Article

Analysis of Li-Ion Battery Gases Vented in an Inert Atmosphere Thermal Test Chamber

1
Autoliv Sverige AB; SE-447 37 Vårgårda, Sweden
2
Research Institute of Sweden (RISE), Box 857, SE-501 15 Borås, Sweden
3
Volvo Car Corporation, SE-405 31 Gothenburg, Sweden
*
Author to whom correspondence should be addressed.
Batteries 2019, 5(3), 61; https://doi.org/10.3390/batteries5030061
Submission received: 6 January 2019 / Revised: 15 July 2019 / Accepted: 1 August 2019 / Published: 4 September 2019

Abstract

:
One way to support the development of new safety practices in testing and field failure situations of electric vehicles and their lithium-ion (Li-ion) traction batteries is to conduct studies simulating plausible incident scenarios. This paper focuses on risks and hazards associated with venting of gaseous species formed by thermal decomposition reactions of the electrolyte and electrode materials during thermal runaway of the cell. A test set-up for qualitative and quantitative measurements of both major and minor gas species in the vented emissions from Li-ion batteries is described. The objective of the study is to measure gas emissions in the absence of flames, since gassing can occur without subsequent fire. Test results regarding gas emission rates, total gas emission volumes, and amounts of hydrogen fluoride (HF) and CO2 formed in inert atmosphere when heating lithium iron phosphate (LFP) and lithium nickel-manganese-cobalt (NMC) dioxide/lithium manganese oxide (LMO) spinel cell stacks are presented and discussed. Important test findings include the large difference in total gas emissions from NMC/LMO cells compared to LFP, 780 L kg−1 battery cells, and 42 L kg−1 battery cells, respectively. However, there was no significant difference in the total amount of HF formed for both cell types, suggesting that LFP releases higher concentrations of HF than NMC/LMO cells.

1. Introduction

The number of vehicles with electrified drivetrains produced annually increase every year as the market penetration rises steadily, although still at very low volumes. Electric vehicles (EV) comprise hybrid vehicles (HEV), plug-in hybrid vehicles (PHEV) and pure electric vehicles (PEV). The latter can either be battery powered, also referred to as battery electric vehicle BEV or powered by a fuel cell, fuel cell electric vehicle (FEV). Increasing restrictions on carbon dioxide (CO2) and nitrogen oxide (NOX) emissions from the transport sector as well as more aggressive political strategies for fuel economy and reduced fossil fuel dependence contribute to this trend. The transition from conventional internal combustion engine (ICE) vehicles to EV implies exposure to new risk scenarios and hazards inherent with the rechargeable electrochemical energy storage systems (REESS).
A consequence of this development is that vehicle manufacturers, test institutes, and other organizations who perform assessments of vehicle crash worthiness are experiencing a rising demand to perform such tests on EVs as well as component testing on propulsion batteries and battery systems. Crash testing of EVs introduces a significant difference compared to testing of conventional ICE vehicles [1]. Testing of ICE vehicles with liquid or gas fuels are performed with an “empty tank”, hence with its fuel removed, whereas the energy storage of the EVs is in place during the test and is typically at a relatively high state of charge (SOC) at the time of the impact. Even a partly or “fully” depleted lithium-ion (Li-ion) EV battery, i.e., when the battery indicator shows that the traction battery is fully discharged, can have substantial energy content, depending on the operational SOC window defined by the vehicle application. Additionally, the size of the battery pack depends on the level of electrification and vehicle model. A BEV would be expected to have significantly more battery power available onboard than a HEV of the same vehicle model, both because the BEV is likely to have a wider SOC operational window than a HEV, but also because the battery itself is expected to be larger for range purposes. Furthermore, there are various different cell chemistries which exhibit varying safety performance characteristics. This challenges the existing safety routines of the test operators, who must update their safety practice to accommodate for the new risks implied in crash testing of hybridized and/or fully EVs. For the same reason, new safety routines for first and second responders performing rescue work at traffic incidents involving EVs are in the process of evaluation around the globe.
Comprehensive studies on plausible critical failure scenarios and their consequences for the automotive traction battery is one way of supporting development of new safety practices in testing and field situations. This paper focuses on risks and hazards associated with venting from Li-ion batteries, currently the battery technology of choice for EV propulsion. Venting occurs when the Li-ion batteries experience internal pressure build-up due to increased vapor pressure and formation of gaseous degradation products inside the battery cell [2]. The liquid electrolytes used in Li-ion batteries are unstable and will react with the graphite anode, as the solid-electrolyte interface (SEI)layer degrades, to form a gaseous species when heated above a threshold temperature, typically temperatures greater than 80–120 °C [3] and the battery experiences what is commonly referred to as a “thermal event”. There are several failure modes that can result in a thermal event. Some conditions are initiated internally in the battery system, e.g., shorting of the battery cell, either externally or internally, or improper battery management leading to overcharge, overcurrent, or overdischarge, and some are caused by conditions external to the battery, e.g., severe mechanical abuse (crash) and external heat exposure (fire) [3]. In extreme cases, the thermal event turns into a state of “thermal runaway”. The thermal runaway is characterized by rapid gas evolution from one or more cells, as the alkyl carbonate electrolytes used in most Li-ion cells start to break down in the temperature range from 150–200 °C to form different organic and inorganic species, including CO2, CH4, C2H4, C2H6, C2H5F, H2, and hydrogen fluoride (HF) [4]. This is when the rate of the decomposition reactions continually accelerate and the temperature of the cell increases uncontrollably to extreme levels, often well above 200–300 °C. Barnett et al. reported [3] that the total release of the electrochemical energy can raise the temperature to 700 °C and exothermic reactions between the anode and cathode materials under adiabatic conditions can also elevate cell temperatures by 700 °C. There are different definitions for when the onset of thermal runaway occurs. Roth defines this as the time when the cathode material starts to release oxygen [5]; however, for testing purposes, thermal runaway is often defined by a combination of measurable parameters, including the cell temperature or rate of temperature increase. The total amount of heat energy that can be released from a Li-ion battery can exceed 10 times the amount of electric energy stored in the battery if all combustible materials react with air [3]. However, the oxygen available inside the cell is not sufficient for full combustion of the electrolyte solvent even in Li-ion cell chemistries with metal oxide cathodes. Hence, a major fraction of solvent combustion must take place external to the cell [3].
Conditions of venting, the amount of gas released, and the composition of gases formed by heating two types of automotive grade Li-ion cells in an oxygen free environment were studied experimentally. The test was designed to prevent ignition of vented gases, and thus testing was performed in an inert atmosphere. The Li-ion chemistries represented in the study was lithium iron phosphate (LFP) and lithium nickel manganese cobalt (NMC) dioxide/lithium manganese oxide (LMO) spinel (NMC/LMO). In this study, each test sample comprised a bundle of five cells clamped together and placed on a heating plate that provoked the bottom cell into the thermal runaway, which then propagated through the other four cells. Gas analysis of selected major and minor gases was performed. Major gases comprise combustion gases, carbon dioxide (CO2), carbon monoxide (CO), and volatile organic compounds (VOCs). The minor gases selected were acid gases (HF and phosphorous oxyfluoride (POF3)) due to their high toxicity.

2. Results

2.1. Gas Volumes and Emission Rates

2.1.1. Gas Volumes Produced

A measurable gas flow was detected from the NMC/LMO cells. However, the LFP cells did not produce enough gas to get a reading on the flow sensor, and, therefore, the volume was calculated based on the gas concentration levels measured for VOCs CO2 and HF; see Section 4.3 for details. The total gas volumes are summarized in Table 1. The amount of gas formed from the NMC/LMO cells was 30 times greater than for the LFP cells. Normalized to battery weight, the relative amount of gas formed from the NMC/LMO cells was almost 20 times that of LFP.

2.1.2. Emission Rates

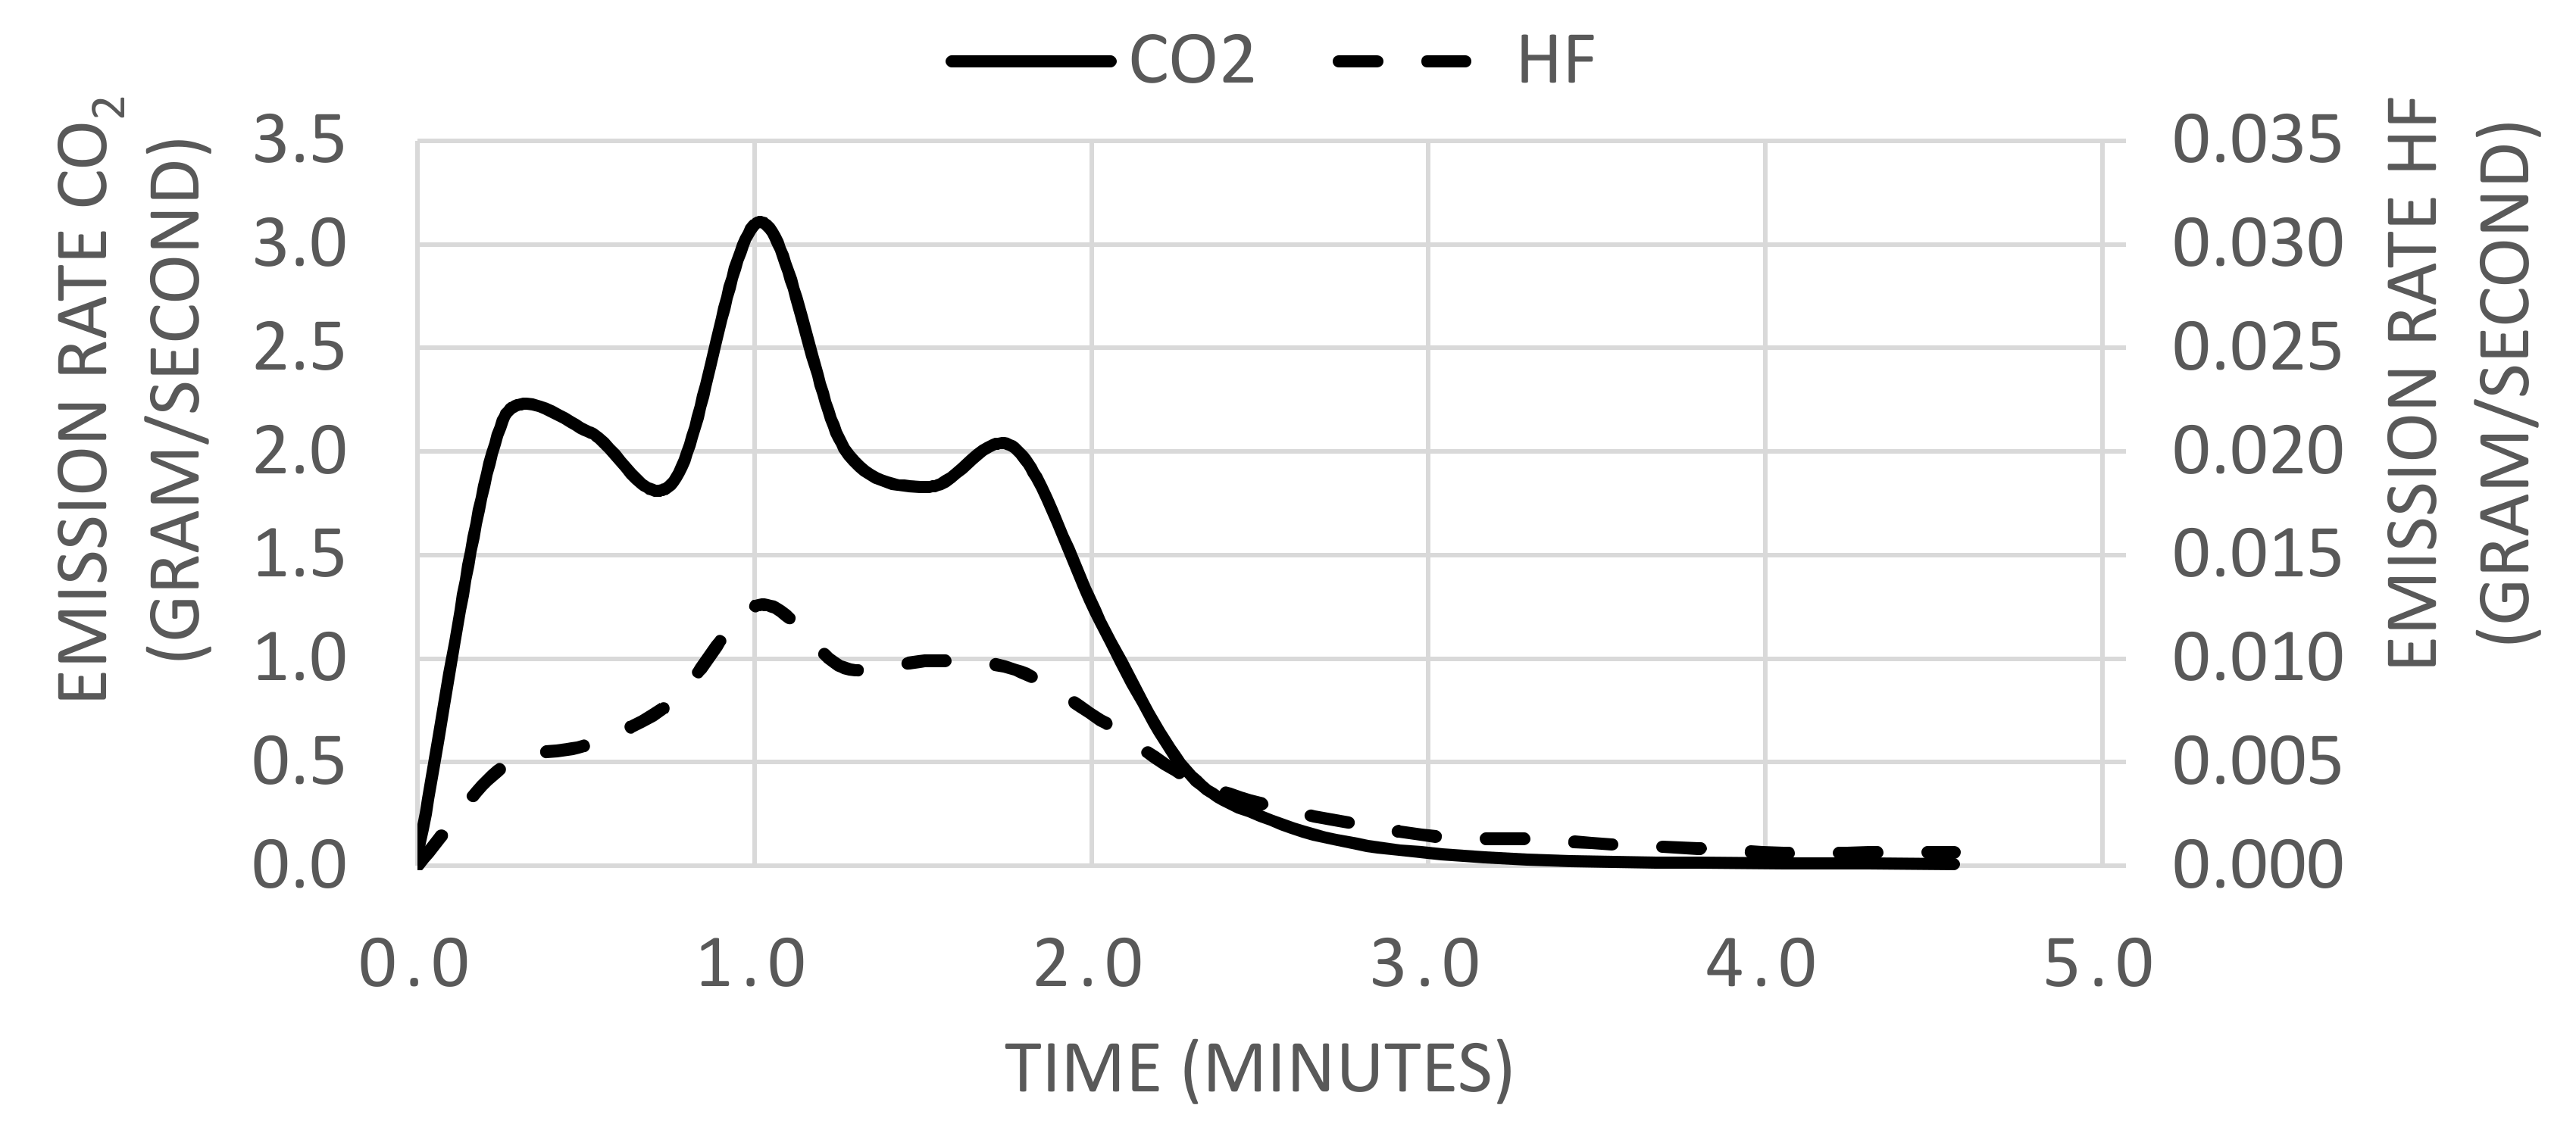
Figure 1 and Figure 2 show the emission rates of CO2 and HF for the LFP and NMC/LMO cells, respectively. t = 0 is the time when the first sign of venting is detected. Note the different scales on the axes, showing that the rate of gas release for NMC/LMO is accelerated by a factor 100 compared to LFP in terms of CO2 release. The venting times of the five cells are clearly separated for LFP, whereas only three distinct peaks can be seen for NMC/LMO. The gassing process for the NMC/LMO cells is also completed very much faster. The duration of gassing in NMC/LMO cells is approximately one-tenth of the total venting time of the LFP cells. Furthermore, it is worth noting that, for LFP, the emission rate of CO2 is one order of magnitude greater than that of HF, whereas, for the NMC/LMO cells, the difference in emission rate between these two gases is two orders of magnitude.
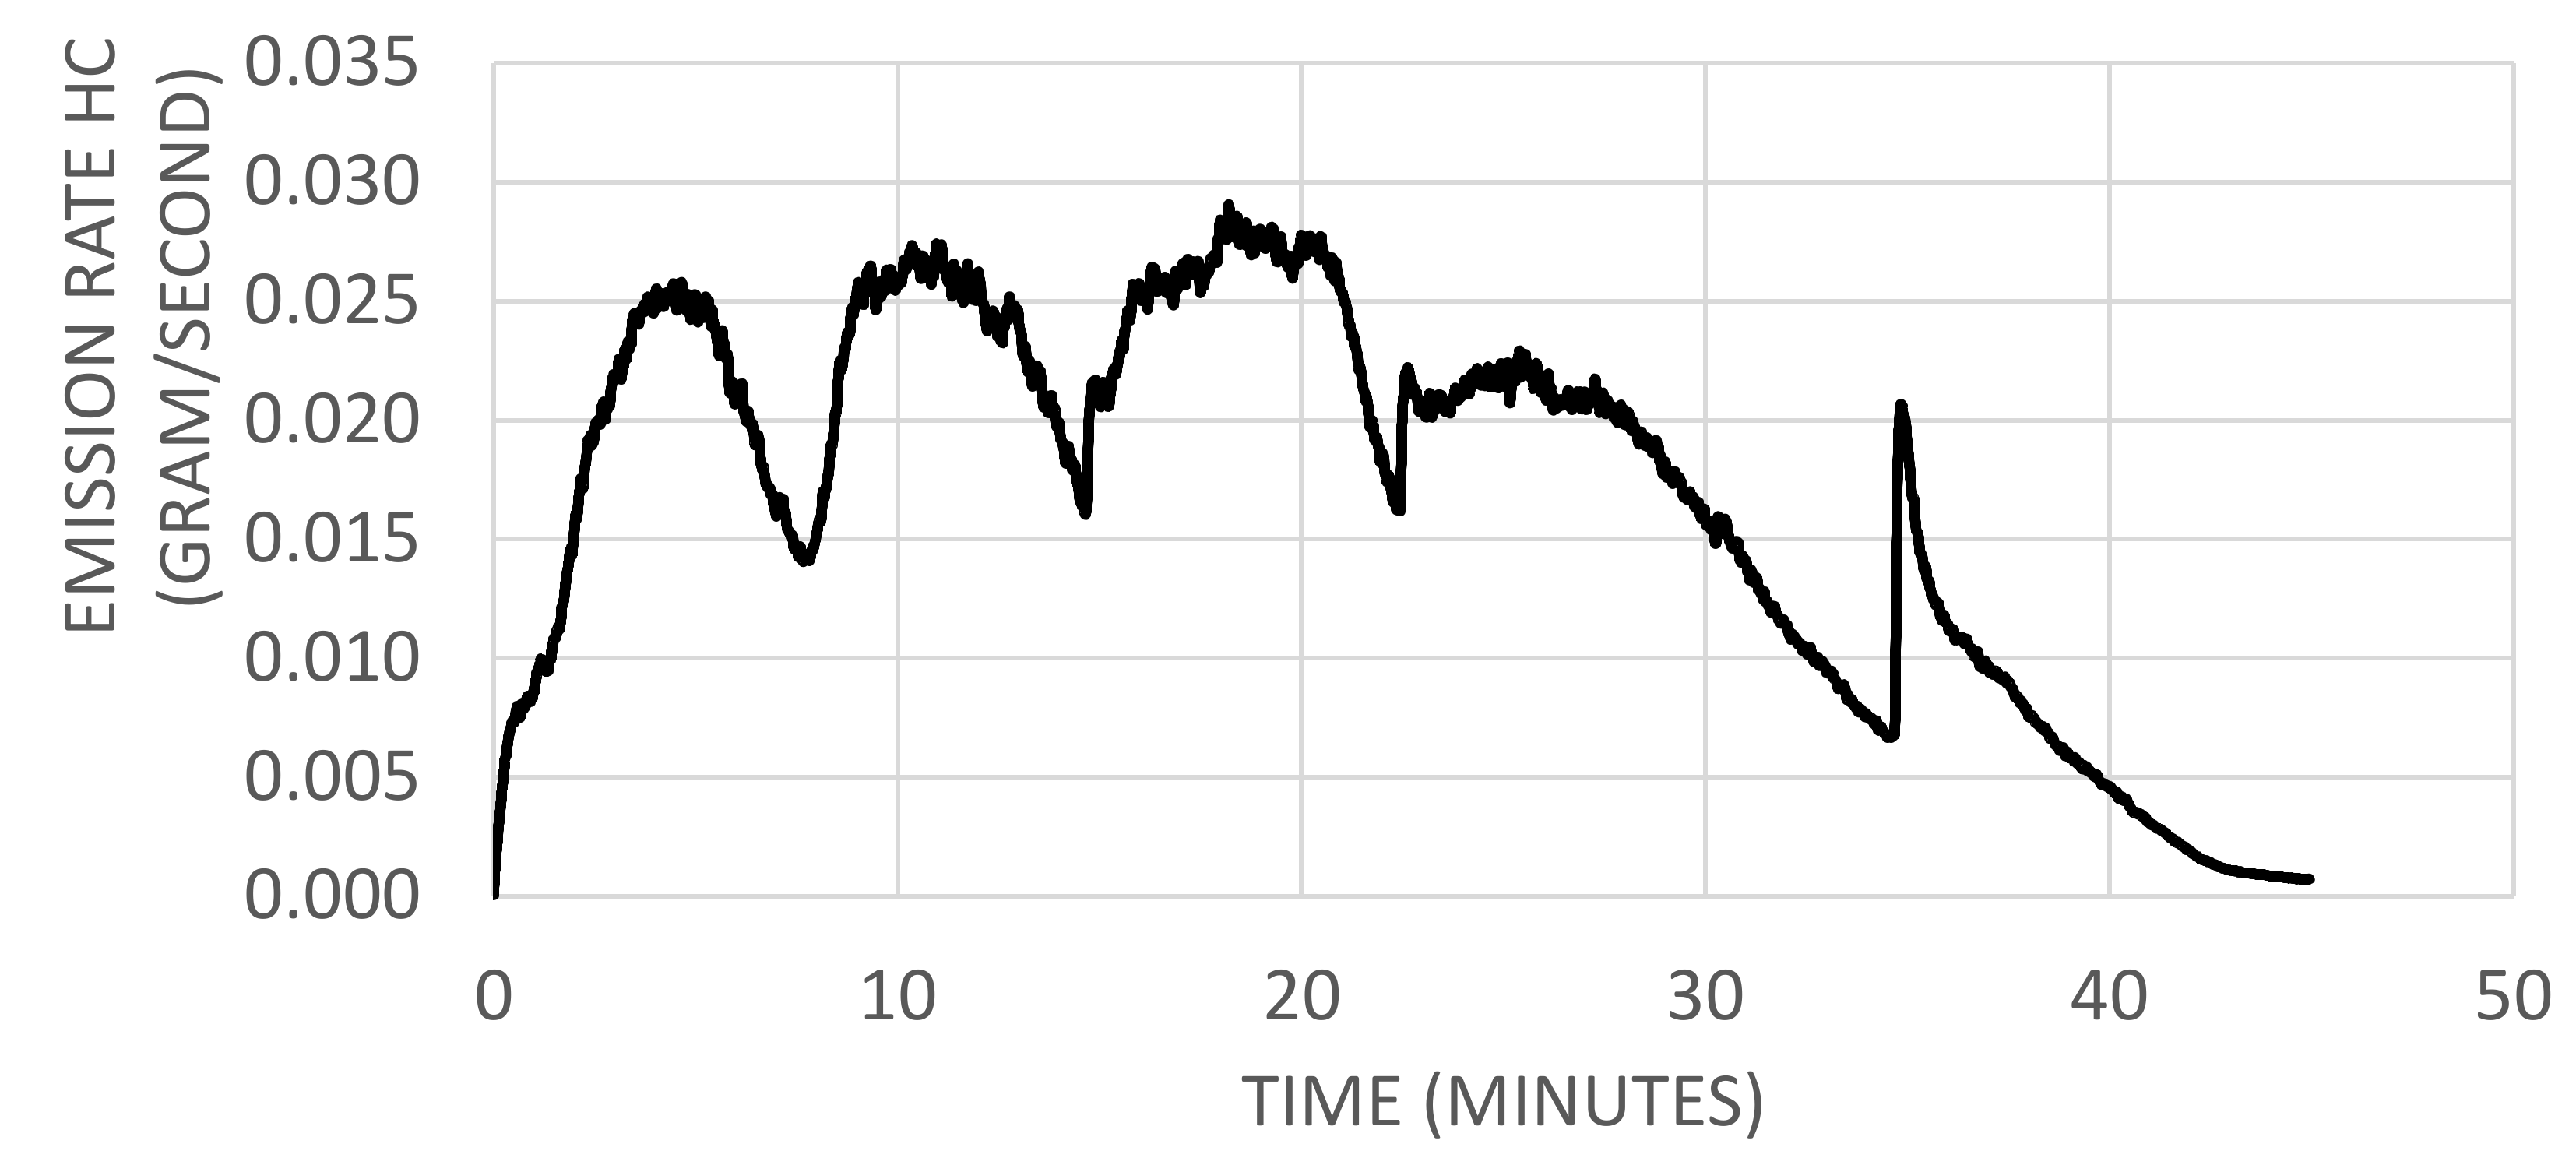
Figure 3 and Figure 4 show the gas emission rates of hydrocarbon compounds for the LFP and NMC/LMO cells, respectively. Unfortunately, some data points are lost for the NMC/LMO case, where the flame ionization detector (FID) was over-loaded at the sensitivity range used during the first 20–25 s. However, the general peak shape was recovered using the available data recordings. Two NMC/LMO cells vented in the first 30–40 s and hence the missing data is from both of these cells. The hydrocarbon gas peaks are more distinct than the CO2 peaks for the NMC/LMO cells and can be used for time resolved cell venting determination.

2.1.3. Temperatures at Venting

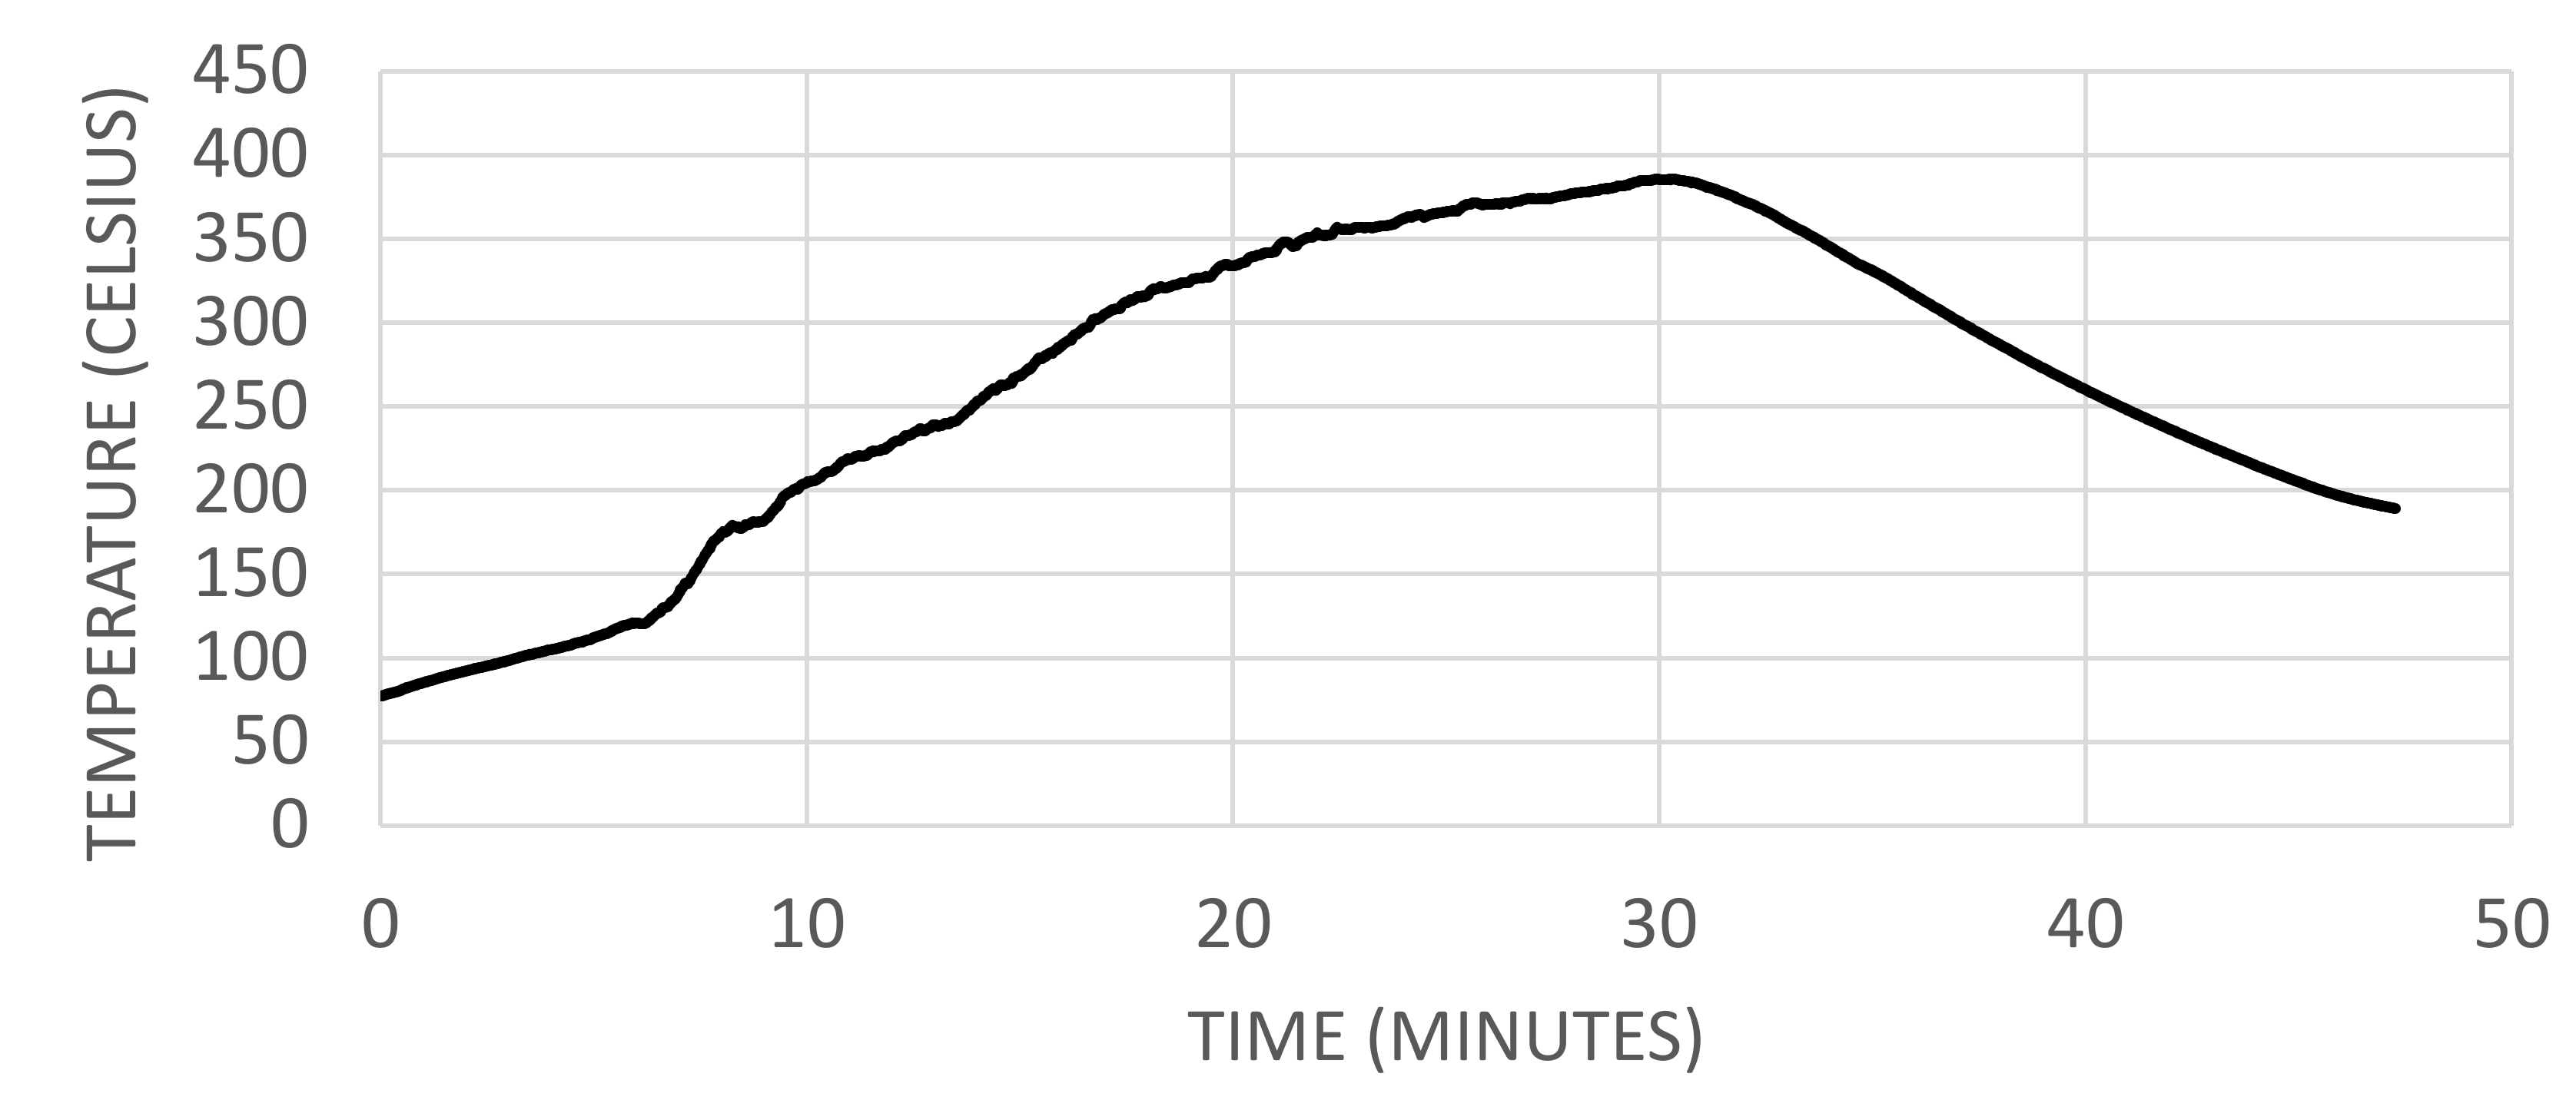
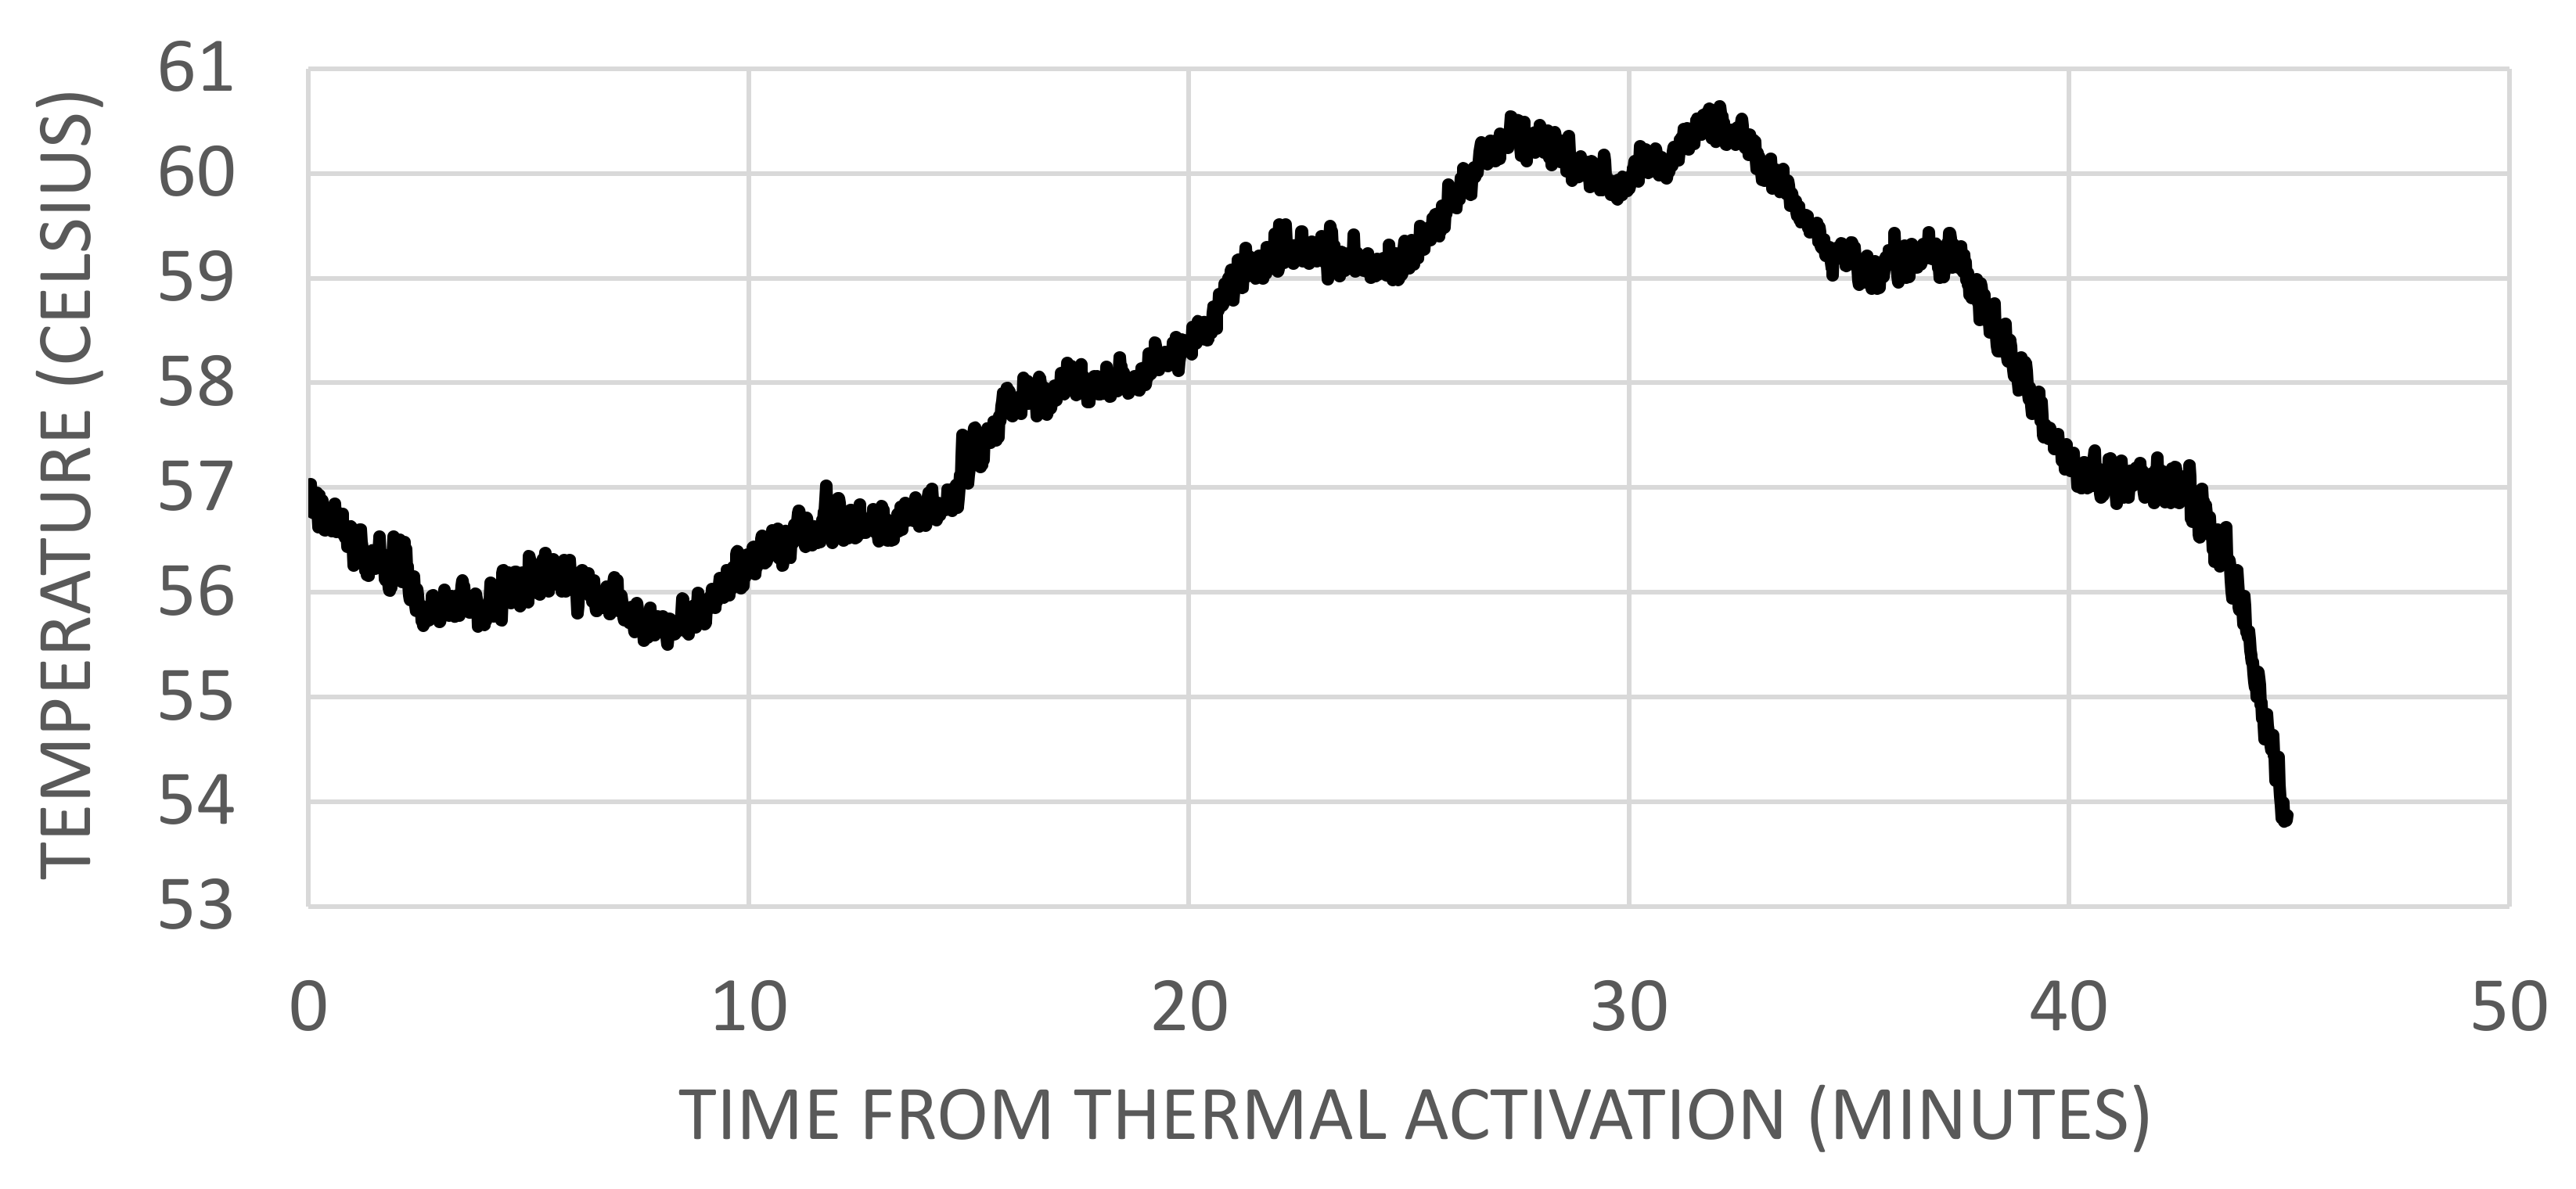
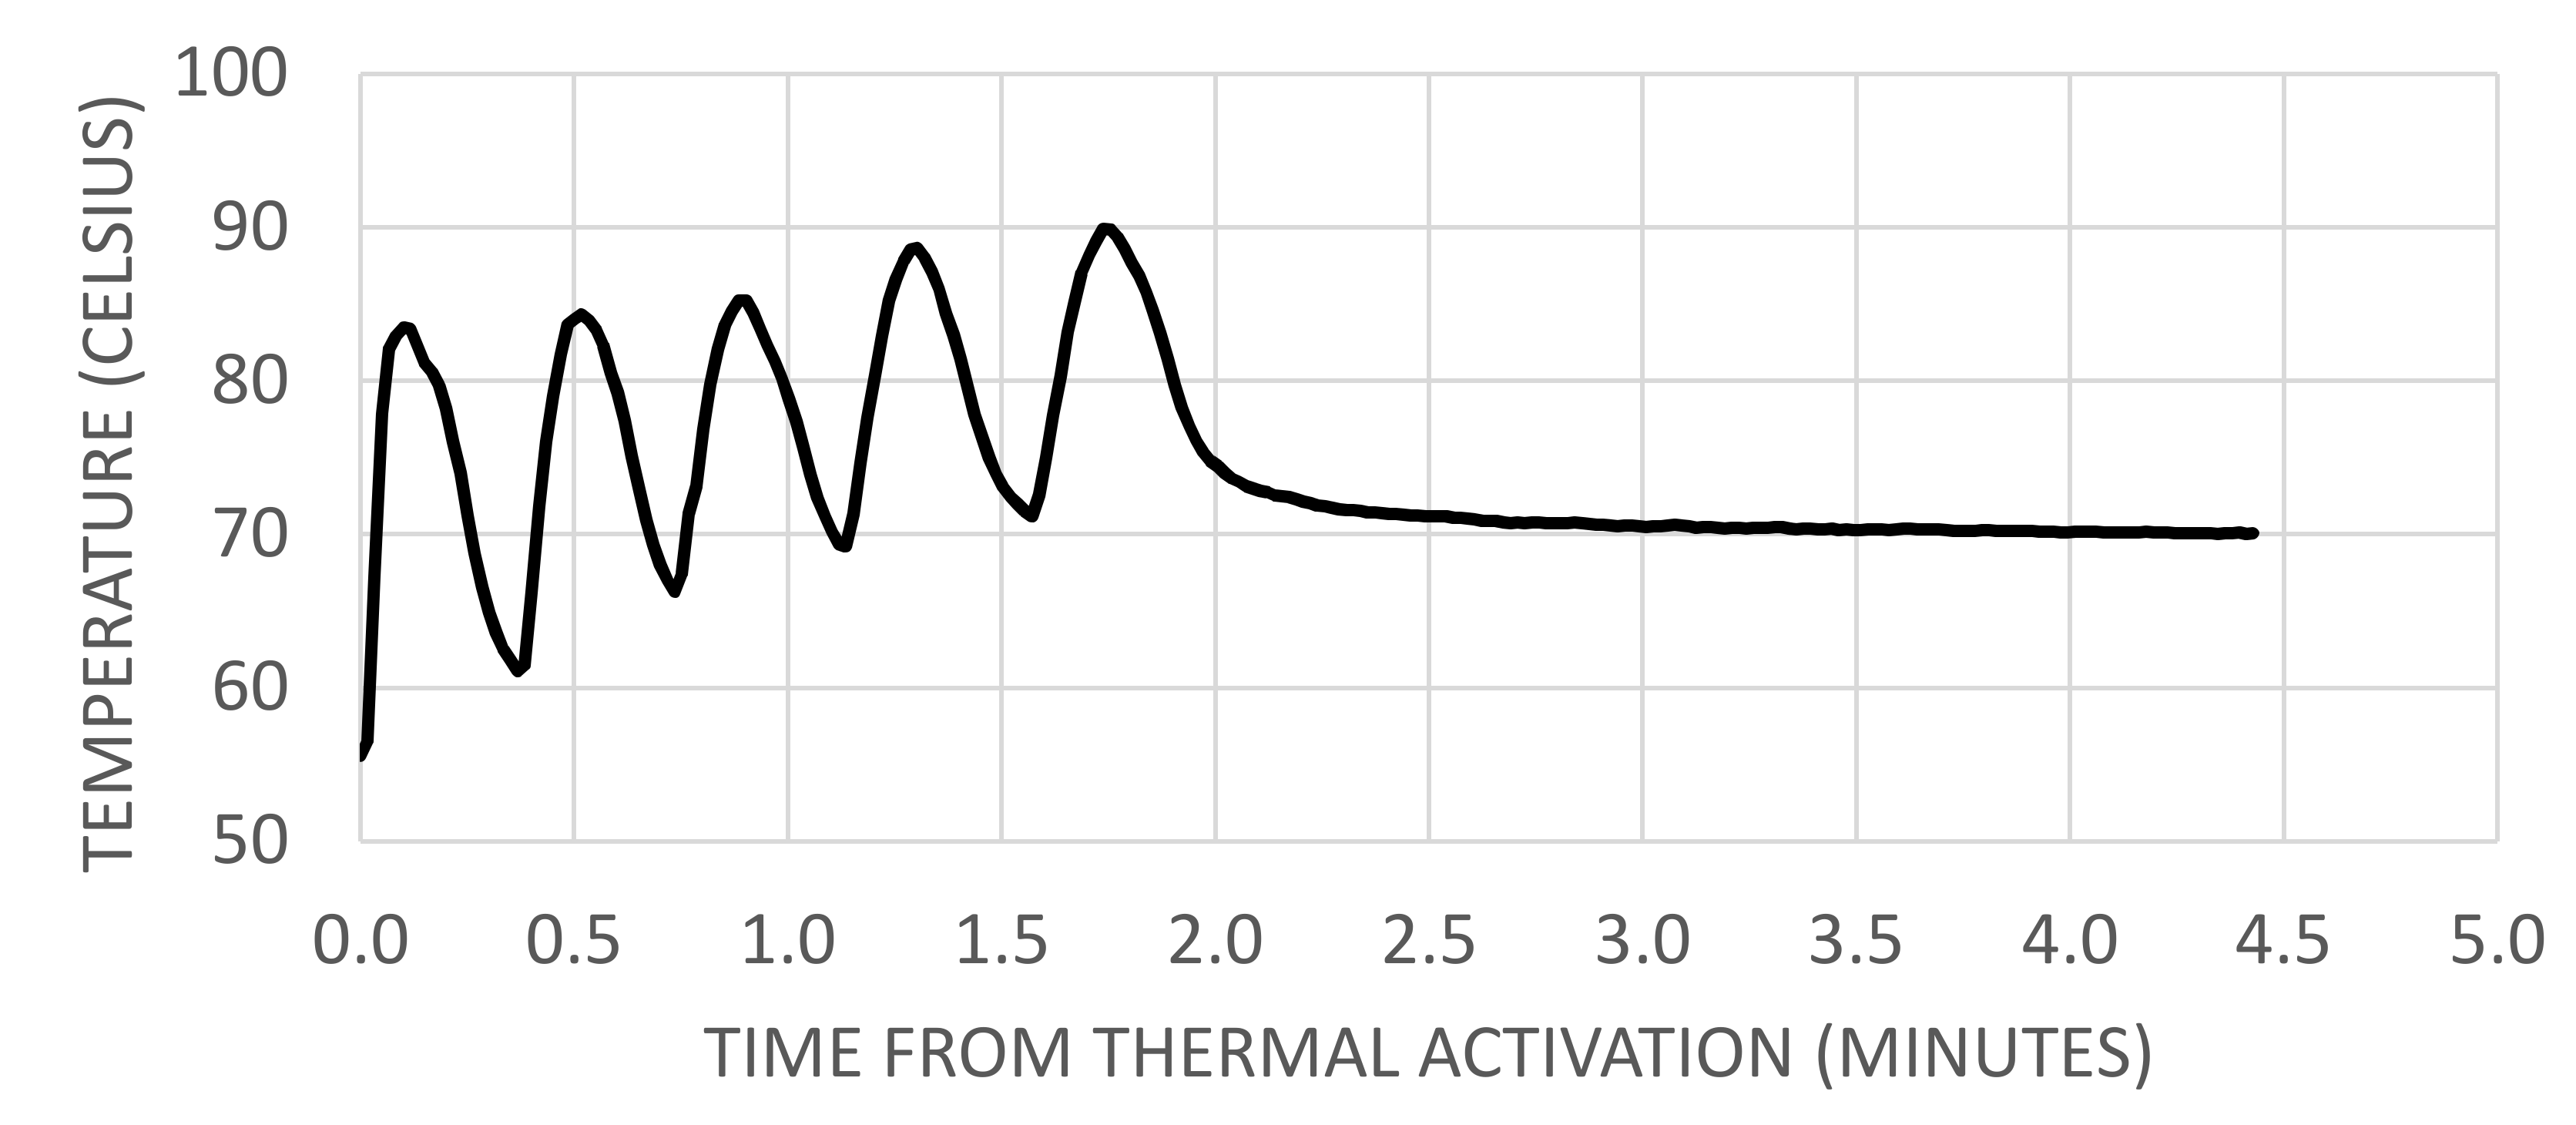
Figure 5 shows the temperatures in the LFP cell stack as a function of test time. Figure 6 is the corresponding temperature curves for NMC/LMO. The peak temperature in the NMC/LMO stack is reached almost immediately following the thermal event, while it ramps up over a period of approximately 30 min in the LFP test. The average temperature slopes during heating are 11.7 °C/min for LFP and 1390 °C/min for NMC/LMO, respectively. The peak temperature for the NMC/LMO cells, 615 °C, is approximately 230 °C higher than the highest measured temperature in the LFP cells, 386 °C. Note that the inflection point at 400 °C in the initial temperature peak for NMC/LMO in Figure 6 suggests that two cells vent in very quick succession during the first 30 s. This supports the assumption that the reconstructed part of Figure 3 comprises the venting of two cells.
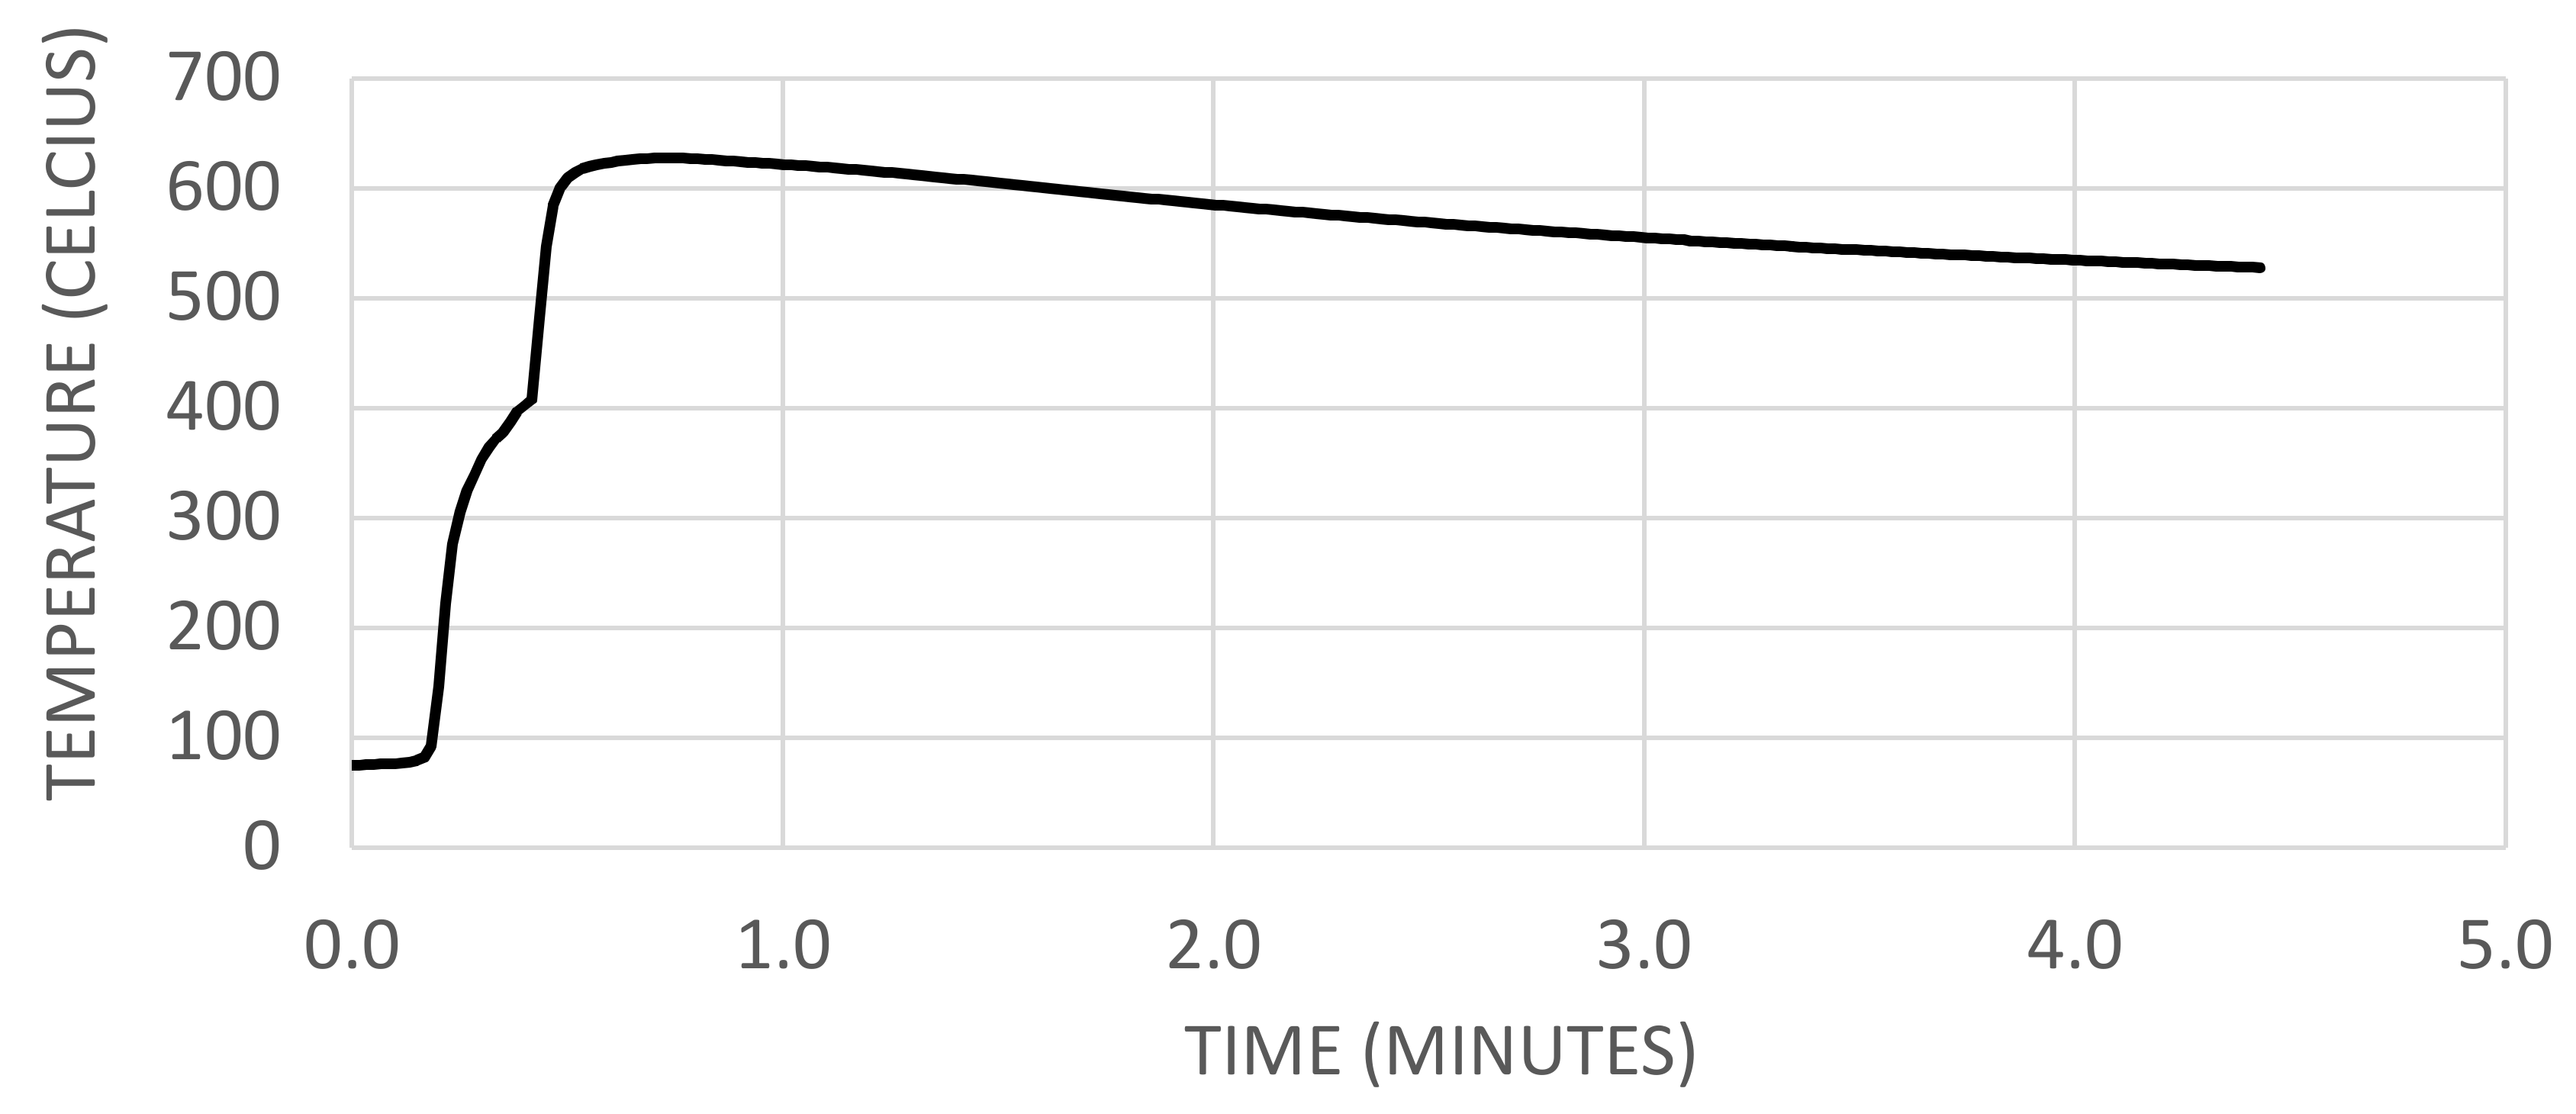
The temperatures of the measured gas flows are shown in Figure 7 and Figure 8 for LFP and NMC/LMO cells, respectively. These temperatures are much lower and about the same for both cell types. This is due to the cooling effect of the nitrogen carrier gas. The venting of the five LFP cells takes approximately 45 min, as shown in Figure 7, but it is difficult to determine the exact venting times of the individual cells. Figure 8 shows that all five NMC/LMO cells have vented in less than 4 min. The 5 cells venting events are clearly discernable in the temperature measurement of the gas flow leaving the test vessel.

2.2. Gaseous Species

2.2.1. HF Emissions

Table 2 shows the HF amounts detected in the vent gases of the two cell types using wash bottles and Fourier-transform infrared spectroscopy (FTIR), respectively. The wash bottle method consistently has significantly higher amounts of HF, due to treating all soluble fluorinated species as HF. The measured amounts of HF indicate that the amount of HF released is comparable for both cell types, but since the total gas volume of LFP is significantly smaller compared to NMC/LMO, the relative concentration of HF is very much higher in the fumes from the former.

2.2.2. FTIR and Gas Chromatography-Mass Spectrometry (GC-MS) Analysis

Most of the main absorption peaks in the FTIR spectra from both cell types are from carbonates, which is expected since different mixes of organic carbonates constitute the electrolyte solvents used in commercial Li-ion cells. A summary of the absorption peaks used for quantitative analysis is found in Table 3. Major absorption peaks are found around 1770 cm−1 and 1280 cm−1, which are characteristic for diethyl carbonate (DEC), dimethyl carbonate (DMC) and ethyl methyl carbonates (EMC). Absorption bands at 1870 cm−1 and 1100 cm−1 are most likely propylene carbonate (PC). However, the absorption band at 1100 cm−1 can also represent unknown organic fluorinated substances. A typical bond stretching wavenumber for a fluorine atom bounded to a tertiary carbon is 1100 cm−1 [6]. The wave number for the fluorine carbon bond stretching varies with the configuration of the carbon, e.g., the wave number for the fluorine bond with a primary carbon in 1-fluoropropane is 1018 cm−1 [7]. CO2, an electrolyte decomposition product, was observed with a peak around 2350 cm−1, which is the major CO2 peak. However, this peak is not suitable for quantitative analysis, and for this purpose 2392 cm−1 was used instead. HF bands were seen between 4000 cm−1 and 4200 cm−1. POF3 was not conclusively identified in any of the two cell types, but cannot be completely excluded. CO could not be conclusively determined due to interference in the spectral region of the C-O bond.
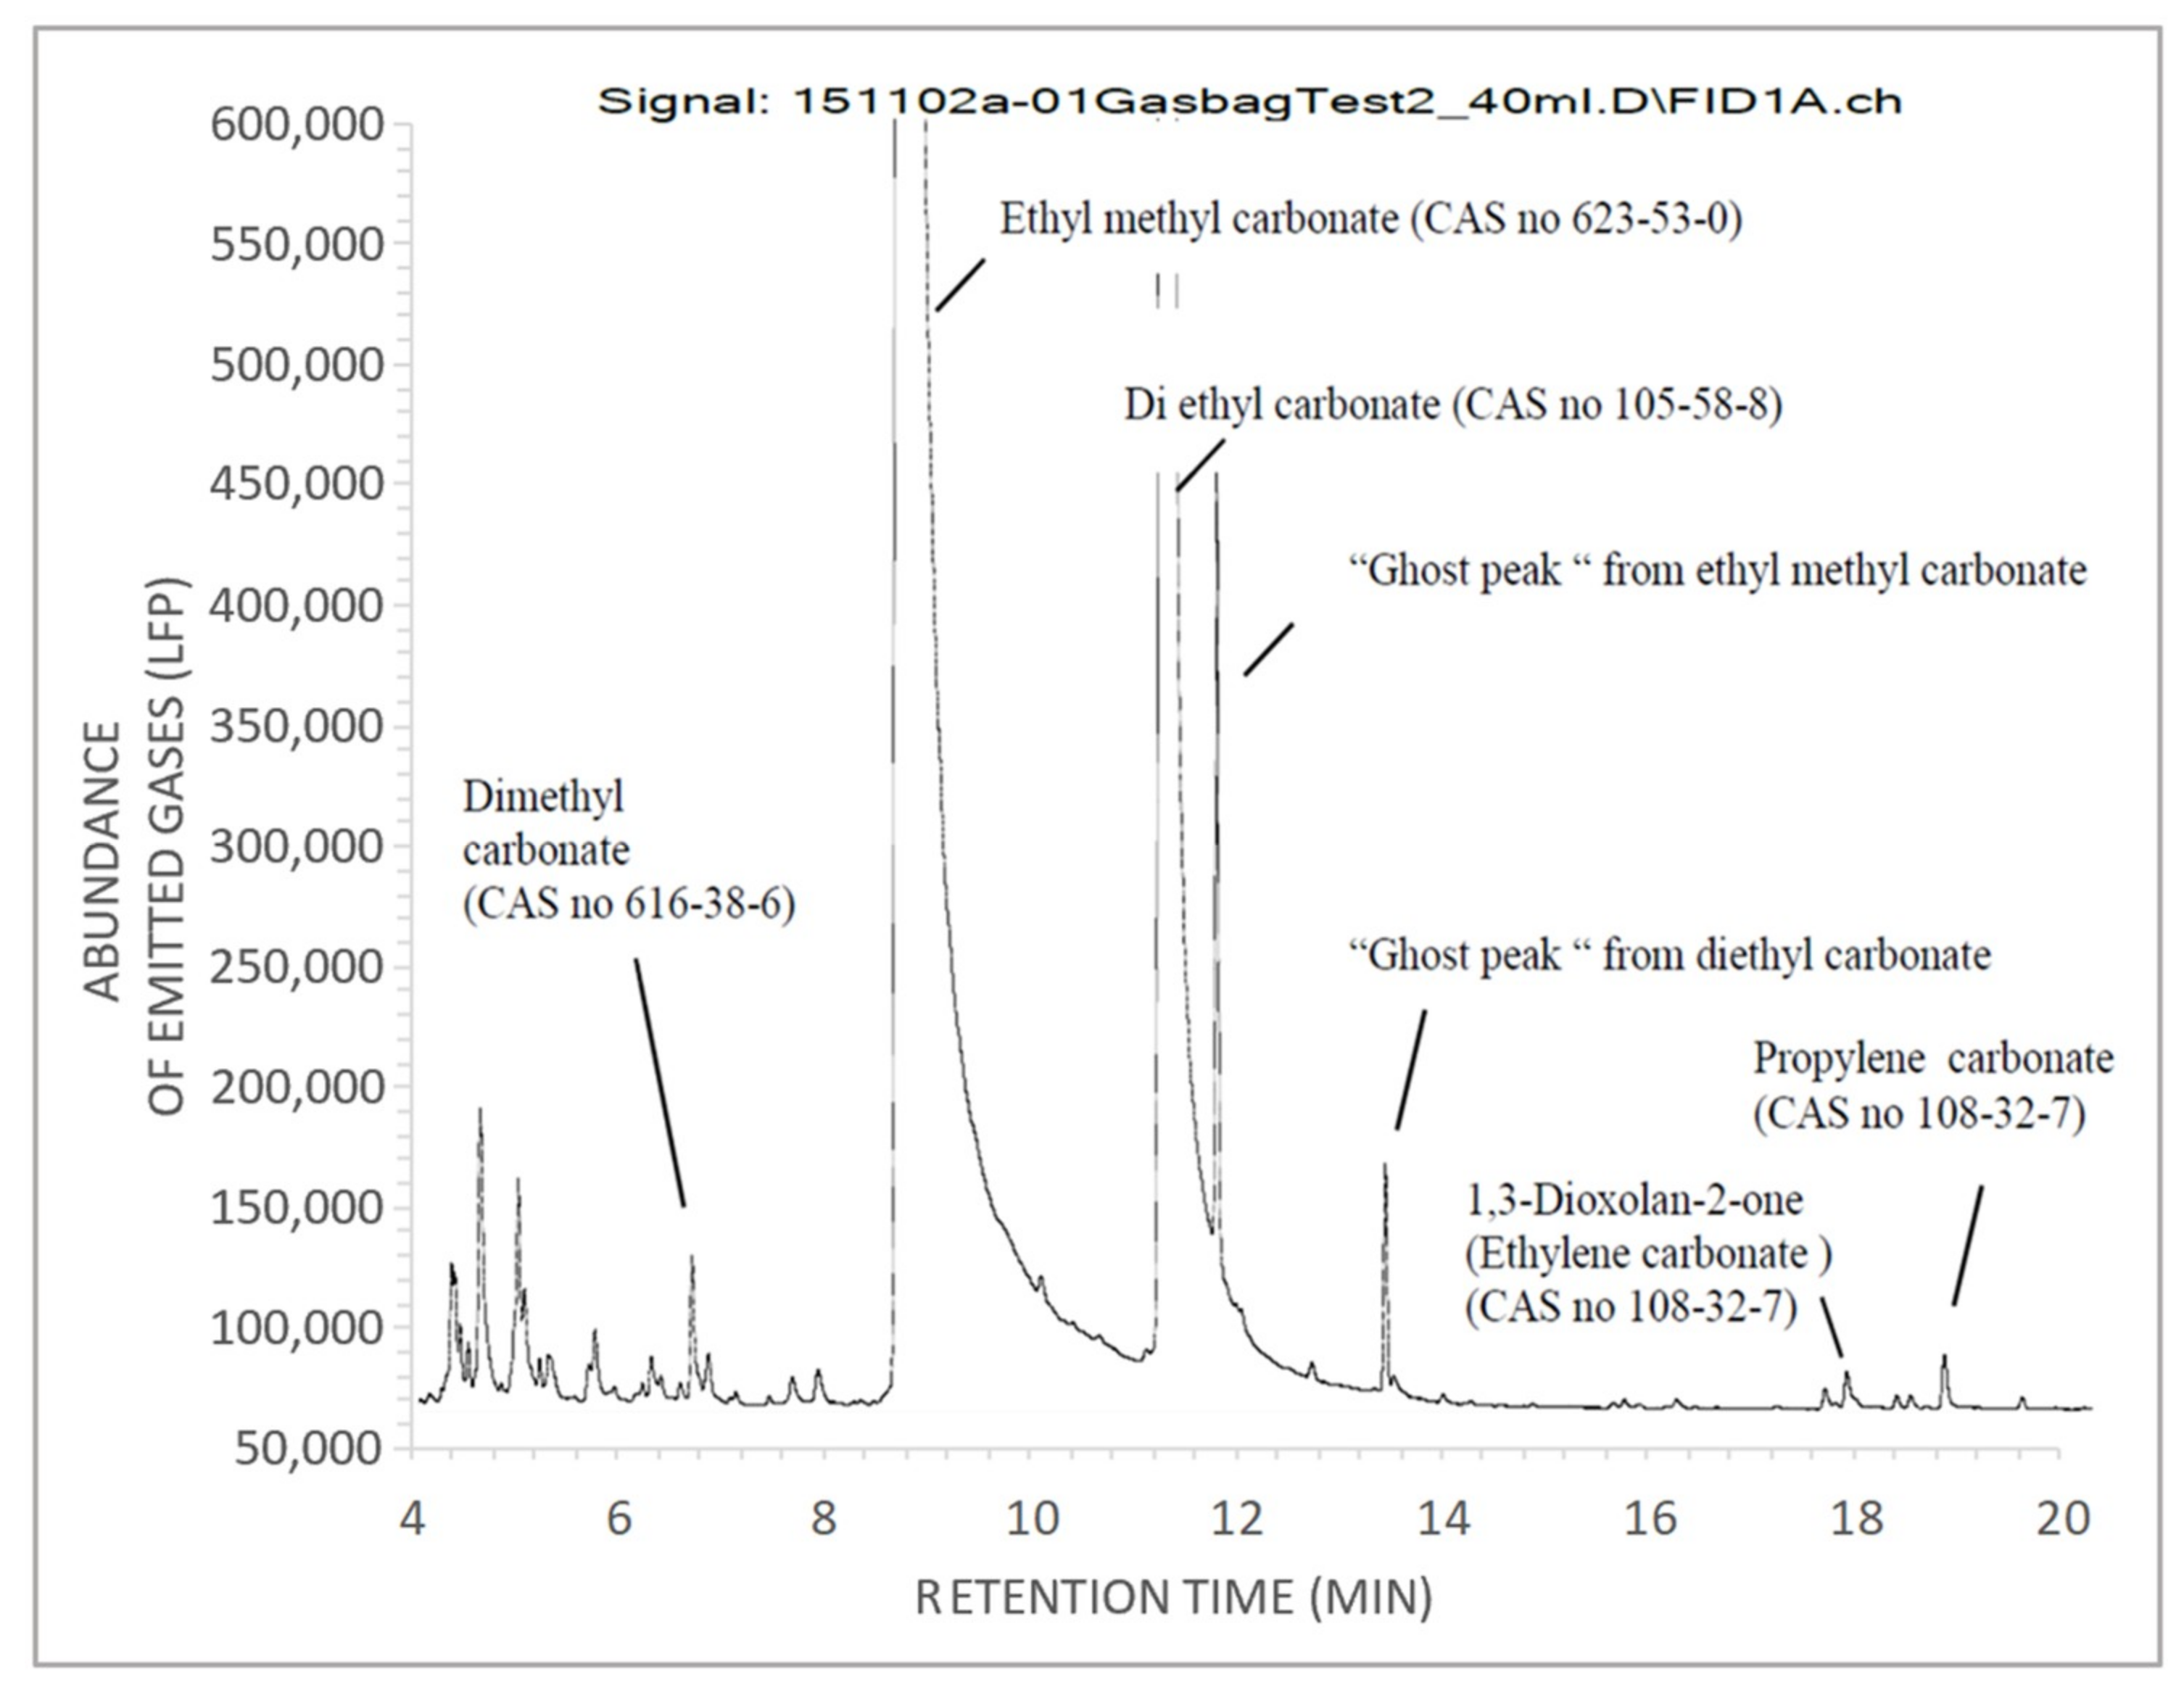
The presence of significant amounts of non-reacted electrolyte solvent was confirmed by the gas chromatography-mass spectrometry (GC-MS) analysis of collected gas bag samples, as shown in Figure 9 and Figure 10 for LFP and NMC/LMO cells, respectively.

3. Discussion

3.1. Gas Volumes and Emission Rates

The huge difference in the total gas volumes emitted from the LFP cells compared to the NMC/LMO cells was surprising. Although the weight difference between the two cell types, 0.236 g/cell for LFP and 0.385 g/cell for NMC/LMO, can account for a small part of the difference in total gas volume, it is far from explaining a difference of more than an order of magnitude. A plausible explanation for the large gas volumes formed by the NMC/LMO cells is that the cathode material releases oxygen readily, as the material decomposes with increasing temperature, leading to combustion of a significant proportion of the electrolyte solvent. It is a well-known fact that the LFP crystalline structure is resistant to oxygen release [8], and hence combustion reactions of the electrolyte and the graphite anode to form CO and CO2 is dependent on the availability of oxygen releasing species in the electrolyte itself when there is no external supply of oxygen available for the reactions. The NMC/LMO cells were completely consumed at the end of the test, whereas the LFP cells had only suffered minor damage. If full combustion of the LFP cells had been achieved, the total gas volume would likely have been larger. Roth has concluded that gas volumes and composition are related to the electrolyte mixture and different thermal stages during thermal runaway [5]. His results were achieved under fully aerated conditions and an externally regulated temperature profile as determined by the accelerated rate calorimeter (ARC) with a steady temperature increase, which is the same for all tests performed. Lei et al. [9] have also conducted ARC studies on 18650 cells with different cathode materials. Their data shows that LFP generates less gas than NMC and lithium cobolt dioxide (LCO)/NMC and ratios are reported as 1:3:5.5 [9]. The difference in gas volumes is not as large as the results in this study. This can be explained by the difference in the experimental set up. In the case when ARC is used, the ambient temperature is increasing at a linear rate and constantly contributing to the heating of the battery cells. In this study, the nitrogen carrier gas had a cooling effect on the reaction chamber and the temperature increase of the Li-ion cells was dependent on the capability and rate of self-heating of the respective cell chemistries. In an EV battery, the cooling system will respond to an increasing cell and battery temperature to suppress the self-heating process. Dependent on the balance between applied cooling and the rate of self-heating, the maximum temperatures reached, and the time spent in the different runaway stages are going to vary for different cell chemistries. This will have an impact on the gas composition and, consequently, the influence of gas volumes and the level of cell combustion achieved. The relationship between cooling and self-heating used in this test set-up intended to replicate a thermal balance. However, the same cooling effect was applied to both cell types and, since LFP has both a lower heat of reaction as well as a lower maximum temperature than NMC/LMO [9], the LFP cell stack did not reach as high temperature ranges as NMC/LMO. However, this simulates a realistic field scenario, since the safety advantage of LFP relies on these properties [10].

3.2. Gaseous Spec

The chemical species detected in the vented gases in this study are consistent with reports from other authors [11,12,13,14]. HF detection was prioritized in this study, since this is a gas with high toxicity at low concentrations. Two conclusions can be drawn from the gas measurements in this study: The total amount of HF released from the LFP and the NMC/LMO cells are comparable, despite the huge difference in the total amounts of gas volumes, and the measurement method chosen to quantify the amount of HF impacts significantly on the measured values. Furthermore, the results indicate that the concentration of HF in gases released from LFP cells is more than an order of magnitude higher than for NMC/LMO cells. This emphasizes the necessity to not just focus on the total amount of gas released from a Li-ion EV battery, but to also take account of the composition and relative concentration of problematic species and the total time frame of gassing when assessing the risk of unwanted chemical exposure.
In this study, there is little difference in the total HF amounts released by the two cell types. This seems to contradict the assumption that the relative amounts of electrolyte in the two cells is proportional to the weight. Since the weight of the NMC/LMO cells is approximately 60% greater than that of the LFP cells, the former should contain more electrolyte than the latter. However, the results seem to suggest that the total amount of lithium hexafluorophosphate (LiPF6) that reacted to form HF in the two cell types is about the same despite the difference in weight and electric capacity. Yang et al. [15] have described the reaction mechanism by which the electrolyte salt LiPF6 reacts to form HF:
LiPF6 → LiF + PF5
PF5 + H2O → POF3 + 2HF
LiPF6 + H2O → LiF + POF3 + 2HF
Kawamura et al. [16] suggest that POF3 will readily react with moisture according to:
POF3 + H2O → POF2(OH) + HF
Wilken et al. [17] have studied initial stages of thermal decomposition of LiPF6-based Li-ion battery electrolytes. Their investigations conclude that the decomposition of LiPF6 to form HF follows the path of pyrolysis of the salt, forming PF5, which then reacts with water to form HF. The water can either be moisture contamination inside the cell or external moisture. [17].
The results obtained in this study may suggest that conditions for formation of HF are favoured when the thermal event develops over a longer time, as in LFP, compared to the very fast temperature raise and accompanying gas production and ventilation rates that was characteristic for the NMC/LMO cells. A plausible explanation is that the intermediate PF5 predominantly forms inside the cell at the onset of the thermal event and early into the thermal runaway, which is consistent with the shielding effect observed in a previous study [2]. According to Hammami et al. [18], the nickel and manganese found in the NMC/LMO cells will catalyse the formation of a different organic fluoro compound, such as fluoroethanol ether, and this is the reason for the lower HF concentration in the vented gases. These findings are consistent with Sun et al. [19] and Sturk et al. [20], who report different identifications of organic combustion products from NMC and LFP cells. NMC appear to generate significantly lower concentrations of HF than LFP [19].
In this study, the nitrogen gas served three purposes: It was a carrier gas and it created a dry inert oxygen-free atmosphere that prevented outbreak of fire in the reaction vessel. The gas flow kept the temperature of the gases released from the reaction vessel at manageable levels for chemical analysis and quantification. The results show another important difference between the LFP and NMC/LMO cell types: The temperature of the vented gases increased significantly faster and reached higher levels for the NMC/LMO cells compared to LFP. This is attributed to the higher reactivity of the transition metal oxide materials compared to the metal phosphate. Previous studies showed that the reactivity of the Li-ion cells at thermal runaway increased significantly when the cells were fully charged [2]. Therefore, the cells in this study were charged to the highest possible SOC level in order to have the highest possible energy available in the cells at the onset of thermal runaway.
Since the trend in the automotive industry is to move from LFP to NMC cell technologies in order to benefit from the higher energy density of these chemistries, it is important that construction engineers are aware of and consider that different Li-ion technologies have different gassing behaviors. Since the emitted gas contains toxic species, e.g., CO and HF, as well as volatile and flammable organic carbonates, it is necessary to take care of gas emissions in a controlled way so that the vehicle occupants are protected from exposure. When changing from LFP to NMC cells, the potential total gas volume that can be released is not only increased by an order of magnitude, but the gas release rate is also increased at the same time. In a worst-case scenario, the results from this study imply that the gas management system of a battery pack with NMC/LMO based cells would need to handle a gas emission rate that is two orders of magnitude higher compared to LFP. This ratio is obtained by dividing the total gas volume by the gas release time and cell stack mass. For the NMC/LMO cells, this becomes 1500 L/(4 min × 1.925 kg) = 190 L min−1 kg−1. Similarly, for LFP cells, the result is 50 L/(45 min × 1.180 kg) = 0.94 L min−1 kg−1. Clearly, this will have an implication on both dimensioning and placement of vents to avoid uncontrolled leakage of gases through seals in the pack casing, since the expected rate and amount of gas released from thermal decomposition of NMC/LMO exceeds that of LFP [9]. However, the difference will be less pronounced for a battery pack where the self-heating rate of failing cells is managed with a well-balanced cooling system. In this study, the steady cooling provided by the nitrogen carrier gas appears to have been excessive for LFP, since the cell stack was not fully combusted.

3.3. Test Method and System Considerations

The results of the HF measurements shown in Table 2 highlights the importance of the chosen method of quantification. It is always challenging to measure small volume gases (ppm and ppb level) and the measurement uncertainty can be quite high. In this case, the amount of HF obtained using wash bottles was more than double that measured with FTIR. There are two probable reasons for this discrepancy. The wash bottle result over-estimates the actual amounts of HF formed since it is assumed that all F captured originates from HF. The gas measurement showed that a large portion of the vented gases is made up from vaporized electrolyte solution. It cannot be excluded that the vented gases contain some electrolyte aerosols, including the electrolyte salt LiPF6, due to the high pressure and emission rate. Additionally, the FTIR spectra indicate possible formation of fluorinated hydrocarbons as well as other inorganic fluoro-gases, such as POF3. All inorganic fluoro-gases will also be captured in the wash bottles and incorrectly contribute to the HF estimate. Another important reason for the lower amount detected by the FTIR is that the gas has to travel longer before reaching the detection system. HF is a very reactive substance, and it is not unlikely that some reacted with other species in the gas or with the surfaces in the (externally insulated) gas ducts on the way to the FTIR spectrometer. In the current measurement set-up, it was not practically possible to saturate all surfaces with HF prior to heating the cell stacks, since the system was continually purged with nitrogen gas. However, it is important to note that the gas emission rate varied with time and that, during part of the venting episodes for NMC/LMO cells, the gas emission rate was very high. There is, therefore, a possibility that the wash bottle method underestimates the total HF amount for NMC/LMO cells compared to the amount for the LFP cells in this study due to fast short term variations in the relative sampled volume portion of the gas flow in the NMC/LMO test, since the sample gas flow to the wash bottles was kept constant at 1.0 L min−1. Despite this limitation, the amount of HF determined for NMC/LMO cells with the wash bottle method is still expected to be an overestimation compared to the actual amount of HF due to contributions from other fluoro containing substances, which is reflected by the lower value obtained with the FTIR spectroscopy measurement.
One has to be cautious about drawing too far-reaching conclusions about the composition of venting gases from Li-ion cells and batteries based on the results of this type of test. The measurements are made on gas emissions from Li-ion cells in a dry inert atmosphere. While it is desirable to create a test environment where the vented gases do not ignite, the lack of oxygen may significantly impact on what species will form, and it is not unlikely that chemical substances form in oxygen-starved systems would not be stable in a normal atmosphere. The lack of moisture in the nitrogen carrier gas may also have limited formation of HF. Yang et al. [15] have shown that HF formation from a Li-ion electrolyte will be limited in case the humidity is too low. Their results show that no HF is formed at 10 ppm water content while significant production occurs at 300 ppm water vapor. They also show that the survival time for the intermediate PF5 increased significantly when the humidity was very low [15]. The humidity in the nitrogen carrier gas in the current study was 40 ppm, or <10% RH. HF was detected by both FTIR and water-filled wash bottles. If large amounts of intermediate PF5 did not react due to lack of humidity in the test environment, one would expect that the detected amount would be much higher for the water bottles, where there is an abundance of available moisture. Table 2 shows that the total difference between the wash bottle and the FTIR measurement was 1:2 for LFP and 1:3 for NMC/LMO, which is within the same order of magnitude, and the present results indicate that comparable amounts of HF formed in the gas ducts before reaching the FTIR detector.
Another limitation with this type of test system is that the gases that will be detected are dependent on the assumptions made when setting up the measurement system; the choice of analytical methods as well as the chosen detectors. Unexpected gas species may therefore be overlooked, which impacts both on the determined composition of the gas mixture and the relative concentrations/amounts of the various constituents.
One of the strengths of this method is its ability to provide time-resolved information of the propagation of thermal runaway spreading from one cell to the next. In this test, temperature measurements of the vented gases successfully identified the time of rupture of each cell in the stack and hence the rate of propagation for the NMC/LMO cells. For the LFP cells, measurements of changes in temperature were not sensitive enough as a consequence of much lower thermal activity by these cells. However, since the amount of gas was much lower, measurements of CO2 did offer detailed information about the propagation of thermal runaway spreading from cell to cell in the stack. An additional method to acquire time-resolved propagation data on both cell chemistries is by means of total hydrocarbon quantification using FID. This technique worked for both the NMC/LMO and LFP cells. Consequently, different sensors can be considered for detection of activated thermal runaway within a battery, but their ability for good time resolution may differ depending on circumstances, e.g., high or low thermal activity and large or limited production of vent gases. A recent study of different sensors to detect thermal runaway in Li-ion battery packs conducted by Koch et al. [21] showed that thermal runaway detection based on gas, pressure, and force sensors was faster than temperature sensors and very reliable, which supports the results presented in this paper.

3.4. Application Perspectives

The results in this study indicate that gas sensors may be more appropriate to give early detection of a thermal event in progress in a Li-ion battery than temperature sensors. The closer the sensor is to the gas emitting cell, the earlier the potential time of detection.
This study shows that gas emitted from the slow reacting LFP cells contains the same total amounts of HF as the faster reacting NMC/LMO cells. Due to the much smaller gas volumes released from LFP compared to NMC/LMO, it may appear as if the concentration of HF is higher from venting LFP cells. However, it is important to also factor in the total time of gas release in order to estimate the average concentration over time for the two cell types. The FTIR measurements indicate that both cell types release just below 2 g HF (see Table 2), but that the total gas volumes are 50 L form LFP and 1500 L for NMC/LMO, respectively. Considering that it takes 40 min for all cells to vent for LFP vs. 2 min for NMC/LMO, this implies that the average concentration in the gas emissions during the venting is about the same order of magnitude in both cases; 0.9 mg L−1 min−1 for LFP and 0.3 g L−1 min−1 for NMC/LMO, respectively. Which of these two outcomes that is the most problematic will depend very much on the conditions of the incident. Outside, in free air, there will be little risk of HF and other lighter species accumulating near or around the vehicle, since these will rise and rapidly dissipate. A short emission duration may be an advantage in this case (if such dissipation is sufficient), since it means that the total time to handle the incident is notably less. In closed spaces, slow gas emission rates may be easier to manage with existing gas evacuation capability of the surrounding space, and a prolonged emission period may be desirable. However, it is important to remember that studies of vehicle fires show little difference in the amount of toxic gas release from an EV compared to an ICE, and recent data from Truchot et al. [22] shows that an ICE will release a total of 0.4 kg HF compared to 0.7 kg for the EV. Furthermore, their data shows that the initial HF gas release, with the highest concentration, is identical to and independent of the energy carrier and is released from sources that are common to both ICE and EV, e.g., fluorinated plastics and air conditioning refrigerant. The Li-ion battery contribution to HF did not appear until 30 min into the fire. The conclusion was that it would not affect the toxicity level at the time of evacuation of occupants from the vehicle, at least when the fire incident is initiated outside of the battery itself, e.g., an external heat source, such as a fire starting in another part of the vehicle or somewhere in the proximity of the vehicle [22].
Fire studies show that several toxic gases form during combustion of both ICE vehicles and EVs [22]. The acid gases, i.e., HF, hydrogen chloride (HCl), and hydrogen cyanide (HCN), make up a very low volume in terms of total amounts, but deserve consideration for the toxic impact due to their low toxicity thresholds [22]. However, the strong polar nature of these acid gases, as well other halogenated compounds, can be used as an advantage, since it is possible to reduce the concentration of such gases significantly by spraying water and “washing out” the acid and halogenated gaseous species from the emissions [23]. This method is not an established practice by firefighters when fighting fires in EVs, however, it is commonly practiced when mitigating effects of acid gas emissions from chemical fires [24]. Information to fire-fighting authorities about the acid nature of the Li-ion gas emissions during a thermal incident should greatly enhance the opportunity to reduce some of the challenges of handling an EV fire incident in the field by means of water “washing” the Li-ion battery gas emissions. Water can also be used to effectively reduce concentrations of a wide range of harmful substances with lower solubility by diluting the combustion gases [24].

4. Materials and Methods

4.1. Test Set-Up

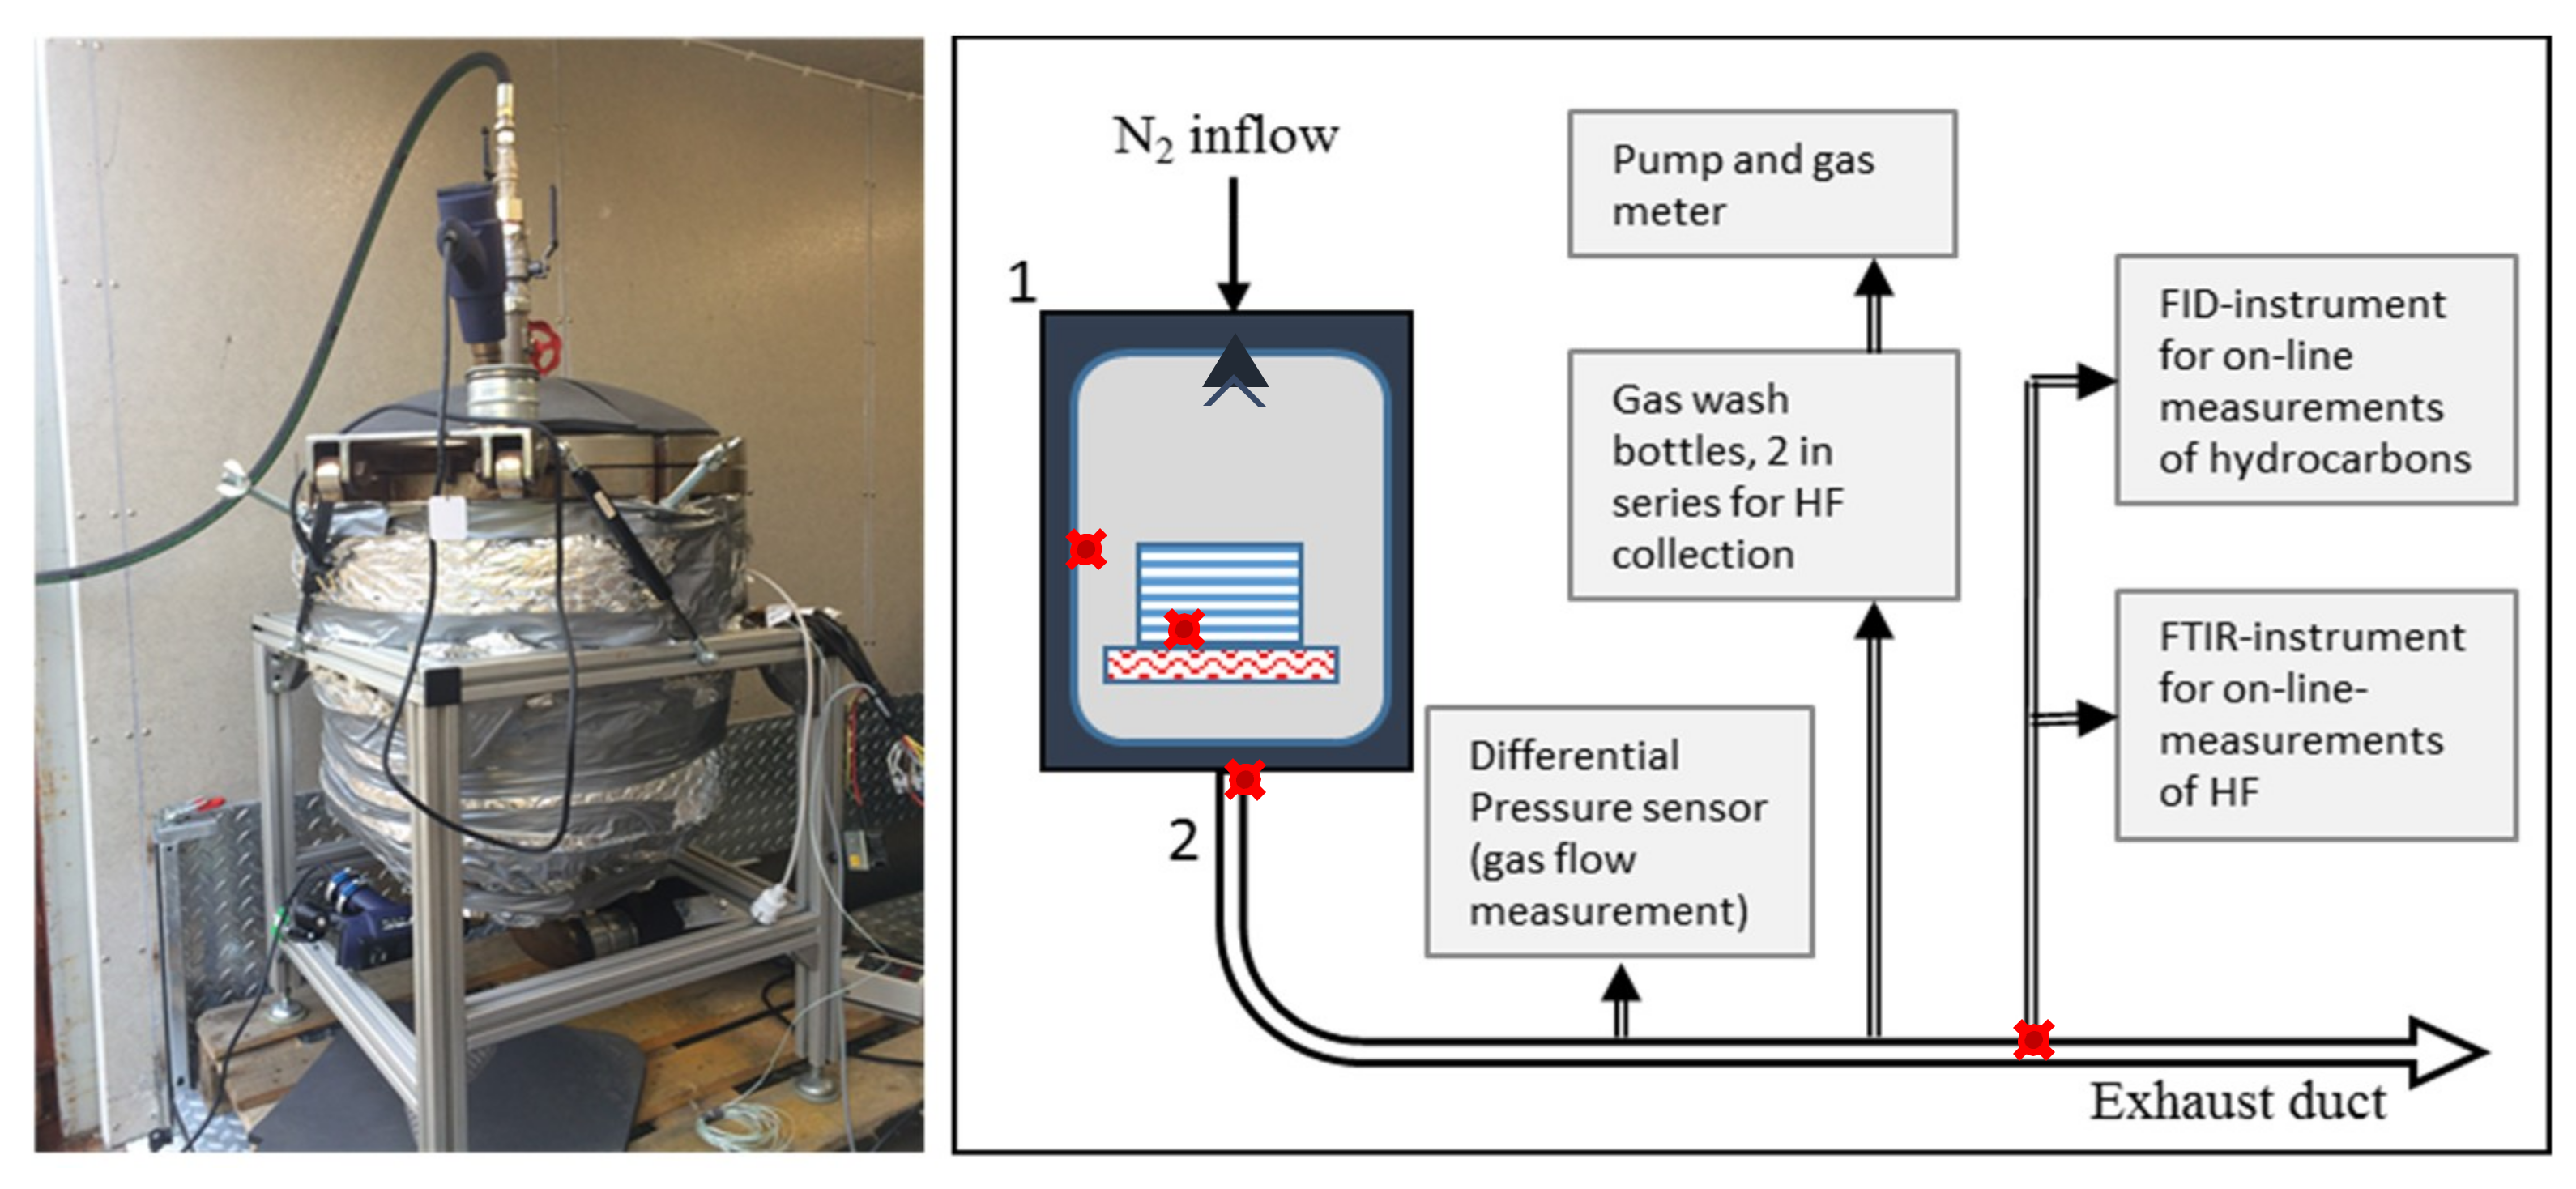
Figure 11 shows a photo and a schematic of the experimental set up developed for the vented gas measurements. The 60 L test vessel was insulated and its walls were electrically heated to approximately 70 °C in order to limit condensation of gaseous substances released from the battery cells during the test. A plate heater was installed at the bottom of test vessel to be used to heat the Li-ion cells. The heater was controlled and turned on/off from the outside of the test vessel. The heater power was 1500 W, generating a maximum temperature of 350 °C at a rate of 7 °C/min.
The top of the test vessel was fitted with an inlet for nitrogen gas in order to be able to establish an inert oxygen-free atmosphere inside the reaction chamber. The humidity of the nitrogen gas was 40 ppm. The objective of the nitrogen was to avoid ignition, and violent combustion reactions with the volatile gases expected to be emitted by the battery cells during tests. A nozzle was installed in the vessel lid in order to distribute the nitrogen gas evenly over the test items. The volume flow rate of the nitrogen gas was nominally 10 L min−1. Thermocouples were mounted on the vessel’s inside wall, between the bottom two cells of the stack at the gas outlet of the test vessel and the gas sampling point. The thermocouples are of K type, and have a thickness of 0.5 mm.
At the bottom of the vessel, a heated outlet was connected to an insulated and similarly heated ventilation duct. The duct system was designed to make it possible to measure the gas flow, to sample gases for measurements, and to ventilate gases to an external smoke stack. The gas flow in the duct was measured using a flow sensor (Micatrone MFS-C80) from AB Micatrone, Solna, Sweden, that was connected to a manometer and a data logger. This arrangement enabled study of any changes in the primary flow of nitrogen, originating from gas evolved from the batteries during heating.
Two sampling lines were connected to the heated duct. The first one was a heated sampling probe with a ceramic filter. The gas was directed through heated polytetrafluoroethylene PTFE tubing to the FTIR and FID for on-line measurements. The FTIR was heated and had a sampling flow rate of 4.2 L min−1 and was calibrated for HF and a range of other gases, e.g., CO and CO2. The heated FID (SICK/Maihak model 3006) was calibrated against a gas mix of 800 ppm propane in synthetic air and had a sampling flow rate of 1.2 L min−1. The other sampling line conducted non-filtered gas at a flow rate of 1.0 L min−1 to a series of 2 gas wash bottles containing a buffer solution for sampling of HF and other water-soluble fluorinated species. The accumulated fluoride concentration in the solution was determined using ion chromatography (IC). The accuracy of the FTIR measurement is assessed to be within 10%-relative. Internal references were used to calibrate the FTIR for CO2, CO, HF, and POF3. A certified gas mixture of HF was used for quantification of the absorption peaks. A detailed description of the calibration procedure is found in the paper by Andersson et al. [25]. The measurement uncertainty for the gas washing bottle method is largely determined by the precision in the gas sampling.
Gas samples for later identification of VOCs were taken on selected occasions during the test. The sampling time was about 1 min and occurred mainly after the main peak flow. The gas samples were collected using Tedlar type gas bags. From these, small volumes of gas were transferred onto multisorbent tubes containing three types of sorbents (Tenax, Carboxen, and Carbograph as adsorbents) for a broad spectrum of organic species. The adsorbed samples were later thermally desorbed into a gas chromatograph system, using FID and mass selective detection (MSD), using the NIST 08 mass spectra library for identification.

4.2. Test Objects

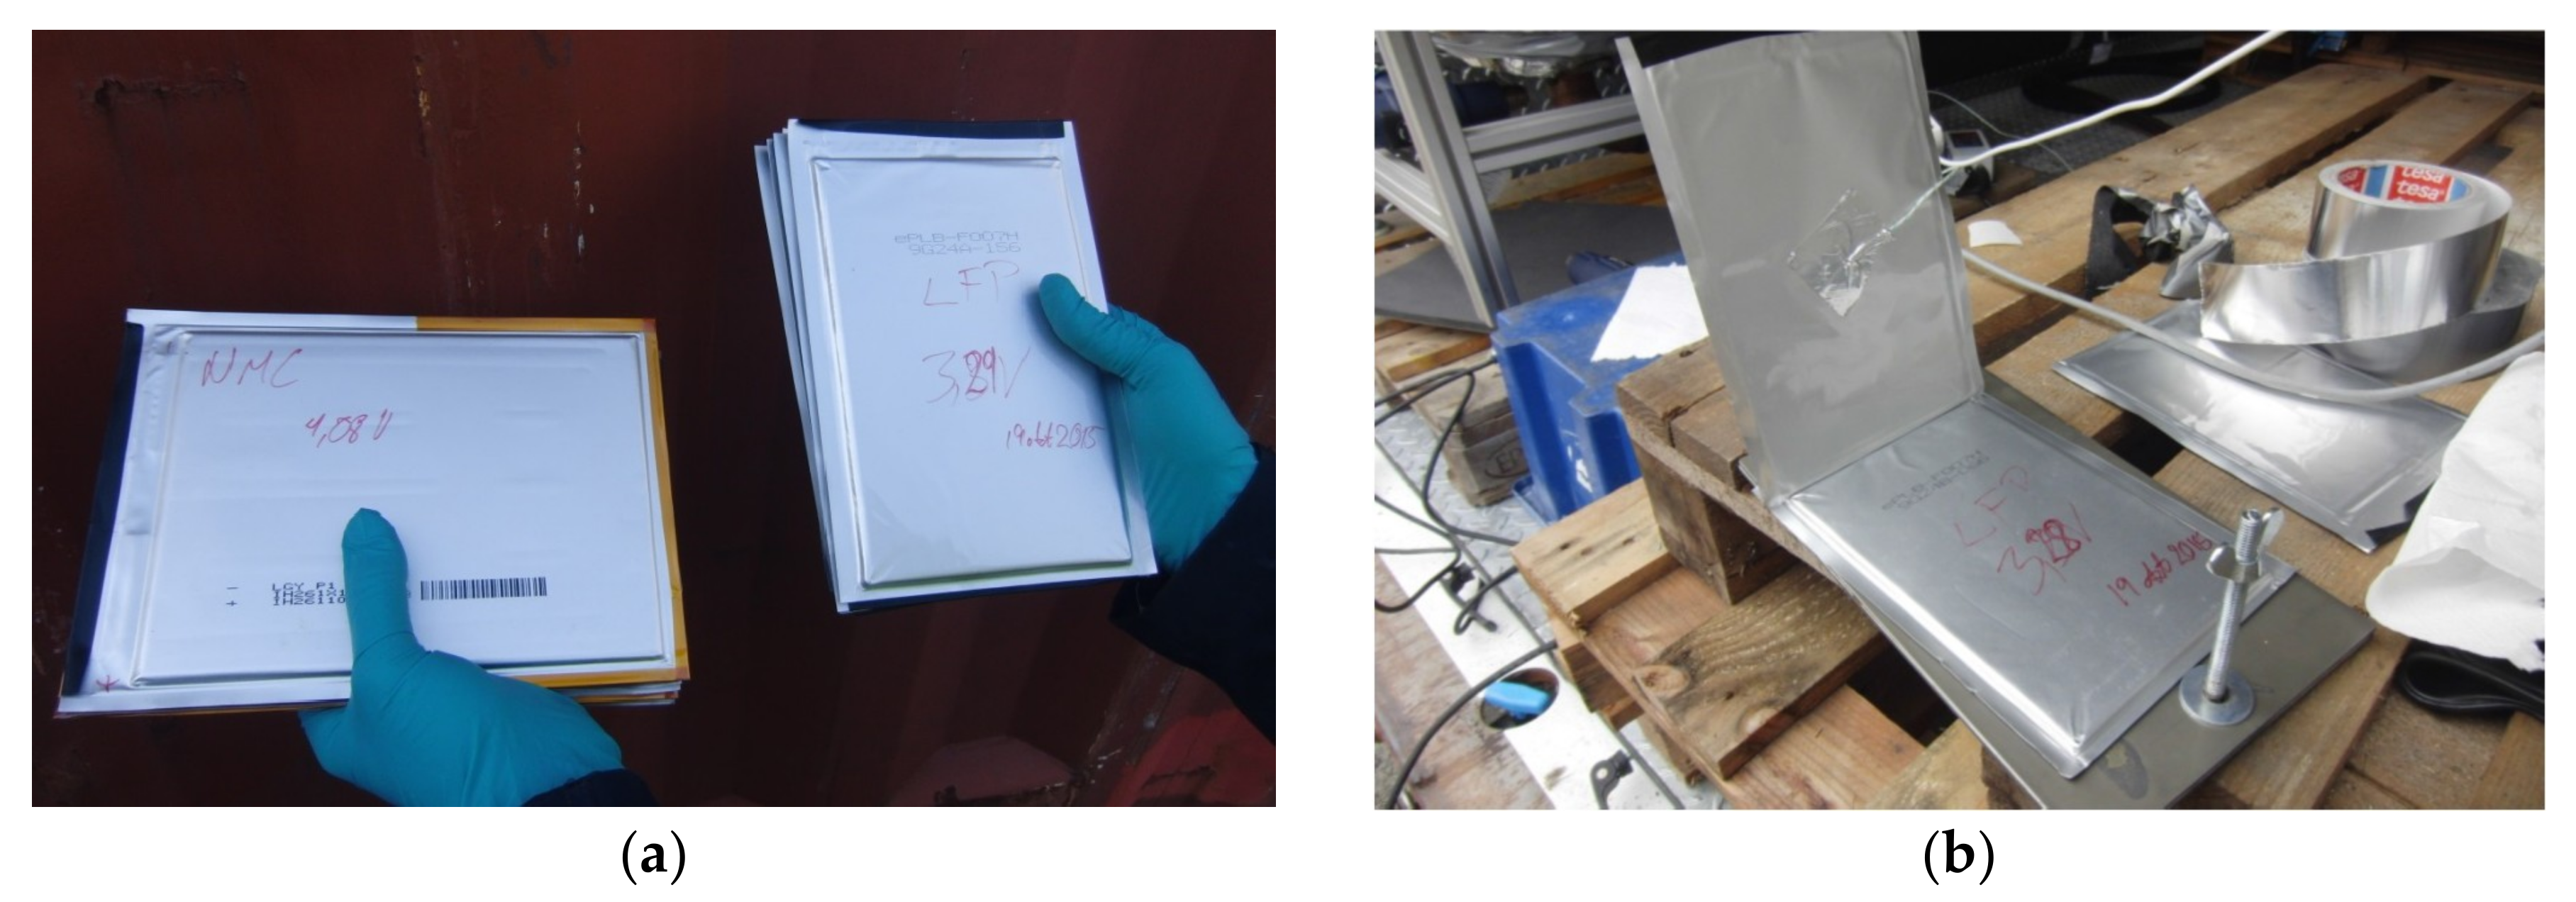
The test was performed on automotive grade LFP and NMC/LMO pouch cells, shown in Figure 12a. These are mass production grade EV cells and are used in commercial EVs on the market. Table 4 summarizes weight and capacity of the test objects. Prior to testing, the cells were charged to about 100% SOC for the respective chemistry, which corresponds to 4.1 V/cell for NMC/LMO cells and 3.3 V/cell for LFP cells, respectively, in order to have a high onset reactivity in the cells when heating. In each test, a stack of five pouch cells was clamped between metal plates, as shown in Figure 12b, and placed onto the heating plate inside the test vessel. The vented gases were examined as they passed through the duct.

4.3. Method for Calculating Gas Volume

In the test with LFP, there was no increase in the flow rate inside the duct detected by the MFS-C80 gas flow sensors, since the emitted gas flow from the battery cells was too small compared to the primary flow rate of nitrogen. Consequently, the total gas volume could not be calculated directly from the measured flow rate. Instead, the measured volume concentrations of emitted gaseous species were used by applying the ideal gas law in combination with gas temperature and the total gas flow rate, as measured by the MFS-C80. The composition of the gas was determined to be 50% VOCs, 45% CO2, and 5% HF. Other potential gases in the emissions, such as H2, were not included in the calculation. For the VOCs, the total hydrocarbon concentration was measured, and the detector was calibrated against propane. Thus, the assumption was that the hydrocarbons were in the form of propane, which gives an uncertainty in the volume calculation, depending on the average number of carbon atoms in the VOCs. The GC-MS analysis of the collected gas bag samples showed that the dominating organic gas species was methyl ethyl carbonate (C4H8O3). This indicates that it is valid to select propane as a representative hydrocarbon, since the 4 carbon atoms in C4H8O3 would result in a similar or lower FID signal compared to propane because the carbonyl carbon does not contribute to the FID signal [26] and the remaining oxygen atoms will reduce the signal further.

5. Conclusions

The gas and temperature measurements confirm studies stating that there is a great difference in chemical reactivity between different types of Li-ion cell chemistries. The NMC/LMO-based technologies are significantly more reactive than LFP, which is seen by a much faster venting period during self-heating and combustion of the NMC/LMO cells; i.e., approximately 2 min venting duration compared to 45 min for LFP cells in this study. The maximum temperatures measured between cells is also much higher for the NMC/LMO cells than for LFP; i.e., about 600 °C and 400 °C, respectively.
The LFP cells released 50 L of gas and the NMC/LMO cells released 1500 L of gas in total, and the corresponding difference in emission rate of CO2 is two orders of magnitude higher for the NMC/LMO cells. However, the absolute amount of HF released from both test series is about the same, whereas the amounts of CO2 differs significantly. For the LFP cells, the HF/CO2 ratio is 1/10, and for the NMC/LMO cells, the ratio is 1/100. However, due to the lower energy density of the LFP cells, the normalized amount of HF and its corresponding gas concentration is notably higher for this chemistry compared to NMC/LMO.
Temperature and hydrocarbon sensors used in the test system were able to provide time-resolved information on the on-set timing and propagation of thermal runaway from cell to cell in the stack. The hydrocarbon sensor was more sensitive than the temperature sensors in the gas duct where the gas temperatures had dropped. Hence, hydrocarbon sensors monitoring gases accumulating inside the battery pack may effectively detect the presence of critical cell failure in a Li-ion battery system, regardless of the rate of temperature increase occurring inside the battery.
Extrapolation of these test results needs to be done cautiously. Venting in an inert atmosphere may impact on the gaseous species formed, since it is possible that chemical species form that are unstable in normal atmospheres. However, the test method is useful for making comparative studies of the amount of gas released from different cell chemistries and relative amounts of major gas constituents. Quantitative determination of small volume gases depends strongly on the detection method used, and the measurement uncertainties are rather high.

Author Contributions

D.S. conceived and designed the experiments; L.R. and P.B. performed the experiments and consolidated the data; D.S. and A.A.T. analyzed the data and wrote the paper.

Funding

Autoliv Sverige AB kindly provided funding to design and execute the tests and compile test results. This research received no external funding.

Conflicts of Interest

The authors declare no conflict of interest.

References

  1. Sturk, D.; Näsman, Y.; Hoffmann, L.; Gustafson, H.; Östrand, L.; Björnstig, U. E-vehicle safe rescue. Investigation of risk factors and rescue tactics in a traffic incident event involving an e-vehicle. In Proceedings of the Third International Conference on Fire in Vehicles – FIVE 2014; Andersson, P., Sundström, U., Eds.; SP Technical Research Institute of Sweden: Berlin, Germany, 2014; pp. 255–265. [Google Scholar]
  2. Sturk, D.; Hoffmann, L.; Ahlberg Tidblad, A. Fire on e-vehicle battery cells and packs. Traff. Inj. Prev. 2015, 16, S159–S164. [Google Scholar] [CrossRef]
  3. Barnett, B.; Ofer, D.; Sriramulu, S.; Stringfellow, R. Li-ion batteries, safety. In Batteries for Sustainability. Selected Entries for the Encyclopedia of Sustainability Science and Technology; Brodd, R.J., Ed.; Springer: New York, NY, USA, 2013; pp. 285–318. ISBN 978-1-4614-5790-9. [Google Scholar]
  4. Roth, E.P.; Orendorff, C.J. How electrolytes influence battery safety. ECS Interface 2012, 21, 45–49. [Google Scholar] [CrossRef]
  5. Roth, E.P. Abuse response of 18650 Li-Ion cells with different cathodes using EC:EMC/LiPF6 and EC:PC:DMC/LiPF6 Electrolytes. ECS Trans. 2008, 11, 19–41. [Google Scholar] [CrossRef]
  6. Hollas, J.M. Modern Spectroskopy, 3rd ed.; John Whiley & Sons Ltd.: Chichester, UK, 1996; p. 139. ISBN 0471965235. [Google Scholar]
  7. Giurgis, G.A.; Zhu, X.; Durig, J.R. Conformational and structural studies of 1-fluoropropane from temperature dependant FT-IR spectra of rare gas solutions and ab initio calculations. Struct. Chem. 1999, 10, 445–461. [Google Scholar] [CrossRef]
  8. Xiang, H.F.; Wang, H.; Chen, C.H.; Ge, X.W.; Guo, S.; Sun, J.H.; Hu, W.Q. Thermal Stability of LiPF6-based Electrolyte and Effect of Contact with Various Delithiated Cathodes of Li-ion Batteries. J. Power Sources 2009, 191, 575–581. [Google Scholar] [CrossRef]
  9. Lei, B.; Zhao, W.; Ziebert, C.; Uhlmann, N.; Rohde, M.; Seifert, H.J. Experimental analysis of thermal runaway in 18650 cylindrical Li-Ion cells using an accelerating rate calorimeter. Batteries 2017, 3, 14. [Google Scholar] [CrossRef]
  10. Barai, A.; Uddin, K.; Chevalier, J.; Chouchelamane, G.H.; McGordon, A.; Low, J.; Jennings, P. Transportation safety of lithium iron phosphate batteries—A feasibility study of storing at very low states of charge. Sci. Rep. 2017, 7, 5128. [Google Scholar] [CrossRef]
  11. Eshetu, G.G.; Bertrand, J.-P.; Lecocq, A.; Grugeon, S.; Laruelle, S.; Armand, M.; Marlair, G. Fire behavior of carbonates-based electrolytes used in Li-ion rechargeable batteries with a focus on the role of the LiPF6 and LiFSI salts. J. Power Sources 2014, 269, 804–811. [Google Scholar] [CrossRef]
  12. Lecocq, A.; Eshetu, G.G.; Grugeon, S.; Martin, N.; Laruelle, S.; Marlair, G. Scenario-based prediction of Li-ion batteries fire-induced toxicity. J. Power Sources 2016, 316, 197–206. [Google Scholar] [CrossRef]
  13. Bergström, U.; Gustafsson, Å.; Hägglund, L.; Lejon, C.; Sturk, D.; Tengel, T. Vented Gases and Aerosol of Automotive Li-ion LFP and NMC Batteries in Humified Nitrogen Under Thermal Load; Försvarets Forskningsinstitut FOI-R--4166—SE; Försvarets Forskningsinstitut: Umeå, Sweden, 2015. [Google Scholar]
  14. Abert, M. Analysis of gases emitted in safety events. In Electrochemical Powers Sources: Fundamentals, Systems, and Applications. Li-Battery Safety; Garche, J., Brandt, K., Eds.; Elsevier: Amsterdam, The Netherlands, 2019; pp. 196–215. ISBN 978-0-444-63777-2. [Google Scholar]
  15. Yang, H.; Zhuang, G.V.; Ross, P.N., Jr. Thermal stability of LiPF6 Salt and Li-ion battery electrolytes containing LiPF6. J. Power Sources 2006, 161, 573–579. [Google Scholar] [CrossRef]
  16. Kawamura, T.; Okada, S.; Yamaki, J.I. Decomposition reaction of LiPF6-based electrolytes for lithium ion cells. J. Power Sources 2006, 156, 547–554. [Google Scholar] [CrossRef]
  17. Wilken, S.; Treskow, M.; Scheers, J.; Johansson, P.; Jacobsson, P. Initial stages of thermal decomposition of LiPF6-based lithium ion battery electrolytes by detailed Raman and NMR spectroscopy. RSC Adv. 2013, 3, 16359–16364. [Google Scholar] [CrossRef]
  18. Hammami, A.; Raymond, N.; Armand, M. Lithium-ion batteries: Runaway risk of forming toxic compounds. Nature 2003, 42, 635–636. [Google Scholar] [CrossRef] [PubMed]
  19. Sun, J.; Li, J.; Zhou, T.; Yang, K.; Wei, S.; Tang, N. Toxicity, a serious concern of thermal runaway from commercial Li-ion battery. Nano Energy 2016, 27, 313–319. [Google Scholar] [CrossRef]
  20. Sturk, D.; Hägglund, L.; Lejon, C.; Tengel, T.; Gustafsson, Å. Analysis of emitted gases from Li-ion LFP and NMC batteries at elevated temperatures. In Proceedings of the EVS29 Symposium, Montreal, QC, Canada, 19–22 June 2016. [Google Scholar]
  21. Koch, S.; Birke, K.P.; Kuhn, R. Fast thermal runaway detection for Lithium-ion cells in large scale traction batteries. Batteries 2018, 4, 16. [Google Scholar] [CrossRef]
  22. Truchot, B.; Fouillen, F.; Collet, S. An experimental evaluation of toxic gas emissions from vehicle fires. Fire Saf. J. 2018, 97, 111–118. [Google Scholar] [CrossRef]
  23. Larsson, F.; Andersson, P.; Blomqvist, P.; Mellander, B.-E. Toxic fluoride gas emissions from lithium-iion battery fires. Sci. Rep. 2017, 7, 10018. [Google Scholar] [CrossRef] [PubMed]
  24. Eriksson, T.; International Association of Fire and Rescue Services (CTIF), Karlstad, Sweden. Personal communication, 2019.
  25. Andersson, P.; Blomqvist, P.; Loren, A.; Larsson, F. Using FTIR to determine toxic gases in fires with Li-ion batterie. Fire Mater. 2016, 40, 999–1015. [Google Scholar] [CrossRef]
  26. Scanlon, J.T.; Willis, D.E. Calculation of flame ionization detector relative response factors using the effective carbon number concept. J. Chromatogr. Sci. 1985, 23, 333–340. [Google Scholar] [CrossRef]
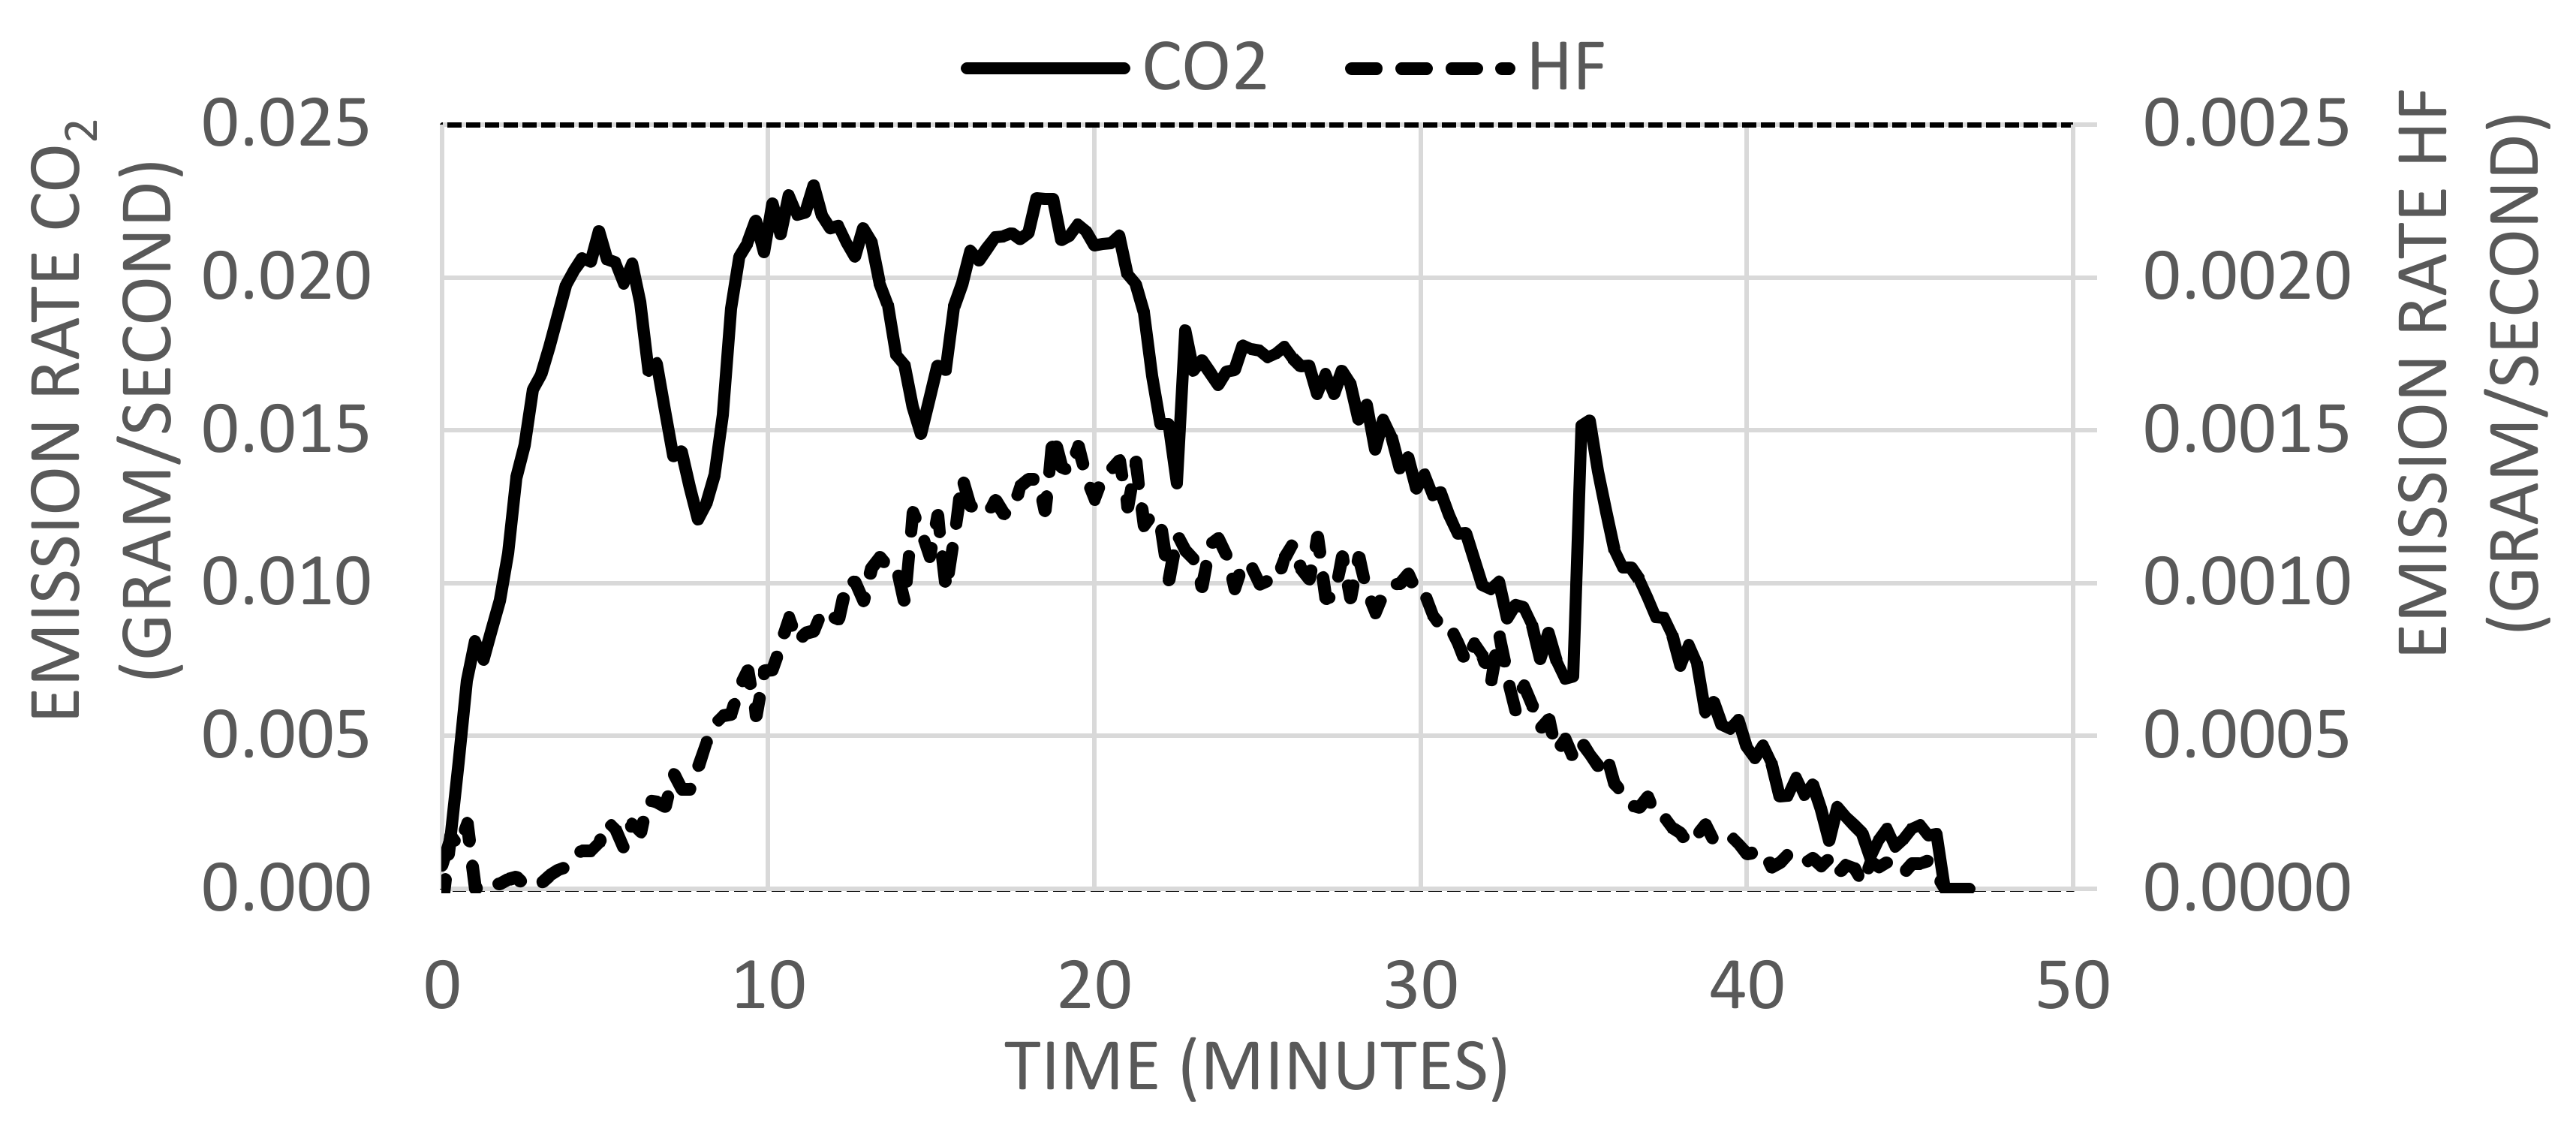
Figure 1. Rate of CO2 and HF release after a thermal event in lithium iron phosphate (LFP cells). t = 0 is the time when the first sign of venting is detected. Note that the order of magnitude is different for CO2 (left) and HF (right) in the diagram.
Batteries 05 00061 g001
Figure 2. Rate of CO2 and HF release after a thermal event in lithium nickel manganese cobalt (NMC) dioxide/lithium manganese oxide (LMO) spinel (NMC/LMO) cells. t = 0 is the time when the first sign of venting is detected. Note that the order of magnitude is different for CO2 (left) and HF (right) in the diagram.
Batteries 05 00061 g002
Figure 3. Rate of hydrocarbon (HC) release after a thermal event in LFP cells. t = 0 is the time when the first sign of venting is detected. HC measured as propane equivalents.
Batteries 05 00061 g003
Figure 4. Rate of hydrocarbon (HC) release after a thermal event in NMC/LMO cells. t = 0 is the time when the first sign of venting is detected. HC measured as propane equivalents. The dotted line represents reconstructed data in place of missing data in the initial part of the graph due to over-loading of the flame ionization detector (FID) at the used sensitivity range.
Batteries 05 00061 g004
Figure 5. The temperature measured between the two bottom cells in the LFP cell stack. t = 0 is the time when the first sign of venting is detected. The average slope, dT/dt, from onset to peak temperature is 11.7 °C/min.
Batteries 05 00061 g005
Figure 6. The temperature measured between two bottom cells in the NMC/LMO cell stack. t = 0 is the time when the first sign of venting is detected. The average slope, dT/dt, from onset to peak temperature is 1390 °C/min.
Batteries 05 00061 g006
Figure 7. The temperature in the gas flow leaving the test vessel for the LFP cells. t = 0 is the time when the first sign of venting is detected.
Batteries 05 00061 g007
Figure 8. The temperature in the gas flow leaving the test vessel for the NMC/LMO cells. t = 0 is the time when the first sign of venting is detected.
Batteries 05 00061 g008
Figure 9. Gas chromatogram (FID signal) of gas volume sampled from LFP cells.
Batteries 05 00061 g009
Figure 10. Gas chromatogram (FID signal) of gas volume sampled from NMC/LMO cells.
Batteries 05 00061 g010
Figure 11. A schematic representation of the test set-up shown to the right. The cell stack was placed on the heating plate in the test vessel (1), and the exhaust duct (2) collected the vented gases and lead them to the measurement equipment. Thermocouples were placed at locations illustrated by the red-crossed circles.
Batteries 05 00061 g011
Figure 12. (a) Li-ion pouch cells used for the test. All NMC/LMO cells were charged to 4.1 V/cell and the LFP cells to 3.3 V/cell, respectively, before the test. (b) Stacks of 5 cells were clamped between metal plates with thermocouples placed between the bottom cell, nearest the heating plate, and the second cell in the stack.
Batteries 05 00061 g012
Table 1. Gas volumes produced by battery stacks comprising five cells when heated to thermal runaway in an oxygen-free environment.
Test NumberCell TypeTotal Gas Volume Normalized Gas Volume
1LFP50 L 142 L/kg
2NMC/LMO1500 L780 L/kg
1 Calculated value from measured amounts of volatile organic compounds (VOCs), carbon dioxide (CO2), and hydrogen fluoride (HF).
Table 2. Total amount of HF measured in the vent gas streams for LFP and NMC cells using two different methods; wash bottles and FTIR. The HF amounts have been normalized to battery mass (g/kg) and energy density (g/kWh), respectively.
Cell Type Wash Bottles 1FTIRNormalized Amounts: Wash BottlesNormalized Amounts: FTIR
LFP4.2 g1.8 g3.6 g/kg 36 g/kWh1.5 g/kg 16 g/kWh
NMC/LMO6.5 g1.7 g3.4 g/kg 23 g/kWh0.9 g/kg 6.0 g/kWh
1 Calculated from the total fluoride ion concentration in the solution.
Table 3. Summary of FTIR absorption peaks used for quantitative analysis of emitted gas composition. The gas species reported include: carbon dioxide (CO2), carbon monoxide (CO), diethyl carbonate (DEC), dimethyl carbonate (DMC), ethyl methyl carbonates (EMC), propylene carbonate (PC), hydrogen fluoride (HF) and phosphorous oxyfluoride (POF3).
Type of GasesGas Species Absorption Band (cm−1)LFPNMC/LMO
Combustion gasesCO22392Strong peakStrong peak
CO2134Not conclusive due to interferenceNot conclusive due to interference
Organic carbonatesDEC1770 and 1280Major peaksMajor peaks
DMC
EMC
PC1870 and 1100Major peaksMajor peaks
Fluorinated hydrocarbons 1100Major peak but cannot separate from PCMajor peak but cannot separate from PC
Acid gasesHF4075 a4000–4200 band clearly identified4000–4200 band clearly identified
POF31416, 991, and 871 bNot conclusively identifiedNot conclusively identified
a Wave number used for quantification. b Wave numbers used for qualitative assessment.
Table 4. Test object data.
Cell TypeCell WeightWeight of Tested Cell Stack (5 Cells)Rated Capacity
LFP0.236 kg1.180 kg7 Ah
NMC/LMO0.385 kg.1.925 kg14 Ah