A One-Dimensional Stack Model for Redox Flow Battery Analysis and Operation


Abstract
:1. Introduction
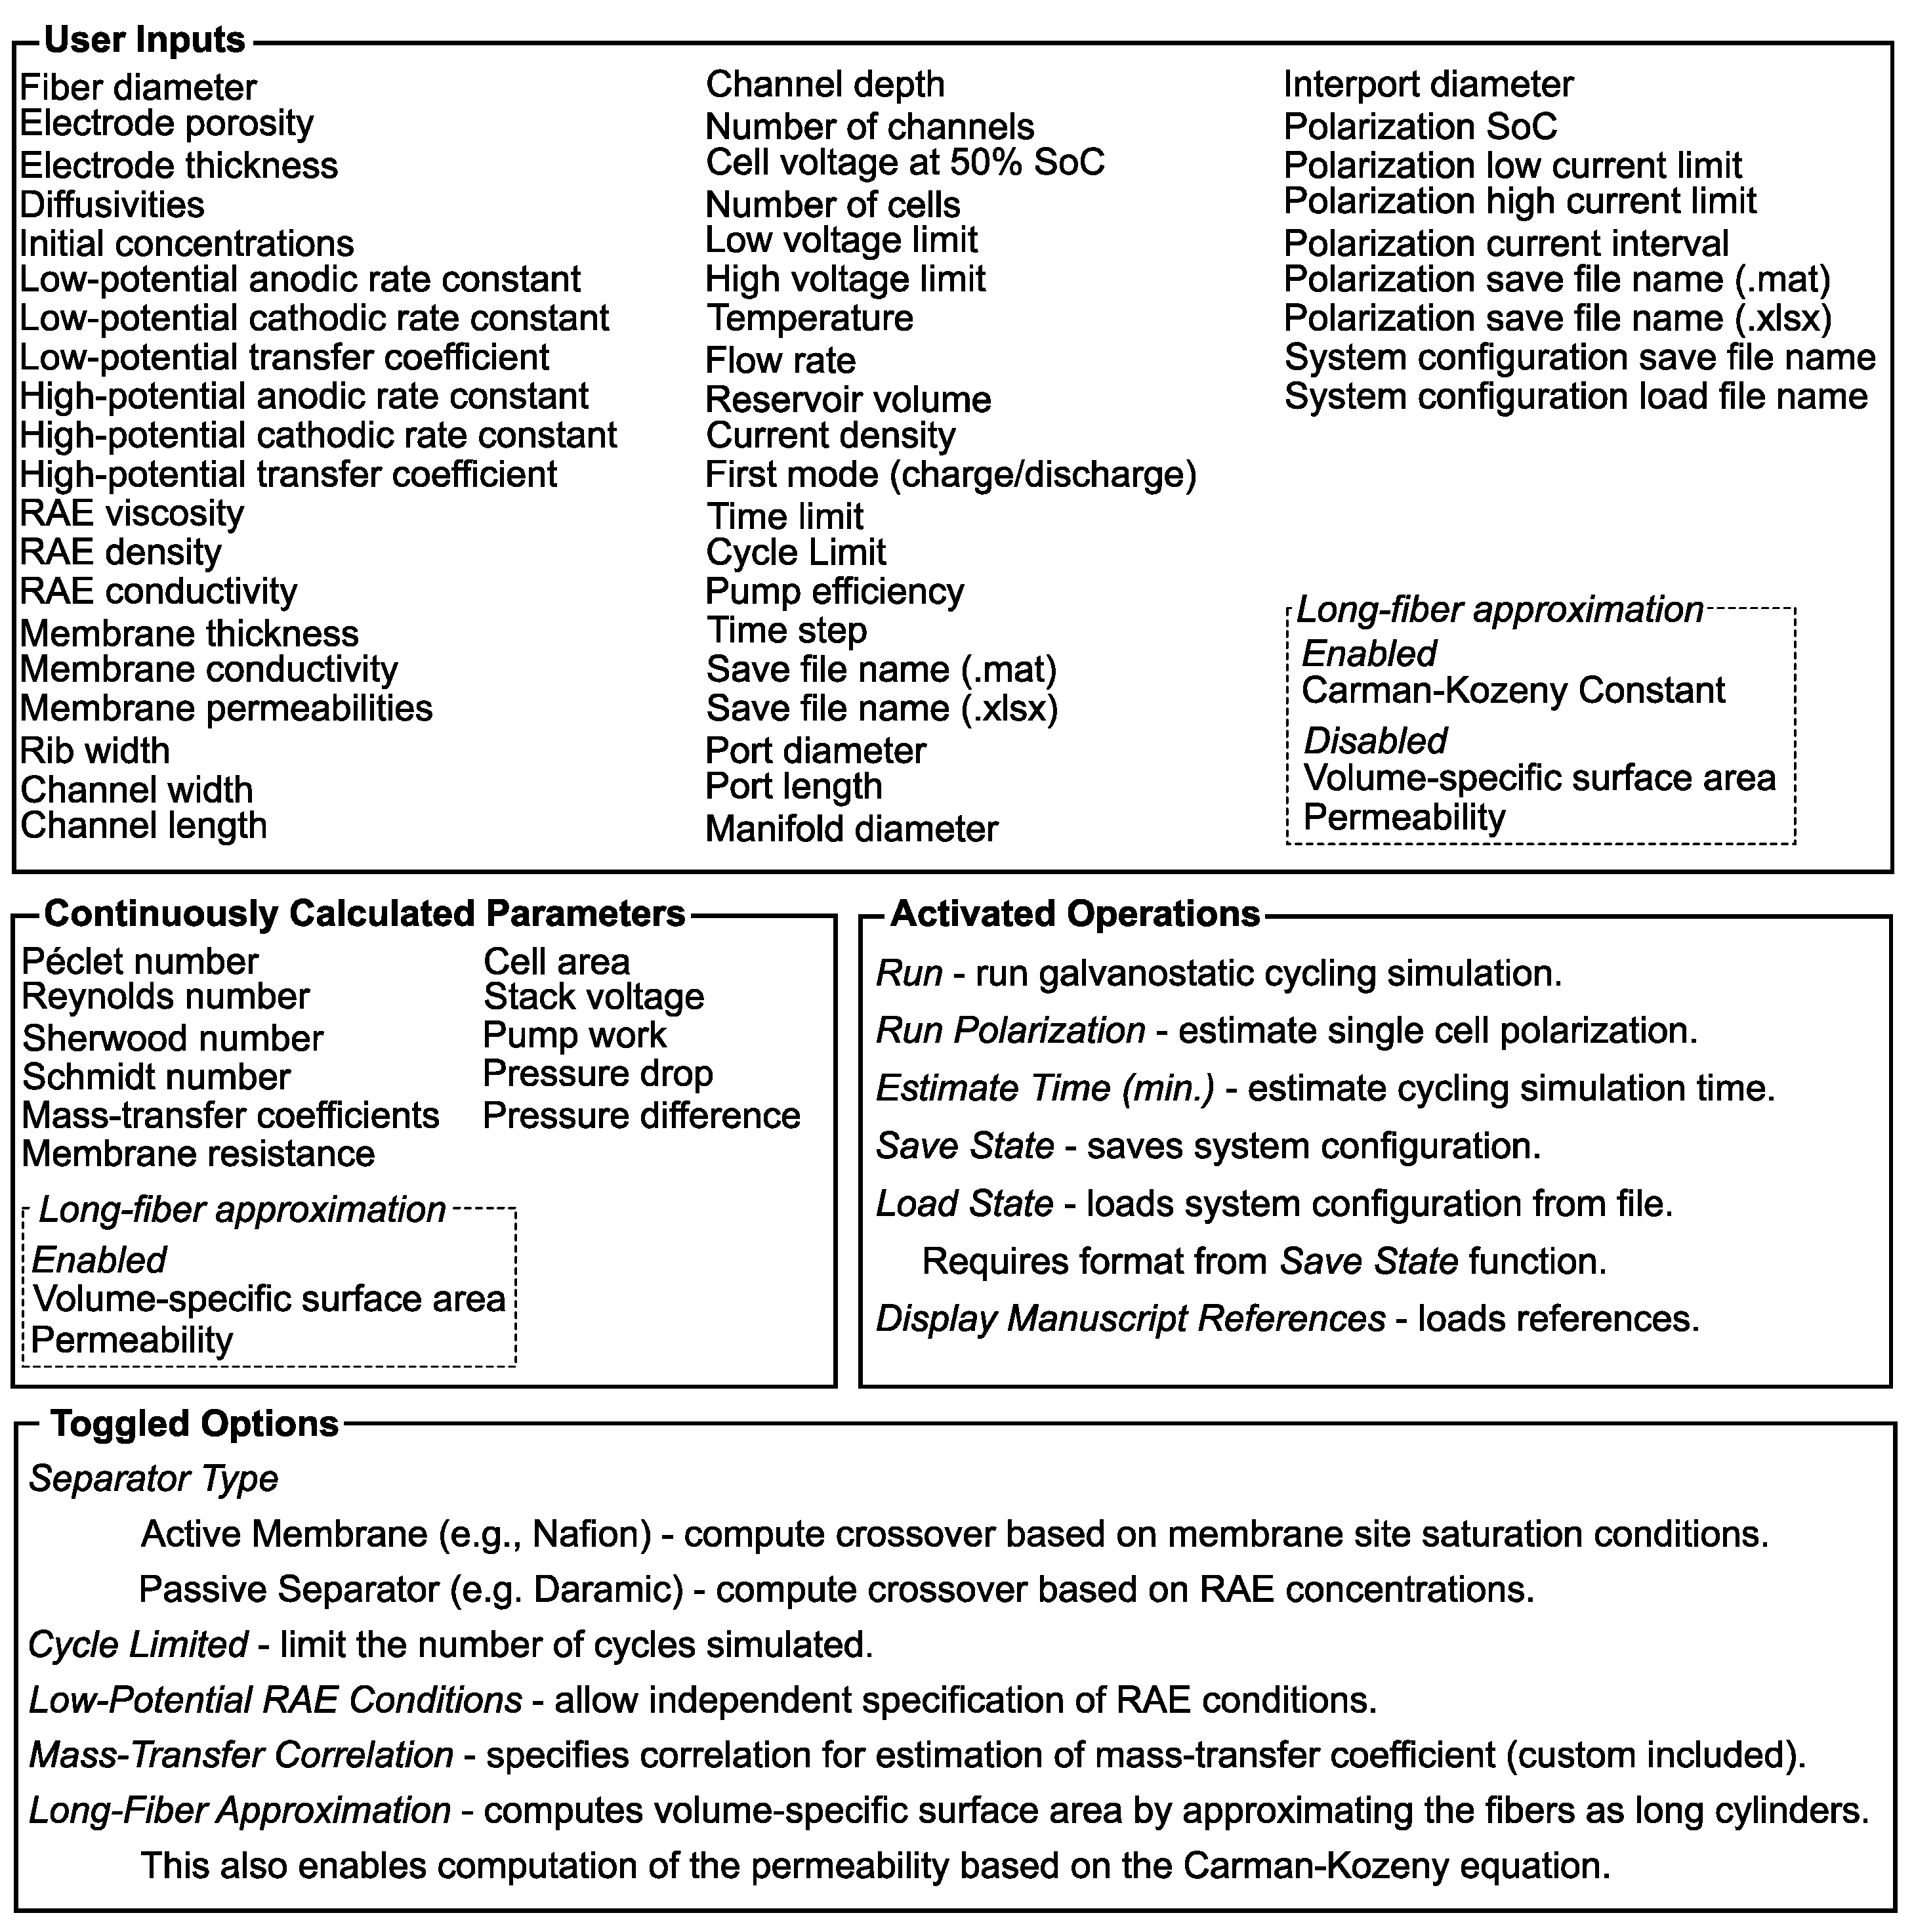
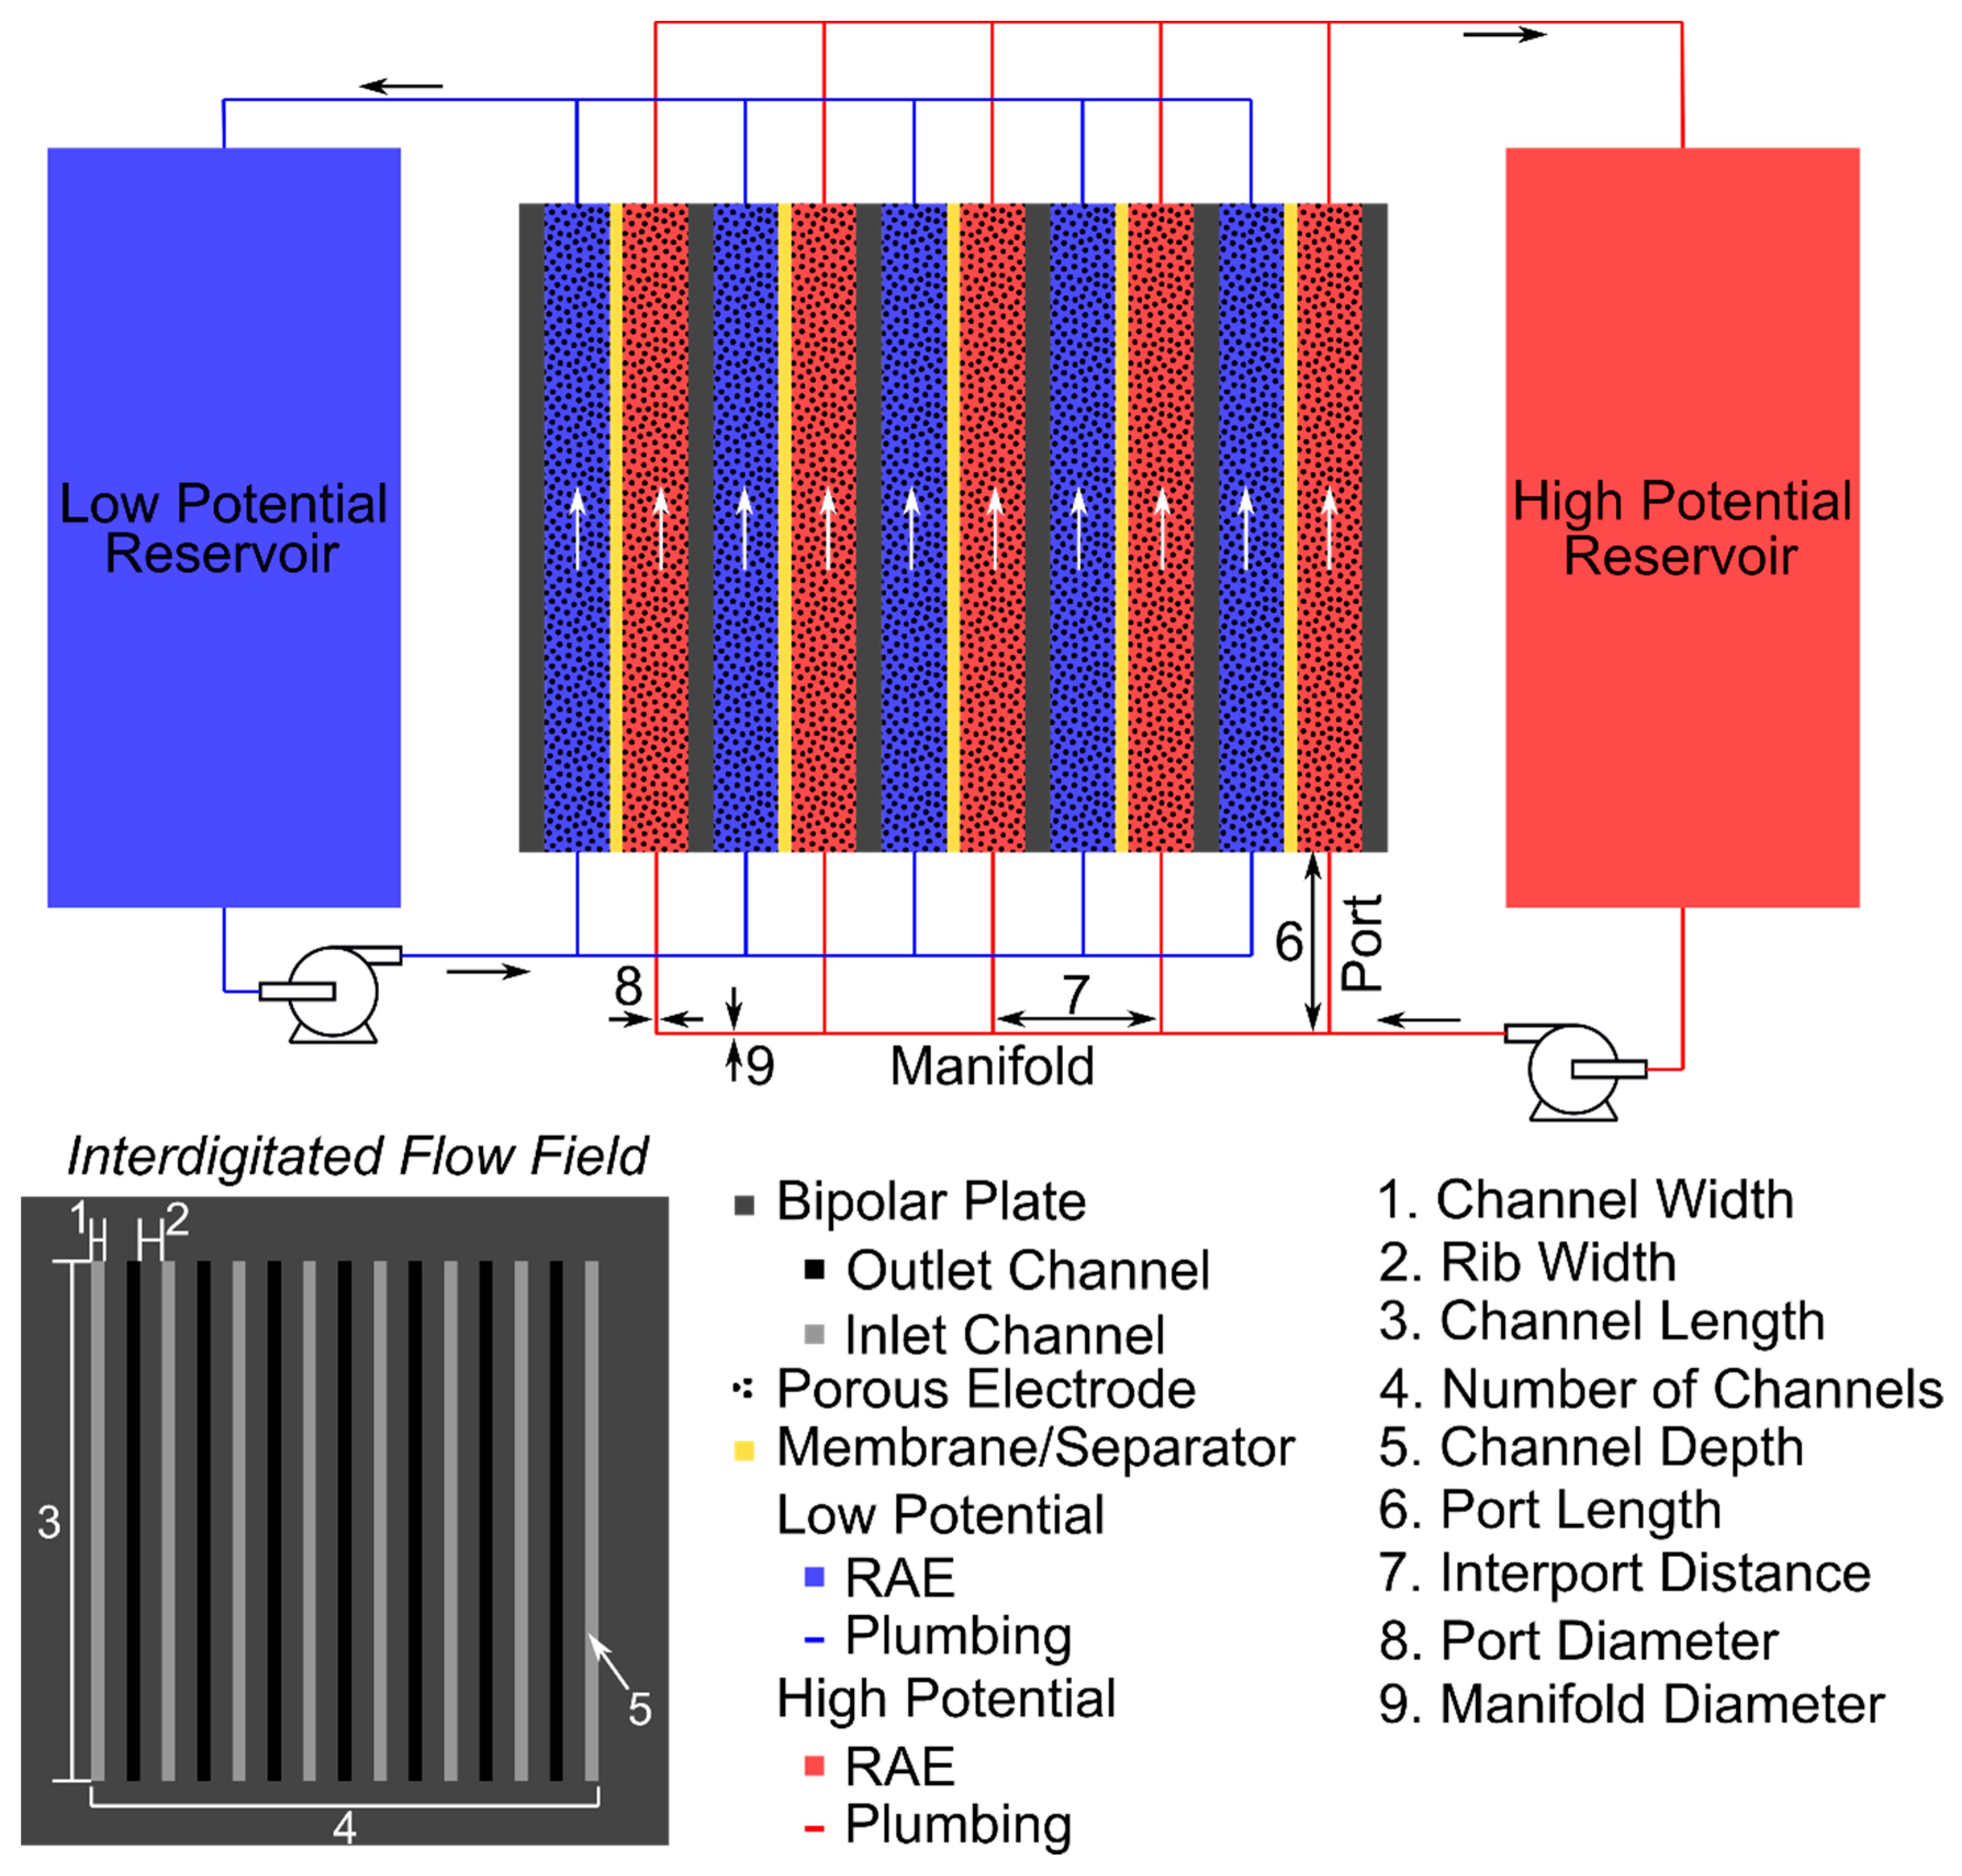
2. System Models
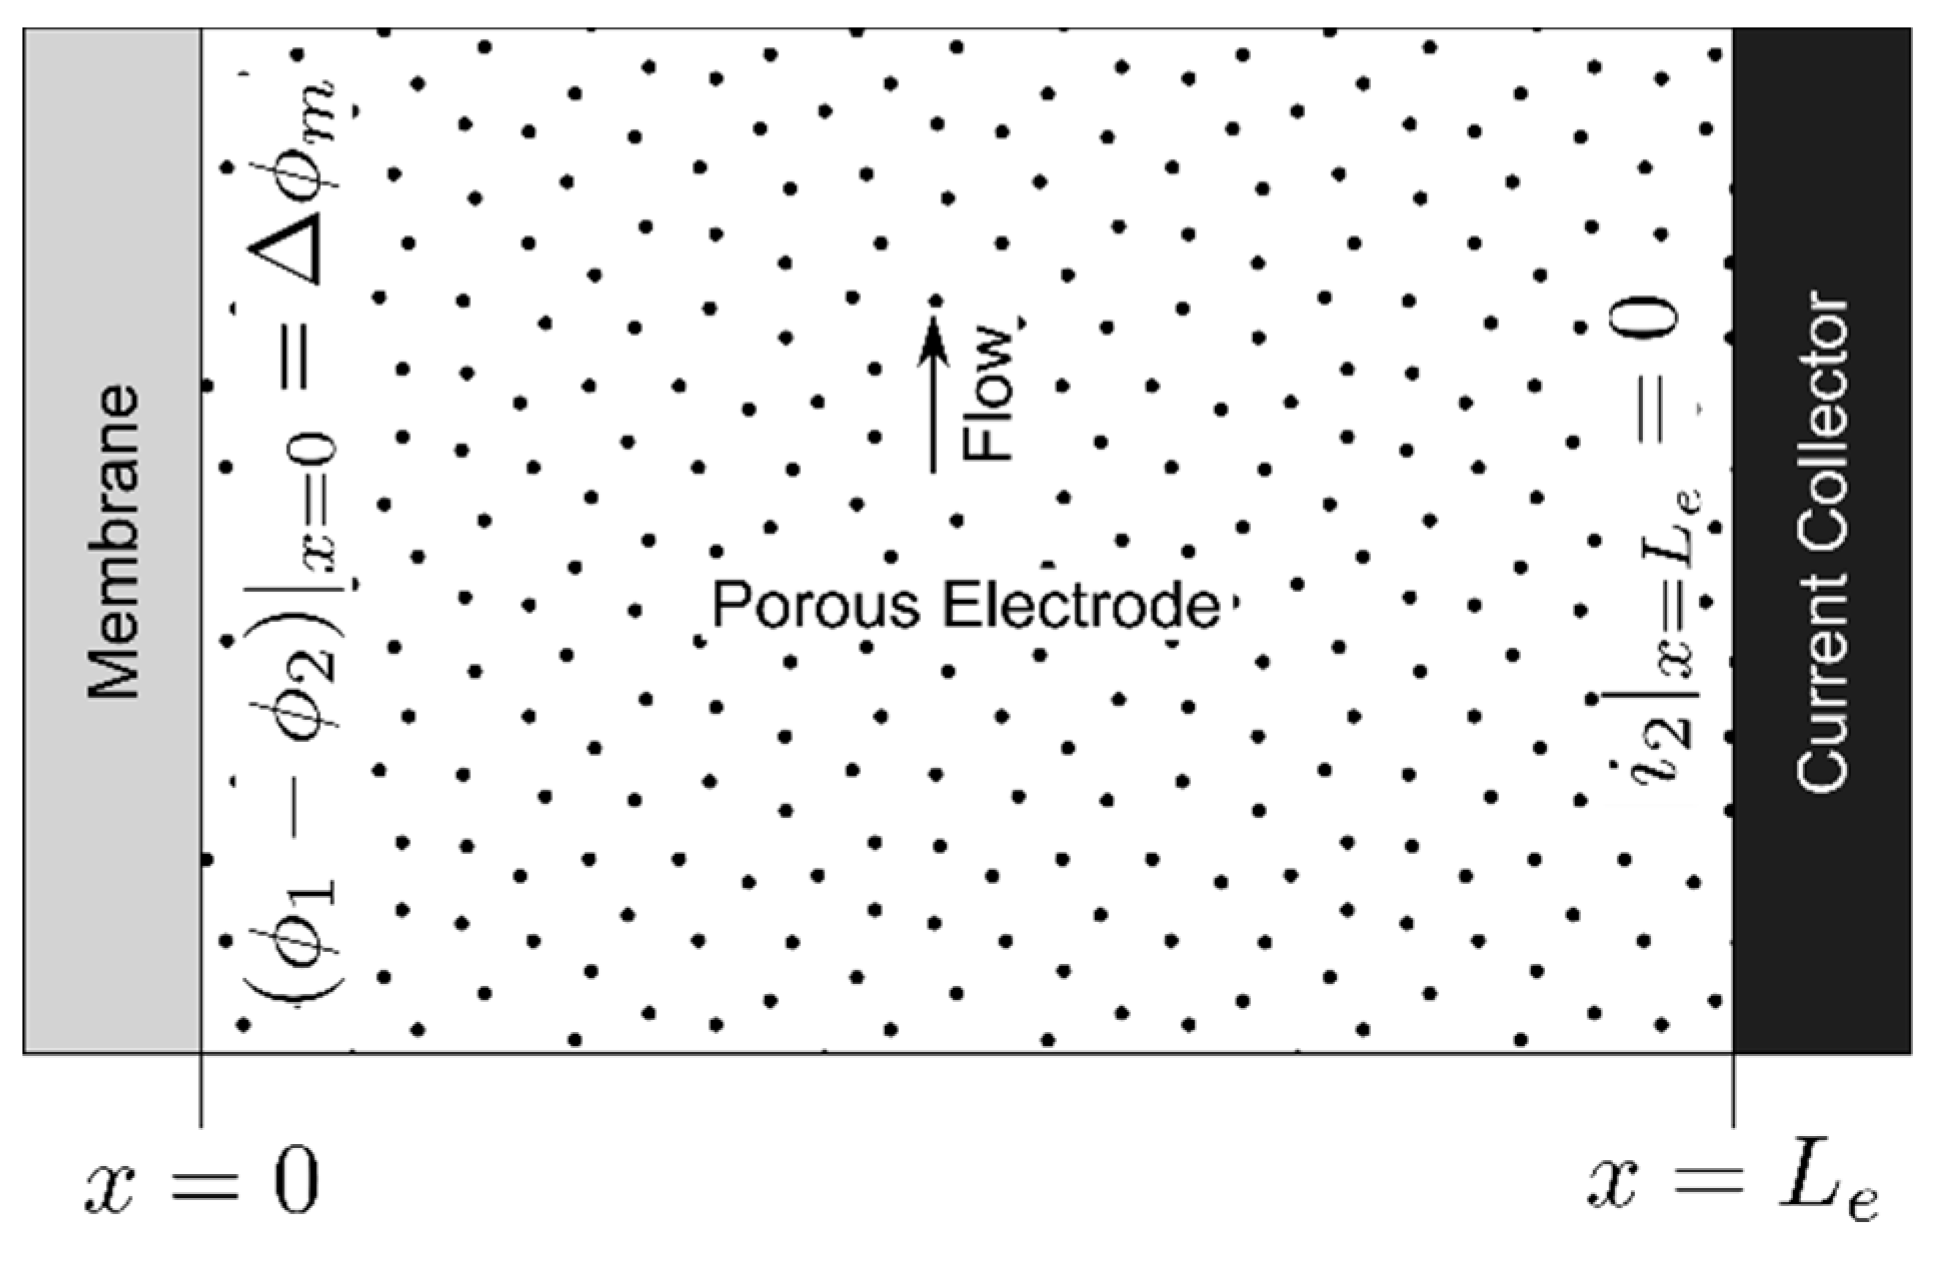
2.1. Electrode Polarization
Mass-Transfer Coefficients
2.2. Membrane Effects
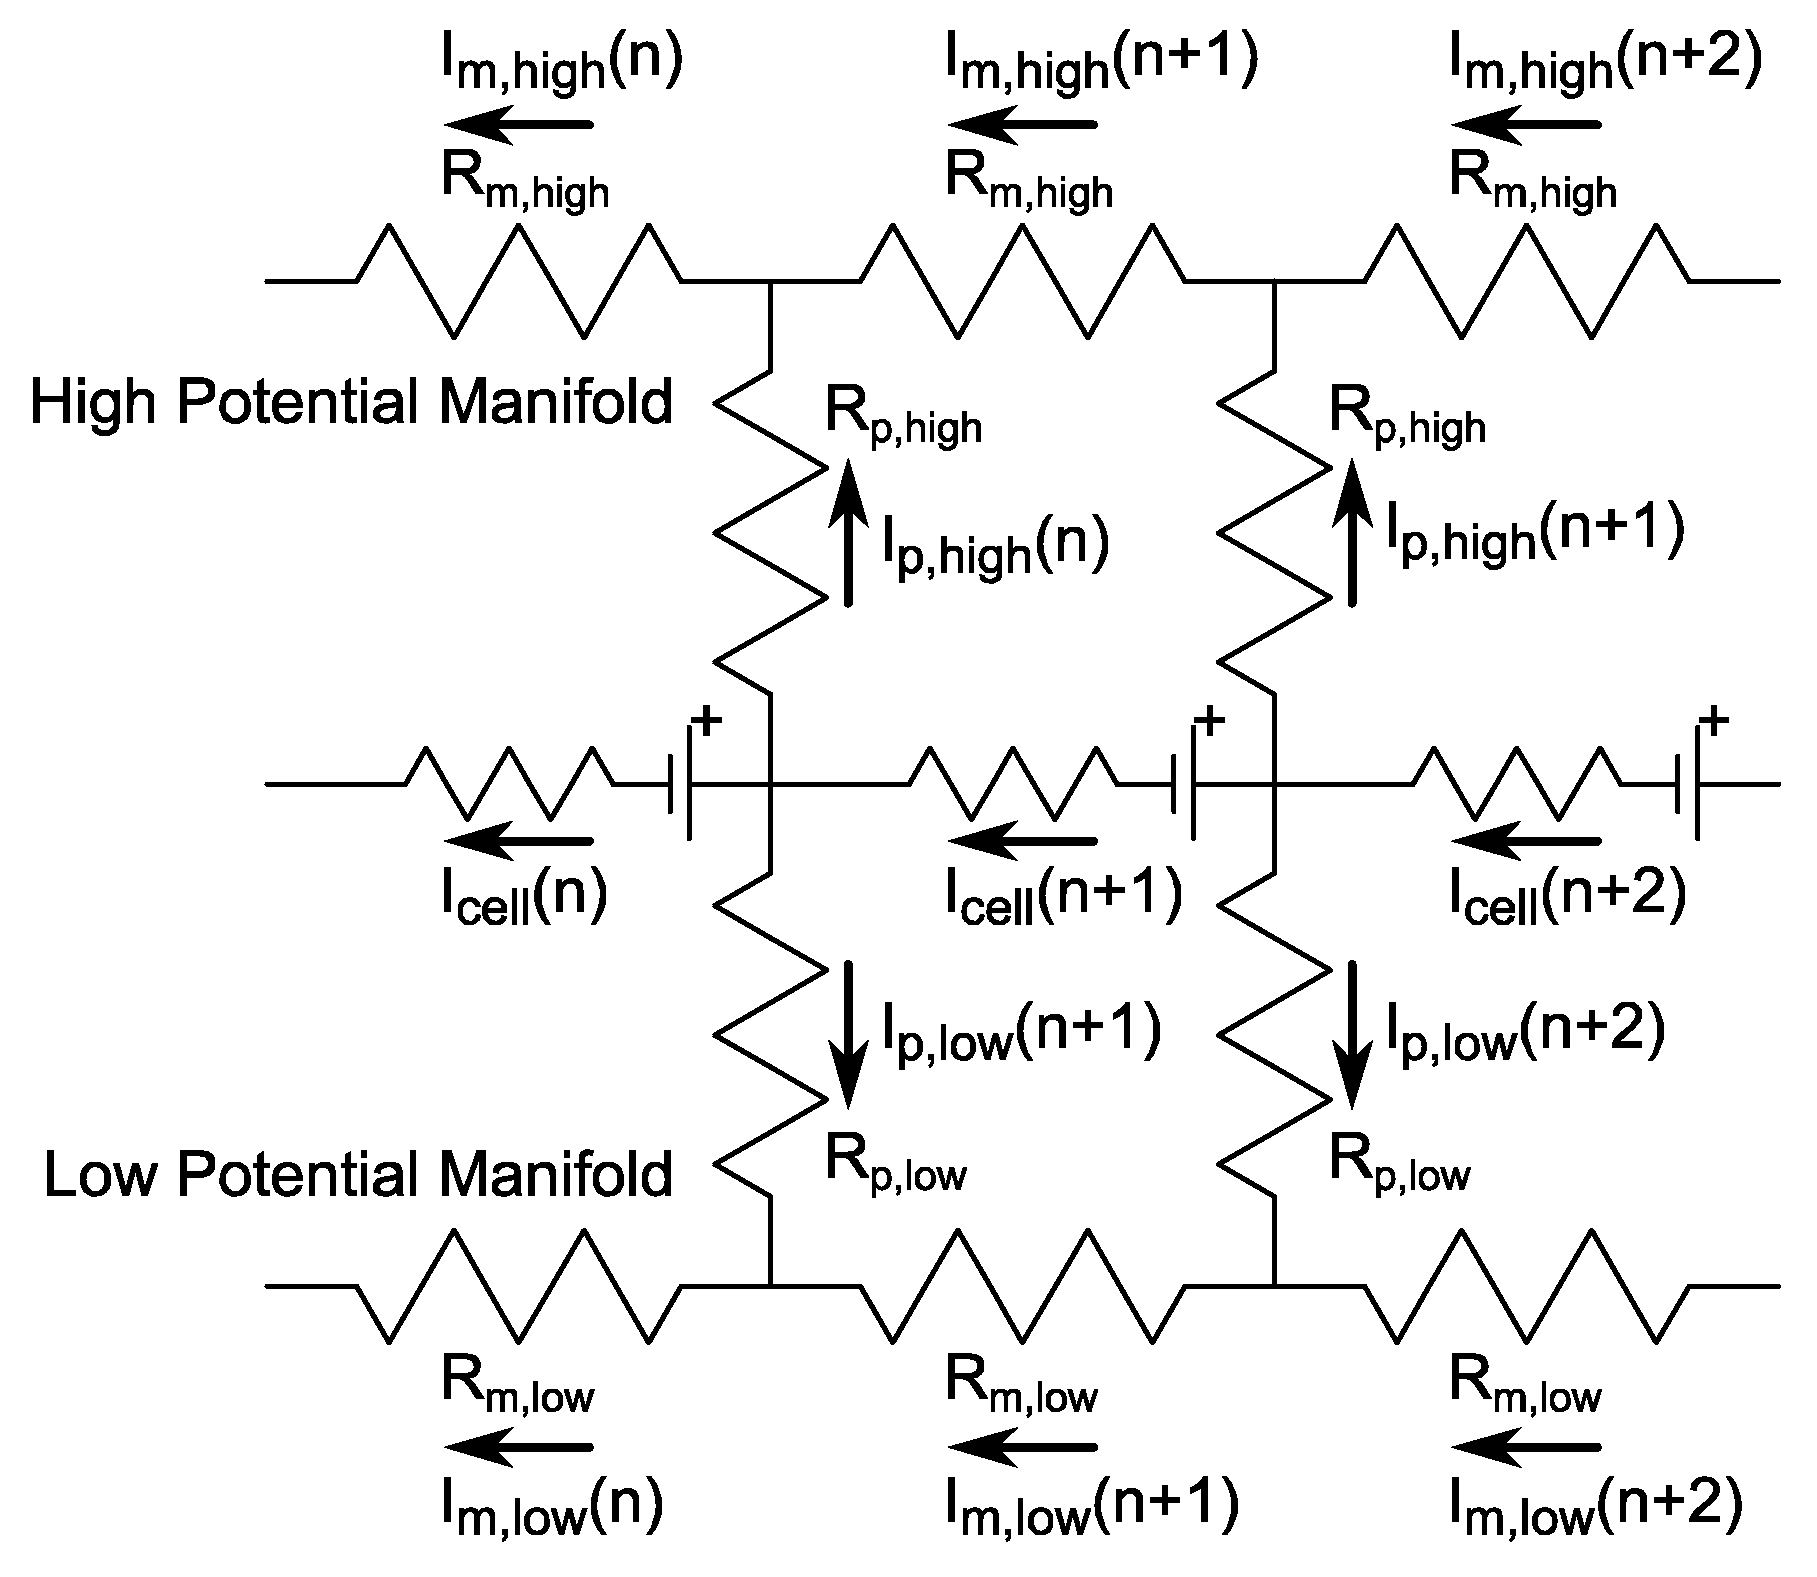
2.3. Shunt Resistance Network
2.4. Hydraulic Losses
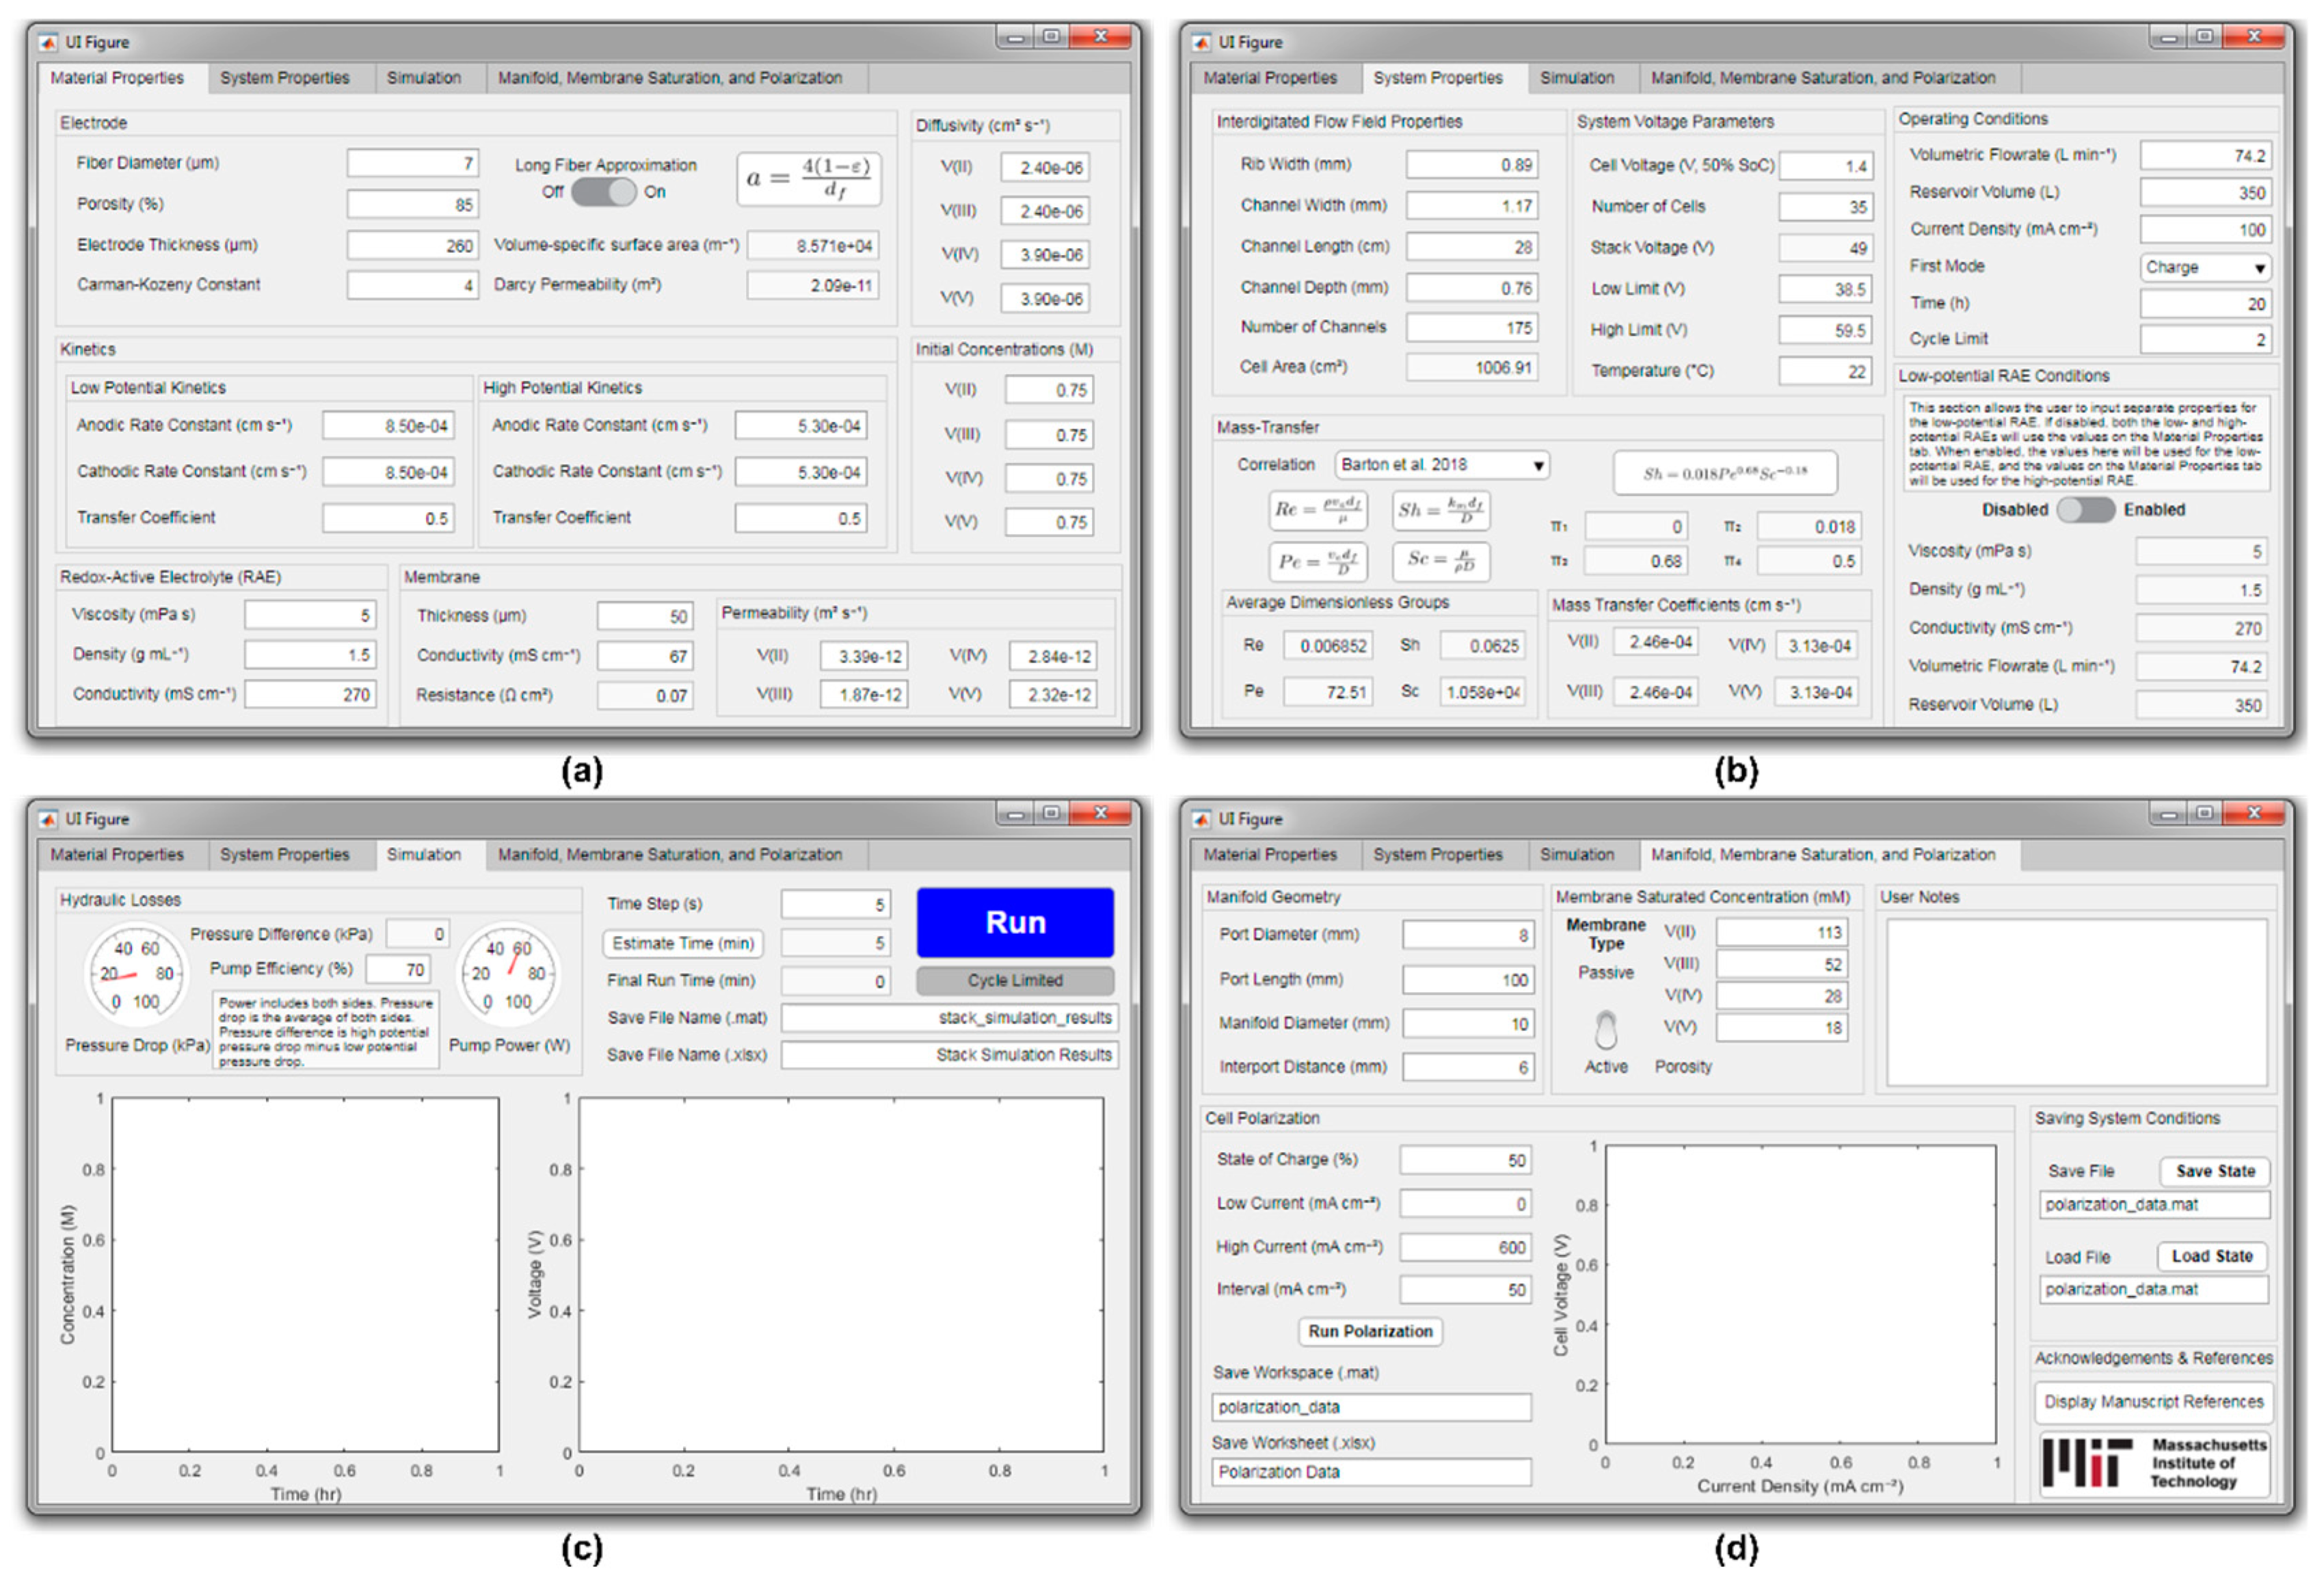
2.5. Model Framework
3. Results and Discussion
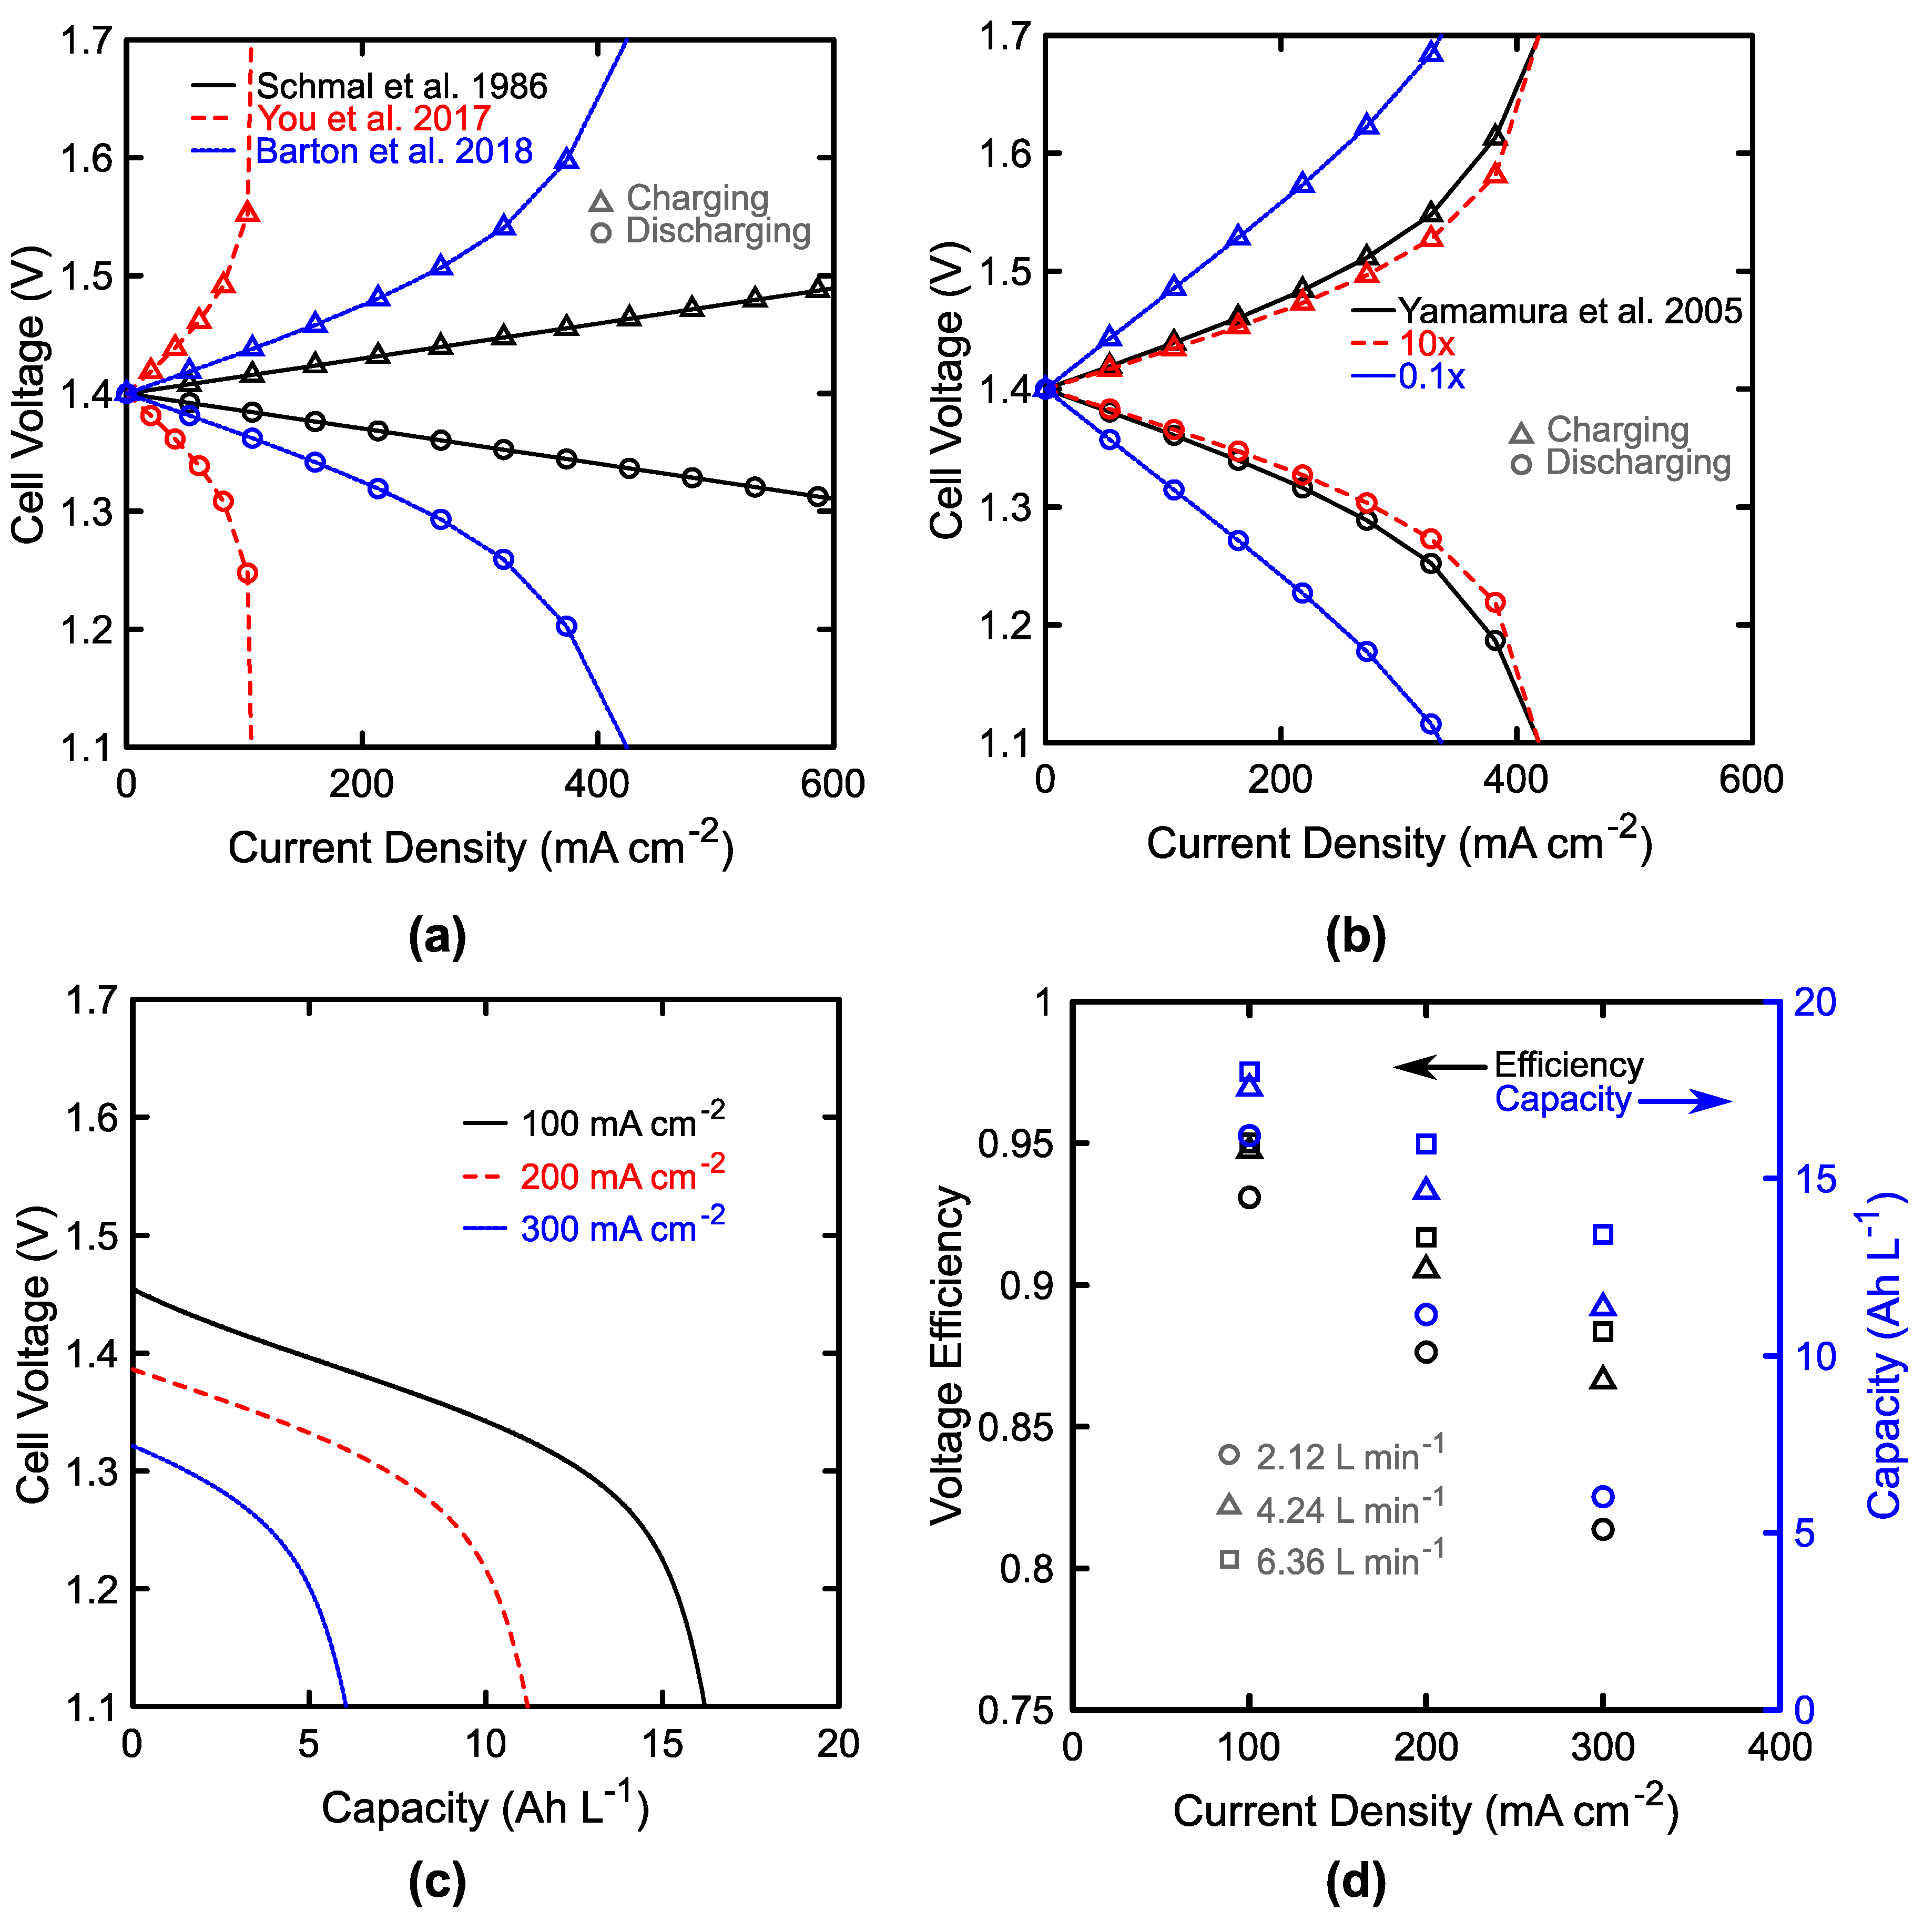
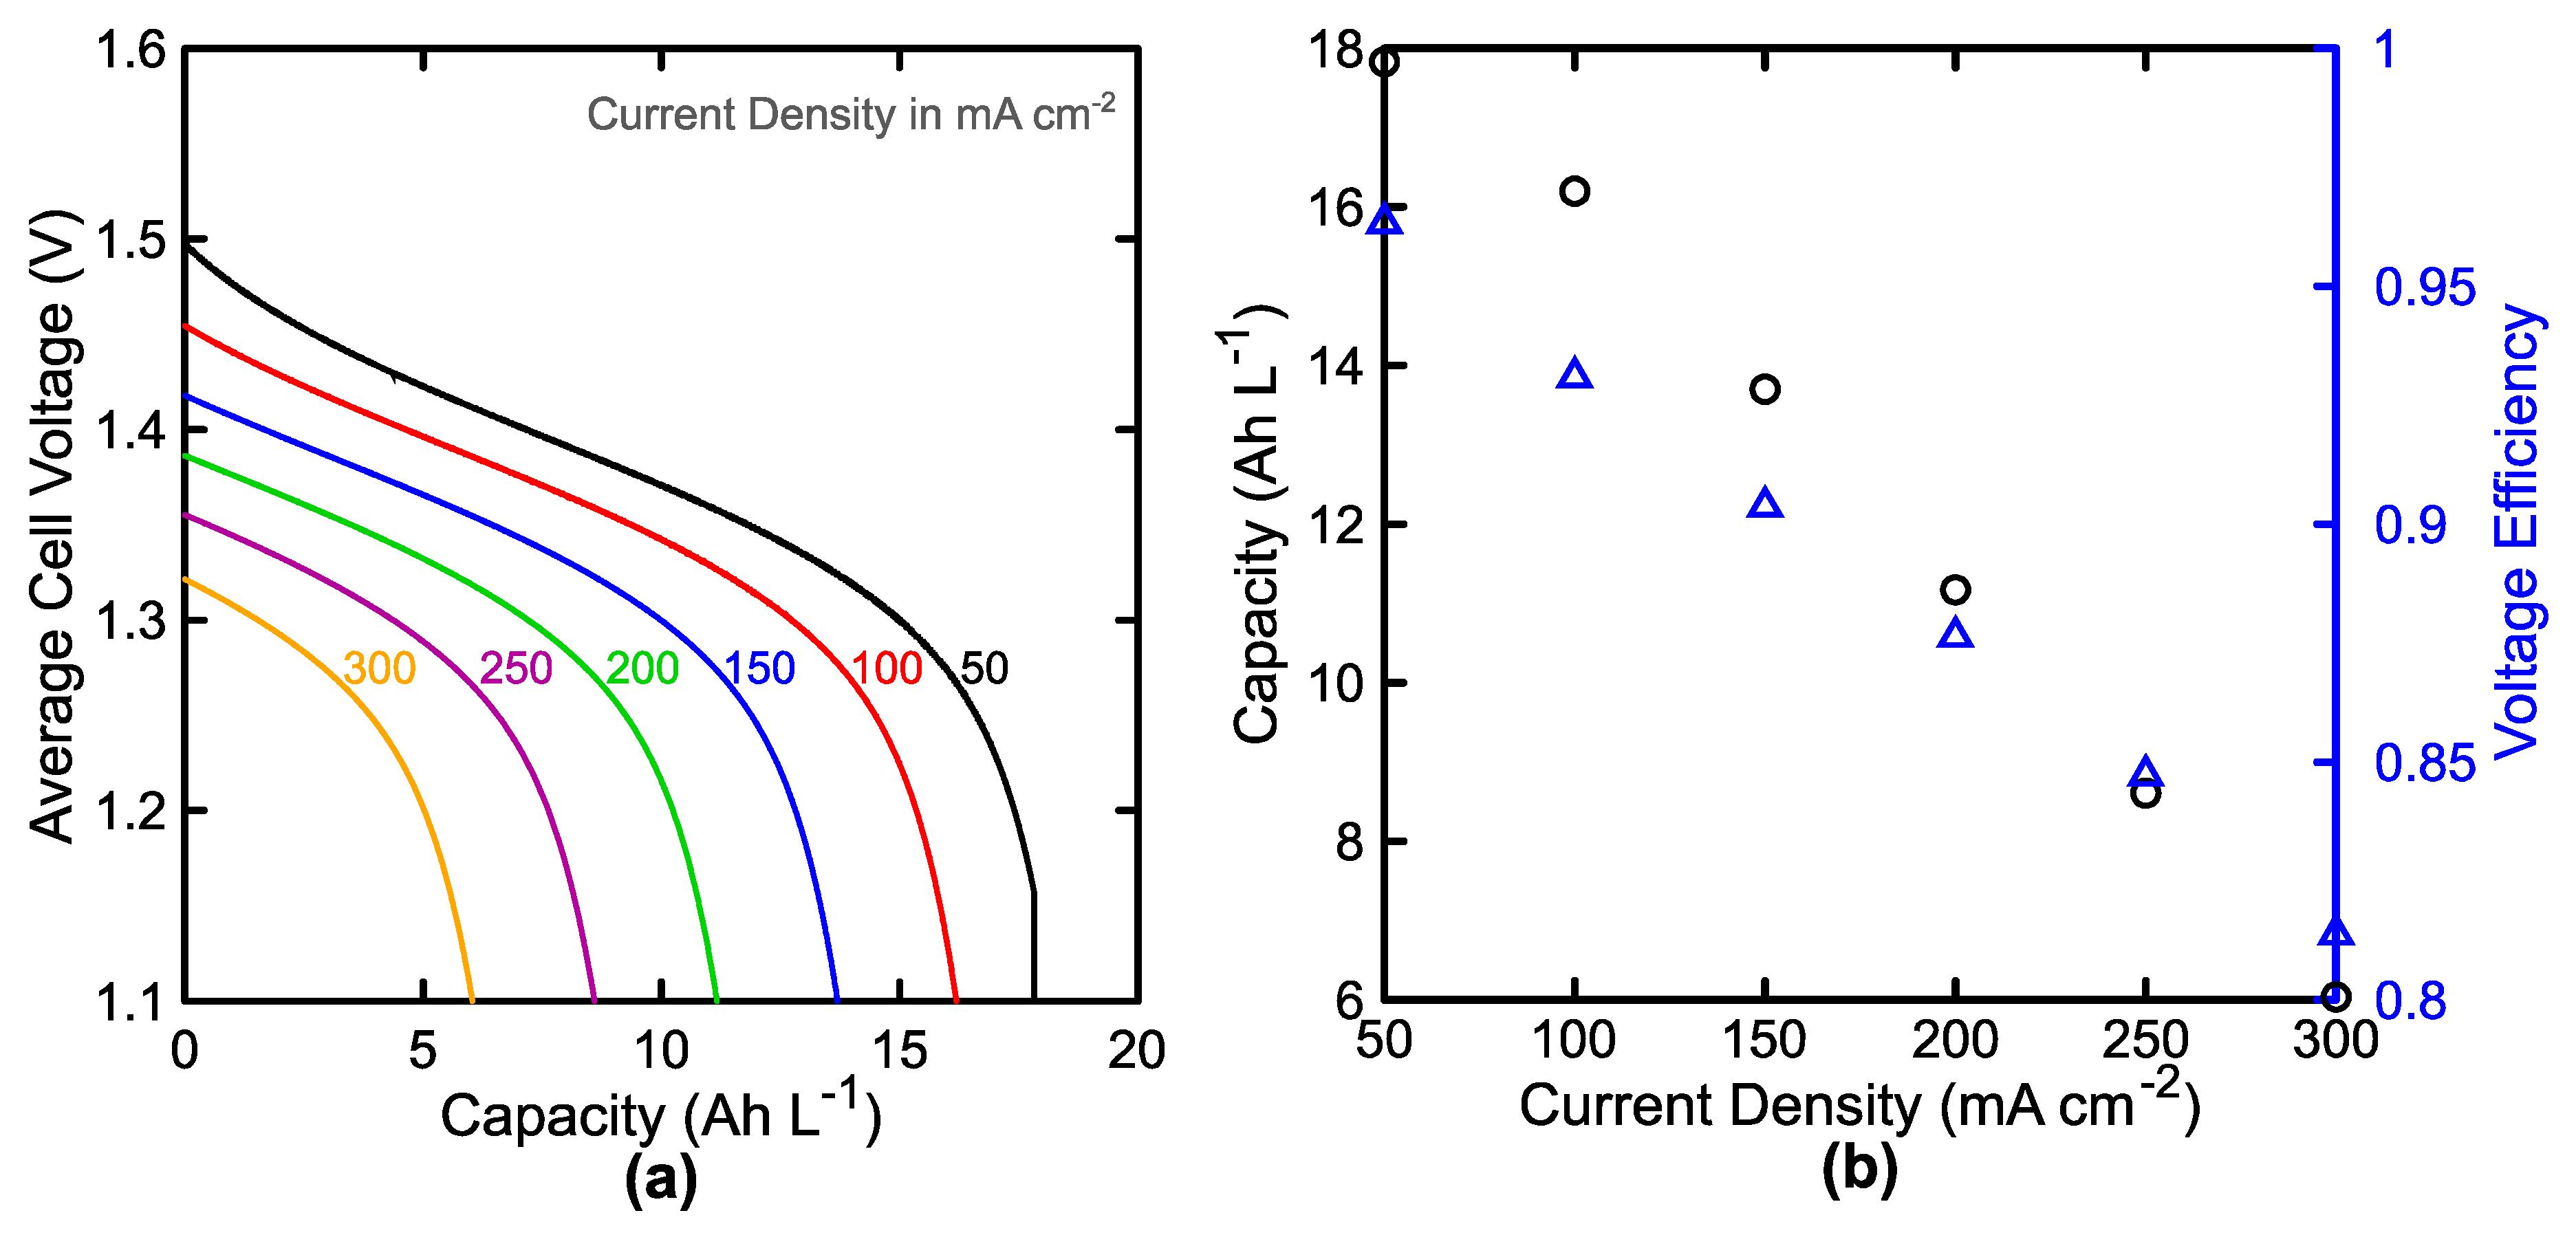
3.1. Single Cell Performance
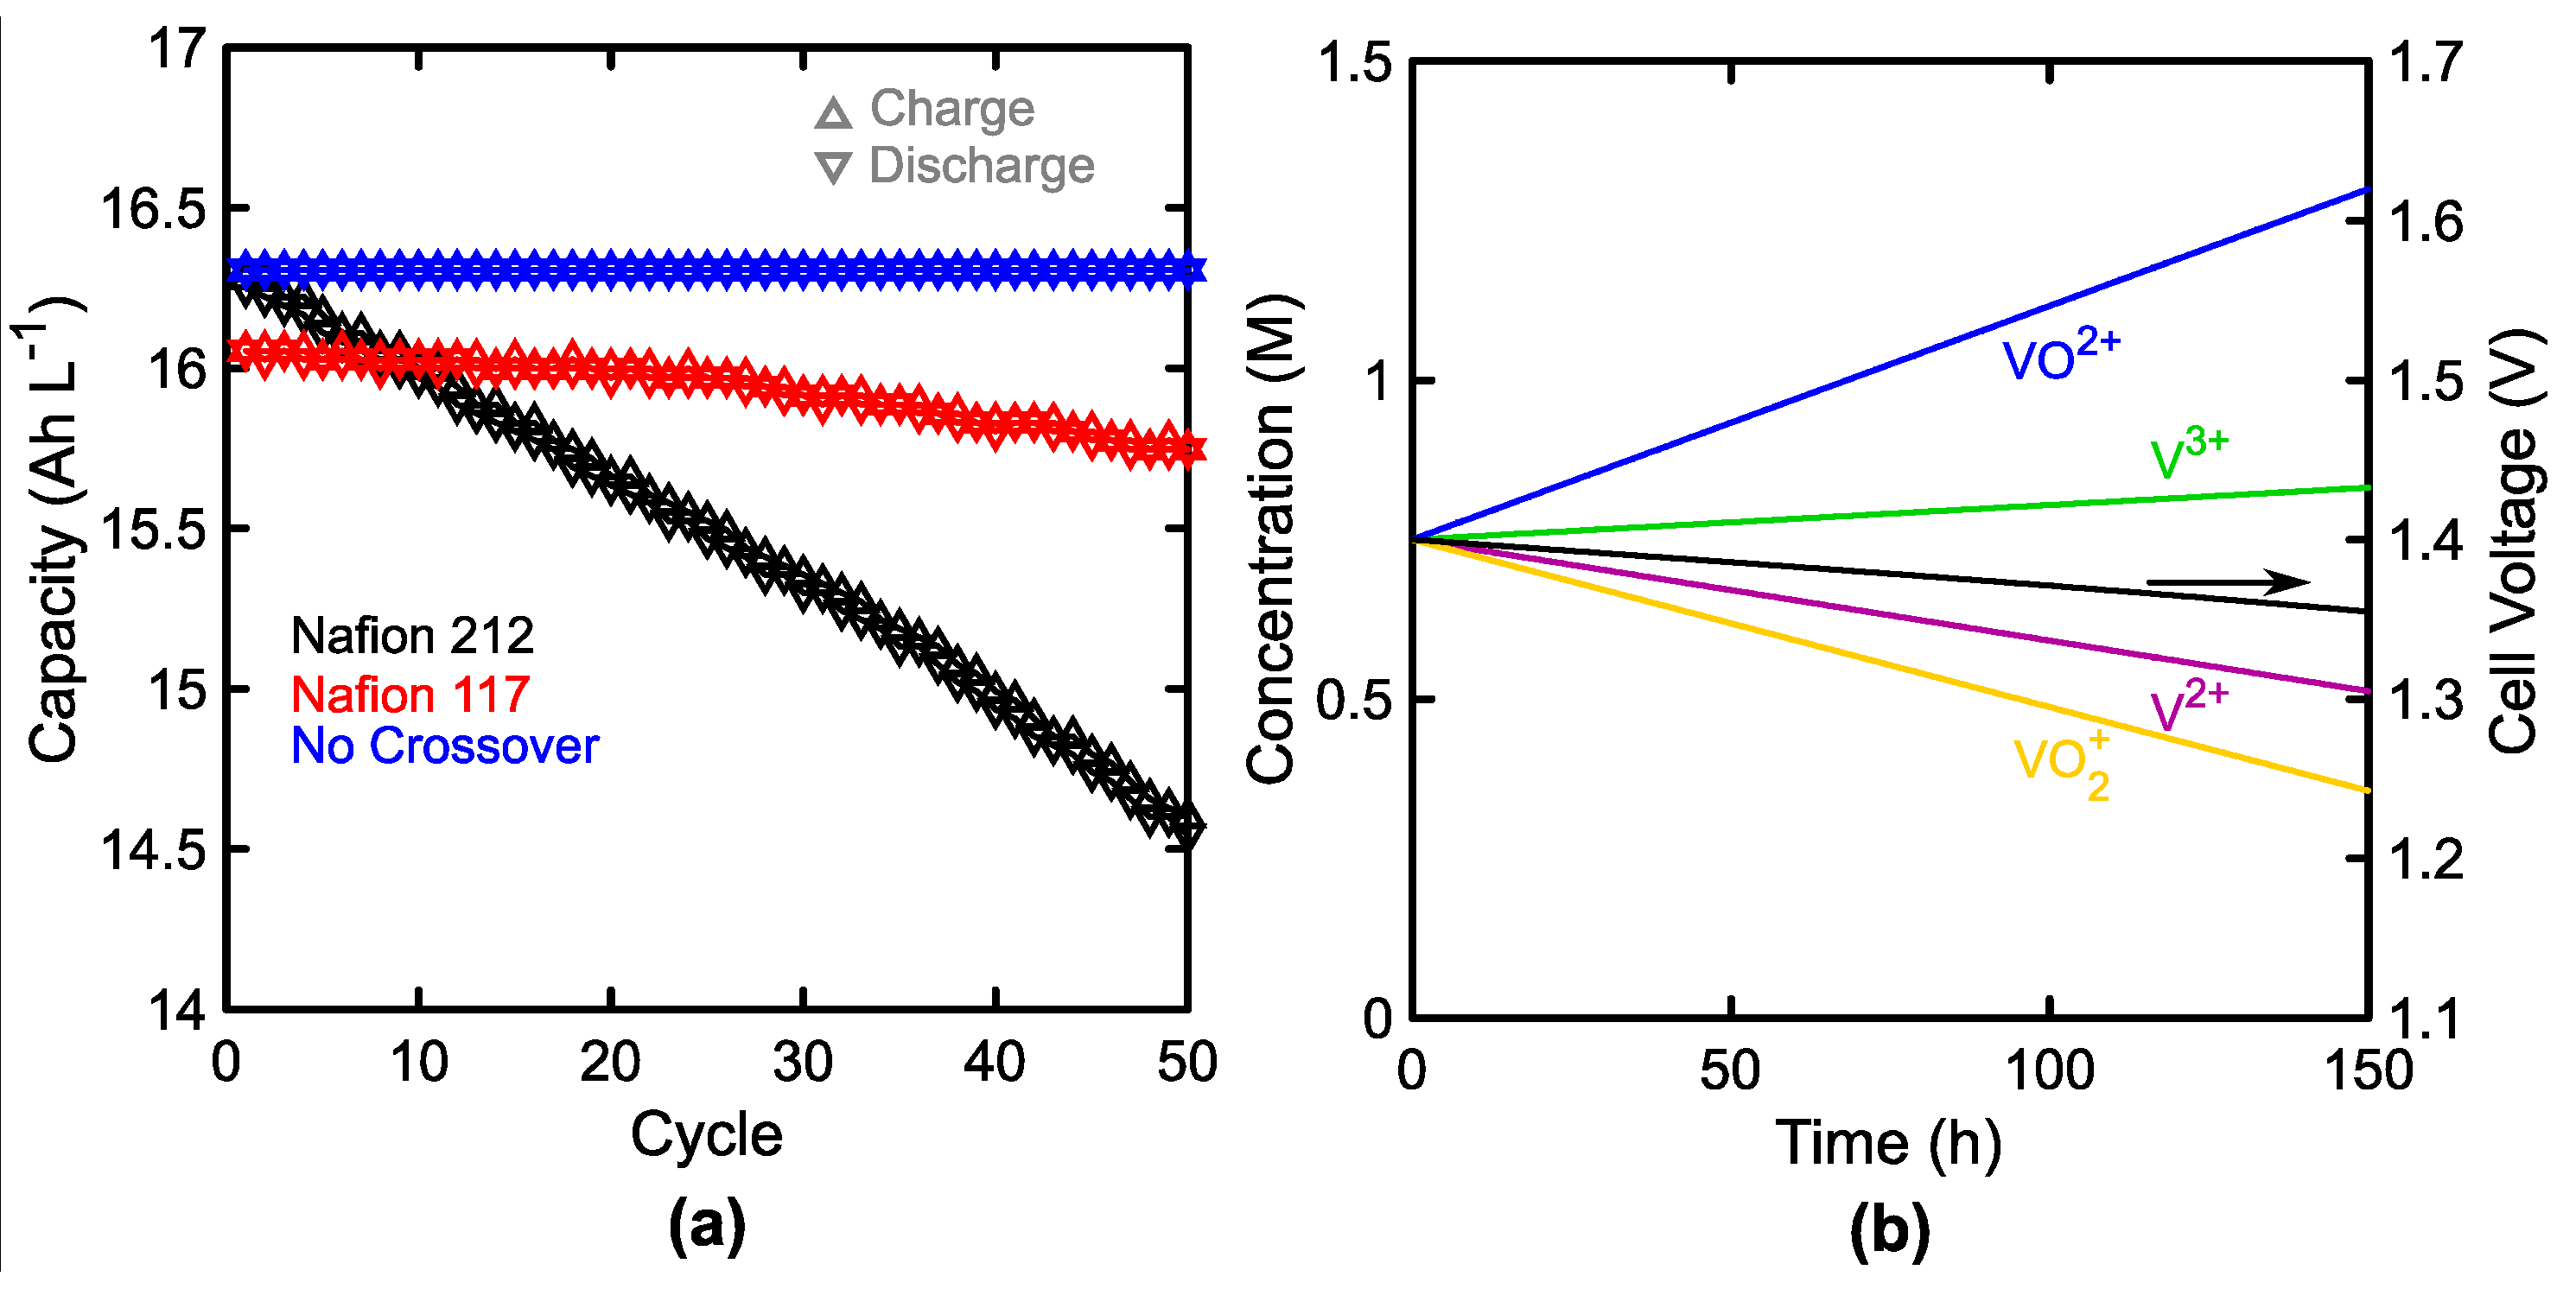
3.2. Membrane Crossover
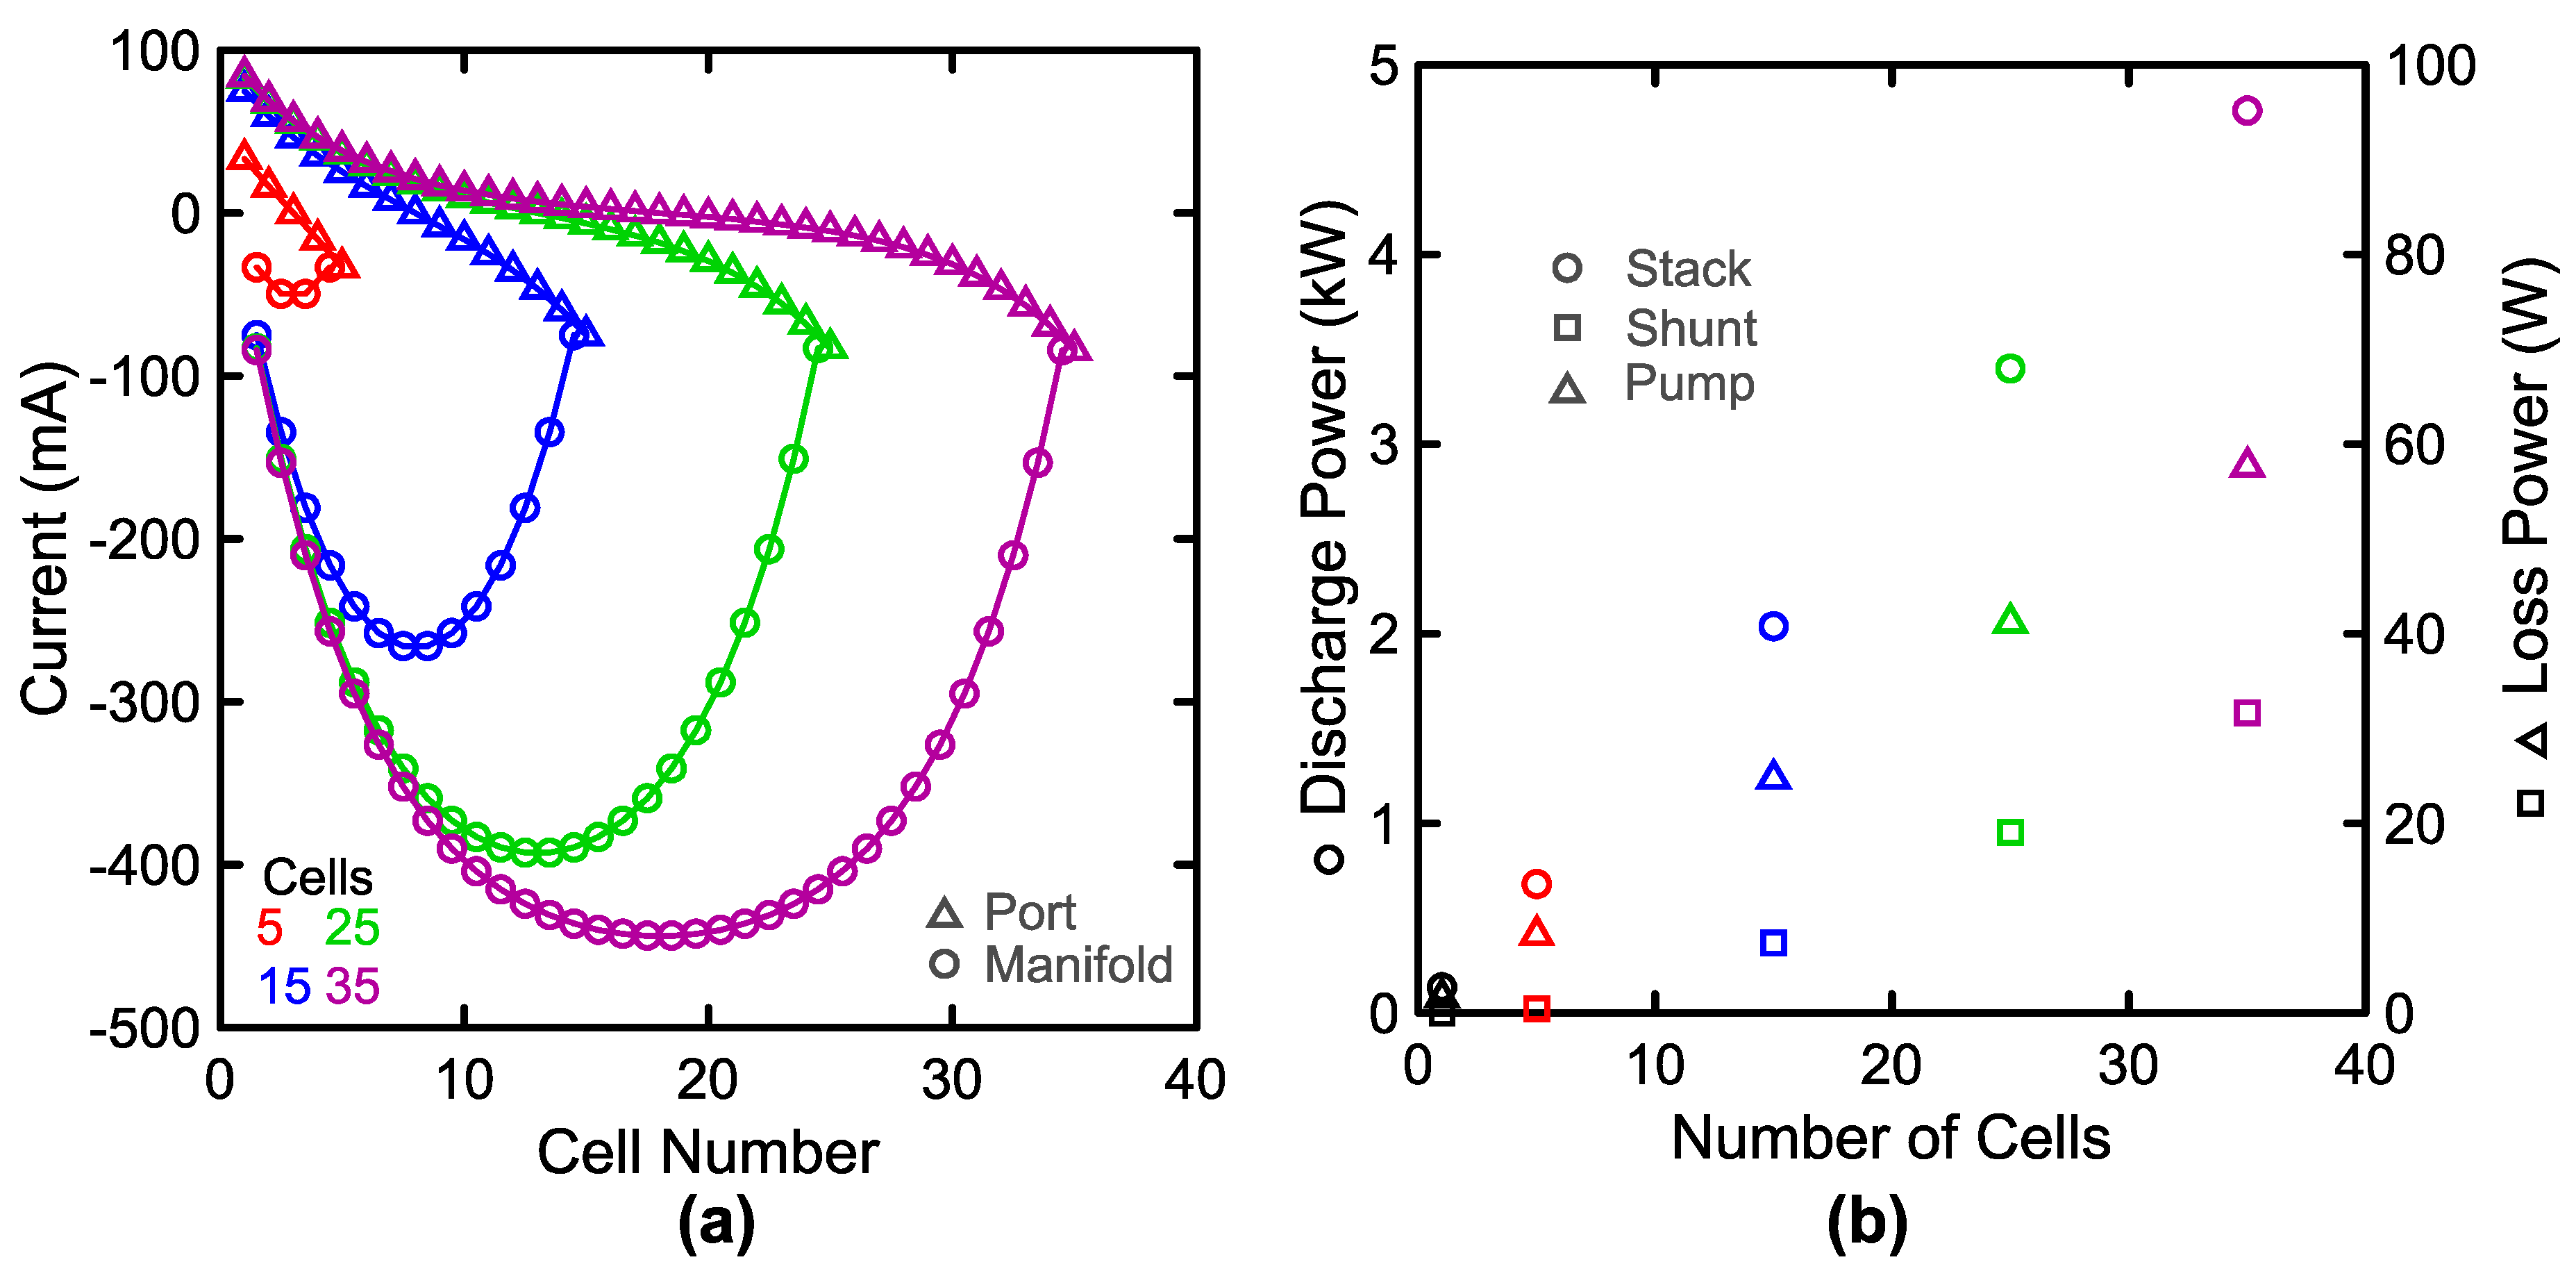
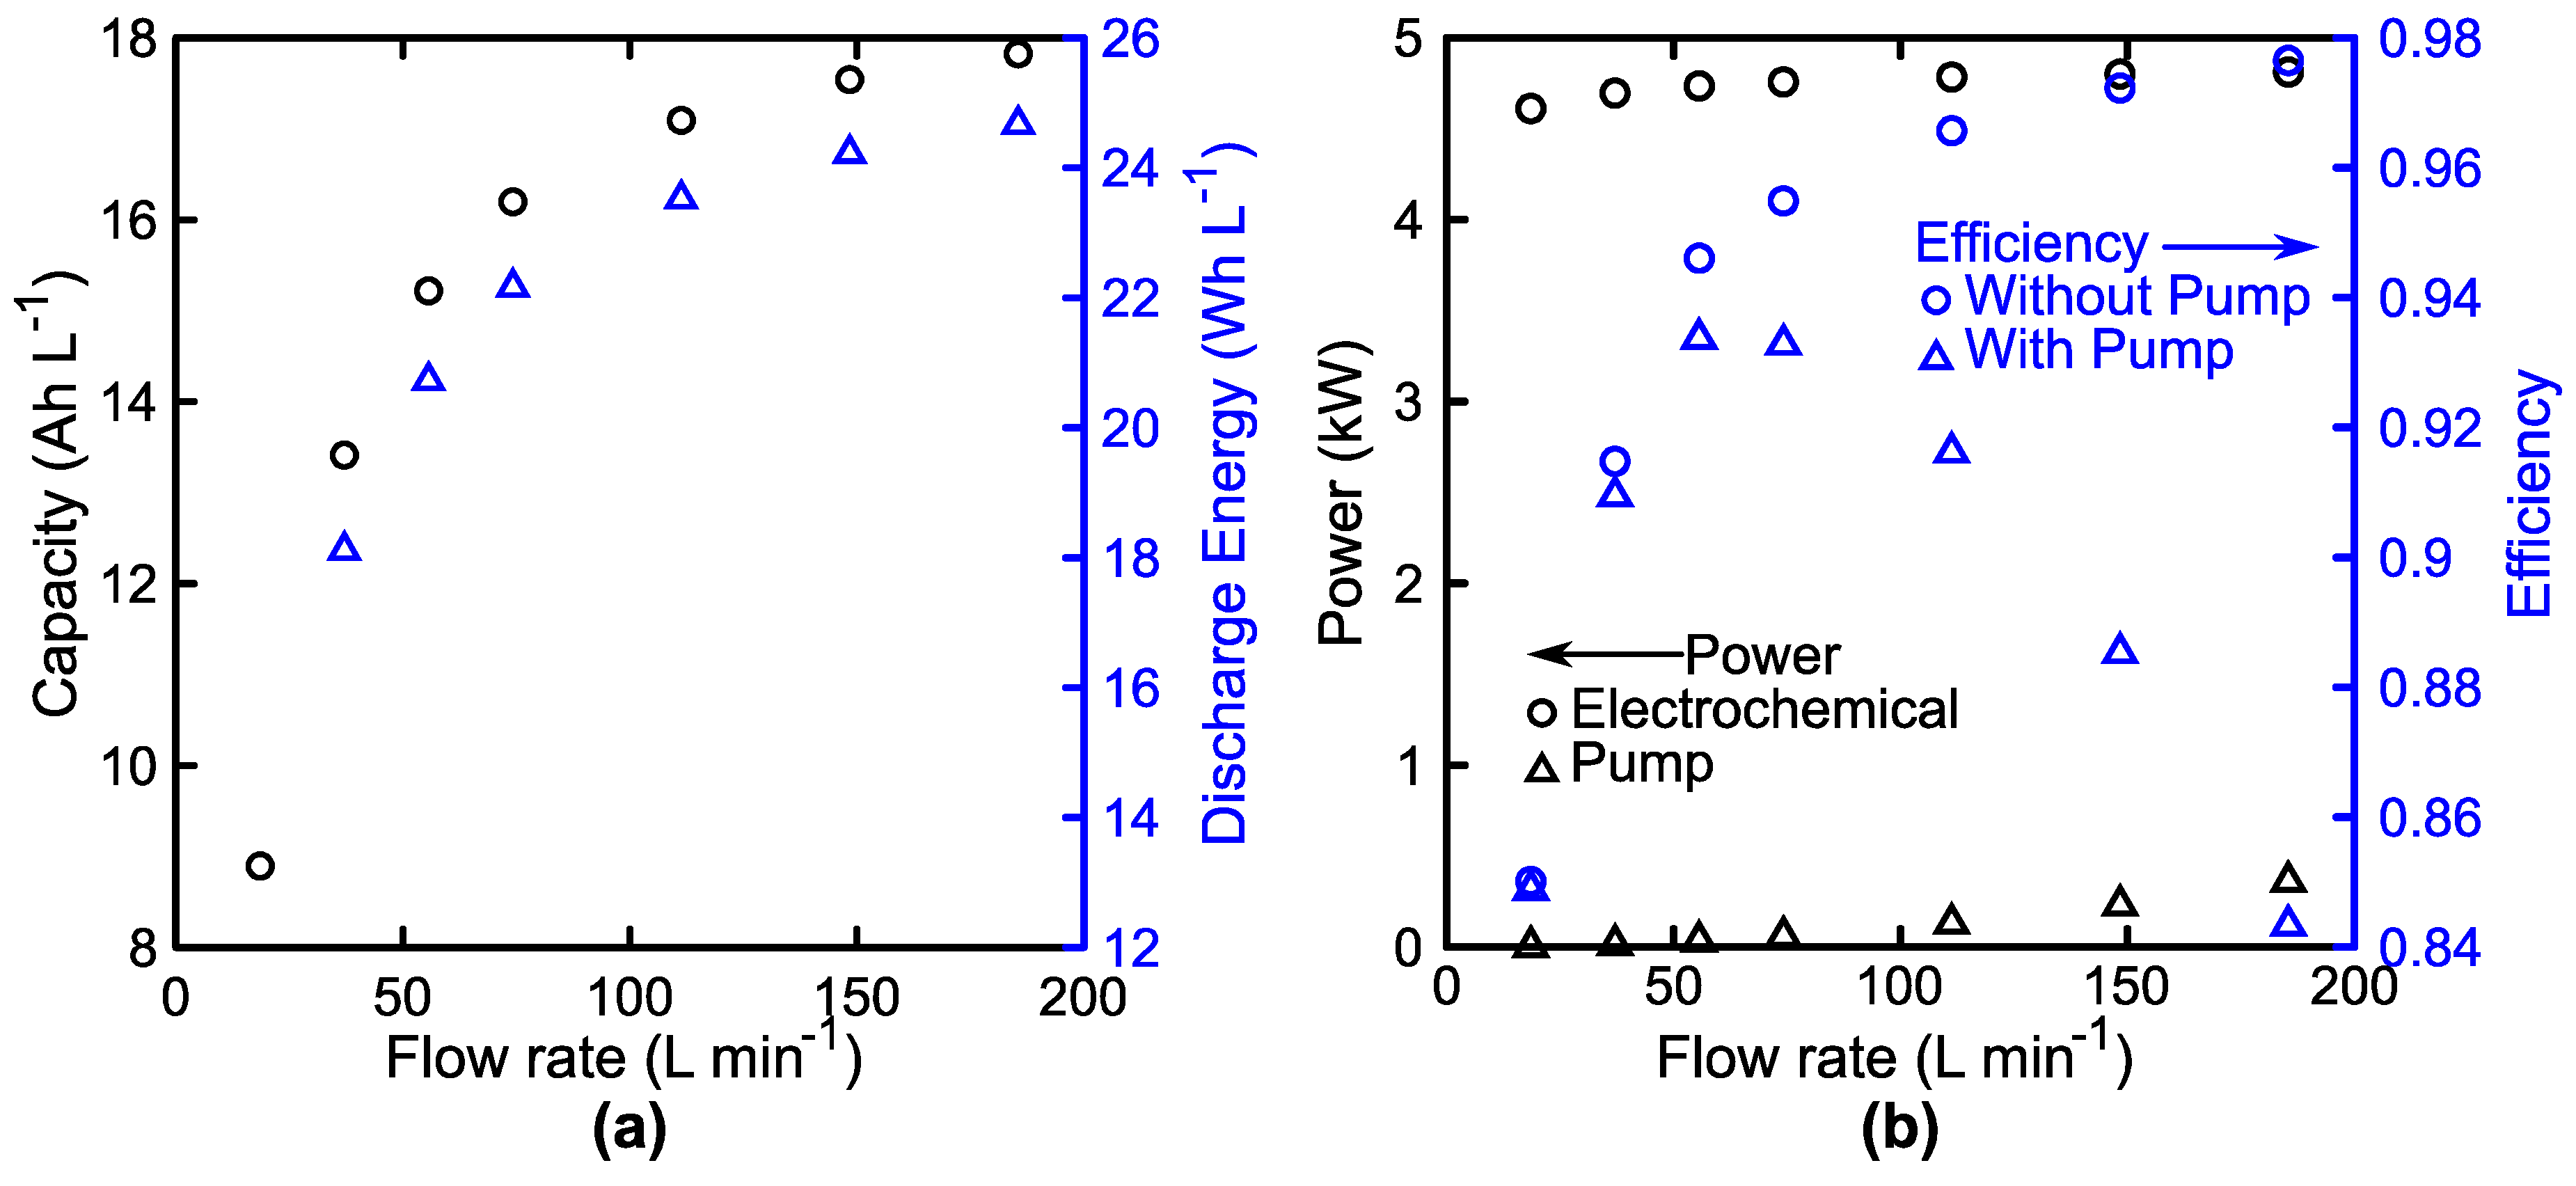
3.3. System Performance
4. Conclusions
Supplementary Materials
Author Contributions
Funding
Acknowledgments
Conflicts of Interest
Appendix A

| Symbol | Description | Dimensions 1 | Default Value 2 |
|---|---|---|---|
| Le | electrode thickness | L | 260 μm |
| kc | cathodic rate constant | L t−1 | 8.5 × 10⁻⁴ cm s−1 [88] |
| ka | anodic rate constant | L t−1 | 5.3 × 10⁻⁴ cm s−1 [88] |
| bulk concentration of species i | N L−3 | 0.75 mol L−1 | |
| df | fiber diameter | L | 7 μm [94] |
| km,i | mass-transfer coefficient of species i | L t−1 | m s−1 |
| nq | number of electrons transferred | 1 | |
| n | cell index | - | |
| N | total number of cells | 35 | |
| NX,i | crossover flux of species i | N L−2 t−1 | mol m−2 s−1 |
| x | position within the porous electrode | L | m |
| i | current density | I L−2 | 100 mA cm−2 |
| I | current | I | A |
| ae | volume-specific electrode surface area 3 | L−1 | 85700 m−1 |
| Ri | resistance of element i | M L2 I−2 t−3 | Ω |
| Re | Reynolds number | - | |
| Sh | Sherwood number | - | |
| Ki | membrane permeability of species i | L2 t−1 | m2 s−1 |
| i = V2+ | 3.39 × 10⁻¹² m2 s−1 [41] | ||
| i = V3+ | 1.87 × 10⁻¹² m2 s−1 [41] | ||
| i = VO2+ | 2.84 × 10⁻¹² m2 s−1 [41] | ||
| i = VO2+ | 2.32 × 10⁻¹² m2 s−1 [41] | ||
| ci,sat | membrane solubility of species i | N L−3 | mol m−3 |
| i = V2+ | 113 mM [83] | ||
| i = V3+ | 52 mM [83] | ||
| i = VO2+ | 28 mM [83] | ||
| i = VO2+ | 18 mM [83] | ||
| εmem | membrane porosity | 0.39 [108] | |
| Lmem | membrane thickness | L | 50 μm |
| KCK | Carman-Kozeny constant | 4 [95] | |
| wrib | flow field rib width | L | 0.89 mm [58] |
| wch | flow field channel width | L | 1.17 mm [58] |
| Lch | flow field channel length | L | 28 cm |
| dch | flow field channel depth | L | 0.76 mm [58] |
| nch | number of flow field channels | 175 | |
| dp | port geometric diameter | L | 8 mm [82] |
| dm | manifold geometric diameter | L | 10 mm [82] |
| Lp | port length | L | 100 mm [82] |
| Lm | manifold interport distance | L | 6 mm [82] |
| Vres | reservoir volume | L3 | 350 L |
| VOC | open-circuit voltage | M L2 I−1 t−3 | 1.4 V [109] |
| Elow | lower voltage limit for cycling | M L2 I−1 t−3 | 5.5 |
| Ehigh | upper voltage limit for cycling | M L2 I−1 t−3 | 8.5 |
| T | temperature | T | 22 °C |
| Sc | Schmidt number | - | |
| Pe | Péclet number | - | |
| Di | diffusivity of species i | L2 t−1 | m2 s−1 |
| i = II; species is V2+ | 2.4 × 10⁻⁶ cm2 s−1 [88] | ||
| i = III; species is V3+ | 2.4 × 10⁻⁶ cm2 s−1 [88] | ||
| i = IV; species is VO2+ | 3.9 × 10⁻⁶ cm2 s−1 [88] | ||
| i = V; species is VO2+ | 3.9 × 10⁻⁶ cm2 s−1 [88] | ||
| ve | electrolyte average velocity | L t−1 | m s−1 |
| Q | volumetric flow rate of RAE 4 | L3 t−1 | 74.2 L min−1 |
| Subscripts | |||
| ox | oxized redox-active species | ||
| red | reduced redox-active species | ||
| 1 | solid (electrode) phase | ||
| 2 | liquid (electrolyte) phase | ||
| high | high-potential side | ||
| low | low-potential side | ||
| Greek | |||
| α | transfer coefficient | 0.5 | |
| ν | kinematic viscosity | L2 t−1 | m2 s−1 |
| πi | mass transfer correlation parameter | - | |
| κ | RAE conductivity | I2 t3 M−1 L−3 | 270 mS cm−1 [8] |
| κeff | effective RAE conductivity 5 | I2 t3 M−1 L−3 | S m−1 |
| κmem | membrane conductivity | I2 t3 M−1 L−3 | 67 mS cm−1 [110] |
| μ | dynamic viscosity | M t2 L−1 | 5 mPa s [8] |
| ηpump | pump efficiency | 70% | |
| Δt | time step for cycling | t | 20 s |
| ε | electrode porosity | 85% [73] | |
| Δϕm | overpotential at the membrane | M L2 I−1 t−3 | V |
| ΔP | pressure drop | M t−2 L−1 | Pa |
| ρ | RAE density | M L−3 | 1.5 g mL−1 [8] |
| σ | electrode conductivity | I2 t3 M−1 L−3 | S m−1 |
| ϕi | potential in phase i | M L2 I−1 t−3 | V |

References
- Weber, A.Z.; Mench, M.M.; Meyers, J.P.; Ross, P.N.; Gostick, J.T.; Liu, Q. Redox flow batteries: A review. J. Appl. Electrochem. 2011, 41, 1137–1164. [Google Scholar] [CrossRef]
- Alotto, P.; Guarnieri, M.; Moro, F. Redox flow batteries for the storage of renewable energy: A review. Renew. Sustain. Energy Rev. 2014, 29, 325–335. [Google Scholar] [CrossRef]
- Leung, P.; Shah, A.A.; Sanz, L.; Flox, C.; Morante, J.R.; Xu, Q.; Mohamed, M.R.; Ponce de León, C.; Walsh, F.C. Recent developments in organic redox flow batteries: A critical review. J. Power Sources 2017, 360, 243–283. [Google Scholar] [CrossRef]
- Darling, R.M.; Gallagher, K.G.; Kowalski, J.A.; Ha, S.; Brushett, F.R. Pathways to low-cost electrochemical energy storage: A comparison of aqueous and nonaqueous fl ow batteries. Energy Environ. Sci. 2014, 7, 3459–3477. [Google Scholar] [CrossRef]
- Leung, P.K.; Li, X.; Ponce de León, C.; Berlouis, L.; Low, C.T.J.; Walsh, F.C. Progress in redox flow batteries, remaining challenges and their applications in energy storage. RSC Adv. 2012, 2, 10125–10156. [Google Scholar] [CrossRef]
- Dmello, R.; Milshtein, J.D.; Brushett, F.R.; Smith, K.C. Cost-driven materials selection criteria for redox flow battery electrolytes. J. Power Sources 2016, 330, 261–272. [Google Scholar] [CrossRef]
- Rychcik, M.; Skyllas-Kazacos, M. Characteristics of a new all-vanadium redox flow battery. J. Power Sources 1988, 22, 59–67. [Google Scholar] [CrossRef]
- Skyllas-Kazacos, M.; Cao, L.; Kazacos, M.; Kausar, N.; Mousa, A. Vanadium Electrolyte Studies for the Vanadium Redox Battery—A Review. ChemSusChem 2016, 9, 1521–1543. [Google Scholar] [CrossRef] [PubMed]
- Turton, R.; Bailie, R.C.; Whiting, W.B.; Shaeiwitz, J.A.; Baille, R.C.; Whiting, W.B.; Shaeiwitz, J.A. Analysis, Synthesis, and Design of Chemical Processes, 3rd ed.; Prentice Hall: Upper Saddle River, NJ, USA, 2009; ISBN 978-0-13-512966-1. [Google Scholar]
- Rudolph, S.; Schröder, U.; Bayanov, I.M. On-line controlled state of charge rebalancing in vanadium redox flow battery. J. Electroanal. Chem. 2013, 703, 29–37. [Google Scholar] [CrossRef]
- Gong, K.; Fang, Q.; Gu, S.; Li, S.F.Y.; Yan, Y. Nonaqueous redox-flow batteries: organic solvents, supporting electrolytes, and redox pairs. Energy Environ. Sci. 2015, 8, 3515–3530. [Google Scholar] [CrossRef]
- Chen, H.; Cong, G.; Lu, Y.-C. Recent progress in organic redox flow batteries: Active materials, electrolytes and membranes. J. Energy Chem. 2018, 1–22. [Google Scholar] [CrossRef]
- Dieterich, V.; Milshtein, J.D.; Barton, J.L.; Carney, T.J.; Darling, R.M. Estimating the cost of organic battery active materials: A case study on anthraquinone disulfonic acid Estimating the cost of organic battery active materials: A case study on anthraquinone disulfonic acid. Transl. Mater. Res. 2018, 5, 3. [Google Scholar] [CrossRef]
- Singh, N.; McFarland, E.W. Levelized cost of energy and sensitivity analysis for the hydrogen-bromine flow battery. J. Power Sources 2015, 288, 187–198. [Google Scholar] [CrossRef]
- Knehr, K.W.; Biswas, S.; Steingart, D.A. Quantification of the Voltage Losses in the Minimal Architecture Zinc-Bromine Battery Using GITT and EIS. J. Electrochem. Soc. 2017, 164, A3101–A3108. [Google Scholar] [CrossRef]
- Braff, W.A.; Bazant, M.Z.; Buie, C.R. Membrane-less hydrogen bromine flow battery. Nat. Commun. 2013, 4, 1–6. [Google Scholar] [CrossRef] [PubMed]
- Li, Z.; Pan, M.S.; Su, L.; Tsai, P.; Badel, A.F.; Valle, J.M.; Eiler, S.L.; Xiang, K.; Brushett, F.R.; Chiang, Y. Air-Breathing Aqueous Sulfur Flow Battery for Ultralow-Cost Long-Duration Electrical Storage. Joule 2017, 1, 306–327. [Google Scholar] [CrossRef]
- Cleaver, T.; Kovacik, P.; Marinescu, M.; Zhang, T.; Offer, G. Perspective—Commercializing Lithium Sulfur Batteries: Are We Doing the Right Research? J. Electrochem. Soc. 2018, 165, A6029–A6033. [Google Scholar] [CrossRef]
- Su, L.; Badel, A.F.; Cao, C.; Hinricher, J.J.; Brushett, F.R. Toward an Inexpensive Aqueous Polysulfide-Polyiodide Redox Flow Battery. Ind. Eng. Chem. Res. 2017, 56, 9783–9792. [Google Scholar] [CrossRef]
- Manohar, A.K.; Kim, K.M.; Plichta, E.; Hendrickson, M.; Rawlings, S.; Narayanan, S.R. A High Efficiency Iron-Chloride Redox Flow Battery for Large-Scale Energy Storage. J. Electrochem. Soc. 2016, 163, A5118–A5125. [Google Scholar] [CrossRef]
- Hawthorne, K.L.; Petek, T.J.; Miller, M.A.; Wainright, J.S.; Savinell, R.F. An Investigation into Factors Affecting the Iron Plating Reaction for an All-Iron Flow Battery. J. Electrochem. Soc. 2014, 162, A108–A113. [Google Scholar] [CrossRef]
- Gong, K.; Ma, X.; Conforti, K.M.; Kuttler, K.J.; Grunewald, J.B.; Yeager, K.L.; Bazant, M.Z.; Gu, S.; Yan, Y. A zinc-iron redox-flow battery under $100 per kW h of system capital cost. Energy Environ. Sci. 2015, 8, 2941–2945. [Google Scholar] [CrossRef]
- Li, B.; Li, L.; Wang, W.; Nie, Z.; Chen, B.; Wei, X.; Luo, Q.; Yang, Z.; Sprenkle, V. Fe/V redox flow battery electrolyte investigation and optimization. J. Power Sources 2013, 229, 1–5. [Google Scholar] [CrossRef]
- Viswanathan, V.; Crawford, A.; Stephenson, D.; Kim, S.; Wang, W.; Li, B.; Coffey, G.; Thomsen, E.; Graff, G.; Balducci, P.; Kintner-meyer, M.; Sprenkle, V. Cost and performance model for redox flow batteries. J. Power Sources 2014, 247, 1040–1051. [Google Scholar] [CrossRef]
- Ma, R.X.; Setzler, B.P.; Gong, K.; Gu, S.; Yan, Y. A General, Analytical Model for Flow Battery Costing and Design. J. Electrochem. Soc. 2018, 165, A2209–A2216. [Google Scholar] [CrossRef]
- Choi, C.; Kim, S.; Kim, R.; Choi, Y.; Kim, S.; Jung, H.Y.; Yang, J.H.; Kim, H.T. A review of vanadium electrolytes for vanadium redox flow batteries. Renew. Sustain. Energy Rev. 2017, 69, 263–274. [Google Scholar] [CrossRef]
- Parasuraman, A.; Lim, T.M.; Menictas, C.; Skyllas-Kazacos, M. Review of material research and development for vanadium redox flow battery applications. Electrochim. Acta 2013, 101, 27–40. [Google Scholar] [CrossRef]
- Kim, K.J.; Park, M.-S.; Kim, Y.-J.; Kim, J.H.; Dou, S.X.; Skyllas-Kazacos, M. A technology review of electrodes and reaction mechanisms in vanadium redox flow batteries. J. Mater. Chem. A 2015, 3, 16913–16933. [Google Scholar] [CrossRef]
- Arenas, L.F.; Ponce de León, C.; Walsh, F.C. Engineering aspects of the design, construction and performance of modular redox flow batteries for energy storage. J. Energy Storage 2017, 11, 119–153. [Google Scholar] [CrossRef]
- Reed, D.; Thomsen, E.; Li, B.; Wang, W.; Nie, Z.; Koeppel, B.; Kizewski, J.; Sprenkle, V. Stack Developments in a kW Class All Vanadium Mixed Acid Redox Flow Battery at the Pacific Northwest National Laboratory. J. Electrochem. Soc. 2016, 163, A5211–A5219. [Google Scholar] [CrossRef]
- Kim, S.; Thomsen, E.; Xia, G.; Nie, Z.; Bao, J.; Recknagle, K.; Wang, W.; Viswanathan, V.; Luo, Q.; Wei, X.; Crawford, A.; Coffey, G.; Maupin, G.; Sprenkle, V. 1 kW/1 kWh advanced vanadium redox flow battery utilizing mixed acid electrolytes. J. Power Sources 2013, 237, 300–309. [Google Scholar] [CrossRef]
- Roe, S.; Menictas, C.; Skyllas-Kazacos, M. A High Energy Density Vanadium Redox Flow Battery with 3 M Vanadium Electrolyte. J. Electrochem. Soc. 2016, 163, A5023–A5028. [Google Scholar] [CrossRef]
- Xi, X.; Li, X.; Wang, C.; Lai, Q.; Cheng, Y.; Zhou, W.; Ding, C.; Zhang, H. Impact of proton concentration on equilibrium potential and polarization of vanadium flow batteries. Chempluschem 2015, 80, 382–389. [Google Scholar] [CrossRef]
- Lawton, J.S.; Tiano, S.M.; Donnelly, D.J.; Flanagan, S.P.; Arruda, T.M. The Effect of Sulfuric Acid Concentration on Physical and Electrochemical Properties of Vanadyl Solutions. Batteries 2018, 4, 40. [Google Scholar] [CrossRef]
- Sum, E.; Skyllas-Kazacos, M. A study of the V(II)/V(III) redox couple for redox flow cell applications. J. Power Sources 1985, 15, 179–190. [Google Scholar] [CrossRef]
- Mousa, A. Chemical and Electrochemical studies of V(III) and V(II) Solutions in Sulfuric Acid Solution for Vanadium Battery Applications. Ph.D. Thesis, University of New South Wales, Sydney, Australia, 2003. [Google Scholar]
- Mousa, A.; Skyllas-kazacos, M. Physical Properties of Negative Half-Cell Electrolytes in the Vanadium Redox Flow Battery. In Electrochemically Enabled Sustainability; CRC Press: Boca Raton, FL, USA, 2014; pp. 395–428. ISBN 9781466575431. [Google Scholar]
- Sun, C.-N.; Delnick, F.M.; Aaron, D.S.; Papandrew, A.B.; Mench, M.M.; Zawodzinski, T.A. Resolving Losses at the Negative Electrode in All-Vanadium Redox Flow Batteries Using Electrochemical Impedance Spectroscopy. J. Electrochem. Soc. 2014, 161, A981–A988. [Google Scholar] [CrossRef]
- Oriji, G.; Katayama, Y.; Miura, T. Investigation on V(IV)/V(V) species in a vanadium redox flow battery. Electrochim. Acta 2004, 49, 3091–3095. [Google Scholar] [CrossRef]
- Rahman, F.; Skyllas-Kazacos, M. Vanadium redox battery: Positive half-cell electrolyte studies. J. Power Sources 2009, 189, 1212–1219. [Google Scholar] [CrossRef]
- Ashraf Gandomi, Y.; Aaron, D.S.; Mench, M.M. Coupled Membrane Transport Parameters for Ionic Species in All-Vanadium Redox Flow Batteries. Electrochim. Acta 2016, 218, 174–190. [Google Scholar] [CrossRef]
- Yu, L.; Lin, F.; Xu, L.; Xi, J. Structure–property relationship study of Nafion XL membrane for high-rate, long-lifespan, and all-climate vanadium flow batteries. RSC Adv. 2017, 7, 31164–31172. [Google Scholar] [CrossRef]
- Schwenzer, B.; Zhang, J.; Kim, S.; Li, L.; Liu, J.; Yang, Z. Membrane development for vanadium redox flow batteries. ChemSusChem 2011, 4, 1388–1406. [Google Scholar] [CrossRef] [PubMed]
- Lawton, J.S.; Jones, A.M.; Tang, Z.; Zawodzinski, T.; National, R.; Tennessee, O.R.; Lindsey, M. Ion Effects on Vanadium Transport in Nafion Membranes for Vanadium Redox Flow Batteries. J. Electrochem. Soc. 2017, 164, A2987–A2991. [Google Scholar] [CrossRef]
- Won, S.; Oh, K.; Ju, H. Numerical analysis of vanadium crossover effects in all-vanadium redox flow batteries. Electrochim. Acta 2015, 177, 310–320. [Google Scholar] [CrossRef]
- Li, X.; Zhang, H.; Mai, Z.; Zhang, H.; Vankelecom, I. Ion exchange membranes for vanadium redox flow battery (VRB) applications. Energy Environ. Sci. 2011, 4, 1147. [Google Scholar] [CrossRef]
- Elgammal, R.A.; Tang, Z.; Sun, C.-N.; Lawton, J.; Zawodzinski, T.A. Species Uptake and Mass Transport in Membranes for Vanadium Redox Flow Batteries. Electrochim. Acta 2017, 237, 1–11. [Google Scholar] [CrossRef]
- Oh, K.; Won, S.; Ju, H. A comparative study of species migration and diffusion mechanisms in all-vanadium redox flow batteries. Electrochim. Acta 2015, 181, 238–247. [Google Scholar] [CrossRef]
- Sun, B.; Skyllas-Kazacos, M. Modification of graphite electrode materials for vanadium redox flow battery application—I. Thermal treatment. Electrochim. Acta 1992, 37, 1253–1260. [Google Scholar] [CrossRef]
- Pezeshki, A.M.; Sacci, R.L.; Delnick, F.M.; Aaron, D.S.; Mench, M.M. Elucidating effects of cell architecture, electrode material, and solution composition on overpotentials in redox flow batteries. Electrochim. Acta 2017, 229, 261–270. [Google Scholar] [CrossRef]
- Fink, H.; Friedl, J.; Stimming, U. Composition of the Electrode Determines Which Half-Cell’s Rate Constant is Higher in a Vanadium Flow Battery. J. Phys. Chem. C 2016, 120, 15893–15901. [Google Scholar] [CrossRef]
- He, Z.; Cheng, G.; Jiang, Y.; Wang, L.; Dai, L. Sulfonated Carbon Nanotubes as Superior Catalysts towards V3+/V2+ Redox Reaction for Vanadium Redox Flow Battery. J. Electrochem. Soc. 2018, 165, A932–A938. [Google Scholar] [CrossRef]
- Liu, S.; Kok, M.; Kim, Y.; Barton, J.L.; Brushett, F.R.; Gostick, J. Evaluation of Electrospun Fibrous Mats Targeted for Use as Flow Battery Electrodes. J. Electrochem. Soc. 2017, 164, A2038–A2048. [Google Scholar] [CrossRef]
- Zhong, S.; Skyllas-Kazacos, M. Electrochemical behaviour of vanadium(V)/vanadium(IV) redox couple at graphite electrodes. J. Power Sources 1992, 39, 1–9. [Google Scholar] [CrossRef]
- Becker, M.; Bredemeyer, N.; Tenhumberg, N.; Turek, T. Kinetic studies at carbon felt electrodes for vanadium redox-flow batteries under controlled transfer current density conditions. Electrochim. Acta 2017. [Google Scholar] [CrossRef]
- Aaron, D.; Yeom, S.; Kihm, K.D.; Gandomi, Y.A.; Ertugrul, T.; Mench, M.M. Kinetic enhancement via passive deposition of carbon-based nanomaterials in vanadium redox flow batteries. J. Power Sources 2017, 366, 241–248. [Google Scholar] [CrossRef]
- Xu, Q.; Zhao, T.S.; Zhang, C. Performance of a vanadium redox flow battery with and without flow fields. Electrochim. Acta 2014, 142, 61–67. [Google Scholar] [CrossRef]
- Darling, R.M.; Perry, M.L. The Influence of Electrode and Channel Configurations on Flow Battery Performance. J. Electrochem. Soc. 2014, 161, A1381–A1387. [Google Scholar] [CrossRef]
- Xu, Q.; Zhao, T.S.; Leung, P.K. Numerical investigations of flow field designs for vanadium redox flow batteries. Appl. Energy 2013, 105, 47–56. [Google Scholar] [CrossRef]
- Zheng, Q.; Xing, F.; Li, X.; Ning, G.; Zhang, H. Flow field design and optimization based on the mass transport polarization regulation in a flow-through type vanadium flow battery. J. Power Sources 2016, 324, 402–411. [Google Scholar] [CrossRef]
- You, X.; Ye, Q.; Cheng, P. Scale-up of high power density redox flow batteries by introducing interdigitated flow fields. Int. Commun. Heat Mass Transf. 2016, 75, 7–12. [Google Scholar] [CrossRef]
- Tang, A.; Bao, J.; Skyllas-Kazacos, M. Studies on pressure losses and flow rate optimization in vanadium redox flow battery. J. Power Sources 2014, 248, 154–162. [Google Scholar] [CrossRef]
- Kim, D.K.; Yoon, S.J.; Lee, J.; Kim, S. Parametric study and flow rate optimization of all-vanadium redox flow batteries. Appl. Energy 2018, 228, 891–901. [Google Scholar] [CrossRef]
- Rudolph, S.; Schröder, U.; Bayanov, R.I.; Blenke, K.; Bayanov, I.M. Optimal electrolyte flow distribution in hydrodynamic circuit of vanadium redox flow battery. J. Electroanal. Chem. 2015, 736, 117–126. [Google Scholar] [CrossRef]
- Zhang, C.; Zhao, T.S.; Xu, Q.; An, L.; Zhao, G. Effects of operating temperature on the performance of vanadium redox flow batteries. Appl. Energy 2015, 349–353. [Google Scholar] [CrossRef]
- Oboroceanu, D.; Quill, N.; Lenihan, C.; Eidhin, D.N.; Albu, S.P.; Lynch, R.P.; Buckley, D.N. Communication—Observation of Arrhenius Behavior of Catholyte Stability in Vanadium Flow Batteries. J. Electrochem. Soc. 2016, 163, A2919–A2921. [Google Scholar] [CrossRef]
- Schafner, K.; Becker, M.; Turek, T. Capacity balancing for vanadium redox flow batteries through electrolyte overflow. J. Appl. Electrochem. 2018. [Google Scholar] [CrossRef]
- Vynnycky, M. Analysis of a model for the operation of a vanadium redox battery. Energy 2011, 36, 2242–2256. [Google Scholar] [CrossRef]
- Chen, C.L.; Yeoh, H.K.; Chakrabarti, M.H. An enhancement to Vynnycky’s model for the all-vanadium redox flow battery. Electrochim. Acta 2014, 120, 167–179. [Google Scholar] [CrossRef]
- Shah, A.A.; Watt-Smith, M.J.; Walsh, F.C. A dynamic performance model for redox-flow batteries involving soluble species. Electrochim. Acta 2008, 53, 8087–8100. [Google Scholar] [CrossRef]
- Shah, A.A.; Walsh, F.C.; Al-Fetlawi, H.; Walsh, F.C. Dynamic modelling of hydrogen evolution effects in the all-vanadium redox flow battery. Electrochim. Acta 2010, 55, 1125–1139. [Google Scholar] [CrossRef]
- Milshtein, J.D.; Tenny, K.M.; Barton, J.L.; Drake, J.; Darling, R.M.; Brushett, F.R. Quantifying mass transfer rates in redox flow batteries. J. Electrochem. Soc. 2017, 164. [Google Scholar] [CrossRef]
- Barton, J.L.; Milshtein, J.D.; Hinricher, J.J.; Brushett, F.R. Quantifying the impact of viscosity on mass-transfer coefficients in redox flow batteries. J. Power Sources 2018, 399, 133–143. [Google Scholar] [CrossRef]
- Newman, J.; Tiedemann, W. Porous-Electrode Theory with Battery Applications. AIChE J. 1975, 21, 25–41. [Google Scholar] [CrossRef]
- Newman, J.; Thomas-Alyea, K.E. Electrochemical Systems, 3rd ed.; John Wiley & Sons, Inc.: Hoboken, NJ, USA, 2004; ISBN 978-0-471-47756-3. [Google Scholar]
- König, S.; Suriyah, M.R.; Leibfried, T. Validating and improving a zero-dimensional stack voltage model of the Vanadium Redox Flow Battery. J. Power Sources 2018, 378, 10–18. [Google Scholar] [CrossRef]
- Wandschneider, F.T.; Röhm, S.; Fischer, P.; Pinkwart, K.; Tübke, J.; Nirschl, H. A multi-stack simulation of shunt currents in vanadium redox flow batteries. J. Power Sources 2014, 261, 64–74. [Google Scholar] [CrossRef]
- Yin, C.; Guo, S.; Fang, H.; Liu, J.; Li, Y.; Tang, H. Numerical and experimental studies of stack shunt current for vanadium redox flow battery. Appl. Energy 2015, 151, 237–248. [Google Scholar] [CrossRef]
- Wei, Z.; Zhao, J.; Skyllas-Kazacos, M.; Xiong, B. Dynamic thermal-hydraulic modeling and stack flow pattern analysis for all-vanadium redox flow battery. J. Power Sources 2014, 260, 89–99. [Google Scholar] [CrossRef]
- Knehr, K.W.; Agar, E.; Dennison, C.R.; Kalidindi, A.R.; Kumbur, E.C. A Transient Vanadium Flow Battery Model Incorporating Vanadium Crossover and Water Transport through the Membrane. J. Electrochem. Soc. 2012, 159, 1446–1459. [Google Scholar] [CrossRef]
- Xing, F.; Zhang, H.; Ma, X. Shunt current loss of the vanadium redox flow battery. J. Power Sources 2011, 196, 10753–10757. [Google Scholar] [CrossRef]
- Fink, H.; Remy, M. Shunt currents in vanadium flow batteries: Measurement, modelling and implications for efficiency. J. Power Sources 2015, 284, 547–553. [Google Scholar] [CrossRef]
- Darling, R.M.; Weber, A.Z.; Tucker, M.C.; Perry, M.L. The Influence of Electric Field on Crossover in Redox-Flow Batteries. J. Electrochem. Soc. 2015, 163, A5014–A5022. [Google Scholar] [CrossRef]
- Cho, H.S.; Ohashi, M.; Van Zee, J.W. Absorption behavior of vanadium in Nafion®. J. Power Sources 2014, 267, 547–552. [Google Scholar] [CrossRef]
- Sun, C.; Chen, J.; Zhang, H.; Han, X.; Luo, Q. Investigations on transfer of water and vanadium ions across Nafion membrane in an operating vanadium redox flow battery. J. Power Sources 2010, 195, 890–897. [Google Scholar] [CrossRef]
- Darling, R.M.; Shiau, H.-S.; Weber, A.Z.; Perry, M.L. The Relationship between Shunt Currents and Edge Corrosion in Flow Batteries. J. Electrochem. Soc. 2017, 164, E3081–E3091. [Google Scholar] [CrossRef]
- Gandomi, Y.A.; Aaron, D.S.; Zawodzinski, T.A.; Mench, M.M. In Situ Potential Distribution Measurement and Validated Model for All-Vanadium Redox Flow Battery. J. Electrochem. Soc. 2016, 163, A5188–A5201. [Google Scholar] [CrossRef]
- Yamamura, T.; Watanabe, N.; Yano, T.; Shiokawa, Y. Electron-Transfer Kinetics of Np3+/Np4+, NpO2+/NpO22+, V2+/V3+, and VO2+/VO2+ at Carbon Electrodes. J. Electrochem. Soc. 2005, 152, A830. [Google Scholar] [CrossRef]
- Bard, A.J.; Faulkner, L.R. Electrochemical Methods Fundamentals and Applications, 2nd ed.; Harris, D., Swain, E., Aiello, E., Eds.; John Wiley & Sons, Inc.: New York, NY, USA, 2001; ISBN 978-0-471-04372-0. [Google Scholar]
- Tjaden, B.; Cooper, S.J.; Brett, D.J.; Kramer, D.; Shearing, P.R. On the origin and application of the Bruggeman correlation for analysing transport phenomena in electrochemical systems. Curr. Opin. Chem. Eng. 2016, 12, 44–51. [Google Scholar] [CrossRef]
- You, X.; Ye, Q.; Cheng, P. The Dependence of Mass Transfer Coefficient on the Electrolyte Velocity in Carbon Felt Electrodes: Determination and Validation. J. Electrochem. Soc. 2017, 164, E3386–E3394. [Google Scholar] [CrossRef]
- Schmal, D.; Van Erkel, J.; Van Duin, P.J. Mass transfer at carbon fibre electrodes. J. Appl. Electrochem. 1986, 16, 422–430. [Google Scholar] [CrossRef]
- Wilson, E.J.; Geankoplis, C.J. Liquid Mass Transfer at Very Low Reynolds Numbers in Packed Beds. Ind. Eng. Chem. Fundam. 1966, 5, 9–14. [Google Scholar] [CrossRef]
- Zenyuk, I.V.; Parkinson, D.Y.; Connolly, L.G.; Weber, A.Z. Gas-diffusion-layer structural properties under compression via X-ray tomography. J. Power Sources 2016, 328, 364–376. [Google Scholar] [CrossRef]
- Kok, M.D.R.; Khalifa, A.; Gostick, J.T. Multiphysics Simulation of the Flow Battery Cathode: Cell Architecture and Electrode Optimization. J. Electrochem. Soc. 2016, 163, A1408–A1419. [Google Scholar] [CrossRef]
- Darling, R.M.; Badrinarayanan, P. Oxygen Transport in Polymer-Electrolyte Fuel Cells with Interdigitated Air Channels in Porous Bipolar Plates. J. Electrochem. Soc. 2011, 158, B54. [Google Scholar] [CrossRef]
- Jiang, B.; Wu, L.; Yu, L.; Qiu, X.; Xi, J. A comparative study of Nafion series membranes for vanadium redox flow batteries. J. Memb. Sci. 2016, 510, 18–26. [Google Scholar] [CrossRef]
- Li, Z.; Liu, L.; Yu, L.; Wang, L.; Xi, J.; Qiu, X.; Chen, L. Characterization of sulfonated poly(ether ether ketone)/poly(vinylidene fluoride-co-hexafluoropropylene) composite membrane for vanadium redox flow battery application. J. Power Sources 2014, 272, 427–435. [Google Scholar] [CrossRef]
- Luo, Q.; Li, L.; Wang, W.; Nie, Z.; Wei, X.; Li, B.; Chen, B.; Yang, Z.; Sprenkle, V. Capacity decay and remediation of nafion-based all-vanadium redox flow batteries. ChemSusChem 2013, 6, 268–274. [Google Scholar] [CrossRef] [PubMed]
- Landesfeind, J.; Hattendorff, J.; Ehrl, A.; Wall, W.A.; Gasteiger, H.A. Tortuosity Determination of Battery Electrodes and Separators by Impedance Spectroscopy. J. Electrochem. Soc. 2016, 163, A1373–A1387. [Google Scholar] [CrossRef]
- Wang, T.; Fu, J.; Zheng, M.; Yu, Z. Dynamic control strategy for the electrolyte flow rate of vanadium redox flow batteries. Appl. Energy 2017. [Google Scholar] [CrossRef]
- Fu, J.; Wang, T.; Wang, X.; Sun, J.; Zheng, M. Dynamic Flow Rate Control for Vanadium Redox Flow Batteries. Energy Procedia 2017, 105, 4482–4491. [Google Scholar] [CrossRef]
- Zhou, X.L.; Zhao, T.S.; An, L.; Zeng, Y.K.; Zhu, X.B. Performance of a vanadium redox flow battery with a VANADion membrane. Appl. Energy 2016, 180, 353–359. [Google Scholar] [CrossRef]
- Wang, K.; Zhang, Y.; Liu, L.; Xi, J.; Wu, Z.; Qiu, X. Broad temperature adaptability of vanadium redox flow battery-Part 3: The effects of total vanadium concentration and sulfuric acid concentration. Electrochim. Acta 2018, 259, 11–19. [Google Scholar] [CrossRef]
- Bryans, D.; Amstutz, V.; Girault, H.; Berlouis, L. Characterisation of a 200 kW/400 kWh Vanadium Redox Flow Battery. Batteries 2018, 4, 54. [Google Scholar] [CrossRef]
- Bhattarai, A.; Wai, N.; Schweiss, R.; Whitehead, A.; Lim, T.M.; Hng, H.H. Advanced porous electrodes with flow channels for vanadium redox flow battery. J. Power Sources 2017, 341, 83–90. [Google Scholar] [CrossRef]
- Sun, C.-N.; Mench, M.M.; Zawodzinski, T.A. High Performance Redox Flow Batteries: An Analysis of the Upper Performance Limits of Flow Batteries Using Non-aqueous Solvents. Electrochim. Acta 2017, 237, 199–206. [Google Scholar] [CrossRef]
- Joseph, D.; Büsselmann, J.; Harms, C.; Henkensmeier, D.; Larsen, M.J.; Dyck, A.; Jang, J.H.; Kim, H.J.; Nam, S.W. Porous Nafion membranes. J. Memb. Sci. 2016, 520, 723–730. [Google Scholar] [CrossRef]
- Hudak, N.S. Practical thermodynamic quantities for aqueous vanadium- and iron-based flow batteries. J. Power Sources 2014, 269, 962–974. [Google Scholar] [CrossRef]
- Xie, W.; Darling, R.M.; Perry, M.L. Processing and Pretreatment Effects on Vanadium Transport in Nafion Membranes. J. Electrochem. Soc. 2016, 163, A5084–A5089. [Google Scholar] [CrossRef]


© 2019 by the authors. Licensee MDPI, Basel, Switzerland. This article is an open access article distributed under the terms and conditions of the Creative Commons Attribution (CC BY) license (http://creativecommons.org/licenses/by/4.0/).
Share and Cite
Barton, J.L.; Brushett, F.R. A One-Dimensional Stack Model for Redox Flow Battery Analysis and Operation. Batteries 2019, 5, 25. https://doi.org/10.3390/batteries5010025
Barton JL, Brushett FR. A One-Dimensional Stack Model for Redox Flow Battery Analysis and Operation. Batteries. 2019; 5(1):25. https://doi.org/10.3390/batteries5010025
Chicago/Turabian StyleBarton, John L., and Fikile R. Brushett. 2019. "A One-Dimensional Stack Model for Redox Flow Battery Analysis and Operation" Batteries 5, no. 1: 25. https://doi.org/10.3390/batteries5010025
APA StyleBarton, J. L., & Brushett, F. R. (2019). A One-Dimensional Stack Model for Redox Flow Battery Analysis and Operation. Batteries, 5(1), 25. https://doi.org/10.3390/batteries5010025