Article

Discharge by Short Circuit Currents of Parallel-Connected Lithium-Ion Cells in Thermal Propagation

1
Daimler AG, Neue Straße 95, 73230 Kirchheim u. Teck (Nabern), Germany
2
Electrical Energy Storage Systems, Institute for Photovoltaic, University of Stuttgart, Pfaffenwaldring 47, 70569 Stuttgart, Germany
*
Author to whom correspondence should be addressed.
Batteries 2019, 5(1), 18; https://doi.org/10.3390/batteries5010018
Submission received: 28 December 2018 / Revised: 17 January 2019 / Accepted: 19 January 2019 / Published: 29 January 2019

Abstract

:
The increasing need for high capacity batteries in plug-in hybrids and all-electric vehicles gives rise to the question of whether these batteries should be equipped with a few large capacity cells or rather many low capacity cells in parallel. This article demonstrates the possible benefits of smaller cells connected in parallel because of discharge effects. Measurements have been conducted proving the beneficial influence of a lower SoC on the thermal runaway behaviour of lithium-ion cells. A second test series examines the short circuit currents during an ongoing thermal propagation in parallel-connected cells. With the help of a developed equivalent circuit model and the results of the test series two major system parameters, the ohmic resistance of a cell during thermal runaway R tr and the resistance post thermal runaway R ptr are extracted for the test set-up. A further developed equivalent circuit model and its analytical description are presented and illustrate the great impact of R ptr on the overall discharged capacity. According to the model, cells with a capacity of no more than C cell = 10–15 Ah and a parallel-connection of 24 cells show the most potential to discharge a significant amount.

1. Introduction

The ongoing triumphal procession of plug-in hybrid electric vehicles and all-electric vehicles (EV) is accompanied and made possible by the spread of lithium-ion cells and their rapidly falling costs [1]. Range anxiety being still a major concern of customers deciding to acquire an EV [2,3] drives manufacturers to build batteries with higher and higher capacity. This can be done in two ways, either by using a small number of large capacity cells (e.g., BMW i3, Mitsubishi iMiEV) or a greater number of lower capacity cells connected in parallel (e.g., Tesla Model S, VW e-Golf and Nissan Leaf) [4,5]. Both ways have their specific challenges. Parallel-connected cells need special attention during normal operation in relation to their current distribution due to cell resistance and capacity mismatch high transient balancing currents possibly occurring [5,6,7] and severely threatening the safe operation of the cells. These cell mismatches can also increase through degradation or cell connection errors and need to be properly handled [8,9,10]. High capacity cells tend to pose a bigger threat in case of a thermal runaway (TR) [11,12]. This leads to aising the question of what cell size and connection is optimal in terms of safety. Some work on failure propagation through cell modules with different connection topologies has been done on cylindrical and small pouch cells [11,13], but mainly with regard to heat conduction through current bus bars and cell proximity. However, a cell undergoing TR is bound to get an internal short circuit, which can lead to serious short circuit currents if connected in parallel with other cells [14], especially for pouch cells as they lack internal current interruption devices. This is why circuit breakers are often advised [15,16]. Used on purpose, these short circuit currents can lead to a discharge of parallel-connected cells and therefore lower their state of charge (SoC). Lithium-ion cells with reduced SoC show a less severe TR reaction [17,18,19,20,21,22] (further discussed in Section 2) and, with the help of some additional measures [23,24,25,26], eventually lead to better controllability of thermal propagation (TP). This work is focused on finding the right conditions for pouch cells while also achieving a meaningful discharge during TP and therefore a reduced safety threat.
The remainder of this work is structured as follows: Section 2 describes the effect of SoC on the TR behaviour and demonstrates the applicability of literature findings on high capacity pouch cells. Section 3 explains the experiment series and measurement results which are used in Section 4. An equivalent circuit model (ECM) of the experiment is proposed in Section 4.1, used to estimate important system parameters, which are then applied to a second ECM in Section 4.2 to do a sensitivity analysis and find optimal system settings. Section 5 provides discussion and presents the conclusions.

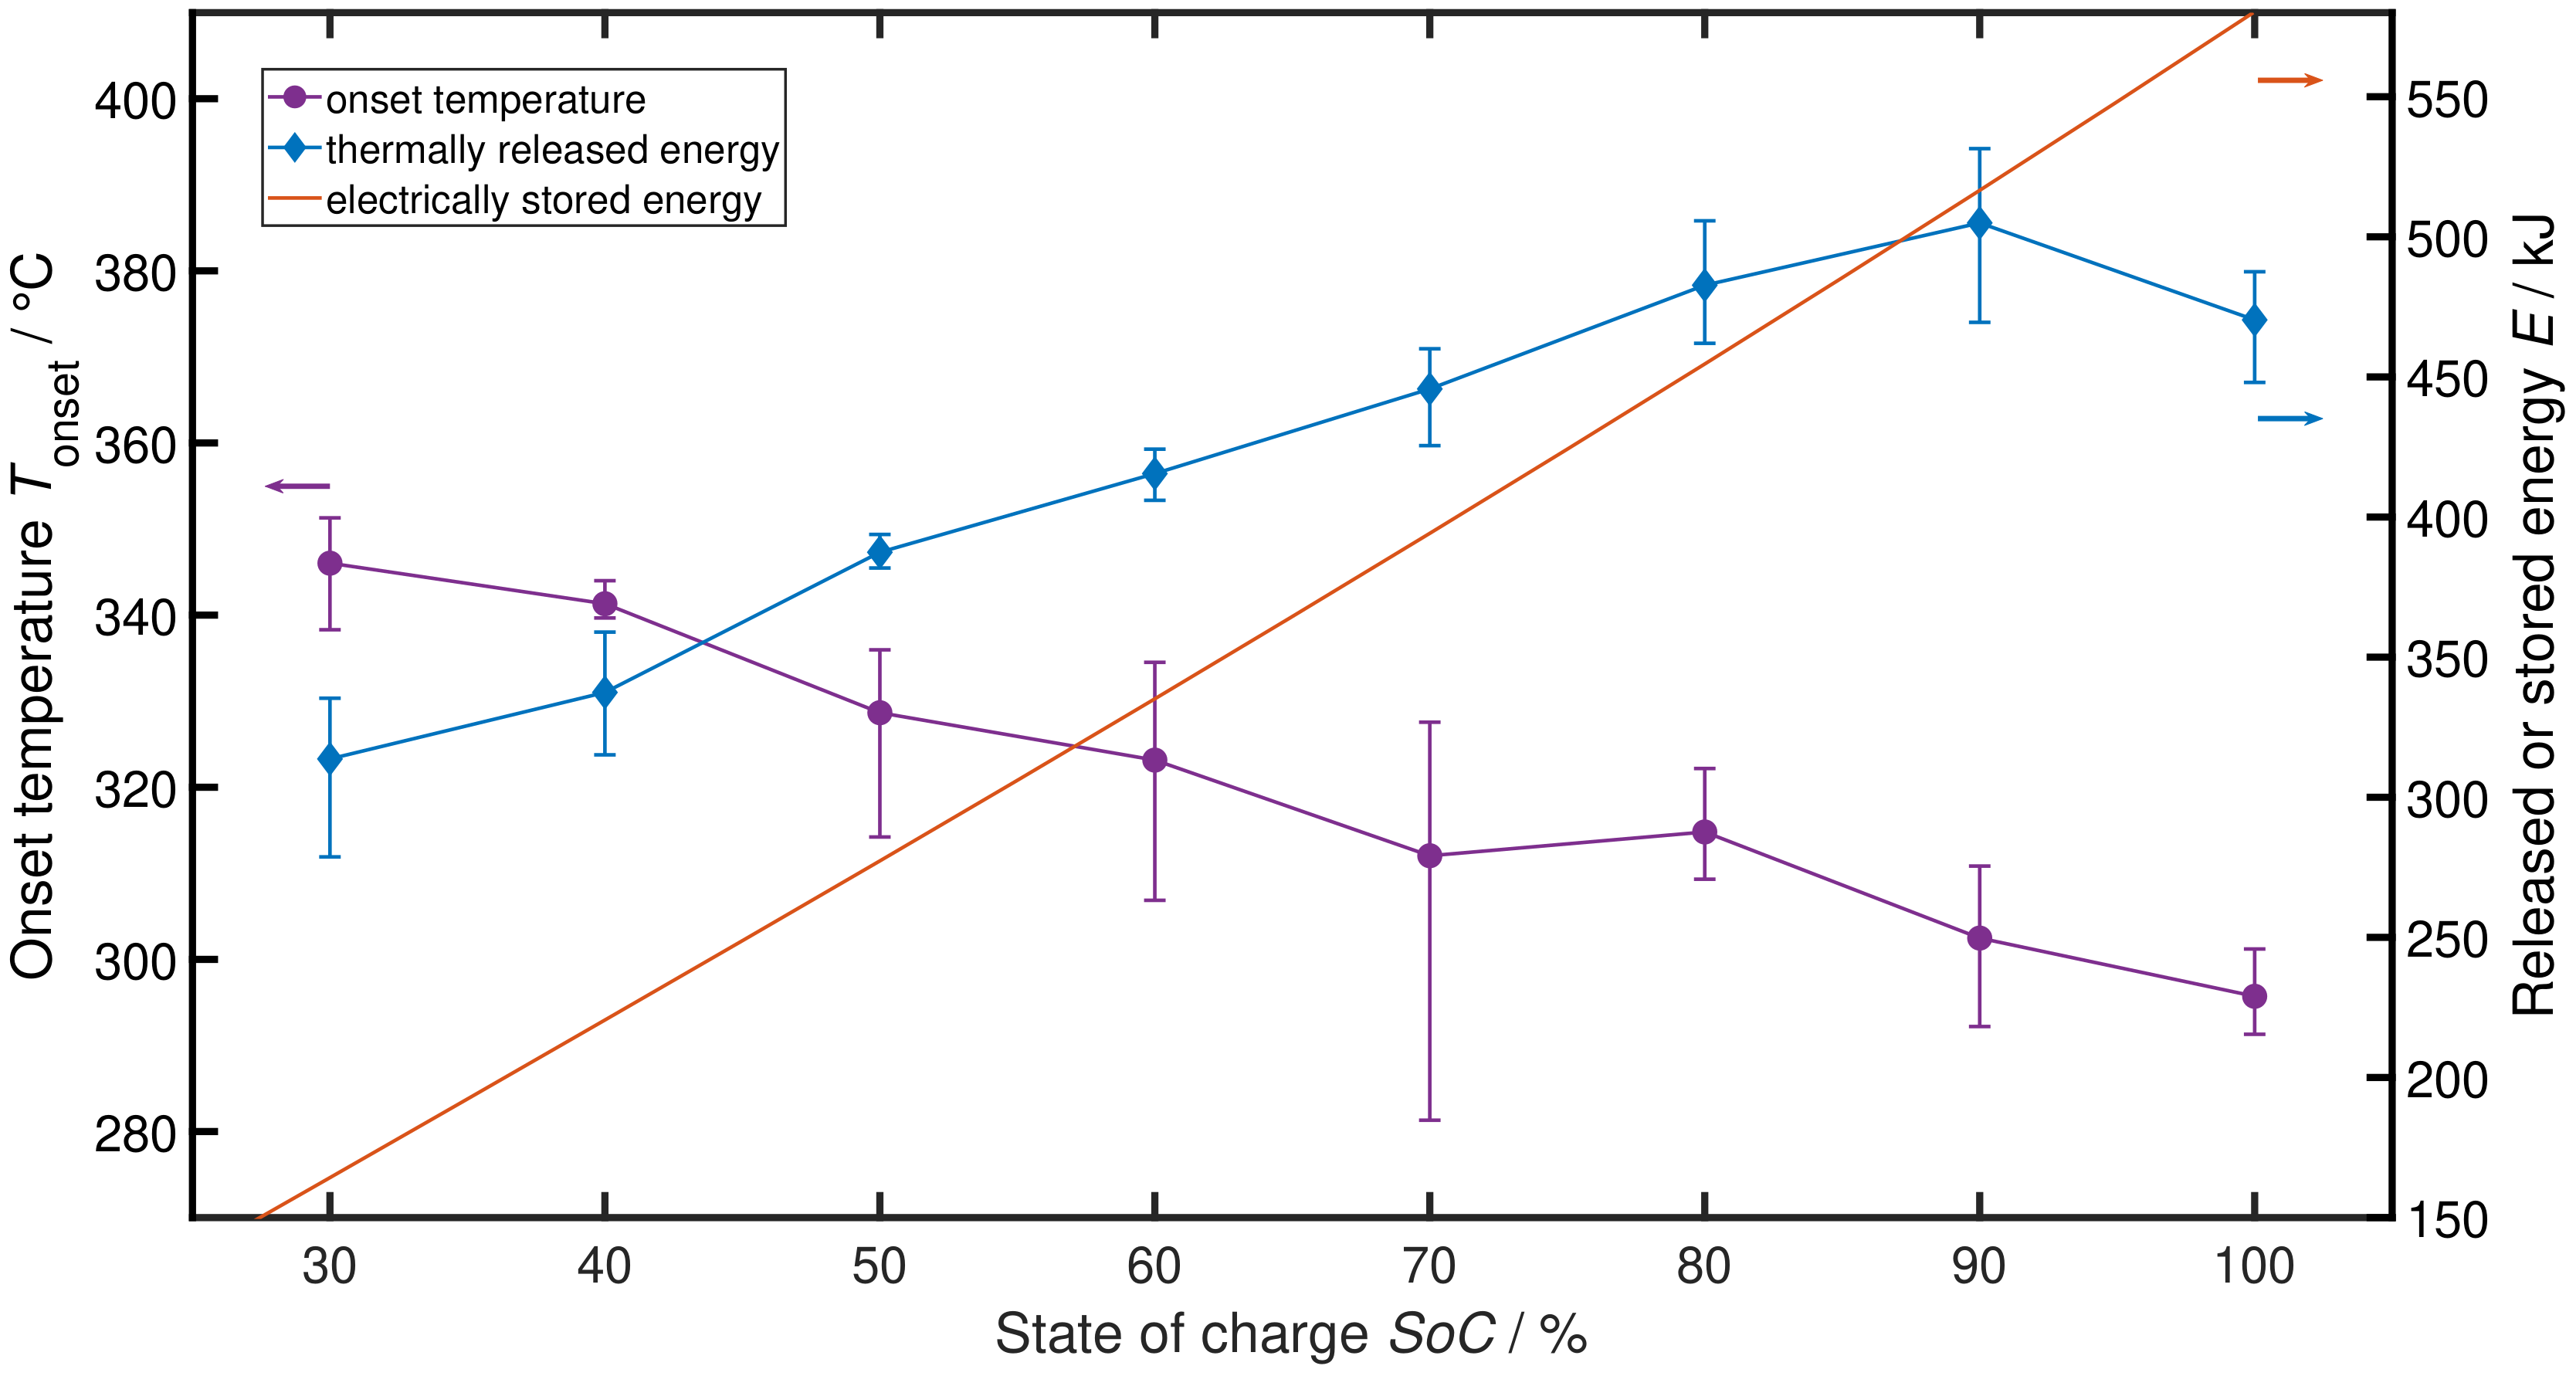
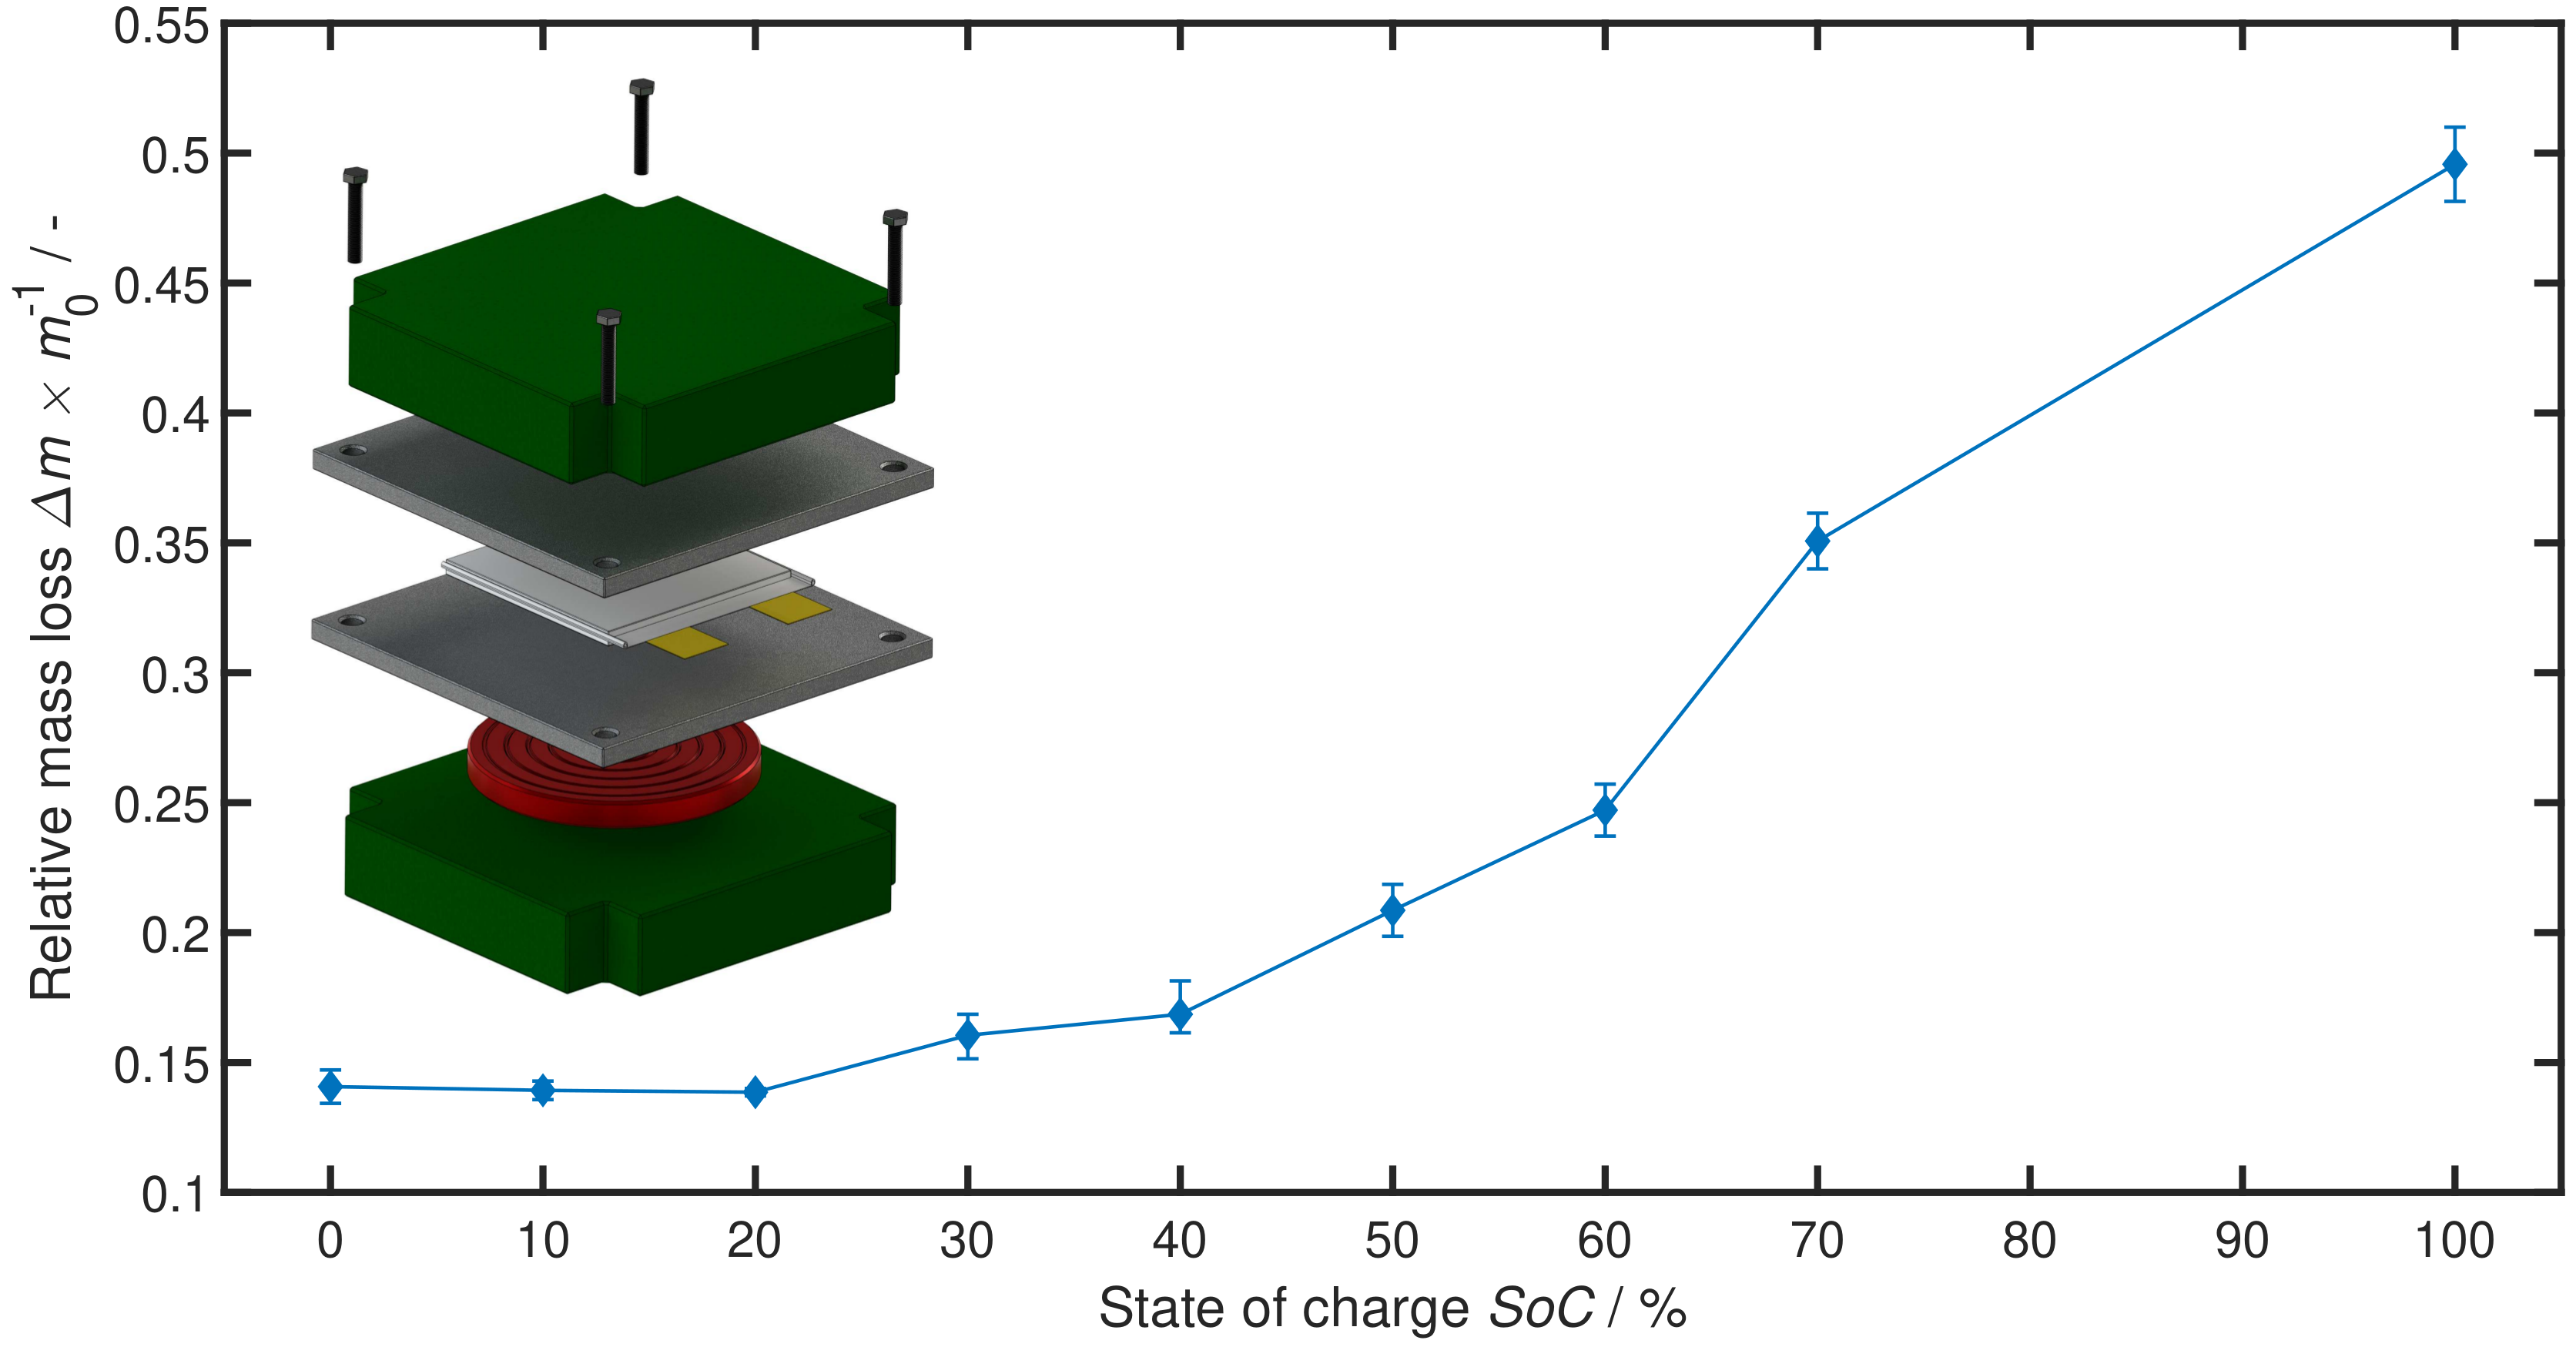
2. Influence of SoC on TR Behaviour
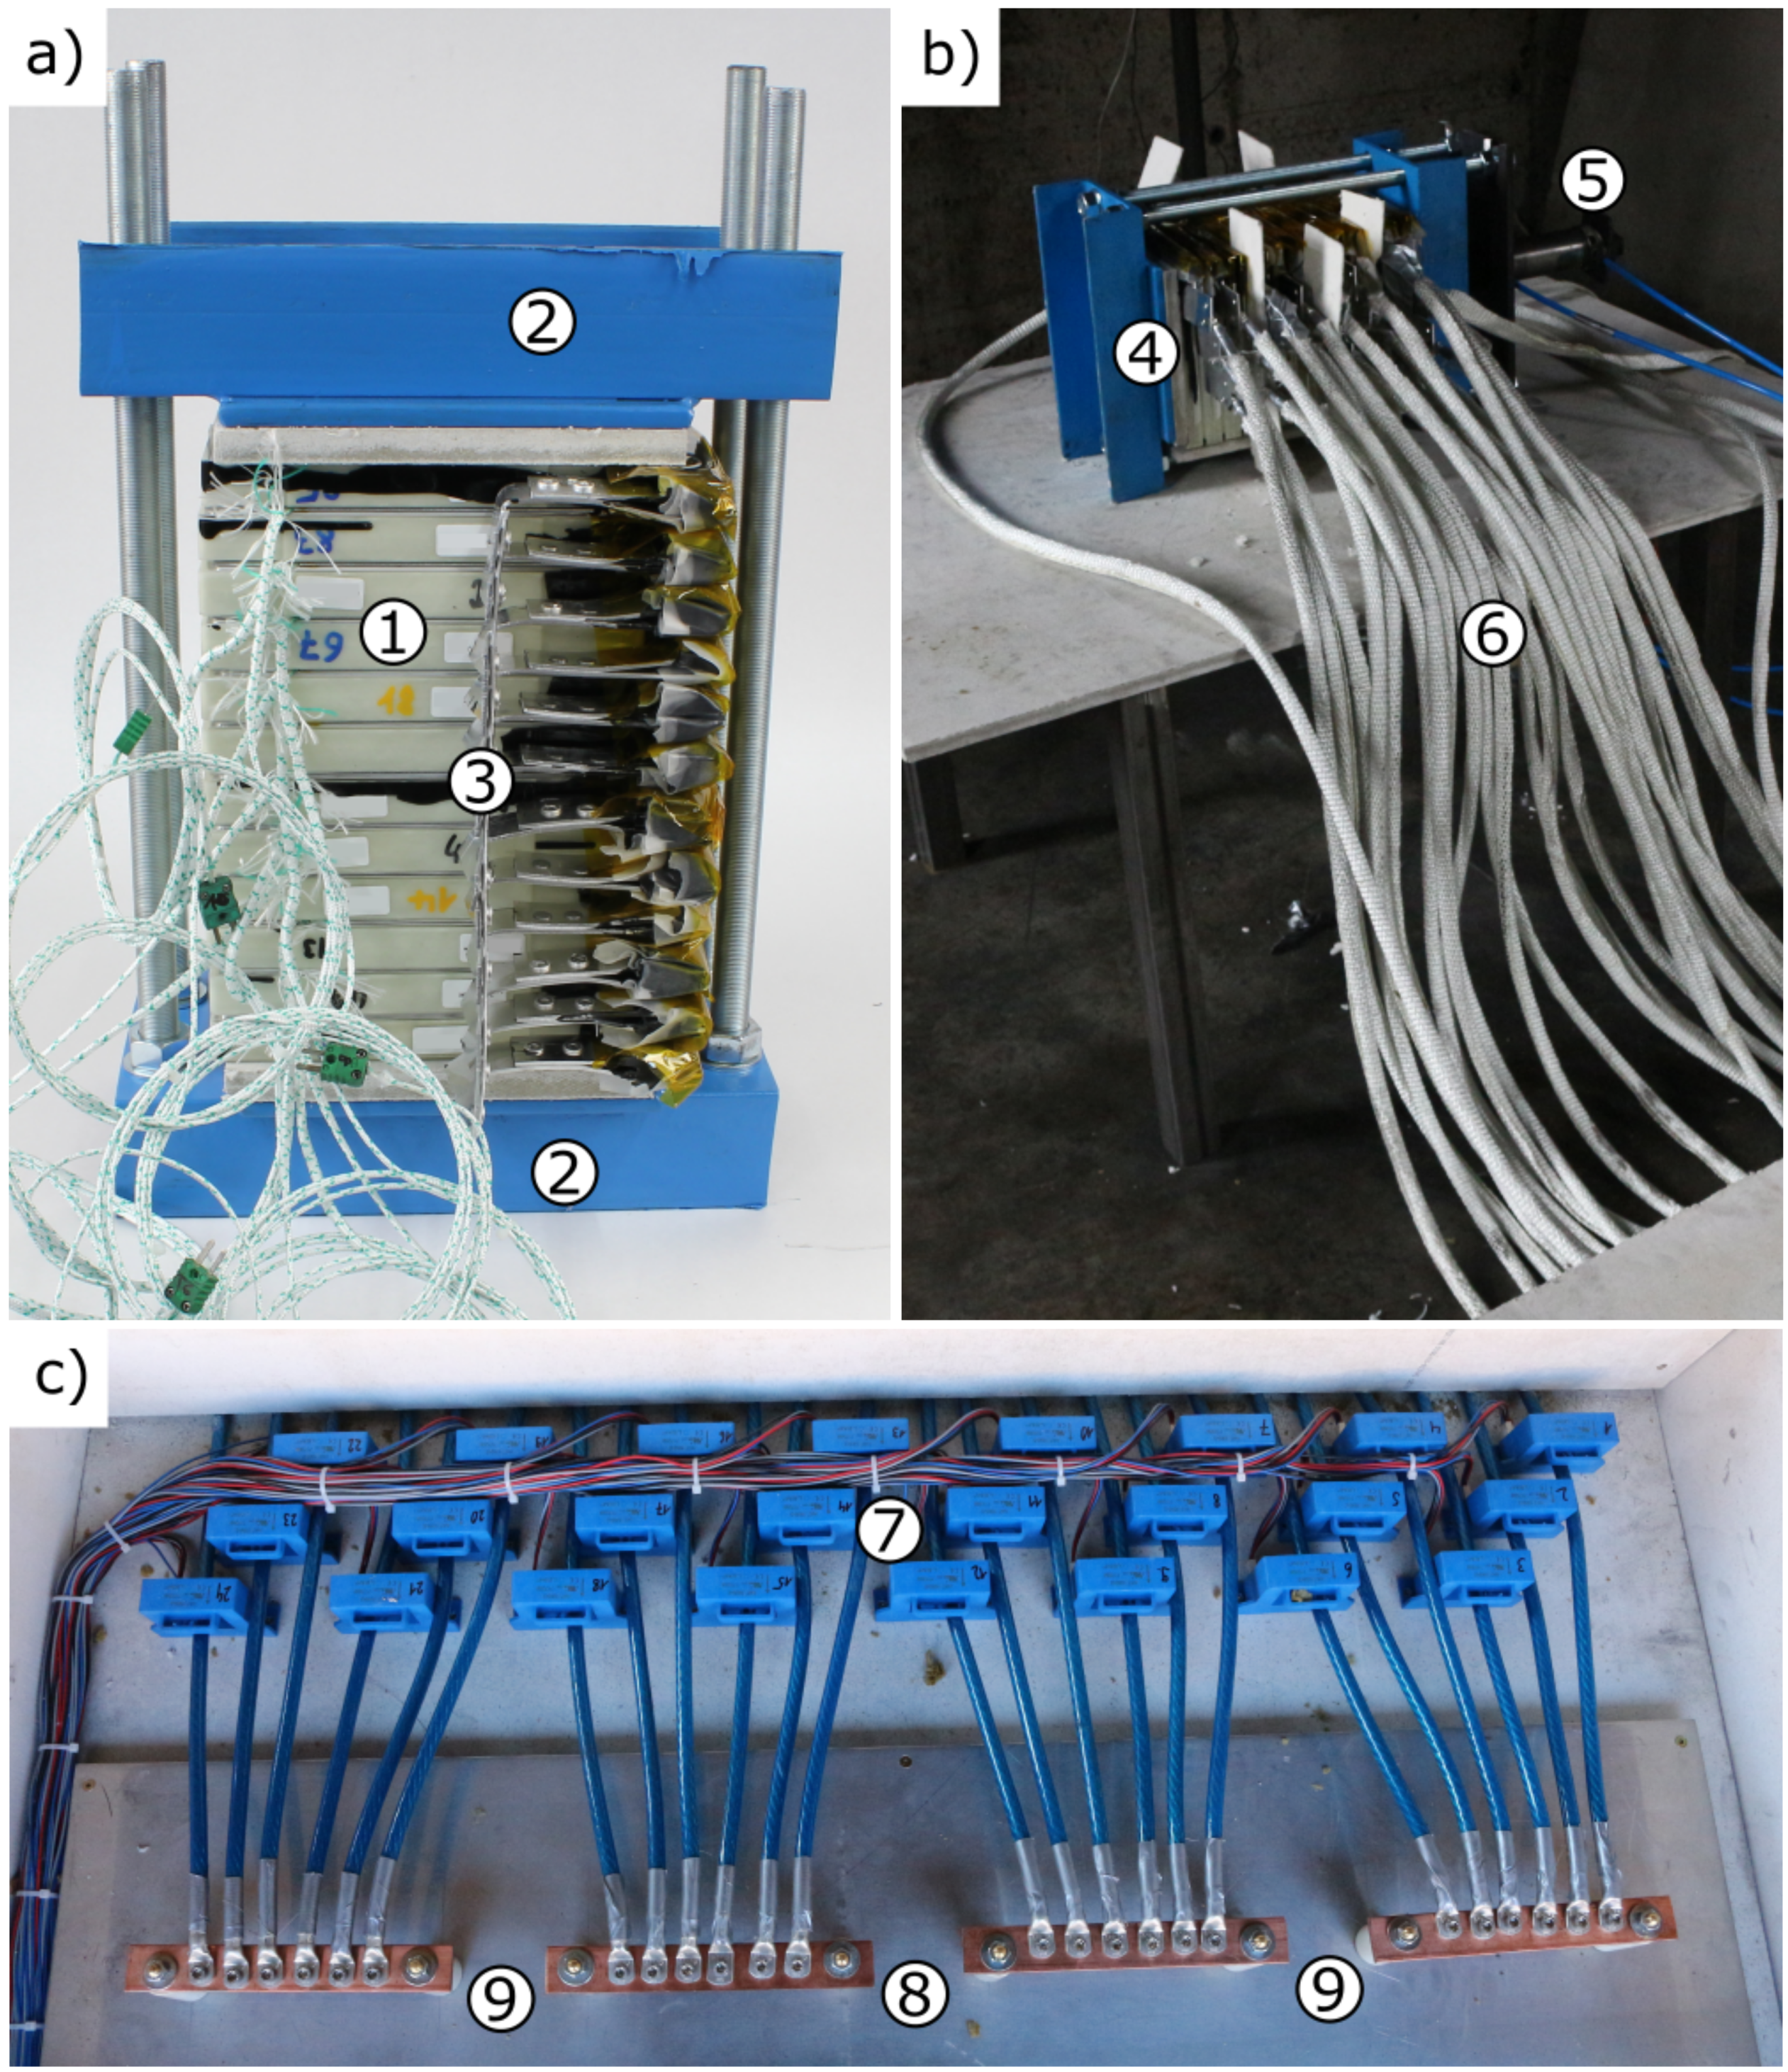
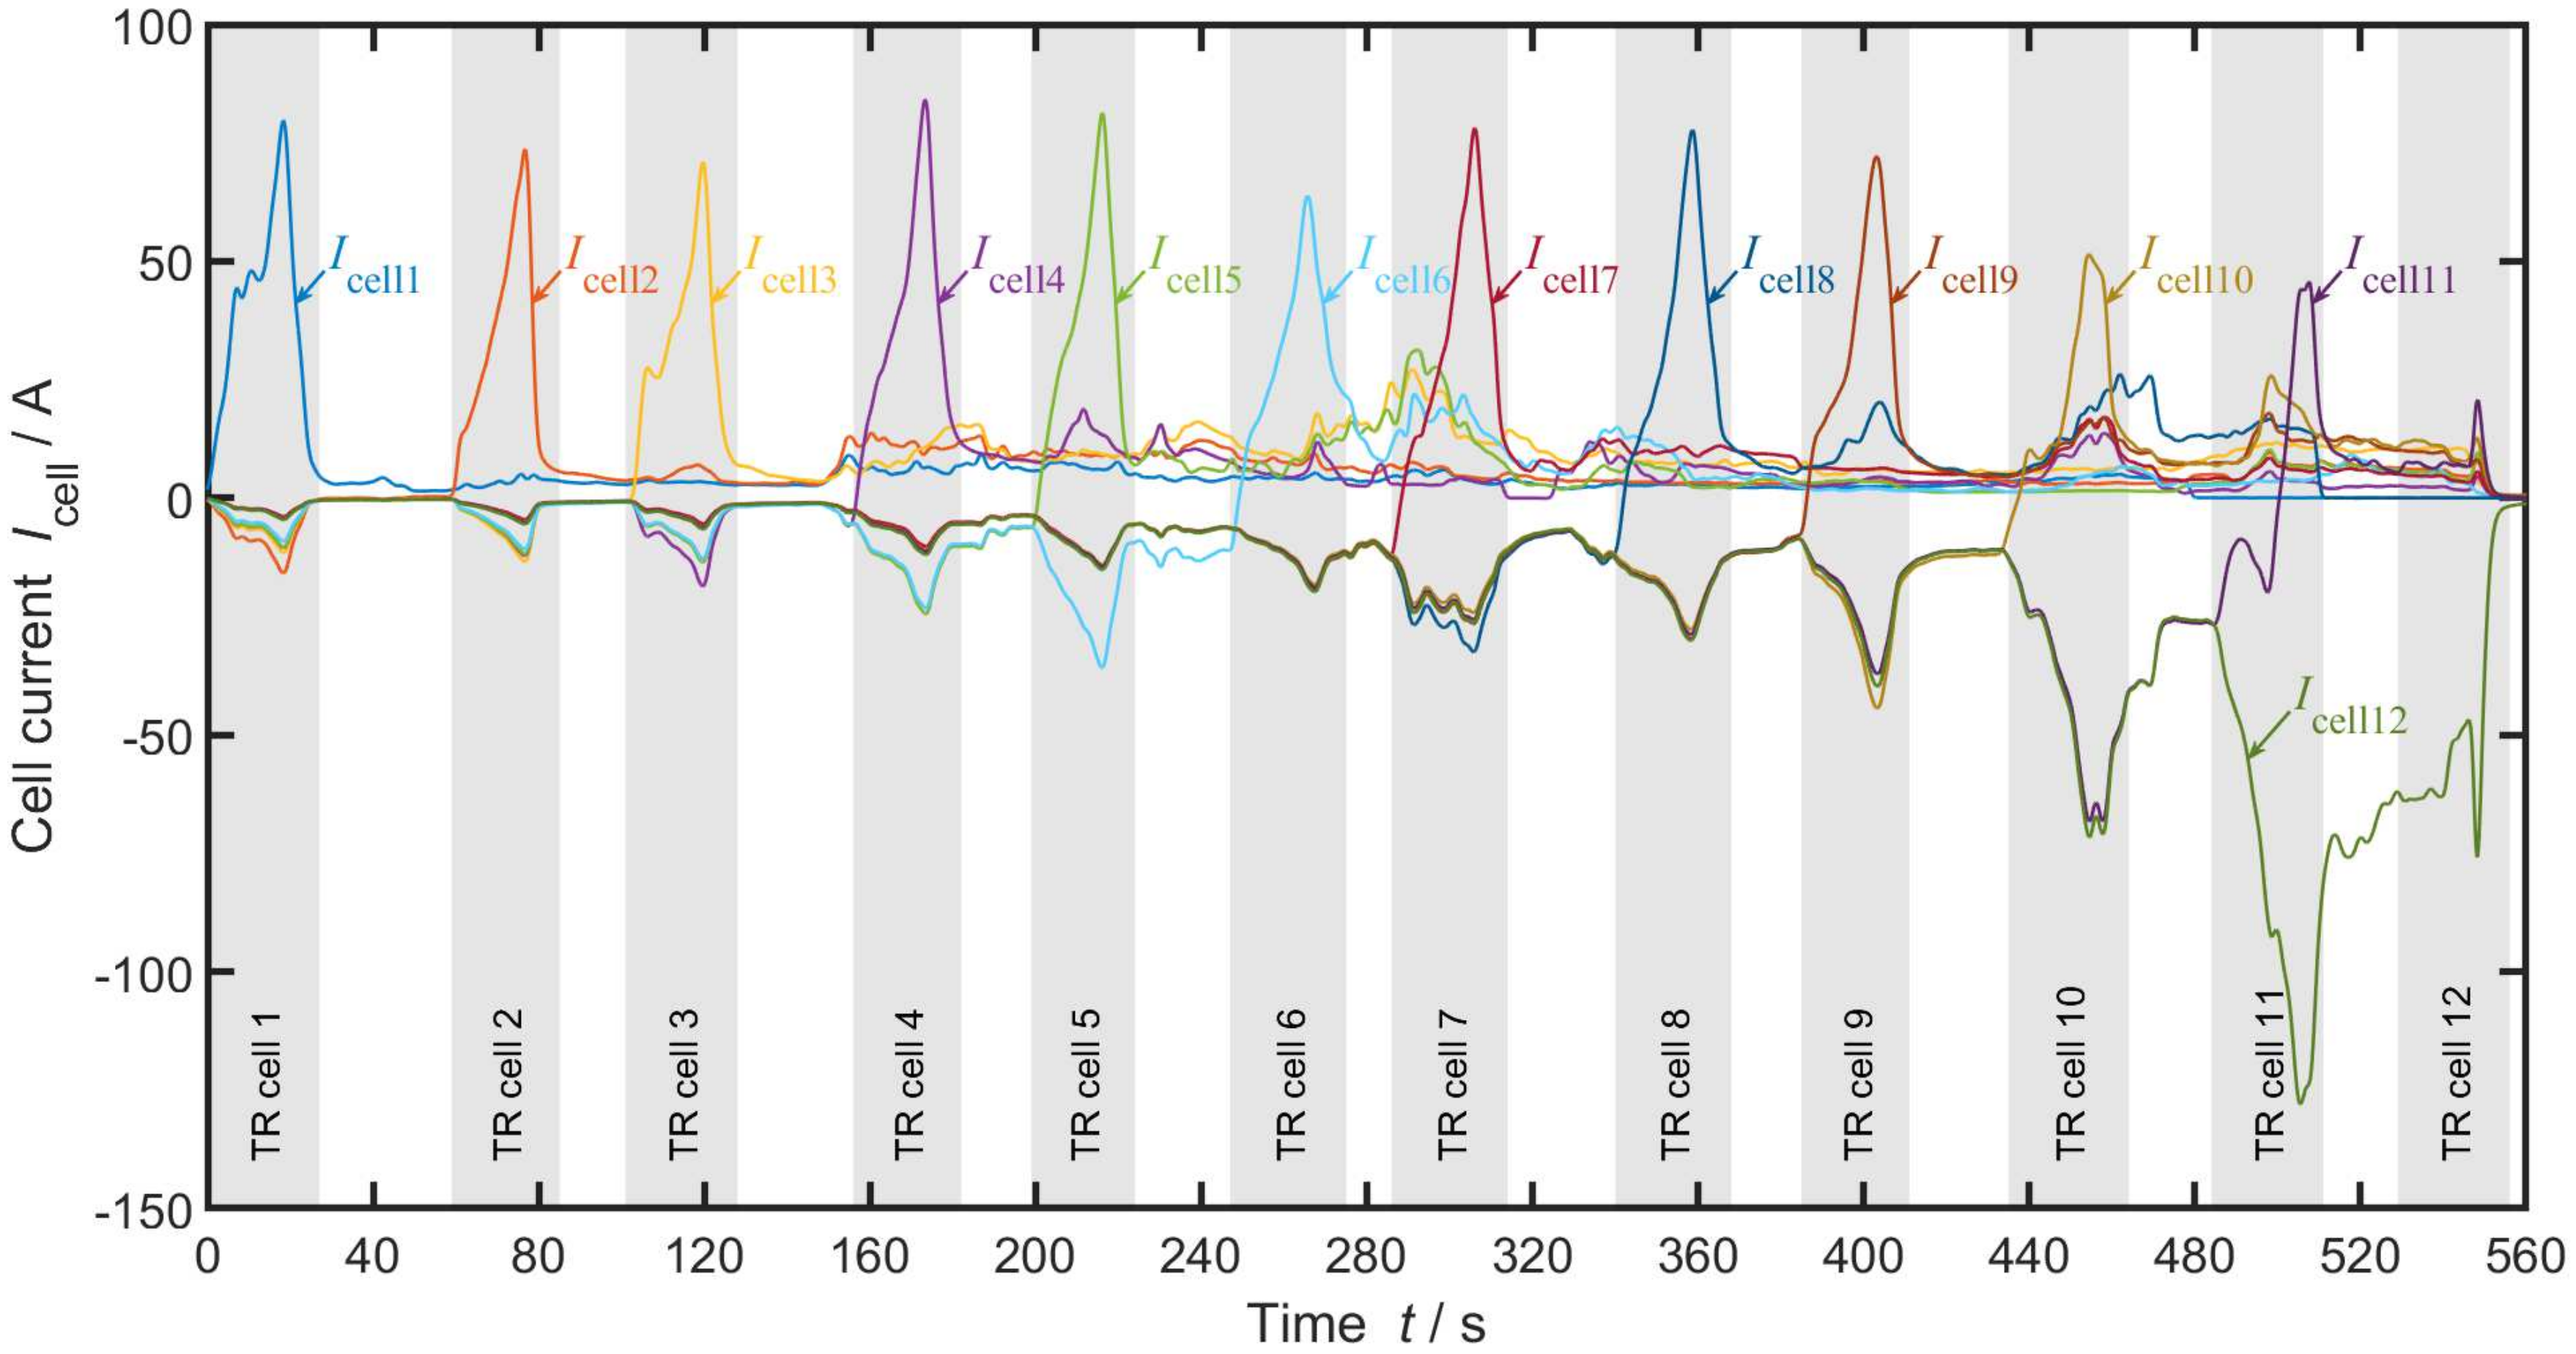
The SoC has a significant influence on the cells safety behavior and reaction during TR. Santhanagopalan et al. have shown the positive impacts (lower TR risk and less heat generation) from a decreased SoC during an internal short circuit of a 18650 type cell [27]. Increased heat generation, higher self-heat rates, earlier TR-onset and severity of TR with increasing SoC have been shown for cylindrical cells [17,18,19,20] and low capacity pouch cells [21,22] as well as an earlier and greater gas generation during venting with higher SoC [20,28]. Similar observations can be found both in cathode and anode studies and on a material level [29,30,31,32].
In order to demonstrate the influence of the SoC on a large capacity pouch cell and therefore the adaptability of the above mentioned literature, a test series is conducted. The rated capacity of the tested cells is C nom = 43 Ah with a Li[Ni x Mn y Co z ]O 2 (NMC) chemistry. A heat plate set-up as shown in the small picture in Figure 2 is used to analyse the behaviour of such high energy cells. The cell is placed between two aluminium jigs, held together by screw bolts. Heat is applied through a heating plate from the bottom of the set-up and insulation sheets on top and on the bottom of the stack reduce heat transfer to the environment during the experiment. Type K thermocouples are installed in between each layer of the stack to measure the temperature along the test set-up. Thermal energy carried by hot venting gas or ejected particles will not be detected with this measurement set-up. Instead, only the heat that is transferred to neighbouring cells by conduction during TP is measured.
A step width of 10% SoC from 100% SoC down to 0% SoC will ensure a good resolution of the test series. High SoC values down to 30% are tested with three cells each, lower SoC values from 20% down are tested with two cells each to get an insight into the repeatability of the measurements. The heater is powered with constant power of P heat = 2600 W. Due to the good insulation, a nearly constant heat rate of k heat 0.43 K/s is achieved.
Figure 1 shows the results of the test series. For SoC values lower than 30%, a distinct TR reaction start and end can not be determined and therefore onset temperature and thermally released energy can not be evaluated. The left y-axis shows the TR onset temperature T onset measured between aluminium jig and cell on the hot side, directed towards the bottom heat plate. A quasi inversely proportional relation between SoC and onset temperature is clearly visible. Lowering the SoC by 70% is leading to a higher onset temperature of Δ T onset = 50 K or 17%. This conforms in general to the literature findings for small cells. Thermally released energy E therm is displayed on the right y-axis together with the electrically stored energy of the cell (solid line with no marker). The released energy E therm is calculated by the temperature delta before and after TR and the thermal mass of the measurement set-up. As expected, the thermally released energy decreases with decreasing SoC. However, the slope of the curve is not parallel to that of the electrically stored energy and the 100% SoC value has an unexpected low value. Cell mass loss during TR can give us one possible explanation of this behaviour.
Figure 2 shows the relative mass loss of the tested cells during TR. While cells at all SoC values lose roughly Δ m 15 % of their mass due to some minor thermal reactions and the drying-out of their electrolyte after the pouch cell ruptured, cells at higher SoC values lose significantly more mass up to Δ m 50 %. This increasing mass loss is also visually detectable during the test as a more severe and abrupt reaction with increasing SoC. For these more severe reactions, we can assume that a certain portion of cell material is ejected before all exothermic reactions are completed—eventually leading to heat generation outside of the test set-up, which is not measured. Bearing in mind that fact, the shallower slope of the thermally released energy in Figure 1 compared to the electrically stored energy and even the bend down at SoC = 100% can be explained by losing not yet fully reacted material through ejection.
Summing up the results, we can see an inversely proportional relation between SoC and onset temperature T onset , a nearly proportional relation between SoC and thermal energy release E therm and an increasing mass loss of the cells with increasing SoC, starting from SoC = 30%.

3. Experiment

In order to understand and quantify the short circuit currents and resulting discharge of parallel-connected pouch cells during TP, a total of three different experiments are conducted. With the influence of the degree of parallelisation additionally being of interest, the number of parallel-connected cells is varied throughout these three experiments from 6 over 12 to 24 cells in parallel. Each experiment consists of a cell module with 24 cells, guaranteeing a comparable thermal mass, resulting in the circuit connections: 6p4s, 12p2s and 24p1s. For the best possible applicability of the results from Section 2, the same 43 Ah pouch cells are used for this experiment.
Figure 3a pictures the module assembly of the 24p1s connection as an example. The cells (1) are stacked between two steel jigs (2) and connected in parallel on their positive tab via an aluminium bus bar (3). Figure 3b shows the complete experiment set-up with the module assembly (4) from Figure 3a, a pneumatic cylinder working as a nail penetration trigger mechanism at the first cell (5) and the thermally insulated wires (6) leading from the negative cell tab to the current measurement box. Figure 3c gives a look into this current measurement box. The wires are coming in from the top, each threading through a separate hall sensor type LEM HAT 1000-S (7) (LEM International SA, Plan les Ouates, Switzerland) until they finally close the parallel connection on a copper bus bar. For better reusability of the measurement box during the three experiments, the wires and bus bars are arranged in four groups. This allows for a native parallel-connection of six cells. By placing bridges between two bus bars (9), the parallel-connection can be adjusted to 12 cells or even 24 cells with all three bridges (8 + 9) in place. The connection on the positive side of the cells Figure 3a (3) needs to be adjusted accordingly. The hall sensors (7) measure occurring short circuit currents during the TP process of the cell module, leading to quantifiable discharge observations. Video cameras additionally record the visible extent of the experiments.
Figure 4 depicts the measured results of one section in the 12p2s experiment, showing the 12 different cell currents measured with the hall sensors as well as the periods of visible TR reactions from the video cameras, displayed as grey ribbons. Positive currents indicate energy being transferred into a cell, negative currents stand for discharge of the cell. Starting at the very left of Figure 4 in the ribbon “TR cell 1”, meaning cell 1 is currently undergoing TR, we can see a high positive inrush current of I cell 1 80 A. This indicates a short circuit within the cell and the loss of its cell voltage, leading to a discharge of adjacent cells through cell 1. All of the other cells have respective negative currents of Icell2–12 ≈ 4–15 A, indicating their individual discharge. Following Kirchhoff’s law [33], the current through cell 1 I cell 1 is hereby the sum of discharge currents of the remaining cells Icell2–12. With the end of the first cell TR, leaving the first grey ribbon, currents decrease significantly. This indicates a much higher ohmic resistance of the burned first cell post TR R ptr than during TR R tr . The second current peak is visible in the “TR cell 2” ribbon, marking visible TR reactions of the second cell. This time, a positive current of cell 2 I cell 2 75 A can be seen, again accompanied by respective negative currents Icell3–12 ≈ 4–15 A and following Kirchhoff’s law I cell 1 + I cell 2 + I cell3–12 = 0 A. This shows a second discharge period of the remaining cells this time through cell 2. Minor discharge also happens through the already burned cell 1. Once again, with the decrease of all currents at the end of TR in cell 2 (end of ribbon “TR cell 2”), we can assume a much lower ohmic resistance in a cell during its TR reaction than afterwards. With advance of the TP, these described effects repeat for each cell. Every time a new cell goes into TR, the remaining healthy cells discharge massively through it with minor discharges through the already burned cells and decreasing currents after TR ends. Results of the 24p1s and 6p4s experiments lead to similar observations.
From these measurements, we can conduct two things: first, the ohmic resistance of a cell in TR R tr is much lower than the ohmic resistance of a cell after TR R ptr . Second, all remaining healthy cells discharge continuously through the already burned cells, but with varying intensity. Furthermore, the measurement set-up including the long cables (Figure 3b (6)) is believed to introduce additional resistance limiting the maximum short circuit currents in this experiment. In order to eliminate the influence of this problem, an ECM is developed in the following sections and additional resistance due to measurement equipment is identified and cancelled.

4. Modelling

4.1. Parameter Estimation

Quantification of the two different ohmic resistances R ptr and R tr , found in Section 3 are of high interest for further calculations, as they significantly influence the total amount of discharged energy during TP. In order to find these values, an ECM representing the used test set-up is developed.
Figure 5 shows this ECM. Each cell is represented by a voltage source V cell and a variable internal resistance R i / R tr / R ptr , framed in a dashed line and labelled with “Cell x”. The three ohmic resistances represent the internal cell resistance during the three possible cell states: healthy cell R i , cell in TR R tr and burned cell post TR R ptr . According to these three possible states, the cell voltage is either V cell = 4.15 V for a healthy fully charged cell, or V cell = 0 V for a cell in TR and burned after TR. Connected in series to each cell is a wire resistance R c representing the additional ohmic resistance of the measurement wires (compare Figure 3b (6)) from the cell module to the measurement box and all contact resistances along it. A connection resistance that stands for the parallel connection bus bars on the positive cell tab (compare Figure 3a (3)) but also the copper bus bars in the measurement box (compare Figure 3c) R cn is introduced between each cell. Finally, accounting for the bridges (Figure 3c (8 + 9)) between the copper bus bars to realise the modular connection in the measurement box an additional ohmic resistance R ic is introduced in the bottom circuit every 6 cells, if applicable. Simulating over time, the single cells from the ECM are now subsequently switched through their three states, from healthy ( V cell = 4.15 V, R i ) to TR ( V cell = 0 V, R tr ) and finally to post TR ( V cell = 0 V, R ptr ). The times it takes a cell to undergo TR t tr and then after TR for the next cell to be triggered t propagation are taken from the experiments in Section 3.
In order to speed up the parameter estimation in the ECM, all values are restricted to certain ranges or even set if they are already adequately known. Table 1 sums up all parameters and their set values or ranges. The simulation times for TP each stage cell voltage V cell and cell internal resistance R i are known values from the cells data sheet. The parallel connection resistance is measured in previous test to roughly R cn = 15   μ Ω . The rest of the unknown parameters are limited by reasonable ranges from simulation experience.
The tool for our parameter estimation is a MATLAB Simulink model built (Version 2017a, MathWorks, Natick, MA, USA) from the ECM in Figure 5 and a parameter estimation session from the Simulink Design Optimization toolbox (MathWorks, Natick, MA, USA). Equipped with the parameter values and ranges from Table 1, the actual estimation is conducted using the integrals of the measured currents. This way, it is easier to obtain average values, as the real resistances show a dynamic behaviour, constantly changing.
Figure 6 presents these current integrals for the 12p2s connection experiment shown in Figure 4 (solid lines) and the result of a corresponding ECM simulation with the now estimated parameter values (dashed lines). Corresponding to Figure 4, positive curve slopes representing other cells being discharged through the cell of interest and negative slopes represent the fact that the cell itself is currently discharging. The characteristics of the cells undergoing their three states with time are clearly visible. Starting with cell 1 going into TR, a steep positive slope can be observed, showing the rather low ohmic resistance during TR R tr , while all other cells are still healthy ( R i ) and discharging through the reacting first cell. Next, cell 1 goes into its post TR state with the higher ohmic resistance R ptr shown by a shallower slope and leading the remaining healthy cells to discharge slower. Soon after, cell 2 is triggered into TR; this again leads to a steep positive slope, standing for a low short circuit resistance R tr , therefore causing the other cells to discharge faster again until the TR is over. Then, cell 2 has a higher short circuit resistance R ptr and so the discharge of the remaining healthy cells is slowed down again. This process goes on until all cells are burned and TP is over. Simulated curves and measurements fit quite well to each other. The deviations visible in the post TR state of some cells can be explained by R ptr in the ECM model in Figure 5 having a constant value while the actual resistance of a cell after TR is dynamically changing and slowly increasing. As an outcome, the simulation results are straight lines while the measurements show curves. In order to overcome these deviations and model the dynamic behaviour, the cell resistance after TR R ptr must not be a constant. In a first approximation, a change of R ptr each time a new cell goes into TR or finishes its TR could already deliver an improvement of the simulation accuracy. However, for the reminder of this article, the simplified model with a constant R ptr is used.
Figure 7a,b show the two most interesting estimated values, R tr and R ptr for each cell and experiment. Note that, due to the modelling approach, the last cell of a parallel connected block cannot be estimated and is left out, as it does not lead to any remaining cells being discharged through it. This affects the results of the 24th cell for all connections, the 12th cells in 12p2s and 6p4s connections and the 18th cell in a 6p4s connection. The first six cells in the 6p4s connection could not be evaluated due to a measurement failure with data loss of the hall sensors during the experiment and are therefore also left out in the results. The values of R tr in Figure 7a range between 20 m Ω and 180 m Ω with a mean value of R tr = 92 m Ω over all three experiments. However, a trend towards higher values for later cells and therefore cells that undergo TR in a later stage of the TP process is visible. This might be an effect of the change in pressure on the cell module. At the beginning of each experiment, the 24 cells are compressed by the jigs, held together by screw bolts. During TR, each cell loses a great deal of mass as pointed out in Figure 2 and therefore also volume. With the screw bolts and jigs being spatially fixed, this leads to a decrease in pressure on the cells with each cell going into TR. With less pressure, the cells have more possibility to expand, which ultimately leads to a higher resistance R tr from the single electrodes inside the cell not contacting each other well anymore. This chain of effects reveals itself in the rising values towards later cells. Figure 7b displays the estimation results for R ptr . They range from R ptr = 0.2–1.5 Ω with a mean value of R ptr = 0.54   Ω but rather randomly distributed with no clear tendency.

4.2. System Analysis

After identifying all necessary parameters, the system of discharging parallel-connected cells in TP can be further examined. In order to eliminate the influence of measurement equipment and experiment adaptations, the ECM in Figure 5 is slightly altered and split into individual parts. Figure 8 shows the changed ECM, divided into two sides by the red ribbon which stands for the TP front. The left side represents a resistance network (a) with post TR burned cells while no cell is in TR and a resistance network (b) while there is a cell in TR. The right side describes the remaining healthy cells. The used elements in this ECM are the connection resistance R cn as well as the cell voltage V cell and the cell internal resistance of a healthy cell R i already known from the ECM in Figure 5 and in addition the short circuit resistance of a cell during TR R tr and after TR R ptr with the newly found mean values from Section 4.1. Simulating the TP process over time, with each cell going into TR, there is one more parallel cell element on the left side and one less healthy cell on the right side. The left side is hereby alternating between versions (a) and (b) depending on a cell being in TR at the TP front or not.
By splitting up the ECM into these three parts and using mean values for the estimated resistances, it is even possible to describe the system with three analytic equations, one for each part of the ECM. The equivalent resistance of part (a) R eqv _ a can be calculated by
R eqv _ a = R ptr i = 1 m ( m 2 + i 2 ( i 1 ) ) R ptr m i R cn i 1 i = 1 m ( m 1 + i 2 i 1 ) R ptr m i R cn i 1
with the short circuit resistance of a cell after TR R ptr and the parallel-connection resistance R cn and the number of already burned cells m. The equivalent resistance of part (b) R eqv _ b can now be calculated as
R eqv _ b = ( R eqv _ a + R cn ) R tr R eqv _ a + R cn + R tr
representing a series connection of R eqv _ a with R cn and then a parallel connection of R tr . To obtain the current distribution of the remaining cells, we can use
I x = V cell i = 1 n x ( n x 2 + i 2 ( i 1 ) ) R i n i R cn i 1 ( i = 1 n + 1 ( n 1 + i 2 ( i 1 ) ) R i n + 1 i R cn i 1 ) + ( R eqv _ x i = 1 n ( n 1 + i 2 i 1 ) R i n i R cn i 1 )
with the discharge current I x from cell x + 1 counting from the TP front onwards, x 0 , 1 , , n 1 , with n being the total amount of remaining healthy cells, the cell voltage V cell which is considered constant for simplification, the parallel-connection resistance R cn and the cell internal resistance R i . R eqv x is the equivalent resistance currently connected to part (c), either R eqv a if there is no cell in TR or R eqv b if a cell is undergoing TR.
While the origin of Equation (2) can be explained by series and parallel connections of resistors, the derivations of Equations (1) and (3) are more difficult. The easiest approach for Equation (1) for example is to manually calculate the equivalent resistance for some networks with only a few resistors in parallel and taking a close look. In the terms, we can then see a sequence with R ptr , R cn and some pre-factors. An analytic description of the R ptr and R cn powers is trivial. For the pre-factors, Holbrook delivered a look-up table [34], but, with a more detailed look, we can see a jumping pattern through Pascal’s triangle and we can therefore analytically describe these pre-factors with the use of binomial coefficients. The same approach leads to Equation (3).
With the use of Equations (1)–(3), the discharge currents can be calculated for each cell in each stage of a TP process. Integrating these currents over time delivers the total discharged energy for each cell. The time it takes for a cell to undergo TR t tr = 18.14 s and the time before the next adjacent cell is triggered t propagation = 25.57 s is hereby taken as an average of the three experiments from Section 3.
Figure 9 shows the results of a comprehensive sensitivity analysis of the different system parameters. Figure 9a displays the total discharged energy of the last cell in a parallel-connected cell module that undergoes a TP. Cell internal resistance R i is swept while all other parameters are set to the found values from Section 4.1 ( R tr = 92 m Ω , R ptr = 0.54   Ω , R cn = 15   μ Ω , V cell = 4.15 V). The different solid curves represent different degrees of parallelization, and the dashed line is a rational fit through the peaks of each curve. With an increasing number of parallel-connected cells, the total discharged energy of the last cells rises seemingly linearly. This is mainly due to the increasing discharge time with the increasing number of parallel-connected cells, as it takes the TP front longer before it reaches the last cell and finally burns it. Hence, the last cell has a longer period of time to discharge, which leads to a greater current integral. While the fit through the peak values of each curve has a very concave shape, the absolute change with increasing cell internal resistance R i is quite low after an initial rise. A cell internal resistance in the range of single-digit milli-Ohms is not the bottleneck in the overall resistor network and therefore does not limit the total amount of discharged energy. The initial rise for each individual curve can be explained by the current distribution, calculated by Equation (3). If R i R cn is not given, only the closest two to three cells to the TP front carry all the discharge current, leaving the cells further back with nearly no discharge current until the TP front comes closer and therefore results in a very low current integral or low total discharged energy.
Figure 9b depicts the total discharged energy over all cells in the parallel-connected block with fixed parameter values R i = 0.5 m Ω , R tr = 92 m Ω , R ptr = 0.54   Ω , R cn = 15   μ Ω and V cell = 4.15 V. The dashed lines are cubic fits through all of the very last, second last and third last cells of the different degrees of parallelization. Even though the dashed lines look linear, they demonstrate the cubic relation between the number of parallel connected cells and discharged energy. Figure 9b is a cross section cut through Figure 9a at the position R i = 0.5 m Ω , but it shows the discharge of all cells and not just the last. While the first cells of each degree of parallelization linearly increase their amount of discharged energy before TR, the last couple of cells have an over proportional higher discharged energy. This again can be explained by the current distribution during the TP process. While there are still many healthy cells remaining, the discharge current is split between them. However, the last few cells no longer need to share and can increase their discharged energy more than the previous cells.
Figure 9c presents the influence of the parallel-connection resistance R cn . Each curve stands for a different R cn , deduced by sweeping over R i for 24 cells connected in parallel with all other parameters fixed to R tr = 92 m Ω , R ptr = 0.54   Ω and V cell = 4.15 V. The dashed line linearly connects the peaks of these curves. The first finding in this figure is the increasing effect on the discharged energy in the last cell with a decreasing connection resistance R cn . The second finding is the influence of R cn on the slope of the initial rise at low R i -values. As mentioned before in Figure 9a, this can be explained by the relation of R i to R cn . If R i R cn is given, a rising R i only leads to a lower total amount of discharged energy. The theoretical boundary value R cn = 0   Ω leads to a finite amount of discharged energy that can be determined by the linear projection through at least two peak values for different R cn (compare dashed lines).
Figure 9d illustrates the effect of changing R tr on the amount of discharged energy in the last cell for different degrees of parallelization. All other parameters are fixed to R i = 0.5 m Ω , R ptr = 0.54   Ω , R cn = 15   μ Ω and V cell = 4.15 V. The shallow slopes of the curves for values R tr > 40 m Ω conclude a small influence of changes in R tr as long as the values do not decrease lower than R tr < 20 m Ω . Especially with an increasing number of parallel-connected cells, this can be explained by the resistor network in Figure 8 part (b). If there are already a couple of R ptr in parallel with each R tr = 0.54   Ω , they form a combined resistance that is smaller than R tr , rendering R tr insignificant to the discharge currents.
Figure 9e pictures the impact of changing R ptr for different amounts of cells in parallel on the discharge energy of the last cell in a parallel string. An increasing dependency of discharged energy from R ptr is observed with an increasing number of parallel-connected cells. This is due to the rising number of parallel connected resistors in the ECM of Figure 8 part (a) for a rising number of parallel-connected cells towards the end of the TP process.

5. Discussion and Conclusions

This article provides the quantified impact of a change in SoC on large scale pouch cells’ TR behaviour through a comprehensive test series in Section 2. A higher onset temperature T onset , smaller amount of thermally released energy E therm (comp. Figure 1) and less mass loss during TR (comp. Figure 2) are connected to lower SoCs. In general, a less severe TR behaviour with decreasing SoC is observed. These findings correspond well to existing literature on low energy cylindrical cells, small pouch cells and material examinations.
Following this approach, an experiment series to examine the discharge currents during TP is set up, fuelling an ECM parameter estimation to find the two crucial values of the system, ohmic cell resistance during thermal runaway R tr = 92 m Ω and ohmic cell resistance after TR R ptr = 0.54   Ω . An updated ECM, eliminating influences of measurement equipment and representing real conditions, is proposed and described with analytical equations. A sensitivity analysis gives insight on which system parameters have the biggest impact on a cell discharge during TP. Most potential lays hereby with the post TR resistance R ptr . Especially with an increasing number of parallel-connected cells, a decrease of R ptr has a significant influence on how much the cells are discharged during a TP process due to short circuit currents. One possible way to affect R ptr is via dynamic cell module compression, achieved for example by a spring. Higher pressure on the cell stack even after the first cells undergo TR is seen as a potential candidate to decrease R ptr . Additionally, a lower parallel-connection resistance R cn could increase the amount of discharged energy, especially for cells with low internal resistance R i . However, this parameter can only increase discharged energy by a finite amount as shown in Figure 9c. Finally, the number of parallel-connected cells itself has an impact on the amount of discharged energy. Nearly linear with the degree of parallelization, the discharged energy rises in a very weak parabolic way as demonstrated in Figure 9b.
With the given values and findings from experiment and sensitivity analysis, a realistic discharge of C DCH 6–10 Ah could be achieved for the last cell of 24 cells in parallel. This would mean cells with a total capacity of C cell 10–15 Ah would experience major discharge during TP, leading them into the regions of SoC = 30% and therefore leaving them with a much less severe TR behaviour, eventually even stopping TP.
All these findings lay within limitations of the proposed ECM and the specific parameters of the experiment. In particular, the influence of cell cavity dimensions, number of cell internal electrode layers and cell stack pressure on R ptr and R tr should be investigated. Furthermore, the impact of cell chemistry and energy density are additionally of interest. Finally, the effect that additional heat caused by discharging energy of parallel-connected cells has on the TP velocity is a key factor to the overall system. If the surplus on excess heat during TR and TP has a stronger impact on the overall outcome of the TP process than the less severe TR behaviour of cells with lower SoC, all efforts should go into avoiding this discharge.

Author Contributions

S.K. and K.K. conceived, designed and supervised the experiments. S.K. and A.F. analysed and interpreted the data. S.K. designed the simulations and models, conducted the calculations and wrote the paper. K.P.B. and A.F. contributed to the manuscript design and revised the paper.

Funding

This research received no external funding

Acknowledgments

The authors want to thank Ke-Tec GmbH Betzigau, Germany and SL TecH2 GmbH Kirchheim u. Teck, Germany for the conduction of several abuse tests. Further acknowledgements go to Louise Egremont for her revisions of the article and help with spelling corrections.

Conflicts of Interest

The authors declare no conflict of interest.

Abbreviations

The following abbreviations are used in this manuscript:
EVall-electric vehicle
TRthermal runaway
TPthermal propagation
SoCstate of charge
ECMequivalent circuit model
NMCLi[Ni x Mn y Co z ]O 2

References

  1. Nykvist, B.; Nilsson, M. Rapidly falling costs of battery packs for electric vehicles. Nat. Clim. Chang. 2015, 5, 329–332. [Google Scholar] [CrossRef] [Green Version]
  2. Yuan, Q.; Hao, W.; Su, H.; Bing, G.; Gui, X.; Sadikhani, A. Investigation on Range Anxiety and Safety Buffer of Battery Electric Vehicle Drivers. J. Adv. Transp. 2018, 2018. [Google Scholar] [CrossRef]
  3. Esmaili, M.; Shafiee, H.; Aghaei, J. Range anxiety of electric vehicles in energy management of microgrids with controllable loads. J. Energy Storage 2018, 20, 57–66. [Google Scholar] [CrossRef]
  4. Rothgang, S.; Baumhöfer, T.; Sauer, D. Necessity and Methods to improve Battery Lifetime on System Leve. In Proceedings of the Electric Vehicle Symposium EVS28, Goyang, Korea, 3–6 May 2015. [Google Scholar]
  5. Brand, M.; Hofmann, M.; Steinhardt, M.; Schuster, S. Current distribution within parallel-connected battery cells. J. Power Sources 2016, 334, 202–212. [Google Scholar] [CrossRef]
  6. Dubarry, M.; Devie, A.; Liaw, B. Cell-balancing currents in parallel strings of a battery system. J. Power Sources 2016, 321, 36–46. [Google Scholar] [CrossRef] [Green Version]
  7. Fill, A.; Koch, S.; Pott, A.; Birke, K. Current distribution of parallel-connected cells in dependence of cell resistance, capacity and number of parallel cells. J. Power Sources 2018, 407, 147–152. [Google Scholar] [CrossRef]
  8. Orcioni, S.; Buccolini, L.; Ricci, A.; Conti, M. Lithium-ion Battery Electrothermal Model, Parameter Estimation, and Simulation Environment. Energies 2017, 10, 375. [Google Scholar] [CrossRef]
  9. Pastor-Fernández, C.; Bruen, T.; Widanage, W.; Gama-Valdez, M.; Marco, J. A Study of Cell-to-Cell Interactions and Degradation in Parallel Strings: Implications for the Battery Management System. J. Power Sources 2016, 329, 574–585. [Google Scholar] [CrossRef] [Green Version]
  10. Roscher, M.; Kuhn, R.; Döring, H. Error detection for PHEV, BEV and stationary battery systems. Control Eng. Pract. 2013, 21, 1481–1487. [Google Scholar] [CrossRef]
  11. Lopez, C.; Jeevarajan, J.; Mukherjee, P. Experimental Analysis of Thermal Runaway and Propagation in Lithium-Ion Battery Moduls. J. Electrochem. Soc. 2015, 162, A1905–A1915. [Google Scholar] [CrossRef]
  12. Koch, S.; Fill, A.; Birke, K. Comprehensive gas analysis on large scale automotive lithium-ion cells in thermal runaway. J. Power Sources 2018, 398, 106–112. [Google Scholar] [CrossRef]
  13. Lamb, J.; Orendorff, C.; Steele, L.; Spangler, S. Failure propagation in multi-cell lithium ion batteries. J. Power Sources 2015, 283, 517–523. [Google Scholar] [CrossRef] [Green Version]
  14. Feng, X.; Sun, J.; Ouyang, M.; Wang, F.; He, X.; Lu, L.; Peng, H. Characterization of penetration induced thermal runaway propagation process within a large format lithium ion battery module. J. Power Sources 2015, 275, 261–273. [Google Scholar] [CrossRef]
  15. Balakrishnan, P.; Ramesh, R.; Kumar, T.P. Safety mechanisms in lithium-ion batteries. J. Power Sources 2006, 155, 401–414. [Google Scholar] [CrossRef]
  16. Wang, Q.; Ping, P.; Zhao, X.; Chu, G.; Sun, J.; Chen, C. Thermal runaway caused fire and explosion of lithium ion battery. J. Power Sources 2012, 208, 210–224. [Google Scholar] [CrossRef]
  17. Liu, X.; Stoliarv, S.; Denlinger, M.; Masias, A.; Snyder, K. Comprehensive calorimetry of the thermally-induced failure of a lithium ion battery. J. Power Sources 2015, 280, 516–525. [Google Scholar] [CrossRef]
  18. Mendoza-Hernandez, O.; Ishikawa, H.; Nishikawa, Y.; Maruyama, Y.; Umeda, M. Cathode material comparison of thermal runaway behavior of Li-ion cells at different state of charges including over charge. J. Power Sources 2015, 280, 499–504. [Google Scholar] [CrossRef]
  19. Doughty, D.; Roth, E. A General Discussion of Li Ion Battery Safety. Electrochem. Soc. Interface 2012, 21, 37–44. [Google Scholar] [CrossRef] [Green Version]
  20. Golubkov, A.; Scheikl, S.; Planteu, R.; Voitic, G.; Wiltsche, H.; Stangl, C.; Fauler, G.; Thaler, A.; Hacker, V. Thermal runaway of commerial 18650 Li-ion batteries with LFP and NCA cathodes - impact of state of charge and overcharge. RSC Adv. 2015, 5, 57171–57186. [Google Scholar] [CrossRef]
  21. Ma, L.; Nie, M.; Xia, J.; Dahn, J. A systematic study on the reactivity of different grades of charged Li[NixMnyCoz]O2 with electrolyte at elevated temperatures using accelerating rate calorimetry. J. Power Sources 2016, 327, 145–150. [Google Scholar] [CrossRef]
  22. Ribière, P.; Grugeon, S.; Morcrette, M.; Boyanov, S.; Laruelle, S.; Marlair, G. Investigation on the fire-induced hazards pf Li-ion battery cells by fire calorimetry. Energy Environ. Sci. 2012, 5, 5271–5280. [Google Scholar] [CrossRef]
  23. Coleman, B.; Ostanek, J.; Heinzel, J. Reducing cell-to-cell spacing for large-format lithium ion battery modules with aluminum or PCM heat sinks under failure conditions. Appl. Energy 2016, 180, 14–26. [Google Scholar] [CrossRef] [Green Version]
  24. Wilke, S.; Schweitzer, B.; Khateeb, S.; Al-Hallaj, S. Preventing thermal runaway propagation in lithium ion battery packs using phase change composite material: An experimental study. J. Power Sources 2017, 340, 51–59. [Google Scholar] [CrossRef]
  25. Koch, S.; Birke, K.; Kuhn, R. Fast Thermal Runaway Detection for Lithium-Ion Cells in LArge Scale Traction Batteries. Batteries 2018, 4, 16. [Google Scholar] [CrossRef]
  26. Feng, X.; Ouyang, M.; Liu, X.; Lu, L.; Xia, Y.; He, X. Thermal runaway mechanism of lithium ion battery for electric vehicles: A review. Energy Storage Mater. 2018, 10, 246–267. [Google Scholar] [CrossRef]
  27. Santhanagopalan, S.; Ramadass, P.; Zhang, J. Analysis of internal short-circuit in a lithium ion cell. J. Power Sources 2009, 194, 550–557. [Google Scholar] [CrossRef]
  28. Fu, Y.; Lu, S.; Li, K.; Liu, C.; Cheng, X.; Zhang, H. An experimental study on burning behaviors of 18650 lithium ion batteries using a cone calorimeter. J. Power Sources 2015, 273, 216–222. [Google Scholar] [CrossRef]
  29. Richard, M.; Dahn, J. Accelerating Rate Calorimetry Study on the Thermal Stability of Lithium Intercalated Graphite in Electrolyte I. Experimental. J. Electrochem. Soc. 1999, 146, 2068–2077. [Google Scholar] [CrossRef]
  30. Maleki, H.; Howard, J.N. Role of the cathode and anode in heat generation of Li-ion cells as a function of state of charge. J. Power Sources 2004, 137, 117–127. [Google Scholar] [CrossRef]
  31. Röder, P.; Baba, N.; Wiemhöfer, H.D. A detailed thermal study of a Li[Ni0.33Co0.33Mn0.33]O2/LiMn2O4-based lithium ion cell by accelerating rate and differential scanning calorimetry. J. Power Sources 2014, 248, 978–987. [Google Scholar] [CrossRef]
  32. Biensan, P.; Simon, B.; Pérès, J.; de Guibert, A.; Broussely, M.; Bodet, J.; Perton, F. On safety of lithium-ion cells. J. Power Sources 1999, 81–82, 906–912. [Google Scholar] [CrossRef]
  33. Kirchhoff, G. Ueber den Durchgang eines elektrischen Stromes durch eine Ebene, insbesondere durch eine kreisförmige. Ann. Phys. 1845, 140, 497–514. [Google Scholar] [CrossRef]
  34. Holbrook, J. Specialized Applications of the Laplace Transform. In Laplace Transforms for Electronic Engineers, 2nd (revised) ed.; Pergamon Press Ltd.: Oxford, UK, 1966; Chapter IX; p. 269. [Google Scholar]
Figure 1. Impact of SoC on onset temperature T onset and thermally released energy E therm . The red line serves as a comparison to the electrically stored energy in the cell.
Batteries 05 00018 g001
Figure 2. Impact of SoC on relative cell mass loss Δ m during thermal runaway (TR) scaled to cell mass m 0 before TR. Small picture: Schematic of the test set-up. A lithium-ion cell is placed between two aluminium jigs and heated via a hot plate. Insulation pads on the very top and bottom prevent excessive heat loss.
Batteries 05 00018 g002
Figure 3. Photographs of the test set-up. (a) detailed view of the cell module with cells (1), compression jigs (2) and cell connection bus bar (3); (b) complete test set-up with the cell module (4), the penetration trigger (5) and the cables leading to the current measurement box (6); (c) current measurement box with hall sensors (7) and the bridge positions for 12p connection (9) and 24p connection (8 + 9).
Batteries 05 00018 g003
Figure 4. Current measurement during the 12p2s propagation test. Positive values indicate currents into the cell (charge direction), negative currents indicate currents out of the cell (discharge direction). The ribbons represent the time period of a visible TR reactions.
Batteries 05 00018 g004
Figure 5. Equivalent circuit model of the experimental set-up. A cell comprises a variable resistor ( R i , R tr or R ptr ) and a voltage source V cell . The cell to cell connection resistance is represented by R cn and the wiring for current measurements by R c . For more flexibility of the set-up a clamp bridge was used if needed to connect the blocks of six parallel-connected cells to 12p or 24p, represented by R ic .
Batteries 05 00018 g005
Figure 6. Current integrals of the first six cells from Figure 4 as solid lines. The dashed lines represent the simulation results with the estimated parameters set into the equivalent circuit model (ECM) from Figure 5.
Batteries 05 00018 g006
Figure 7. (a) parameter estimation results for the cell resistance during TR R tr of the three different experiments. The rising resistance with increasing cell number is believed to be a result of a decreasing pressure on the cells due to the mass loss from ejected particles and venting gas; (b) parameter estimation results for the cell resistance after TR R ptr .
Batteries 05 00018 g007
Figure 8. Equivalent circuit model of a cell stack in thermal propagation (TP) without measurement equipment. (a) ECM of the burned part while there is currently no cell in TR; (b) ECM of the burned part while a cell is in TR; (c) ECM of the healthy part with intact cells.
Batteries 05 00018 g008
Figure 9. Influence analysis of the different system parameters. (a) different numbers of cells in parallel over cell internal resistance R i . The dashed line is a fit to the maxima; (b) total amount of discharged energy of each cell. The dashed line shows cubic correlation of the last cells to the number of parallel connected cells; (c) different connection resistances R cn over cell internal resistance R i . The dashed line is a linear fit to the maxima; (d) variation of cell resistance during TR R tr ; (e) variation of cell resistance after TR R ptr .
Batteries 05 00018 g009
Table 1. Start parameter set used in the equivalent circuit model (ECM) in Figure 5 and their estimation ranges or set values for the parameter estimation.
ParameterSymbolRange or Value
cell voltage V cell 4.15 V
cell internal resistance R i 0.5 m Ω
parallel connection resistance R cn 15 μ Ω
cell resistance during TR R tr 1–300 m Ω
cell resistance after TR R ptr 0.1–2 Ω
wire resistance R c 0.5–3 m Ω
bridge resistance R ic 0.5–3 m Ω

