Article

Silicon/Mesoporous Carbon (Si/MC) Derived from Phenolic Resin for High Energy Anode Materials for Li-ion Batteries: Role of HF Etching and Vinylene Carbonate (VC) Additive

1
AIT Austrian Institute of Technology GmbH, Center for Low-Emission Transport, 1210 Vienna, Austria
2
Institute of Chemical Technologies and Analytics, Technische Universität Wien, 1060 Vienna, Austria
3
Analytical Instrumentation Center, Technische Universität Wien, 1060 Vienna, Austria
*
Author to whom correspondence should be addressed.
Batteries 2019, 5(1), 11; https://doi.org/10.3390/batteries5010011
Submission received: 30 November 2018 / Revised: 7 January 2019 / Accepted: 14 January 2019 / Published: 16 January 2019
(This article belongs to the Special Issue Silicon for High-Energy Lithium Ion Batteries)

Abstract

:
Silicon/mesoporous carbon (Si/MC) composites with optimum Si content, in which the volumetric energy density would be maximized, while volume changes would be minimized, have been developed. The composites were prepared by dispersing Si nanoparticles in a phenolic resin as a carbon source, subsequent carbonization, and etching with hydrofluoric acid (HF). Special attention was paid to understanding the role of HF etching as post-treatment to provide additional void spaces in the composites. The etching process was shown to reduce the SiO2 native layer on the Si nanoparticles, resulting in increased porosity in comparison to the non-etched composite material. For cell optimization, vinylene carbonate (VC) was employed as an electrolyte additive to build a stable solid electrolyte interphase (SEI) layer on the electrode. The composition of the SEI layer on Si/MC electrodes, cycled with and without VC-containing electrolytes for several cycles, was then comprehensively investigated by using ex-situ XPS. The SEI layers on the electrodes working with VC-containing electrolyte were more stable than those in configurations without VC; this explains why our sample with VC exhibits lower irreversible capacity losses after several cycles. The optimized Si/MC composites exhibit a reversible capacity of ~800 mAhg−1 with an average coulombic efficiency of ~99 % over 400 cycles at C/10.

1. Introduction

Progress in the field of high-performance Li-ion batteries is crucial for the development of future portable electronic devices and electric vehicles, as well as energy storage for renewable energy. As a candidate for anode materials, Si offers a theoretical capacity of 3579 mAhg−1 (Li15Si4), much higher than the current state-of-the-art graphite (372 mAhg−1, LiC6), and a low lithiation potential (~0.4 V vs. Li/Li+) [1]. The main drawback of Si as an anode material is the volume change (~280–400%) during lithiation/delithiation, which causes pulverization and electric contact loss, leading to severe capacity fading. To overcome this issue, various attempts, including the preparation of nanostructured Si [2,3,4,5,6] and Si/carbon (Si/C)-based composites [2,3,4,5,6,7,8,9,10], have been explored.
Several Si/C composite materials indeed show excellent electrochemical performance due to their ability to combine two advantages: The high specific capacity of Si, and the mechanical stability of carbon. Employing phenolic resin as a carbon source has received a great deal of attention since the preparation is rather straightforward. Si/C materials synthesized from phenolic resin as a carbon source have been studied as anode materials for Li-ion batteries. The Si contents, the used electrolytes, and their electrochemical performances are summarized in Table 1.
The as-prepared Si/C composites with or without hydrofluoric acid (HF) etching indeed showed improved electrochemical performance compared to their pure counterpart. However, the Si content in the composites is still far from an optimal situation where Si/C anodes would exhibit no volume expansion constraints. Dash et al. reported the theoretical limits of specific capacity for a Si/C anode at which it should exhibit no volume expansion. It was determined that the threshold value of Si was 11.68 wt % and the maximum capacity of the anode was ~935 mAhcm−3 and ~712 mAhg−1 [13].
In this manuscript, we report our approach to optimizing the design of Si/MC composites for high energy anode materials for Li-ion batteries application. We prepared Si/MC composites by dispersing Si nanoparticles in phenolic resin followed by carbonization under Ar, and subsequent HF etching. The final Si content in the prepared Si/MC electrodes was close to the threshold limits reported by Dash et al.
In order to achieve high performance of the cell, VC was used as an electrolyte additive to build a stable SEI layer during formation cycles. It is generally accepted that the SEI layer on graphite-based anodes determines safety, power capability, shelf life, and cycle life of Li-ion batteries [14]; thus, building a stable SEI layer on the anode in the first few cycles is of major importance. The addition of VC in the electrolyte has been proven to improve the stability of the SEI layer on Si thin film due to the formation of poly(VC) [15], to inhibit side reactions, and to form highly stable SEI layers on the Si nanoparticles [16]. Polymerization reactions initiated by ring-opening of VC were found to be thermodynamically more favorable than those reacting with EC molecules [17]. However, publications on the SEI formation on Si/C composites containing Si nanoparticles and amorphous carbon with high specific surface area are scarce to date. Thus, it is of fundamental interest to comprehensively investigate the composition of the species which build the SEI layer on the prepared Si/MC anodes. Previously, we reported that VC surpasses succinic anhydride (SA) and lithium bis (oxalato) borate (LiBOB) in building an effective SEI layer on the Si/MC anode [18]. In this work, we investigate the role of VC as an additive on the formation of a stable SEI layer on the electrode in detail by carrying out ex-situ XPS analysis on the cycled Si/MC electrodes.

2. Results and Discussion

2.1. Properties of the Materials and the Effect of the HF Etching

The crystalline structure of the synthesized Si/MC materials was analyzed by means of XRD. The XRD pattern of Si/MC (Figure 1a) before etching presents typical diffraction peaks at 2θ of about 28.4°, 47.4°, 56.2°, and 69.2°, corresponding to the (111), (220), (311), and (400) planes of crystalline Si, respectively [19]. Two broad peaks at around 23° and 44° can be assigned to the (002) and (100) planes for carbon [20]. The Si/MC composites after etching show similar diffraction peaks.
To investigate the effect of HF etching on the porosity of the prepared materials, N2 adsorption/desorption isotherms were measured; the results are shown in Figure 1b. Both isotherms can be classified as type I isotherms, which is typical for microporous adsorbents according to the IUPAC classification of the sorption isotherms. The slight hysteresis in the P/P0 range 0.6–0.95 observed in the isotherm of the etched sample is an indication of mesoporosity in the structure, in addition to the presence of micropores, which result from the etching process. The specific surface area of the materials was determined by using the Brunauer–Emmett–Teller (BET) method. Multipoint BET analysis yields a specific surface area (SSA) of 481.88 m2g−1 for Si/MC before etching and 530.23 m2g−1 for the etched Si/MC composites. The related porous parameters are listed in Table 2. The data shows that the etching process increases not only the total surface area, but also the pore volume, all of which is expected to improve the electrochemical performance.
The morphology of the Si/MC composites was investigated by SEM, see Figure 2a,b. SEM images show a similar morphology of the two samples. EDX analysis (not shown) indicates that the non-etched Si/MC composites contain Si, C, and O. Oxygen can be derived from the surface SiO2 and C-Ox layer from the native layer of commercial Si nanoparticles. Similar spectra can be seen in the etched Si/MC composites with decreased Si content. The morphology of the composites was further investigated by TEM, shown in Figure 2c,d. The dark grey color of the images corresponds to the Si nanoparticles and the light grey color corresponds to the carbon layer. The TEM image of the non-etched Si/MC shows that the Si agglomerates are completely enveloped by an amorphous carbon layer. For the etched Si/MC, Si nanoparticles of ~50 nm are enveloped by the carbon layer, with additional pores between them; the latter have a diameter of about 10 nm.
The elemental composition of the Si/MC powders before and after HF etching was investigated by XPS. Quantification of the elements was performed from survey spectra (see Figure 3). Besides C, O, and Si, traces of N were detected in both samples. Nitrogen would be derived from ammonia as a pH controller during synthesis. Quantitative analysis averaged over three different positions of the as-prepared electrodes shows a homogenous distribution of the elements (see Table 3). Comparison of the elemental composition prior to and after etching indicates a decrease of Si and O from 3.2 to 2.6 at% and 11.6 to 10.2 at%, respectively.
The high-resolution spectra of the C 1s and Si 2p regions are depicted in Figure 4. C 1s spectra show an asymmetric shape, indicating sp2 carbon as well as several other components that may be assigned to C−O/C−N, O−C=O, and C=O and/or CO2/CCO3 species (Figure 4a) [21]. Most importantly, no significant changes caused by the etching process are detected in the C 1s signal, indicating that reduction of C-Ox groups is not the main reason for the overall decrease in the O content after HF etching. The peak shapes of the Si 2p detail spectra (Figure 4b) show certain differences for the Si/MC before and after etching and were de-convoluted using three symmetrical Gauss-Lorentz (70%–30%) curves. The component at 99.6 eV is assigned to elemental Si, while the peaks at higher BE are assigned to Si-oxides on the nanoparticle surface, SiO2 (103.6 eV) and SiOx (101.3 eV). The latter overlaps with the contribution from Si3N4, which could also explain the presence of nitrogen in the samples [22]. While no major differences in BE could be detected, the full width at half maximum (FWHM) of all peaks is decreased by 50% after HF etching. This observation might refer to (partial) charging effects and, therefore, might indicate that the non-etched samples are less conductive than the etched ones.
The result of this analysis (Table 4) shows that the Si/SiO2 ratio increases due to the etching process. The ratio approximately doubles—from 0.3 before to 0.6 after etching—indicating that the decrease in O and Si content by HF etching corresponds to a reduced amount of SiO2 on the nanoparticles.
To estimate the composition of the synthesized Si/MC composite materials, TGA was performed in ambient atmosphere and is presented in Figure 5. The TGA curve of Si/C composites before etching shows three decomposition stages in the temperature ranges of 25–150 °C, 150–450 °C, and 450–800 °C. The decomposition stage at ≥150 °C on the etched sample corresponds to the loss of distilled water from the rinsing process. In the temperature range between 450–800 °C, the oxidation of carbon into CO2 and the evaporation of CO2 and CO take place; the latter is completed at 800 °C. The increase in mass above 800 °C is attributed to the oxidation of Si into SiO2. The Si content in the Si/MC composites before etching was measured at 25.24 wt%, whereas in the Si/C composites after etching it was 17.30 wt%, which confirms Si removal by the etching process.

2.2. Initial Electrochemical Performance

To compare the irreversible capacity loss of the Si/MC electrodes in the first few cycles and the potential hysteresis of each electrode material during lithiation/delithiation, the potential (or voltage) profiles at the 1st, 20th, and 50th cycles are presented in Figure 6. The non-etched Si/MC electrode (Figure 6a) shows an initial discharge (lithiation) capacity of 3793 mAhg−1 and a charge capacity of 1894 mAhg−1, resulting in a coulombic efficiency of 49.95 %. This significant irreversible capacity loss of about 50% can be mostly assigned to the electrolyte decomposition to form the SEI layer at the electrode surface. The etched Si/MC electrode exhibits a higher initial discharge capacity of 3944 mAhg−1 and a coulombic efficiency of 46.35 %. The etched sample exhibits a higher irreversible capacity loss in comparison to the non-etched one, which can be explained by its higher specific surface area (see Section 2.1), which leads to more electrolytes being decomposed. However, the voltage hysteresis between lithiation and delithiation in the etched sample is lower than the non-etched. The high surface area of the etched materials benefits the charge–transfer kinetics, which in turn can benefit the negative electrode potential hysteresis.
By adding VC to the electrolyte, the Si/MC electrode (Figure 6b) exhibits an initial discharge of 3909 mAhg−1 and a coulombic efficiency of 44.6 %. Presumably, the addition of VC to the electrolyte causes more electrolyte decomposition for building the SEI layer. By using ab initio molecular dynamics (AIMD), Balbuena et.al. showed that the mixture of EC and VC is highly reactive and that a significant number of molecules decompose when in contact with the lithiated Si surface. However, at the 20th cycle, the electrode in the VC-containing electrolyte shows a better coulombic efficiency in comparison to the VC-free electrolyte—i.e., 98.66 % vs. 97.08 %. This is even more pronounced in the following cycles—e.g., at the 50th cycle 99.1% (VC-containing electrolyte) vs. 96.7% (VC-free). Furthermore, VC addition causes decreased voltage hysteresis between lithiation and delithiation after 20 and 50 cycles.

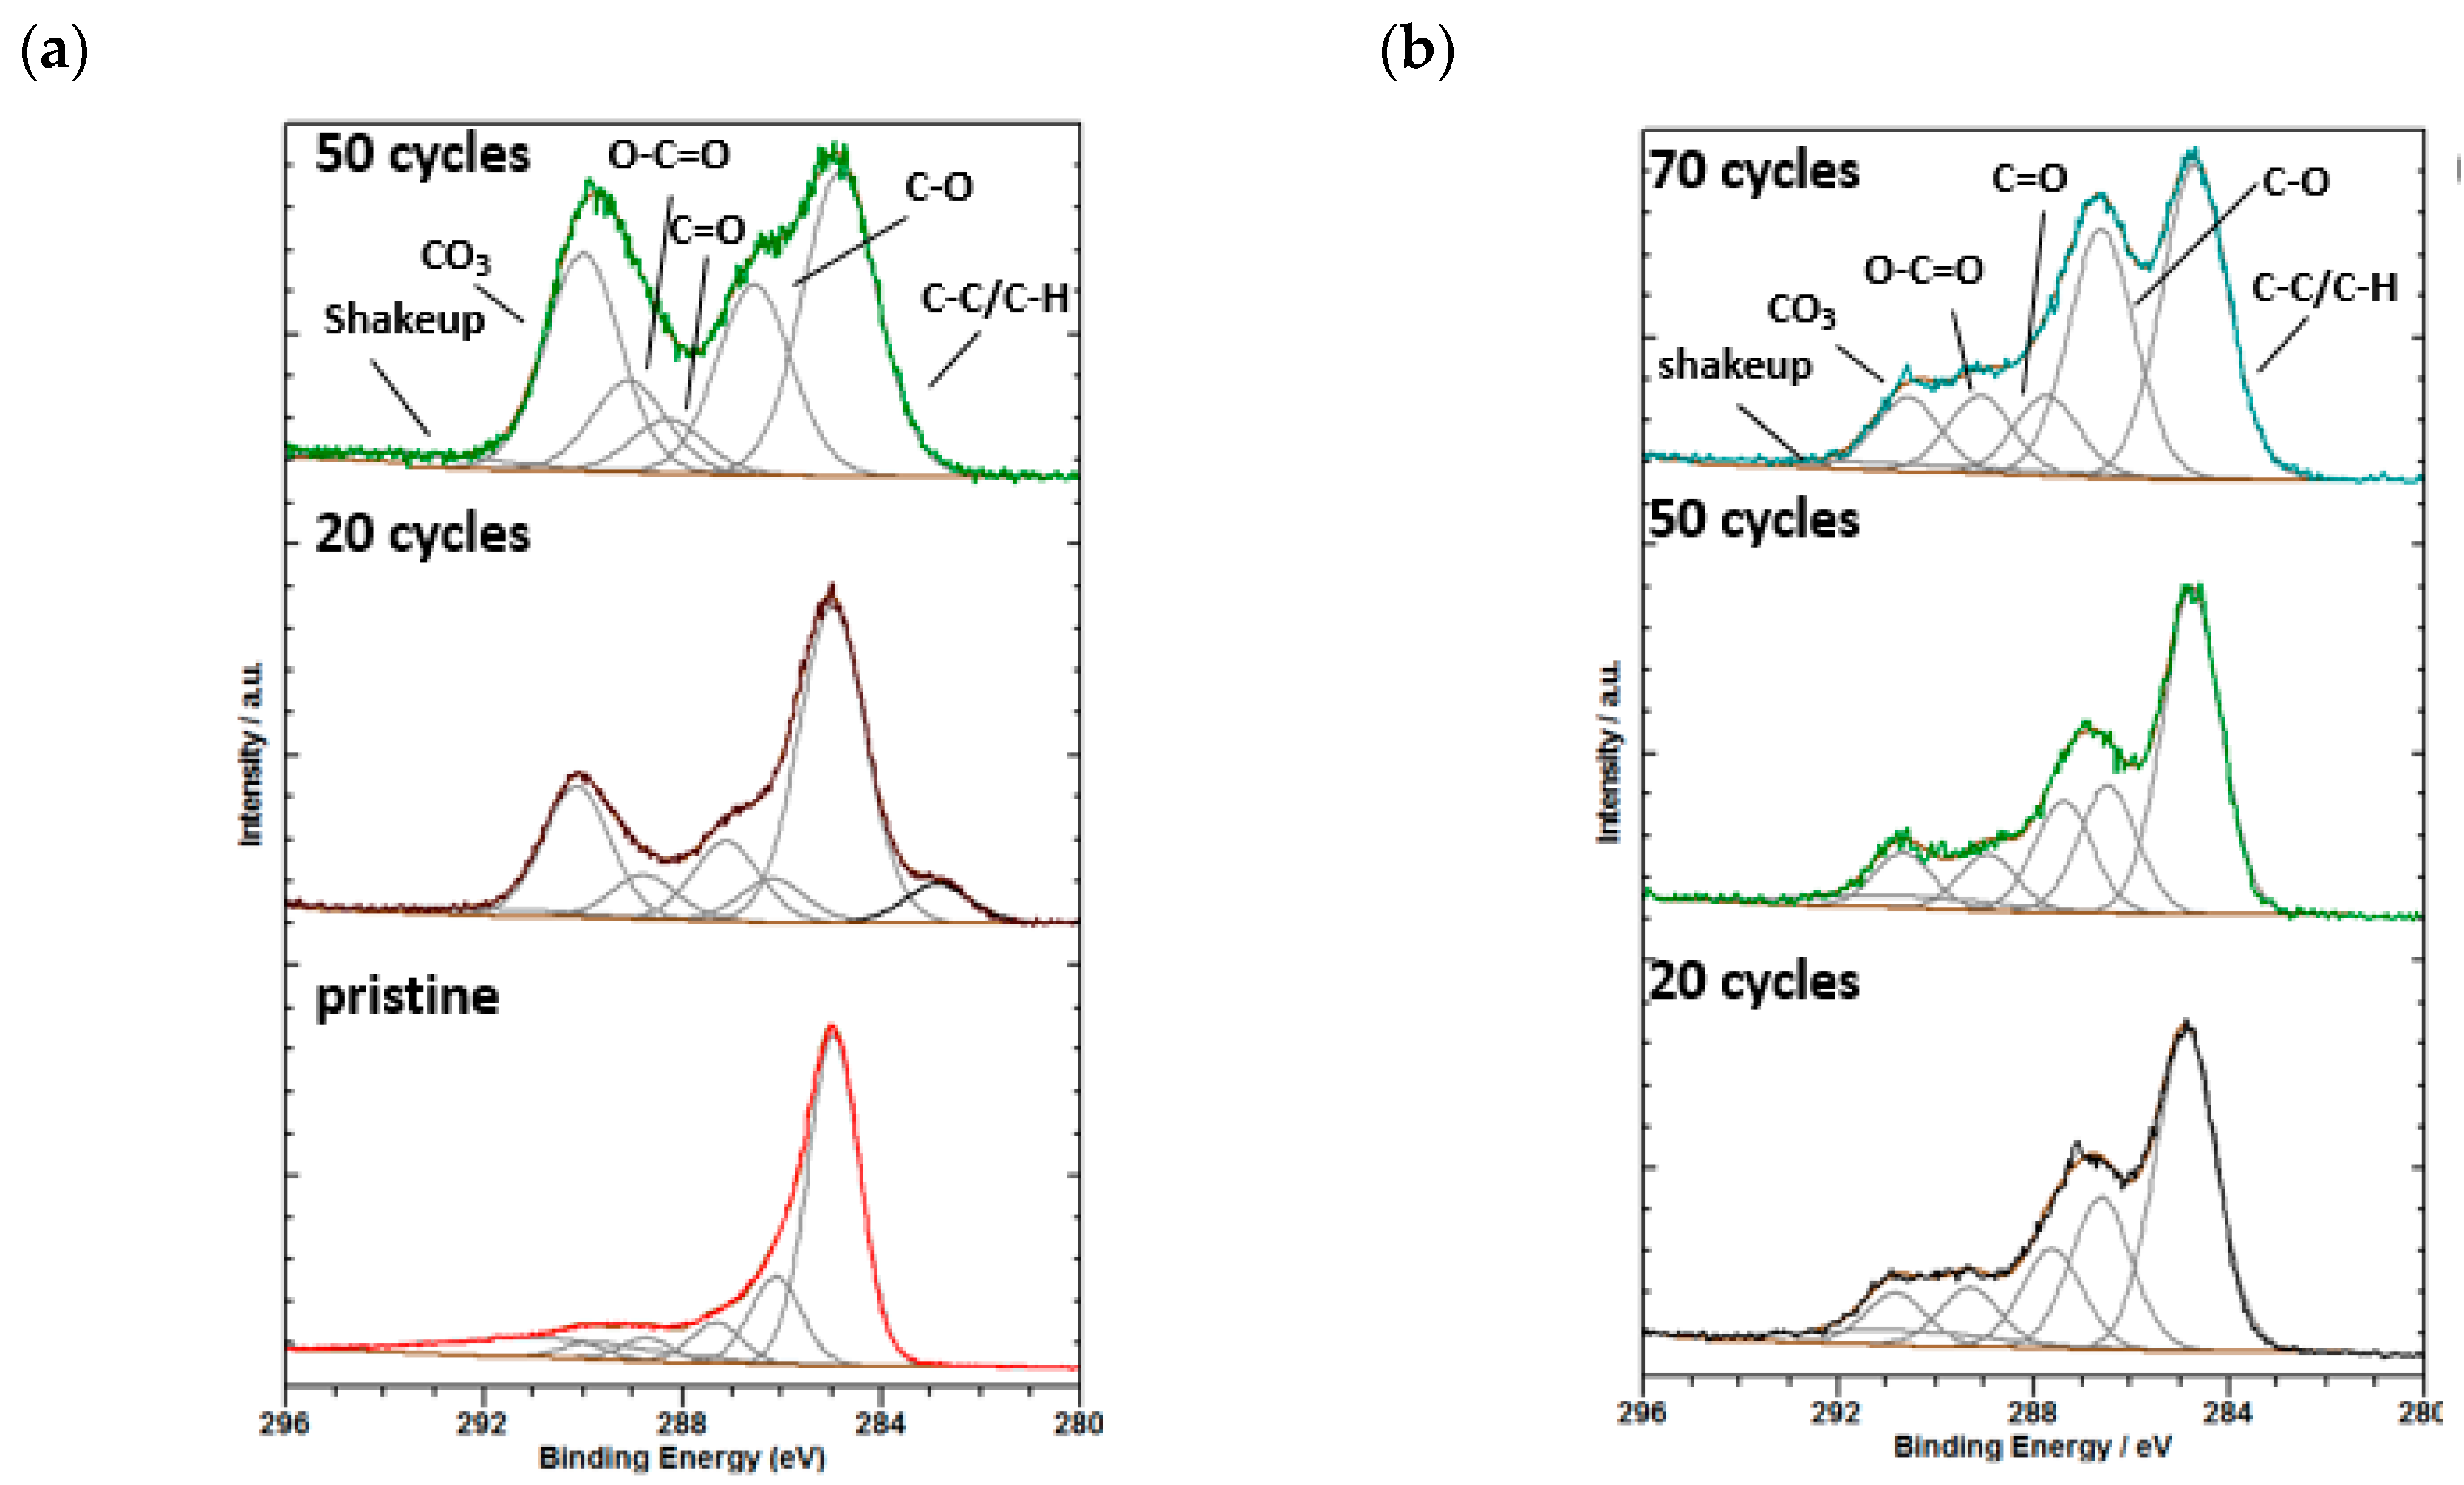
2.3. XPS Analysis of SEI Modification on Si/MC Electrodes

XPS analyses were performed on etched Si/MC electrodes cycled in VC-containing and VC-free electrolytes for a better understanding of the composition of the SEI layer, the changes occurring in the SEI layer during cycling, and their correlation with the irreversible capacity losses during cycling. The same analysis was also conducted on a pristine electrode for comparison.
The C1s spectra of the pristine and cycled electrodes after 20 and 50 cycles (Figure 7a) show five distinct peaks. The large peak at 284.9 eV can be assigned to C–C and C–H bonds derived from the carbon substrate. The peak at 286.3 eV is the characteristic of C–O/C–N, while those at 287.5 eV, 289 eV, and 290.0 eV can be attributed to C=O, O–C=O and CO3, respectively. In addition, a shakeup peak could be evidenced around 291.0 eV for all samples and a small contribution, possibly from carbides (282.9 eV), was detected after 20 cycles. The component at 290.0 eV reveals the decomposition of species such as lithium carbonate Li2CO3, and/or ROCO2Li on the electrode surface which is shown to increase after cycling.
The C1s spectra of Si/MC electrodes with VC-containing electrolytes after 20, 50, and 70 cycles (Figure 7b) also consist of five different peaks, C–C/C–H (284.9), C–O/C–N (286.5 eV), C=O (287.6 eV), O–C=O (289.4 eV), CO3 (289.1 eV), and an additional shake-up peak around 291 eV. While the C–C/C–H content does not differ significantly between samples, C–O/C–N varies from around 30 at% for 70 cycles to 17 at% for 50 cycles. Lucht et.al. reported that the SEI from VC on Si nanoparticles is dominated by lithium carbonate with low concentrations of poly(VC), lithium alkyl carbonates, LiF and LixPFyOz [16]. In comparison to the electrode with VC-free electrolyte, the SEI layer on the electrodes working with VC-containing electrolyte is more stable. The addition of 5 wt% VC additive can suppress the continuous formation of SEI layers on Si/MC electrodes; this explains why our sample with VC exhibits lower irreversible capacity losses after several cycles (Figure 6).

2.4. Long Cycling Performance

Long cycling performance for the Si/MC electrodes (etched and non-etched, with and without VC) can be seen in Figure 8. The non-etched electrode without VC additive shows an initial discharge capacity of 3793 mAhg−1 and charge capacity to 727 mAhg−1 after 50 cycles. It is shown that the capacity decreases over the first few cycles which can be assigned to (i) electrolyte decomposition to form the SEI layer at the electrode surface and (ii) large volumetric changes during alloying and de-alloying. The volume changes in Si-based anodes during cycling has been known to lead to progressive pulverization and electric contact loss, causing capacity fading as well as potentially catastrophic failure. In addition, the volume changes cause cracks which may electrochemically isolate individual particles, thus, facilitating continuous SEI leading to decreased capacity. The etched Si/MC electrode without VC shows an initial discharge capacity of 3944 mAhg−1 and charge capacity of 672 mAhg−1 after 100 cycles. The improved electrochemical performance of the etched Si/MC electrode can be due to the formation of additional pores after HF etching. Furthermore, the etched Si/MC electrode with VC-containing electrolyte showed much improved electrochemical performance with a charge capacity of 793 mAh g−1 and coulombic efficiency of 99.88% even after 400 cycles.
The as-prepared Si/MC electrode in a VC-containing electrolyte shows improvement compared to the literature-reported Si/C electrodes prepared from phenolic resin as the carbon source [5,6,11,12]. Taking into account that the Si content in the etched sample was 17.30 wt% while the ratio of the composites in the electrode was 75 wt%, we note that the ratio of Si nanoparticles in the prepared Si/MC electrode was 12.98 wt%, close to the reported threshold value. The enhanced electrochemical performance of the as-prepared Si/MC electrodes can be explained as follows: (i) the content of Si in the Si/MC composites is quite close to the threshold value as reported by Dash et al. [13]; (ii) HF etching removed the native oxide layers from the surface and increased the surface area and porosity of the composites; (iii) the formation of a stable SEI layer was ensured by using VC as electrolyte additive. However, the irreversible capacity loss in the first cycle is relatively high due to the high specific surface area of the Si/MC composites; this can be a challenge for anode/cathode (N/P) balancing in a full cell.

3. Materials and Methods

3.1. Si/MC Composites Preparation

Resorcinol (6.089 g, Merck KGaA) and formaldehyde solution (8.964 g, Merck Schuchardt OHG) were used for preparing mesoporous carbon. As formaldehyde was used as a precursor, the reaction rate would have been too slow at low pH. Therefore, the pH value was controlled in the range of 6.5–7.4 by using NH3 (5 vol%, Carl Path GmbH). The solution was put into a sealed vial, while the temperature was kept at 85 °C to obtain a gel. Afterward, Si nanoparticles with particle sizes of 30–50 nm and specific surface areas of 70–80 m2g−1 (1.170 g, Nanostructured and Amorphous Materials Inc.) were dispersed in it. The gel was dried under vacuum overnight. The resulting dried powder was carbonized at 650 °C for 10 h under Ar to produce Si/MC composites. The pyrolysis step transformed the organic gel into a pure carbon structure by removing remaining oxygen- and hydrogen-containing groups at an elevated temperature. The temperature of 650 °C was chosen to adjust the specific surface area of carbon. The as-prepared powder was mixed using a ball mill for 10 mins for better homogenization. The obtained samples were immersed in 1 M HF (Merck KGaA) solution for 1 h. Afterward, the powders were filtered, rinsed with distilled H2O to remove any HF, and dried at 120 °C for 24 h in an oven.

3.2. Material Characterization

The crystalline structure of the synthesized Si/MC composites was analyzed by X-ray diffraction (XRD) using a Panalytical X’PERT (PRO) POWDER–diffractometer with Cu-Kα radiation (λ = 1.5418Å). The surface morphology of the samples was observed using scanning electron microscopy (SEM, FEI/Philips XL-30 Field Emission ESEM) coupled with an energy dispersive X-ray (EDX) spectroscopy. To get information on the inner structure of the particles, a focused ion beam (FIB) was used to prepare a thin cross-section of the electrode. TEM analysis was carried out on a FEI Tecnai F20 TEM/STEM. N2 adsorption–desorption isotherms were measured using a Quantachrome Instruments Autosorb iQ (US). Thermal gravimetric analysis (TGA) was conducted on an STA429 C/PC-PFEIFFER VACUUM TGA-7 analyzer (NETZSCH-Gerätebau GmbH, Germany) in ambient atmosphere from 20 °C to 1100 °C with a heating rate of 5 °C min−1.

3.3. Electrochemical Characterization

The Si/MC composites (75 wt%), Super C45 (15 wt%, Timcal) and polyacrylic acid (PAA, 10 wt%, Sigma Aldrich) were mixed and dissolved in N-methyl-2-pyrrolidone (NMP, Sigma Aldrich). The slurry was coated onto a 0.01 mm Cu foil current collector. After drying at 80 °C in air, the coated electrode was pressed at 120 °C and cut into 15 mm diameter discs to form working electrodes. The thickness of the active material layer was (0.04 ± 0.002) mm. The areal loading of Si/MC composites and Si in the electrode was 3.50 mg·cm−2 and 0.45 mg·cm−2, respectively. The electrodes were dried under vacuum at 60 °C for 2 h, then at 120 °C for 4 h. 2032 type coin cells were assembled in an argon filled glove box (MBRAUN), using Li metal as a counter electrode, and separators made by Freudenberg. The electrolyte was 1 M LiPF6 in a mixture of ethylene carbonate (EC) and dimethyl carbonate (DMC) (1:1 by volume) with and without 5 wt% VC. The electrolyte and the VC additive were purchased from Sigma Aldrich and used as received. The galvanostatic charge/discharge tests were performed at room temperature with a Maccor Series 4000 battery tester in the potential range of (0.005–1.0) V vs. Li/Li+ using constant current-constant voltage (CCCV) mode. The electrodes were first lithiated at a current of C/20 and then kept at 50 mV until the current dropped to a value of 10% of the current applied during the discharge for the respective C-rate. Then, the electrodes were delithiated at C/20 until a 1 V cut off voltage was reached. Thereafter, the C/10 rate was applied for the following cycles.

3.4. XPS Analysis

X-ray photoelectron spectroscopy (XPS) was performed on a SPECS XP-spectrometer equipped with a monochromatized Al-Kα (1486.6 eV) X-ray source (μFocus 350) and a hemispherical WAL-150 analyzer (acceptance angle: 60°, Source angle: 30° to sample surface normal, analyzer angle: 51° to sample-surface normal). Pass energies of 100 eV and 30 eV and energy resolutions of 1 eV and 100 meV were used for survey and detail spectra, respectively. Beam energy and spot size were set to 70 W onto 400 μm. Base pressure in the system was 6 × 10⁻¹⁰ mbar, rising to 2 × 10⁻⁹ mbar during measurements. Data analysis was carried out using CASA XPS software, employing transmission corrections (as per the instrument vendor’s specifications), Shirley/Tougaard backgrounds [23], and Scofield sensitivity factors [24].

4. Conclusions

Silicon/mesoporous carbon (Si/MC) composites with an enhanced electrochemical performance were prepared by dispersing Si nanoparticles in phenolic resin, followed by pyrolysis and subsequent HF etching. The etching process was proven to reduce the SiO2 native layer on the Si nanoparticles, resulting in increased porosity—i.e., 26.56% in comparison to the non-etched composite material. The electrodes with a Si content of 12.98 wt% exhibited an excellent reversible capacity of ~793 mAhg−1 with an average coulombic efficiency of ~99 % after more than 400 cycles. XPS analysis shows the SEI layer on the electrodes working with VC-containing electrolyte is more stable than without the VC, which is consistent with the electrochemical tests showing that the electrode with VC-containing electrolyte exhibits better capacity retention. It can be concluded that the synthesized material exhibits enhanced electrochemical performance due to the optimal Si content in the Si/MC composites, the formation of additional pores after HF etching, and the use of VC as an electrolyte additive.

Author Contributions

A.R. designed and conducted the experiments, analyzed data, and wrote the main manuscript; H.V. analyzed data for BET and reviewed the manuscript; R.H. conducted XRD and TG analysis; M.S. and A.F. conducted XPS analysis and analyzed data; C.T. and H.K. contributed to scientific discussions.

Funding

The authors gratefully acknowledge the European Commission for its support of the Marie Curie program through the ITN EMVeM project (GA 315967).

Conflicts of Interest

The authors declare no conflict of interest.

References

  1. Zuo, X.; Zhu, J.; Müller-Buschbaum, P.; Cheng, Y.-J. Silicon based lithium-ion battery anodes: A chronicle perspective review. Nano Energy 2017, 31, 113–143. [Google Scholar] [CrossRef] [Green Version]
  2. Yi, R.; Zai, J.; Dai, F.; Gordin, M.L.; Wang, D. Dual conductive network-enabled graphene/Si–C composite anode with high areal capacity for lithium-ion batteries. Nano Energy 2014, 6, 211–218. [Google Scholar] [CrossRef]
  3. Park, K.-S.; Min, K.-M.; Seo, S.-D.; Lee, G.-H.; Shim, H.-W.; Kim, D.-W. Self-supported multi-walled carbon nanotube-embedded silicon nanoparticle films for anodes of Li-ion batteries. Mater. Res. Bull. 2013, 48, 1732–1736. [Google Scholar] [CrossRef]
  4. Usui, H.; Wasada, K.; Shimizu, M.; Sakaguchi, H. TiO2/Si composites synthesized by sol–gel method and their improved electrode performance as Li-ion battery anodes. Electrochim. Acta 2013, 111, 575–580. [Google Scholar] [CrossRef]
  5. Wang, M.S.; Fan, L.Z. Silicon/carbon nanocomposite pyrolyzed from phenolic resin as anode materials for lithium-ion batteries. J. Power Sources 2013, 244, 570–574. [Google Scholar] [CrossRef]
  6. Yue, L.; Zhang, W.; Yang, J.; Zhang, L. Designing Si/porous-C composite with buffering voids as high capacity anode for lithium-ion batteries. Electrochim. Acta 2014, 125, 206–217. [Google Scholar] [CrossRef]
  7. Deng, J.; Ji, H.; Yan, C.; Zhang, J.; Si, W.; Baunack, S.; Oswald, S.; Mei, Y.; Schmidt, O.G. Naturally Rolled-Up C/Si/C Trilayer Nanomembranes as Stable Anodes for Lithium-Ion Batteries with Remarkable Cycling Performance. Angew. Chem. 2013, 125, 2382–2386. [Google Scholar] [CrossRef]
  8. Bogart, T.D.; Oka, D.; Lu, X.; Gu, M.; Wang, C.; Korgel, B.A.; Al, B.E.T. Lithium Ion Battery Peformance of Silicon Nanowires with Carbon Skin. ACS Nano 2014, 8, 915–922. [Google Scholar] [CrossRef]
  9. Zhu, S.; Zhu, C.; Ma, J.; Meng, Q.; Guo, Z.; Yu, Z.; Lu, T.; Li, Y.; Zhang, D.; Lau, W.M. Controlled fabrication of Si nanoparticles on graphene sheets for Li-ion batteries. RSC Adv. 2013, 3, 6141. [Google Scholar] [CrossRef] [Green Version]
  10. Ren, J.-G.; Wu, Q.-H.; Hong, G.; Zhang, W.-J.; Wu, H.; Amine, K.; Yang, J.; Lee, S.-T. Silicon-Graphene Composite Anodes for High-Energy Lithium Batteries. Energy Technol. 2013, 1, 77–84. [Google Scholar] [CrossRef]
  11. Park, J.; Kim, G.-P.; Nam, I.; Park, S.; Yi, J. One-pot synthesis of silicon nanoparticles trapped in ordered mesoporous carbon for use as an anode material in lithium-ion batteries. Nanotechnology 2013, 24, 025602. [Google Scholar] [CrossRef] [PubMed]
  12. Xu, Y.; Zhu, Y.; Wang, C. Mesoporous carbon/silicon composite anodes with enhanced performance for lithium-ion batteries. J. Mater. Chem. A 2014, 2, 9751–9757. [Google Scholar] [CrossRef]
  13. Dash, R.; Pannala, S. Theoretical Limits of Energy Density in Silicon-Carbon Composite Anode Based Lithium Ion Batteries. Sci. Rep. 2016, 6, 27449. [Google Scholar] [CrossRef] [PubMed] [Green Version]
  14. Peled, E.; Menkin, S. Review—SEI: Past, Present and Future. J. Electrochem. Soc. 2017, 164, A1703–A1719. [Google Scholar] [CrossRef] [Green Version]
  15. Martin, L.; Martinez, H.; Ulldemolins, M.; Pecquenard, B.; Le Cras, F. Evolution of the Si electrode/electrolyte interface in lithium batteries characterized by XPS and AFM techniques: The influence of vinylene carbonate additive. Solid State Ionics 2012, 215, 36–44. [Google Scholar] [CrossRef]
  16. Nguyen, C.C.; Lucht, B.L. Comparative Study of Fluoroethylene Carbonate and Vinylene Carbonate for Silicon Anodes in Lithium Ion Batteries. J. Electrochem. Soc. 2014, 161, A1933–A1938. [Google Scholar] [CrossRef]
  17. Soto, F.A.; Ma, Y.; Martinez De La Hoz, J.M.; Seminario, J.M.; Balbuena, P.B. Formation and Growth Mechanisms of Solid-Electrolyte Interphase Layers in Rechargeable Batteries. Chem. Mater. 2015, 27, 7990–8000. [Google Scholar] [CrossRef]
  18. Rezqita, A.; Sauer, M.; Foelske, A.; Kronberger, H.; Trifonova, A. The effect of electrolyte additives on electrochemical performance of silicon/mesoporous carbon (Si/MC) for anode materials for lithium-ion batteries. Electrochim. Acta 2017, 247, 600–609. [Google Scholar] [CrossRef]
  19. Hassan, F.M.; Chabot, V.; Elsayed, A.R.; Xiao, X.; Chen, Z. Engineered Si electrode nanoarchitecture: A scalable postfabrication treatment for the production of next-generation Li-ion batteries. Nano Lett. 2014, 14, 277–283. [Google Scholar] [CrossRef]
  20. Fang, Y.; Lv, Y.Y.; Che, R.C.; Wu, H.Y.; Zhang, X.H.; Gu, D.; Zheng, G.F.; Zhao, D.Y. Two-Dimensional Mesoporous Carbon Nanosheets and Their Derived Graphene Nanosheets: Synthesis and Efficient Lithium Ion Storage. J. Am. Chem. Soc. 2013, 135, 1524–1530. [Google Scholar] [CrossRef]
  21. Journal, F. High Resolution XPS of Organic Polymers: The Scienta ESCA300 Database. Cell 2016, 164, 591–592. [Google Scholar]
  22. Naumkin, A.V.; Kraut-Vass, A.; Gaarenstroom, S.W.; Powell, C.J. NIST X-ray Photoelectron Spectroscopy Database; Version 4.1; National Institute of Standards and Technology (NIST): Gaithersburg, MD, USA, 2012. [Google Scholar]
  23. Shirley, D.A. High-resolution x-ray photoemission spectrum of the valence bands of gold. Phys. Rev. B 1972, 5, 4709–4714. [Google Scholar] [CrossRef]
  24. Scofield, J.H. Hartree-Slater subshell photoionization cross-sections at 1254 and 1487 eV. J. Electron Spectrosc. Relat. Phenom. 1976, 8, 129–137. [Google Scholar] [CrossRef]
Figure 1. (a) XRD patterns and (b) N2 adsorption/desorption isotherms of Si/MC composites before and after etching.
Batteries 05 00011 g001
Figure 2. SEM images of Si/MC composites before (a) and after (b) etching, TEM images of the Si/MC composites before (c) and after (d) etching.
Batteries 05 00011 g002
Figure 3. XPS survey spectra of Si/MC powders before (blue) and after HF etching (red). Blue-marked areas show the regions used for quantification as shown in Table.
Batteries 05 00011 g003
Figure 4. Normalised (a) C 1s and (b) Si 2p XPS detail spectra of Si/MC before and after HF etching. Dashed lines indicate the positions of different C/O components. SiO2 signals are shown in dark blue/red, all others in dark grey.
Batteries 05 00011 g004
Figure 5. TGA curves of Si/C composites before and after etching.
Batteries 05 00011 g005
Figure 6. Potential vs. specific capacity profiles of Si/MC electrodes: Etched and non-etched (a), without and with VC (b) at 1st, 20th, and 50th cycles in the potential range of 1 and 0.005 V vs Li/Li+.
Batteries 05 00011 g006
Figure 7. (a) C1s detail spectra of pristine and cycled electrodes without VC-containing electrolytes after 20 and 50 cycles and (b) Si/MC electrodes with VC-containing electrolytes after 20, 50, and 70 cycles.
Batteries 05 00011 g007
Figure 8. Influence of the HF etching and of VC addition onto the long cycling performance of the Si/MC electrodes. Potential range: 1–0.005 V vs. Li/Li+ at C/10.
Batteries 05 00011 g008
Table 1. Overview of literature data on Si/carbon (Si/C) materials prepared from phenolic resin as a carbon source: Si content, hydrofluoric acid (HF) etching, electrolyte, and electrochemical performance.
ElectrodesSi ContentHF EtchingElectrolyteElectrochemical Performance
Si/C nanocomposites42 wt%No1M LiPF6 in EC: DEC: DMC (1:1:1 by volume)initial reversible capacity of 904 mAhg−1 and a high capacity retention of 75% after 50 cycles at a current density of 100 mA g−1 [5]
Si/porous-C36.2 wt%Yes1 M in LiPF6 EC/DEC/DMC (1:1:1 by volume)a reversible capacity of 980 mAh g−1 over 80 cycles at a current density of 100 mA g−1 [6]
Si/OMC82 wt%Yes1 M LiPF6 in EC:DEC (1:1 by weight)reversible capacity above 700 mAh g−1 during 50 cycles at 2 A g−1 [11]
Mesoporous C/Si composite76 wt%No1 M LiPF6 in a mixture of FEC:DMC (1:1 by volume)specific capacity of 1018 mAh g−1 after 100 cycles at a current density of 500 mA g−1 [12]
Silicon/mesoporous carbon (Si/MC)12.98 wt%Yes1 M LiPF6 in EC and DMC (1:1 by volume) with 5 wt% VCreversible capacity of ~793 mAhg−1 with an average coulombic efficiency of ~99 % after more than 400 cycles [this study]
Table 2. Surface and porous parameters of Si/MC composites.
SampleSBET (m2/g)Micropore Surface Area (m2/g)Mesopore Surface Area (m2/g)Vtotal (cm3/g)Vmicro (cm3/g)Vmeso (cm3/g)
before etching481.88461.0920.790.3050.1790.126
after etching530.23486.5943.640.3860.1920.194
Table 3. Relative C, O, and Si contents (in %) from XPS elemental survey measurements (see also Figure 3) on Si/MC samples before and after HF etching.
SampleElement (at%)
COSi
before etching85.311.63.2
after etching87.210.22.6
Table 4. Relative abundance (at%) and possible assignments of the components found in XPS Si 2p detail spectra of Si/MC powder samples before and after HF etching.
SampleComponent (at%)
SiSiOx/Si3N4SiO2
before etching20.311.068.6
after etching35.65.858.6

