Article

Effects of Boron-Incorporation in a V-Containing Zr-Based AB2 Metal Hydride Alloy

1
Department of Mechanical Engineering, Wayne State University, Detroit, MI 48202, USA
2
BASF/Battery Materials—Ovonic, 2983 Waterview Drive, Rochester Hills, MI 48309, USA
3
Department of Chemical Engineering and Materials Science, Wayne State University, Detroit, MI 48202, USA
*
Author to whom correspondence should be addressed.
Batteries 2017, 3(4), 36; https://doi.org/10.3390/batteries3040036
Submission received: 23 September 2017 / Revised: 23 October 2017 / Accepted: 25 October 2017 / Published: 14 November 2017
(This article belongs to the Special Issue Nickel Metal Hydride Batteries 2017)

Abstract

:
In this study, boron, a metalloid element commonly used in semiconductor applications, was added in a V-containing Zr-based AB2 metal hydride alloy. In general, as the boron content in the alloy increased, the high-rate dischargeability, surface exchange current, and double-layer capacitance first decreased and then increased whereas charge-transfer resistance and dot product of charge-transfer resistance and double-layer capacitance changed in the opposite direction. Electrochemical and gaseous phase characteristics of two boron-containing alloys, with the same boron content detected by the inductively coupled plasma optical emission spectrometer, showed significant variations in performances due to the difference in phase abundance of a newly formed tetragonal V3B2 phase. This new phase contributes to the increases in electrochemical high-rate dischargeability, surface exchange current, charge-transfer resistances at room, and low temperatures. However, the V3B2 phase does not contribute to the hydrogen storage capacities in either gaseous phase and electrochemical environment.

Graphical Abstract

1. Introduction

As energy storage devices, nickel/metal hydride (Ni/MH) batteries are important in consumer battery, transportation, and alternative energy-related stationary applications, and they are superior in operation temperature range and cycle life compared to the competing Li-ion batteries [1]. However, the specific energy of Ni/MH battery is lower than that of Li-ion battery, which has become the main research direction in the field [2]. Two commonly used stoichiometries in Ni/MH batteries are AB2 and AB5, where the A-site is occupied by larger elements with stronger affinities with hydrogen, and the B-site elements are relatively smaller and have the tendency to weaken the alloy’s average metal-hydrogen bond strength [3]. Nevertheless, flexibility in stoichiometry [4,5] and abundantly available secondary phases [6] in the AB2 metal hydride (MH) alloy allow for fine tailoring in chemical composition to fulfill the stringent demands from different applications. Among various types of AB2 MH alloys, one based on the C14 Laves phase—an intermetallic phase with an AB2 stoichiometry—is commonly used as the negative electrode active material of the Ni/MH battery [6]. Laves phases, named after Fritz Laves (1906–1978), have three different classes: a cubic MgCu2 (C15), a hexagonal MgZn2 (C14), and a dihexagonal MgNi2 (C36) [7]. Although the theoretical hydrogen storage of C15 phase is higher than that in the C14 phase (6.33 vs. 7 per AB2 formula) [8], C14 alloy was used in the first commercially built electric vehicle (EV-1 by General Motor, Detroit, MI, USA) due to its large capacity and superior cycle stability over C15 phase. Typical A-site elements in the C14 MH alloy are Ti and Zr, while B-site elements are mainly Ni with a small percentage of V, Cr, Mn, and Co. Contribution of each element can be found in a recently published review article [6]. C14 Laves phase-based AB2 MH alloy showed a reversible hydrogen storage (H-storage) capacity up to 2.1 wt % [9] and an electrochemical discharge capacity reaching 436 mAh·g−1 [10], which provides a pathway to narrow the gap in specific energy between Ni/MH and the rival Li-ion battery technologies. While most of the substitution studies on the AB2 MH alloys were performed with transition metals with metallic natures similar to other constituent elements (Zr and Ni), the number of studies with non-transition metals, especially non-metals, is very limited [6].
Boron, a non-transition metal, was doped into a body-centered-cubic MH alloy and demonstrated the capability of decreasing the alloy’s hydrogen absorption kinetics [11]. Moreover, a study in which potassium boride was added to a Ti-based AB2 MH alloy revealed that boron, not potassium, is responsible for the increase in electrochemical capacity [12]. In terms of electrochemical cycling stability, boron was a beneficial additive in the La–Mg–Ni-based superlattice MH alloy system [13]. In a Zr-based AB2 MH alloy, boron reduced the unit cell volume and decreased the reaction kinetics of hydrogen absorption with the increase in incorporation [14]. However, adding boron in a Zr-based V-free AB2 alloy expanded the unit cell volume and lowered the gaseous phase desorption pressure whereas the gaseous phase and electrochemical capacities were both reduced [15]. Therefore, as an additive, boron’s functions in the AB2 MH alloys are not clear and warrant further evaluation. In this study, boron is added in a Zr-based V-containing AB2 alloy to investigate its effects on structural, gaseous phase, and electrochemical properties.

2. Experimental Setup

Sample preparation began with a conventional melt-and-cast by placing the designated atomic proportionated raw materials into an Al2O3 crucible under a helium protective atmosphere with the induction melting furnace heating up and holding at 1500 °C for 5 min; an iron plate was later used for holding the melt for cooling. A hydriding/dehydriding process followed to pulverize the ingot into powder smaller than 200 mesh. The actual chemical composition of each sample was analyzed with a Varian Liberty 100 inductively coupled plasma optical emission spectrometer (ICP-OES, Agilent Technologies, Santa Clara, CA, USA). A Philips X'Pert Pro X-ray diffractometer (XRD, Philips, Amsterdam, The Netherlands) and a JEOL-JSM6320F scanning electron microscope (SEM, JEOL, Tokyo, Japan) with energy dispersive spectroscopy (EDS) capability were used for the phase identification, phase distribution, and phase composition studies. A Suzuki–Shokan multi-channel pressure–concentration–temperature (PCT, Suzuki Shokan, Tokyo, Japan) system was used for the gaseous phase H-storage study. A 2-h thermal cycle activation between room temperature (RT) and 300 °C under 2.5 MPa H2 pressure was conducted before the PCT measurements at 30, 60 and 90 °C. For the electrochemical measurements, −200 mesh alloy powder was compacted onto an expanded nickel mesh by applying 2 GPa pressure with a hydraulic press to form a negative electrode that was 1 cm2 in size and 0.2 mm thick. Half-cell testing performed with an Arbin BT2000 battery tester (Arbin, College Station, TX, USA) was used to measure electrochemical properties at RT with a 30 wt % KOH aqueous solution as the electrolyte and two pieces of sintered Ni(OH)2/NiOOH as the counter positive electrode. The system was charged at a current density of 50 mA·g−1 for 10 h and then discharged at a current density of 50 mA·g−1 until a cutoff voltage of 0.9 V was reached. Next, the system was discharged at a current density of 12 mA·g−1 until a cutoff voltage of 0.9 V was reached and again discharged at a current density of 4 mA·g−1 until a cutoff voltage at 0.9 V was reached [16,17]. AC impedance measurements were also performed to characterize the RT and low temperature (LT, −40 °C) electrochemical properties. Each negative electrode was first subjected to three full charge/discharge activation cycles, charged fully, and discharged to 80% state-of-charge at a 0.1 C rate with an Arbin BT2000 battery tester. A Solartron 1250 Frequency Response Analyzer (Solartron Analytical, Leicester, England) with a sine wave amplitude of 10 mV and a frequency range of 0.5 mHz to 10 kHz was then used to conduct the AC impedance measurements. Magnetic susceptibility (M) of the activated alloy powder surface (by immersing the alloy powder in a 30 wt % KOH solution at 100 °C for 4 h) was measured by a Digital Measurement Systems Model 880 vibrating sample magnetometer (MicroSense, Lowell, MA, USA).

3. Results and Discussion

3.1. Chemical Composition

A 2 kg induction melting furnace with an Al2O3 crucible was used to prepare six alloys (B0 to B5) with the design compositions of Ti12Zr21.5V10-0.4xCr7.5Mn8.1Co8Ni32.2-0.6xAl0.4Sn0.3Bx, where x is from 0 to 5. The base alloy (B0) was chosen because of its balanced performances in capacity, high-rate dischargeability (HRD), charge retention, and cycle stability, and was previously used as the base material in other substitution studies [18,19,20,21,22]. ICP results are compared with the design compositions in Table 1. For each design composition, the vanadium- and nickel-contents were reduced by 40% and 60% of the added boron content, respectively, to maintain the B/A ratio. Therefore, while 60% of boron was designed to occupy the A-site, 40% of boron was designed to occupy the B-site. Boron, with the highest melting point among the constituent elements (2076 °C), was dissolved (instead of melted) in the liquid during melting. The participation rate (ratio between the content in the final alloy and content in the raw materials) of boron decreases with the increase in the boron content, which results in the lower boron contents and B/A ratios in alloys B3 to B5 compared to the corresponding design values.
Average electron density (e/a), as calculated by averaging the numbers of outer-shell electrons of constituent elements, is a parameter used to predict the C14/C15 ratio in MH alloys [23,24,25]. In this study, e/a of 6.57 to 6.82 is designed to promote the formation of C14 over C15 [25]. The design e/a value decreases with the increase in the boron content due to boron’s relatively low number of outer-shell electrons (3) compared to the replaced vanadium (5) and nickel (10). Even with the increased deviation between the design and ICP result, as the boron content increases, the e/a values calculated from the ICP results do not deviate much from the design values since boron shows the largest deviation between the design and ICP result but has only three outer-shell electrons (two 2s and one 2p).

3.2. XRD Analysis

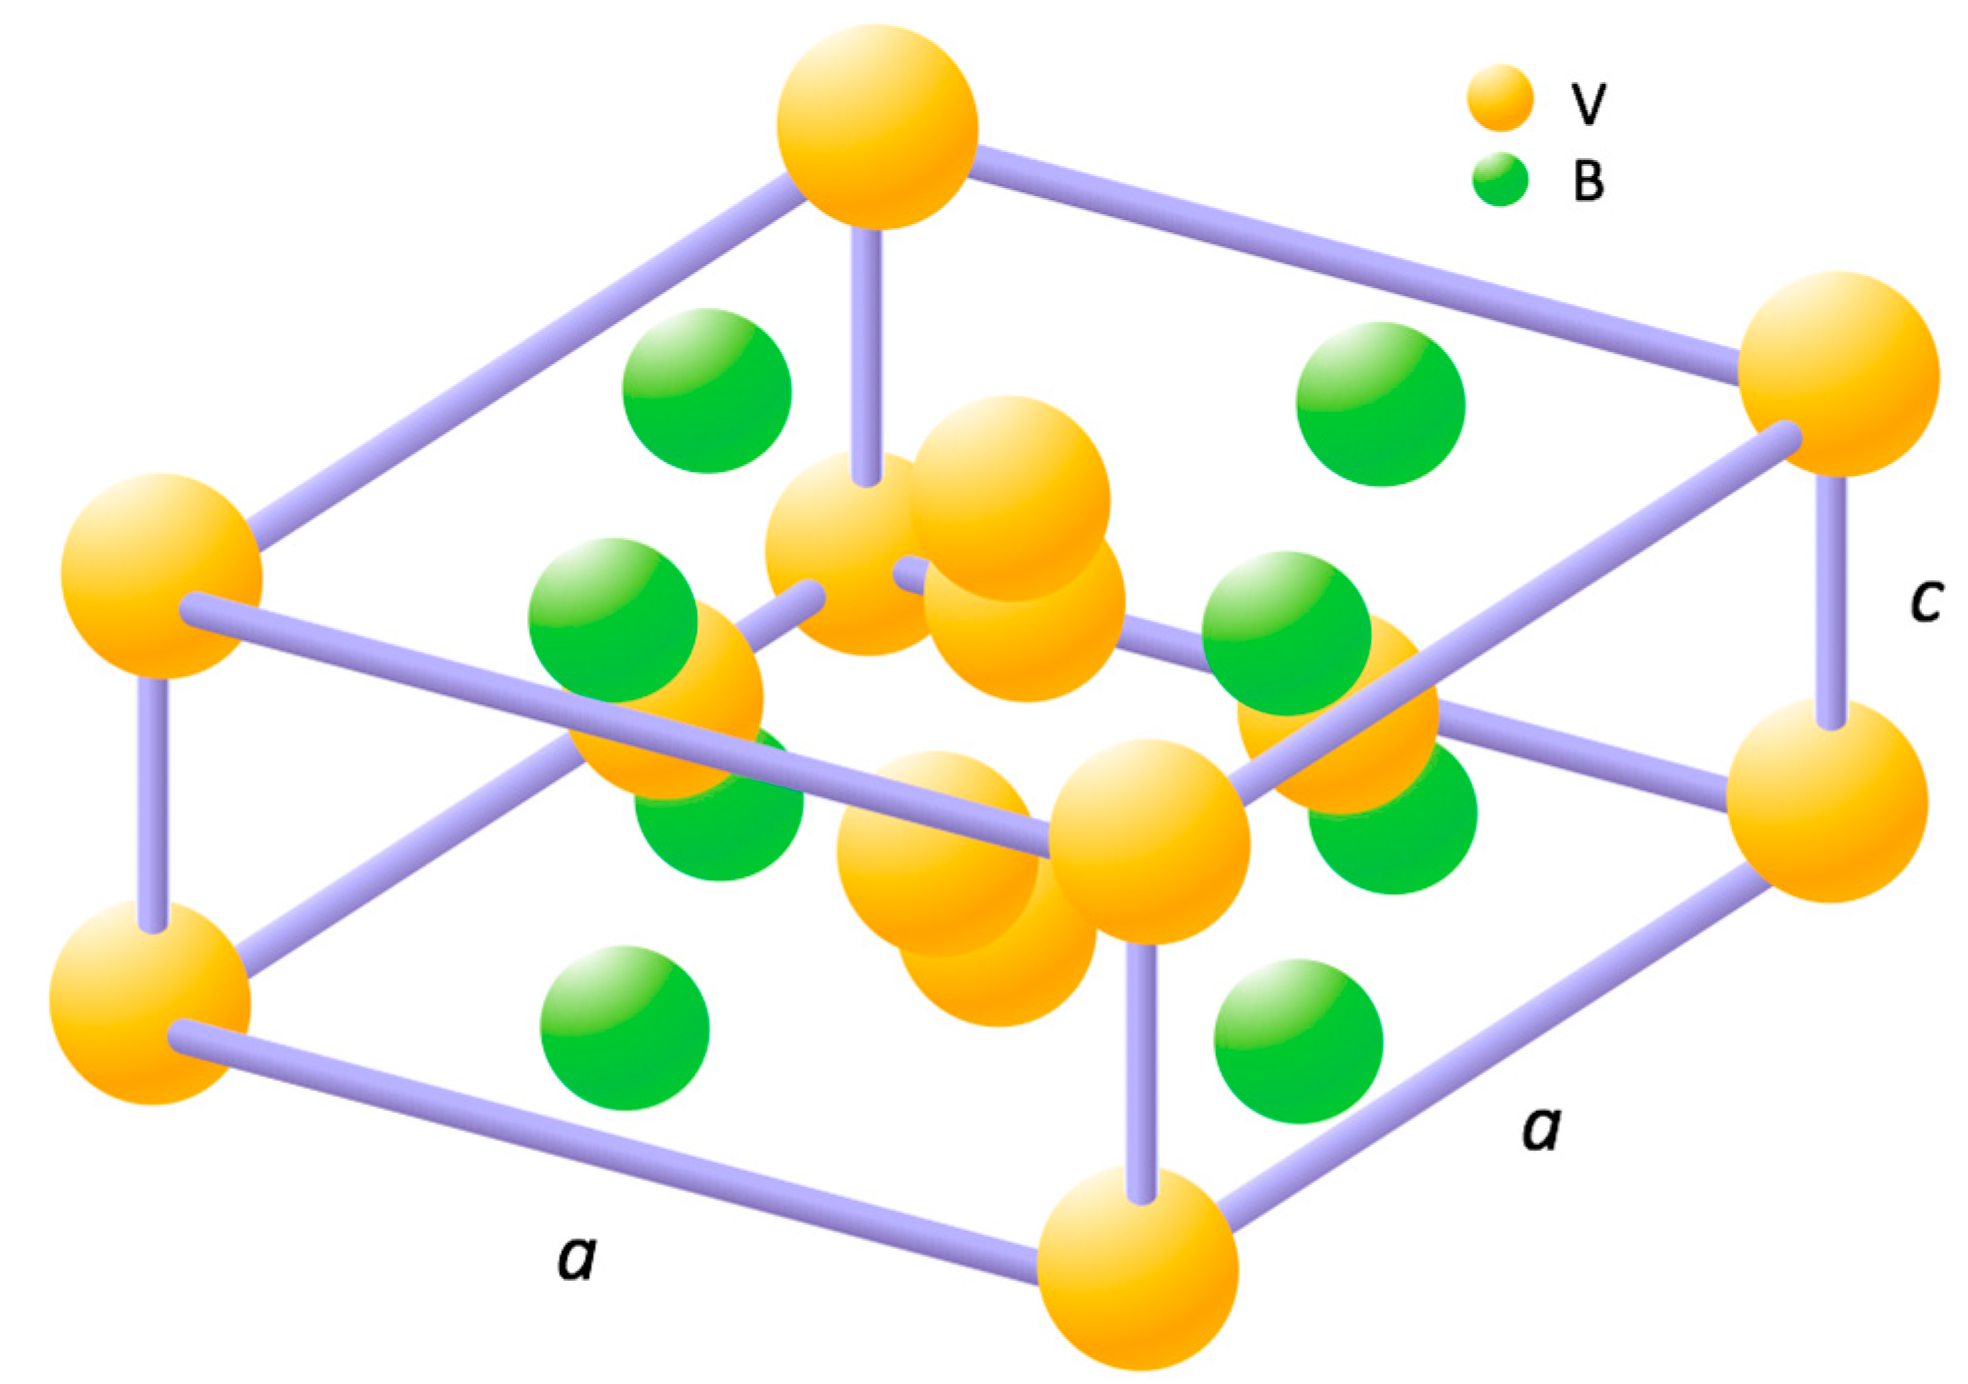
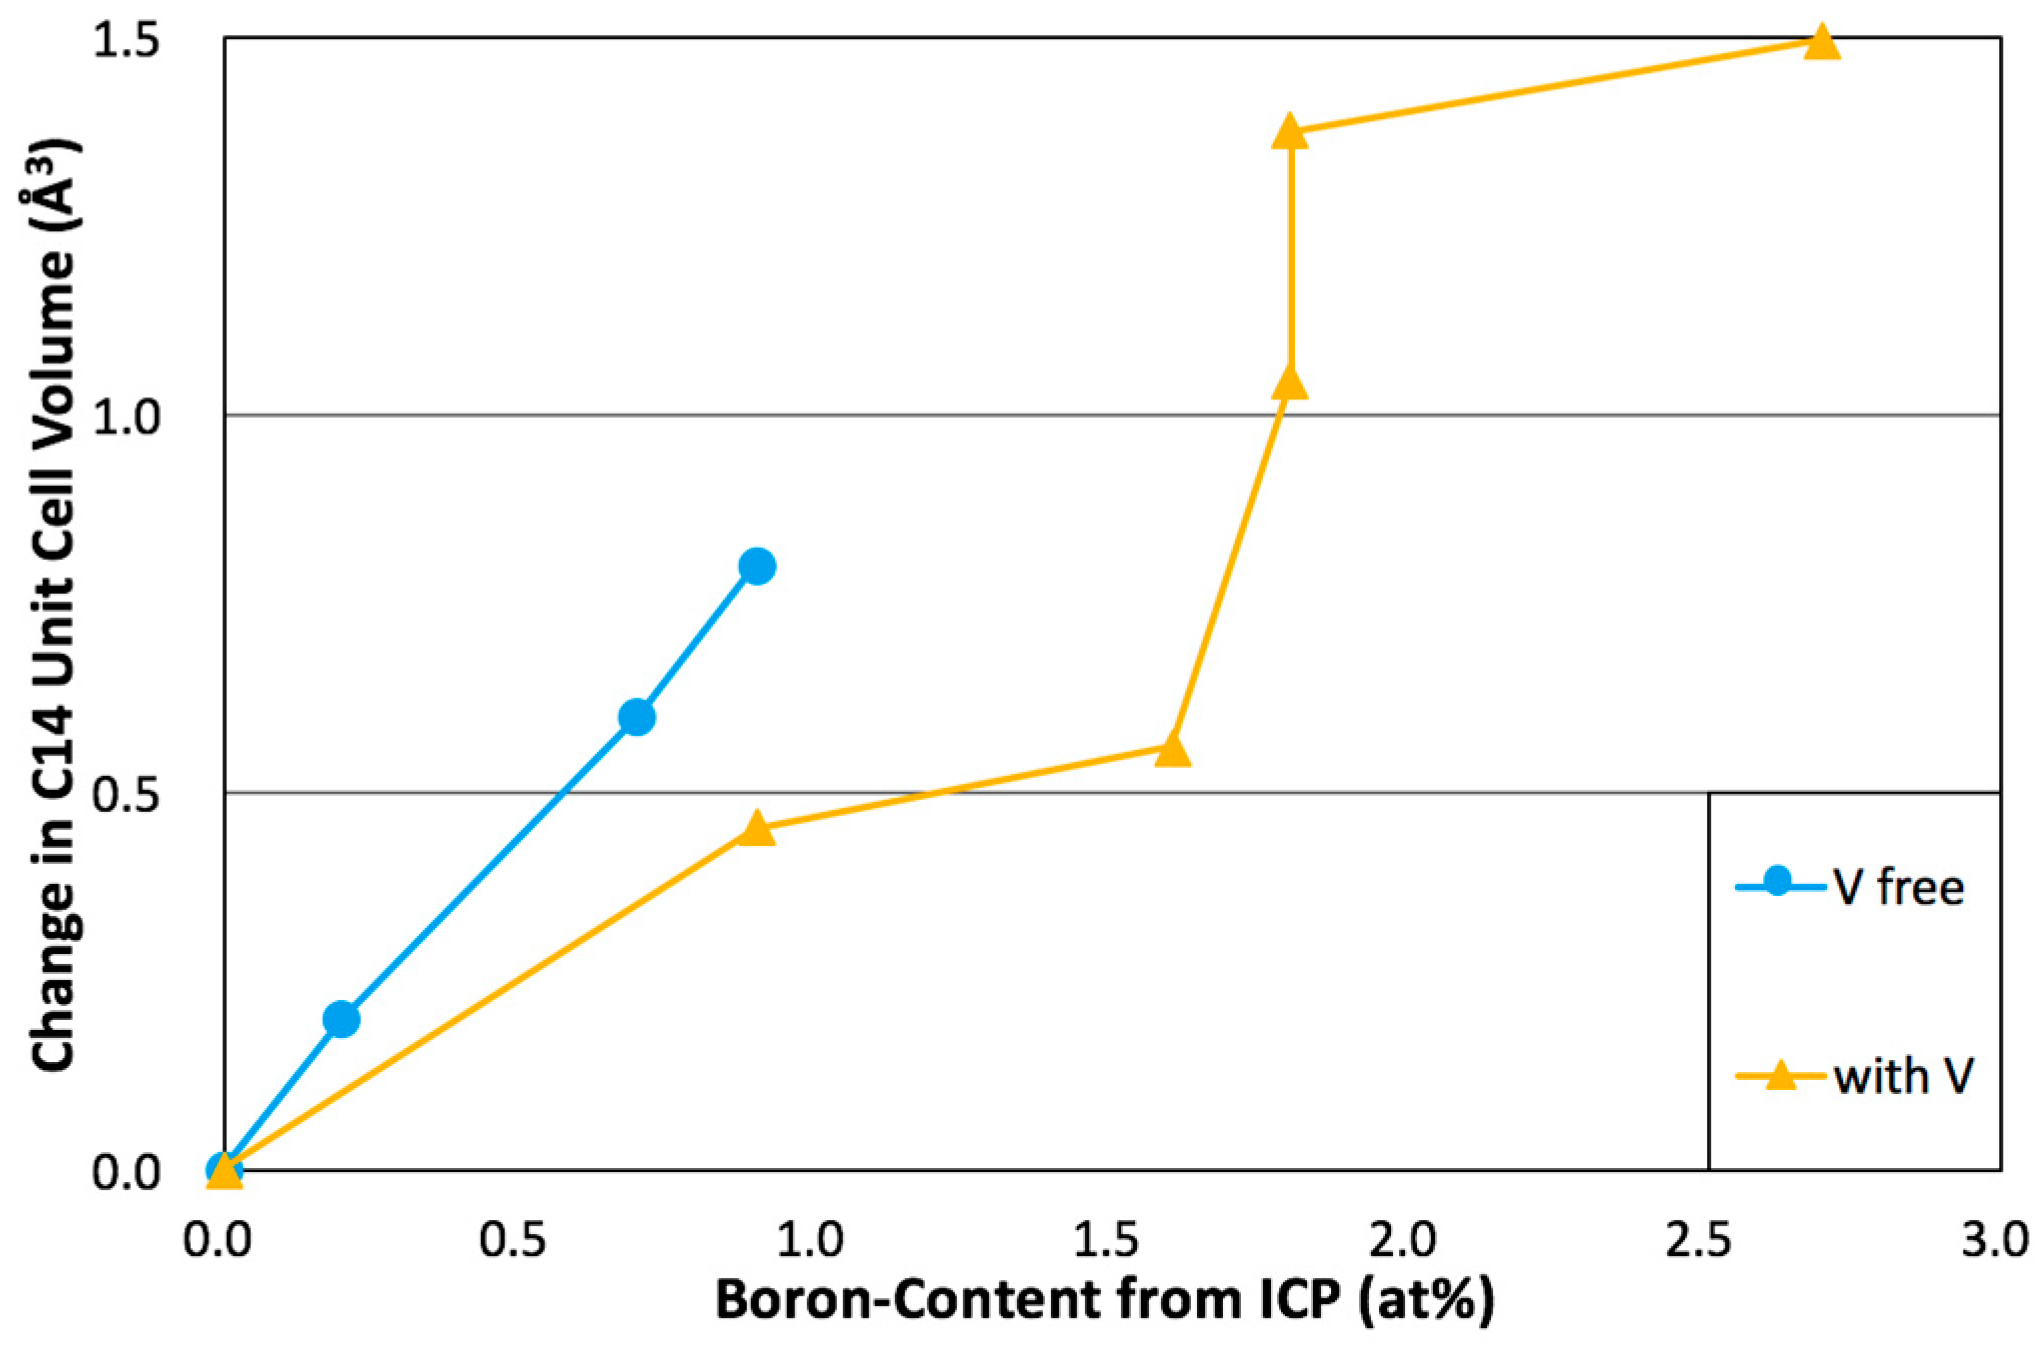
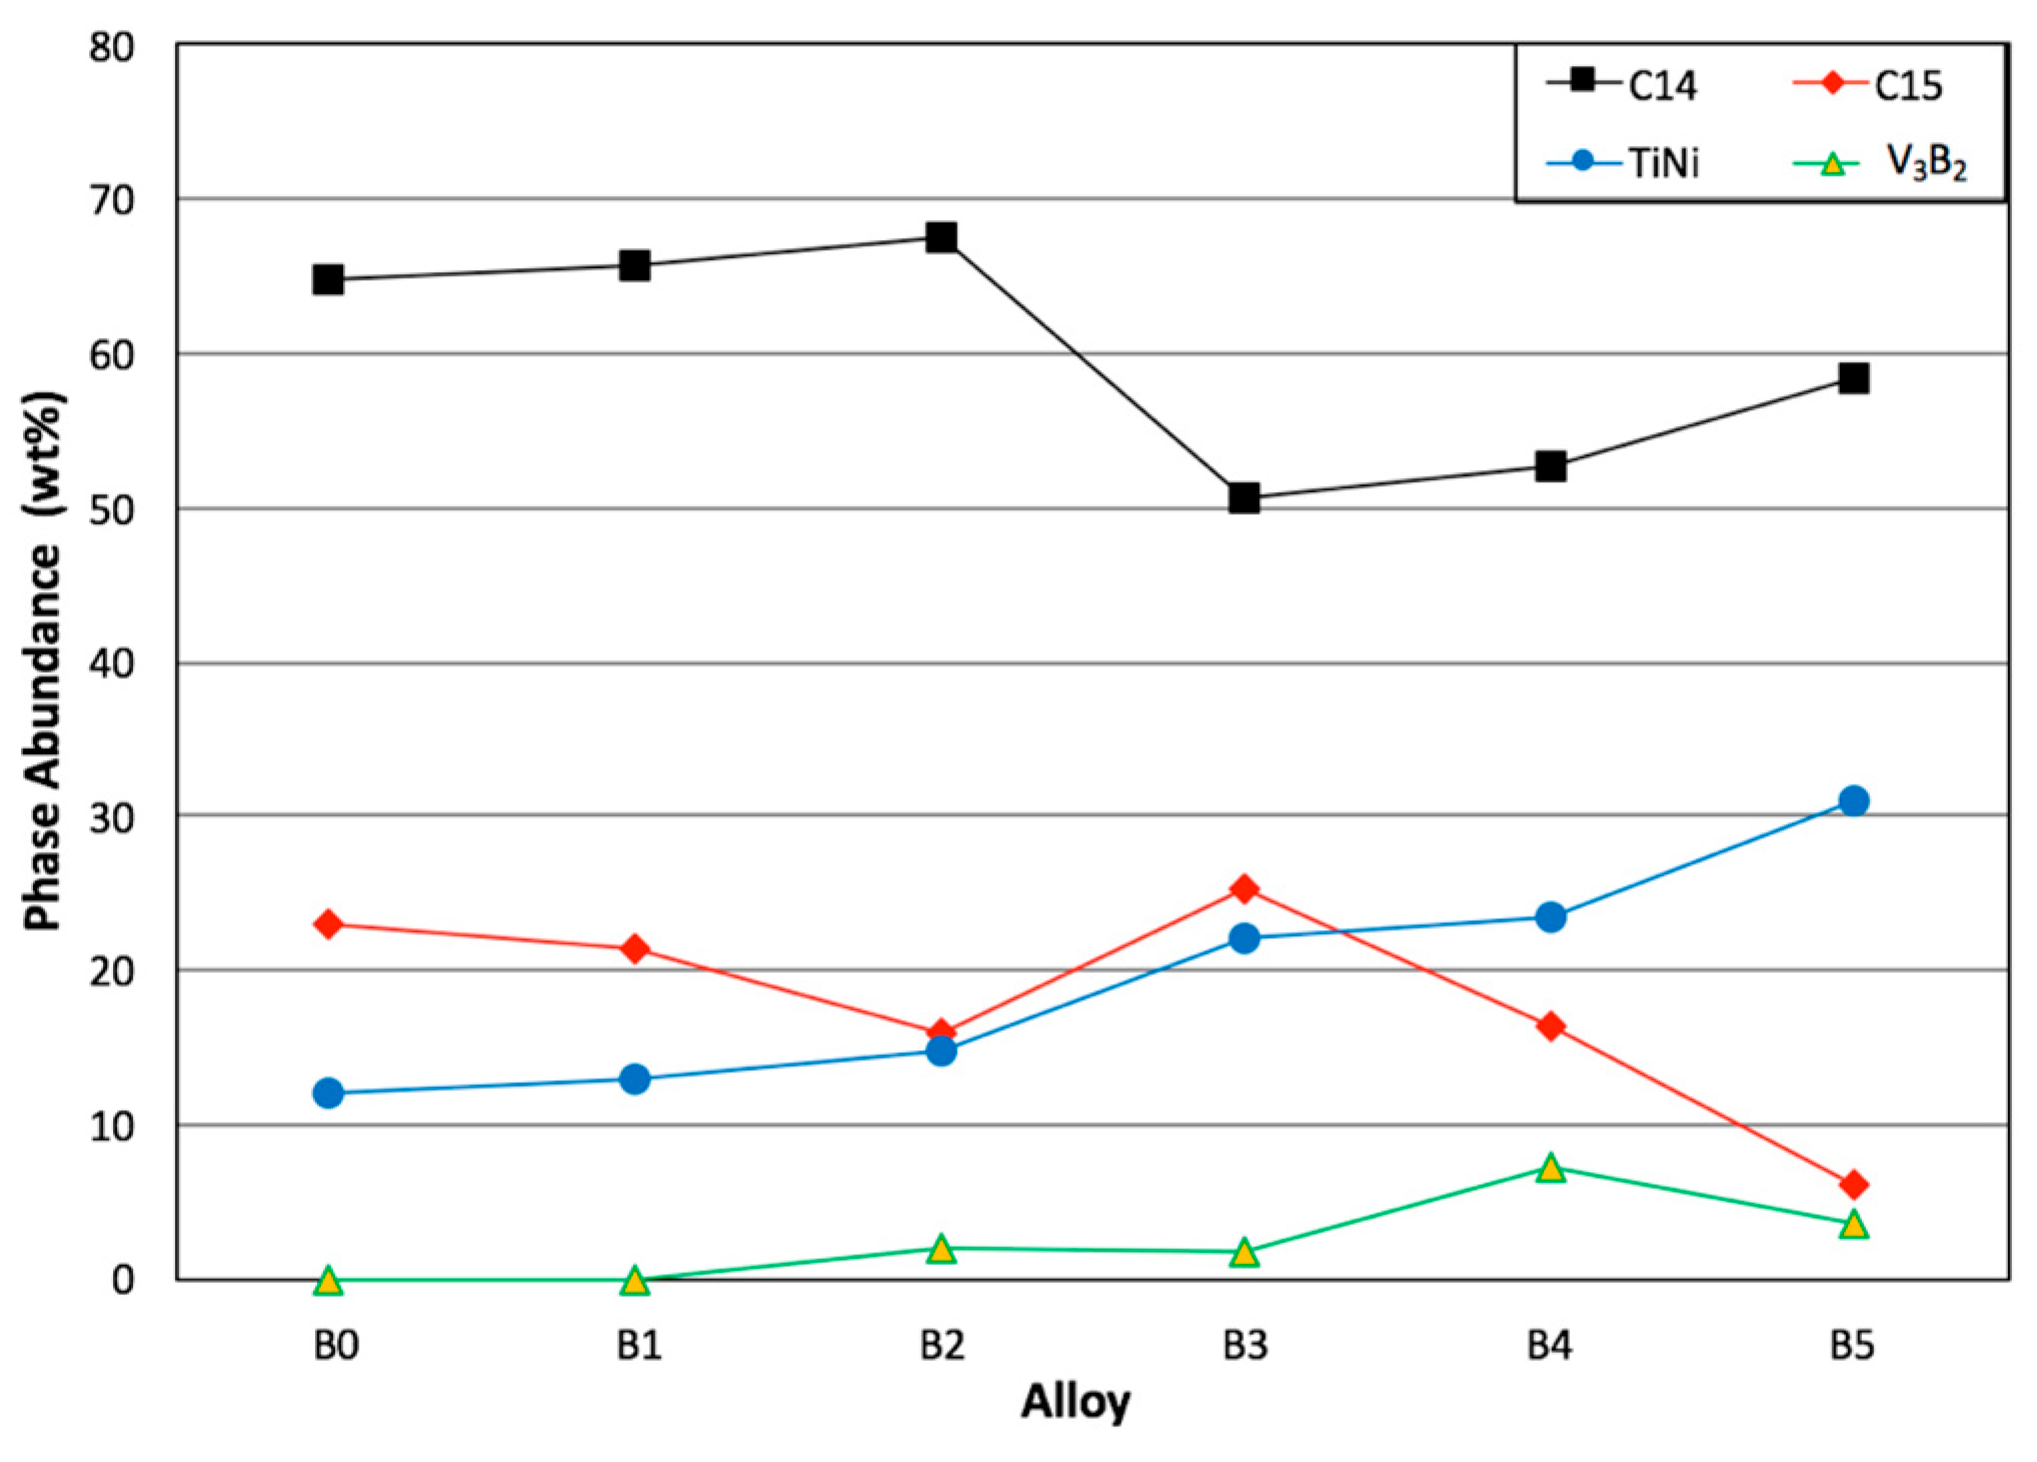
XRD was used to analyze the alloys’ structural characteristics, and the resulting patterns are shown in Figure 1. For the Laves phases, peaks from the hexagonal C14 and cubic C15 phases overlapped at several angles. A peak at around 41.5° is observed in each pattern and identified as the TiNi phase with a B2 cubic structure. Furthermore, a tetragonal phase is detected in most boron-containing alloys and assigned to the V3B2 phase with a tetragonal tP10 structure (Figure 2). Structure characteristics, such as lattice constants and phase abundances, were analyzed by the Jade 9.0 software (MDI, Livermore, CA, USA), and the results are listed in Table 2 and Table S1. With the increased boron concentration, the main peaks of the C14, C15, and TiNi phases shift to lower angles, indicating increases in lattice constants according to Bragg’s Law. For the C14 phase, both lattice constants a and c increase, and the a/c ratio decreases slightly, suggesting an anisotropic expansion in unit cell as the boron content increases. Although boron is the smallest among all constituent elements, the C14 unit cell expansion due to the addition of boron has been reported previously and attributed to the dumbbell model of two smaller atoms occupying one A-site, which causes an anisotropic unit cell expansion (lower a/c ratio) [4]. The C14 unit cell expansion in the current study is compared with that from a previous study on the boron substitution in a V-free AB2 alloy [15] in Figure 3, and it demonstrates that more boron can be incorporated in C14 of the V-free MH alloy (as shown by the higher rate of increase in the C14 unit cell vs. the boron content in the alloy) than that of the V-containing alloy because boron forms a new V3B2 secondary phase in the V-containing MH alloy. Moreover, lattice constants of the C15 and TiNi phases follow the increasing trend observed in the C14 phase as the boron content increases. It is possible that boron always enters a structure in pairs. Differently to the Laves and cubic TiNi phases, the V3B2 unit cell volume does not have a linear dependency with the boron content, and all are smaller than the reported value (100.17 Å3 from the JCPDF file [26]) because the mixed boron configuration is suspected to be in play, where a reduced unit cell indicates a single boron atom in the B-site, and an enlarged unit cell implies double boron atoms occupying the A-site in a dumbbell manner [27]. Rietveld refinement was used to obtain the constituent phase abundances from the XRD patterns, and the results are listed in Table S1 and illustrated in Figure 4. As the concentration of boron increases, the TiNi phase abundance increases at the expense of the Laves phase abundance monotonically, and the V3B2 phase starts to form.

3.3. SEM/EDS Analysis

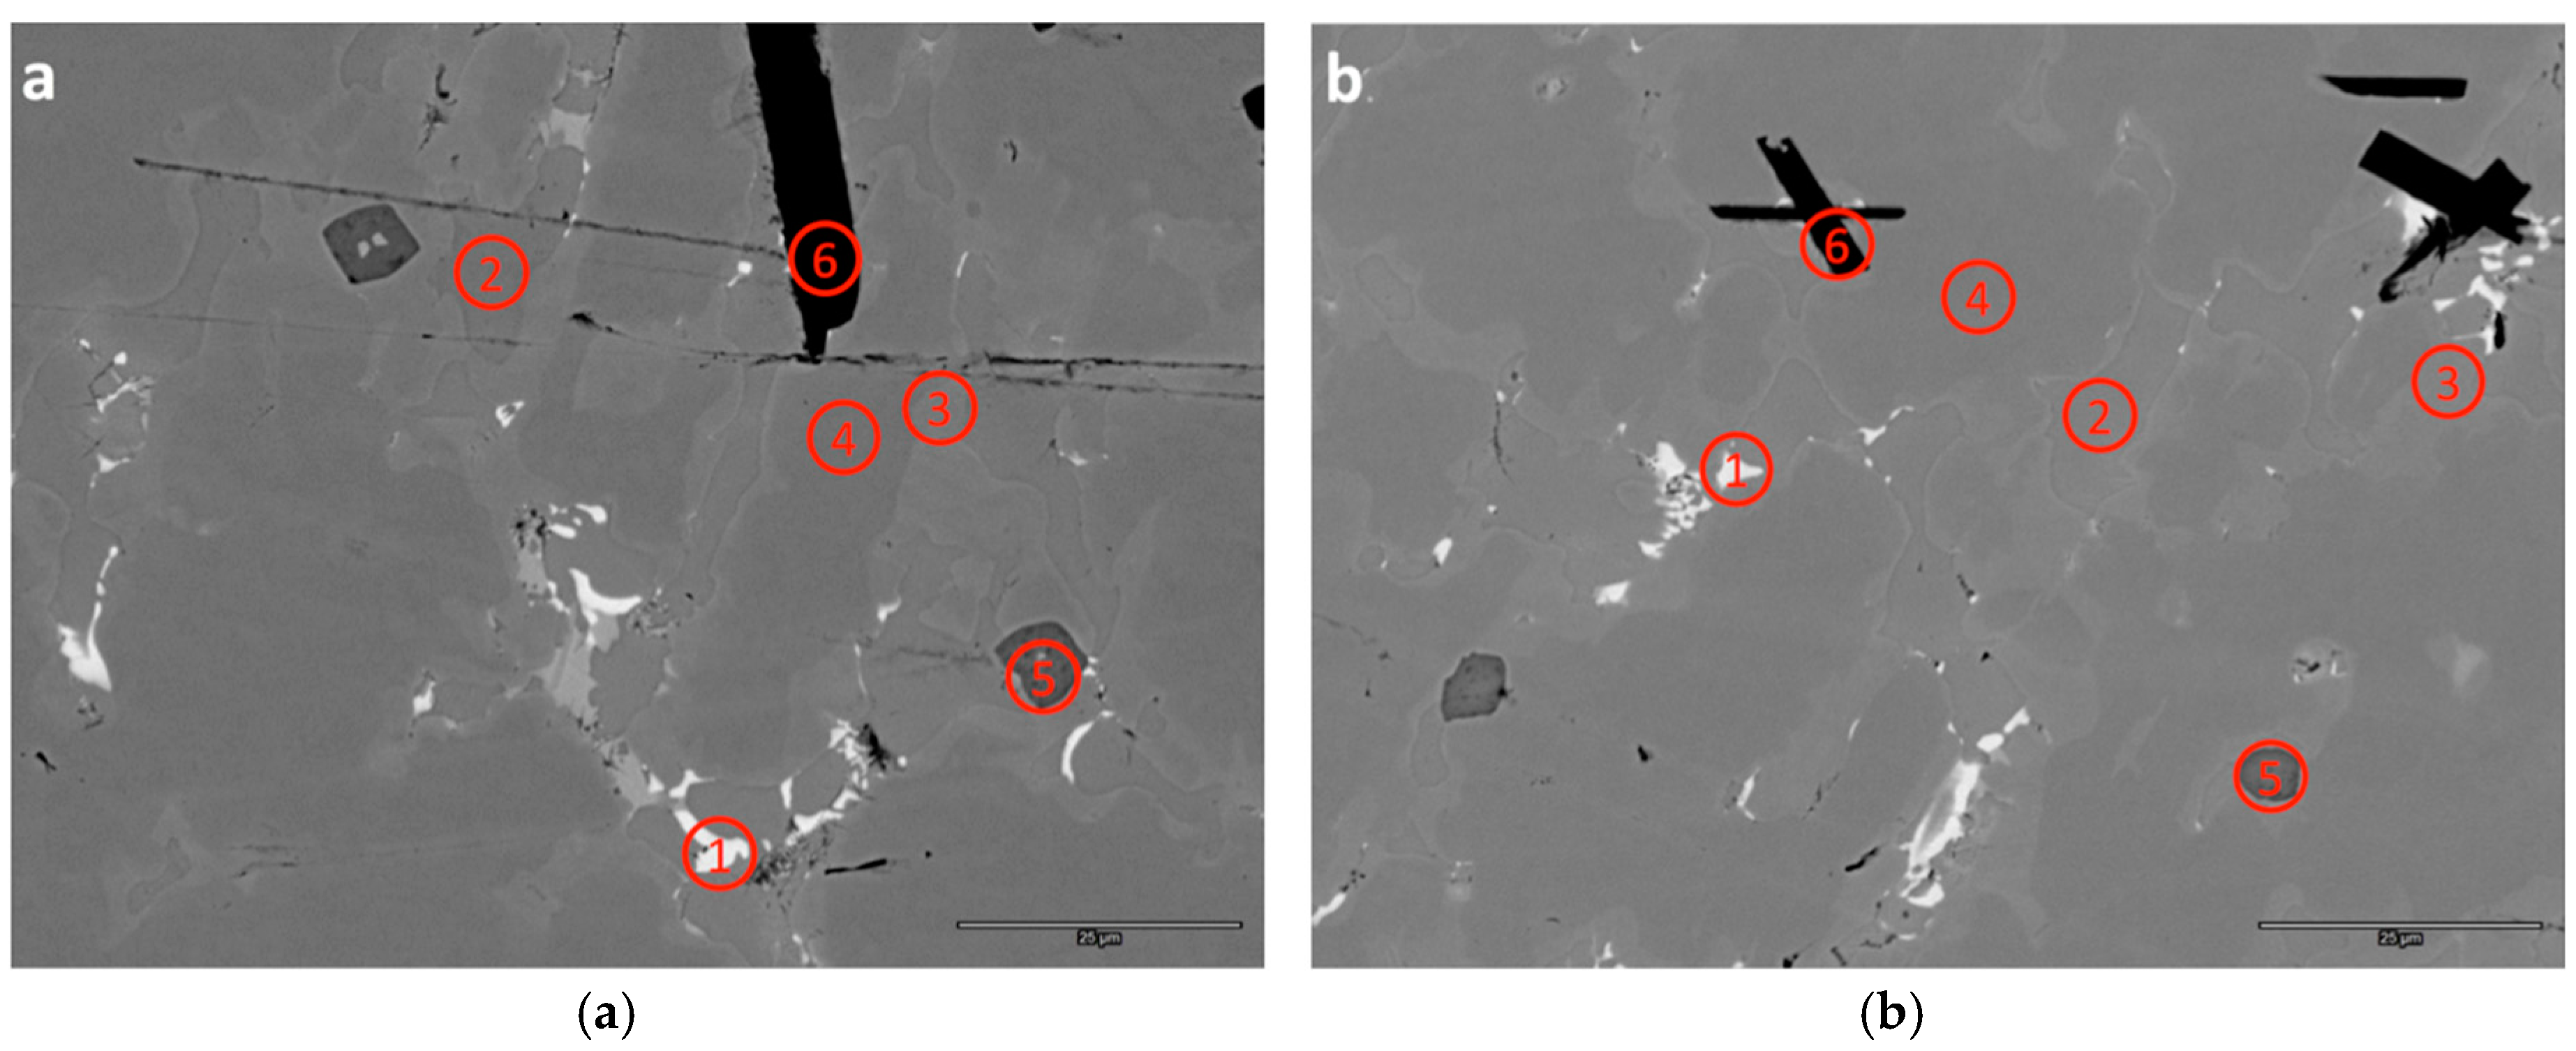
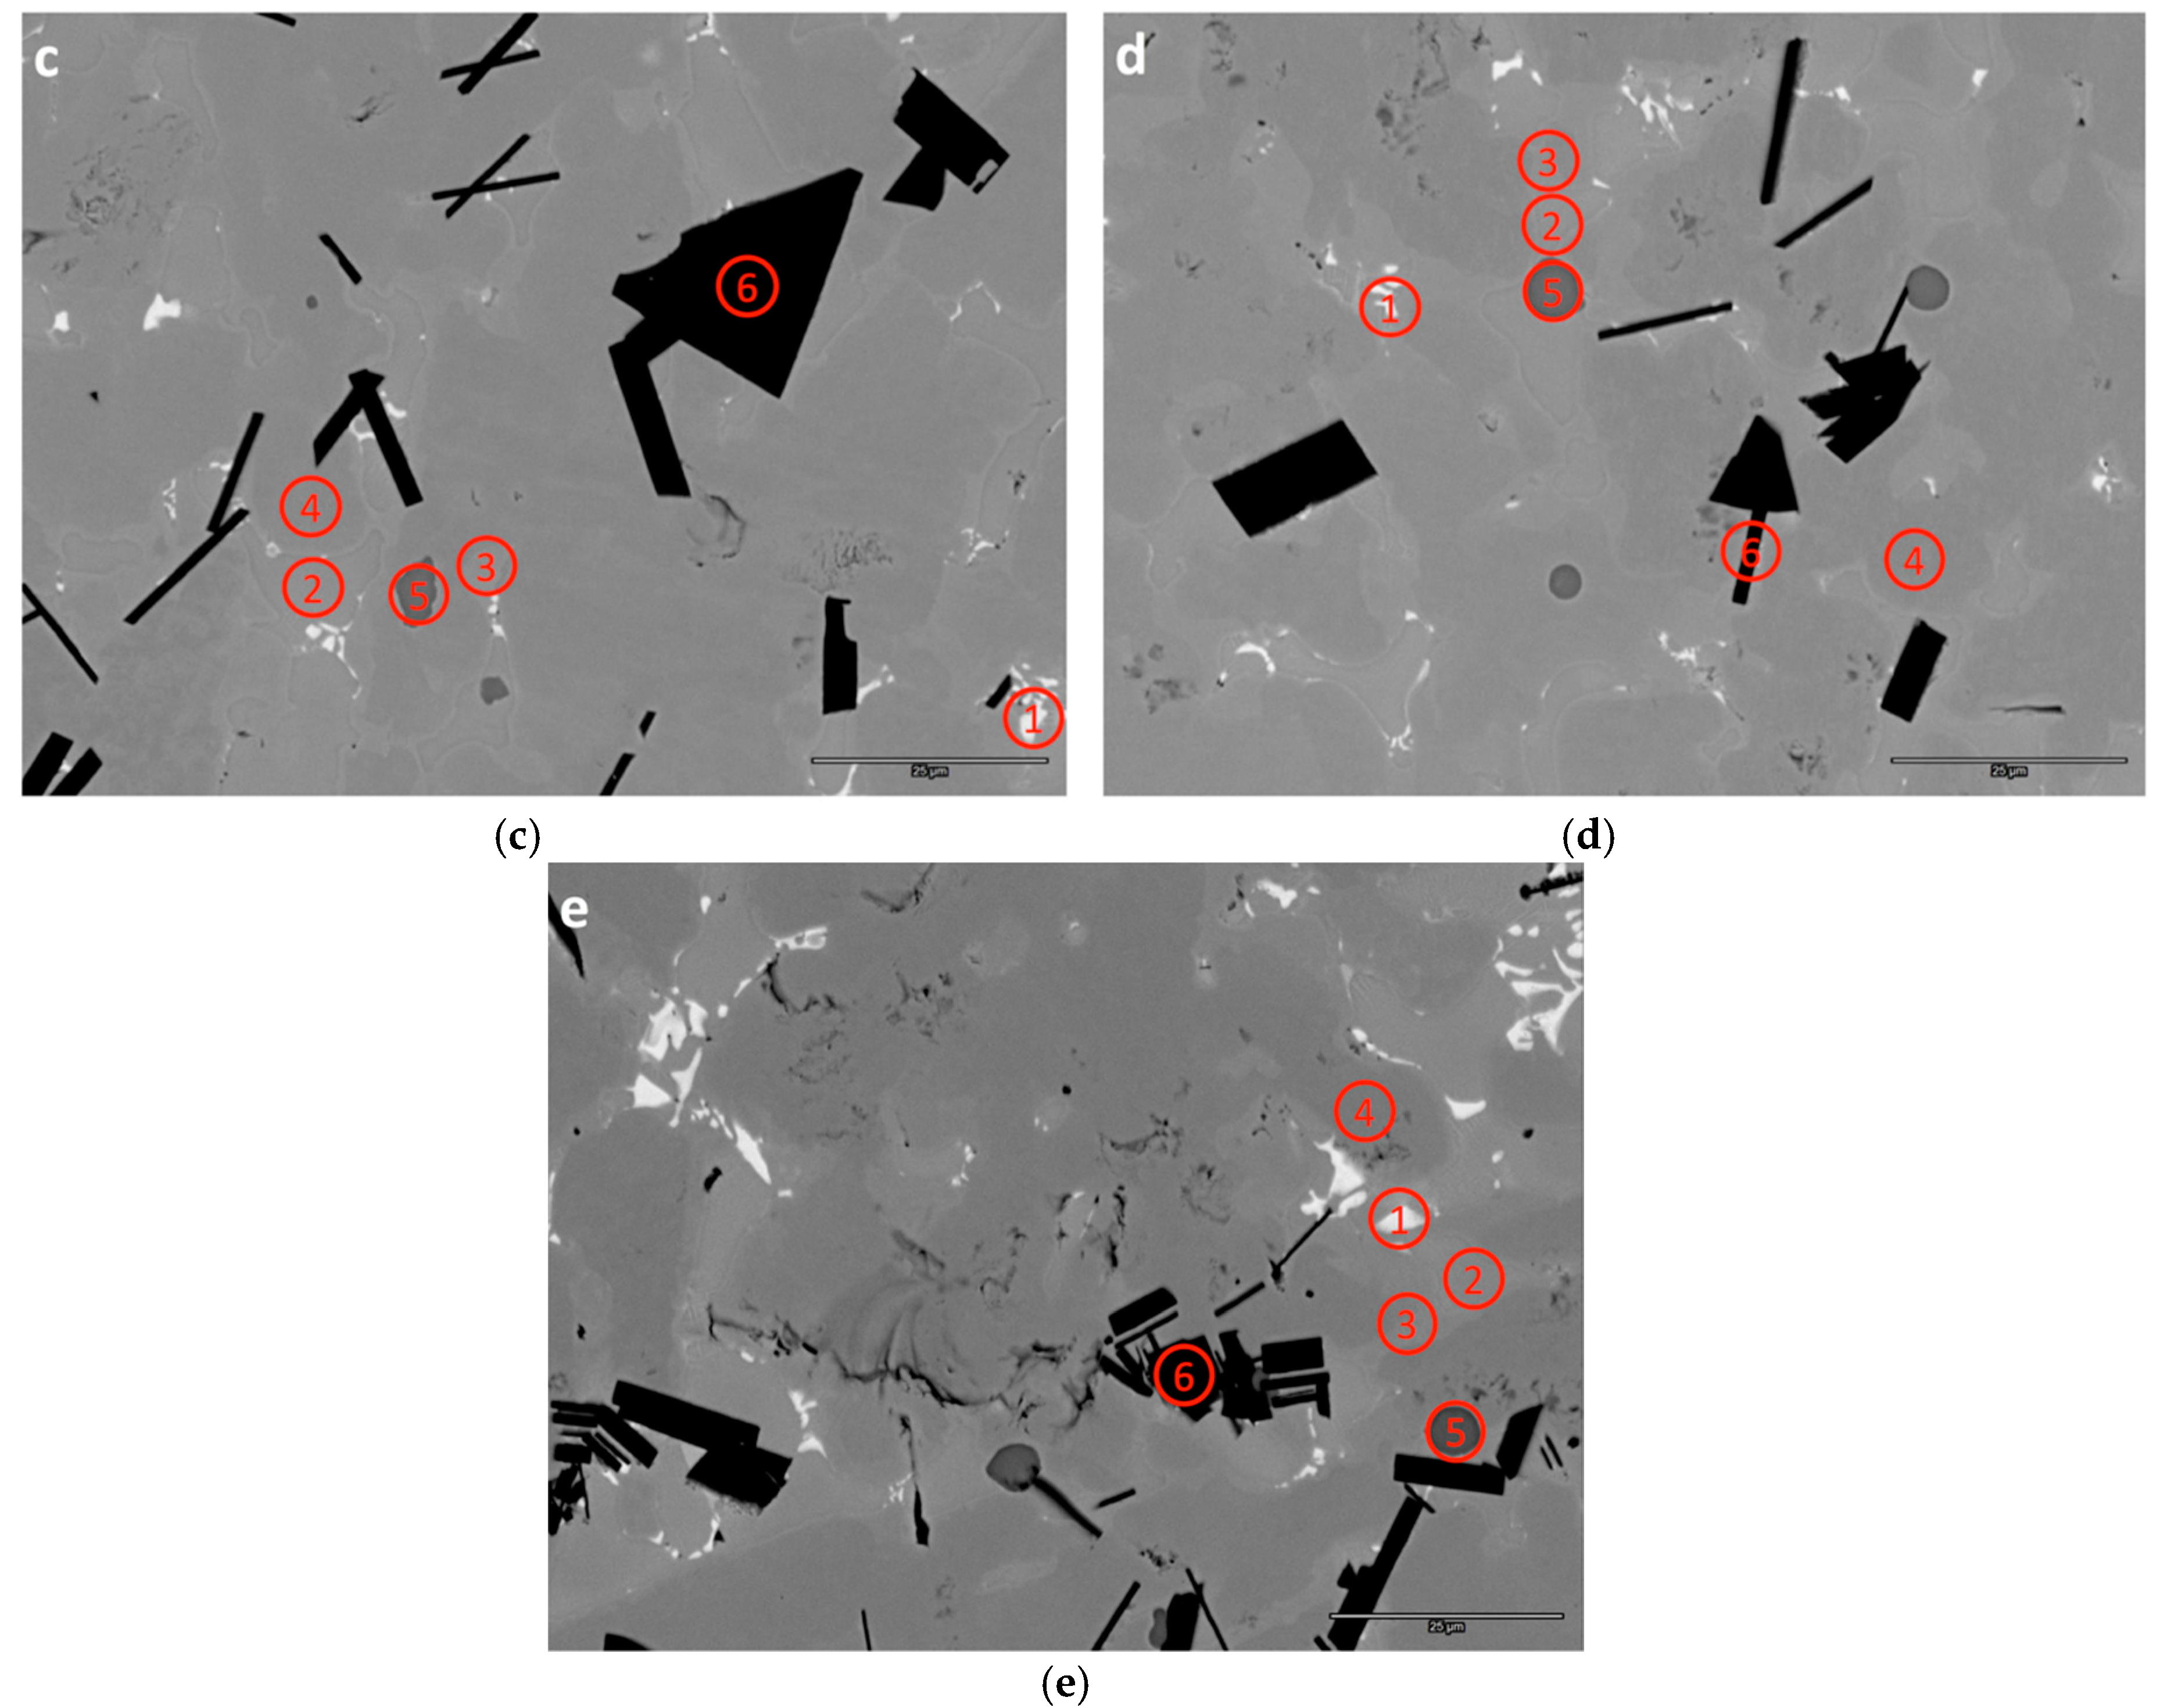
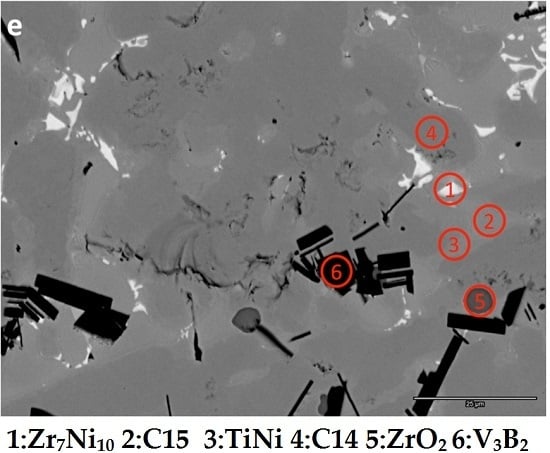
Figure 5 shows the SEM back-scattering electron image (BEI) of each boron-containing alloy. Table 3 lists the composition information of selected and numbered spots with different contrasts (indicated in Figure 5) analyzed by EDS in each BEI. The microstructure of alloy B0 was studied and reported previously [18,19,20,21,22]. For the B/A ratio calculation, vanadium is assumed to occupy the B-site in the Laves phases [28] and the A-site in the non-Laves phases [29]. For the boron-containing alloys B1 to B5, the brightest phase with the B/A ratio between 1.38 and 1.44 is identified as Zr7Ni10. Three phases, TiNi, C15, and C14, are detected next to each other. The TiNi phase with the second brightest contrast and a low vanadium-content exhibits the lowest B/A ratio (1.18 to 1.21) among the three phases. The phase with an e/a value (7.07 to 7.10) higher than the C14/C15 threshold [25] and a hypo-stochiometric composition (1.82 to 1.88) is identified as C15. The C15 phase solidifies between the C14 and TiNi phases in the cooling sequence [30]. The C14 phase with the darkest contrast among the three phases has an e/a value below 7.0 and a hyper-stoichiometry of 2.02 to 2.12. Furthermore, EDS shows a high oxygen-content in a relatively dark area (second darkest among all phases due to the light weight of oxygen), and this area is identified as ZrO2. By examining both the EDS and XRD results, the phase with the darkest contrast is the tetragonal V3B2 phase. Boron is too light to be detected by EDS, but the low BEI contrast indicates the existence of an element lighter than carbon. The calculated B/A ratio for the V3B2 phase is not the real B/A ratio since boron is not detectable by EDS; instead, it is the ratio of sum of the chromium-, manganese-, cobalt-, nickel-, aluminum-, and tin-contents to that of the zirconium-, titanium, and vanadium-contents. This B/A ratio increases from 0.32 to 0.48 with the increase in the boron content from alloys B1 to B4, which suggests increases in the amounts of smaller transition metals in the V3B2 phase.

3.4. PCT Analysis

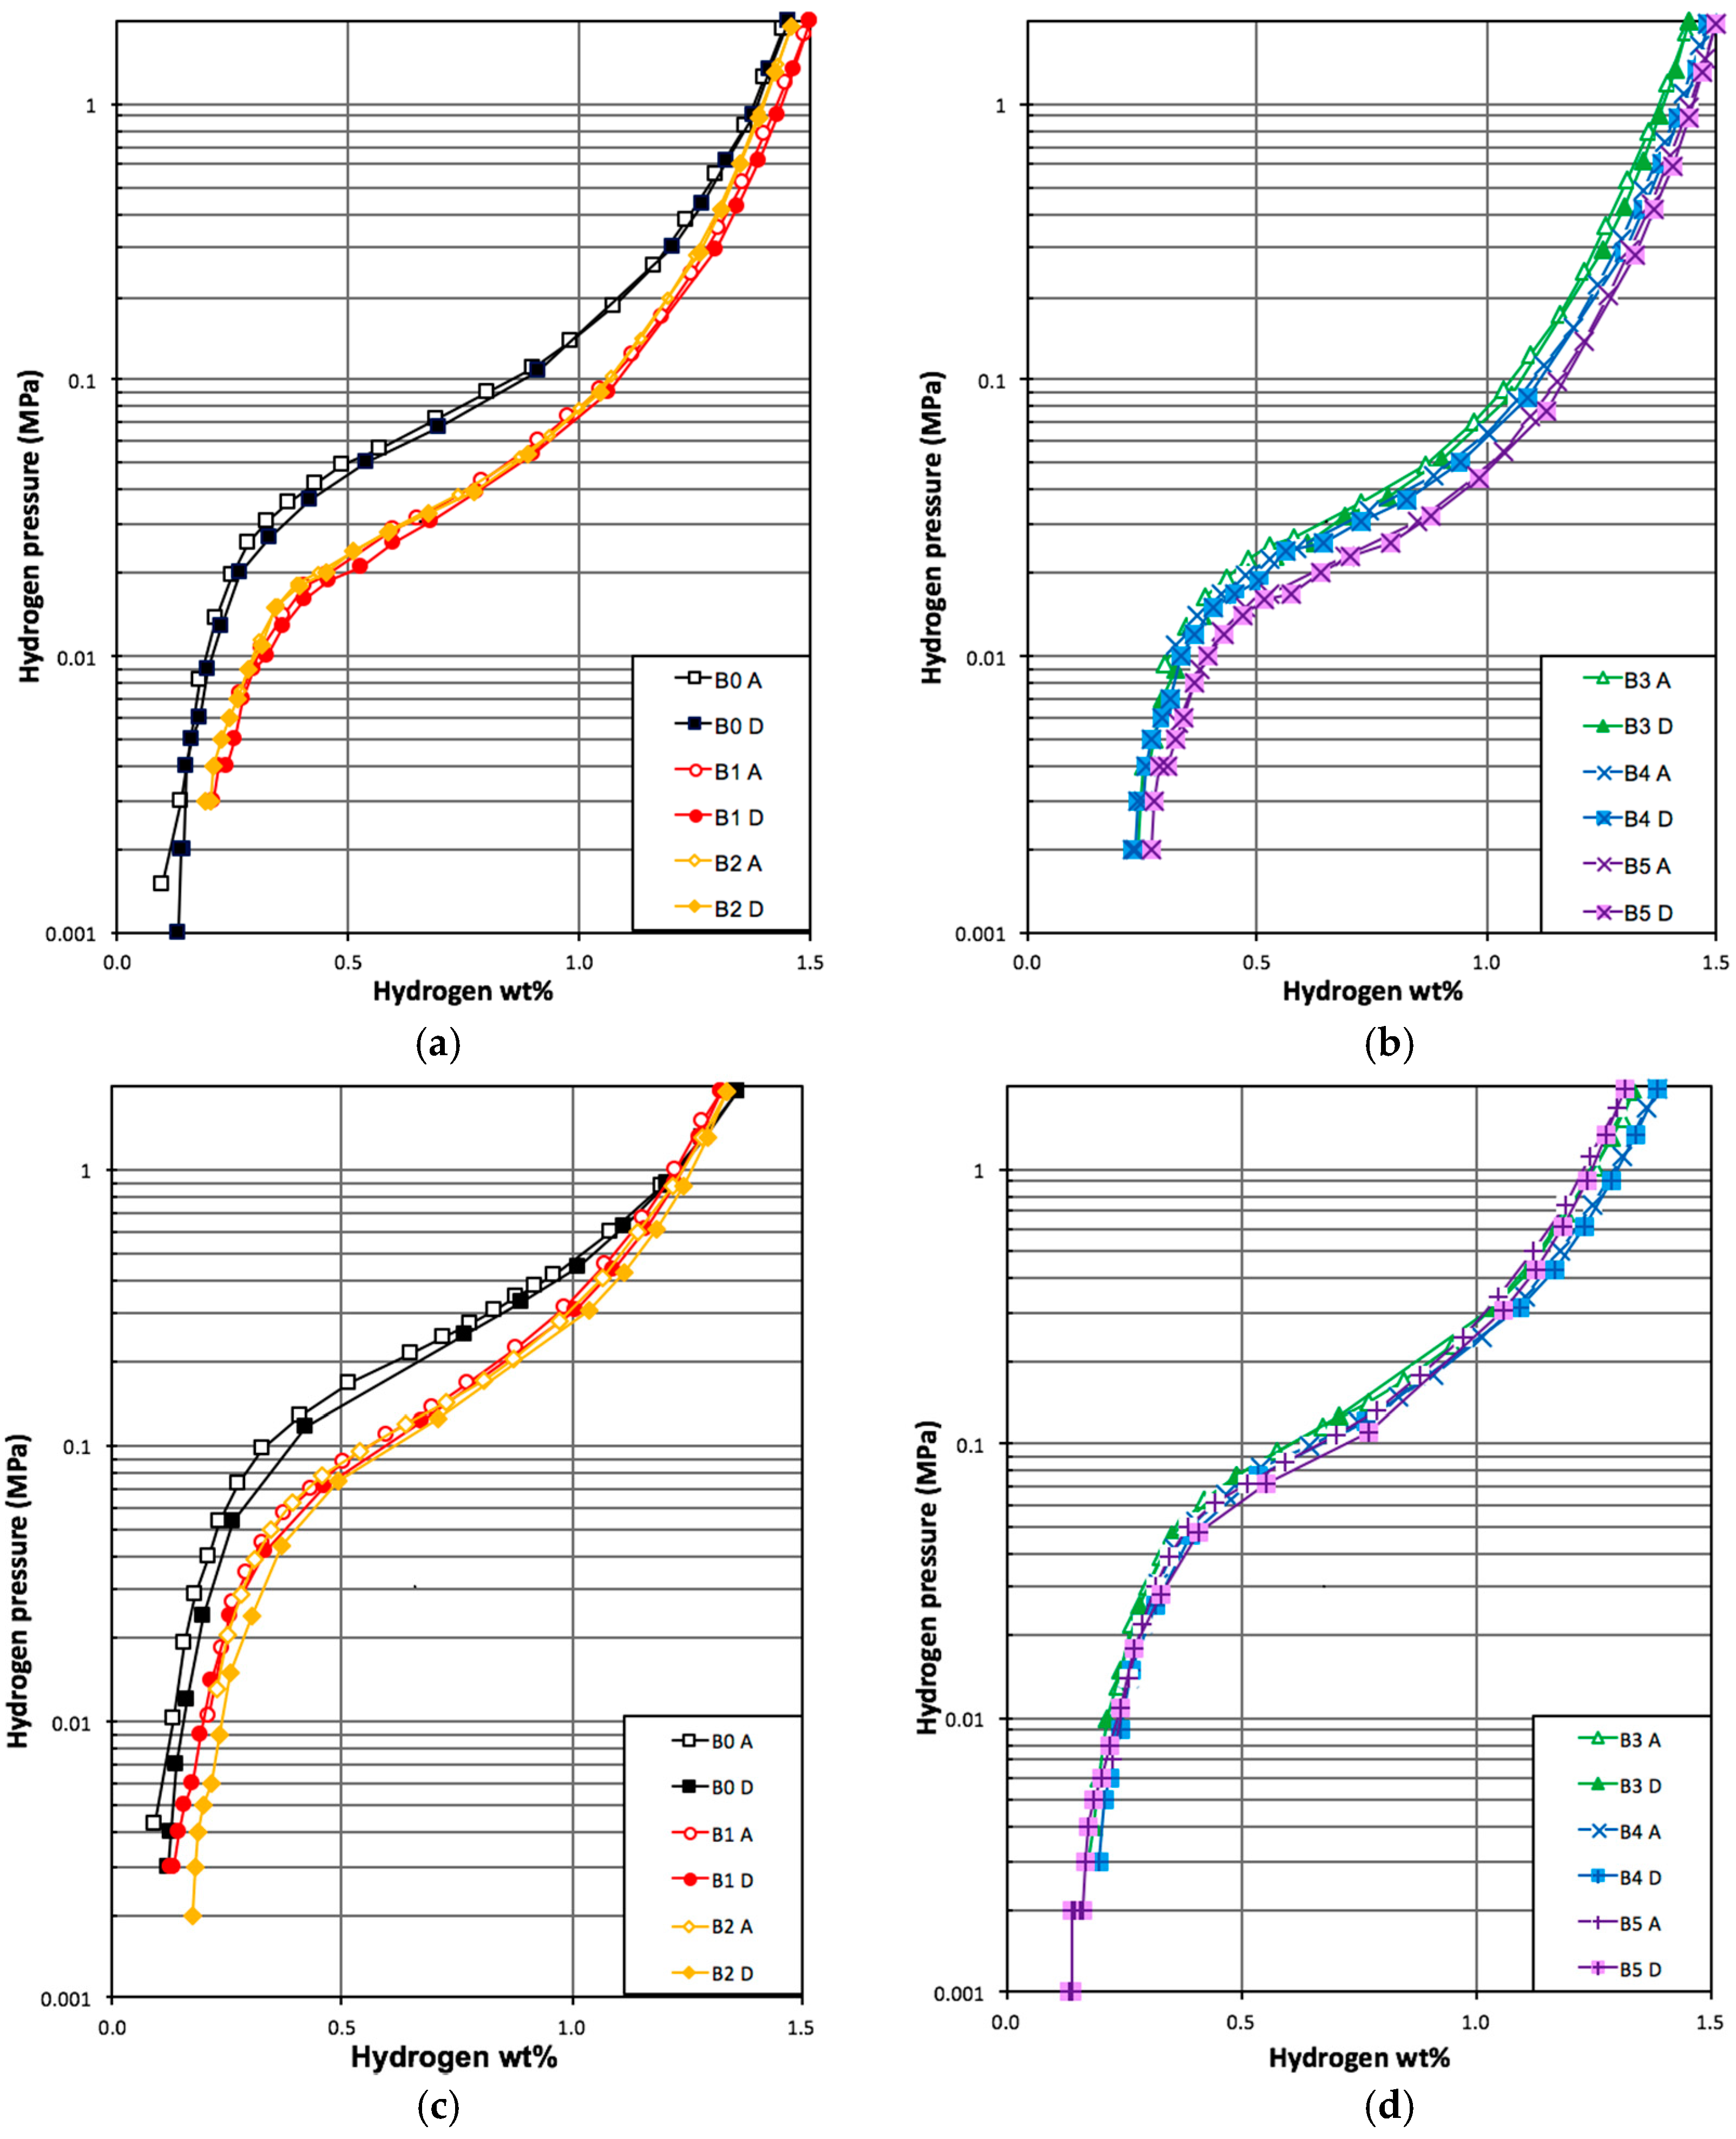
PCT measurements were used to study the gaseous phase H-storage characteristics of alloys in this study. Isotherms from the PCT results measured at 30 and 60 °C are plotted in Figure 6. At the same pressure, hydrogen storage at lower temperature (30 °C) is higher than that at a higher temperature (30 °C). Compared to the AB5 MH alloy, the highly disordered AB2 MH alloy has a relatively slanted isotherm without an easily defined plateau region [31,32,33,34,35,36]. Instead, the desorption pressure at 0.75 wt % is introduced as an indicator for the plateau pressure and used in the calculations of hysteresis, heat of hydride formation (∆Hh), and entropy change (∆Sh) [37]. Table 4 shows the gaseous phase H-storage properties obtained from the PCT isotherms. In general, the boron-containing alloys have higher maximum capacities and lower reversible capacities when compared to those from the boron-free alloy.
Desorption pressure measured at 0.75 wt % H-storage decreases with the increase in the boron content and can be attributed to the enlarged C14 unit cell revealed by the XRD analysis. Slope factor (SF), defined as the ratio of desorption capacity between 0.01 and 0.5 MPa to total reversible capacity [6,17,22], is an indicator of the degree of disorder (DOD) in the MH alloy [38] and smaller in a more slanted isotherm. SF measured at 30 °C is listed in the fifth column in Table 4 and shows a decreasing trend with the increase in the boron content. This finding suggests a decrease in uniformity with the addition of boron and is consistent with the decrease in the main C14 phase abundance. Hysteresis of PCT isotherm, defined as the natural log of ratio between the absorption and desorption equilibrium pressures [39,40,41], can be used to predict the degree of pulverization through cycling [28,37,42,43]. In the current study, hysteresis is listed in the sixth column in Table 4 and does not change significantly as the boron content increases. Therefore, boron is not likely to have a major impact on the pulverization rate during cycling.
Hh and ∆Sh can be calculated from the desorption equilibrium pressures at 0.75 wt % H-storage at 30, 60, and 90 °C by the Van’t Hoff equation,
G = ∆HhTSh = RTln P,
where T and R are the absolute temperature and ideal gas constant, respectively. ∆Hh is negative since the hydrogen absorbing process is exothermic. The different between ∆Sh and −130.7 J·mol H2−1·K−1 for H2 gas indicates DOD of hydrogen in the MH alloy [42]. Both −∆Hh and −∆Sh are listed in Table 4 and share a similar trend with the gaseous phase H-storage capacities due to the existence of two competing driving forces—an increase in the C14 unit cell volume and a decrease in the C14 phase abundance as the boron content increases.

3.5. Electrochemical Analysis

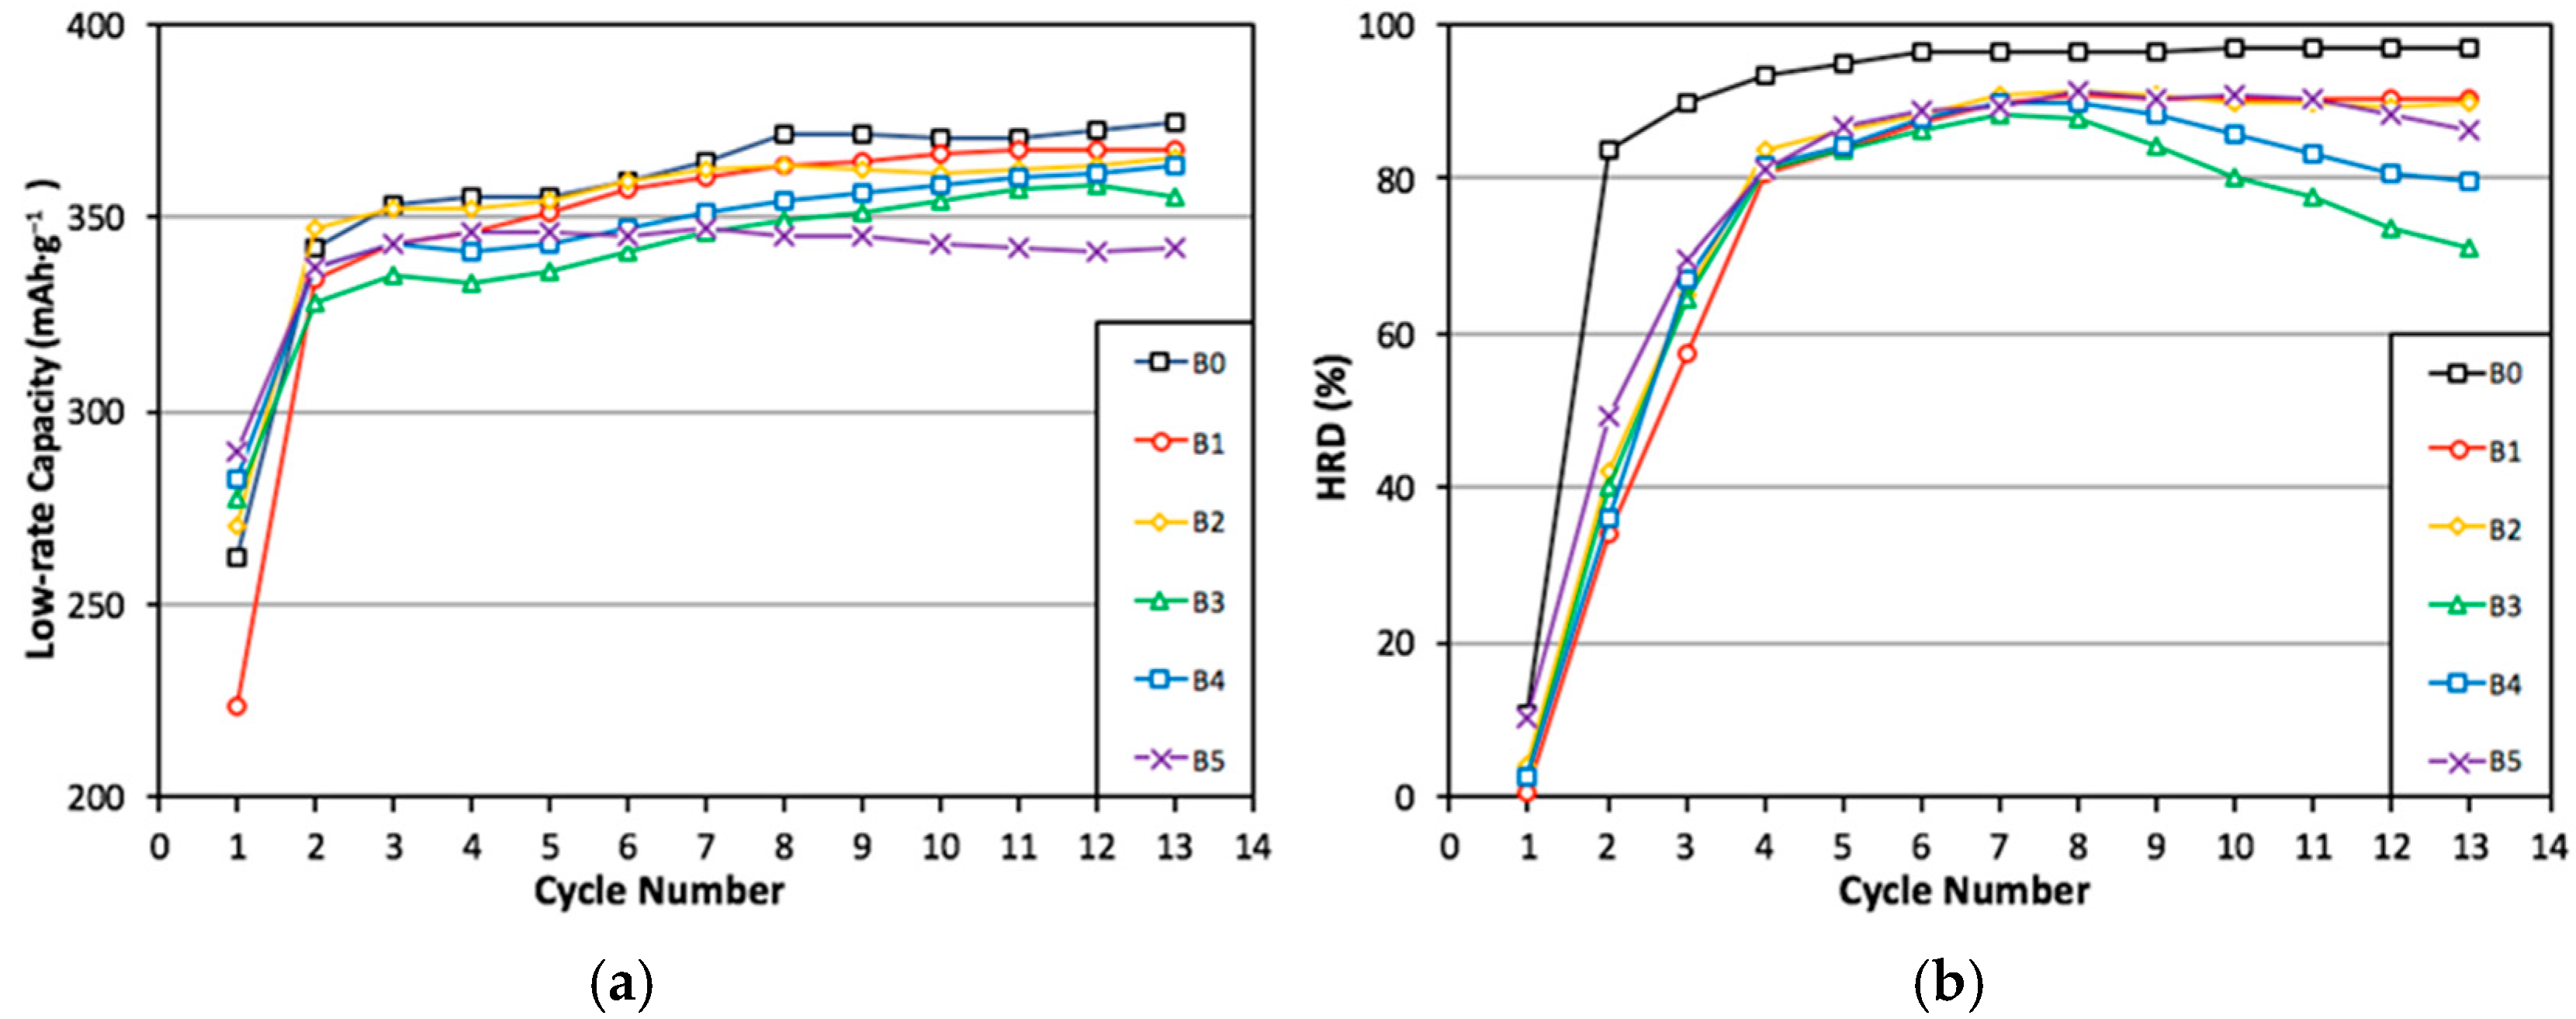
Half-cell full discharge capacity is obtained by summing the discharge capacities at three different rates, and half-cell HRD is defined as the ratio between the high-rate and full capacities. Electrochemical activation behaviors of full capacity and HRD in the first 13 cycles are illustrated in Figure 7. All alloys require the same number of activation cycles (2) to reach the stabilized capacity. As the boron content increases, capacity decrease (Figure 7a), and more activation cycles are needed to reach 85% of maximum HRD (Figure 7b). HRD starts to drop at the eighth cycle in alloys with higher boron contents. HRD at the 10th cycle for each alloy is listed in Table 5 and shows a first-decrease-then-increase trend with the increase in the boron content. Therefore, boron in the Laves phase-based MH alloy is suspected to deteriorate HRD [4], but the increase in the V3B2 phase abundance at higher boron content benefits it. In alloy B5, although the V3B2 phase abundance is smaller than that in alloy B4, the abundance of another beneficial phase, TiNi [44], is higher, which results in the positive net effect on HRD.
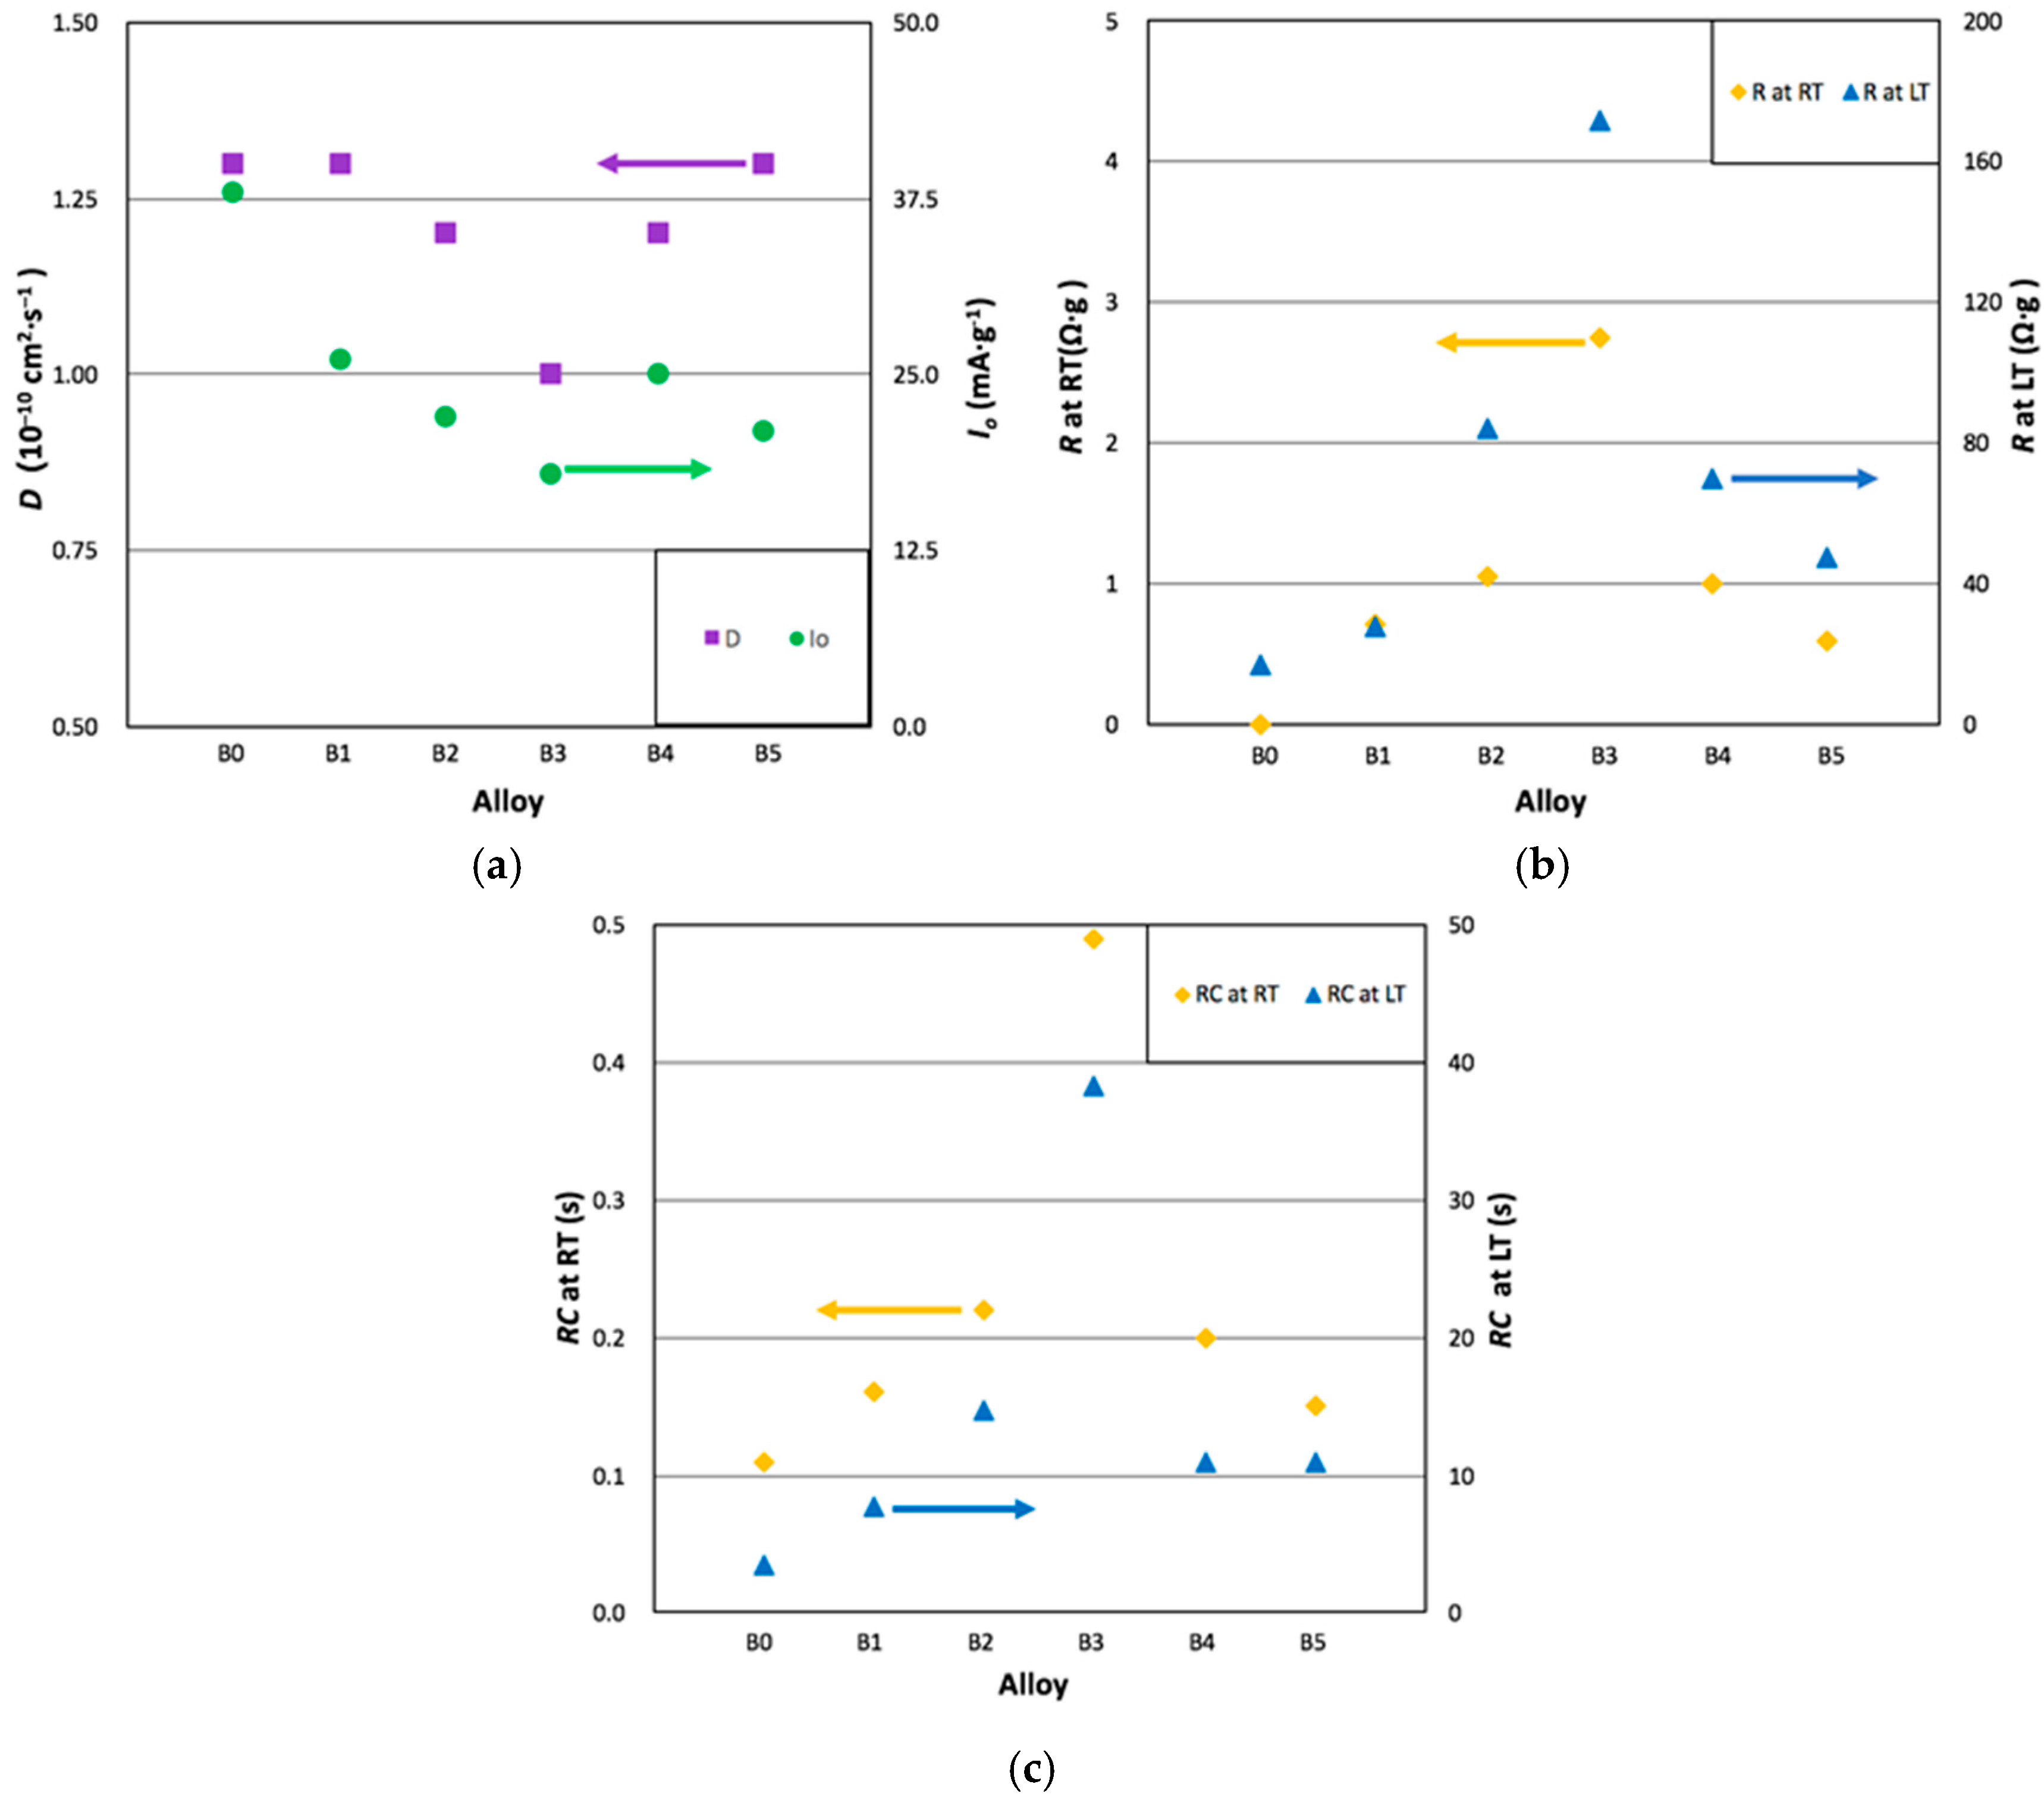
Both surface exchange current (Io) and bulk diffusion coefficient (D) are used to trace the cause of change in HRD, and the results are listed in Table 6. While Io reflects the reaction kinetics at the electrode surface, D shows the ability of hydrogen diffusing from the particle core to surface. Details of these measurements can be found in previous studies [45]. Other temperature- and hydrogen content-dependent measurements of hydrogen diffusion constant, such as nuclear magnetic resonance [46] and quasi-elastic neutron scattering [47], in Laves phase alloys were also conducted before. In this study, both Io and D first decrease and then increase with the increase in alloy number as shown in Figure 8a. However, since the variation in D is on a smaller scale compared to that in Io, Io is considered the main factor in affecting HRD. In other words, the HRD performances of the boron-containing alloys are dominated by the speed of surface reaction. According to our previous study, the TiNi phase contributes more to D than Io [44], which is confirmed by comparing HRDs of alloys B4 and B5 in this study.
To further investigate the connection between HRD and the surface reaction, AC impedance measured at both RT and LT were conducted, and the resulting charge-transfer resistances (R) and double-layer capacitances (C) from the Cole–Cole plots are summarized in Table 6. While R is closely related to the speed of electrochemical reaction, C is proportional to the reactive surface area, and their product (RC) represents the surface catalytic ability without the contribution from surface area. From the results shown in Table 6 and plotted in Figure 8b,c, we found that R and RC obtained at both RT and LT follow the same trend with the half-cell HRD (Table 6). Changes in surface reactive area (proportional to C) at RT and LT are not as significant as those in R and RC at RT and LT. Therefore, we conclude that the improvement in HRD by the introduction of a new V3B2 secondary phase is from the increase in surface catalytic ability.

3.6. Magnetic Susceptibility

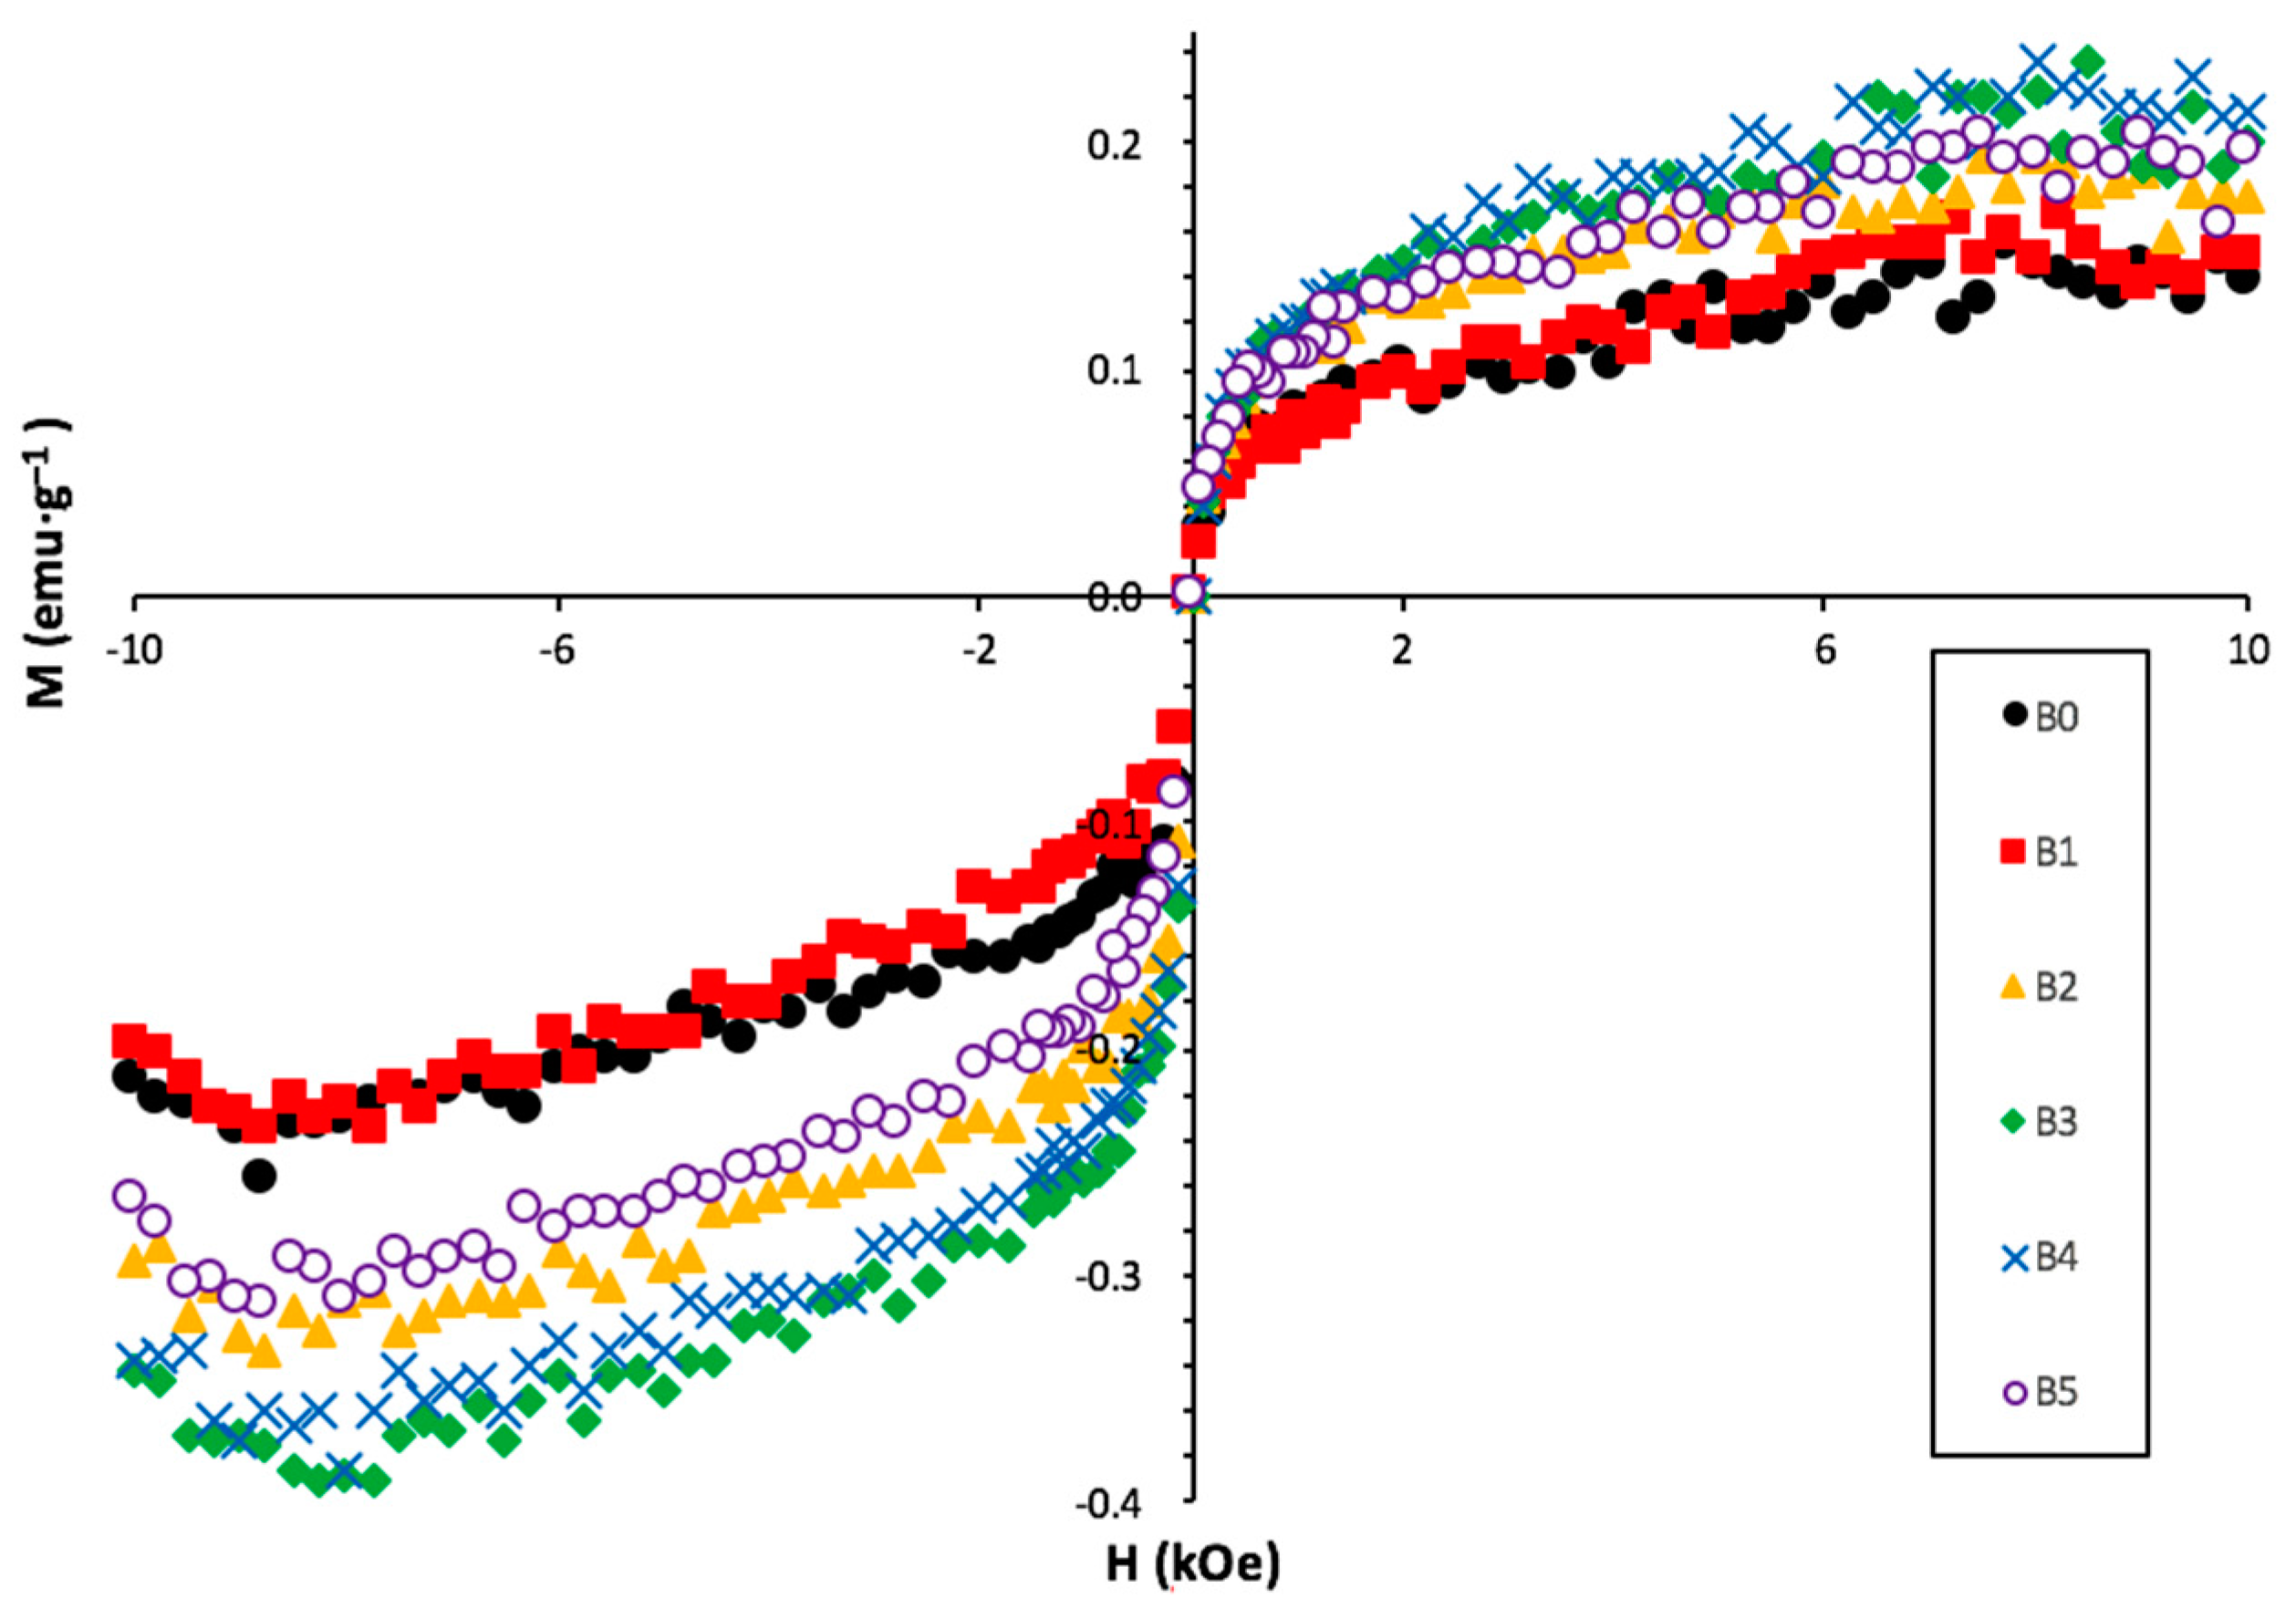
To continue the study of surface catalytic ability, M measurements on the activated alloys were conducted to quantify the amount of metallic nickel embedded in the surface oxide. Metallic nickel in the surface acts as a catalyst for water splitting and recombination in the electrochemical reaction and contributes directly to the surface exchange current. Saturated M (MS) from the ferromagnetic nickel in the surface oxide can be obtained by deducting the paramagnetic part of M curve [48]. Strength of the applied magnetic field corresponding to half of the MS value (H1/2) is associated with the magnetic field domain size and can be used to estimate the average size of nickel clusters. The M vs. applied magnetic field curves are plotted in Figure 9, and the calculated MS and H1/2 are listed in Table 7. MS first decreases slightly and then increases with the increase in the boron content. The initial decrease in MS is due to the reduction in the nickel-content in the alloy, and the later increase is caused by the increase in the nickel-content in the catalytic V3B2 phase. As the boron content increases, not only the V3B2 phase abundance increases, but the nickel content in the V3B2 phase also increases (Table 4). The H1/2 values listed in Table 7 indicate a decrease in size and an increase in surface area of nickel clusters with the increase in the boron content.

4. Conclusions

The influences of boron addition on the microstructural, gaseous phase, and electrochemical properties of a V-containing Laves phase-based metal hydride alloy have been studied. A small amount of boron (<2 at %) decreases the hydrogen equilibrium pressure because of the enlargement in unit cell of the C14 main phase, decreases the discharge capacities, and impedes the high-rate performance. However, a further increase in the boron content promotes the formation of a new V3B2 secondary phase and increase in the abundance of the beneficial TiNi phase, which contribute positively to the high-rate and low-temperature performances. Future studies will focus on optimizing the V3B2 phase abundance and introducing this phase in other metal hydride alloy families.

Acknowledgments

The authors would like to thank the following individuals from BASF-Ovonic for their help: Su Cronogue, Diana F. Wong, Shuli Yan, Tiejun Meng, David Pawlik, Allen Chen, Ryan J. Blankenship, Chaolan Hu, and Reichman Benjamin.

Author Contributions

Shiuan Chang designed the experiments, prepared alloy samples, and performed electrochemical and structural analysis. Taihei Ouchi performed the PCT analysis. Kwo-Hsiung Young, Jean Nei, and Xin Wu mentored the work and helped in manuscript preparation.

Conflicts of Interest

The authors declare no conflict of interest.

Abbreviations

The following abbreviations are used in this manuscript:
Ni/MHNickel/metal hydride
MHMetal hydride
H-storageHydrogen-storage
ICP-OESInductively coupled plasma-optical emission spectrometer
XRDX-ray diffractometer
SEMScanning electron microscope
EDSEnergy dispersive spectroscopy
PCTPressure concentration temperature
RTRoom temperature
LTLow temperature at −40 °C
MMagnetic susceptibility
HRDHigh-rate dischargeability
e/aAverage electron density
VC14Unit cell volume of the C14 phase
V V 3 B 2 Unit cell volume of the V3B2 phase
BEIBack-scattering electron image
HhHeat of hydride formation
ShChange in entropy
SFSlope factor
DODDegree of disorder
TAbsolute temperature
RIdeal gas constant
IoSurface exchange current
DBulk diffusion coefficient
RSurface charge-transfer resistance
CSurface double-layer capacitance
MSSaturated magnetic susceptibility
H1/2Applied magnetic field strength corresponding to half of saturated magnetic susceptibility

References

  1. Zelinsky, M.A.; Koch, J.M.; Young, K. Performance comparison of rechargeable batteries for stationary applications (Ni/MH vs. Ni-Cd and VRLA). Batteries. submitted.
  2. Young, K.; Ng, K.Y.S.; Bendersky, L.A. A technical report of the Robust Affordable Next Generation Energy Storage System-BASF program. Batteries 2016, 2, 2. [Google Scholar] [CrossRef]
  3. Young, K.; Nei, J. The current status of hydrogen storage alloy development for electrochemical applications. Materials 2013, 6, 4574–4608. [Google Scholar] [CrossRef] [PubMed]
  4. Huang, T.; Wu, Z.; Xia, B.; Xu, N. Influence of stoichiometry and alloying elements on the crystallography and hydrogen sorption properties of TiCr based alloys. Mater. Sci. Eng. A 2005, 397, 284–287. [Google Scholar]
  5. Kim, D.M.; Jeon, S.W.; Lee, J.Y. A study of the development of a high capacity and high performance Zr–Ti–Mn–V–Ni hydrogen storage alloy for Ni–MH rechargeable batteries. J. Alloys Compd. 1998, 279, 209–214. [Google Scholar] [CrossRef]
  6. Young, K.; Chang, S.; Lin, X. C14 Laves phase metal hydride alloys for Ni/MH batteries applications. Batteries 2017, 3, 27. [Google Scholar] [CrossRef]
  7. Wilipedia. Laves Phase. Available online: https://en.wikipedia.org/wiki/Laves_phase (accessed on 20 October 2017).
  8. Shoemaker, D.P.; Shoemaker, C.B. Concerning atomic sites and capacities for hydrogen absorption in the AB2 Friauf-Laves phases. J. Less-Common Met. 1979, 68, 43–58. [Google Scholar] [CrossRef]
  9. Jacob, I.; Stern, A.; Moran, A.; Shaltiel, D.; Davidov, D. Hydrogen absorption in (ZrxTi1−x)B2 (B = Cr, Mn) and the phenomenological model for the absorption capacity in pseudo-binary Laves-phase compounds. J. Less-Common Met. 1980, 73, 1369–1376. [Google Scholar] [CrossRef]
  10. Young, K.; Ouchi, T.; Koch, J.; Fetcenko, M.A. The role of Mn in C14 Laves phase multi-component alloys for NiMH battery application. J. Alloys Compd. 2009, 477, 749–758. [Google Scholar] [CrossRef]
  11. Sehn, C.-C.; Chou, J.C.-P.; Li, H.-C.; Wu, Y.-P.; Perng, T.-P. Effect of interstitial boron and carbon on the hydrogenation properties of Ti25V35Cr40 alloy. Int. J. Hydrogen Energy. 2010, 35, 11975–11980. [Google Scholar] [CrossRef]
  12. Luan, B.; Chu, N.; Zhao, H.J.; Liu, H.K.; Dou, S.X. Effects of potassium-boron addition on the performance of titanium based hydrogen storage alloy electrodes. Int. J. Hydrogen Energy. 1996, 21, 373–379. [Google Scholar] [CrossRef]
  13. Zhang, Y.-H.; Dong, X.-P.; Wang, G.-Q.; Guo, S.-H.; Ren, J.-Y.; Wang, X.-L. Effect of boron additive on electrochemical cycling life of La-Mg-Ni alloys prepared by casting and rapid quenching. Int. J. Hydrogen Energy. 2007, 32, 594–599. [Google Scholar] [CrossRef]
  14. Leela, A.M.R.; Ramaprabhu, S. Hydrogen diffusion studies in Zr-based Laves phase AB2 alloys. J. Alloys Compd. 2008, 460, 268–271. [Google Scholar]
  15. Young, K.; Ouchi, T.; Huang, B.; Fetcenko, M.A. Effects of B, Fe, Gd, Mg, and C on the structure, hydrogen storage, and electrochemical properties of vanadium-free AB2 metal hydride alloy. J. Alloys Compd. 2012, 511, 242–250. [Google Scholar] [CrossRef]
  16. Young, K.; Fetcenko, M.A.; Li, F.; Ouchi, T. Structural, thermodynamics, and electrochemical properties of TixZr11–x(VNiCrMnCoAl)2 C14 Laves phase alloys. J. Alloys Compd. 2008, 464, 238–247. [Google Scholar] [CrossRef]
  17. Young, K.; Fetcenko, M.A.; Koch, J.; Morii, K.; Shimizu, T. Studies of Sn, Co, Al, and Fe additives in C14/C15 Laves alloys for NiMH battery application by orthogonal arrays. J. Alloys Compd. 2009, 486, 559–569. [Google Scholar] [CrossRef]
  18. Young, K.; Ouchi, T.; Huang, B.; Reichman, B.; Fetcenko, M.A. Studies of copper as a modifier in C14-predominant AB2 metal hydride alloys. J. Power Sources 2012, 204, 205–212. [Google Scholar] [CrossRef]
  19. Young, K.; Ouchi, T.; Huang, B.; Reichman, B.; Fetcenko, M.A. The structure, hydrogen storage, and electrochemical properties of Fe-doped C14-predominating AB2 metal hydride alloys. Int. J. Hydrogen Energy 2011, 36, 12296–12304. [Google Scholar] [CrossRef]
  20. Young, K.; Ouchi, T.; Huang, B.; Reichman, B. Effect of molybdenum content on structural, gaseous storage, and electrochemical properties of C14-predominant AB2 metal hydride alloys. J. Power Sources 2011, 196, 8815–8821. [Google Scholar] [CrossRef]
  21. Erika, T.; Ricardo, F.; Fabricio, R.; Fernando, Z.; Verónica, D. Electrochemical and metallurgical characterization of ZrCr1-xNiMox AB2 metal hydride alloys. J. Alloys Compd. 2015, 649, 267–274. [Google Scholar] [CrossRef]
  22. Young, K.; Ouchi, T.; Lin, X.; Reichman, B. Effects of Zn-addition to C14 metal hydride alloys and comparisons to Si, Fe, Cu, Y, and Mo-additives. J. Alloys Compd. 2016, 655, 50–59. [Google Scholar] [CrossRef]
  23. Johnson, R.L.; Hoffmann, R. Z. Structure-bonding relationships in the Laves Phases. Z. Anorg. Allg. Chem. 1992, 616, 105–120. [Google Scholar] [CrossRef]
  24. Liu, C.T.; Zhu, J.H.; Brady, M.P.; McKamey, C.G.; Pike, L.M. Physical metallurgy and mechanical properties of transition-metal Laves phase alloys. Intermetallics 2000, 8, 1119–1129. [Google Scholar] [CrossRef]
  25. Nei, J.; Young, K.; Salley, S.O.; Ng, K.Y.S. Determination of C14/C15 phase abundance in Laves phase alloys. Mat. Chem. Phys. 2012, 136, 520–527. [Google Scholar] [CrossRef]
  26. Power Diffraction File (PDF) Database; MSDS No. 04-003-6123; International Centre for Diffraction Data: Newtown Square, PA, USA, 2011.
  27. Notten, P.H.L.; Einerhand, R.E.F.; Daams, J.L.C. How to achieve long-term electrochemical cycling stability with hydride-forming electrode materials. J. Alloys Compd. 1995, 231, 604–610. [Google Scholar] [CrossRef]
  28. Young, K.; Fetcenko, M.A.; Li, F.; Ouchi, T.; Koch, J. Effect of vanadium substitution in C14 Laves phase alloys for NiMH battery application. J. Alloys Compd. 2009, 468, 482–492. [Google Scholar] [CrossRef]
  29. Young, K.; Ouchi, T.; Fetcenko, M.A.; Mays, W.; Reichman, B. Structural and electrochemical properties of Ti1.5Zr5.5VxNi10–x. Int. J. Hydrogen Energy 2009, 34, 8695–8706. [Google Scholar] [CrossRef]
  30. Liu, Y.; Young, K. Microstructure investigation on metal hydride alloys by electron backscatter Diffraction Technique. Batteries 2016, 2, 26. [Google Scholar] [CrossRef]
  31. Ovshinsky, S.R.; Fetcenko, M.A. Electrochemical Hydrogen Storage Alloys and Batteries Fabricated from Mg Containing Base Alloys. U.S. Patent 5,506,069, 9 April 1996. [Google Scholar]
  32. Young, K.; Huang, B.; Ouchi, T. Studies of Co, Al, and Mn substitutions in NdNi5 metal hydride alloys. J. Alloys Compd. 2012, 543, 90–98. [Google Scholar] [CrossRef]
  33. Schlapbach, L.; Züttel, A. Hydrogen-storage materials for mobile applications. Nature 2001, 414, 353–358. [Google Scholar] [CrossRef] [PubMed]
  34. Züttel, A. Materials for hydrogen storage. Mater. Today 2003, 6, 24–33. [Google Scholar] [CrossRef]
  35. Sastri, M.V.C. Introduction to metal hydrides: basic chemistry and thermodynamics of their formation. In Metal Hydride; Sastri, M.V.C., Viswanathan, B., Murthy, S.S., Eds.; Springer-Verlag: Berlin, Germany, 1998; p. 5. [Google Scholar]
  36. Young, K.; Ouchi, T.; Meng, T.; Wong, D.F. Studies on the synergetic effects in multi-phase metal hydride alloys. Batteries 2016, 2, 15. [Google Scholar] [CrossRef]
  37. Young, K.; Ouchi, T.; Fetcenko, M.A. Pressure-composition-temperature hysteresis in C14 Laves phase alloys: Part 1. Simple ternary alloys. J. Alloys Compd. 2009, 480, 428–433. [Google Scholar] [CrossRef]
  38. Wong, D.F.; Young, K.; Nei, J.; Wang, L.; Ng, K.Y.S. Effects of Nd-addition on the structural, hydrogen storage, and electrochemical properties of C14 metal hydride alloys. J. Alloys Compd. 2015, 647, 507–518. [Google Scholar] [CrossRef]
  39. Scholtus, N.A.; Hall, W.K. Hysteresis in the palladium-hydrogen system. J. Chem. Phys. 1963, 39, 868–870. [Google Scholar] [CrossRef]
  40. Makenas, B.J.; Birnbaum, H.K. Phase changes in the niobium-hydrogen system 1: Accommodation effects during hydride precipitation. Acta Metall. Mater. 1980, 28, 979–988. [Google Scholar] [CrossRef]
  41. Balasubramaniam, R. Accommodation effects during room temperature hydrogen transformations in the niobium-hydrogen system. Acta Metall. Mater. 1993, 41, 3341–3349. [Google Scholar] [CrossRef]
  42. Lide, D.R. CRC Handbook of Chemistry and Physics, 74th ed.; CRC Press: Boca Raton, FL, USA, 1993; pp. 6–22. [Google Scholar]
  43. Jeng, R.; Lee, S.; Hsu, C.; Wu, Y.; Lin, J. Effects of the addition of Pd on the hydrogen absorption-desorption characteristics of Ti33V33Cr34 alloys. J. Alloys Compd. 2008, 464, 467–471. [Google Scholar] [CrossRef]
  44. Young, K.; Ouchi, T.; Nei, J.; Moghe, D. The importance of rare-earth additions in Zr-based AB2 metal hydride alloys. Batteries 2016, 2, 25. [Google Scholar] [CrossRef]
  45. Young, K.; Wong, D.F.; Ouchi, T.; Huang, B.; Reichman, B. Effects of La-addition to the structure, hydrogen storage, and electrochemical properties of C14 metal hydride alloys. Electrochim. Acta 2015, 174, 815–825. [Google Scholar] [CrossRef]
  46. Renz, W.; Majer, G.; Skripov, A.V.; Seeher, A. A pulsed-field-gradient NMR study of hydrogen diffusion in the Laves-phase compounds ZrCr2Hx. J. Phys. Condens. Matter. 1994, 6, 6367–6474. [Google Scholar] [CrossRef]
  47. Campbell, S.I.; Kemali, M.; Ross, D.K.; Bull, D.J.; Fernandez, J.F.; Johnson, M.R. Quasi-elastic neutron scattering study of the hydrogen diffusion in the C15 Laves structure, TiCr1.85. J. Alloys Compd. 1999, 293–295, 351–355. [Google Scholar] [CrossRef]
  48. Stucki, F.; Schlapbach, L. Magnetic properties of LaNi5, FeTi, Mg2Ni and their hydrides. J. Less-Common Met. 1980, 74, 143–151. [Google Scholar] [CrossRef]
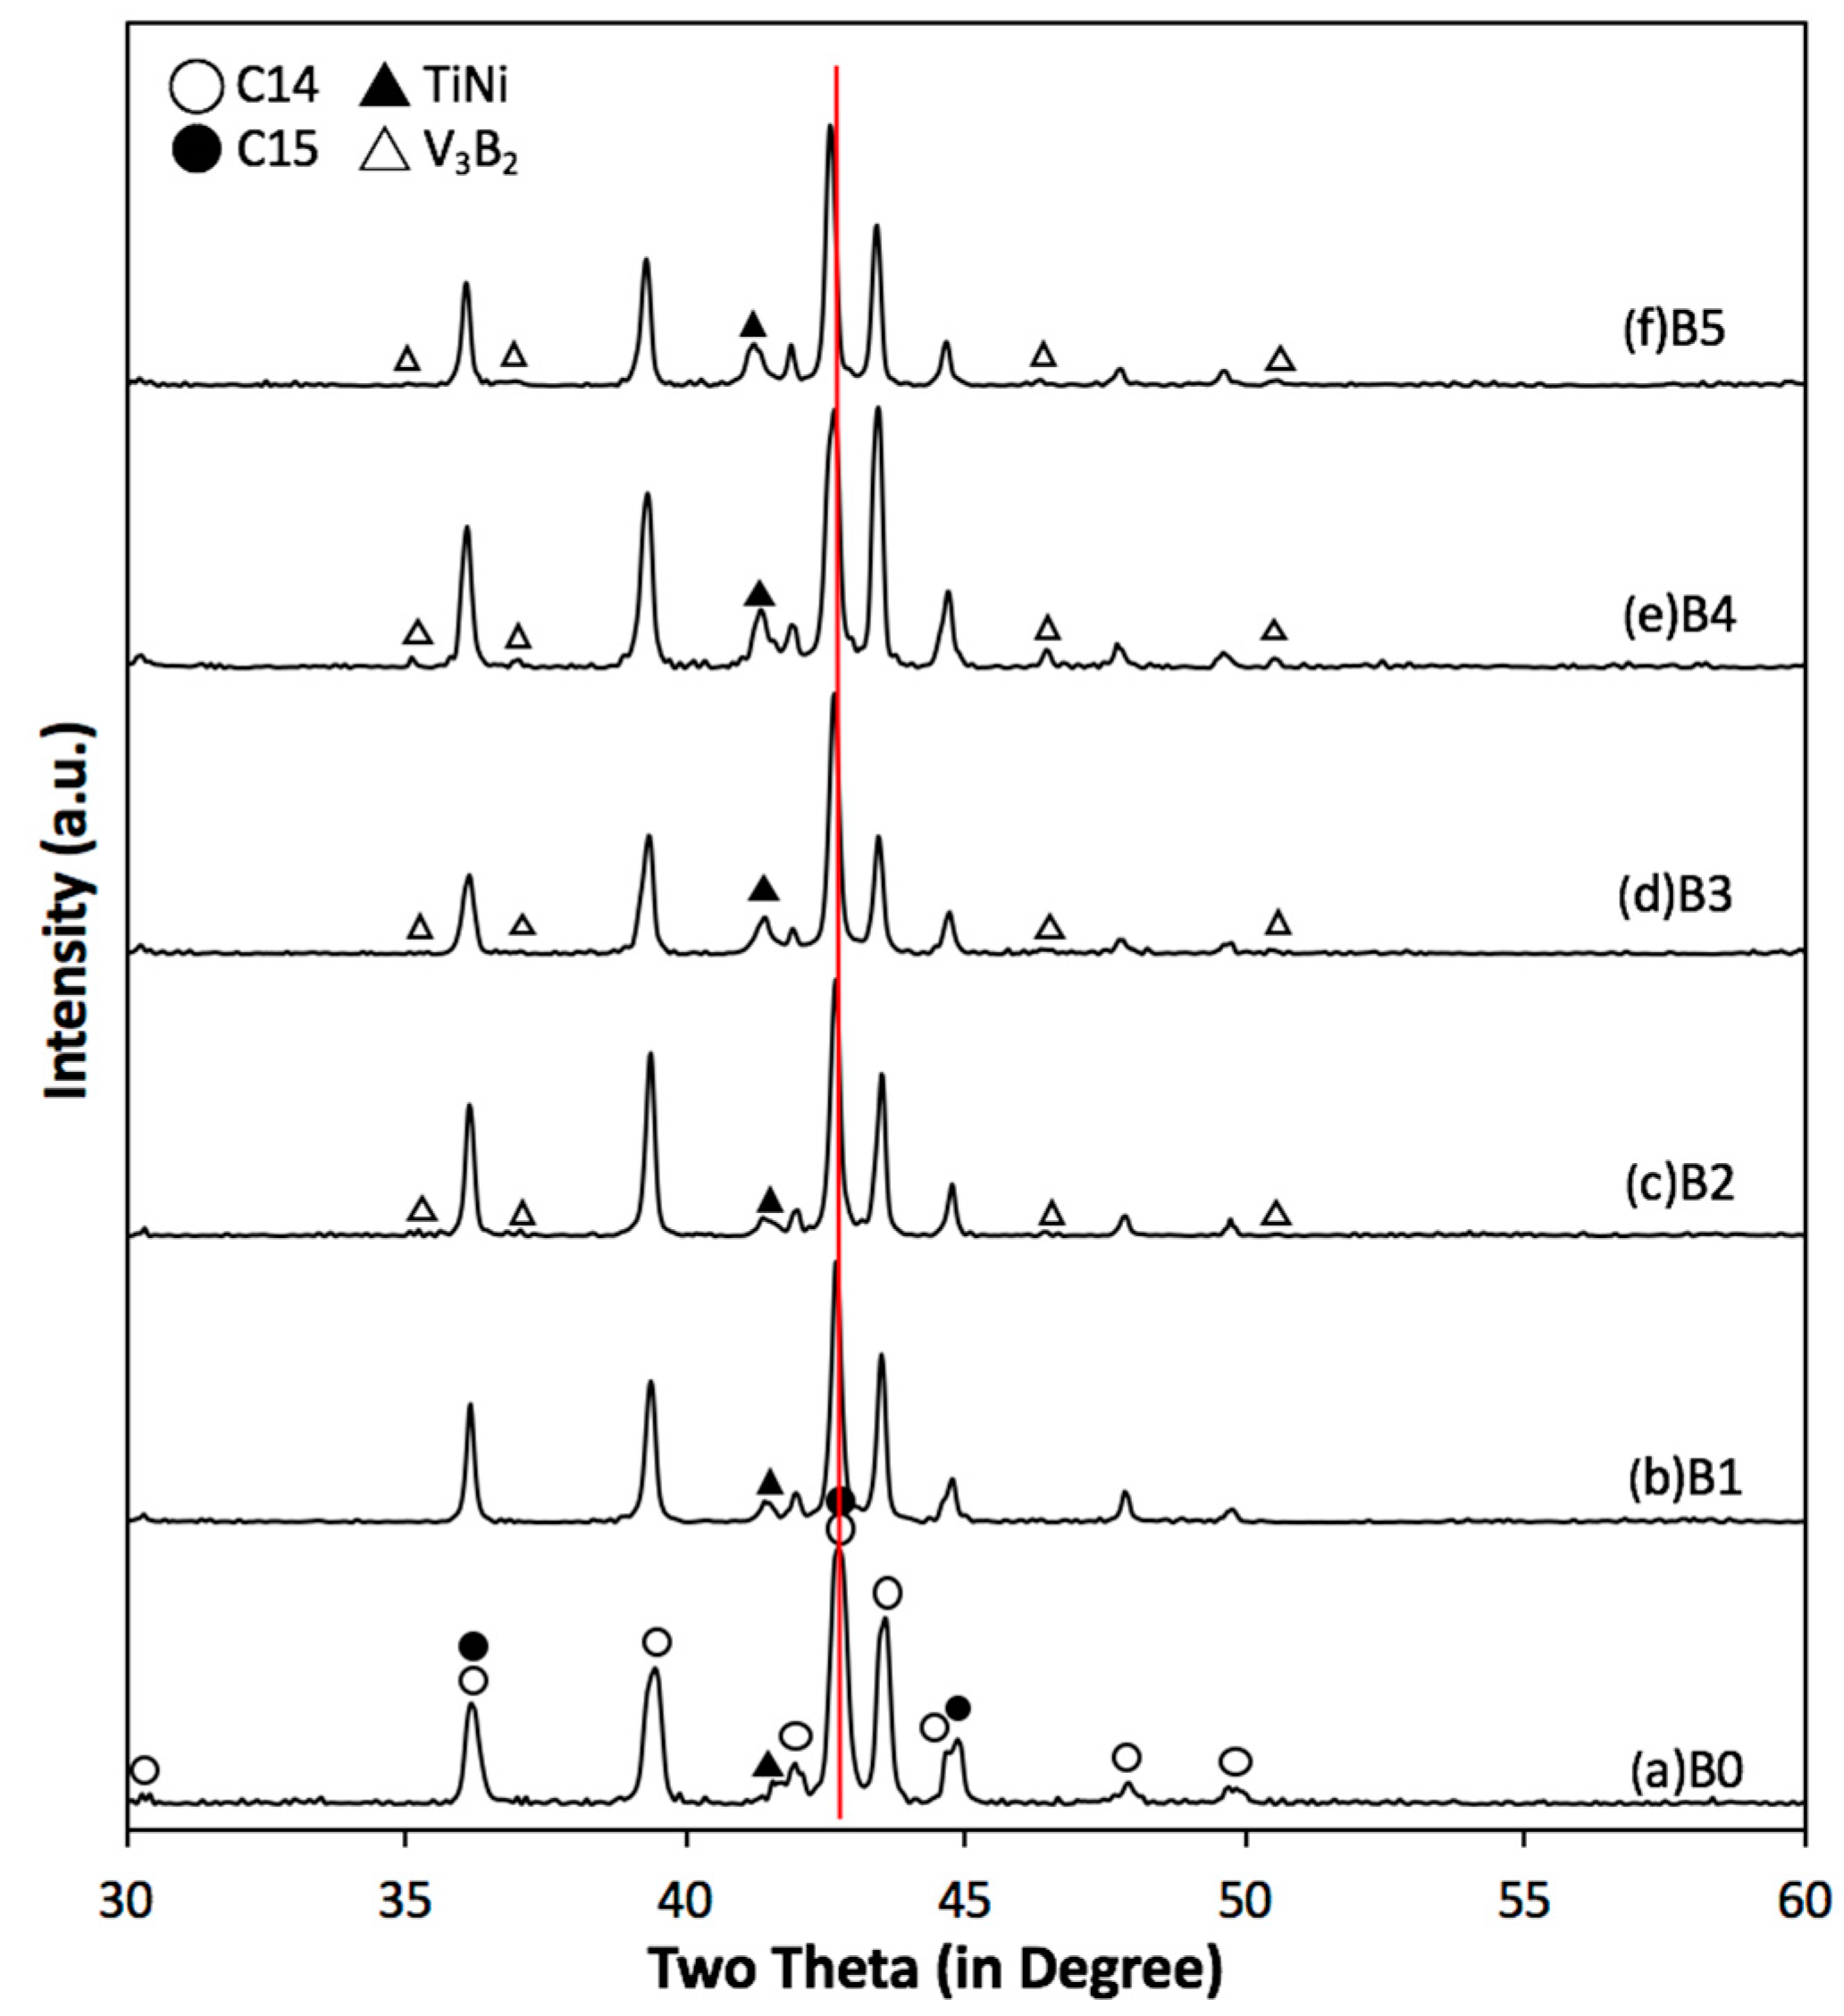
Figure 1. XRD patterns using Cu-Kα as the radiation source for alloys (a) B0; (b) B1; (c) B2; (d) B3; (e) B4; and (f) B5. Besides the two Laves phases, a cubic phase (TiNi) and a tetragonal phase (V3B2) can also be identified. Vertical line indicates the main C14/C15 peak shifting into a lower angle with the increase in the boron content.
Batteries 03 00036 g001
Figure 2. Schematic of the V3B2 crystal structure (tP10). Orange and green spheres represent the vanadium and boron atoms, respectively.
Batteries 03 00036 g002
Figure 3. C14 unit cell volume change vs. boron content in the V-free [15] and V-containing AB2 alloys.
Batteries 03 00036 g003
Figure 4. Evolutions of the C14, C15, TiNi, and V3B2 phase abundances vs. alloy number.
Batteries 03 00036 g004
Figure 5. SEM back-scattering electron images (BEIs) of alloys (a) B1; (b) B2; (c) B3; (d) B4; and (e) B5. Compositions of the numbered areas were analyzed by energy dispersive spectroscopy (EDS), and the results are shown in Table 4. Areas 1–6 are identified as the Zr7Ni10, TiNi, C15, C14, ZrO2, and V3B2 phases, respectively.
Batteries 03 00036 g005aBatteries 03 00036 g005b
Figure 6. 30 °C PCT isotherms of alloys (a) B0, B1, and B2 and (b) B3, B4, and B5 and 60 °C PCT isotherms of alloys (c) B0, B1, and B2 and (d) B3, B4, and B5. Open and solid symbols are for absorption and desorption curves, respectively.
Batteries 03 00036 g006
Figure 7. Activation behaviors observed from (a) half-cell capacity measured at 4 mA·g‒1 and (b) half-cell high-rate dischargeability (HRD) for the first 13 electrochemical cycles.
Batteries 03 00036 g007
Figure 8. Correlations of (a) D and Io vs. alloy number, (b) R at RT and LT vs. alloy number, and (c) RC at RT and LT vs. alloy number.
Batteries 03 00036 g008
Figure 9. Magnetic susceptibilities of alloys in this study.
Batteries 03 00036 g009
Table 1. Design compositions (in bold) and inductively coupled plasma (ICP) results in at %. e/a is the average electron density. B/A is the atomic ratio of the B-atoms (elements other than Ti and Zr) to the A-atoms (Ti and Zr).
AlloySourceTiZrVCrMnCoNiAlSnBe/aB/A
B0Design12.021.510.07.58.18.032.20.40.30.06.821.99
ICP12.021.510.07.58.18.032.20.30.40.06.821.99
B1Design12.021.59.67.58.18.031.60.40.31.06.771.99
ICP12.121.59.77.37.98.031.60.70.40.96.761.98
B2Design12.021.59.27.58.18.031.00.40.32.06.721.99
ICP12.021.49.77.28.08.031.10.70.31.66.722.00
B3Design12.021.58.87.58.18.030.40.40.33.06.671.99
ICP12.121.79.27.18.08.131.00.70.41.86.721.96
B4Design12.021.58.47.58.18.029.80.40.34.06.621.99
ICP12.222.18.66.98.18.331.00.70.41.86.721.92
B5Design12.021.58.07.58.18.029.20.40.35.06.571.99
ICP12.122.88.07.08.78.129.50.70.32.76.621.86
Table 2. Lattice constants a and c, a/c ratio, unit cell volume, and crystallite size of the main C14 phase of alloys B0 to B5 from the XRD analysis. Lattice information of the secondary phases are also included. N.D. denotes non-detectable.
AlloyC14
a
(Å)
C14
c
(Å)
C14
a/c
VC14
3)
C14 Crystallite Size
(Å)
C15
a
(Å)
TiNi
a
(Å)
V3B2
a
(Å)
V3B2
c
(Å)
V3B2
a/c
V V 3 B 2
3)
B04.96358.09060.6135172.622607.00023.0637N.D.N.D.N.D.N.D.
B14.96558.09590.6133172.875917.00773.0770N.D.N.D.N.D.N.D.
B24.96678.09610.6135172.966437.00873.07755.71253.02321.889698.66
B34.97028.10720.6131173.444877.01483.08135.70893.04861.872699.36
B44.97448.11100.6133173.814967.01543.08415.71933.03301.885799.21
B54.98458.13300.6129174.995717.02933.09165.72873.03971.884699.76
Table 3. Summary of the EDS results. All compositions are in at%. Compositions of the main C14 and C15 phases are in bold and italic, respectively.
LocationTiZrVCrMnCoNiAlSnOe/aB/APhase
B1-14.835.90.40.21.61.440.30.415.30.0-1.44Zr7Ni10
B1-225.318.91.20.42.37.543.80.40.40.0-1.21TiNi
B1-311.822.96.83.47.06.540.60.60.50.07.101.88C15
B1-49.622.411.99.79.68.727.20.50.10.06.652.12C14
B1-50.233.80.10.10.10.20.60.10.064.9-1.94ZrO2
B1-618.50.556.916.04.81.61.60.10.00.0--V3B2
B2-16.834.60.70.31.82.239.60.413.70.0-1.38Zr7Ni10
B2-224.719.71.10.42.37.343.80.30.30.0-1.20TiNi
B2-311.523.36.53.77.16.640.20.60.40.07.081.87C15
B2-49.622.811.310.910.09.025.90.50.20.06.642.09C14
B2-50.134.20.10.10.10.20.70.10.064.5-1.91ZrO2
B2-610.40.462.221.13.61.01.30.10.00.0--V3B2
B3-16.234.40.50.31.92.338.50.413.41.9-1.38Zr7Ni10
B3-223.721.01.00.32.27.343.50.30.40.0-1.18TiNi
B3-311.424.06.03.87.46.839.70.70.40.07.081.83C15
B3-410.123.110.49.810.09.127.00.50.10.06.672.02C14
B3-51.231.50.20.10.20.42.20.10.064.1-2.04ZrO2
B3-611.41.259.521.23.50.92.00.10.00.0--V3B2
B4-17.134.20.80.52.32.540.00.412.40.0-1.38Zr7Ni10
B4-222.821.90.90.42.47.643.40.40.40.0-1.20TiNi
B4-311.024.35.73.68.17.039.30.60.40.07.071.83C15
B4-49.723.210.310.110.79.426.00.50.20.06.662.04C14
B4-50.132.60.10.10.10.10.70.10.066.1-2.04ZrO2
B4-614.81.852.023.44.11.22.60.10.10.0--V3B2
B5-14.536.50.50.32.42.339.20.613.90.0-1.42Zr7Ni10
B5-221.323.50.80.42.57.243.60.40.50.0-1.20TiNi
B5-310.924.65.13.59.17.638.40.70.40.07.081.82C15
B5-49.723.49.39.611.99.725.90.60.10.06.682.03C14
B5-50.132.30.10.10.10.20.60.10.066.5-2.08ZrO2
B5-617.52.048.222.84.61.53.20.10.20.0--V3B2
Table 4. Summary of the gaseous phase properties.
AlloyMaximum Capacity at 30 °C wt %Reversible Capacity at 30 °C
wt %
Desorption PRESSURE at 0.75 wt %, 30 °C
MPa
Slope Factor at 30 °C
%
Hysteresis at 0.75 wt %, 30 °C-∆Hh
kJ·mol H2−1
-∆Sh
J·mol H2−1·K−1
B01.451.320.078600.0432.8107
B11.501.290.037540.0838.9120
B21.461.270.038530.0637.5116
B31.441.210.036550.0735.3108
B41.461.230.032580.0535.5108
B51.501.220.025500.0542.9130
Table 5. Summary of the RT electrochemical half-cell results.
Alloy10th Cycle High-Rate Discharge Capacity
mAh·g−1
10th Cycle Full Discharge Capacity
mAh·g−1
10th Cycle HRD
%
Number of Activation Cycles to Reach 85% HRD
B0359371973
B1330366904
B2325362905
B3284354806
B4307359866
B5311343916
Table 6. Summary of the room temperature (RT) and low temperature (LT) electrochemical properties (D: bulk diffusion coefficient, Io: surface exchange current, R: charge-transfer resistance, C: double-layer capacitance, and RC product).
AlloyD at RT
10−10 cm2·s−1
Io at RT
mA·g−1
R at RT
Ω·g
C at RT
F·g−1
RC Product at RT
s
R at LT
Ω·g
C at LT
F·g−1
RC Product at LT
s
B01.3380.440.240.1116.50.213.5
B11.3260.710.220.1627.40.287.7
B21.2221.040.210.2283.90.1815.1
B31.0182.740.180.49171.50.2237.7
B41.2250.990.200.2070.00.1611.2
B51.3210.590.240.1547.10.2310.8
Table 7. Summary of the RT magnetic properties (MS: saturated magnetic susceptibility and H1/2: applied field at half of the MS value).
AlloyMS
emu·g−1
H1/2
kOe
B00.0640.064
B10.0590.120
B20.0930.138
B30.0990.139
B40.1010.106
B50.0900.139