Article

High-Rate Capability Limitations, Plating Phenomena and Ablate Recycling in Laser-Structured Electrodes

by
Sacris Tambio
1,
Vincent Sarou-Kanian
2,3,
Michael Deschamps
2,3 and
Wilhelm Pfleging
1,*
1
Institute for Applied Materials-Applied Materials Physics, Karlsruhe Institute of Technology (KIT), Kaiserstraße 12, 76131 Karlsruhe, Germany
2
Laboratoire CEMHTI, CNRS, Université d’Orléans, 1D, Avenue de la Recherche Scientifique, 45071 Orléans, France
3
Réseau sur le Stockage Électrochimique de l’Energie (RS2E), Centre National de la Recherche Scientifique CNRS FR3459, 80039 Amiens, France
*
Author to whom correspondence should be addressed.
Batteries 2026, 12(9), 377; https://doi.org/10.3390/batteries12090377 (registering DOI)
Submission received: 7 August 2026 / Revised: 7 September 2026 / Accepted: 9 September 2026 / Published: 20 September 2026
(This article belongs to the Section Electrode Materials and Advanced Characterization)

Abstract

The power performance (high-rate capability) of laser-structured electrodes for graphite and NMC 811 were evaluated at different electrolyte concentrations and electrode thicknesses. Line patterning was used to create microstructures via femtosecond laser ablation. The electrochemical power performance of structured electrodes at both increasing electrolyte salt concentration and increasing electrode thickness shows that the best power performances were attained at 1.0 M electrolyte salt concentration. Lithium plating observations and long-term cycling capacities show that cycle life is greatly determined by electrolyte salt concentrations across all electrodes. Results suggest that salt mobility in the electrolyte and concentrations are significant factors in improving the power performance in both unstructured and structured electrodes. Ablated material recycling attempts also reveal that graphite is able to retain its chemistry and can be directly recycled for electrochemical use.

1. Introduction

Lithium-ion battery (LIB) technology has been ubiquitous since its implementation in many personal electronic devices, stationary storage, and most recently in electric mobility. Intensive research has been done over more than two decades to better understand its mechanisms and improve performance. A significant factor that hampers its full potential as an alternative to internal combustion engines are charging times (high-rate capability). Charging takes around 20–30 min depending on the battery’s state of charge (SOC) before charging. This is further highlighted in thick-film battery electrodes (thickness of up to ≈100 μm) due to the limitation stemming from the Li+ mobility [1,2,3]. In LIBs, the electrochemical reaction follows a redox mechanism where an electron flows to either anode or cathode (through a load) depending on the manner of operation (discharge or charge). The lithium-ion containing material, often a lithium-ion intercalation material, will then release the lithium-ion (Li+) which will migrate to the electrode that received the extra electrons to be then re-intercalated and finally complete electroneutrality [4]. In the case of a full-cell NMC 811 vs. graphite, both materials are Li-ion-intercalating materials, and graphite intercalates Li+ during charge, while NMC 811 intercalates Li+ during discharge, with both materials absorbing the electron that passed through the external load upon their respective intercalation reactions. The Li+ diffuses through the electrolyte solution and the separator as it moves from one electrode to another during charge or discharge. Present LIB electrodes are composites of various materials which are often prepared in slurries and then tape cast onto metallic substrates, i.e., current collector, and then dried resulting in porous films. The pores allow the electrolyte to penetrate the deeper areas of the electrode along the film thickness, which enables full utilization of the active materials present in it. This mostly is true at low C-rates due to the transport of Li+ ions limiting full material utilization along the electrode thickness. C-rate is defined as the current to either fully charge or discharge the cell based vs. its total theoretical capacity in ampere-hours (C-rate = applied current [A]/nominal capacity [Ah]). At high C-rates, the electrochemical reaction at the surface and immediate zones of the active material particles are relatively fast, and the pore areas farthest from the separator cannot be replenished with Li+ quickly. This results in a fast termination of the charge/discharge process and in turn, low capacity-delivery at fast charge/discharge, i.e., high power operation. Thicker electrodes have been regarded as the simplest design choice to increase capacity at the cell or battery level without the need to stack multiple electrode layers, which in turn also increases inactive components such as current collectors and separators. The said design has not been fully exploited for high power applications due to the aforementioned limitation.
A promising solution has been demonstrated by Pfleging et al. [5,6,7], where the electrodes are microstructured using ultrafast laser ablation. This creates regions of low tortuosity allowing better penetration of the liquid electrolyte into the deeper electrode pore areas for better Li+ replenishment. Different structuring patterns including straight lines, holes, and 3D structures have been tested and demonstrated significantly improved power performances for different LIB anodes and cathodes [5,6,7]. This technique has yet to be implemented in ultrathick-film electrodes (thickness > 100 μm) which could be significant in improving the power performance for such designs. Moreover, the ablates are material that is typically discarded and will be significant if this technique is scaled into the industrial process. Exploring the recyclability of the ablated material would be necessary to make the laser process cost-efficient and sustainable. In the presented work, we aimed to implement such a design in ultrathick-film electrodes and further understand the mechanisms and limitations of respective laser ablation. We also aimed to measure the Li+ diffusion in the channels via diffusion NMR and determine the improvements in Li+ diffusion coefficient of the electrolyte in the channels. Finally, the ablated material was studied for its direct reuse.

2. Experimental Procedure

Graphite- and NMC 811-based electrodes were prepared using aqueous and organic slurry preparations, respectively. The mass percentage ratios of the materials in the electrode composites are presented in Table 1. Slurries were mixed using a Hauschild Speedmixer™ (Hamm, Germany) and were casted on copper and aluminum for graphite- and NMC 811-based slurries, respectively.
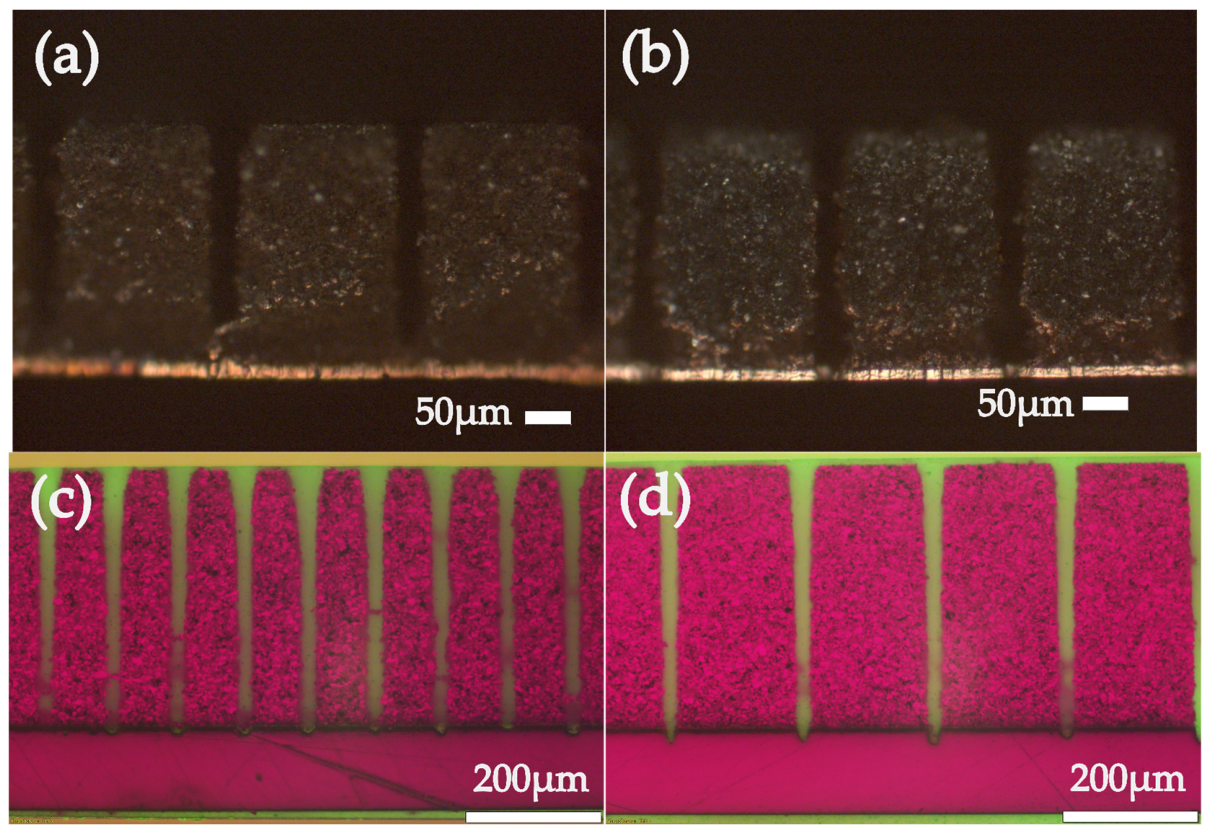
Laser ablation was done for all electrodes via an OPTEC™ micromachining system (Figure 1). For electrodes in half-cell configuration, a wavelength (λ) of 515 nm (green-VIS, Tangerine) was used, while a wavelength of 1030 nm (near infrared: NIR, Satsuma) was used for the graphite electrode in full cells. Trenches were drawn at maximum depth up to the substrate, and the periodic distance (hatch) between each trench was around 200 μm.
Electrodes were then cut in to 12 mm Φ discs using the same OPTEC™ system (Optec SA, Frameries, Belgium) and were assembled in half-cell and full-cell configuration in the 2032 coin-cell design. Celgard™ PP2500 (MTI Corporation, Richmond, CA, USA) was chosen as the separator with 120 μL of LP57 (1M LiPF6 in 3:7 wt. ethyl carbonate:ethyl methyl carbonate). Derivatives of the LP57 formulation with increased salt concentration (1.4 M and 1.8 M) were also used. For full cells, graphite was chosen as the anode, and NMC 811 was chosen as the cathode, with a respective area load balancing (in mAh/cm2) of 1.2:1. The cells were then cycled for rate capability (power performance) and long-term cycling via Arbin™ potentiostat (BT2000, Arbin Instruments, College Station, TX, USA). Applied rates were based on the C-rate definition, where 1C is the current applied that will charge or discharge the cell in 1 h. For 2C, this time is 30 min and for C/2, 2 h and so on. The cycling parameters are shown in Table 2, Table 3 and Table 4. Full cells were also disassembled after cycling for visual verification of lithium plating. The ablates from both graphite and NMC 811 were collected via custom filter setup and were analyzed using electrochemical cycling, NMR spectroscopy, X-ray diffraction (XRD), and Raman spectroscopy.
Pulsed-field gradient stimulated spin-Echo NMR was the chosen technique to determine the diffusion coefficient of Li+ of the electrolyte in the channels. This required a special experiment setup involving non-metallic samples. This was done by using graphite as the active material and a polyimide film (thickness 125 μm) as substrate. The graphite slurry followed the same slurry composition described in Table 1 but was then cast on the polyimide substrate. The electrodes were then structured with simple lines and using the same OPTEC™ micromachining system at 100 μm hatch to allow maximum electrolyte retention and optimized intensity. Strips of 29 × 8.6 mm2 were then soaked in the same LP57 solution for 2 h and also at varying LiPF6 concentrations (1.0 M, 1.4 M, 1.8 M). The strips were then removed of excess electrolyte and were sandwiched in custom class slides to center the sample in the glass NMR tube. The following nuclei were chosen to represent the following electrolyte components:
  • 1H: ethyl carbonate and methyl carbonate;
  • 7Li: Li+ from LiPF6;
  • 19F: PF6 from LiPF6.
Compensation of convection-induced effects was used to make sure that the diffusion values were purely from self-diffusion.

3. Results and Discussion

3.1. Electrochemical Characterization

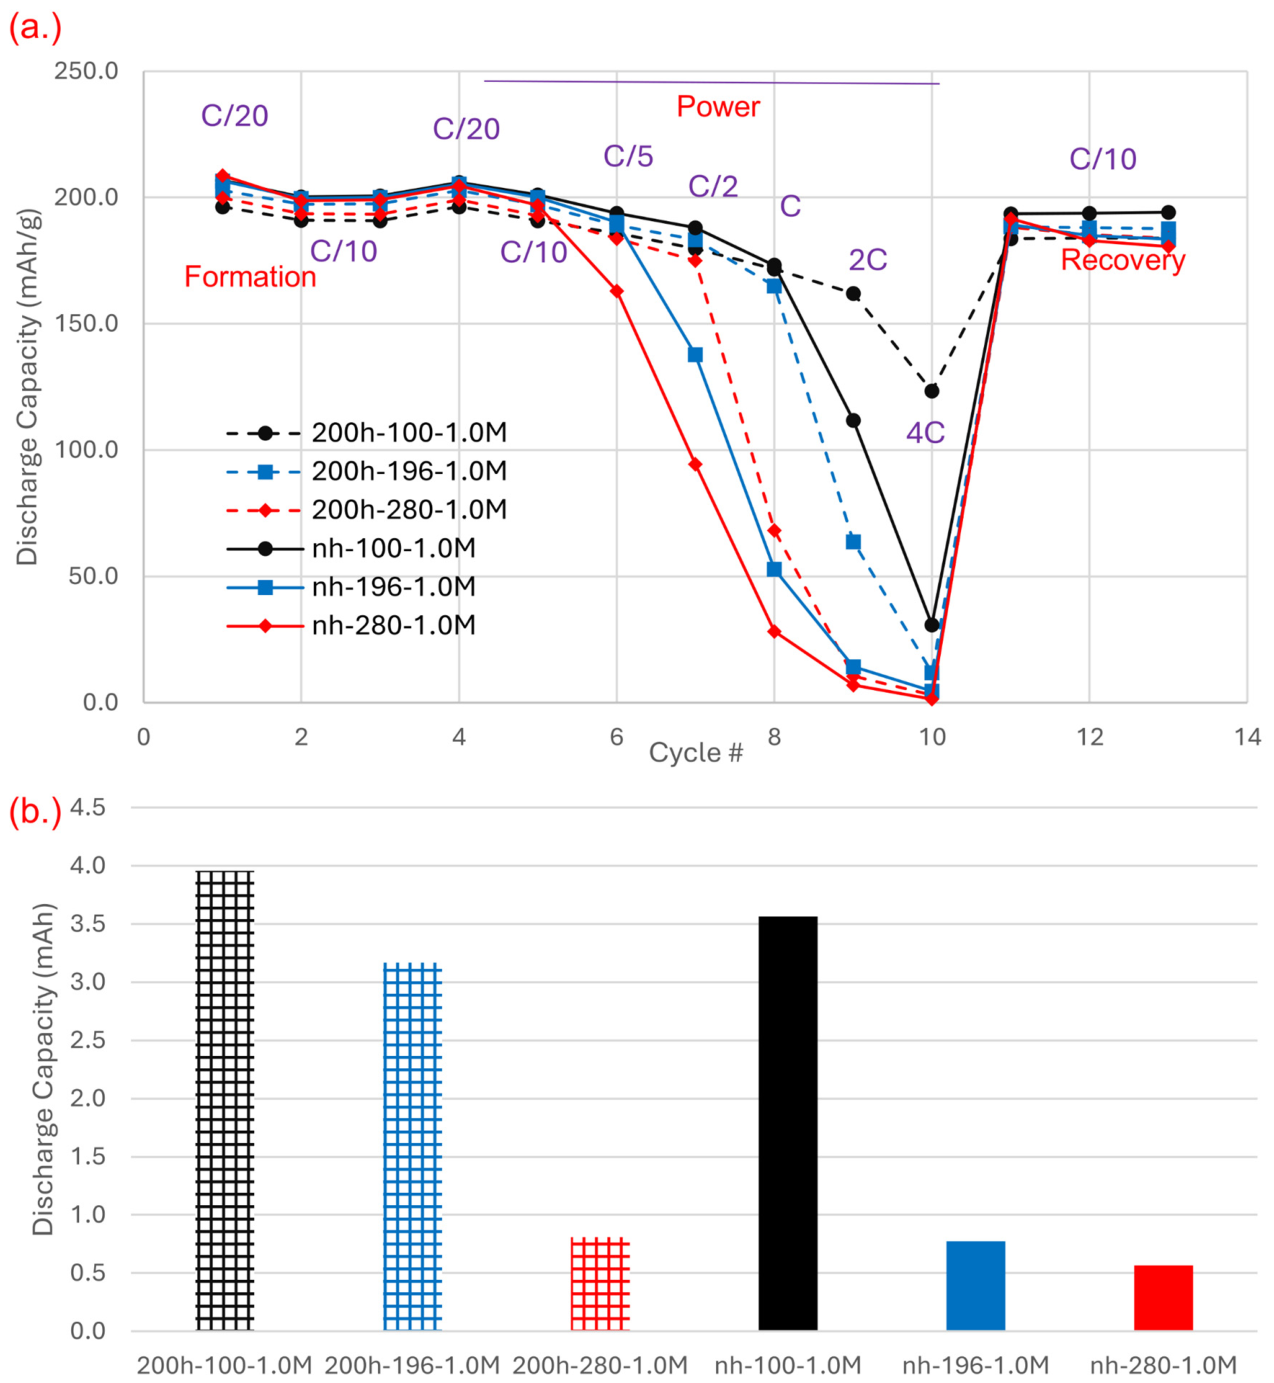
Power-test results for NMC 811 lithiation in half-cells are shown in Figure 2a. Sample electrode specifications are described in Table 5. The most prominent feature is the decline of capacity delivered at rates higher than C*. C* is the rate before the capacity starts to spontaneously drop, marking the boundary between the electronically controlled region and the diffusion-controlled region [2]. C* also tends to shift to higher C-rates as either electrode thickness (i.e., lithium migration path becomes longer) and/or concentration increases (i.e., lithium diffusion is slowed down by the increased viscosity). The dotted lines represent the structured electrodes that showed better capacity delivery than their unstructured counterparts. Moreover, 200h-100-1.0M exhibited the best capacity vs. all samples especially at 4 C. In addition, we see a dramatic improvement in capacity delivery for 200h-196-1.0M vs. its unstructured counterpart nh-196-1.0M.
As demonstrated by Besnard et al. [2], the shift of C* to higher rates for the structured electrodes vs. their unstructured counterparts stems from the improvement in Li+ mobility during cycling. However, this improvement does not translate much to 200h-280-1.0M at 2C, which only delivered 1.3x improvement against its unstructured counterpart. Also, gravimetric capacity is often cited in the literature as the metric to normalize capacity performance against the total mass of active material. One can argue that even if the specific capacity is not comparatively significant, the total capacity delivered could be comparative when the total active mass is then considered, which is not the case, as can be seen in Figure 2b. This is an interesting result suggesting that the depth of the channel and the electrode thickness are contributing factors in the power performance in laser-structured electrodes.
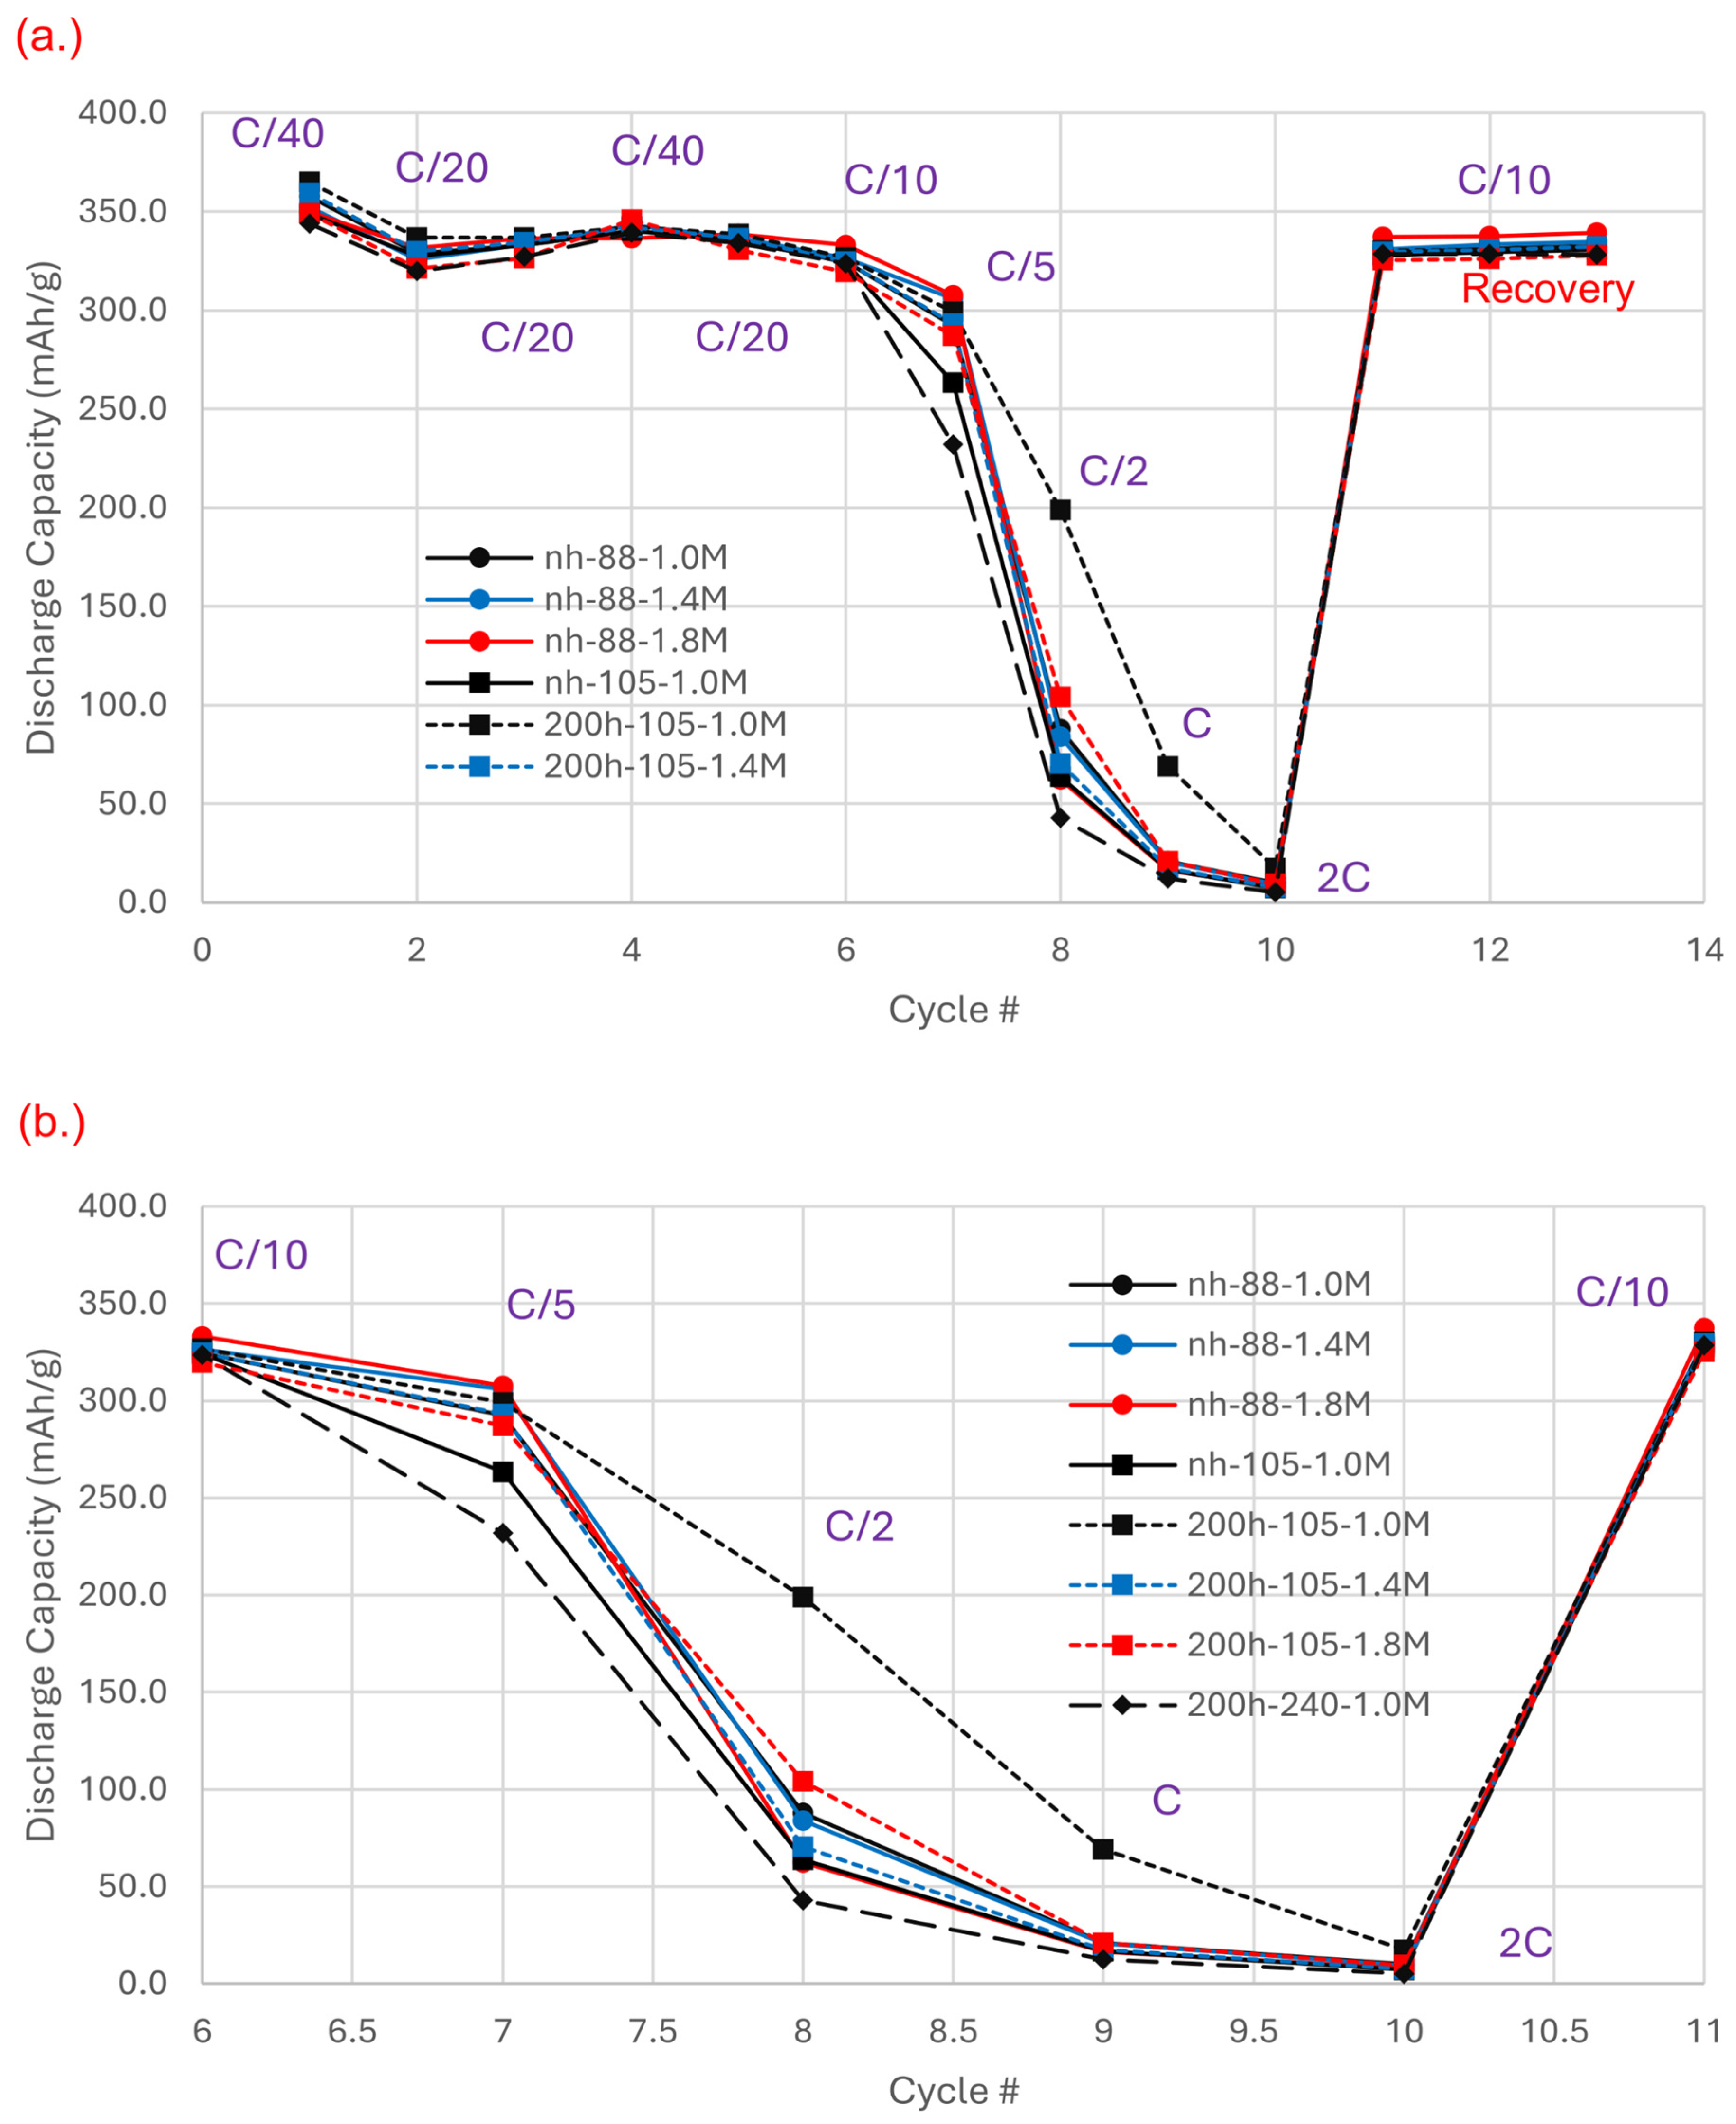
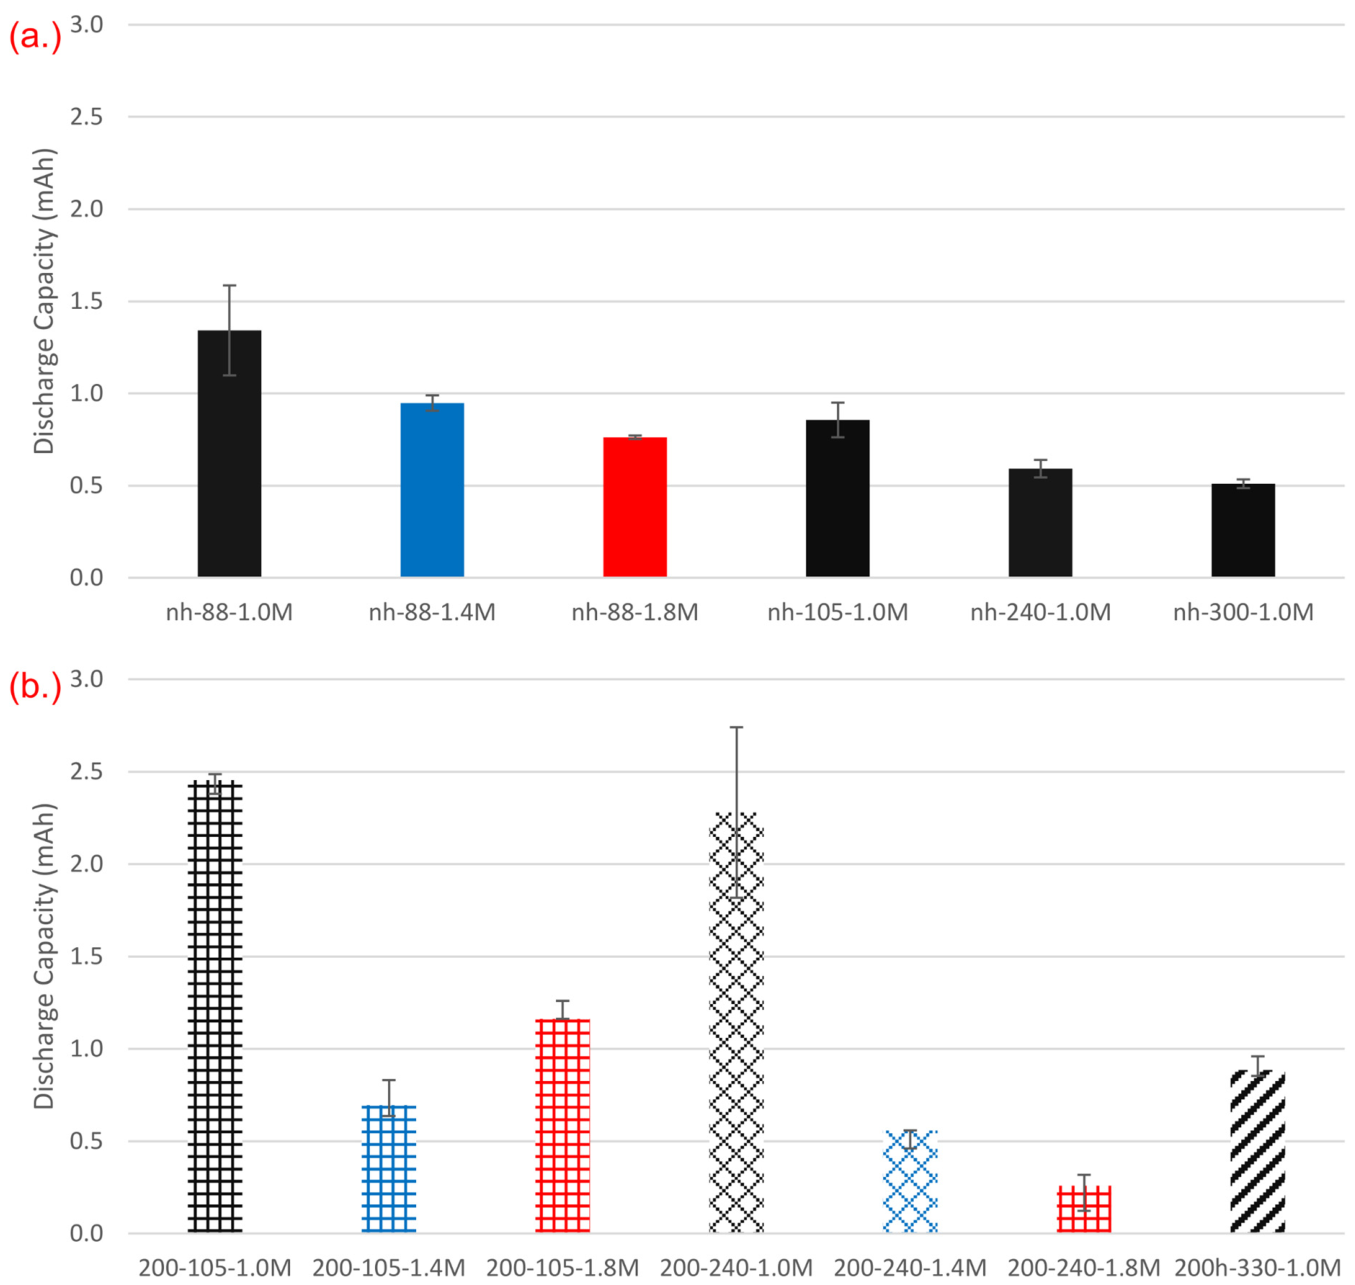
Power test results for representative graphite half cells with 3.8–4 mAh/cm2 loading during lithiation are shown in Figure 3. These graphite electrodes were cycled at different heights with or without laser patterning. The detailed legends for the samples in this comparison are found in Table 6. Note that the AM (active mass) loading corresponds to the 93% of graphite found in the samples. Two sets of baseline data were taken from unstructured graphite electrodes with a height of 105 μm (4 mAh/cm2) and circle markers for electrodes with a height of 88 μm (3.8 mAh/cm2). The fundamental difference in baseline loading stems from the fact that some active material is lost upon the structuring of the 4 mAh/cm2 graphite electrode, and the structured electrode loading is lowered to 3.8 mAh/cm2. Current densities applied during cycling are therefore adjusted accordingly. Therefore, it is still imperative to compare against both baselines, i.e., to examine the power differences before and after ablation for the same base electrode and vs. an unstructured electrode displaying the same reduced loading. Different colors also indicate cycling at different salt concentrations. At first glance, the most defining feature is the dip at C/5 which could be the characteristic C* for all cells. Comparing the different baseline samples (nh-88-1.0M vs. nh-105-1.0M), we can see that nh-105-1.0M has a lower gravimetric performance than that of nh-88-1.0M. However, when we convert the total capacity delivered at C/2, the total charge delivered occurs at about 1.0 mAh, which is almost equivalent. We also observed that nh-88-1.4M and nh-88-1.8M exhibit comparable or slightly lower performance than what was found for 1.0 M. As seen from the comparison of unstructured vs. structured electrodes (with similar loadings) at 1.0, 1.4 and 1.8 M, patterning has a stronger effect at 1.0 M: the improvements seen between nh-88-1.0M and 200h-105-1.0M are significant compared to the difference between nh-88-1.4M and 200h-105-1.4M and between nh-88-1.8M and 200h-105-1.8M. The lowest performance was observed with 200h-240-1.0M. Note that 200h-240-1.0M had a diameter of 8.5 mm to match the average loading of 12.7 mg for all the cells compared here. During the recovery cycle at C/10, nh-88-1.8M exhibited the highest recovery capacity, but all the electrodes exhibited a higher capacity value than the first C/10 cycle during the main power test sequence.
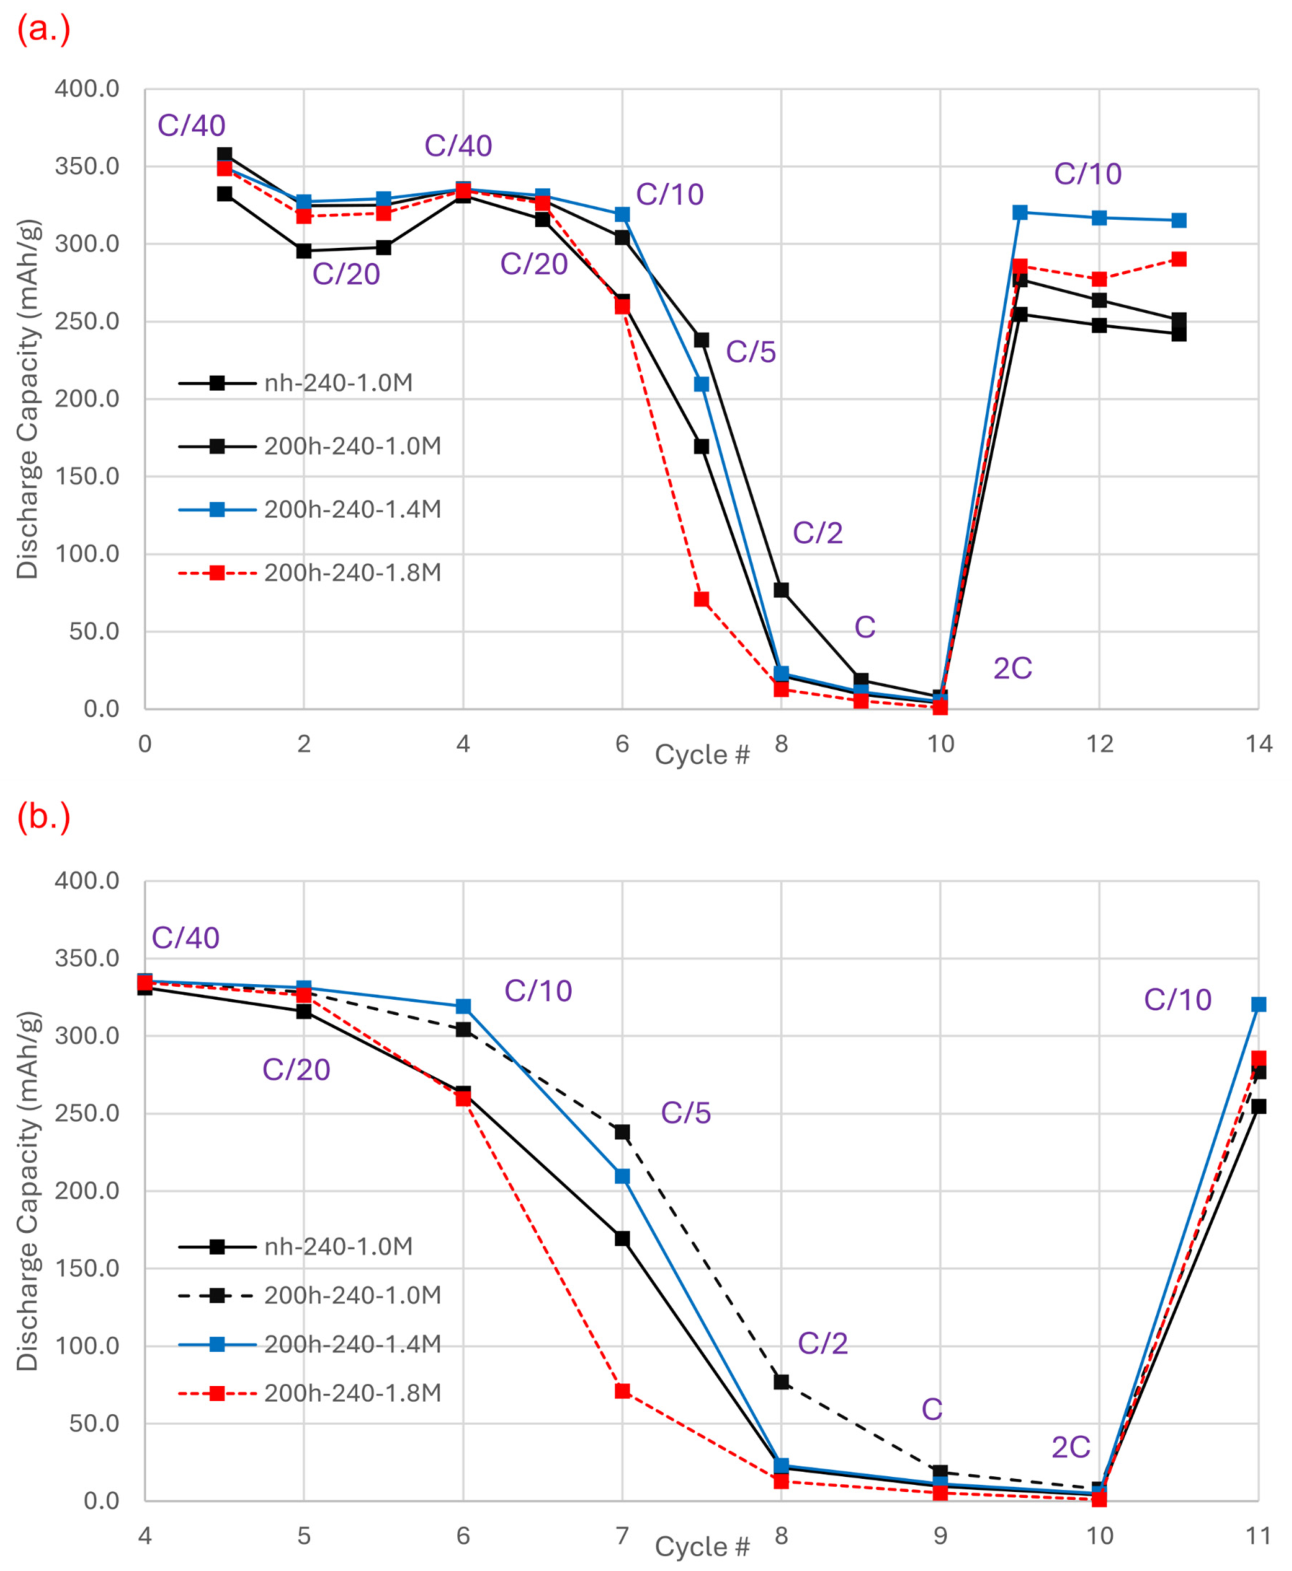
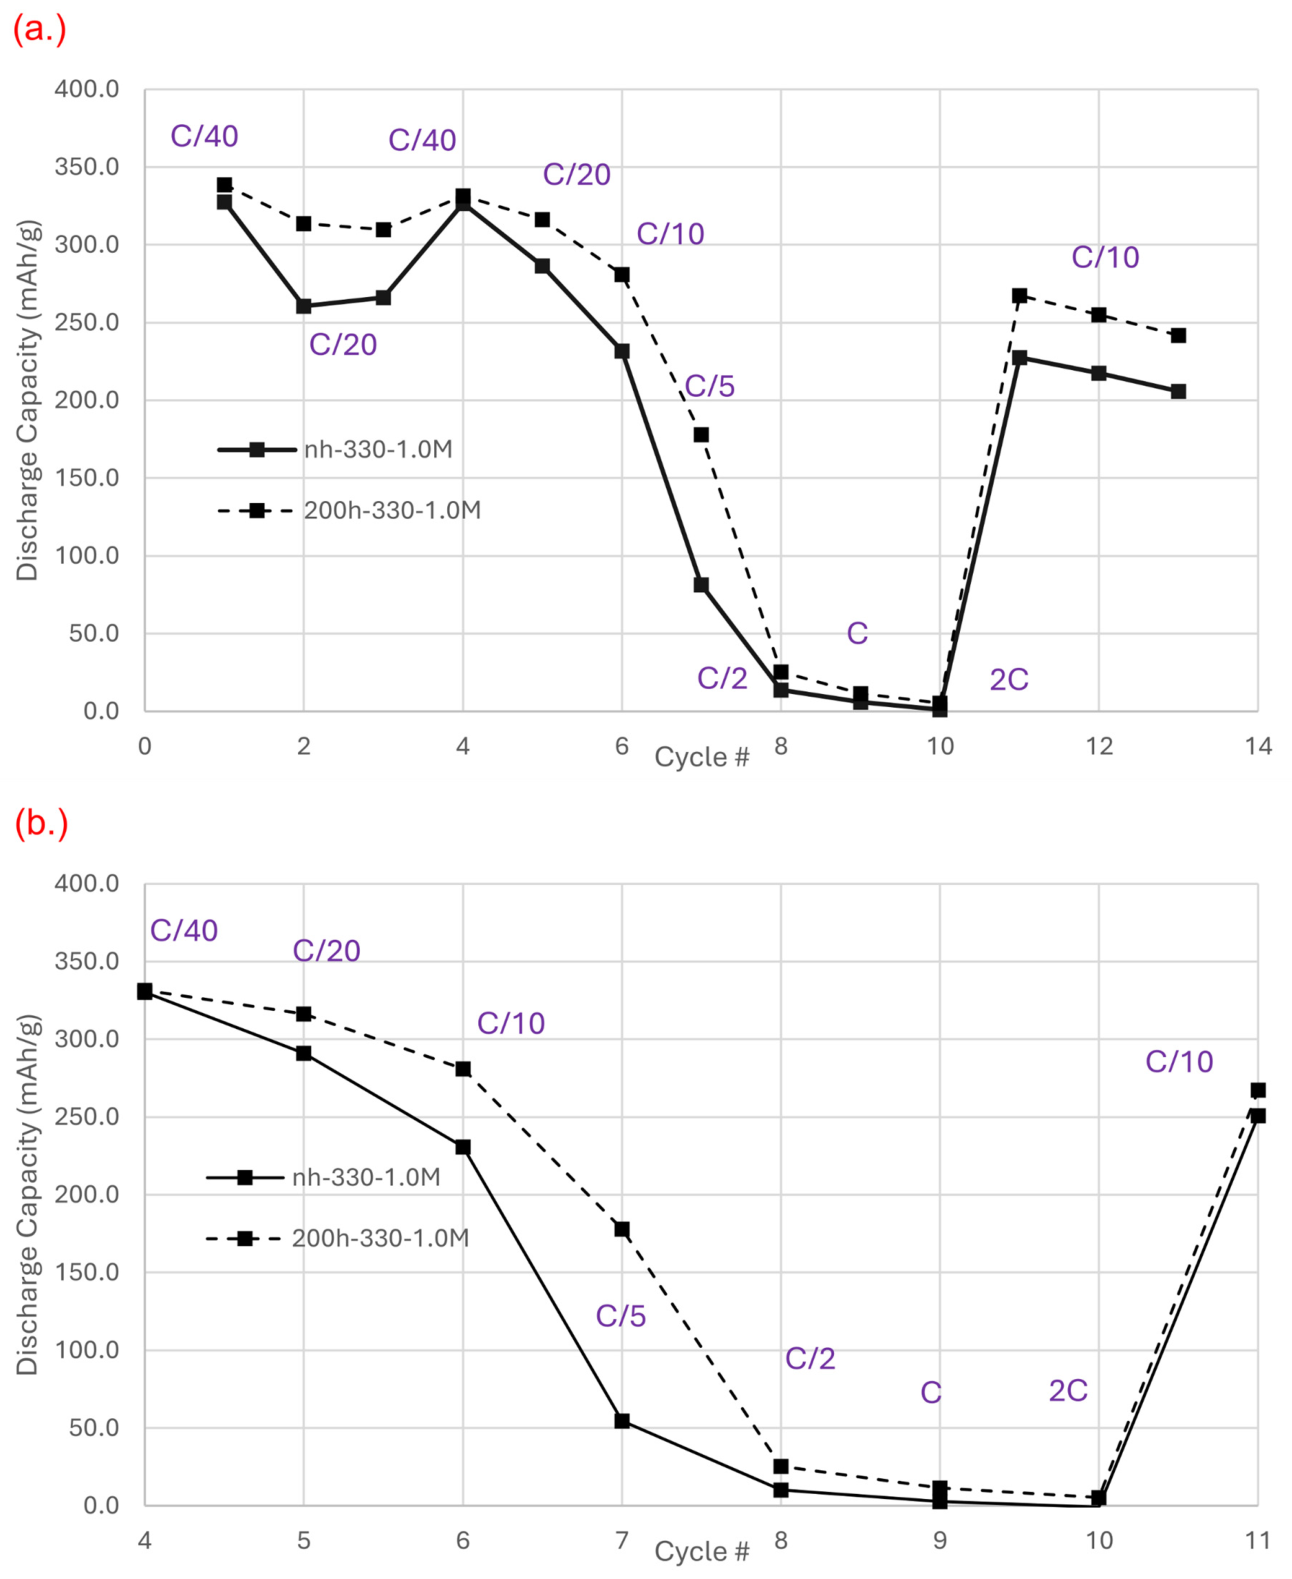
Power test results for representative graphite half cells with 7–9 mAh/cm2 loading during lithiation are shown in Figure 4. The electrodes are also cycled at different rates with and without structuring. The detailed legends for the samples in this comparison are found in Table 7. Cycling at different LiPF6 concentrations were only done for the ablated electrodes. Here, the C* shift from C/5 to either C/20 or C/10 in comparison to what was observed earlier with electrodes of 3–4 mAh loading can be seen. 200h-240-1.0M exhibited the best power performance behavior similar to the observed trend with the thinner electrodes (3–4 mAh/cm2 loading). 200h-240-1.4M showed almost the same capacity as nh-240-1.0M at C/2 to 2C, while 200h-240-1.8M showed lower capacities in this region. Interestingly, 200h-240-1.4M exhibited the best recovery capacity at C/10, with 200h-240-1.8M showing a slight increase in the third recovery cycle. Both nh-240-1.0M and 200h-240-1.0M exhibited a slight decreasing trend during the whole recovery sequence. Power test results for representative graphite half cells with 11–12 mAh/cm2 loading during lithiation are shown in Figure 5. The electrodes are also cycled at different rates with and without structuring. The detailed legends for the samples in this comparison are found in Table 8. Immediately, we can see that the C* shifted even further to C/40 in comparison to the electrodes described earlier. 330h-240-1.0M exhibited better power performance than nh-240-1.0M. Both electrodes exhibited a lower recovery capacity at C/10 and showed a downward trend up to the third recovery cycle.
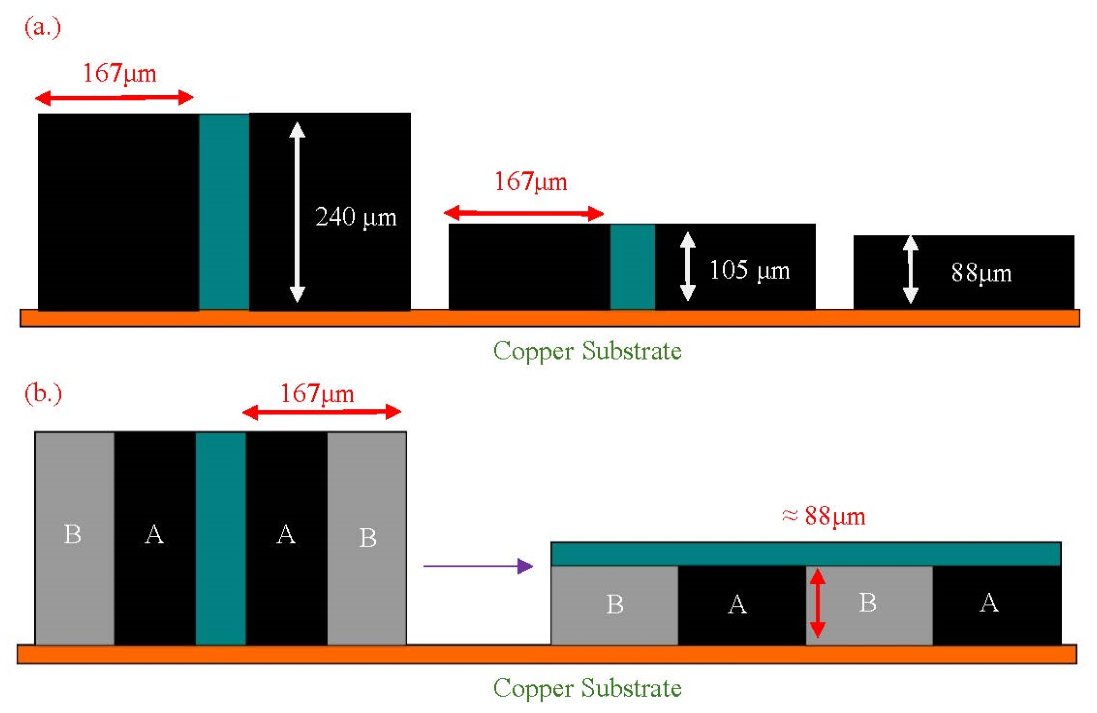
As stated earlier in the section on NMC 811, different works by Pfleging et al. [4,5,6] indicate that laser structuring increases power performance for electrodes ≤100 μm. This has been attributed to better diffusion kinetics and electrolyte access provided by the channels for the LiPF6 salt to reach the deeper recesses of the electrode. However, we pose another hypothesis wherein the increase in power performance could stem from how the structuring mimics the geometry of a thinner, unstructured electrode (Figure 3). The basis for this hypothesis stems from multiple works showing that thinner electrodes have the best power performance, as lithium ions have shorter distances to migrate (from the electrolyte reservoir in the separator to the active material surface) [1,2,3]. To test this hypothesis, we compared 200h-240-1.0M, 200h-105-1.0M and nh-88-1.0M. Figure 6 illustrates the geometric comparisons between the three electrodes. All three have almost the same graphite mass loading, and both 200h-240-1.0M and 200h-105-1.0M have a pillar width of 167 μm, which is almost twice the height of nh-88-1.0M. Dividing the pillar width and laying the two halves horizontally would mimic the geometry of an unstructured thinner electrode (nh-88-1.0M). Comparing the performance of the three electrodes reveals that 200h-105-1.0M showed the best performance at rates higher than C*. However, this was not the case for 200h-240-1.0M, which showed the worst performance even with the same mass loading. This suggests that the height of the channel is a factor in determining the power performance in structured electrodes. This is more obvious as we compare against different heights (Figure 4, Figure 5 and Figure 6). Both 200h-105-1.0M and 200h-240-1.0M showed the best performances in their mass loading categories, but 200h-105-1.0M had a C* shifted to the right relative to 200h-240-1.0M in addition to the observed highest specific capacity. This suggests that the trench height is a determining factor in the performance of line-structured electrodes.
The power performance for structured electrodes with increased LiPF6 concentration also shows interesting behavior. It has been established that increased salt concentrations increase electrolyte viscosity and, in turn, decreases salt mobility [8,9,10]. Indeed, nh-88-1.4M and nh-88-1.8M have decreased performances vs. nh-88-1.0M. However, 200h-105-1.4M and 200h-105-1.8M do not exhibit the same improvement as that seen with 200h-105-1.0M. Moreover, the same trend is observed for electrodes with 7–8 mAh/cm2. This confirms that concentration is a considerable factor in determining the power performance in structured electrodes.
The total delivered capacities for the half cells at C/2 are shown in Figure 7. Each condition was tested using up to three replicate cells wherever possible, consistent with our general reproducibility protocol for cycling measurements, and the reported values represent the mean ± error across these replicates. C/2 was chosen, as it is the C-rate after the C* for the graphite electrodes of 3–4 mAh/cm2 and can also be considered as the start of the diffusion-controlled region for all electrodes. Results show that the highest total capacity delivered was attained with 200-105-1.0M. This is then followed by 200-240-1.0M and nh-105-1.8M. On average, the structured electrodes with salt concentrations higher than 1.0M performed worse than the unstructured electrodes with 1.0 M salt concentration. Moreover, the improvements for structured electrodes with higher concentration do not match what was observed with 200-105-1.0M. The values clearly show that even after taking mass into account, the total delivered capacity is best obtained with the structured thin electrode cycled at 1.0 M LiPF6. Moreover, structuring does not significantly improve power delivery for electrodes cycled at higher salt concentrations. This clearly shows that the additional active material in thicker electrodes (7 mAh/cm2–12 mAh/cm2) is not significantly utilized even with structuring and could be considered as unnecessary in the electrode. Moreover, we would also like to state and consider that ultrathick-film graphite electrodes cycled in half-cell configuration are noted for increased polarity that can lead to lithium plating onset that are different from full cells [11,12]. This lithium plating can contribute to both capacity loss and the cut-off potential of lithiation. Hence, we would like to state that these are not fully representative of the actual capacity delivered in full-cell configuration.
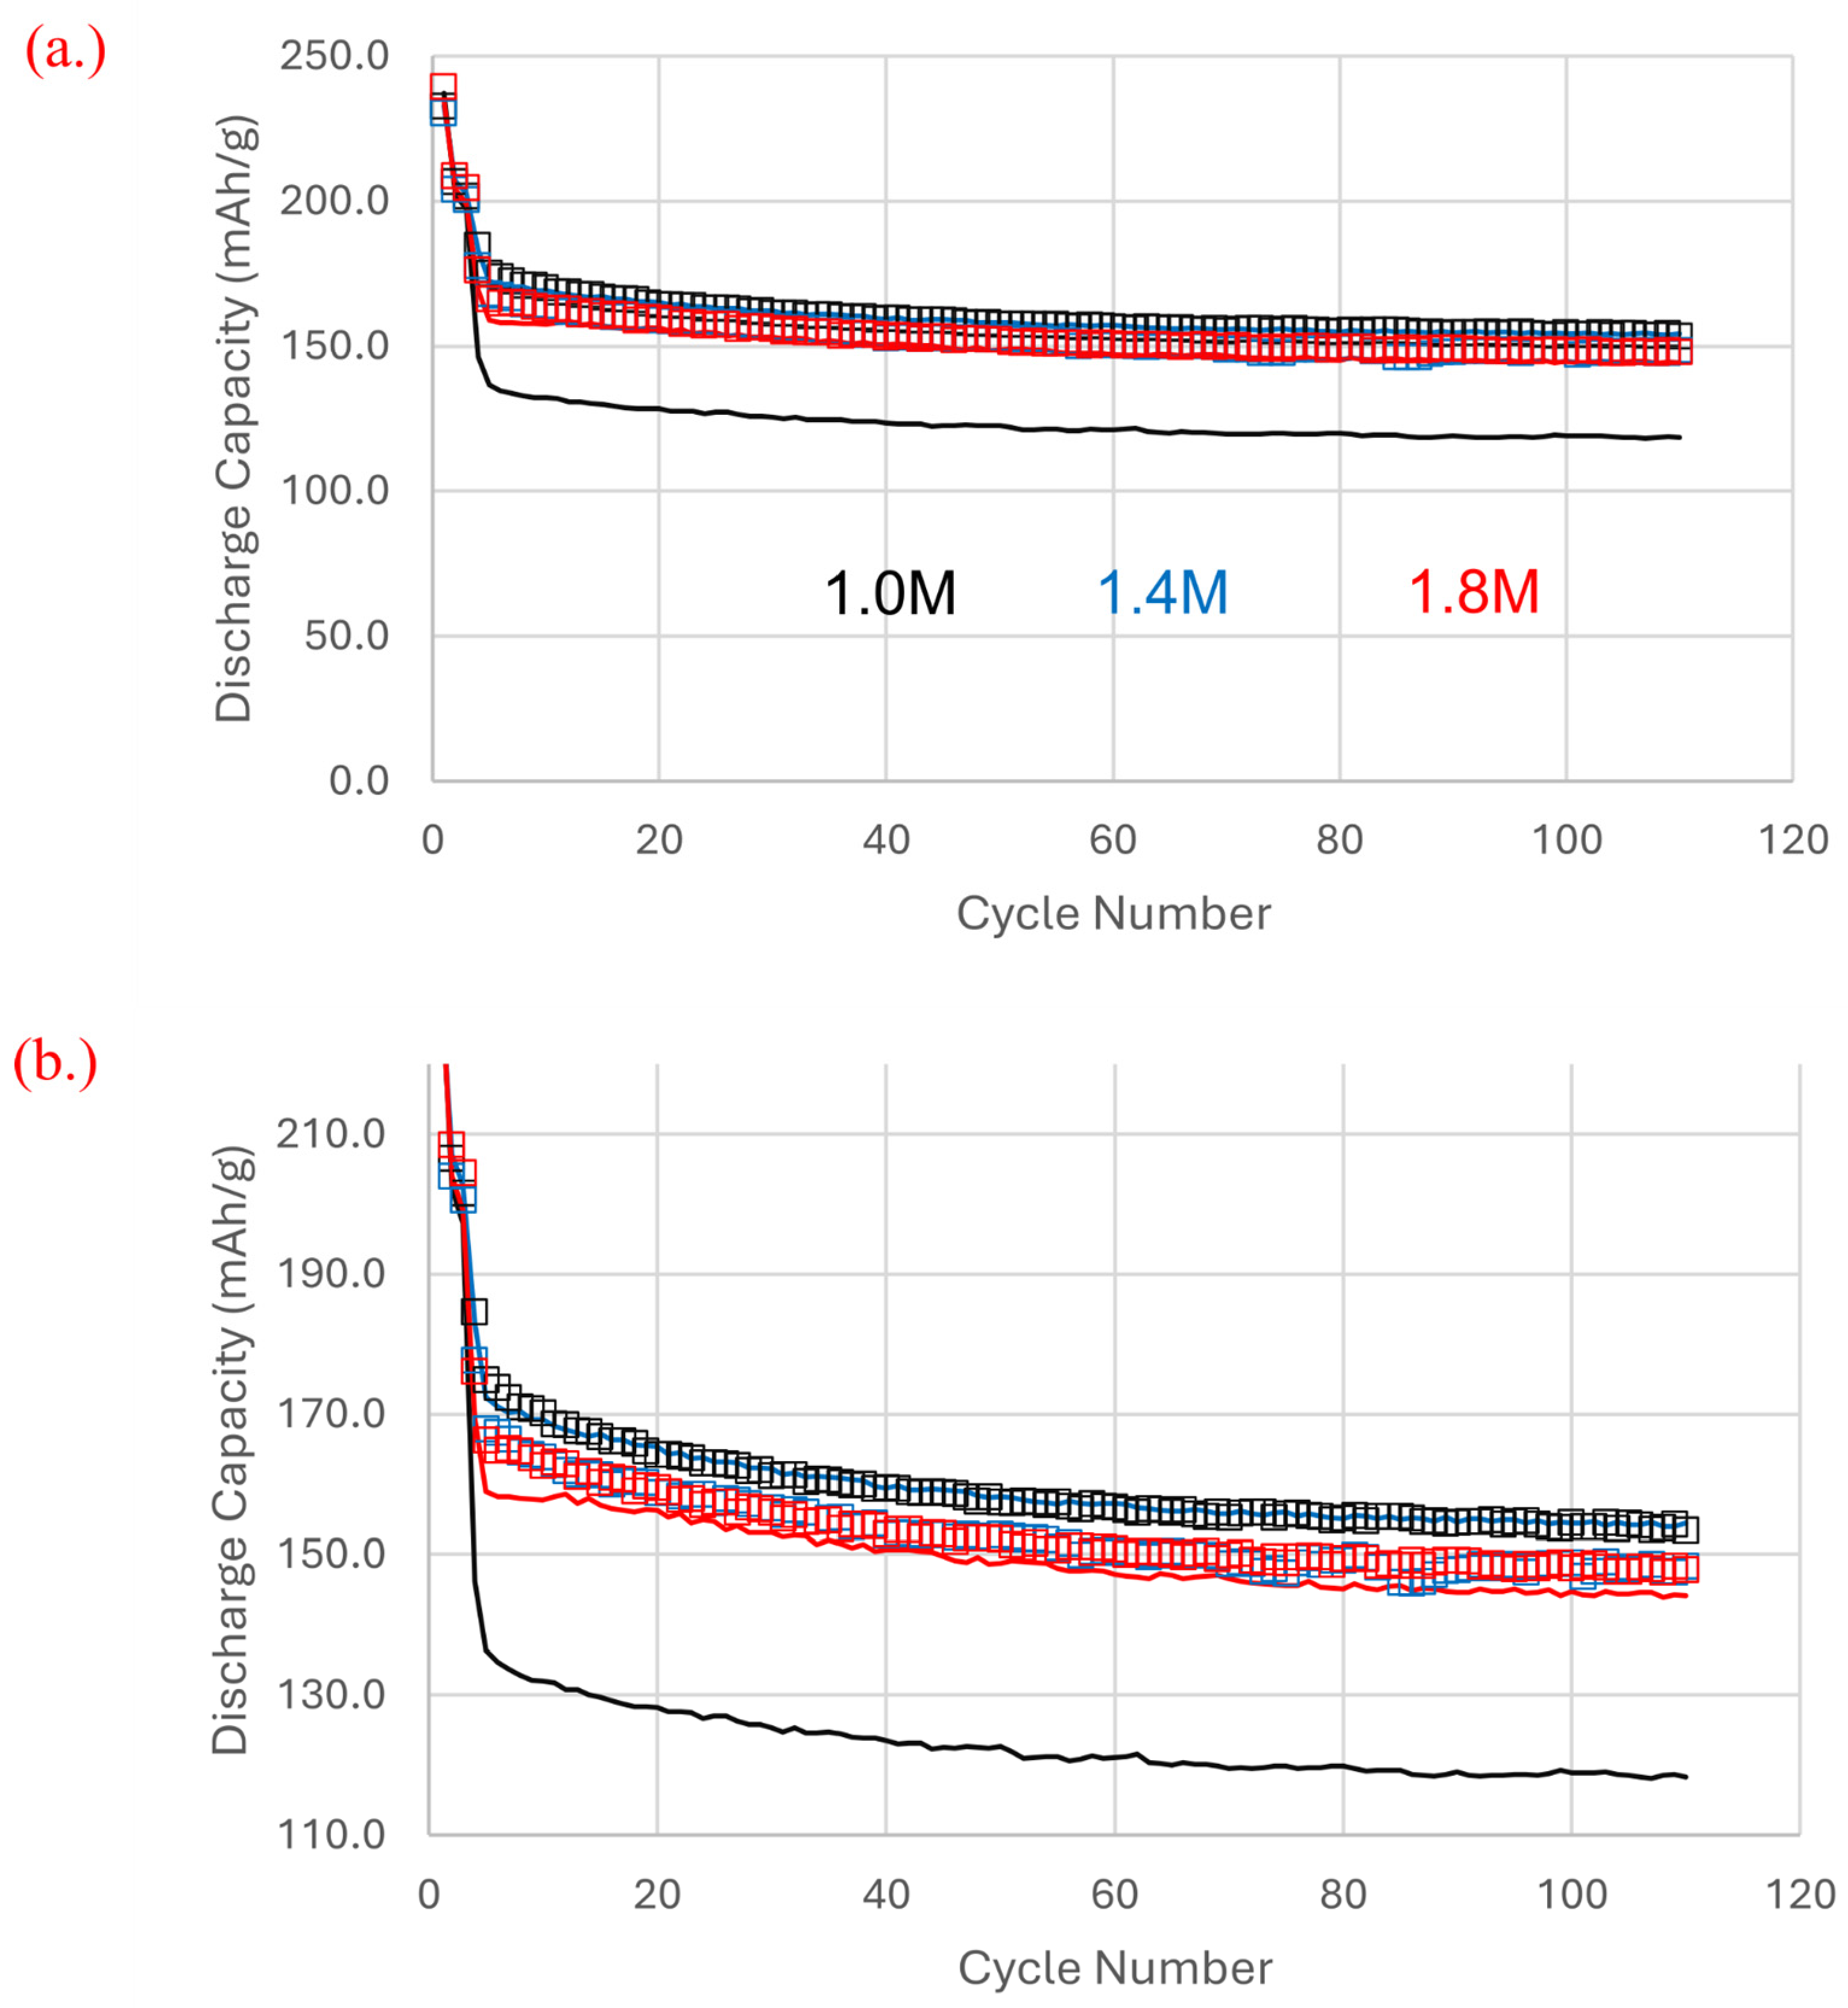
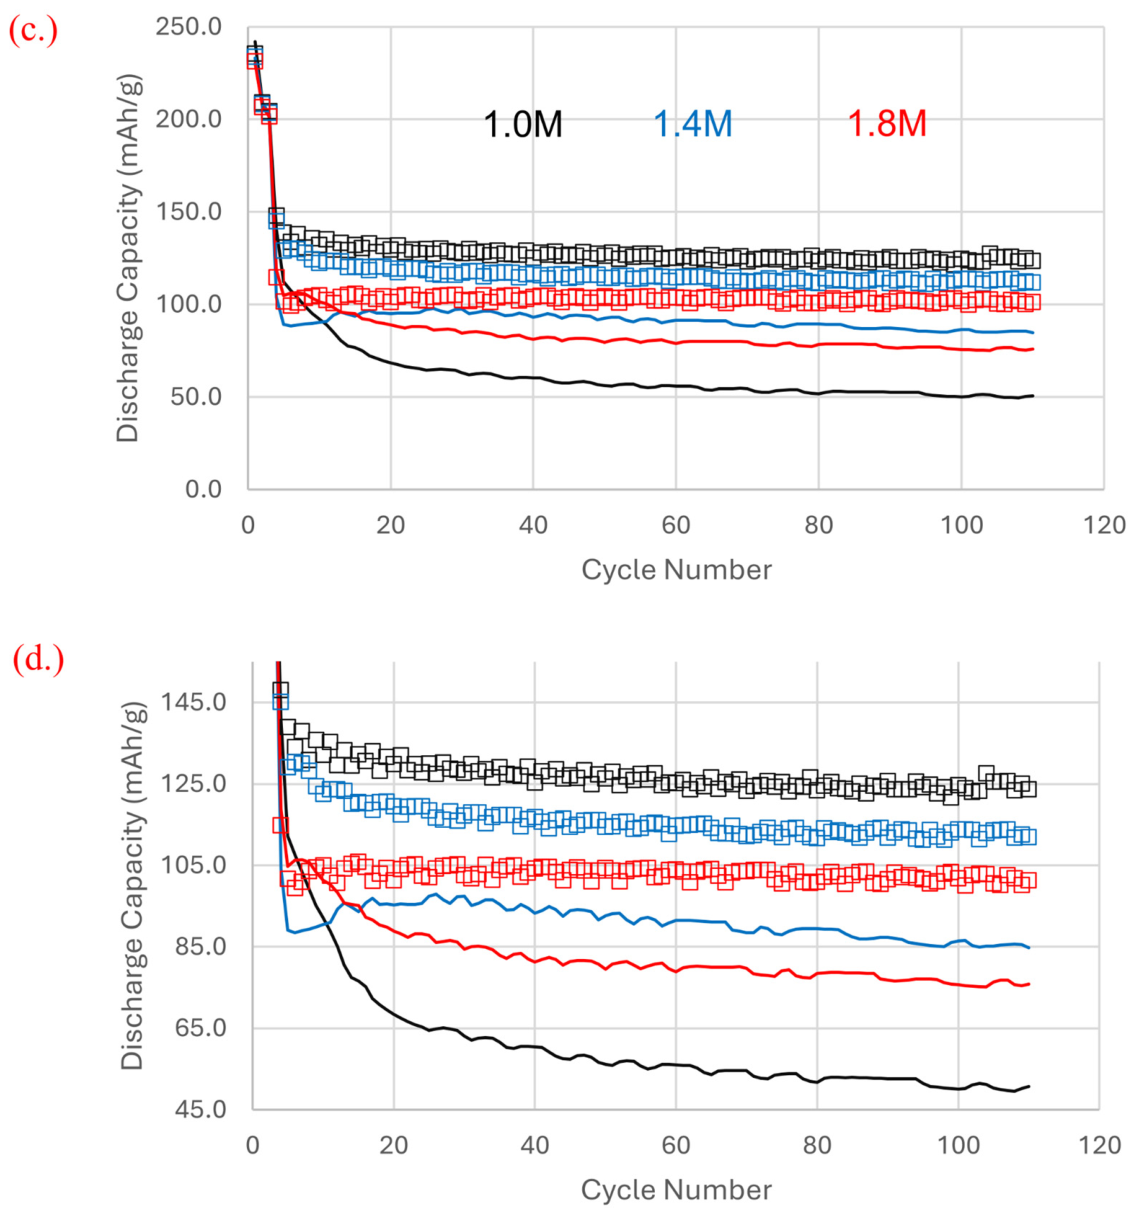
The long-term cycling performance of the full cells during charging at 1C for 100 cycles is shown in Figure 8. As expected, the full cells with 240 μm thick graphite electrodes exhibited lower capacities than those with 105 μm thick graphite electrodes. For non-ablated graphite full cells, we can see that the cell cycled with a 1.0 M electrolyte concentration had the lowest charge capacity across all electrode thicknesses. Interestingly, we can see that the cells cycled at 1.4 M and 1.8 M concentrations performed well in both non-ablated and ablated graphite electrodes at a thickness of 105 μm. Moreover, there is a drastic improvement in capacity delivery for the ablated graphite cycled at 1.0 M salt concentration and for both thicknesses. This drastic improvement does not occur in cells cycled at 1.4 M and 1.8 M concentrations at 105 μm thickness but is observed at 240 μm thickness. We can also see that the full cell with the 240 μm thick unstructured graphite electrode cycled at 1.0 M had a curve that is slightly approaching zero, suggesting the start of a capacity fading behavior. Interestingly, this fading behavior does not show up in structured graphite electrodes, especially at 240 μm thickness.
It has been shown by Wu et al. [10] that the increased salt concentration can contribute to a longer life cycle in full cells. This has been attributed to how increased concentration helps counteract salt depletion effects. Lower concentrations tend to create a thicker SEI layer at the anode, thereby creating concentration gradients and eventually decreasing ionic conductivity [13,14]. This could help explain the initial higher capacities observed for non-structured electrodes cycled at concentrations > 1.0 M. However, we can attribute the improvement at 1.0 M to the effect of better ionic access due to structuring. This improvement may not have been observed from cells cycled with increased salt concentrations due to their inherent higher viscosity that could offset the effect of laser structuring.

3.2. Lithium Plating on Graphite

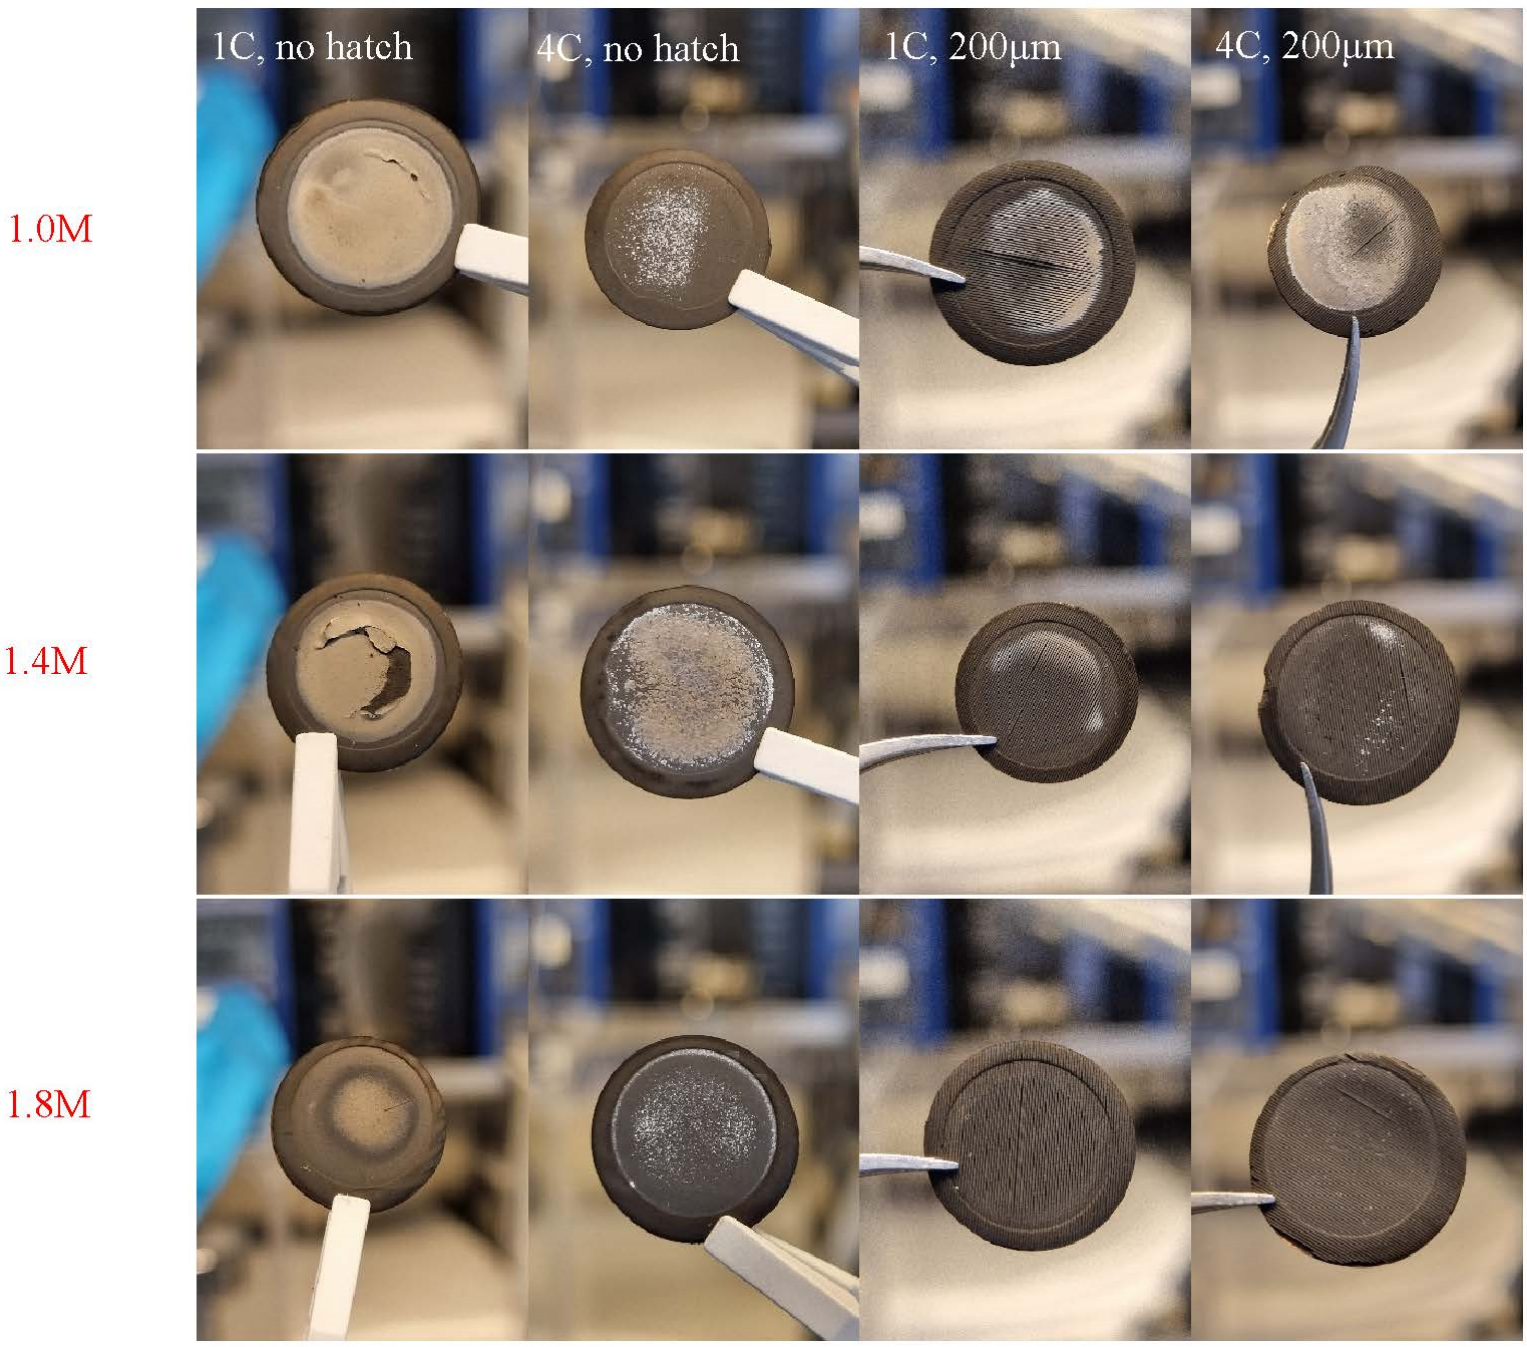
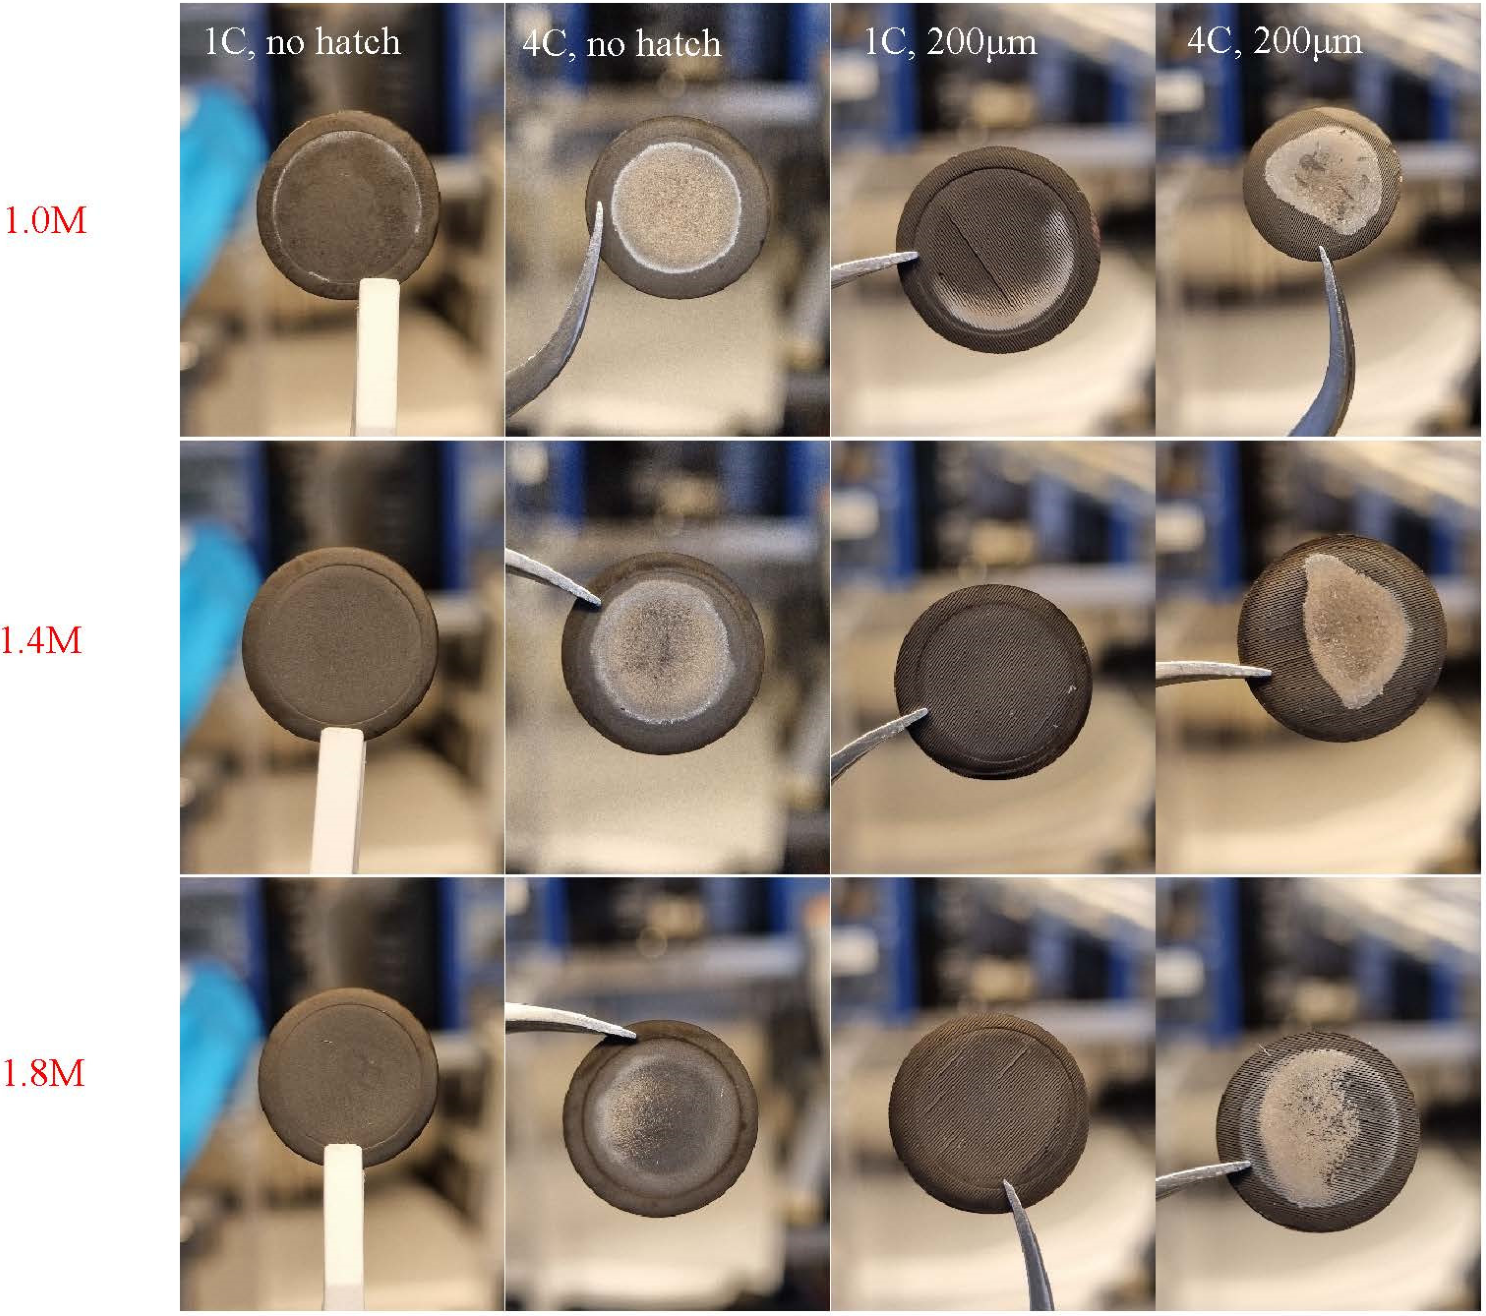
Lithium plating behavior was studied in the full cells via long-term cycling at different electrode thicknesses, C-rates and electrolyte concentrations (Figure 9 and Figure 10). For cells with 8 mAh/cm2 (210 μm thickness) loading, the cells cycled with 1.8 M LiPF6 exhibited the least amount of visual lithium plating. Furthermore, the plating was not visibly observed for electrodes that were structured. This was not the case for cells with 4 mAh/cm2 (105 μm thickness) loading. Minimal plating was observed for cells that were cycled at 1C regardless of structuring and with almost no plating starting from a salt concentration of 1.4 M. This was also observed in most of the cells shown here, but for graphite with a mass loading of 4 mAh/cm2, heavy plating was observed at 4C regardless of electrolyte concentration. The phenomenon of decreasing plating at increased salt concentrations was reported by Wu et.al. in full cells [9]. As stated in the earlier section, the thicker SEI layer at lower concentrations affects cell resistance, which decreases ionic conductivity [12,13]. This, in turn, increases cell resistance, which contributes to higher onset potentials and thus plating [15]. This could help explain the observed plating generally observed for graphite cycled at 1.0 M. It is interesting to note that the effect of structuring in mitigating lithium plating is more pronounced for electrodes at 210 μm thickness than at 105 μm at 1C. The presence of structured channels mitigates the higher ionic resistances present in thicker electrodes. This plating is more suppressed/greatly diminished at increasing concentrations, especially at 1.8 M.

3.3. Pulsed-Field Gradient Stimulated Spin-Echo NMR

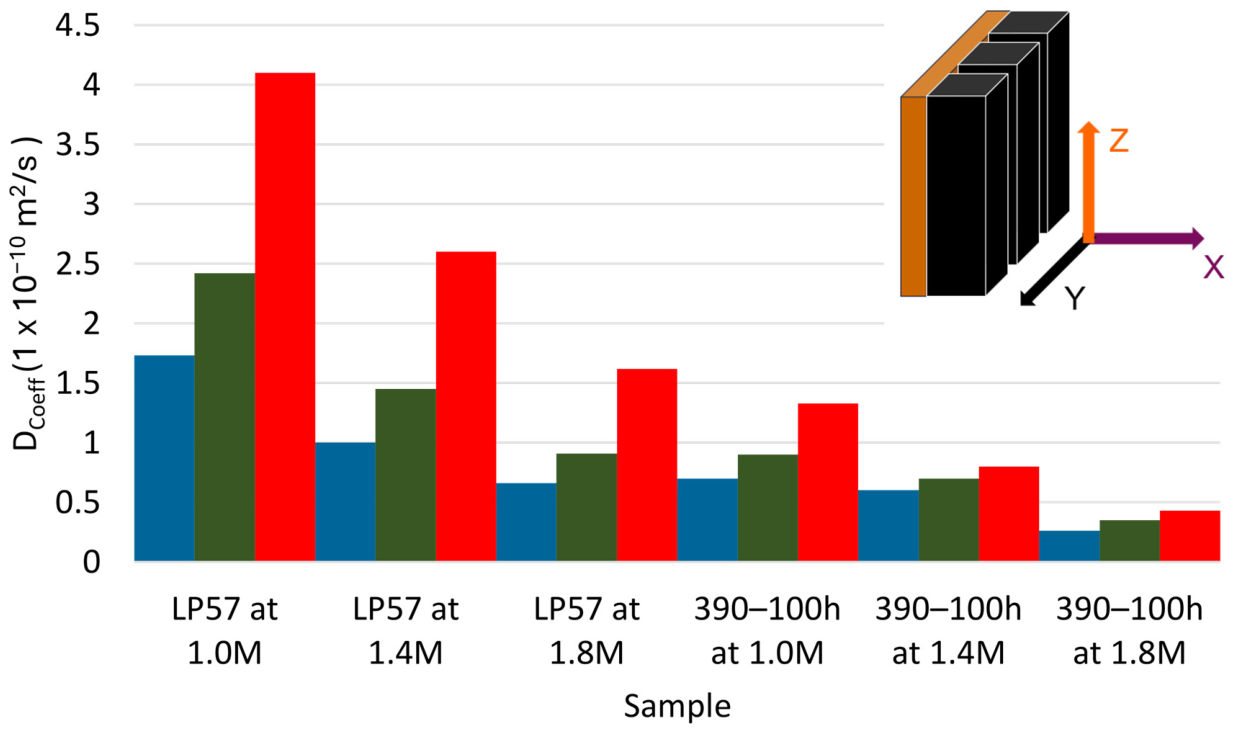
PFG-STE NMR is a classic NMR technique for determining diffusion coefficients in multiple systems ranging from pure liquids to porous systems in rocks. It exploits the stimulated spin-echo phenomenon [14]. We performed PFG-STE to directly determine the diffusion coefficients of the electrolyte species contained in the pure electrolyte and those contained in the trench. Bipolar gradient pulses were used to avoid effects from internal gradients, and a sequence with convection compensation was used for the pure electrolyte [16]. The results of the PFG-STE measurements along the z-direction are shown in Figure 11. The structured sample used in this measurement is graphite with a thickness of 390 μm and hatch of 100 μm. It is first important to note the absence of values coming from samples that are not laser ablated. This is to highlight a key limitation of diffusion NMR, which is the effect of internal magnetic field gradients on T2. PFG-STE NMR is a technique to measure self-diffusion which relies completely on observing the NMR signal’s attenuation behavior at increasing gradient strengths in space. No diffusion means no observable attenuation and vice versa. It has been known that a porous environment, especially with a difference in magnetic susceptibility between the solid material and the liquid, creates internal gradients that disrupt the intended effect of the applied gradients in the experiment [17]. Moreover, the constricted nature of the electrode pores leads to very small T2 values. Low T2 values do not allow enough time for the applied gradient’s dephasing effect to fully realize; thus, the desired attenuation behavior cannot be achieved. This leads to the lack of successful measurements in the literature in determining the self-diffusion coefficients of the electrolyte species in real electrodes via diffusion NMR. However, the successful determination of the self-diffusion coefficient values with PFG-SE NMR along the z-direction (Figure 11) already demonstrates that the liquid in the trenches is more labile in comparison to the unstructured samples. We would also like to highlight that we chose to perform this measurement with the thickest available electrode to maximize the amount of electrolyte trapped in the channels, thereby maximizing the signal acquisition which depends on the amount of sample present.
However, the most obvious feature is that the self-diffusion coefficients of the species in the electrode trenches do not have the same values as those in the bulk electrolyte. This value decreases as we increase hatch distance and decrease with the thickness of the electrodes. Moreover, the ratio of decrease is not the same for each species. The Li+ diffusion coefficient in 1M LP57 drops from 1.7·10−10 m2/s to 6.6·10−11 m2/s (i.e., a drop by a factor of 2.6) when measured inside the trenches with a 50 ms diffusion delay, similarly to the anion diffusion coefficient, which drops from 2.4·10−10 m2/s to 9.4·10−11 m2/s inside the trench. Over a Δ = 50 ms delay, the diffusion length inside the trench is expected to range around (2DΔ)1/2 = 4 μm for Li+ and 5 μm for PF6, which is smaller than the width of the trench (20 μm). Such a large drop in the self-diffusion coefficient could only be explained by a very high tortuosity inside the porous electrode, and therefore, it is very likely that the large drop in the diffusion coefficient may also result from interactions with the solvated binder that escapes the electrode and partly diffuses into the trenches, increasing the electrolyte’s viscosity. Overall, the observed values demonstrate decreasing electrolyte diffusion at increasing concentrations, further supporting the observed power-performance data and showing that the electrolyte in the channels does not emulate the same ion-diffusion values found in the bulk electrolyte.

3.4. Recycling of Ablated Materials

Ablated material from both graphite and NMC electrodes were collected using a custom filter setup (Figure S2). The ablates were collected from material irradiated with green laser. Samples were analyzed using radio-frequency-driven recoupling (RFDR) NMR, XRD, and Raman spectroscopy. XRD diffraction patterns for both pristine and ablated NMC-811 are shown in Figure S3. The most notable difference is the lack of many prominent peaks that are characteristic of pristine NMC 811’s hexagonal R 3 ¯ m structure in the diffraction pattern of the ablated NMC. Additional peaks were also found around 2θ of 38°, and those at 44° and 65° have been associated with phase change to a rock salt structure [18,19]. We also performed radio-frequency-driven recoupling (RFDR) NMR on 7Li of the NMC 811 ablate. RFDR NMR is a technique that exploits the dipolar interactions between the spins of the same nuclei which can reveal the sub-nanometer proximity between distinct NMR signatures [20]. Additionally, if cross peaks are observed between the same nuclei contained in different environments, it can be surmised that the two phases are connected and that magnetization exchange is possible between the two phases. Figure S4 shows that two phases are indeed present in the sample, a broad peak corresponding to the pristine NMC signature and a small peak which appears after ablation. These two environments do not share a cross-peak, confirming that these two signatures likely do not belong to the same phase. As this complements the earlier XRD results, we can surmise that the narrow part comes from the rock salt structure as the degradation product of ablating NMC 811 [21]. Therefore, reformulations and electrochemical cycling for NMC 811 ablate were not performed. This is due to that further chemical processing must be conducted to recover the pristine NMC 811, which was not the focus of this study and thus was not undertaken.
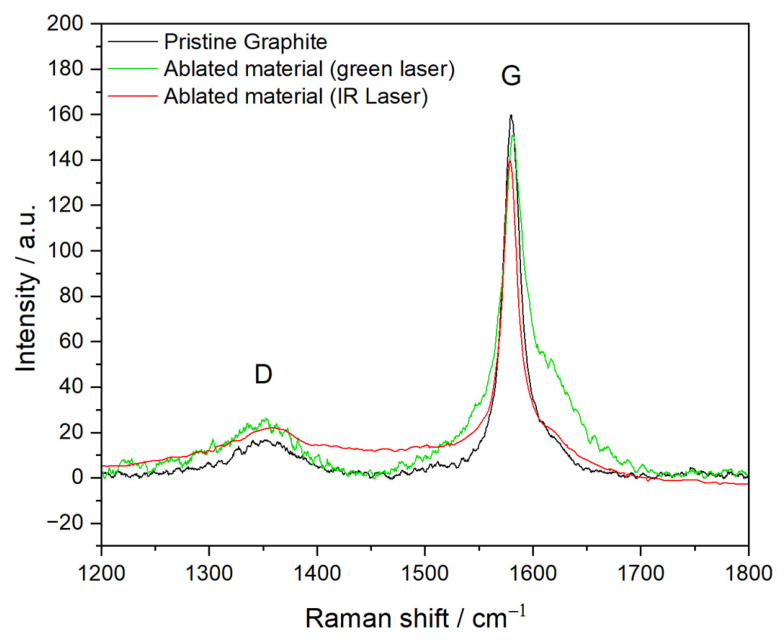
Raman spectroscopy was also used to compare the structures of graphite ablates and the pristine graphite (Figure 12). The spectra show the same isotropic peak for graphite (1350 cm−1, 1580 cm−1) in all cases. This signals the presence of graphitic carbon even in the ablated powders. Interestingly, a broad shoulder can be seen for the peak of 1650 cm−1 for the green laser ablate. This can be attributed to a higher surface modification with the ablates from the green laser. The Raman spectrometry results complement what was found in SEM measurements, where electrochemically active graphite was still present, and its particle micromorphology was almost the same (Figure S2). Reformulation was then attempted with the graphite ablates using the same slurry process found in the experimental section. Slight adjustments were made with the mass ratio formulation, wherein we assumed that the pure collected ablates carried the same ratio and total amount of additives upon ablation (Table 1). Upon reformulation, we then adjusted the theoretical amount of active material to be lower than that in the original formulation (Table 9).
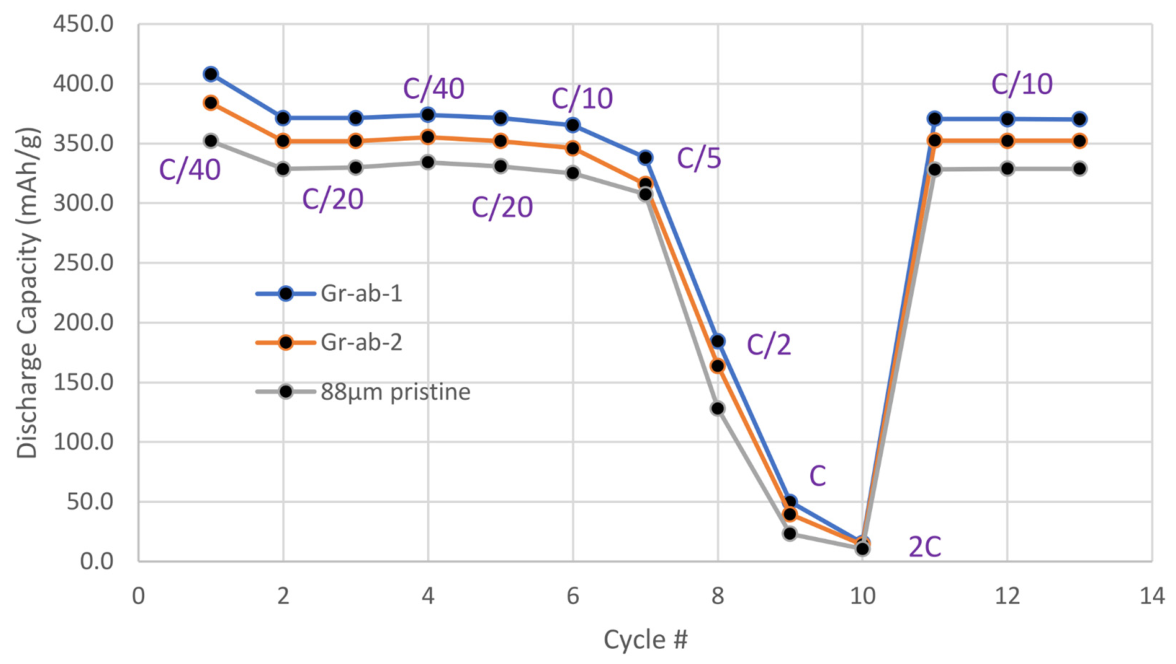
The power performance of the re-used graphite ablated materials is concisely described in (Figure 13). Immediately we can see that the first C/40 cycle exhibited a specific capacity exceeding 350 mAh/g which continued up to C/2. The C* was also observed at C/5, similar to what was seen with the graphite electrodes with 3–4mAh/cm2 in half-cell configuration. We then see a similar trend of decrease in capacity from C/2 to 2C followed by a constant recovery at C/10. The observed extra capacity can be a result of the approximation of the ablated material during formulation. The observed capacities suggest that there was still an excess of active material unaccounted for during formulation. However, attaining more than 330 mAh/g of specific capacity at low C-rates demonstrates that the collected graphite behaves electrochemically as pristine graphite. Moreover, the graphite can be already used as is and could be directly mixed without further treatment. The results are also in accordance with what Tancin et al. observed [19]. The graphite that they ablated with a near-infrared laser (λ = 1030) showed a comparable performance against pristine graphite and can be directly processed without further use. We would like to highlight that the graphite ablate that we processed and cycled in our study came from green laser (λ = 515 nm). Here we demonstrate that there are no significant differences in the ability to directly process graphite and its power performance with different processing lasers.


4. Conclusions

We explored the potential of laser ablation as a promising technique in improving the power performance of ultrathick-film battery electrodes. To explore its effect on ultrathick-film electrodes, we tested the structured electrodes at different composite film thicknesses and different salt concentrations. In half cells cycled at the 2032 coin-cell configuration, there was a general observable shift in C* to the right when unstructured and structured electrodes at elevated C-rates were compared, indicating the improvement of Li-ion transport. This improvement does not translate significantly for electrodes cycled at higher salt concentrations and thicknesses >200 μm due to increased electrolyte viscosity, as indicated by the reduced diffusion coefficients observed via PFG-SE NMR. Beneficial Li-salt concentration effects were more pronounced in full cells, as the increased concentration not only helps stabilize the cell but also diminishes the effect of laser ablation to the power performance. The results from PFG-SE NMR complements these observations, as the salt self-diffusion tends to decrease at higher concentrations even when the electrode has undergone micro-structuring. This highlights that there is a need for the right balance of laser patterning, electrolyte composition, electrode stability, SEI formation, and performance. The recyclability of the ablated active material was also explored, and it was found that graphite showed the most promise in direct re-use of the ablated material regardless of the laser irradiation source. In conclusion, the study demonstrates that the salt ion mobility in the bulk electrolyte is still a significant factor in determining the power performance in laser-structured electrodes, and the experimental exploration of other patterns and/or modelling studies would have to be performed in order to fully understand the penetration depth of the electrolyte salt in ablated electrodes.

Supplementary Materials

The following supporting information can be downloaded at: https://www.mdpi.com/article/10.3390/batteries12090377/s1, Figure S1: Long-Term Cycling Capacities at 4C; Figure S2: Filter Setup and SEM of Ablated Graphite Powders; Figure S3: XRD of Pristine vs. Ablated NMC 811; Figure S4: RFDR-NMR Spectra of Pristine vs. Ablated NMC 811.

Author Contributions

Conceptualization, S.T., M.D. and W.P.; methodology, S.T., V.S.-K., M.D. and W.P.; validation, S.T. and M.D.; formal analysis, S.T. and V.S.-K.; investigation, S.T. and V.S.-K.; resources, S.T., V.S.-K., M.D. and W.P.; data curation, S.T. and V.S.-K.; writing—original draft preparation, S.T.; writing—review and editing, M.D. and W.P.; visualization, S.T.; supervision, M.D. and W.P.; project administration, S.T. and W.P.; funding acquisition, S.T., M.D. and W.P. All authors have read and agreed to the published version of the manuscript.

Funding

This work was financially supported by the European Commission under the Marie Skłodowska-Curie Actions European Postdoctoral Fellowships of Horizon 2021 (UltraThickLas, Development of Ultrathick Laser Ablation for Ultrathick Electrode Processing, Grant agreement No 101063128). The project leading to this application has received funding from the European Union’s Horizon 2020 research and innovation program under grant agreement no. 101008500 (PANACEA: Pan-European solid-state NMR Infrastructure for Chemistry-Enabling Access).

Data Availability Statement

Data are included in this article and the Supplementary Materials. Further inquiries can be directed to the corresponding authors.

Acknowledgments

This work was financially supported by the European Commission under the Marie Skłodowska-Curie Actions European Postdoctoral Fellowships of Horizon 2021 (UltraThickLas, Development of Ultrathick Laser Ablation for Ultrathick Electrode Processing, Grant agreement No 101063128). The project leading to this application has received funding from the European Union’s Horizon 2020 research and innovation program under grant agreement no. 101008500 (PANACEA: Pan-European solid-state NMR Infrastructure for Chemistry-Enabling Access). We would like to thank Elodie Salager for his technical contributions for the NMR experiments, Heino Besser for the laser structuring experiments, Alexandra Reif for SEM, and Victoria Falkowski for Raman and XRD. We would also like to acknowledge Penghui Zhu for his continuous support related to cathode development.

Conflicts of Interest

The authors declare no conflicts of interest.

References

  1. Malifarge, S.; Delobel, B.; Delacourt, C. Experimental and modeling analysis of graphite electrodes with various thicknesses and porosities for high-energy-density Li-ion batteries. J. Electrochem. Soc. 2018, 165, A1275–A1287. [Google Scholar] [CrossRef] [Scilit]
  2. Besnard, N.; Etiemble, A.; Douillard, T.; Dubrunfaut, O.; Tran-Van, P.; Gautier, L.; Franger, S.; Badot, J.C.; Maire, E.; Lestriez, B. Multiscale Morphological and Electrical Characterization of Charge Transport Limitations to the Power Performance of Positive Electrode Blends for Lithium-Ion Batteries. Adv. Energy Mater. 2017, 7, 1602239. [Google Scholar] [CrossRef] [Scilit]
  3. Zhang, X.; Verhallen, T.W.; Labohm, F.; Wagemaker, M. Direct observation of Li-ion transport in electrodes under nonequilibrium conditions using neutron depth profiling. Adv. Energy Mater. 2015, 5, 1500498. [Google Scholar] [CrossRef] [Scilit]
  4. Nasajpour-Esfahani, N.; Garmestani, H.; Bagheritabar, M.; Jasim, D.J.; Toghraie, D.; Dadkhah, S.; Firoozeh, H. Comprehensive review of lithium-ion battery materials and development challenges. Renew. Sustain. Energy Rev. 2024, 203, 114783. [Google Scholar] [CrossRef] [Scilit]
  5. Pfleging, W.; Pröll, J. A new approach for rapid electrolyte wetting in tape cast electrodes for lithium-ion batteries. J. Mater. Chem. A 2014, 2, 14918–14926. [Google Scholar] [CrossRef] [Scilit]
  6. Pfleging, W.; Gotcu, P. Femtosecond laser processing of thick film cathodes and its impact on lithium-ion diffusion kinetics. Appl. Sci. 2019, 9, 3588. [Google Scholar] [CrossRef] [Scilit]
  7. Shi, H.; Liu, X.; Wu, R.; Zheng, Y.; Li, Y.; Cheng, X.; Pfleging, W.; Zhang, Y. In situ SEM observation of structured Si/C anodes reactions in an ionic-liquid-based lithium-ion battery. Appl. Sci. 2019, 9, 956. [Google Scholar] [CrossRef] [Scilit]
  8. Gao, K.; Li, S.D. Effects of lithium salt concentration on graphited carbon microbead anodes in the piperidinium-based hybrid electrolytes. Mater. Res. Bull. 2015, 61, 159–164. [Google Scholar] [CrossRef] [Scilit]
  9. Landesfeind, J.; Gasteiger, H.A. Temperature and concentration dependence of the ionic transport properties of lithium-ion battery electrolytes. J. Electrochem. Soc. 2019, 166, A3079–A3097. [Google Scholar] [CrossRef] [Scilit]
  10. Wu, X.; Ma, L.; Liu, J.; Zhao, K.; Wood, D.L., III; Du, Z. Understanding the effect of salt concentrations on fast charging performance of Li-ion cells. J. Power Sources 2022, 545, 231863. [Google Scholar] [CrossRef] [Scilit]
  11. Mijailovic, A.S.; Waag-Swift, S.; Wang, G.; Zhou, B.; Luo, M.; Lu, W.; Wu, Q.; Sheldon, B.W. Interplay of intercalation dynamics and lithium plating in monolithic and architectured graphite anodes during fast charging. Energy Environ. Sci. 2024, 17, 8702–8721. [Google Scholar] [CrossRef] [Scilit]
  12. Weng, S.; Yang, G.; Zhang, S.; Liu, X.; Zhang, X.; Liu, Z.; Cao, M.; Ateş, M.N.; Li, Y.; Chen, L.; et al. Kinetic limits of graphite anode for fast-charging lithium-ion batteries. Nano-Micro Lett. 2023, 15, 215. [Google Scholar] [CrossRef] [Scilit] [PubMed]
  13. Paled, E. The electrochemical behavior of alkali and alkaline earth metals in nonaqueous battery systems—The solid electrolyte interphase model. J. Electrochem. Soc. 1979, 126, 2047–2051. [Google Scholar] [CrossRef] [Scilit]
  14. Smith, A.J.; Burns, J.C.; Zhao, X.; Xiong, D.; Dahn, J.R. A high precision coulometry study of the SEI growth in Li/graphite cells. J. Electrochem. Soc. 2011, 158, A447–A452. [Google Scholar] [CrossRef] [Scilit]
  15. Chang, H.J.; Ilott, A.J.; Trease, N.M.; Mohammadi, M.; Jerschow, A.; Grey, C.P. Correlating microstructural lithium metal growth with electrolyte salt depletion in lithium batteries using 7Li MRI. J. Am. Chem. Soc. 2015, 137, 15209–15216. [Google Scholar] [CrossRef] [Scilit] [PubMed]
  16. Jerschow, A.; Müller, N. Suppression of convection artifacts in stimulated-echo diffusion experiments. Double-stimulated-echo experiments. J. Magn. Reson. 1997, 125, 372–375. [Google Scholar] [CrossRef] [Scilit]
  17. Zhang, G.Q.; Hirasaki, G.J.; House, W.V. Internal field gradients in porous media. Petrophysics 2003, 44, 422–434. [Google Scholar]
  18. Lin, F.; Markus, I.M.; Nordlund, D.; Weng, T.C.; Asta, M.D.; Xin, H.L.; Doeff, M.M. Surface reconstruction and chemical evolution of stoichiometric layered cathode materials for lithium-ion batteries. Nat. Commun. 2014, 5, 3529. [Google Scholar] [CrossRef] [Scilit] [PubMed]
  19. Tancin, R.J.; Özdoğru, B.; Dutta, N.S.; Finegan, D.P.; de Villers, B.J.T. Direct reuse of graphite and lithium nickel manganese cobalt oxide (NMC) recovered from ultrafast-laser ablation debris in Li-ion battery electrodes. J. Power Sources 2024, 596, 234027. [Google Scholar] [CrossRef] [Scilit]
  20. Murakami, M.; Noda, Y.; Koyama, Y.; Takegoshi, K.; Arai, H.; Uchimoto, Y.; Ogumi, Z. Local structure and spin state of cobalt ion at defect in lithium overstoichiometric LiCoO2 as studied by 6/7Li solid-state NMR spectroscopy. J. Phys. Chem. C 2014, 118, 15375–15385. [Google Scholar] [CrossRef] [Scilit]
  21. Shi, X.; Watanabe, T.; Yamamoto, K.; Kumar, M.; Thakur, N.; Matsunaga, T.; Fujii, M.; Kinoshita, H.; Iba, H.; Nagamine, M.; et al. Hierarchical Reactions Involving Dynamic Structural Changes in Lithium-Ion Batteries during Overcharge Using Advanced Analytical Techniques. Electrochem. Soc. 2024, 171, 120504. [Google Scholar] [CrossRef] [Scilit]
Figure 1. Microscope images of graphite electrode cross-sections structured via (a) green-VIS (515 nm) and (b) NIR (1030 nm) radiation at 500 mm/s scan rate. Structured graphite on polyimide electrodes with (c) 100 μm and (d) 200 μm hatch.
Batteries 12 00377 g001
Figure 2. (a) Power performance of NMC 811 half cells at different mass loading. Solid lines indicate unstructured electrodes, while dotted lines indicate structured electrodes. (b) Total capacity in mAh delivered at 2 C for unstructured (solid bars) and structured electrodes (patterned bars) via green laser ablation.
Batteries 12 00377 g002
Figure 3. (a) Power performance of graphite half cells at 4 mAh/cm2 of areal capacity. (b) Magnified comparison from C/5 to first C/10 recovery. Colors indicate different concentrations, while hollow dots indicate structuring.
Batteries 12 00377 g003
Figure 4. (a) Power performance of graphite half cells at 8 mAh/cm2 of areal capacity. (b) Magnified comparison from C/40 to first C/10 recovery. Colors indicate different concentrations, while hollow dots indicate structuring.
Batteries 12 00377 g004
Figure 5. (a) Power performance of graphite half cells at 12 mAh/cm2 of areal capacity. (b) Magnified comparison from C/5 to first C/10 recovery. Colors indicate different concentrations, while hollow dots indicate structuring.
Batteries 12 00377 g005
Figure 6. (a) Scale representation of widths, heights and channels of (left) 200h-240-1.0M, (center) 200h-105-1.0M and (right) nh-88-1.0M. Average channel width is around 33 μm. (b) Diagram of re-distributed pillars mimicking a flattened electrode. Teal colored section represents channels (structured electrodes) and electrolyte in separator (unstructured electrode).
Batteries 12 00377 g006
Figure 7. Total capacity delivered at C/2 for (a) unstructured and (b) structured electrodes using green laser radiation. Error bars represent the variability across up to 3 replicate cells tested per condition.
Batteries 12 00377 g007
Figure 8. Long-term cycling capacities of graphite–NMC 811 full cells cycled at 1C for (a) 105 μm (3.8–4.0 mAh/cm2) and (c) 240 μm (7.0–8.0 mAh/cm2) thick graphite electrodes. Magnified axes for (b) 105 μm and (d) 240 μm electrodes graphite electrodes. Solid lines highlight unstructured graphite electrodes, while hollow markers highlight ablated graphite electrodes.
Batteries 12 00377 g008aBatteries 12 00377 g008b
Figure 9. Lithium plating after 110 cycles at different electrolyte concentrations and C-rates at 240 μm height (8 mAh/cm2) for unstructured and structured (200 μm hatch) electrodes.
Batteries 12 00377 g009
Figure 10. Lithium plating after 110 cycles at different electrolyte concentrations and C-rates at 105 μm height (4 mAh/cm2) for unstructured and structured (200 μm hatch) electrodes.
Batteries 12 00377 g010
Figure 11. Self-diffusion coefficients for Li+ (blue), PF6 (green) and the solvent (in red, i.e., an apparent diffusion coefficient measured for the broad, unresolved signature of EC and EMC in LP57) measured along z (inset) using PFG-NMR for different concentrations in a tube or in graphite electrodes with a 100 μm hatch.
Batteries 12 00377 g011
Figure 12. Raman spectra for pristine graphite (black) graphite ablated at λ = 515 nm (green) and 4.5 W, and graphite ablated at λ = 1064 nm and 4.5 W (red).
Batteries 12 00377 g012
Figure 13. Power performance of ablated graphite powder electrode. Ablation parameters are as follows: λ = 515 nm and scan speed = 500 mm/s. Graphite 88 μm is included for operational comparison.
Batteries 12 00377 g013
Table 1. Mass percentage compositions of graphite- and NMC-811-based electrodes with their respective additives.
Aqueous Graphite Electrode
Graphite (Targray Inc., Kirkland, QC, Canada)Carbon Black
(Super 65, Imerys Graphite & Carbon Ltd., Bodio, Switzerland)
Sodium Carboxymethyl Cellulose (Na-CMC, Sigma Aldrich, Steinheim, Germany)Steryl-Butadiene Rubber (SBR, mit, Richmond, VA, USA)
931.421.863.72
Organic NMC 811 Electrode
NMC-811 (Gelon Lib Co., Ltd., Linyi, China)Carbon Black (Super 65, Imerys Graphite & Carbon Ltd., Bodio, Switzerland)Polyvinylidene Fluoride (PVdF, mit, Richmond, VA, USA)K6L Graphite (Imerys Graphite & Carbon Ltd., Bodio, Switzerland)
92332
Table 2. Power cycling parameters for graphite half cells.
StagePower Cycling
FormationNo. of CyclesCharge (Delithiation)Discharge (Lithiation)
1C/40C/40
2C/20C/20
Test SequenceNo. of CyclesChargeDischarge
1C/20C/40
1C/20C/20
1C/20C/10
1C/20C/5
1C/20C/2
1C/20C/2
1C/20C
1C/202C
Table 3. Power cycling parameters for NMC 811 half cells.
StagePower Cycling
FormationNo. of CyclesCharge (Delithiation)Discharge (Lithiation)
1C/20C/20
2C/10C/10
Test SequenceNo. of CyclesChargeDischarge
1C/10C/20
1C/10C/10
1C/10C/5
1C/10C/2
1C/10C
1C/102C
1C/105C
Table 4. Long-term cycling parameters for full cells (NMC 811 vs. graphite).
StageLong Term Cycling
FormationNo. of CyclesCharge (Delithiation)Discharge (Lithiation)
1C/40C/40
2C/20C/20
Sequence1071C or 4CC/2 cc + C/10 cv
Table 5. Sample legend for NMC 811 half cells in Figure 2 (N/A = non applicable).
Namenh-100-1.0Mnh-196-1.0Mnh-240-1.0M200h-100-1.0M200h-196-1.0M200h-280-1.0M
Thickness (μm)100196280100196200
AM Loading (mg)31.954.280.824.449.776.6
LiPF6 conc. (M)1.01.01.01.01.01.0
Hatch (μm)N/AN/AN/A200200200
Table 6. Sample name legend and properties for Figure 3 (N/A = non applicable).
Namenh-88-1.0Mnh-88-1.4Mnh-88-1.8Mnh-105-1.0M200h-105-1.0M200h-105-1.4M200h-105-1.8M200h-240-1.0M
Thickness (μm)888888105105105105240
AM Loading (mg)12.412.112.114.912.611.812.111.7
LiPF6 conc. (M)1.01.41.81.01.01.41.81.0
Hatch (μm)N/AN/AN/AN/A200200200200
Table 7. Sample name legend and properties for Figure 4 (N/A = non applicable).
Namenh-240-1.0M200h-105-1.4M200h-240-1.4M200h-240-1.8M
Thickness (μm)88240240240
AM Loading (mg)29.623.62424.8
LiPF6 conc. (M)1.01.01.41.8
Hatch (μm)N/A200200200
Table 8. Sample name legend and properties for Figure 5 (N/A = non applicable).
Namenh-330-1.0M200h-330-1.0M
Thickness (μm)330330
AM Loading (mg)39.237.9
LiPF6 conc. (M)1.01.0
Hatch (μm)N/A200
Table 9. Graphite ablate slurry composition and mass percentages.
Graphite (Collected Ablate)Carbon Black (Super 65. Imerys Belgium)Sodium Carboxymethyl Cellulose (NaCMC, Sigma Aldrich, Germany)Steryl-Butadiene Rubber (SBR, MTI, USA)
85102.52.5
Disclaimer/Publisher’s Note: The statements, opinions and data contained in all publications are solely those of the individual author(s) and contributor(s) and not of MDPI and/or the editor(s). MDPI and/or the editor(s) disclaim responsibility for any injury to people or property resulting from any ideas, methods, instructions or products referred to in the content.