Article

A Hybrid Battery Thermal Management System Coupling Static Immersion and Refrigerant-Based Direct Cooling: Flow Distribution Regulation and Multi-Objective Optimization


1
Beijing Laboratory of New Energy Storage Technology, North China Electric Power University, Beijing 102206, China
2
Key Laboratory of Electrochemical Energy Safety, Ministry of Emergency Management, Beijing 102400, China
3
XYZ Storage Technology Corp., Ltd., Beijing 102400, China
*
Authors to whom correspondence should be addressed.
These authors contributed equally to this work.
Batteries 2026, 12(9), 344; https://doi.org/10.3390/batteries12090344
Submission received: 11 August 2026 / Revised: 28 August 2026 / Accepted: 4 September 2026 / Published: 6 September 2026

Abstract

To address the limitations of individual battery thermal management technologies, this study proposes a hybrid battery thermal management system coupling static immersion cooling with refrigerant-based direct cooling. The system employs parallel upper and lower direct cooling plates, with the refrigerant flow split regulated to enhance buoyancy-driven convection within the sealed immersion chamber. Numerical simulations are conducted to compare an R134a direct cooling system with a 50% ethylene glycol solution indirect cooling system over total flow rates of 6–18 L⋅min−1 and upper plate flow ratios of 10–90%. The effects of the total flow rate and flow distribution on the pressure drop, battery temperature, temperature uniformity, flow characteristics, and pumping power are systematically evaluated. The R134a direct cooling system reduces the average battery temperature by approximately 0.5–1.0 °C compared with the indirect cooling system. Increasing the upper plate flow ratio strengthens the natural convection within the immersion chamber and alleviates vertical temperature non-uniformity, whereas excessive flow redistribution weakens the cooling capacity of the lower plate. A Kriging surrogate model coupled with a multi-objective genetic algorithm identifies the optimal condition at a total flow rate of 8.82 L⋅min−1 and an upper plate flow ratio of 56.45%. Relative to the baseline condition of 9 L⋅min−1 and an upper plate flow ratio of 10%, the optimized condition reduces the average battery temperature, maximum temperature difference, and pumping power by 10.1%, 7.2%, and 52.1%, respectively, while maintaining a low cell temperature standard deviation of 0.032 °C.

1. Introduction

To improve the cleanliness and sustainability of energy utilization, the share of renewable power generation and the market penetration of electric vehicles have increased significantly [1,2]. In this context, battery energy storage systems have been widely applied in various scenarios [3,4]. Although lithium-ion batteries offer advantages, such as high specific energy, low self-discharge rate, and long cycle life, they inevitably generate heat during operation, and their performance is highly sensitive to temperature [5,6]. Studies have shown that the optimal operating temperature range for lithium-ion batteries is 25–40 °C, while the cell-to-cell temperature difference at comparable monitoring locations is generally recommended to remain within 5 °C [7]. Both excessively high and low temperatures can lead to significant performance degradation, resulting in irreversible deterioration of lifespan and safety [8]. In severe cases, they may even trigger thermal runaway, causing a fire or explosion and posing serious risks to personal safety [9,10]. Therefore, it is essential to equip battery systems with an effective battery thermal management system (BTMS) to achieve precise temperature control, thereby improving battery performance, extending service life, and ensuring operational safety [11,12].
According to the type of cooling medium, BTMSs can be classified into three categories, namely, air cooling, liquid cooling, and phase change material cooling [13,14]. Among these methods, air cooling has the simplest structure and the lowest cost. However, its cooling efficiency is limited, making it difficult to satisfy the requirements of current high-power batteries [15]. Phase change cooling utilizes the latent heat of phase change materials to absorb the heat generated by a battery pack. This method offers advantages, such as high cooling efficiency and a compact structure. Nevertheless, in high-power-density applications, its heat dissipation capability is significantly constrained by the limited volume of the phase change material [16].
At present, liquid cooling is the most widely used approach for BTMS. According to the contact mode between the cooling medium and the battery, it can be classified into indirect contact cooling and direct contact cooling [17]. Among these methods, indirect contact cooling, which circulates the coolant through cooling plate channels, is currently the mainstream solution in electric vehicles [18]. Depending on the refrigeration method, indirect liquid cooling can further be divided into conventional indirect cooling and direct refrigerant cooling [19]. Compared with conventional liquid cooling, direct cooling utilizes the latent heat absorbed during refrigerant vaporization, and its cooling efficiency can reach nearly five times that of traditional methods. It also offers a high level of integration with air-conditioning systems. By sharing key components, such as the compressor and condenser, an integrated vehicle thermal management system can be established. This design effectively reduces the overall cost while enhancing system safety. Therefore, direct cooling is gradually becoming an important technological direction for BTMSs [20]. However, in indirect contact cooling, the heat transfer between the coolant and the battery must occur through an intermediate medium. This introduces unavoidable thermal resistance and prevents the heat dissipation efficiency from reaching an ideal level.
Immersion cooling is a novel liquid cooling approach that has developed rapidly in recent years. By directly immersing a battery in a dielectric liquid, direct convective heat transfer between the battery and the coolant can be achieved. This significantly reduces the thermal resistance between the cooling medium and the heat source, thereby improving both the cooling efficiency and temperature uniformity within the battery pack [21,22]. According to the flow mode, immersion cooling can be classified into static immersion cooling and forced-convection immersion cooling [23]. Forced-convection immersion cooling employs a pump to drive liquid circulation, enabling efficient removal of battery-generated heat. Liu et al. [24] established a forced-flow immersion-cooling battery module test platform using transformer oil as the coolant and systematically investigated the electro-thermal performance under different flow rates and discharge C-rates. Their results showed that increasing the coolant flow rate could accelerate the temperature recovery of the battery module and improve the overall electro-thermal performance. However, in practical applications, forced-convection immersion cooling requires an additional external circulation loop and pumping system, which increases system complexity and potential leakage risks, thereby limiting its engineering implementation [25]. In contrast, static immersion cooling eliminates the external pump and substantially reduces the risk of dielectric liquid leakage. Nevertheless, due to the absence of an external driving force, heat dissipation within a system is often delayed, making it difficult to support the long-term stable operation of the battery system [26]. In addition, static immersion cooling relies solely on natural convection. As a result, the high-temperature coolant tends to accumulate in the upper region, which further aggravates the vertical temperature non-uniformity of the battery pack [27].
These findings indicate that each individual battery thermal management technology has inherent limitations that are difficult to overcome. Consequently, recent research on lithium-ion battery thermal management has gradually shifted from single cooling methods to multi-field coupled hybrid thermal management systems. For hybrid systems combining liquid cooling and phase change materials, Xu et al. [28] conducted a systematic parametric analysis of a novel structure, in which an ultrathin phase change material layer is arranged between the liquid cooling channel and the battery. Their study revealed the buffering effect of the phase change material for reducing the system’s sensitivity to the coolant flow velocity. The key parameters, including the thickness of the phase change material layer and the channel layout, were further optimized. This enabled a balance between temperature rise control and temperature uniformity. For thermoelectric cooling coupled with other thermal management technologies, Luo et al. [29] developed a hybrid BTMS integrating thermoelectric coolers, a vapor chamber, and a liquid cooling plate. They also established a thermo-fluid–electrical multiphysics coupling model. The results showed that the introduction of thermoelectric cooling can significantly enhance the battery cooling rate under high-temperature operating conditions. In addition, Luo et al. [30] coupled thermoelectric coolers with phase change materials and a liquid-cooled phase plate. This design enabled effective recovery of the latent heat of the phase change material and improved the thermal management performance under high discharge rates.
In the field of immersion cooling, Hu et al. [31] proposed an immersion-coupled direct cooling system, in which the heat flow distribution within a battery pack was optimized through a non-uniform arrangement of cooling pipes. It should be noted that the “direct cooling” in that study referred to the direct contact between the battery and the immersion liquid. Their study further investigated the effects of different dielectric coolants, cooling water temperatures, and flow velocities on the thermal dissipation performance of the system. A cooling efficiency coefficient was also introduced to balance the heat dissipation performance and energy consumption. Zhang et al. [32] further combined phase change materials with static immersion cooling and proposed a novel passive adaptive thermal regulator. By utilizing the volume variation in the phase change material during the phase transition process, dynamic regulation of the thermal resistance between the battery and the cooling plate was achieved. The system demonstrated an excellent thermal management capability under both high-temperature heat dissipation and low-temperature heat preservation conditions. Its applicability under continuous charge–discharge cycling and low-temperature environments was also verified. These studies indicate that hybrid BTMSs coupling multiple cooling methods offer significant advantages for enhancing heat dissipation efficiency, improving temperature uniformity, and strengthening environmental adaptability. Such systems are becoming an important development direction in the field of BTMSs.
At present, the research on direct cooling battery thermal management mainly focuses on the optimization of the structure and operating parameters of the direct cooling plate itself. Lian et al. [20] established a two-phase-flow thermal coupling model based on correlation algorithms and tensor operators for a large-scale direct cooling plate with multiple parallel inlet and outlet channels. Their study revealed the mechanism by which uneven flow resistance in microchannels leads to local overheating. By optimizing the channel cross-sectional dimensions, the maximum temperature of the direct cooling plate was reduced from 42 °C to 31 °C. The temperature difference was maintained within 5 °C, and the pressure drop was reduced by 24%, thereby effectively improving battery cycle life and system energy efficiency. Tang et al. [33] designed four different direct cooling plate structures and comparatively analyzed the effects of cooling plate arrangement and flow channel configuration on heat dissipation performance. The results showed that a hybrid structure combining a main-wall serpentine channel with narrow side-wall parallel channels could control the temperature difference in a battery pack within 3.84 °C under a 3 C discharge rate. They further determined the boundary conditions of evaporation temperature and mass flow rate required to ensure safe battery pack operation. These studies have verified the effectiveness of direct cooling plate structural optimization for improving temperature uniformity and reducing energy consumption. However, none of them considered the coupling of direct cooling with other cooling methods.
To this end, this study proposes a hybrid battery thermal management system coupling direct cooling plates with static immersion cooling, together with a corresponding flow control strategy. The proposed system retains the high cooling efficiency of direct cooling and achieves improved temperature uniformity through immersion cooling. It also mitigates local overcooling associated with direct cooling plates, reduces the leakage risk of forced-convection immersion cooling, and overcomes the limited long-duration capability of static immersion cooling. In addition, a flow control method based on a dual direct-cooling plate configuration is introduced. By regulating the flow distribution between the upper and lower cooling plates, the natural convection within the immersion chamber is enhanced. This enables static immersion cooling to improve the thermal performance through thermally driven flow, thereby increasing the overall energy utilization efficiency. In this study, the proposed system is first compared with an indirect cooling system across multiple operating scenarios. The effects of upper and lower plate flow rates on the natural convection behavior in the immersion chamber are then analyzed in detail. Finally, a multi-objective optimization method is applied to determine the optimal operating conditions and achieve an overall performance balance.

2. Geometric Design and Numerical Methods

2.1. Structure Design Description

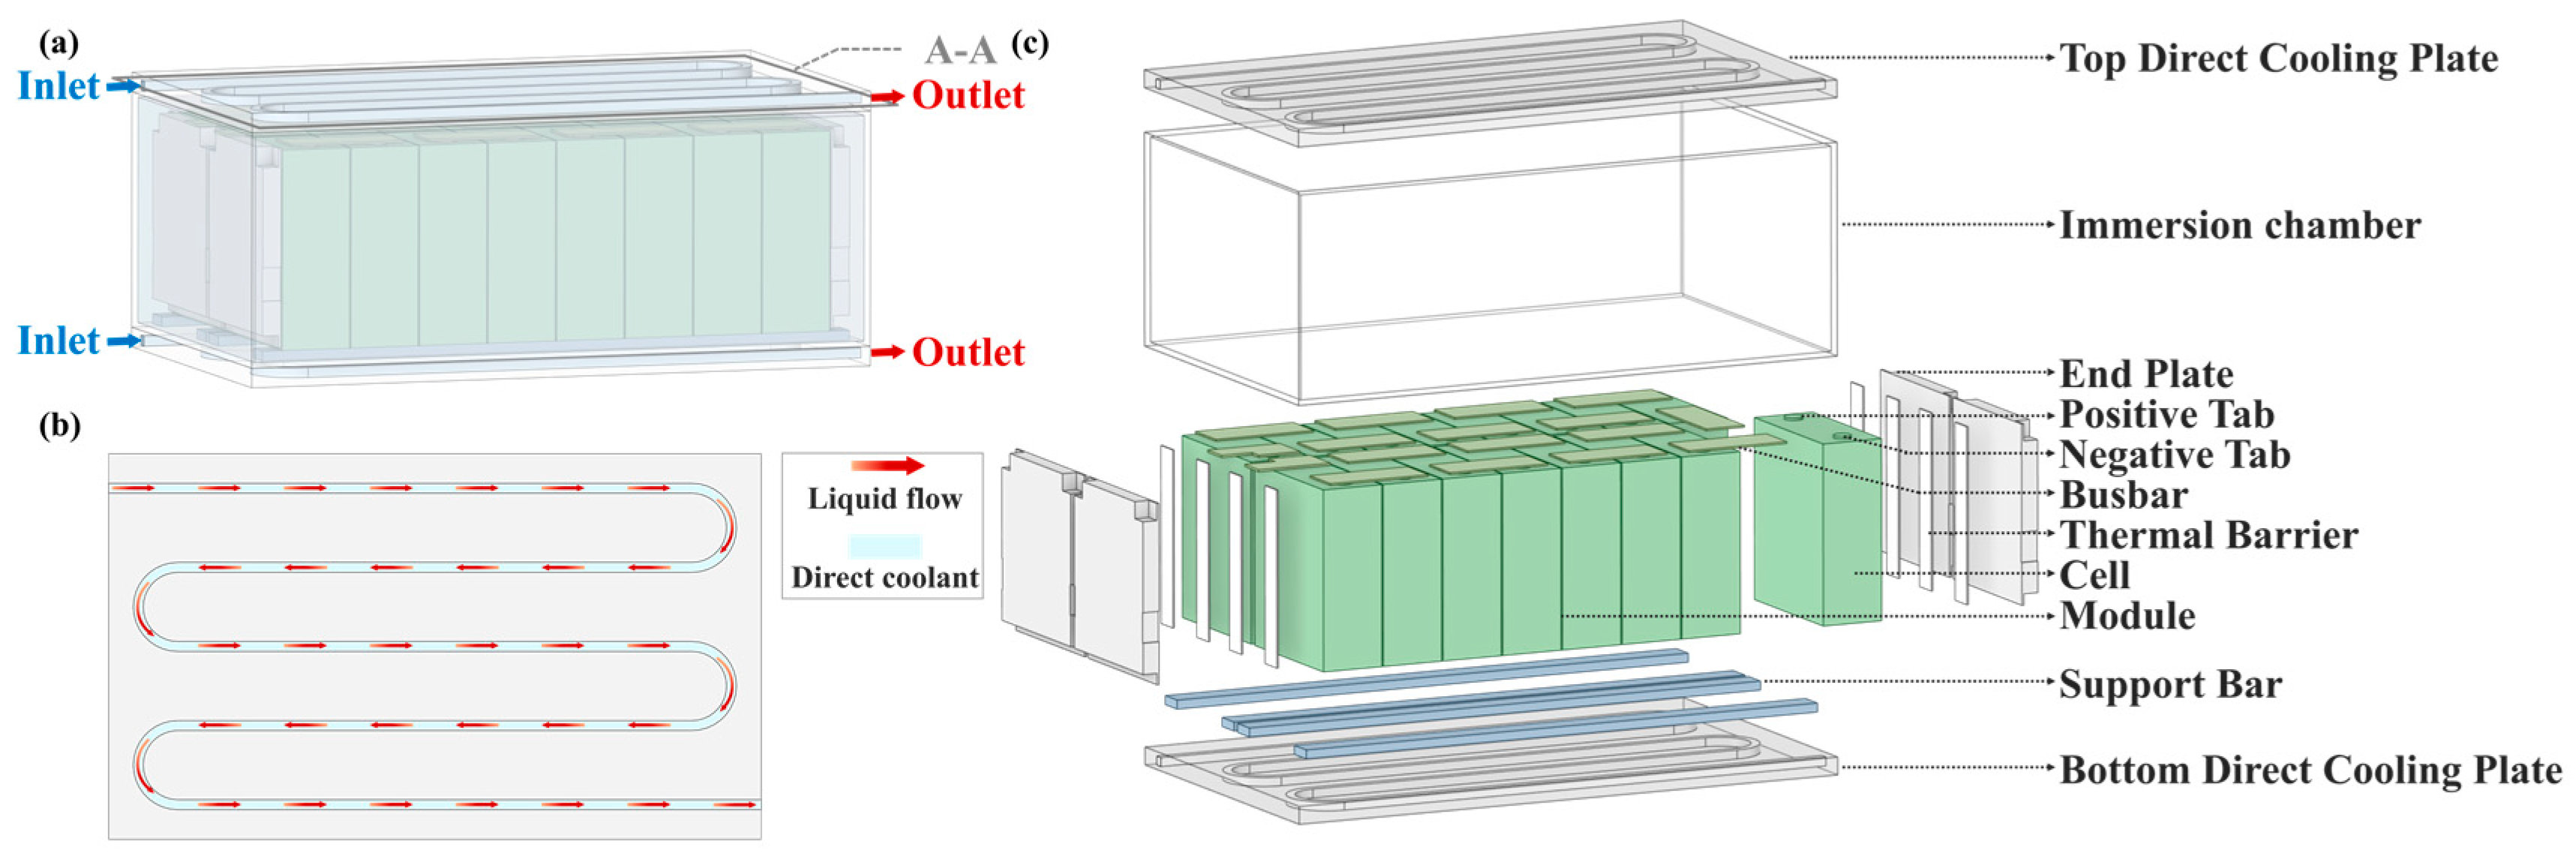
The battery module investigated in this study comprises an upper direct cooling plate, a static immersion module, and a lower direct cooling plate, as shown in Figure 1a. The two direct cooling plates feature identical serpentine channels and are connected in parallel to an external refrigerant loop. The refrigerant enters each plate from one side, exchanges heat with the immersion module, and exits from the opposite side, as shown in Figure 1b. The immersion module comprises a sealed chamber containing immersion fluid and a battery assembly. The battery module consists of 16 cells arranged in a 1P16S configuration.
Owing to its compact and modular architecture, the proposed configuration has potential for use in small-scale battery systems subject to stringent space constraints, including battery modules for marine applications, auxiliary battery systems, compact stationary energy storage units, and other specialized battery packs. Unlike forced-convection immersion cooling systems, the immersion fluid remains sealed within the chamber, eliminating the need for an external circulation pump and a dedicated immersion fluid loop. Only the upper and lower direct cooling plates are connected to the external refrigerant circuit, which simplifies the piping arrangement and reduces the number of external fluid interfaces and potential leakage points. These features facilitate modular installation, system integration, and maintenance, particularly in space-constrained applications.
To capture the component-level heat transfer characteristics of the module, a detailed geometric model is established, as shown in Figure 1c. The model explicitly includes the cells, end plates, positive and negative tabs, busbars, thermal barriers, and support bars. The module comprises prismatic lithium iron phosphate cells manufactured by Lishen New Energy Co., Ltd. (Beijing, China), each with a rated capacity of 280 Ah and a nominal voltage of 3.2 V. To mitigate localized overcooling in the lower region of the cells adjacent to the lower direct cooling plate, the support bars are made of 30% glass fiber-reinforced polyamide 66 (PA66-GF30) and purchased from Shenzhen Xiongyihua Plastic Insulation Ltd. (Shenzhen, China). This material combines high mechanical strength at elevated temperatures with low thermal conductivity, enabling the support bars to maintain structural integrity while restricting conductive heat transfer between the cells and the lower cooling plate. The thermophysical properties of all solid components are summarized in Table 1.
In addition, the immersion fluid is a supramolecular halogenated hydrocarbon immersion cooling fluid, KW890, produced by Xinyuan Qingcai Technology Co., Ltd. (Beijing, China). The refrigerant used in the direct cooling plates is R134a. For comparison with the direct cooling method, a 50% ethylene glycol solution is introduced as a reference fluid. It should be noted that the thermophysical properties of R134a are strongly temperature dependent and vary significantly during the phase change process. Therefore, the thermophysical property correlations of R134a were obtained by second-order polynomial fitting based on REFPROP data over a temperature range of 273.15–323.15 K. The thermophysical properties of all fluids are summarized in Table 2.
It should be noted that R134a is adopted in the present study mainly because of its mature thermophysical database and well-established two-phase cooling characteristics. However, its relatively high global warming potential limits its long-term application in next-generation thermal management systems. Therefore, low-GWP alternative refrigerants have attracted increasing attention. Natural refrigerants, such as R290, have shown promising potential in vehicular thermal management systems [34], while low-GWP working fluids, such as R1233zd(E), have also been investigated as environmentally friendly substitutes for conventional refrigerants [35]. Nevertheless, alternative refrigerants may introduce different thermophysical characteristics, operating pressures, safety requirements, and system performance trade-offs. Therefore, the proposed hybrid configuration is not intrinsically limited to R134a, and the applicability of alternative low-GWP refrigerants will be further investigated in future work.
In this cooling module, the immersion fluid is sealed within the chamber and cools the battery module through natural convection, which reduces the risk of leakage. An external direct cooling unit supplies refrigerant to the direct cooling plates, which exchange heat with the immersion module. This study proposes a method to enhance the natural convection within the immersion module by regulating the flow distribution between the upper and lower direct cooling plates. By adjusting the flow rates of the two plates, the natural convection in the immersion fluid is strengthened. This improves the temperature uniformity, which is a key advantage of immersion cooling. The proposed design combines a high cooling capacity with controllable and stable temperature homogenization performance.

2.2. Numerical Model

2.2.1. Governing Equations for Direct Cooling Plates

The model consists of two regions. One is the forced flow region of the refrigerant inside the direct cooling plates. The refrigerant R134a undergoes a phase change process within the direct cooling plates. Since this study focuses on the system-level thermal–fluid performance rather than the microscopic evolution of the liquid–vapor interface, the Mixture model in the multiphase flow module of Fluent is adopted. This model reduces the number of solution variables and lowers the computational cost while maintaining the capability of describing the gas–liquid mixed flow characteristics. The governing equations are as follows:
Mass :   t ( ρ m ) + ( ρ m v m ) = 0
where v m denotes the mass-averaged velocity,
v m = k = 1 n α k ρ k v k ρ m
where ρ m is the density of the mixture, and
ρ m = k = 1 n α k ρ k
where α k denotes the volume fraction of phase k.
Momentum :   t ( ρ m v m ) + ( ρ m v m v m ) = p + ( v m + v m T ) 2 3 v m I + ρ m g + F ( k = 1 n α k ρ k v d r , k v d r , k )
where n denotes the number of phases, h j , k represents the body force, and μ m is the kinematic viscosity of the mixture.
μ m = k = 1 n α k μ k
v d r , k is the drift velocity of secondary phase k,
v d r , k = v k v m
Energy :   t k ( α k ρ k E k ) + k ( α k v k ( ρ k E k + p ) ) = ( k e f f T k j h j , k j j , k + ( τ ¯ ¯ e f f v ) )
where h j , k represents the enthalpy of species j in phase k, j j , k denotes the diffusion flux of species j in phase k, and k e f f is the effective thermal conductivity, calculated as follows,
k e f f = α k ( k k + k i )
where k i is the turbulent thermal conductivity defined according to the turbulence model employed. The first three terms on the right-hand side of Equation (7) represent the energy transfer caused by conduction, mass diffusion, and viscous dissipation, respectively.
For the phase change flow of R134a inside the direct cooling plates, the Lee evaporation–condensation model is further adopted based on the Mixture multiphase model to describe the interphase mass transfer between the liquid R134a and vapor R134a. In this model, liquid R134a is defined as the primary phase, while vapor R134a is defined as the secondary phase. The Mixture model is used to describe the gas–liquid mixed flow, whereas the Lee model determines evaporation or condensation according to the difference between the local phase temperature and the saturation temperature under the corresponding local pressure.
In the Lee model, the variation in the vapor phase caused by evaporation and condensation can be expressed by the vapor phase transport equation,
t ( α v ρ v ) + ( α v ρ v v v ) = m ˙ e m ˙ c
where v denotes the vapor phase, α v is the vapor volume fraction, ρ v is the vapor density, v v is the vapor velocity, and m ˙ e and m ˙ c are the evaporation and condensation mass transfer rates, respectively. In this study, both m ˙ e and m ˙ c are defined as positive quantities. Therefore, evaporation acts as a source term for the vapor phase, whereas condensation acts as a sink term.
When the local liquid temperature is higher than the saturation temperature under the corresponding pressure, liquid R134a is converted into vapor R134a, and evaporation occurs. When the local vapor temperature is lower than the saturation temperature, vapor R134a is converted into liquid R134a, and condensation occurs. The corresponding interphase mass transfer rates can be expressed as,
Evaporation :   m ˙ e = C e α l ρ l ( T l T s a t ) T s a t
Condensation :   m ˙ c = C c α v ρ v ( T s a t T v ) T s a t
where C e and C c are the evaporation and condensation coefficients, respectively, and are both set to 0.1 s−1 in this study. These coefficients are empirical relaxation parameters in the Lee model rather than intrinsic thermophysical properties of R134a. Previous studies have shown that 0.1 s−1 is commonly adopted as a baseline value in Lee-model simulations [36]. Therefore, the same values are used throughout the present study to ensure consistent model settings among different operating conditions. α l and α v are the volume fractions of the liquid and vapor phases, respectively. ρ l and ρ v denote the densities of the liquid and vapor phases, respectively, while T l and T v denote the corresponding liquid- and vapor-phase temperatures. T s a t is the saturation temperature of R134a under the local pressure.
During the phase change process, interphase mass transfer is accompanied by latent heat absorption or release. Therefore, a phase change heat source term is introduced into the energy equation. For the liquid–vapor phase change in R134a, the heat source term per unit volume can be written as
S q = m ˙ e h f g + m ˙ c h f g
where S q is the phase change heat source term, and h f g is the latent heat of vaporization of R134a under the corresponding saturation condition. According to the sign convention adopted in this study, evaporation absorbs latent heat and therefore appears as a heat sink in the energy equation, whereas condensation releases latent heat and appears as a heat source. Through this source term, the interphase mass transfer in the Lee model is coupled with the energy equation, thereby describing the evaporation heat absorption and condensation heat release of R134a inside the direct cooling plates. The energy source term associated with phase change can generally be obtained by multiplying the mass transfer rate by the latent heat.
Since the pressure of the refrigerant varies along the flow path inside the direct cooling plates, assigning a constant saturation temperature would weaken the response of the phase change criterion to the local pressure variation. Therefore, the saturation temperature of R134a is defined as a function of the local pressure. Based on the fitted relationship between the saturation temperature and pressure of R134a, the local saturation temperature is expressed as
T s a l = 25.3042 P 2 + 87.9216 P + 250.56862
where T s a l is the saturation temperature of R134a, in K, and P is the local absolute pressure of the refrigerant, in MPa. It should be noted that P represents the absolute pressure rather than the gauge pressure. By introducing this pressure-dependent saturation temperature function, the Lee model can determine the phase change direction according to both the local pressure and the local temperature. When the local temperature is higher than the saturation temperature under the corresponding pressure, a mass source from the liquid phase to the vapor phase is generated, and the refrigerant absorbs latent heat. Conversely, when the local temperature is lower than the saturation temperature, a mass source from the vapor phase to the liquid phase is generated, and the refrigerant releases latent heat.

2.2.2. Governing Equations for the Immersion Chamber

The other region is the natural convection region of the immersion fluid inside the immersion chamber. No phase change occurs in this region, so a multiphase flow model is not required. However, Fluent does not allow different multiphase models to be assigned to separate computational domains. Therefore, all phases in this region are defined as identical, which is equivalent to a single-phase flow representation.
The governing equations are as follows:
Mass :   ρ t + ( ρ v ) = 0
Momentum :   ρ v t + ρ ( v ) v = p + μ 2 v + g ρ β Δ T + g ρ
Energy ( immersion ) :   t ( ρ c p T ) + ( ρ c p v T ) = ( λ T )
As shown above, Equations (14)–(16) represent the continuity, momentum, and energy equations of the immersion fluid inside the immersion chamber, respectively. Since the flow in the immersion chamber is mainly driven by temperature gradient-induced density differences and buoyancy, the Boussinesq approximation is adopted to describe the density variation during natural convection. Under this approximation, the immersion fluid is treated as incompressible in the continuity equation and in the inertial and viscous terms of the momentum equation, with its density taken as a constant value at the reference temperature. The temperature-induced density variation is considered only in the gravitational body-force term. The corresponding density variation can be expressed as
ρ = ρ 0 [ 1 β ( T T 0 ) ]
where ρ 0 is the density of the immersion fluid at the reference temperature T 0 , β is the thermal expansion coefficient of the immersion fluid, and T is the local temperature. Accordingly, the buoyancy source term in the momentum equation can be written as
S b = ( ρ ρ 0 ) g = ρ 0 g β ( T T 0 )
This treatment can reflect the influence of temperature variation on fluid density and buoyancy while retaining the incompressible-flow framework. Therefore, it is suitable for the natural convection problem considered in this study, where the temperature difference is relatively small and the corresponding density variation is limited.
In addition, to describe the internal heat conduction of the battery cell and its heat exchange with the surrounding cooling medium, an energy conservation equation is established for the battery cell as follows:
Energy ( battery ) :   t ( ρ c p T ) = ( λ T ) + Q t
Qt in Equation (19) represents the heat generation rate of the battery, which is calculated using the Bernardi equation as follows:
Q t = Q i r + Q r e = ± 1 V b I ( U O C V U ) I T d U O C V d T
where Qir denotes the irreversible heat, and Qre denotes the reversible heat. Vb is the battery volume. U is the terminal voltage, and Uocv is the open-circuit voltage. The positive and negative signs correspond to the discharge and charge states, respectively.

2.2.3. Selection of Flow Model

To reasonably select the appropriate flow model, the flow regimes in different computational regions are further evaluated. The flow domains considered in this study mainly include the forced convection region of the refrigerant inside the direct cooling plates and the natural convection region of the immersion fluid inside the immersion chamber. For the flow inside the direct cooling plates, which is driven by the imposed inlet flow rate, the Reynolds number is used to determine the flow regime. It is defined as
R e = ρ v L μ = q m L A μ
where ρ is the fluid density, v is the flow velocity, L is the characteristic length, μ is the dynamic viscosity, q m is the mass flow rate, and A is the flow cross-sectional area.
For the R134a direct cooling plate region, phase change occurs during the flow process. Since the Mixture multiphase model is adopted in this study, the gas–liquid phase distribution and phase change degree vary along different cross-sections. As a result, the effective viscosity of the mixture changes with the local vapor volume fraction. Based on the Mixture model, the phase change flow regime can be characterized using the mixture Reynolds number R e m , expressed as
R e m = ρ m v m L μ m = q m L A μ m
where ρ m , v m , q m and μ m are the mixture density, mixture velocity, mixture mass flux, and effective dynamic viscosity of the mixture, respectively. Since the local phase change degree cannot be determined before the simulation, the Reynolds number is first conservatively estimated using the viscosity of liquid R134a.
The total flow rate investigated in this study ranges from 6 to 18 L⋅min−1. Considering the flow distribution between the upper and lower direct cooling plates, the flow rate of a single inlet ranges from 0.6 to 16.2 L⋅min−1. For R134a, when the Reynolds number is conservatively estimated using the liquid-phase viscosity, its range is 5366–144,880, which is higher than the commonly used turbulent flow criterion of Re = 4000. In addition, as the vapor volume fraction increases during the phase change process, the effective viscosity of the mixture generally decreases within the considered property range, and the actual mixture Reynolds number is expected to increase further. Therefore, the R134a flow inside the direct cooling plates can be reasonably treated as turbulent flow.
For the 50% ethylene glycol solution, the Reynolds number ranges from 364 to 9833, covering laminar, transitional, and turbulent flow regimes. This indicates that the flow state may vary under different total flow rates and flow distribution ratios. Therefore, in the numerical simulations, the flow model is selected according to the Reynolds number of the corresponding operating condition or channel branch. Specifically, a laminar setting is used when Re < 2300, whereas a turbulence model is adopted when Re ≥ 2300.
Next, the natural convection state of the immersion fluid inside the immersion chamber is analyzed. Unlike the forced convection inside the direct cooling plates, which is driven by the imposed inlet flow rate, the flow of the immersion fluid is mainly driven by temperature-induced density differences and buoyancy. Therefore, the Rayleigh number is used to evaluate the intensity of natural convection, which is expressed as
R a = G r P r = g β Δ T l 3 ν 2 P r
where G r is the Grashof number, P r is the Prandtl number, g is the gravitational acceleration, β is the thermal expansion coefficient of the immersion fluid, Δ T is the characteristic temperature difference, l is the characteristic length, and ν is the kinematic viscosity. Since this study focuses on the overall natural convection behavior inside the immersion chamber, the temperature difference between the initial battery surface temperature and the initial coolant temperature in the cooling plates is selected as the characteristic temperature difference, namely, Δ T = 10   K . In addition, considering that the buoyancy-driven flow in the immersion chamber mainly develops along the vertical direction, the height of the immersion chamber is selected as the characteristic length, namely, l = 0.24 m. The thermal expansion coefficient of the KW890 immersion fluid is 9.56 × 10⁻⁴ K−1.
The Prandtl number is defined as
P r = ν α
where α is the thermal diffusivity. For the KW890 immersion fluid used in this study, the thermal diffusivity is 8.28 × 10⁻⁸ m2/s, and the calculated Prandtl number is Pr = 11.31. Based on the thermophysical properties of KW890, the Rayleigh number is further calculated as Ra = 1.67 × 10¹⁰.
This Rayleigh number is much higher than the critical range for the transition from conduction-dominated heat transfer to convection-dominated heat transfer, indicating that heat transfer inside the immersion chamber is not governed by pure heat conduction. Instead, significant buoyancy-driven flow is formed. Moreover, the Rayleigh number reaches the order of 1010, suggesting that the natural convection intensity inside the immersion chamber is high and that complex recirculation and local turbulent characteristics may appear. Therefore, in the numerical simulation of the immersion chamber, gravity and temperature-induced buoyancy effects should be considered, and a flow model capable of describing high-Rayleigh-number natural convection should be adopted.
In summary, the Reynolds number of the R134a phase change flow inside the direct cooling plates is higher than the commonly used turbulent flow criterion under the investigated operating conditions, and thus this region can be treated as turbulent forced convection. The Rayleigh number of the KW890 immersion fluid inside the immersion chamber is 1.67 × 10¹⁰, indicating strong natural convection with evident buoyancy-driven flow, recirculation structures, and local turbulent characteristics. For the 50% ethylene glycol solution, its Reynolds number covers laminar, transitional, and turbulent regimes. Therefore, the laminar regions are treated accordingly based on the local Reynolds number in the numerical simulation.
Considering that this study mainly focuses on the flow and heat transfer characteristics of the battery module, as well as the combined influence of forced convection in the direct cooling plates and high-Rayleigh-number natural convection in the immersion chamber on the system temperature distribution, the SST k-ω model is adopted to describe the turbulent momentum transport and turbulent heat diffusion in the computational domain. The transport equations are given as follows:
t ( ρ k ) + x i ( ρ k v i ) = x j ( Γ k k x j ) + G k Y k + S k
t ( ρ ω ) + x i ( ρ ω v i ) = x j ( Γ ω ω x j ) + G ω Y ω + S ω
where k is the turbulent kinetic energy, and ω is the specific dissipation rate. Γ represents the effective diffusion coefficient. G represents the turbulent kinetic energy generated by the mean velocity gradient. Y represents the dissipation of k and ω under turbulent action. S is the user-defined source term.

2.3. Battery Model and ECM Validation

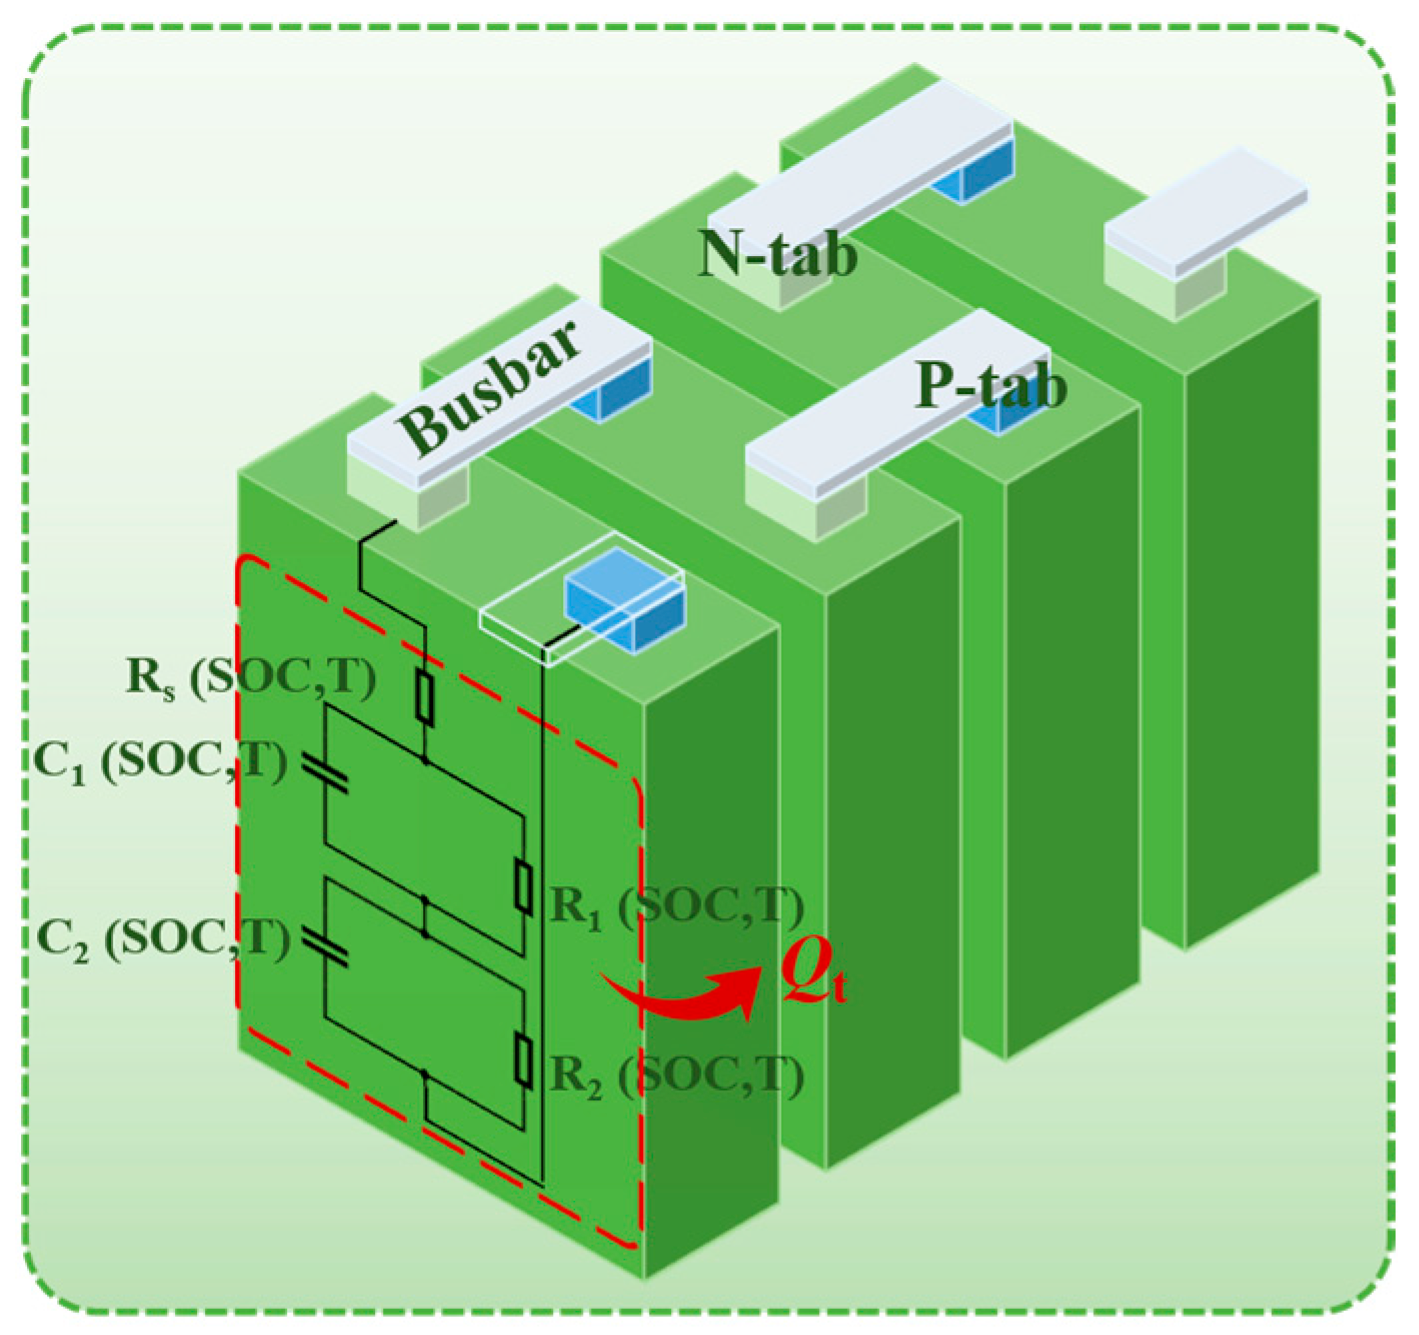
To determine the heat generation rate of the battery, a second-order Thevenin model is used in this study to calculate the electrical parameters, including the voltage, current, and internal resistance. The model consists of one internal resistance and two parallel resistor capacitor (RC) networks, which are used to characterize the capacitive and impedance behaviors of the battery, as shown in Figure 2.
U = U O C V + U 1 + U 2 R s × I
d U 1 d t = U 1 R 1 C 1 I C 1
d U 2 d t = U 2 R 2 C 2 I C 2
d S O C d t = I 3600 Q Ref
where U represents the real-time voltage, and I denotes the real-time current. UOCV is the open-circuit voltage. SOC is the state of charge, and QRef is the reference capacity. Rs, R1, R2, C1, and C2 are the electrical parameters of the second-order Thevenin model and are obtained from the HPPC test. In this study, the parameters of the equivalent circuit model are assumed to be identical for all batteries. Before the simulation, parameter tables for different temperatures and SOC levels are established. During the simulation, these values are obtained through interpolation. The calculated U and I are substituted into Equation (20) to determine the battery’s heat generation rate under different conditions. The results are implemented in Fluent using user-defined functions (UDFs).
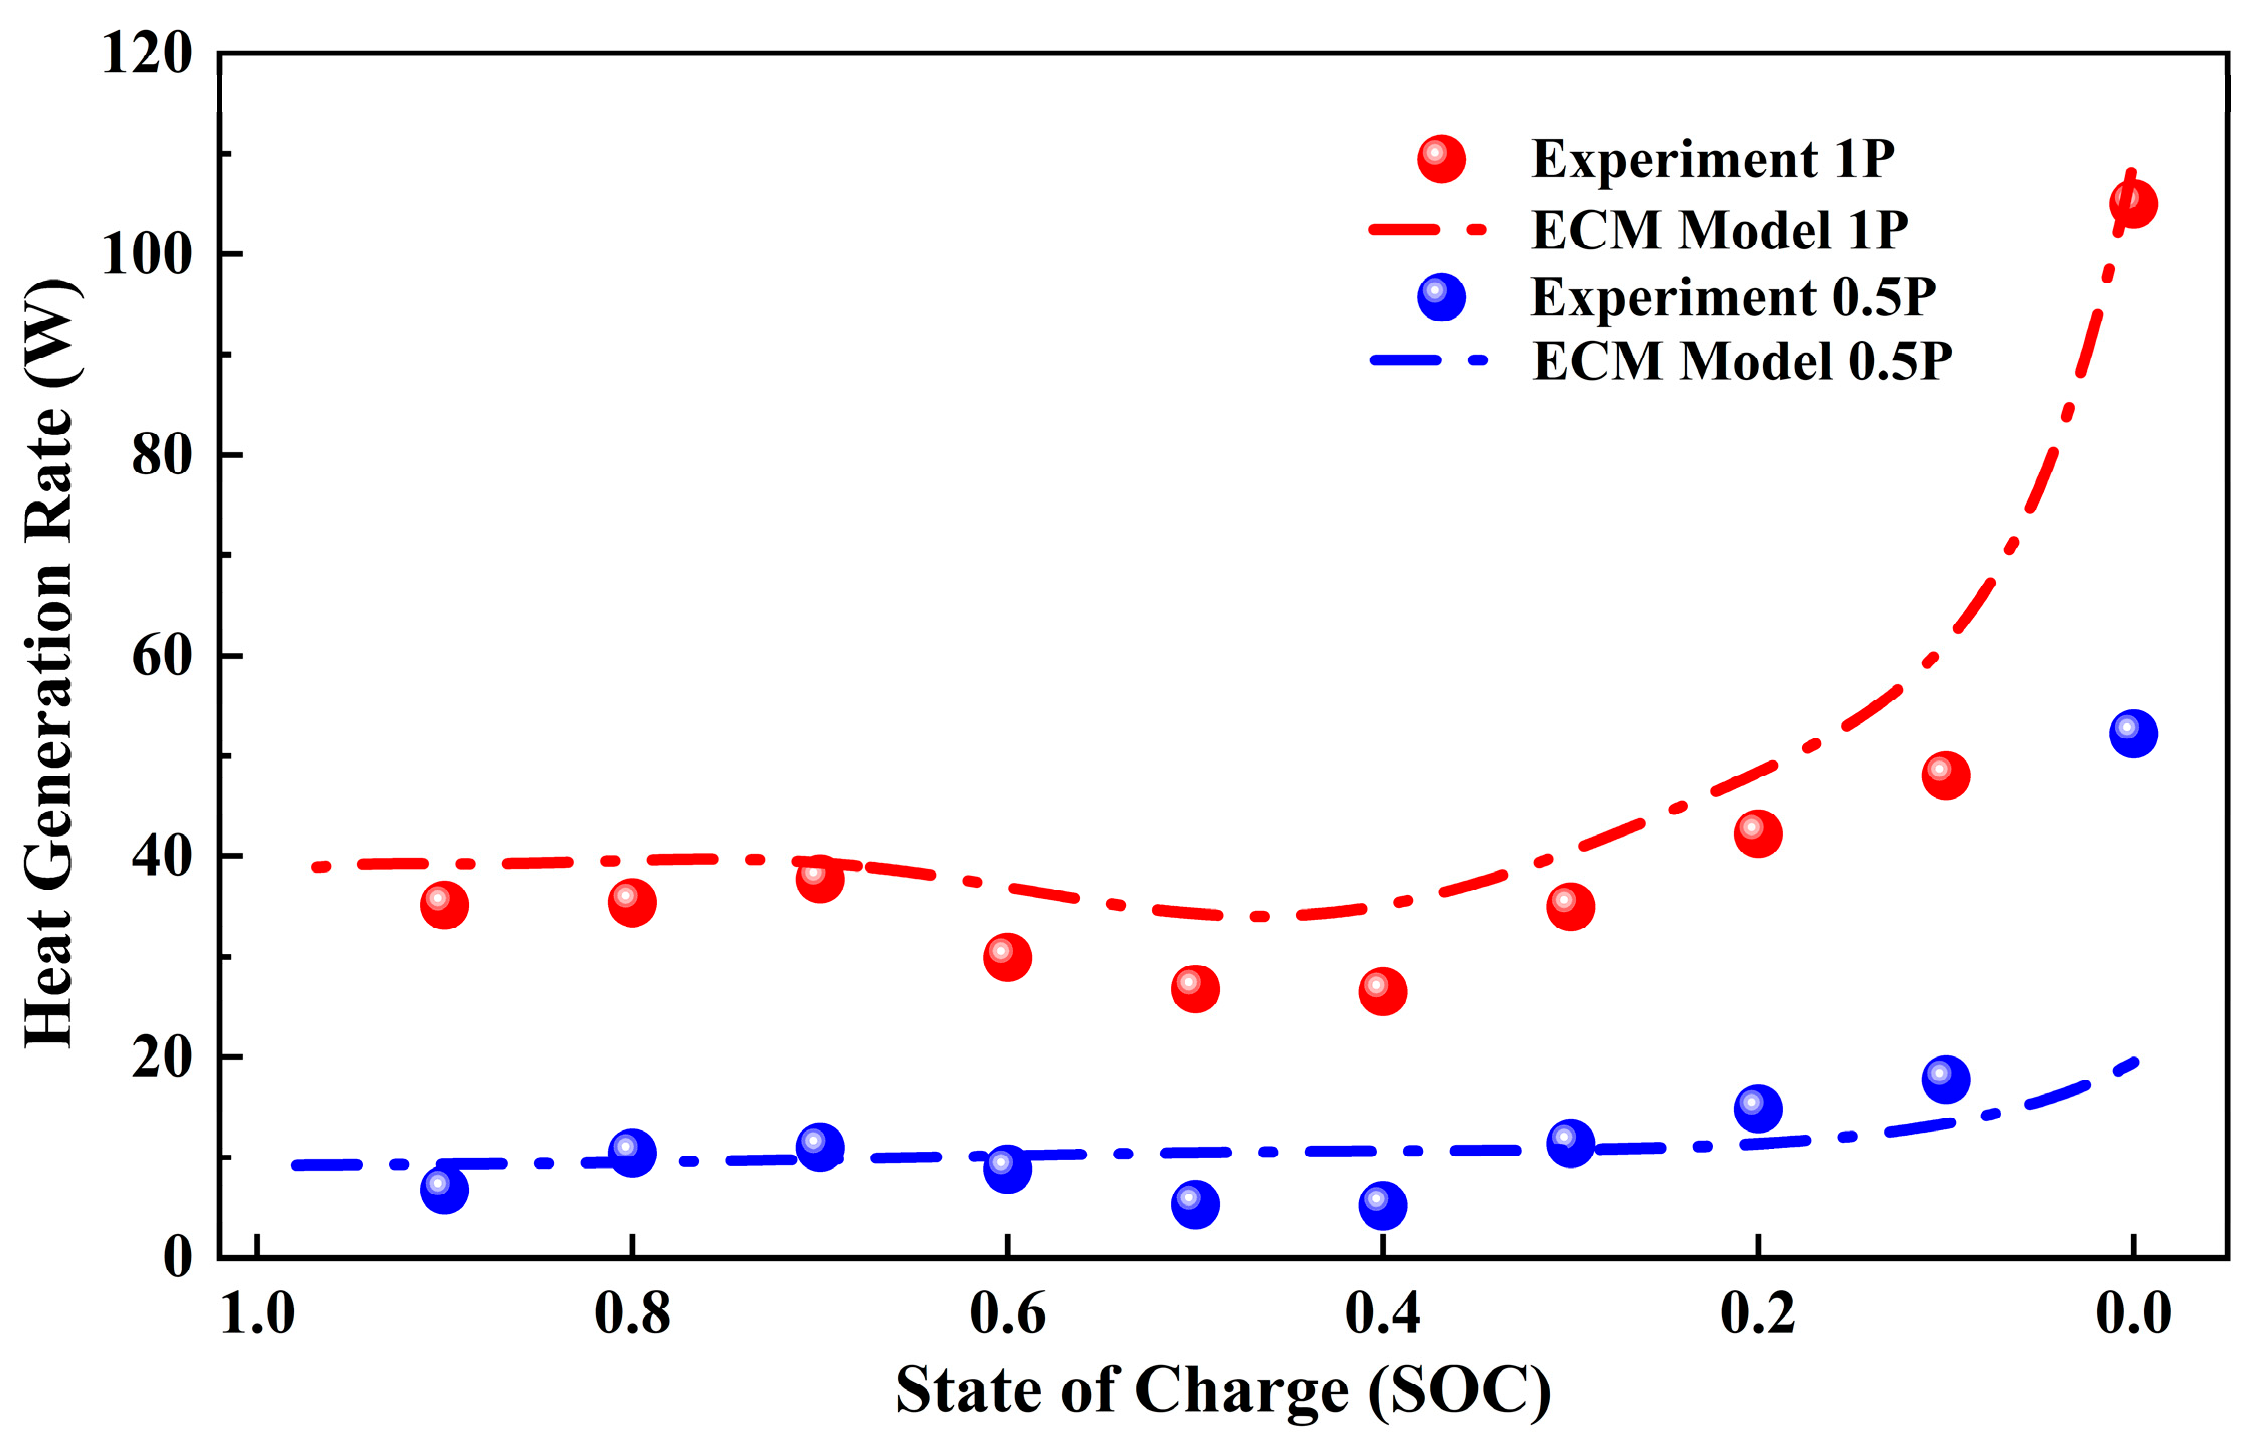
This study primarily investigates the constant power charging and discharging of batteries. As shown in Figure 3, the accuracy of the ECM at 25 °C is validated against experimental data. During constant power discharge, the heat generation rate remains relatively stable at first and then increases as the state of charge decreases. When the state of charge approaches zero, the heat generation rate increases sharply. This behavior is attributed to the rapid increase in internal resistance at a low state of charge. The increased resistance leads to a voltage drop, which in turn raises the current under constant power conditions.
It should be noted that the experimental validation presented in this section is limited to the battery equivalent circuit model. The complete hybrid thermo-fluid system, including R134a’s two-phase flow, the direct cooling plate’s heat transfer, and buoyancy-driven natural convection in the immersion chamber, has not yet been experimentally validated. The present work is therefore intended as a numerical proof-of-concept study to evaluate the feasibility and fundamental thermal–fluid characteristics of the proposed configuration.

2.4. Boundary and Initial Conditions

The boundary and initial conditions are specified according to the operating characteristics of the proposed hybrid battery thermal management system. The computational domain consists of two direct cooling plates, a sealed immersion chamber, and the solid components of the battery module. The upper and lower direct cooling plates are connected in parallel, and the total inlet volumetric flow rate is distributed between them according to the prescribed flow ratio.
The total volumetric flow rate of the coolant is varied from 6 to 18 L⋅min−1. The flow ratio is defined as the ratio of the inlet flow rate of the upper direct cooling plate to the total inlet flow rate as follows:
R a t i o = Q t o p Q t o p + Q b o t t o m × 100 %
where Q t o p and Q b o t t o m are the inlet volumetric flow rates of the upper and lower direct cooling plates, respectively. In this study, the flow ratio is varied from 10% to 90%. Therefore, the inlet flow rates of the upper and lower direct cooling plates are determined by
Q t o p = R a t i o Q t o t a l
Q b o t t o m = ( 1 R a t i o ) Q t o t a l
where Q t o t a l is the total inlet volumetric flow rate.
For the direct cooling system, R134a is used as the working fluid in the upper and lower direct cooling plates. The inlet temperature of R134a is set to 10 °C, and the inlet vapor mass quality is set to zero, indicating that the refrigerant enters the cooling plates in the liquid state. During the flow process, R134a absorbs heat from the battery module and the immersion fluid and then undergoes evaporation inside the direct cooling plates. For the reference indirect cooling system, a 50% ethylene glycol solution is used as the coolant under the same inlet temperature and flow rate conditions.
Pressure outlet boundary conditions are applied at the outlets of both the upper and lower direct cooling plates. The outlet gauge pressure is set to 0 Pa. For the R134a direct cooling system, a fixed inlet pressure is not prescribed. Instead, the inlet flow rate is specified according to each operating condition, and the corresponding inlet pressure is obtained as part of the numerical solution from the prescribed outlet pressure and the flow-induced pressure drop through the cooling plate. Therefore, the inlet pressure varies with the inlet flow rate. The local absolute pressure is used to determine the saturation temperature of the refrigerant in the Lee phase change model. Specifically, the local absolute pressure is obtained from the sum of the operating pressure and the local gauge pressure during the calculation of the pressure-dependent saturation temperature.
The immersion chamber is treated as a sealed fluid domain filled with KW890 dielectric immersion fluid. No inlet or outlet boundary condition is imposed on the immersion fluid. The flow inside the immersion chamber is driven only by buoyancy induced by temperature-dependent density variation. The no-slip boundary condition is applied at all solid–fluid interfaces. Thermal coupling is applied between the immersion fluid and the surrounding solid components, including the battery surfaces, support bars, end plates, busbars, and chamber walls.
The initial temperature of the whole computational domain, including the battery cells, solid components, immersion fluid, and cooling plates, is set to 20 °C. The inlet coolant temperature is maintained at 10 °C throughout the simulation. The outer surfaces of the computational domain are assumed to be adiabatic, so that the heat generated by the batteries is mainly removed through the direct cooling plates and the immersion fluid. Gravity is enabled in the vertical direction to account for buoyancy-driven natural convection in the immersion chamber.
All battery cells are initialized with the same thermal and electrical conditions. The initial state of charge is set to 100%, and the battery module is discharged at a 1P rate. The electrical parameters of the second-order Thevenin equivalent circuit model are assumed to be identical for all cells. The heat generation rate of each cell is calculated using the second-order Thevenin model combined with the Bernardi heat generation equation. The calculated volumetric heat generation rate is then introduced into the battery solid domain through user-defined functions.

2.5. Verification of Grid Independence

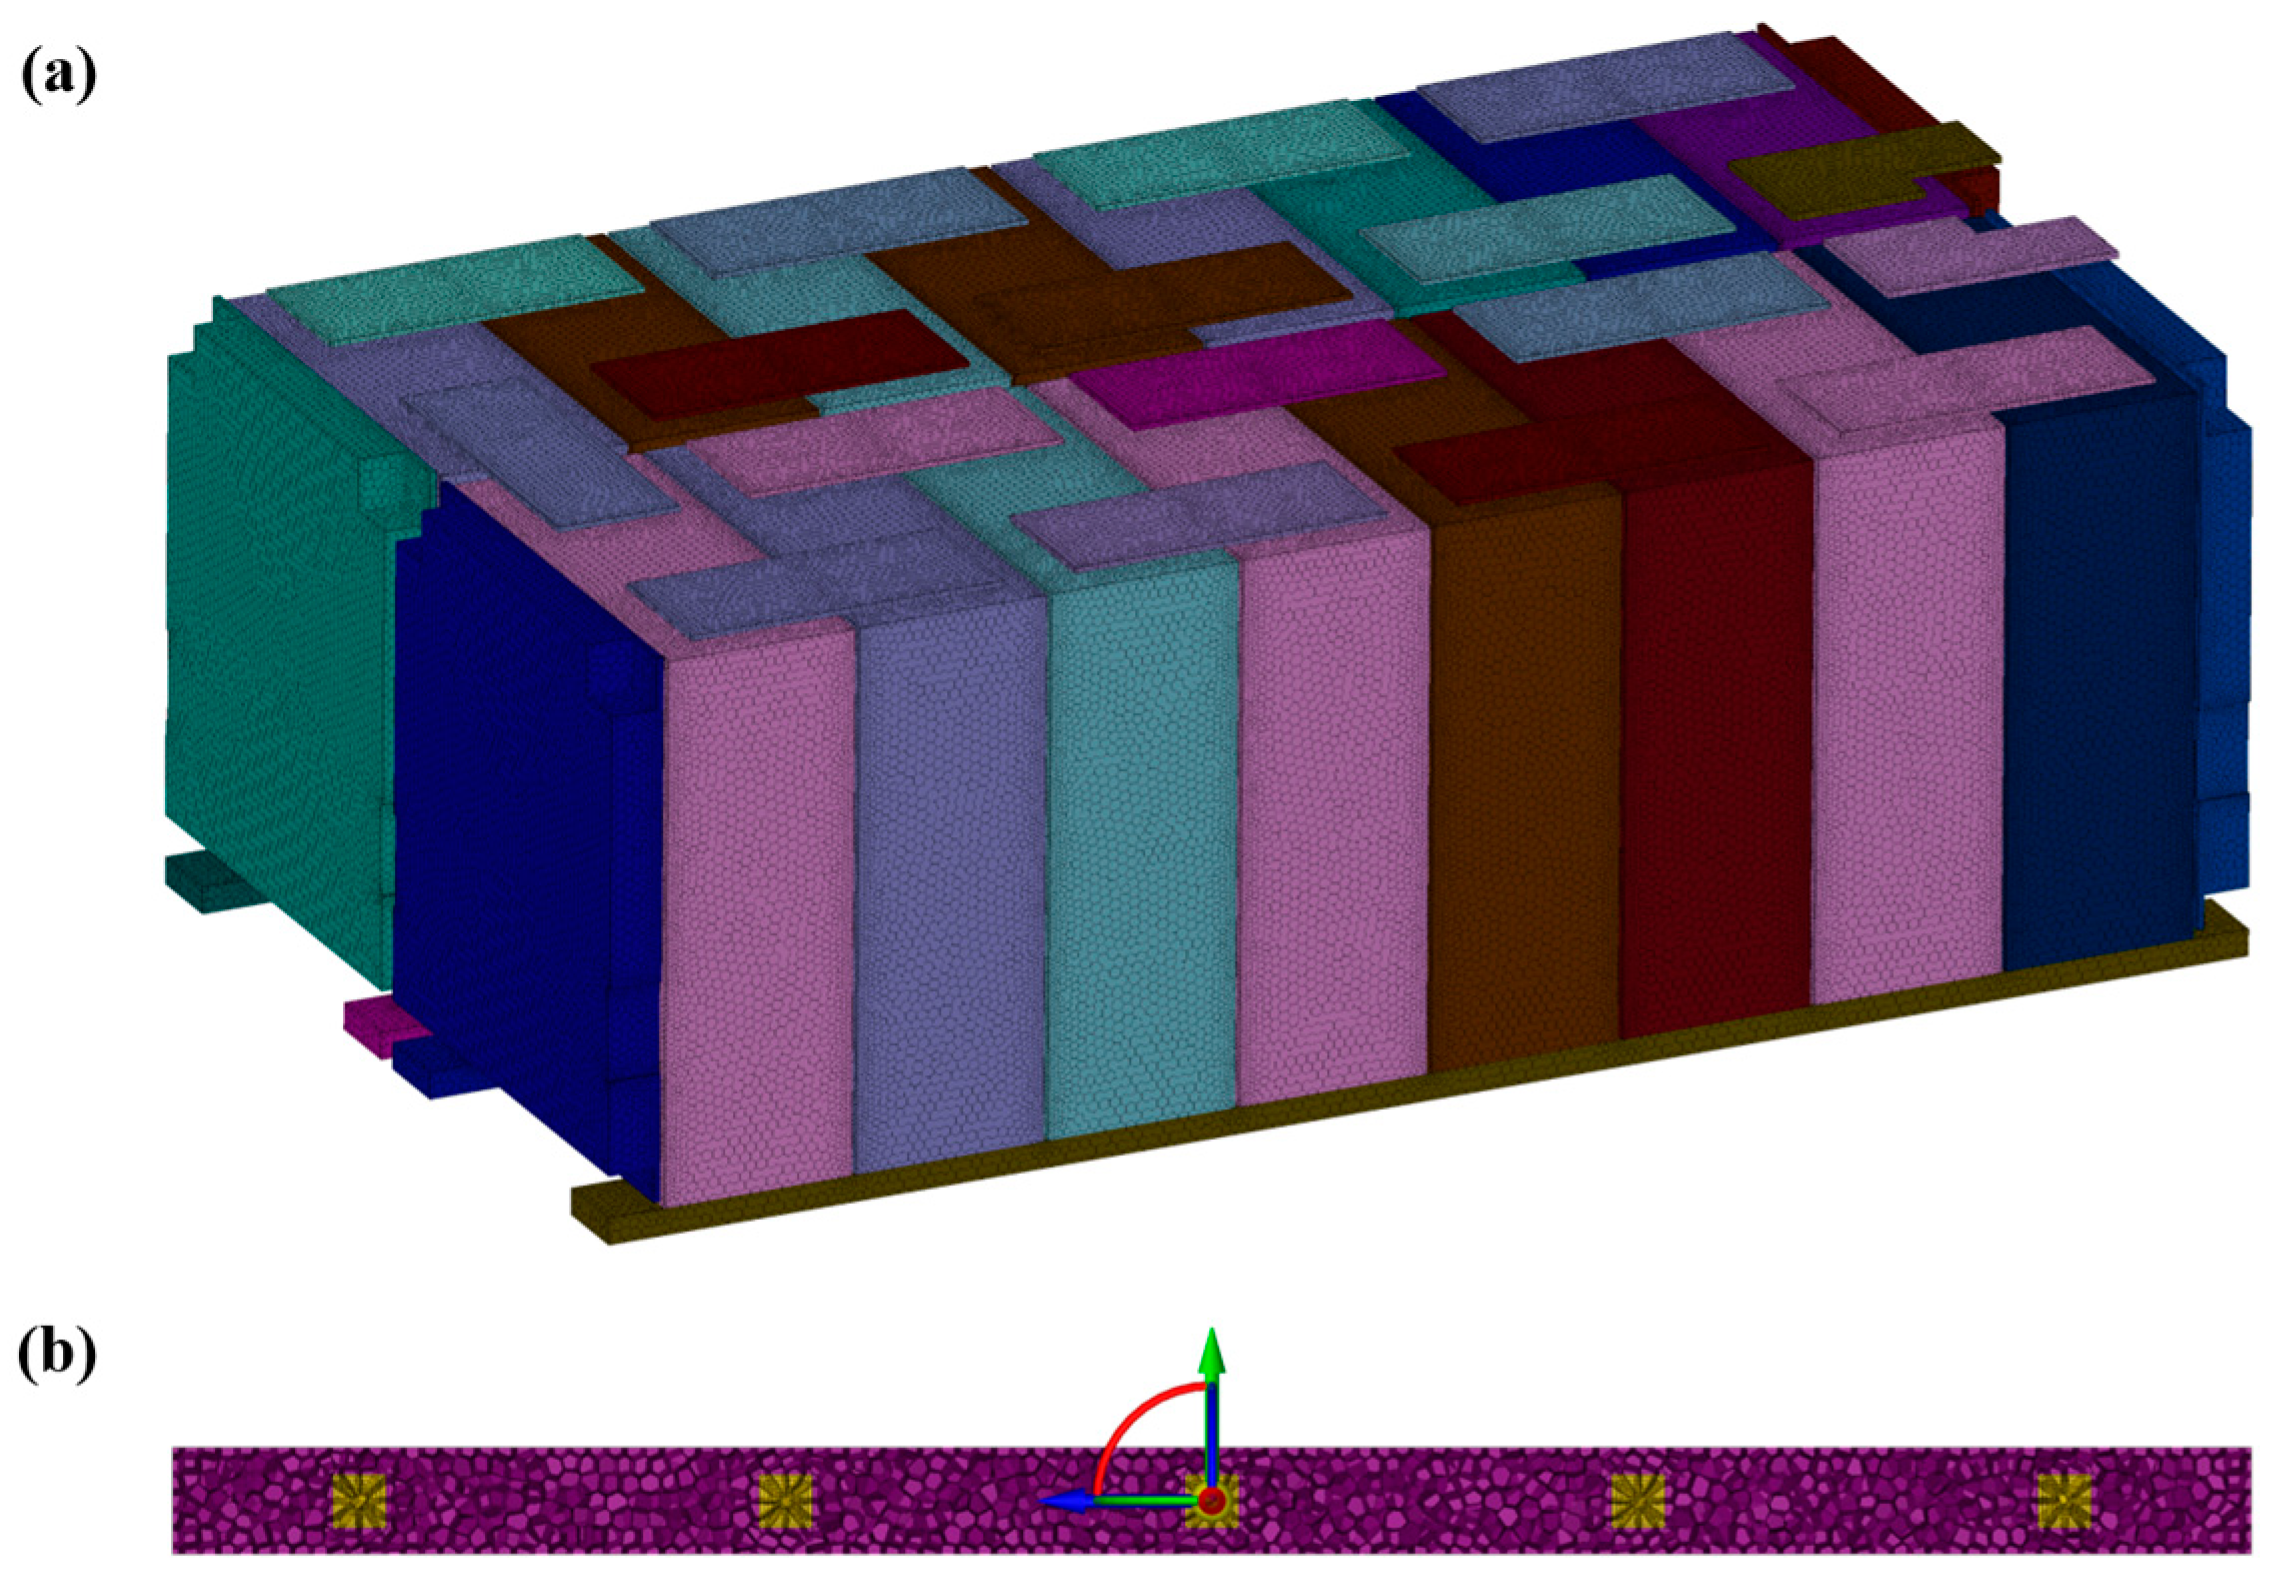
As shown in Figure 4, the computational mesh was generated using Fluent meshing. Local narrow gaps were refined to ensure the accurate resolution of the flow and heat transfer boundary layers. To balance computational cost and numerical accuracy, a mesh independence study was conducted for the direct cooling BTMS. As shown in Table 3, five mesh configurations were tested. The maximum temperature difference, average temperature, and pressure drop varied significantly from Mesh 1 to Mesh 4. For Mesh 1, the deviation in pressure drop reached 2%. With an increasing mesh density, all key indicators gradually converged. The results for Mesh 4 and Mesh 5 were nearly identical. Based on this comparison, Mesh 4 with 5,146,711 elements was selected for the subsequent simulations.

3. Results and Discussion

This section analyzes the thermal and hydraulic performance of the proposed hybrid battery thermal management system. First, the immersion-based direct cooling system is compared with the reference indirect cooling system under different total flow rates and upper cooling plate flow ratios. The effects of flow regulation on the pressure drop, battery temperature, temperature uniformity, flow field characteristics, and pump power consumption are discussed.
Based on the parametric results, a multi-objective optimization is then conducted for the direct cooling system. A Kriging response surface model combined with a multi-objective genetic algorithm is used to determine the optimal flow rate and flow distribution ratio, aiming to balance cooling performance, temperature uniformity, and energy consumption.

3.1. Comparison of System Performance Between Direct and Indirect Cooling

3.1.1. Flow Characteristics

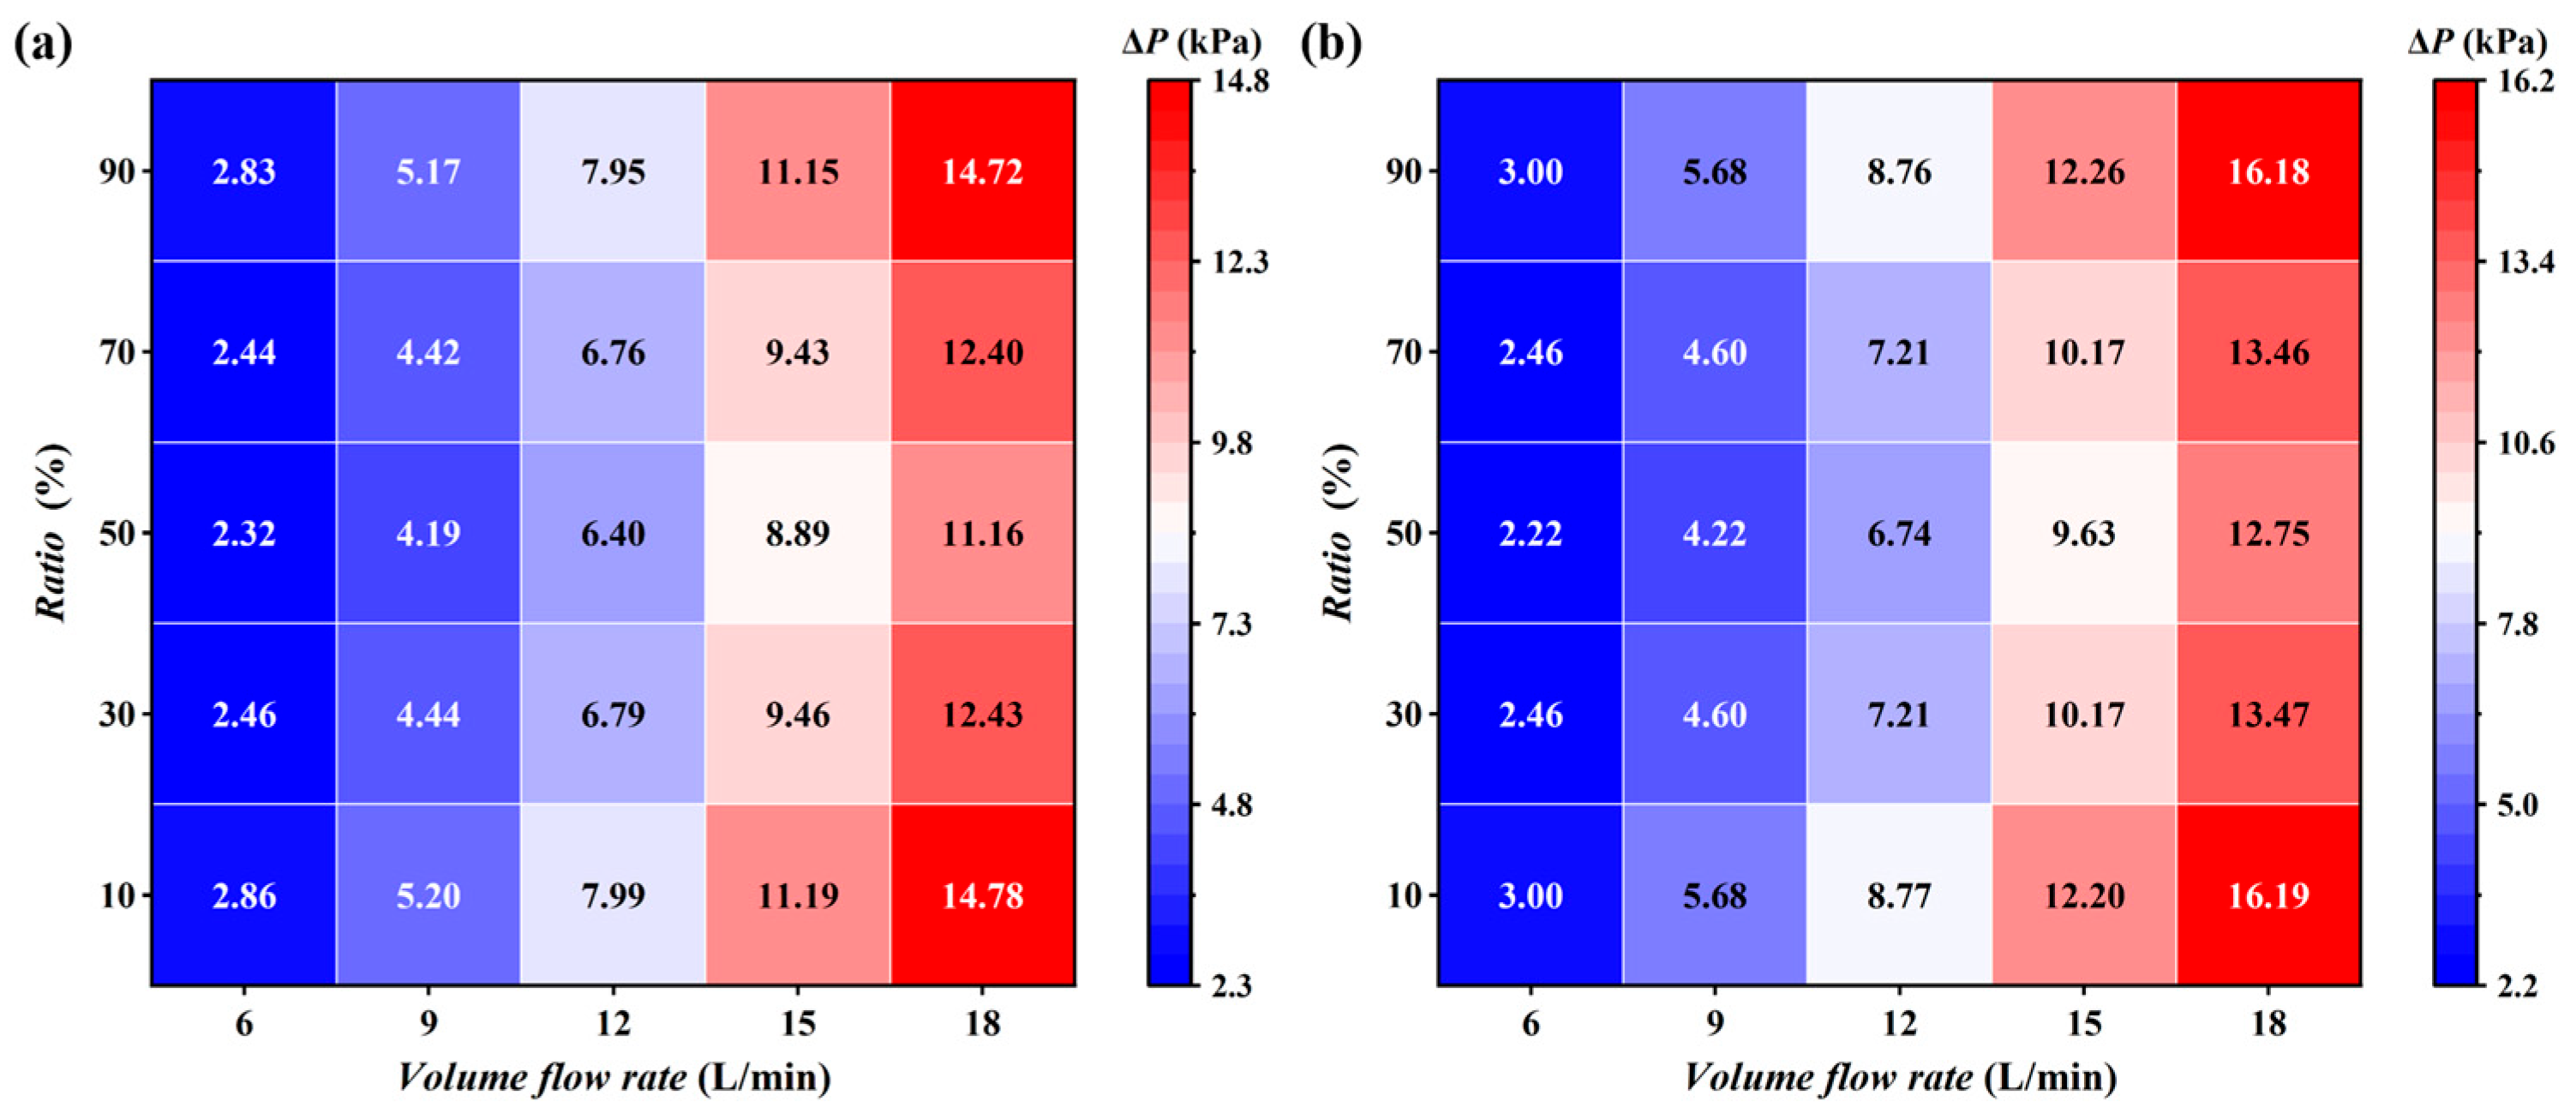
As shown in Figure 5, the pressure drop ∆P variation in the cooling plates is compared under different volumetric flow rates and flow ratios for both the direct cooling and indirect cooling configurations. Both cooling methods show the same trend, where the pressure drop increases continuously with an increasing flow rate, and the rate of increase becomes higher at larger flow rates. Under the direct cooling condition at a flow ratio of 50%, when the flow rate increases from 6 L⋅min−1 to 18 L⋅min−1, the ∆P increases from 2.32 kPa to 11.16 kPa. Although the flow rate triples, the ∆P increases by nearly four times.
In addition, the ∆P reaches its minimum value when the flow is evenly distributed (flow ratio = 50%). It increases as the flow distribution becomes more uneven. These two phenomena are attributed to the nonlinear relationship between the ∆P and flow rate and the dominant influence of the maximum branch flow rate in parallel channels on the overall pressure drop.
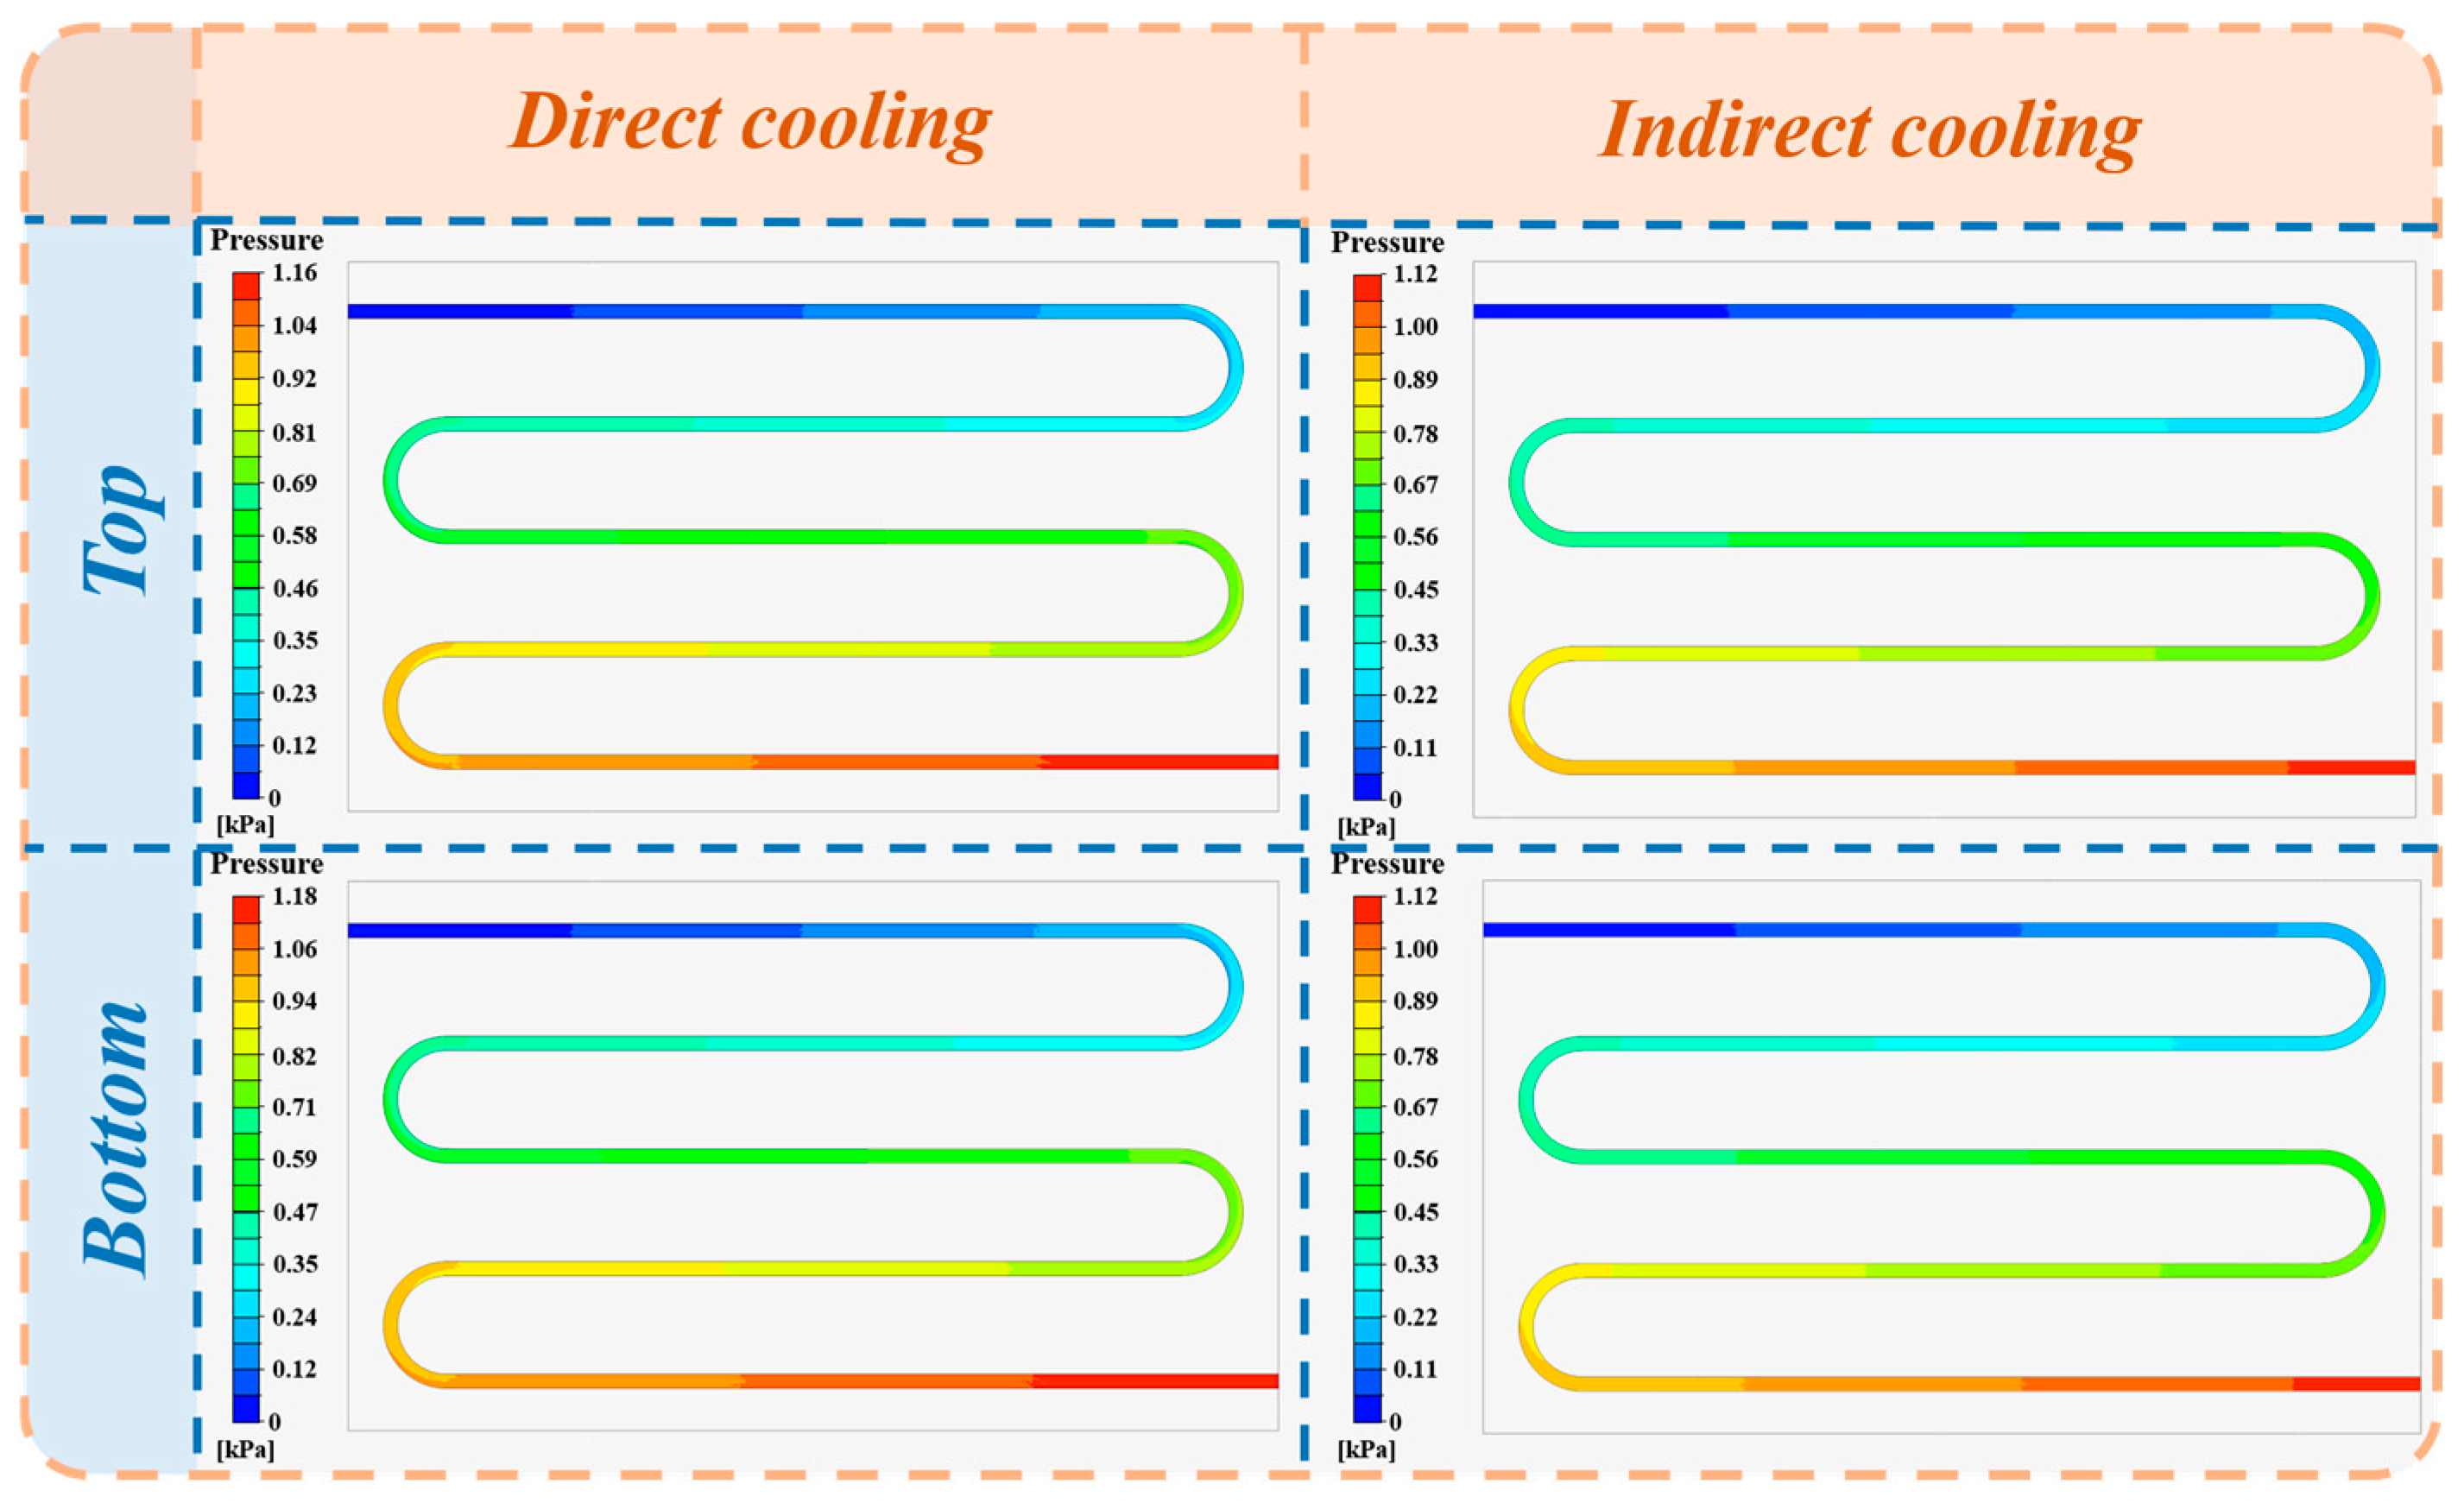
Figure 6 shows a comparison of the pressure contours of the upper and lower direct cooling plates under the conditions of flow rate = 6 L⋅min−1 and ratio = 50%. The pressure distributions of the two plates are generally similar, with comparable pressure variations at corresponding locations. For the indirect cooling plate, the pressure distributions on the upper and lower sides are identical. In contrast, for the direct cooling plate, the pressure drop of the lower plate is slightly higher than that of the upper plate. This difference is mainly attributed to the solid heat conduction path between the lower cooling plate and the battery, formed by the casing and support bars, which enhances heat transfer and promotes more complete refrigerant vaporization. As a result, the vapor volume fraction at the outlet of the lower plate (75.1%) is higher than that of the upper plate (74.6%). Under a constant channel cross-sectional area, a higher vapor fraction increases the volume of the gas–liquid mixture and the flow velocity, which in turn increases both the acceleration pressure drop and frictional pressure drop. Consequently, the ∆P of the lower plate is slightly higher than that of the upper plate.
Further comparison of direct cooling and indirect cooling shows that, under this representative low-flow condition, the overall pressure drop of the direct cooling plate is higher than that of the indirect cooling plate. Although the viscosity of R134a is much lower than that of the 50% ethylene glycol solution, intense flow boiling occurs inside the direct cooling plate. In the two-phase flow regime, the acceleration and frictional pressure drops induced by phase change dominate the flow resistance. The flow resistance caused by gas–liquid expansion and high-velocity two-phase flow exceeds that induced by the higher viscosity of the single-phase liquid, resulting in a higher pressure drop in the direct cooling plate.
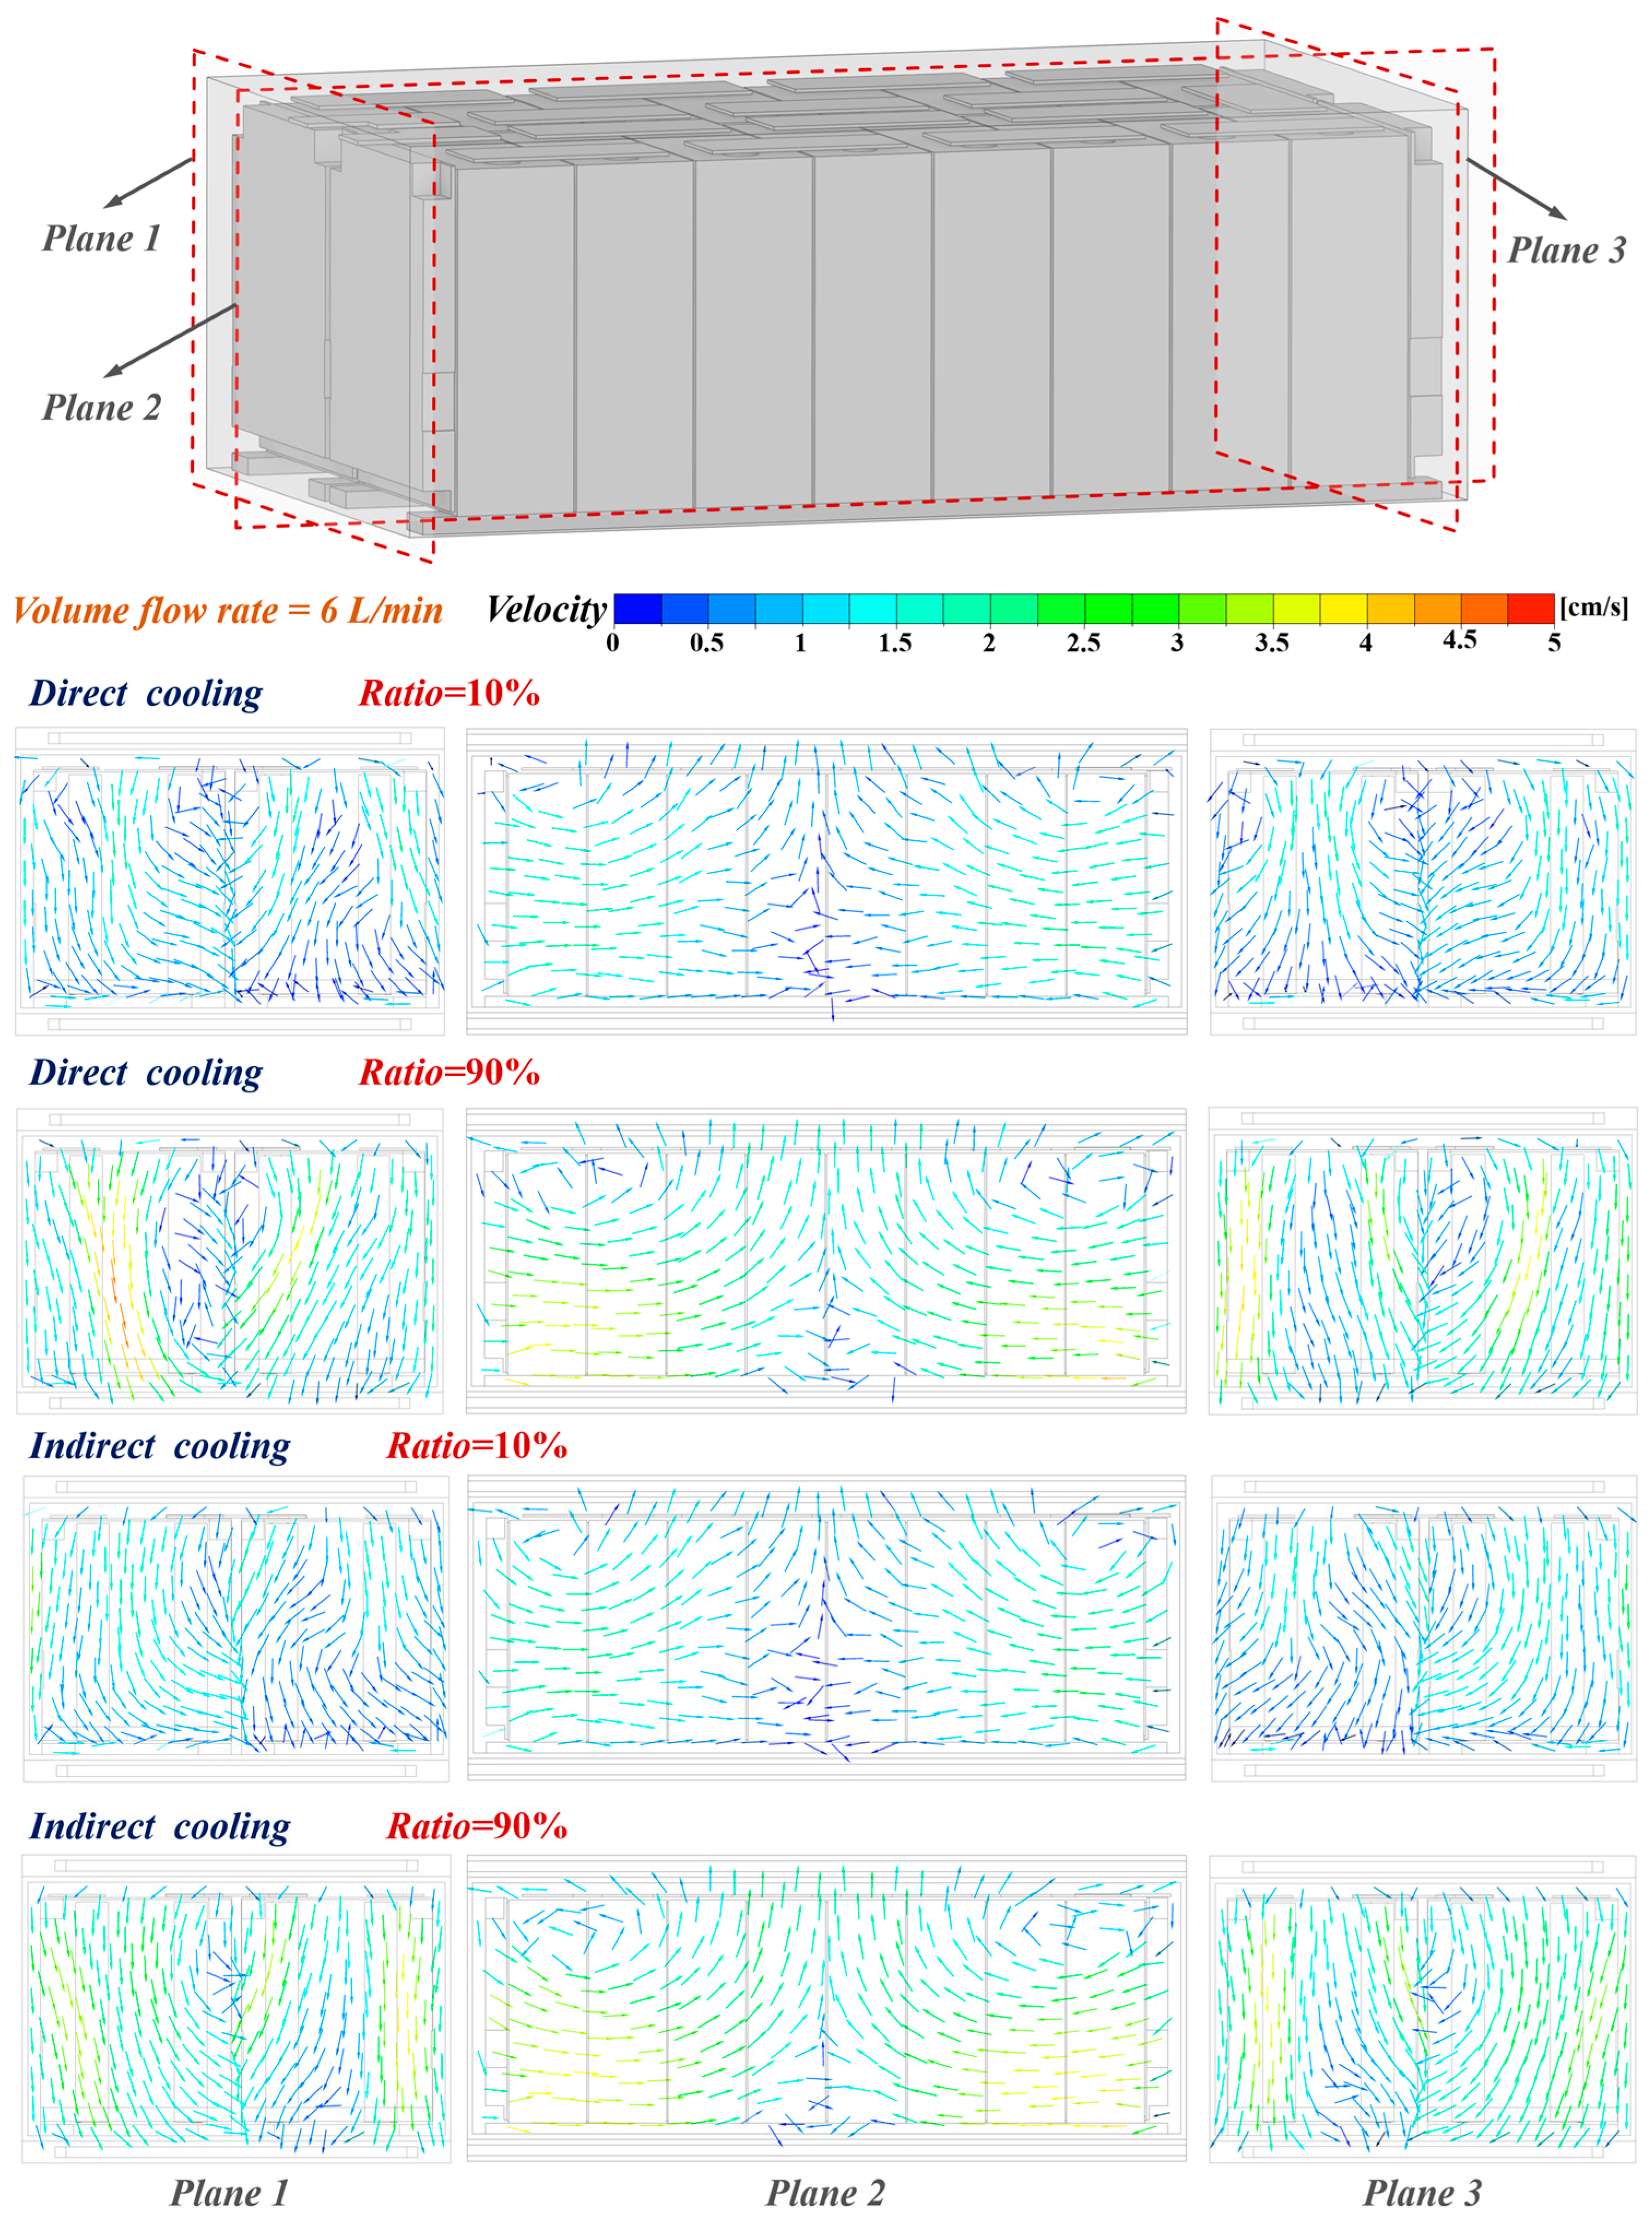
Figure 7 shows the flow field characteristics on three cross-sectional planes of the direct cooling and indirect cooling systems under different flow ratio conditions. Overall, the immersion fluid forms a natural convection circulation within the chamber. At Plane 2, the immersion fluid converges from both sides toward the center and flows upward. At Planes 1 and 3, the fluid enters from the upper region and then flows toward the left, right, and central gaps between cells, enhancing heat transfer between the fluid and the cells.
A comparison shows that when the flow ratio is 90%, the natural convection intensity is significantly higher than that at 10%, with a maximum velocity of 5 cm per second, more than twice that of the 10% condition. This is because increasing the flow rate of the upper cooling plate significantly reduces the temperature of the upper immersion fluid, increasing its density and causing it to sink. Meanwhile, the heated fluid in the lower region becomes less dense and rises, forming a stronger natural convection loop. Therefore, at a constant total flow rate, a higher flow ratio in the upper cooling plate enhances natural convection.
It should be noted that the buoyancy-driven circulation is sensitive to practical operating conditions. The module’s inclination changes the gravity direction relative to the cell gaps and the upper and lower cooling surfaces, which may redirect or weaken the natural convection loops. Vehicle vibration may disturb the thermal boundary layers and modify fluid mixing inside the immersion chamber, while non-uniform heat generation among cells may induce asymmetric thermal plumes and localized hot regions [38]. The present study assumes a stationary and vertically installed module with uniform cell parameters. Therefore, the effects of inclination, vibration, and non-uniform heat generation are not considered in the current model and will be further investigated in future work.

3.1.2. Thermal Characteristics

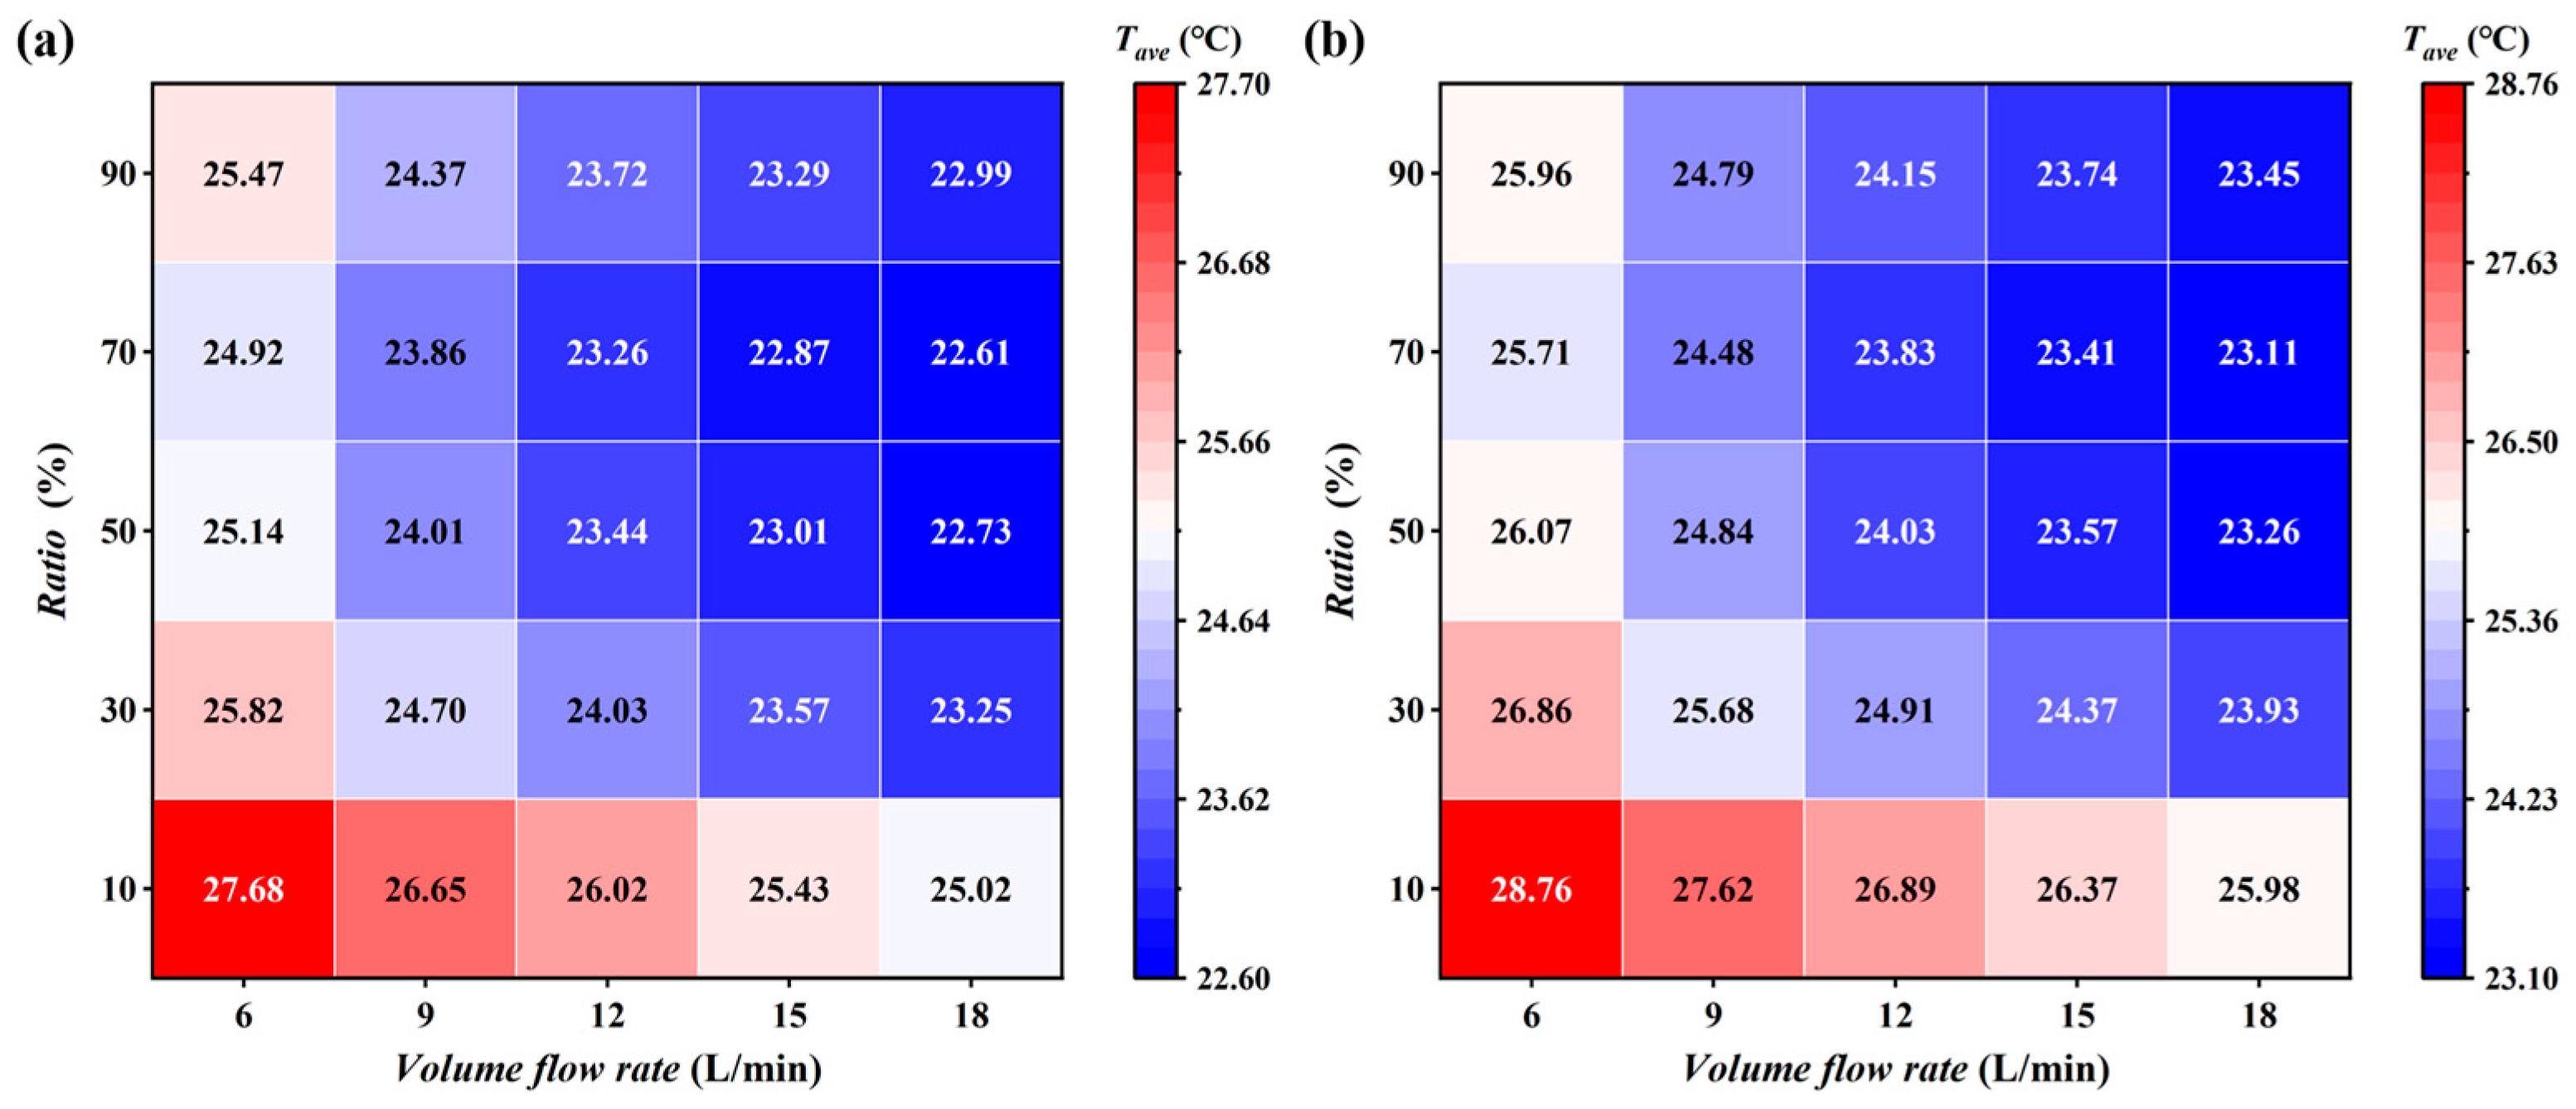
Figure 8 shows the variation in the average battery surface temperature (Tave) under both direct cooling and indirect cooling conditions. The two cooling methods exhibit similar trends. Tave decreases with an increasing flow rate, while the temperature reduction per unit increase in flow rate gradually diminishes. Taking the direct cooling system at a flow ratio of 50% as an example, when the flow rate increases from 6 L⋅min−1 to 18 L⋅min−1, Tave decreases from 25.14 °C to 22.73 °C. The temperature reduction per 1 L⋅min−1 decreases from 0.38 °C to 0.09 °C. This behavior can be explained as follows. In the low flow regime, the convective heat transfer coefficient increases significantly with an increasing flow rate. The thermal resistance is mainly dominated by the coolant side, leading to a strong cooling effect. As the flow rate further increases, the internal heat conduction within the battery and the contact thermal resistance between the cooling plate and the battery become dominant. This results in diminishing improvements in the overall heat transfer performance.
In addition, the relationship between Tave and the ratio is nonlinear. When the flow ratio increases from 10% to 70%, Tave decreases with an increasing flow ratio. However, when the flow ratio further increases from 70% to 90%, Tave increases. This behavior can be explained as follows. The lower cooling plate can directly remove heat from the battery. In the low flow ratio range, increasing the ratio allows the upper cooling plate to absorb more heat from the immersion coolant, which enhances natural convection within the immersion coolant. In the high flow ratio range, the upper cooling plate further strengthens natural convection. However, the reduced flow rate in the lower cooling plate significantly degrades its heat transfer performance. This weakens the overall thermal management capability, leading to an increase in Tave.
Further comparison of direct cooling and indirect cooling shows that the direct cooling system consistently achieves a lower Tave under all operating conditions. This reflects the high heat transfer efficiency associated with refrigerant phase change. At the same flow rate, the difference in Tave between the two systems decreases as the flow ratio increases, from 1 °C to 0.5 °C. This is because a higher flow ratio results in a reduced flow rate in the lower direct cooling plate. The reduced flow significantly weakens the heat transfer performance of the lower plate and leads to local temperature rise. As a result, Tave increases and the advantage of direct cooling over indirect cooling is weakened.
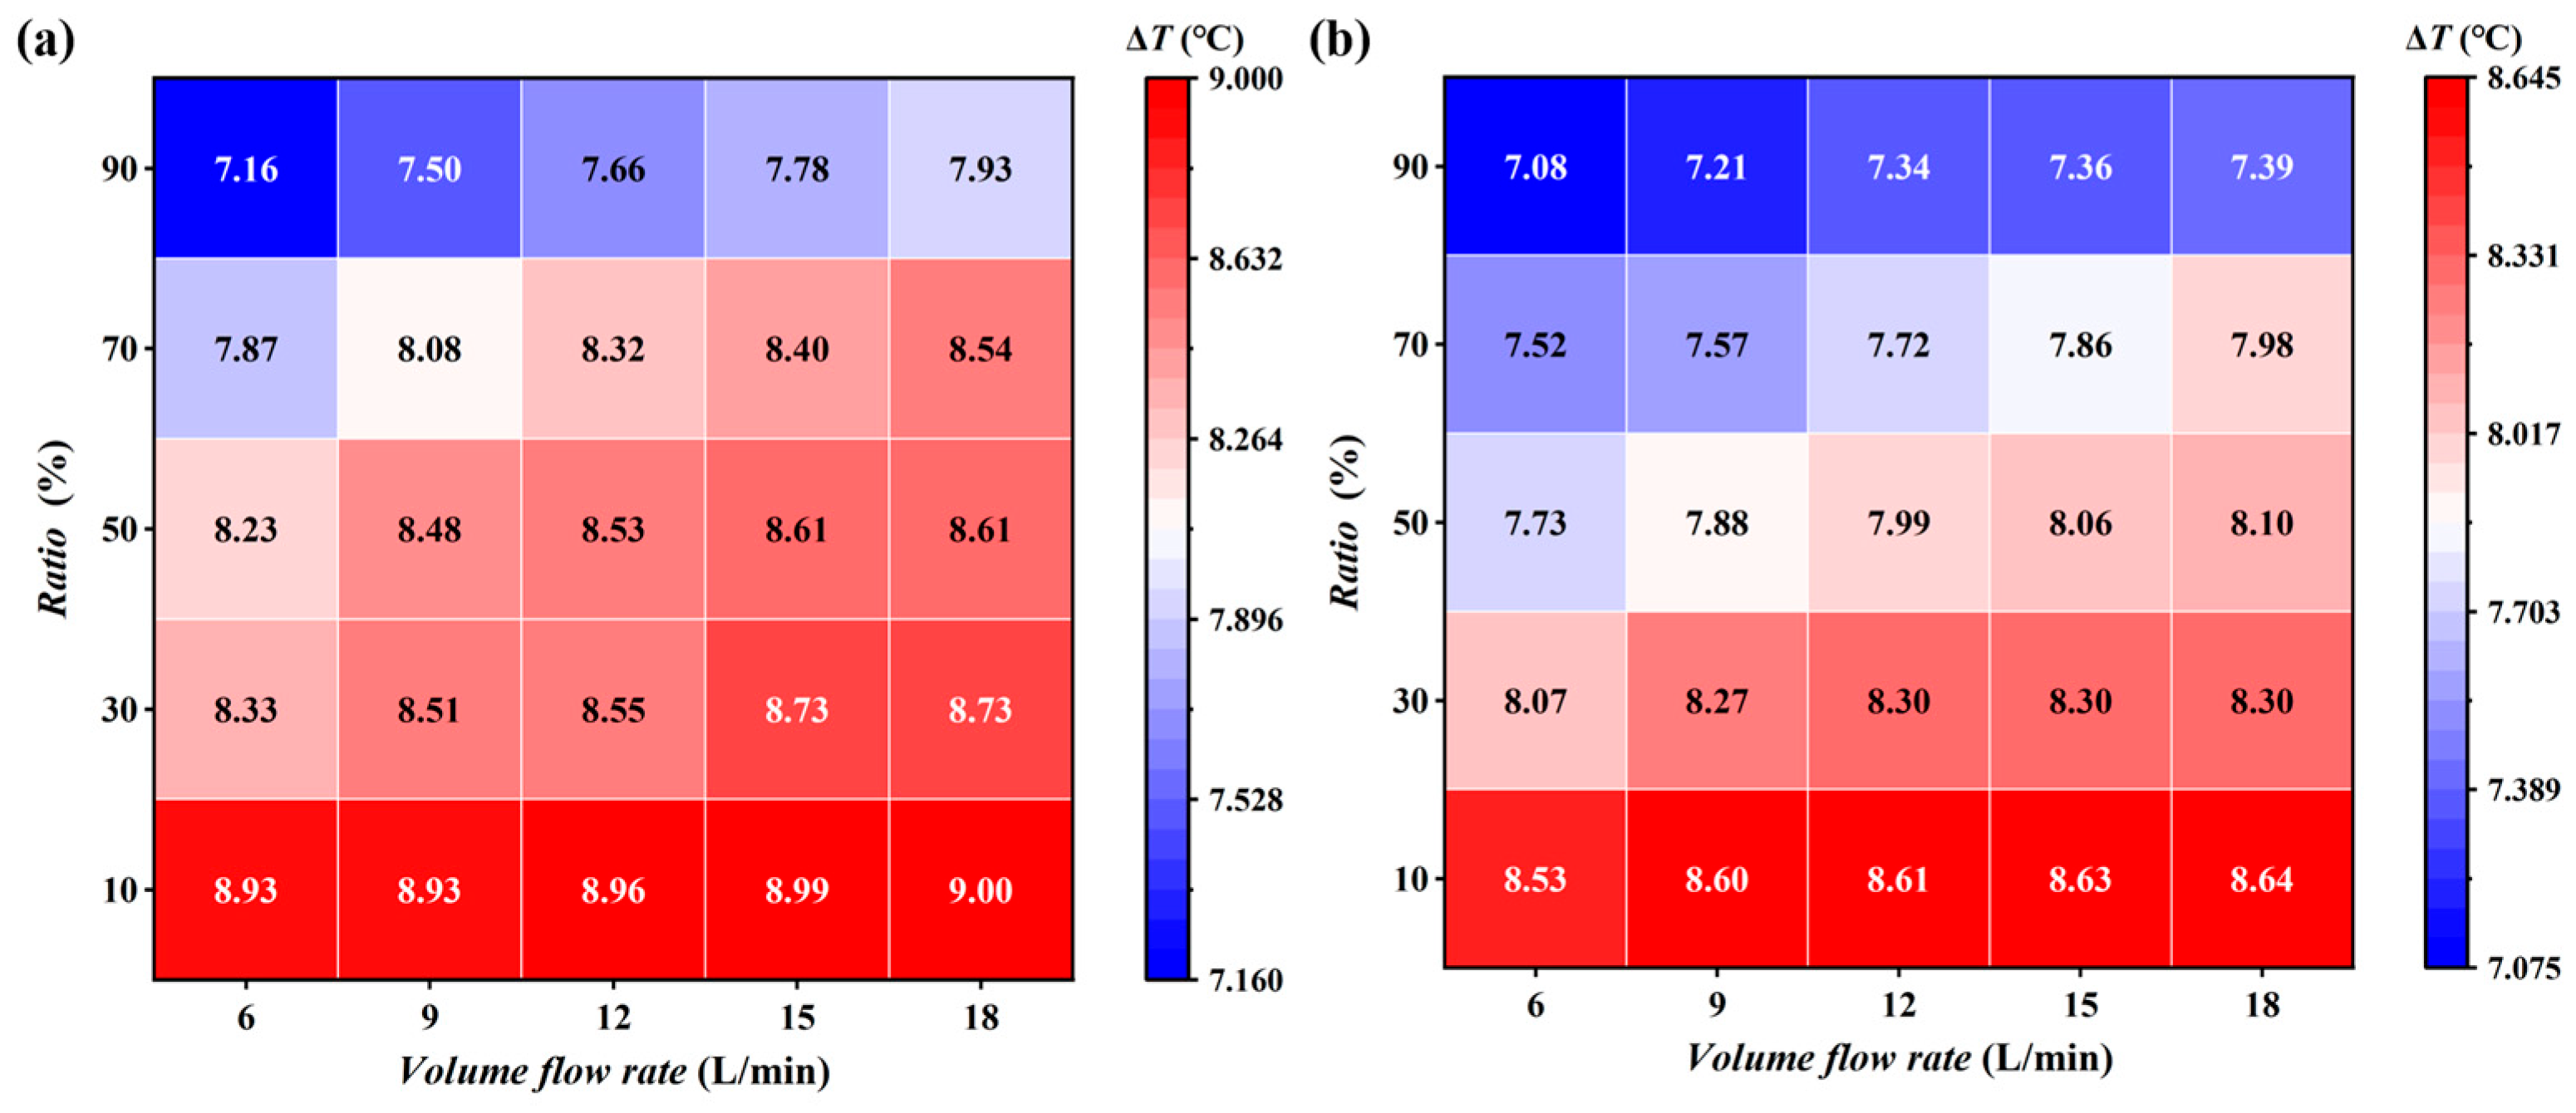
The maximum battery temperature difference (∆T) is another key performance metric for BTMSs. It represents the temperature difference between the highest and lowest battery surface temperatures and is critical under extreme operating conditions. This definition differs from the commonly used cell-to-cell temperature difference evaluated at corresponding monitoring locations. Figure 9 compares the variation in ∆T under direct cooling and indirect cooling conditions. Both cooling methods show similar trends, where ∆T increases with an increasing flow rate. At higher flow rates, local cold regions are overcooled, while hot spots are not effectively suppressed. This leads to an enlargement of the temperature difference. As the flow ratio increases, ∆T gradually decreases. The reduction is more pronounced in the range from 70% to 90%, where ∆T decreases by up to 0.6 °C on average. This behavior can be explained as follows. Under natural convection conditions, high-temperature fluid tends to accumulate in the upper region due to density differences. Increasing the flow rate of the upper cooling plate allows more heat to be removed from the immersion fluid. This enhances cooling of the upper half of the battery module and strengthens natural convection within the immersion fluid, thereby alleviating local hot spots.
Unlike the trends observed for Tave and ∆P, the ∆T under indirect cooling is lower than that under direct cooling, with a difference of up to 0.6 °C. This is because the evaporation cooling rate in the direct cooling system is relatively high, resulting in a higher heat transfer capability than that of indirect cooling. As a result, overcooling occurs in regions where the bottom of the battery module is in direct contact with the cooling plate. This leads to lower local temperatures compared with indirect cooling and increases the overall temperature non-uniformity.
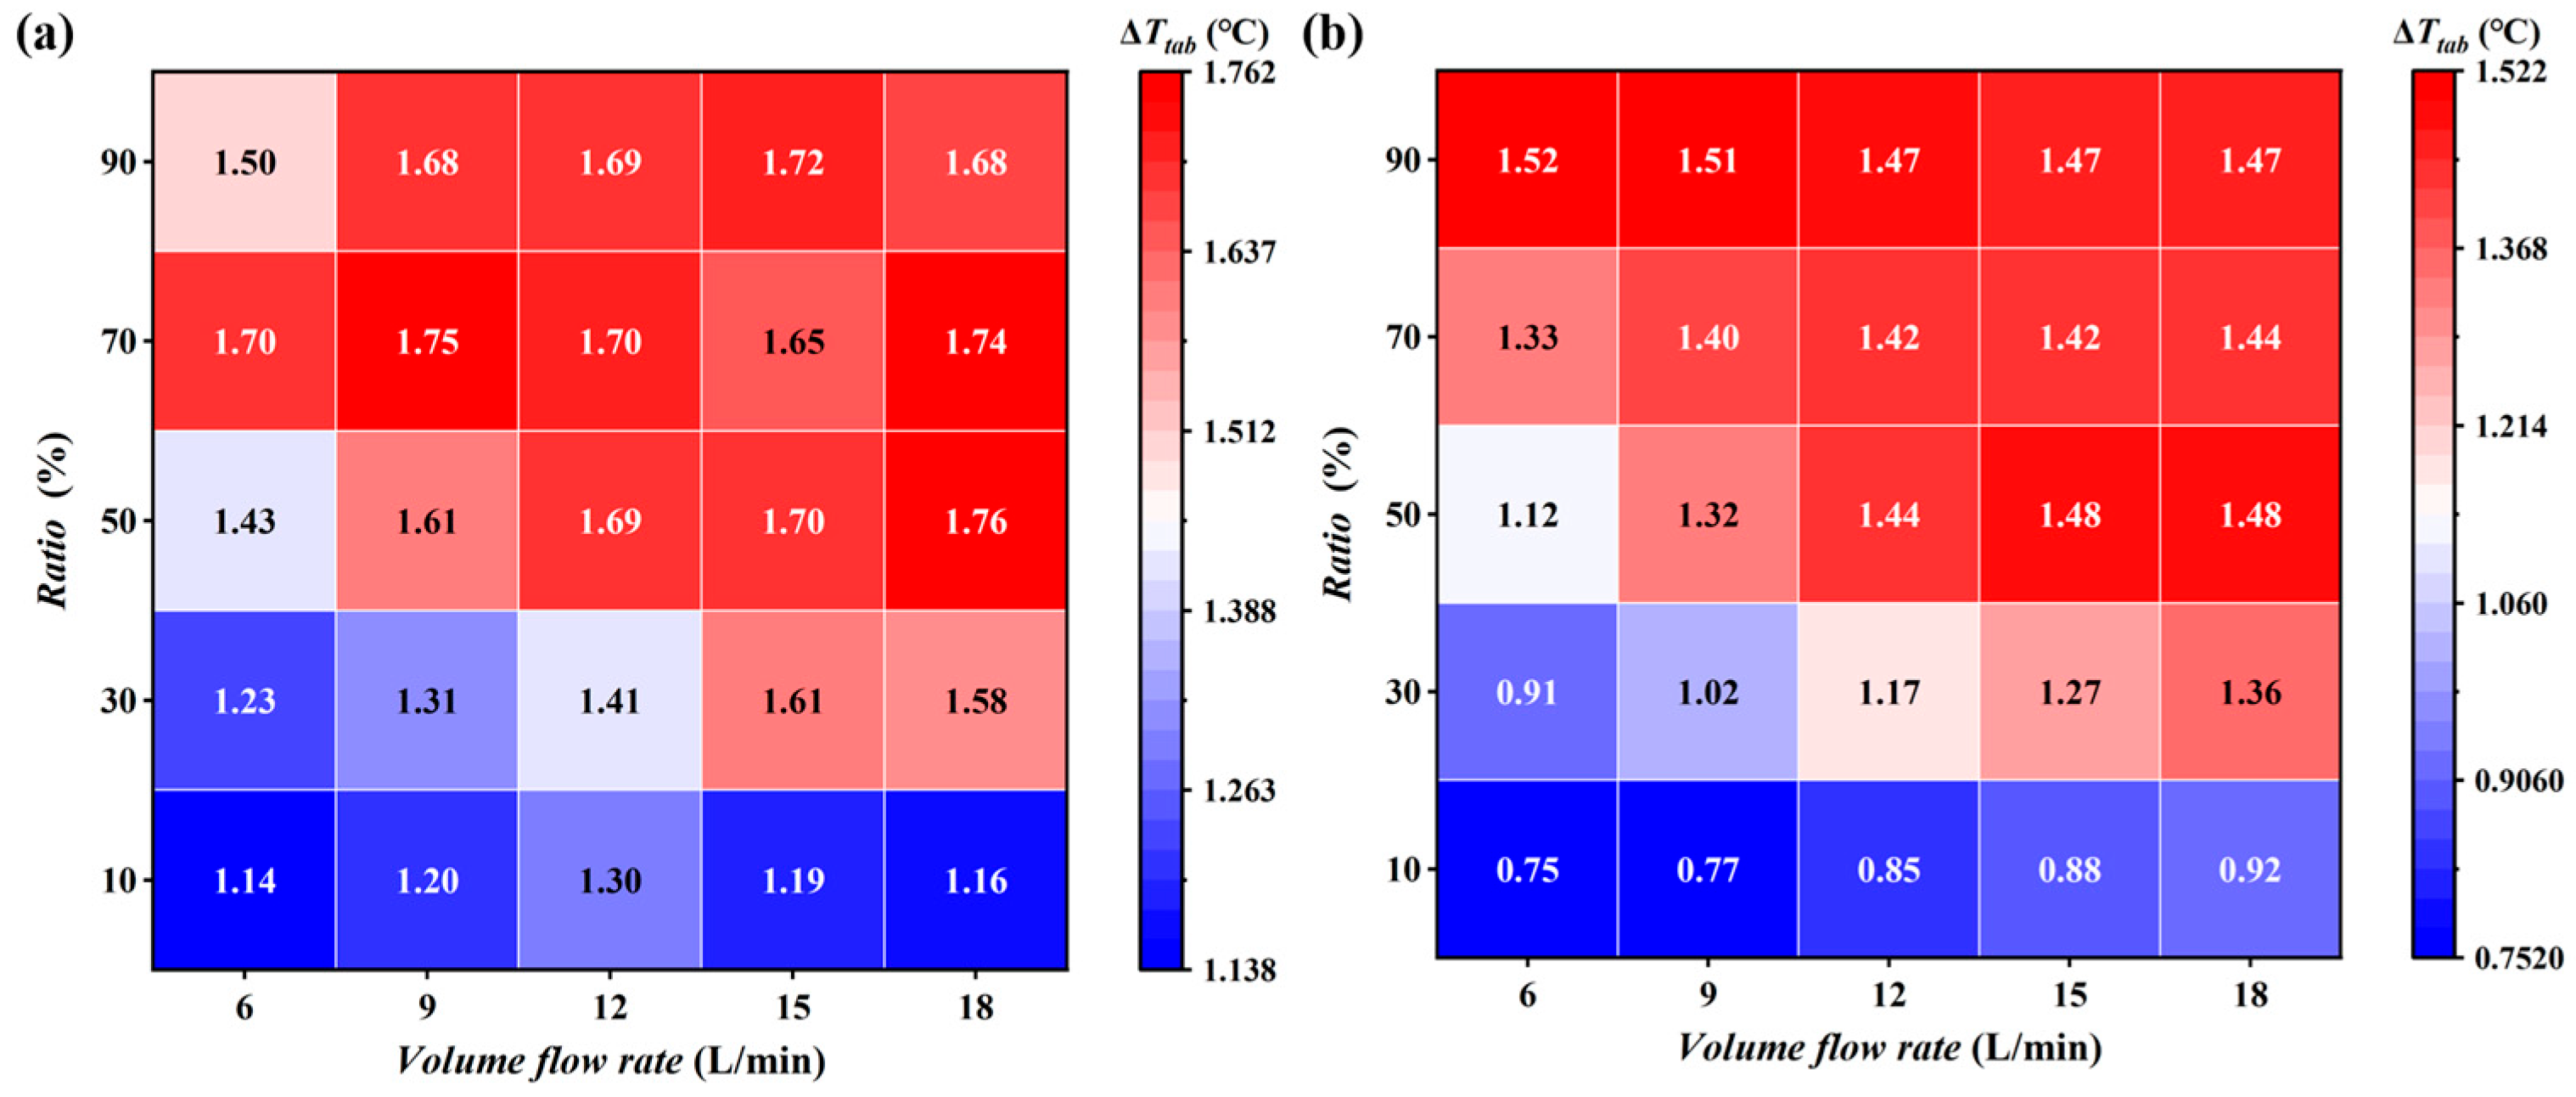
In practical engineering applications, it is difficult to monitor the temperature of all battery surfaces in real time. Therefore, this study also measures the temperature at the positive battery tabs. Figure 10 shows the maximum temperature difference among the tab monitoring points (∆Ttab) under both direct cooling and indirect cooling schemes. ∆Ttab represents the temperature difference among the corresponding positive-tab locations of different cells and is therefore more directly comparable with the commonly recommended cell-to-cell temperature-uniformity criterion. Under the investigated operating conditions, ∆Ttab remains below 5 °C. Overall, both cooling schemes exhibit similar trends. ∆Ttab increases with an increasing flow ratio and flow rate. However, at higher flow ratio values, the influence of flow rate on ∆Ttab becomes less significant. This is because the positive tabs are located in the upper region of the immersion chamber, where their temperature is mainly governed by natural convection. As the flow ratio increases, natural convection is enhanced. Tabs with lower initial temperatures experience stronger cooling by the immersion coolant, while those with higher initial temperatures receive limited additional cooling. This leads to a further increase in the temperature difference between tab locations.
In comparison, ∆Ttab under the direct cooling scheme is generally higher than that under the indirect cooling scheme. The difference is more pronounced at low flow ratio values. This can also be attributed to stronger natural convection effects under direct cooling conditions.
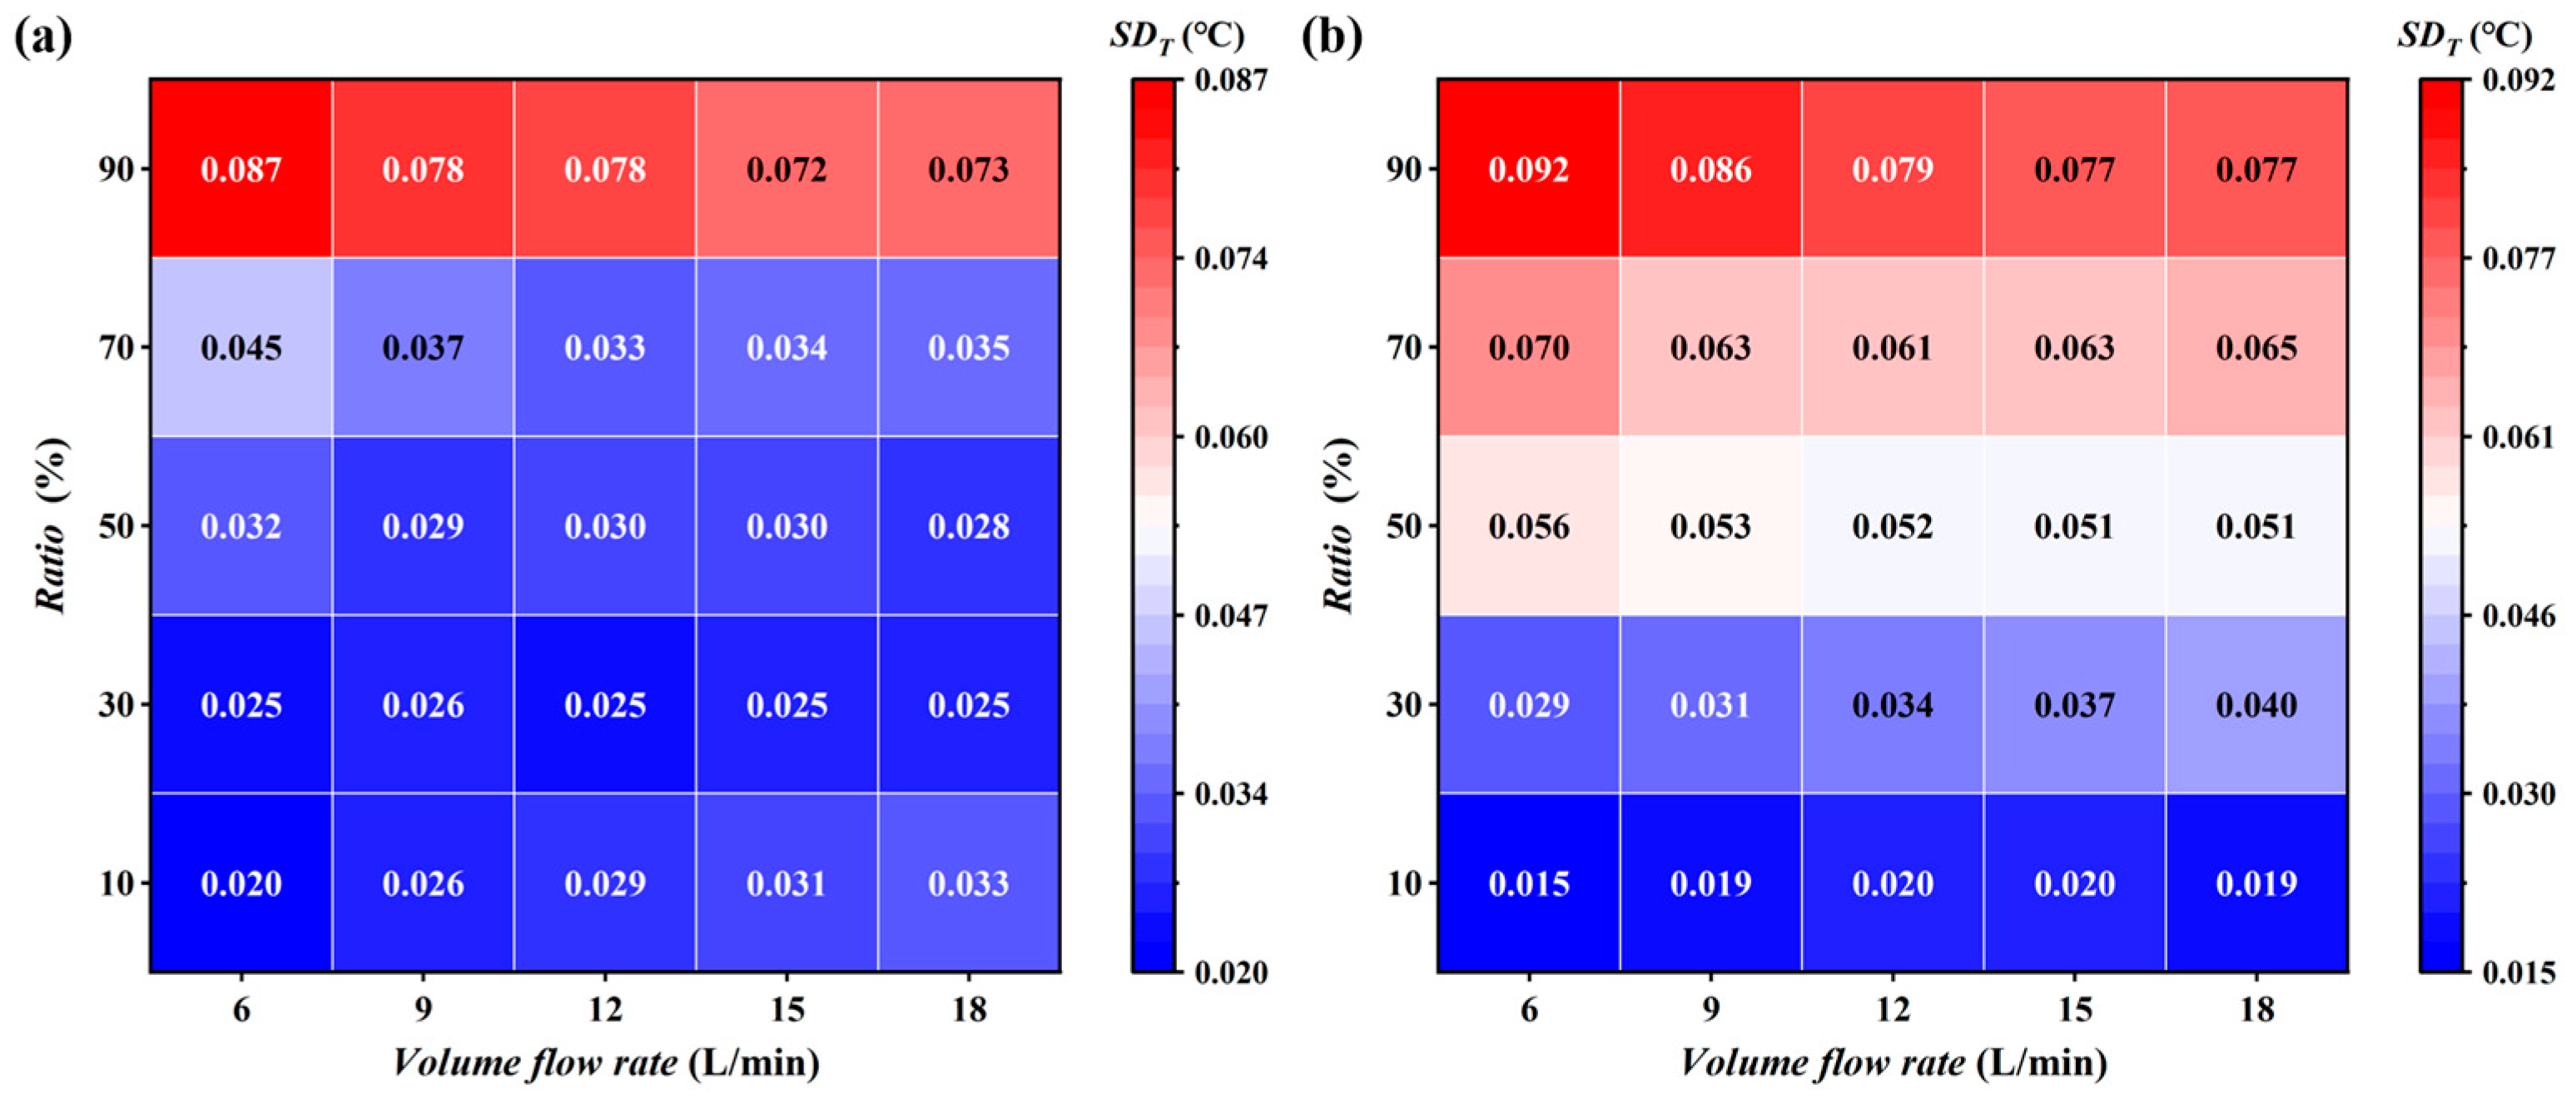
In addition to the ∆T, battery temperature uniformity is also an important indicator for evaluating BTMS performance, as it characterizes the degree of temperature balance among individual cells. Figure 11 shows the standard deviation of cell temperatures (SDT) under direct cooling and indirect cooling conditions. The corresponding calculation is given as follows:
S D T = 1 n i = 1 n ( T i T a v e ) 2
where Ti is the average surface temperature of each cell. Tave is the average battery surface temperature, and n is the number of cells, which is 16 in this study.
Unlike the trends observed for Tave and ∆T, the direct cooling and indirect cooling systems no longer show similar behavior in terms of SDT. Overall, SDT increases with an increasing flow ratio, indicating aggravated temperature non-uniformity among individual cells. However, no clear dependence of SDT on the volumetric flow rate is observed. In the direct cooling system, when the flow ratio is between 10% and 70%, SDT remains nearly constant at approximately 0.03 °C. This is attributed to the high heat transfer efficiency of evaporative phase change cooling. In this range, the average temperature of each cell is mainly governed by the cooling capacity of the lower cooling plate. When sufficient flow is supplied to the lower plate, its cooling performance becomes relatively insensitive to the flow distribution ratio.
It is noteworthy that when the flow ratio increases to 90%, the SDT of both the direct cooling and indirect cooling systems rises to 0.09 °C. This is because the flow rate in the lower cooling plate becomes very low, making it difficult to maintain temperature balance among individual cells. As the flow path length increases, the coolant temperature in the lower cooling plate gradually rises. The cooling performance in the downstream region is weakened, which leads to degraded overall temperature uniformity. Therefore, under the extreme flow distribution condition of a flow ratio of 90%, increasing the total flow rate is beneficial for improving temperature uniformity.
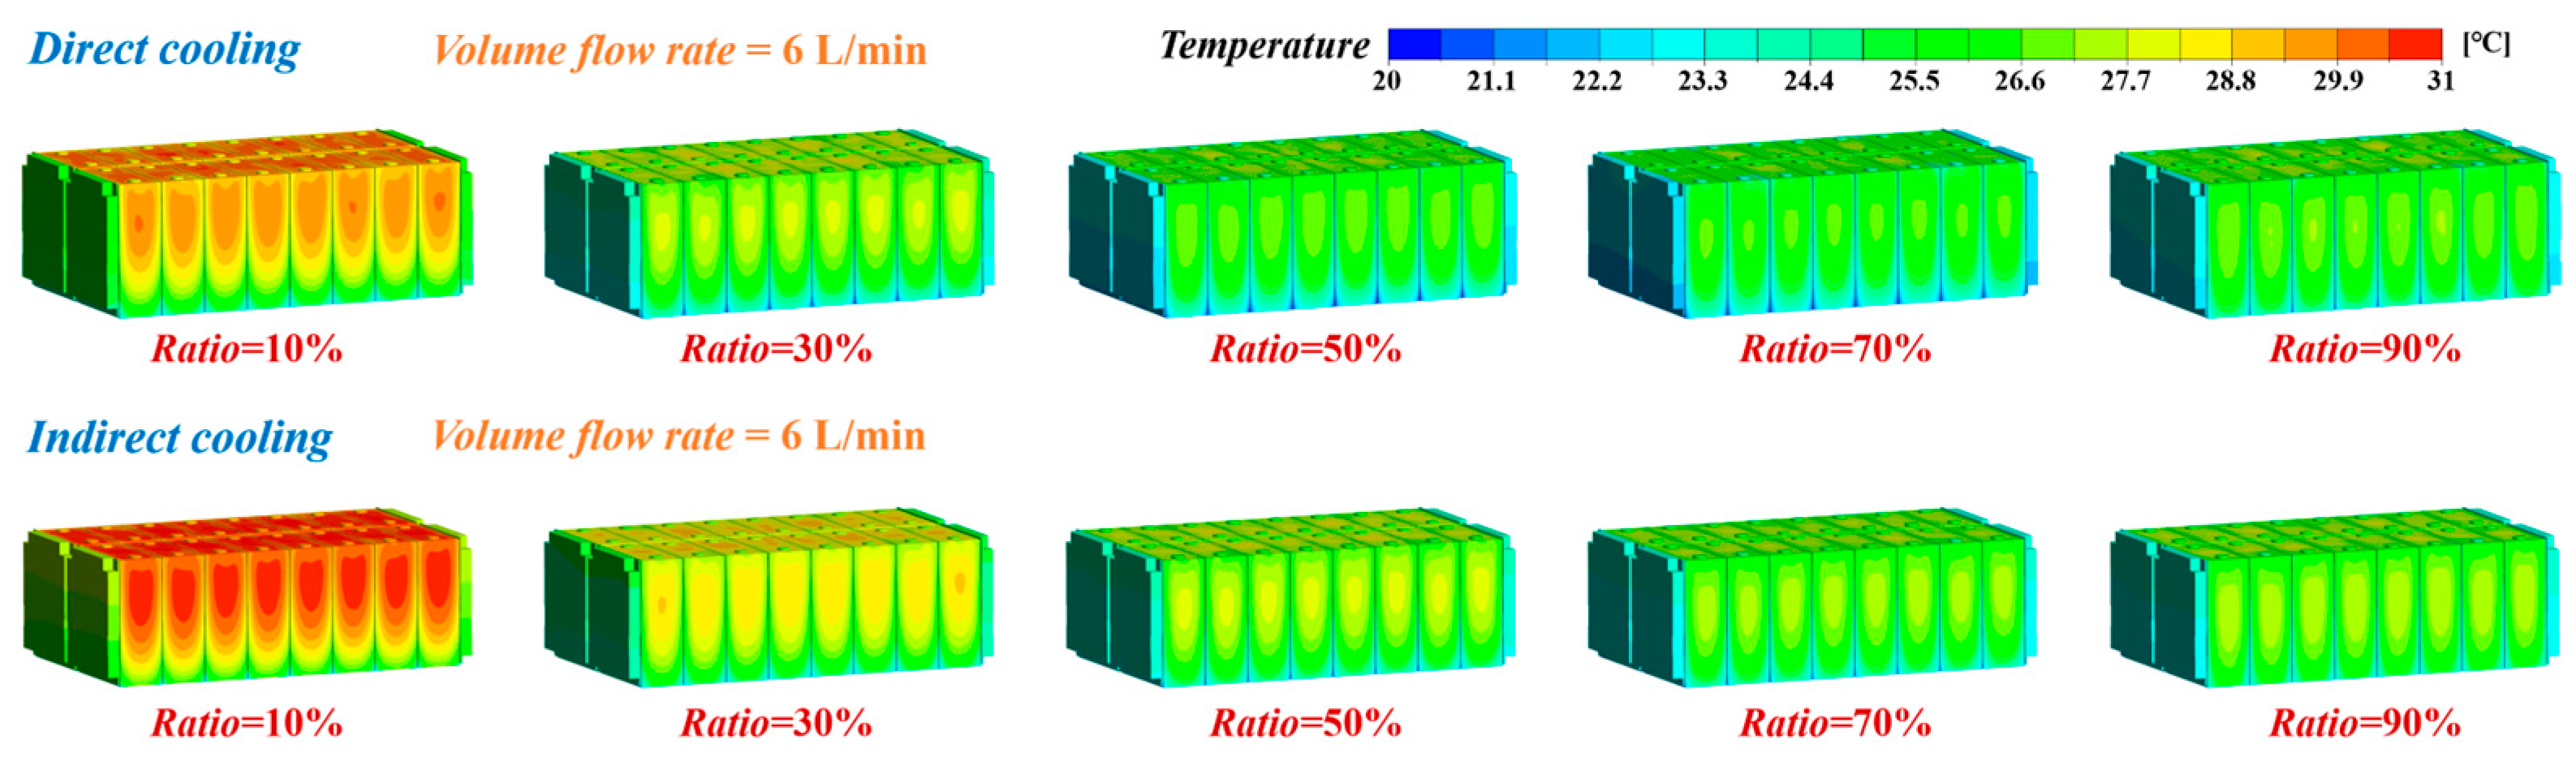
To better compare the thermal management performance of direct cooling and indirect cooling, Figure 12 shows the temperature contour distributions under different flow ratios at a flow rate of 6 L⋅min−1. Overall, the temperature in the upper half of the battery is higher than that in the lower half. This temperature non-uniformity is slightly reduced at higher flow ratios, and the high-temperature regions become more concentrated in the middle of the battery.
For the direct cooling system, as the flow ratio increases from 10% to 70%, the high-temperature regions in the temperature contours gradually decrease. In the range of 10% to 30%, the overall temperature decreases significantly. From 30% to 70%, the high-temperature region further shrinks, and the longitudinal temperature difference within individual cells is also reduced. When the flow ratio increases to 90%, the high-temperature region expands again, and its location shifts from the upper region to the middle region. This is because the flow rate in the lower direct cooling plate becomes too low. At the same time, the main solid heat dissipation path relies on cooling through the lower plate, so the overall cooling performance deteriorates. Although the increased flow rate in the upper direct cooling plate enhances natural convection in the immersion fluid, the additional heat dissipation is not sufficient to compensate for the loss of cooling capacity in the lower plate.
Further comparison of direct cooling and indirect cooling shows that the direct cooling system achieves better temperature control performance. Both systems exhibit similar trends with a varying flow ratio, and their high-temperature distributions are also comparable. The main difference between the two systems is that direct cooling provides a higher overall cooling capacity.
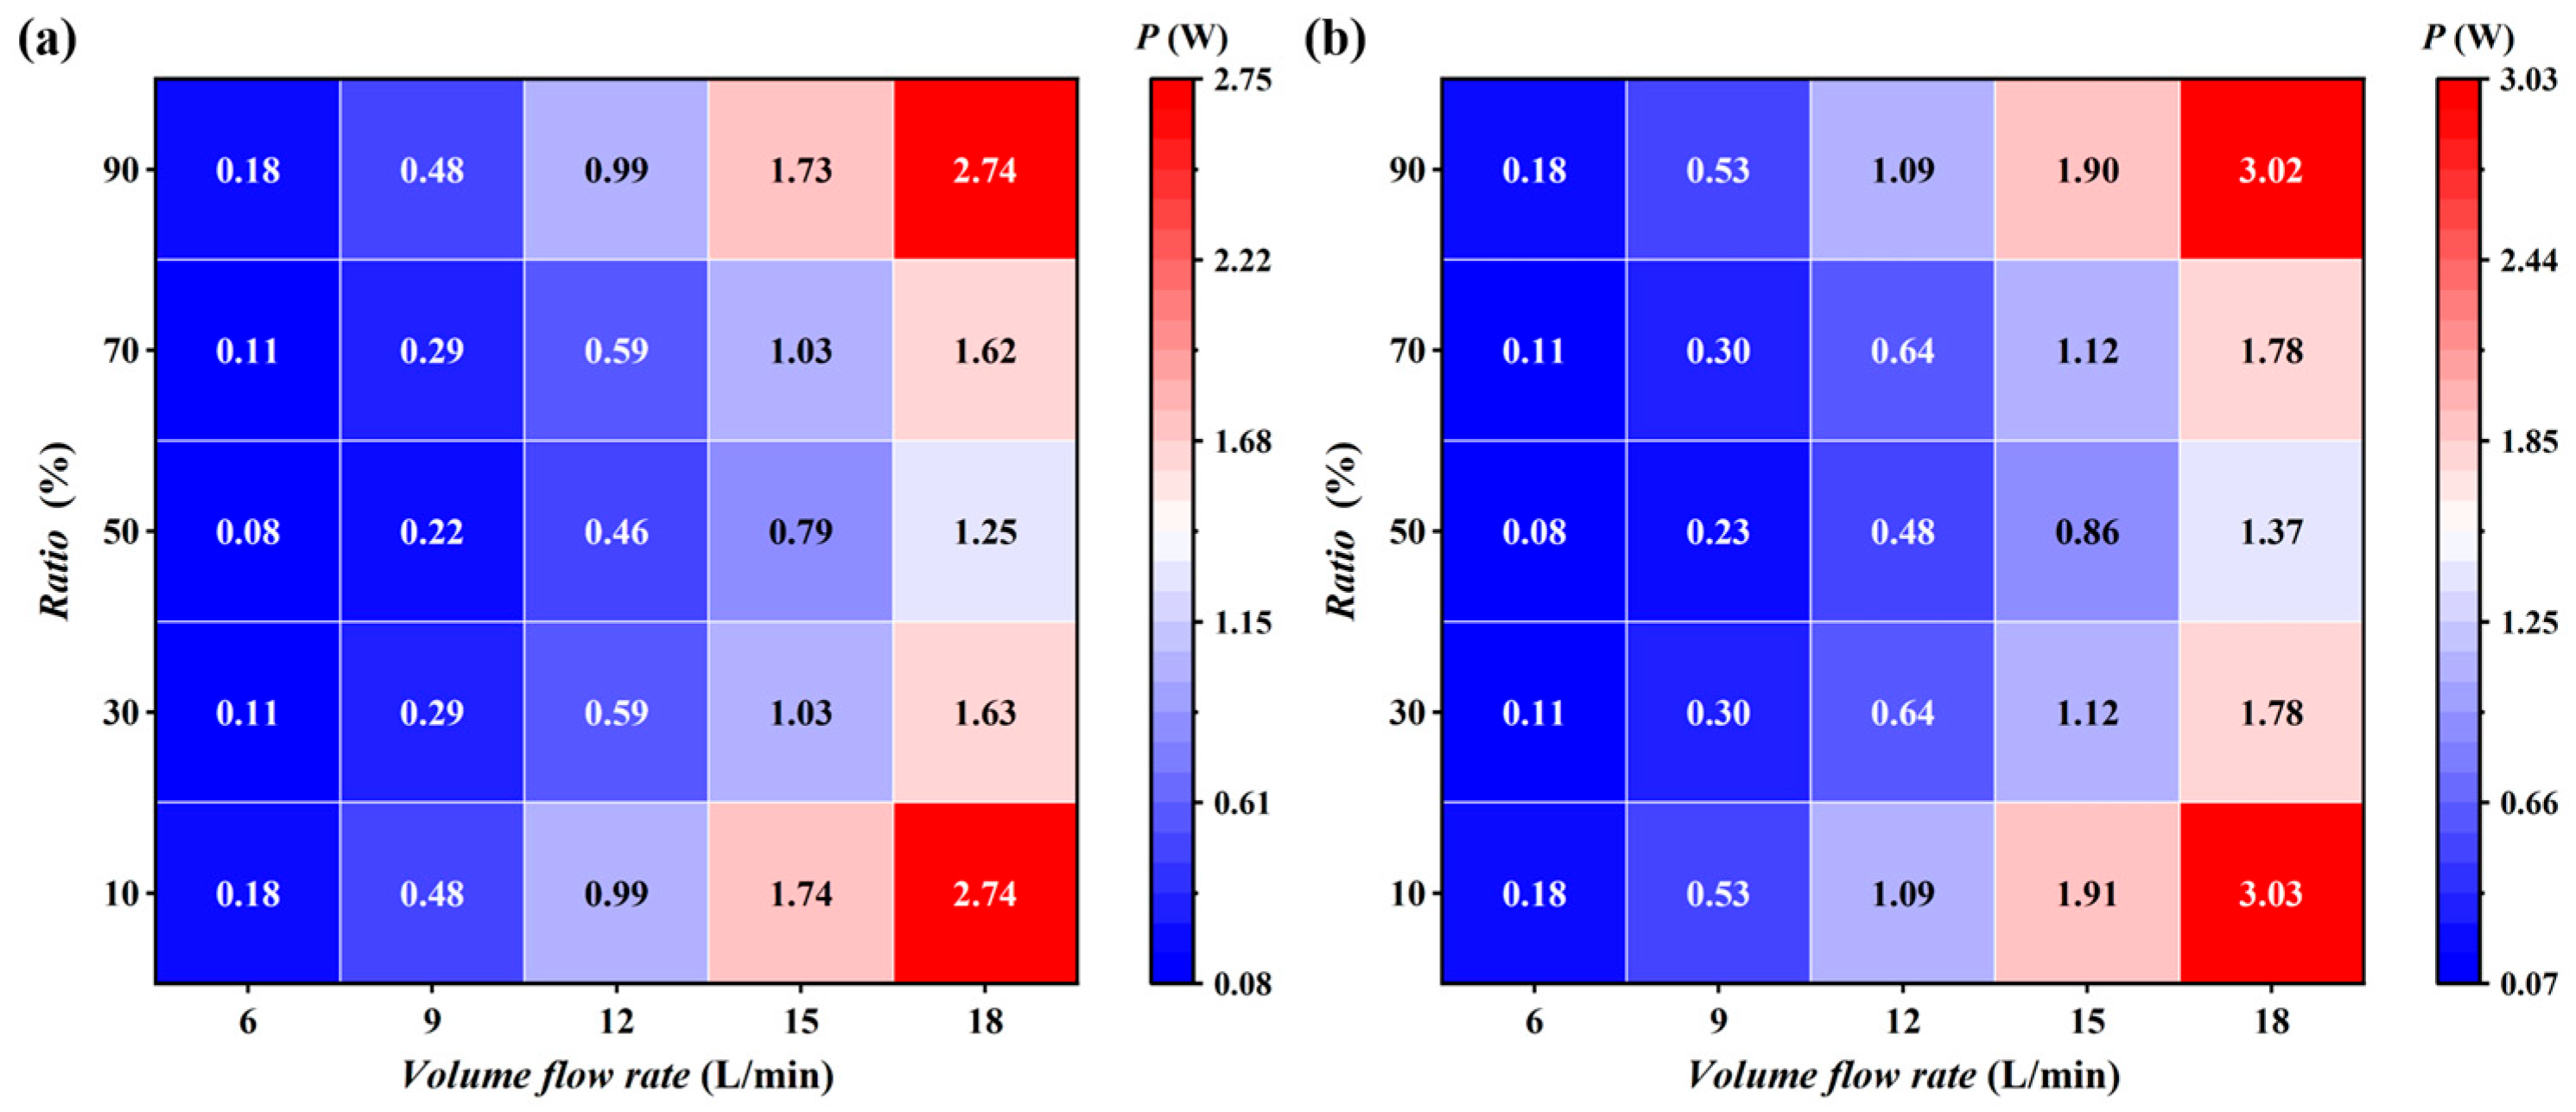
In practical engineering applications, the power consumption of BTMSs is also an important consideration. Figure 13 shows the hydraulic power consumption (P) of the direct cooling and indirect cooling systems. It should be noted that P only represents the hydraulic power associated with coolant transport through the cooling plates. For the R134a direct cooling system, the compressor work and the power consumption of other refrigeration-cycle components are not included in the present model. Therefore, P should not be interpreted as the total energy consumption of the complete refrigeration system. The corresponding expression is given as follows:
P = Q i n × Δ P η
where Qin is the inlet flow rate, ∆P is the hydraulic system pressure drop, and η is the pump efficiency, which is set to 70% in this study.
According to the equation, the power consumption P is proportional to the product of pressure drop ∆P and the volumetric flow rate. Therefore, as the flow rate increases, P increases faster than ∆P alone. As shown in Figure 13, at a flow ratio of 50%, P increases from 0.08 W to 1.25 W, corresponding to an overall increase of 1460%. Although a higher flow rate reduces the average temperature, the sharp increase in P negatively affects the economic feasibility of practical applications. In addition, flow maldistribution significantly increases power consumption. Under a flow rate of 18 L⋅min−1 in the direct cooling system, P at a flow ratio of 90% is 2.2 times that at 50%. This is an important factor that should be considered in further studies.
In comparison, the value of P of direct cooling and indirect cooling is similar only under low flow rate conditions. As the flow rate increases, the direct cooling system exhibits a lower P, and the difference between the two systems becomes more pronounced at higher flow rates. This trend is consistent with the ∆P results and can also be directly inferred from the governing equation.

3.1.3. Comprehensive Performance Comparison

Although the preceding analysis compares the direct cooling and indirect cooling systems using individual performance indicators, the overall performance of the BTMS cannot be fully evaluated by a single metric. Therefore, a weighted TOPSIS method based on engineering preference was further introduced to comprehensively evaluate all operating conditions [39].
Five indicators were selected for the comprehensive evaluation, including the average battery temperature Tave, maximum battery temperature difference ∆T, maximum tab temperature difference ∆Ttab, standard deviation of cell temperature SDT, and pump power consumption P. These indicators represent the overall cooling capacity, local temperature difference, tab temperature consistency, cell-to-cell temperature uniformity, and energy consumption of the system, respectively.
All selected indicators were treated as cost-type indicators, meaning that smaller values indicate better performance. Therefore, the original data were first transformed into dimensionless benefit-type values,
z i j = x j max x i j x j max x j min
where x i j is the original value of the j-th indicator under the i-th operating condition; and x j max and x j min are the maximum and minimum values of the j-th indicator among all operating conditions, respectively.
Considering the engineering design objectives of the proposed BTMS, the weight vector was defined as
w = [ 0.30 , 0.10 , 0.10 , 0.20 , 0.30 ]
corresponding to Tave, ∆T, ∆Ttab, SDT and P, respectively. In this weighting scheme, Tave and P were assigned the highest weights of 0.30. The average battery temperature Tave directly reflects the overall cooling capability of the BTMS and is closely related to the thermal safety of the battery module. The pump power consumption P represents the energy consumption of the cooling system and is an important indicator of system efficiency and engineering applicability. Therefore, these two indicators were regarded as the primary objectives in the comprehensive evaluation.
The standard deviation of cell temperature SDT was assigned a weight of 0.20 because it describes the cell-to-cell temperature uniformity of the entire battery module and provides a global measure of thermal balance. By contrast, ∆T and ∆Ttab were assigned relatively lower weights of 0.10 each. These two indicators are more sensitive to local temperature fluctuations, local overcooling, and the spatial distribution of monitoring points. Therefore, they were retained as local temperature-uniformity constraints rather than dominant evaluation objectives. Overall, this weighting strategy emphasized overall cooling performance and energy efficiency, while also considering both global and local temperature uniformity.
After normalization, the normalized matrix was weighted according to the engineering weight vector. The positive and negative ideal solutions were then determined as
v j + = max ( v i j )
v j = min ( v i j )
where v i j is the weighted normalized value of the j-th indicator under the i-th operating condition. The Euclidean distances from each operating condition to the positive and negative ideal solutions were calculated as
D i + = j = 1 m ( v j + v i j ) 2
D i = j = 1 m ( v j v i j ) 2
Finally, the TOPSIS closeness coefficient was obtained as
S i = D i D i + D i +
where S i represents the comprehensive evaluation score of the i-th operating condition. A larger S i indicates that the corresponding operating condition is closer to the positive ideal solution and has better comprehensive performance.
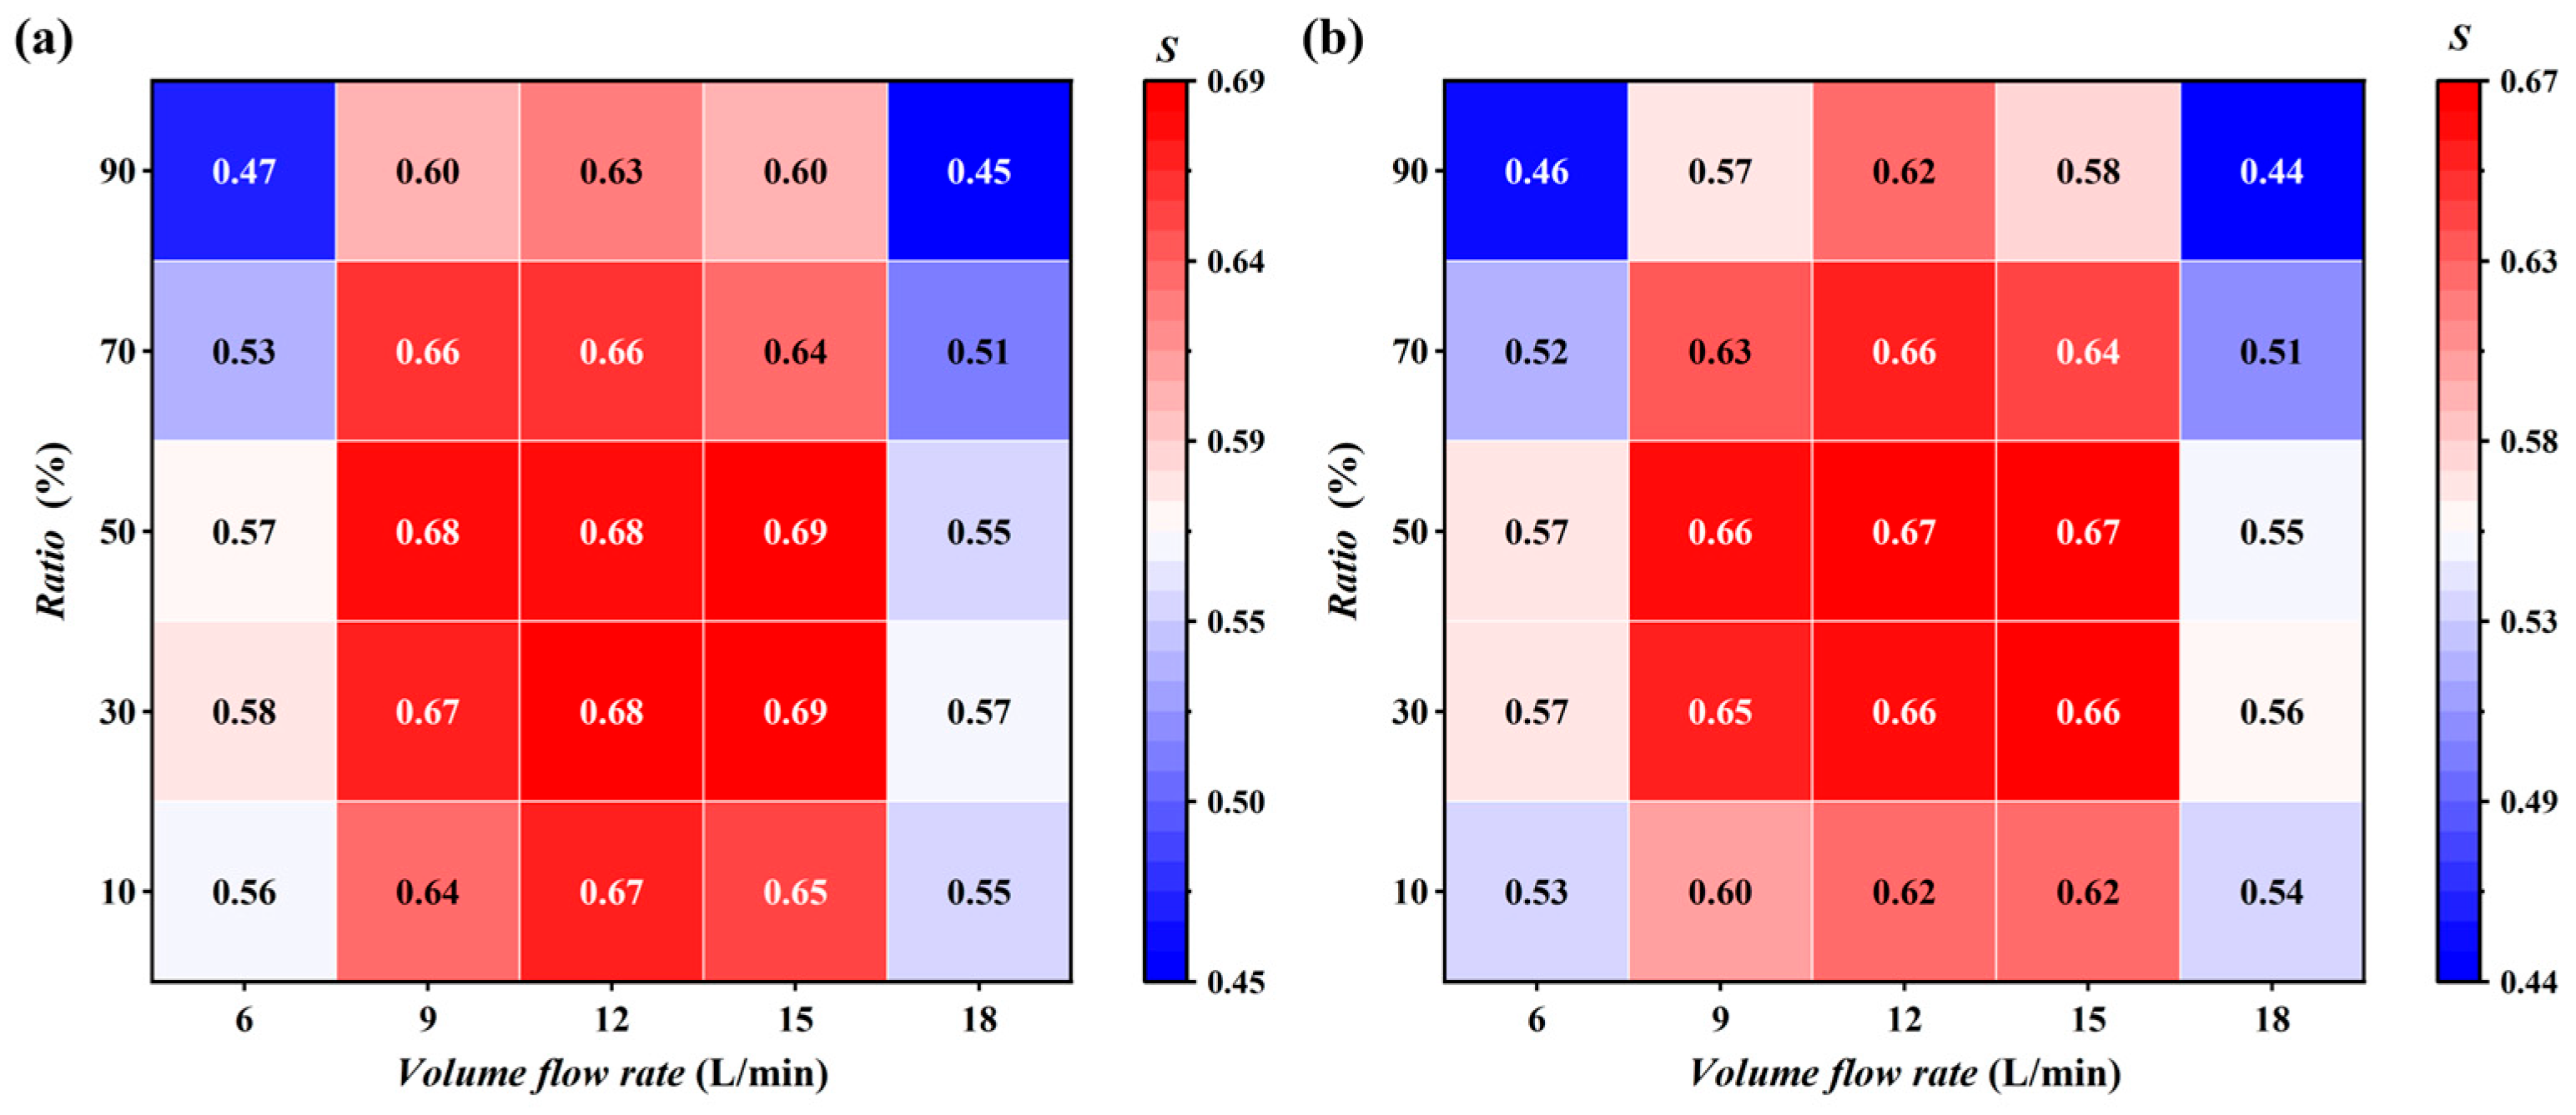
Figure 14 presents the engineering-weighted TOPSIS comprehensive scores S of the direct cooling and indirect cooling systems under different total flow rates and upper cooling plate flow ratios. A higher score indicates a better comprehensive performance in terms of overall cooling capacity, temperature uniformity, and pump power consumption.
For both cooling systems, the comprehensive score first increases and then decreases with an increasing flow rate. At low flow rates, the cooling capacity is insufficient, resulting in relatively low comprehensive scores. When the flow rate increases to a moderate range, the battery temperature is effectively reduced while the pump power consumption remains acceptable, leading to improved overall performance. However, when the flow rate further increases to 18 L⋅min−1, the pump power consumption rises significantly, which weakens the comprehensive advantage of high-flow-rate operation.
The flow ratio also has a significant influence on the comprehensive performance. Extremely low or high upper cooling plate flow ratios lead to lower scores, indicating that an unbalanced flow distribution is not beneficial for the overall thermal management performance. When the flow ratio is in the range of 30–50%, both systems generally exhibit higher comprehensive scores, suggesting that a relatively balanced flow distribution between the upper and lower cooling plates can better coordinate direct heat removal and immersion fluid convection.
Compared with the indirect cooling system, the direct cooling system achieves a slightly higher maximum comprehensive score. The highest score of the direct cooling system reaches 0.69 at a flow rate of 15 L⋅min−1 and a flow ratio of 50%, while the indirect cooling system reaches a maximum score of 0.67 under similar moderate-flow and balanced-distribution conditions. This indicates that, under the engineering-weighted evaluation strategy, the direct cooling system has a slight advantage in comprehensive performance, mainly due to its lower average battery temperature and favorable pump power consumption. Overall, the results show that moderate flow rates and balanced flow distribution are more suitable for improving the comprehensive performance of the proposed hybrid BTMS.
The above TOPSIS analysis provides an overall comparison of the direct and indirect cooling systems under discrete operating conditions. The results indicate that the comprehensive performance is jointly governed by the total flow rate and the flow distribution ratio, and that the direct cooling system can achieve slightly better overall performance under a moderate flow rate and balanced flow distribution conditions. However, the TOPSIS results are still limited to the simulated operating points and cannot directly provide a continuous optimal solution within the whole design space. Therefore, to further identify the optimal flow control parameters and achieve a better balance among the cooling performance, temperature uniformity, and energy consumption, a surrogate-model-based multi-objective optimization is conducted in the following section.

3.2. Optimization of Flow Control Parameters in Direct Cooling Systems

To obtain the optimal operating condition, this study selects Tave, ∆T, SDT, and P as optimization objectives and applies a multi-objective genetic algorithm (MOGA) to perform multi-objective optimization of the immersion-based direct cooling BTMS.
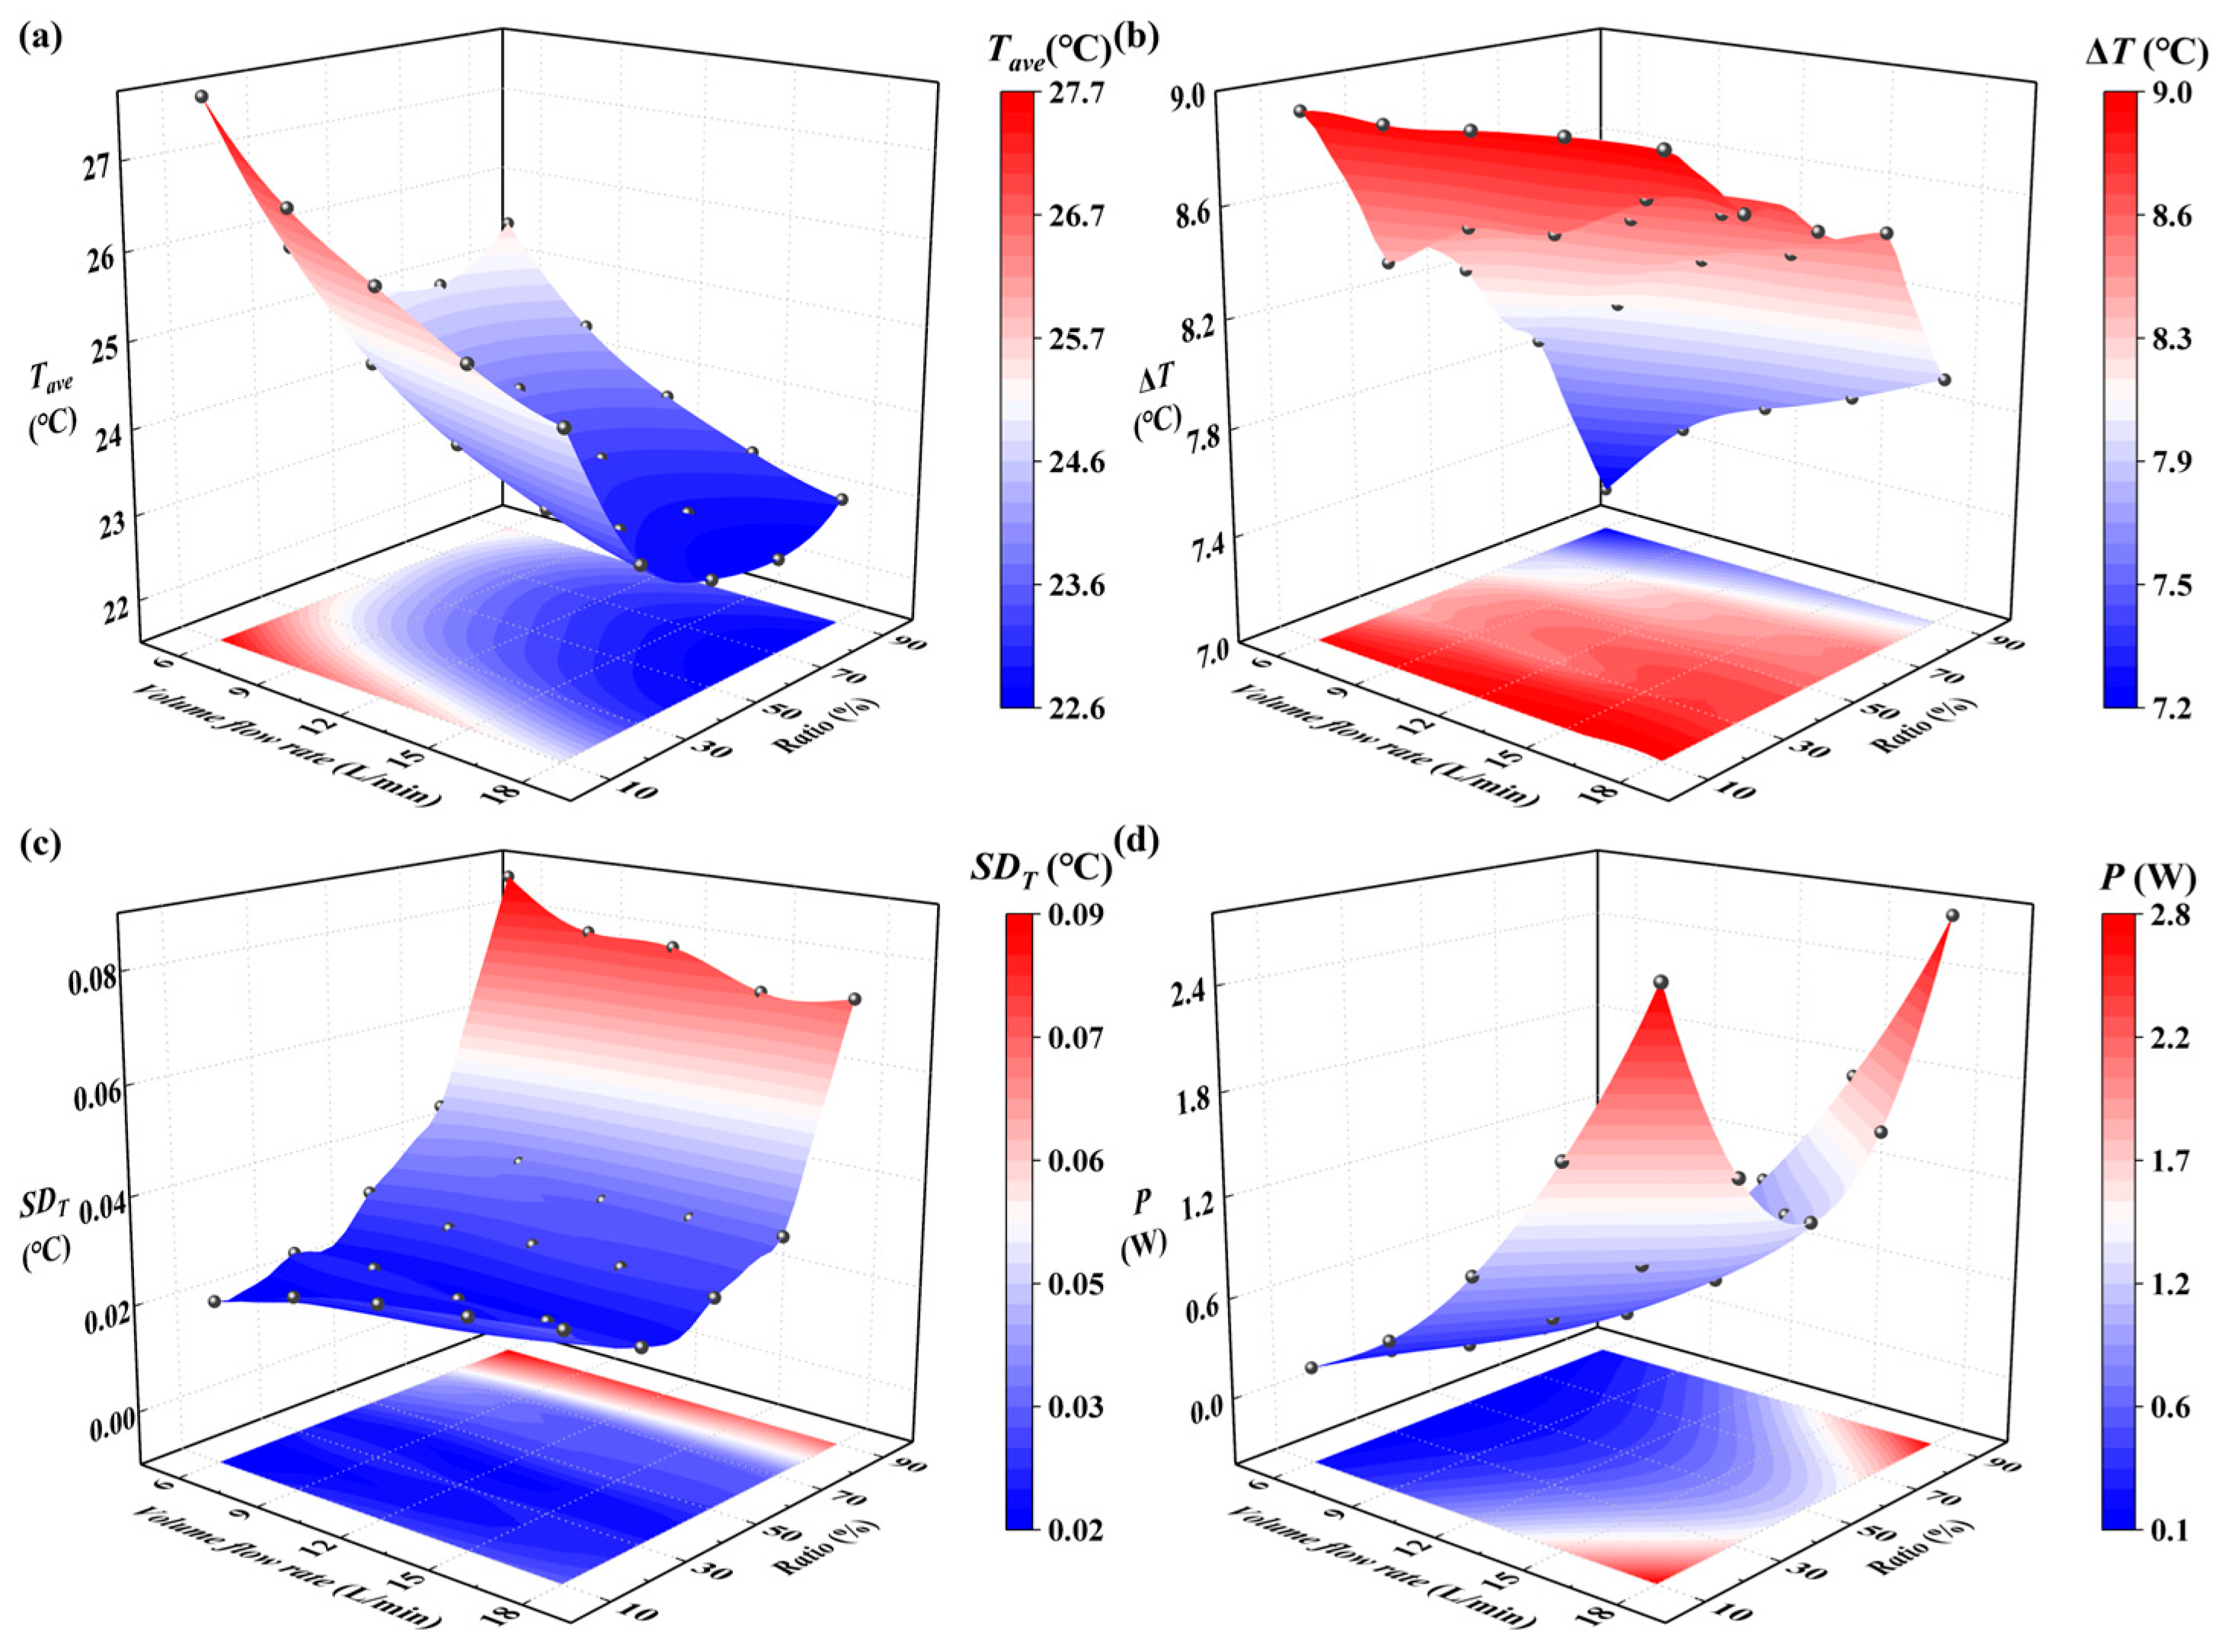
A direct multi-objective optimization using Fluent simulations would result in an excessive computational cost. Therefore, a Kriging-based response surface model is constructed using the available simulation data, as shown in Figure 15. This approach provides accurate surrogate representations of all simulation results and enables efficient multi-objective optimization. The fitted response surfaces are consistent with the simulation data and capture detailed variation trends for each objective.
First, Tave is jointly affected by the total flow rate and the upper plate flow ratio. At a fixed flow ratio, Tave decreases as the total flow rate increases, although the magnitude of the reduction gradually diminishes at higher flow rates. At a fixed total flow rate, increasing the upper plate flow ratio from 10% to approximately 50–70% reduces Tave. However, a further increase in the flow ratio causes Tave to rise. This non-monotonic behavior indicates that an excessively high upper plate flow ratio substantially reduces the flow supplied to the lower cooling plate and weakens its direct heat removal capability. Although the increased upper plate flow enhances the natural convection in the immersion coolant, this additional cooling effect is insufficient to compensate for the deterioration in the lower plate cooling performance.
Second, ∆T is influenced differently by the two operating parameters. At a fixed upper plate flow ratio, ∆T generally increases with an increasing total flow rate because stronger local cooling further decreases the minimum battery surface temperature, whereas the reduction in the maximum temperature is comparatively limited. In contrast, at a fixed total flow rate, ∆T decreases as the upper plate flow ratio increases. A larger upper plate flow ratio enhances cooling in the upper region of the immersion chamber and strengthens buoyancy-driven circulation, thereby alleviating the vertical temperature gradient within the battery module. Consequently, ∆T reaches a relatively low value of 7.16 °C at a total flow rate of 6 L⋅min−1 and an upper plate flow ratio of 90%.
The variation in SDT differs from that of ∆T because the two indicators characterize different aspects of temperature uniformity. Over a flow ratio range of 10–70% in the upper plate, SDT remains relatively stable at approximately 0.03 °C and exhibits no clear monotonic dependence on the total flow rate. However, when the upper plate flow ratio approaches 90%, the substantially reduced flow through the lower cooling plate causes the cell-to-cell temperature non-uniformity to increase markedly. Under low-flow conditions, SDT reaches a maximum of approximately 0.087 °C. In this high-ratio region, increasing the total flow rate can partially restore the cooling capacity of the lower plate and thereby reduce SDT.
Finally, P exhibits a clear monotonic dependence on both the total flow rate and the degree of flow maldistribution. The pumping power increases substantially with an increasing total flow rate and becomes particularly high when the flow distribution between the upper and lower cooling plates is strongly unbalanced. Conversely, reducing the total flow rate and adopting a more balanced flow distribution effectively decreases the pumping power.
To further evaluate the predictive accuracy of the Kriging surrogate models over the entire design space, ten additional validation points are selected across the ranges of total flow rate and upper plate flow ratio. Full numerical simulations are performed at these points and compared with the corresponding Kriging predictions. The root-mean-square error (RMSE) is calculated as a quantitative accuracy indicator. The RMSE values of Tave, SDT, ∆T, and P are 0.029 °C, 0.00184 °C, 0.053 °C and 0.0184 W, respectively. These results indicate that the surrogate models provide satisfactory prediction accuracy throughout the investigated design space. The three candidate points near the optimum are further retained to verify the local prediction accuracy in the optimal region.
Due to the inherently conflicting nature of the four objectives, a MOGA is used to obtain Pareto optimal solutions. In ANSYS Workbench 2024 R2, the MOGA settings are defined as follows. The initial sample size is 200, the number of samples per iteration is 200, and the maximum number of iterations is 30. The input variables are the flow rate and flow ratio, with ranges of 6 to 18 L⋅min−1 and 10% to 90%, respectively. The output variables are Tave, SDT, ∆T, and P. All objectives are set to minimization, with target reference values of 24 °C for Tave, 0.03 °C for SDT, 8 °C for ∆T, and 0 W for P. Three candidate optimal solutions are obtained, as listed in Table 4. They correspond to flow rate and flow ratio combinations of 8.76 L⋅min−1 and 56.17%, 8.81 L⋅min−1 and 56.26%, and 8.82 L⋅min−1 and 56.45%.
To verify the validity of the optimization results, full numerical simulations are performed at these three candidate points. As shown in Table 4, the predicted values agree well with the simulation results. The maximum deviation occurs for SDT, reaching 3.2%, while all other objective parameters show deviations below 1%. This confirms the reliability of the model predictions.
Further, the optimal candidate, point 3, obtained from the optimization (flow rate = 8.82 L⋅min−1; flow ratio = 56.45%) is compared with the baseline operating condition (flow rate = 9 L⋅min−1; flow ratio = 10%). The baseline condition of 9 L⋅min−1 and a 10% upper plate flow ratio represents the initial intentionally unbalanced flow distribution condition used to quantify the effectiveness of the proposed flow regulation strategy. As shown in Table 5, the optimized condition outperforms the baseline in terms of Tave, ∆T, and P, with reductions of 10.1%, 7.2%, and 52.1%, respectively. However, the optimized condition exhibits a slightly higher SDT, with an increase of 23.1%.
It should be noted that, in the practical application of this direct cooling system, the absolute value of SDT remains extremely low. Although the relative increase appears significant in percentage terms, its absolute increment is very limited. Specifically, SDT increases from 0.026 °C to 0.032 °C after optimization, corresponding to an absolute increase of only 0.006 °C, which represents a slight trade-off in cell-to-cell temperature uniformity. Meanwhile, the optimization yields substantial improvements in Tave, ∆T, and P, which are more critical to system safety and operational performance. This result is consistent with the Pareto trade-off principle in multi-objective optimization. Under conflicting objective conditions, the MOGA prioritizes optimization of the initially weaker and more critical thermal management indicators, while accepting a slight deterioration in SDT, which is already at a favorable level.
Specifically, after optimization, the flow ratio increases from 10% to 56.45%. This enables the upper cooling plate to carry a larger thermal load and more effectively remove heat from the upper region of the immersion coolant. As a result, natural convection is strengthened, thereby reducing both the overall Tave and ∆T. Meanwhile, the more balanced flow distribution also contributes to a significant reduction in P. Overall, this optimization effectively improves the most critical performance parameters of the system and therefore demonstrates clear engineering significance.

4. Conclusions

This study proposes a hybrid BTMS integrating static immersion cooling with refrigerant-based direct cooling, together with a dual-plate flow regulation strategy. The thermo-fluid characteristics of R134a direct cooling and 50% ethylene glycol indirect cooling are numerically compared, and the operating parameters are further optimized using a Kriging surrogate model combined with MOGA. The main conclusions are as follows:
  • The proposed hybrid configuration integrates upper and lower direct cooling plates with a static immersion chamber. It combines the high heat removal capacity of refrigerant-based direct cooling with the ability of immersion cooling to improve temperature uniformity. Meanwhile, the sealed immersion chamber reduces the leakage risk associated with forced-convection immersion cooling.
  • Compared with the 50% ethylene glycol indirect cooling system, the R134a direct cooling system provides better overall thermal performance. It reduces the average battery temperature by approximately 0.5–1 °C and shows more favorable pressure-drop and pumping-power characteristics at high flow rates.
  • Increasing the total flow rate enhances heat removal, but the cooling benefit gradually weakens, while the pressure drop increases nonlinearly. At an upper plate flow ratio of 50%, increasing the flow rate from 6 to 18 L⋅min−1 reduces Tave from 25.14 to 22.73 °C, while ∆P increases from 2.32 to 11.16 kPa.
  • The upper plate flow ratio is a key factor affecting temperature uniformity and energy consumption. Increasing this ratio strengthens buoyancy-driven convection in the immersion chamber and alleviates vertical temperature non-uniformity. However, excessive flow redistribution reduces the lower plate’s cooling capacity, leading to degraded overall performance.
  • The optimal operating condition is obtained at a total flow rate of 8.82 L⋅min−1 and an upper plate flow ratio of 56.45%. Compared with the baseline condition of 9 L⋅min−1 total flow rate and a 10% upper plate flow ratio, Tave, ∆T, and P are reduced by 10.1%, 7.2%, and 52.1%, respectively, demonstrating the engineering potential of the proposed hybrid BTMS. Meanwhile, SDT increases slightly from 0.026 °C to 0.032 °C, indicating a minor trade-off in cell-to-cell temperature uniformity.
  • The present study adopts a constant 1P discharge condition as a representative baseline operating condition for evaluating the fundamental thermal management characteristics of the proposed hybrid system. Under higher C-rates or consecutive fast-charging cycles, the increased and time-varying battery heat generation may strengthen buoyancy-driven natural convection, but may also lead to more pronounced thermal stratification and heat accumulation if the increase in heat generation exceeds the passive heat removal capability of the immersion fluid. In addition, practical variable power profiles and dynamic driving cycles may further alter the coupled thermal–fluid behavior. Therefore, the present results should be regarded as a preliminary proof-of-concept under a representative operating condition, and future work will extend the investigation to higher-rate, fast-charging, and variable transient operating conditions.

Author Contributions

Conceptualization, Y.Z., Q.S., X.J. and X.Z.; Methodology, Y.Z., Z.Y., W.W., Q.S., Q.L., X.J., X.Z. and C.X.; Software, Y.Z. and Z.Y.; Validation, Z.L. and Y.Z.; Formal analysis, Z.Y., Q.S., X.Y., Q.L., X.J., X.Z. and C.X.; Resources, Z.L., Y.Z., W.W., X.J. and C.X.; Data curation, X.Y. and X.Z.; Writing—original draft, Y.Z.; Writing—review and editing, Z.L., Z.Y., W.W., Q.S., X.Y., Q.L., X.J., X.Z. and C.X.; Supervision, Z.L., W.W., X.Z. and C.X.; Project administration, X.Z. All authors have read and agreed to the published version of the manuscript.

Funding

This research was funded by the Key Laboratory of Electrochemical Energy Safety, Ministry of Emergency Management, grant number EES2025KF10.

Data Availability Statement

The original contributions presented in this study are included in the article. Further inquiries can be directed to the corresponding authors.

Conflicts of Interest

Authors Zhanwei Lian and Wei Wang are employed by XYZ Storage Technology Corp. The remaining authors declare that the research was conducted in the absence of any commercial or financial relationships that could be construed as a potential conflict of interest.

Abbreviations

The following abbreviations are used in this manuscript:
SymbolDescription
AFlow cross-sectional area
C1, C2Capacitances in ECM
CeEvaporation coefficient in Lee model
CcCondensation coefficient in Lee model
CpSpecific heat capacity
EkEnergy of phase k
FBody force
GTurbulent kinetic energy generation term
GrGrashof number
gGravitational acceleration
hfgLatent heat of vaporization
hj,kEnthalpy of species j in phase k
ICurrent
jj,kDiffusion flux of species j in phase k
kTurbulent kinetic energy
LCharacteristic length
m ˙ e Evaporation mass transfer rate
m ˙ c Condensation mass transfer rate
nNumber of cells
PHydraulic power consumption
PrPrandtl number
QHeat generation rate
QinInlet volumetric flow rate
QirIrreversible heat generation
QreReversible heat generation
QrefReference battery capacity
QtTotal heat generation rate of battery
qmMass flow rate
RaRayleigh number
ReReynolds number
RemMixture Reynolds number
R1, R2, RsOhmic internal resistances in ECM
RatioFlow rate ratio of upper cooling plate
SbBuoyancy source term
SiTOPSIS closeness coefficient
SUser-defined source term
SDTStandard deviation of battery temperature
SOCState of charge
TTemperature
TaveAverage battery temperature
TiAverage temperature of cell i
TlLiquid-phase temperature
TsatSaturation temperature
TvVapor-phase temperature
UTerminal voltage
UOCVOpen-circuit voltage
VbBattery volume
vVelocity
vmMass-averaged velocity
vkVelocity of phase k
vdr,kDrift velocity of secondary phase k
YTurbulence dissipation term
Greek
α k Volume fraction of phase k
α l Liquid-phase volume fraction
α v Vapor-phase volume fraction
β Thermal expansion coefficient
Γ Effective diffusion coefficient
PTotal pressure drop
TMaximum temperature difference on battery surfaces
TtabMaximum temperature difference among measurement points
ηPump efficiency
λThermal conductivity
λ e f f Effective thermal conductivity
λ t Thermal conductivity
μDynamic viscosity
ρ Density
ρ 0 Density at reference temperature
ρ k Density of phase k
ρ l Liquid-phase density
ρ m Mixture density
ρ v Vapor-phase density
τ e f f Effective stress tensor
ωSpecific dissipation rate
Subscripts
aveAverage value
bBattery
cCondensation
drDrift
eEvaporation
effEffective
fgVaporization
iCell index or operating-condition index
inInlet
irIrreversible
jSpecies or indicator index
kPhase index
lLiquid phase
mMixture
maxMaximum value
minMinimum value
OCVOpen-circuit voltage
reReversible
refReference
sSolid
satSaturation
tabPositive terminal tab
vVapor phase
0Reference state
Abbreviations
BESSBattery Energy Storage System
BTMSBattery Thermal Management System
ECMEquivalent Circuit Model
HPPCHybrid Pulse Power Characterization
MOGAMulti-Objective Genetic Algorithm
SSTShear Stress Transport
TOPSISTechnique for Order Preference by Similarity to Ideal Solution
UDFUser-Defined Function

References

  1. Schuller, A.; Flath, C.M.; Gottwalt, S. Quantifying Load Flexibility of Electric Vehicles for Renewable Energy Integration. Appl. Energy 2015, 151, 335–344. [Google Scholar] [CrossRef] [Scilit]
  2. Yong, J.Y.; Ramachandaramurthy, V.K.; Tan, K.M.; Mithulananthan, N. A Review on the State-of-the-Art Technologies of Electric Vehicle, Its Impacts and Prospects. Renew. Sust. Energ. Rev. 2015, 49, 365–385. [Google Scholar] [CrossRef] [Scilit]
  3. Zhang, C.; Wei, Y.-L.; Cao, P.-F.; Lin, M.-C. Energy Storage System: Current Studies on Batteries and Power Condition System. Renew. Sust. Energ. Rev. 2018, 82, 3091–3106. [Google Scholar] [CrossRef] [Scilit]
  4. Jia, Z.; Jin, K.; Mei, W.; Qin, P.; Sun, J.; Wang, Q. Advances and Perspectives in Fire Safety of Lithium-Ion Battery Energy Storage Systems. eTransportation 2025, 24, 100390. [Google Scholar] [CrossRef] [Scilit]
  5. Ma, S.; Jiang, M.; Tao, P.; Song, C.; Wu, J.; Wang, J.; Deng, T.; Shang, W. Temperature Effect and Thermal Impact in Lithium-Ion Batteries: A Review. Prog. Nat. Sci. 2018, 28, 653–666. [Google Scholar] [CrossRef] [Scilit]
  6. Zhang, X.; Li, Z.; Luo, L.; Fan, Y.; Du, Z. A Review on Thermal Management of Lithium-Ion Batteries for Electric Vehicles. Energy 2022, 238, 121652. [Google Scholar] [CrossRef] [Scilit]
  7. Saw, L.H.; Poon, H.M.; Thiam, H.S.; Cai, Z.; Chong, W.T.; Pambudi, N.A.; King, Y.J. Novel Thermal Management System Using Mist Cooling for Lithium-Ion Battery Packs. Appl. Energy 2018, 223, 146–158. [Google Scholar] [CrossRef] [Scilit]
  8. Kim, J.; Oh, J.; Lee, H. Review on Battery Thermal Management System for Electric Vehicles. Appl. Therm. Eng. 2019, 149, 192–212. [Google Scholar] [CrossRef] [Scilit]
  9. Wang, Y.; Zhang, X.; Chen, Z. Low Temperature Preheating Techniques for Lithium-Ion Batteries: Recent Advances and Future Challenges. Appl. Energy 2022, 313, 118832. [Google Scholar] [CrossRef] [Scilit]
  10. Xu, J.; Lan, C.; Qiao, Y.; Ma, Y. Prevent Thermal Runaway of Lithium-Ion Batteries with Minichannel Cooling. Appl. Therm. Eng. 2017, 110, 883–890. [Google Scholar] [CrossRef] [Scilit]
  11. Gharehghani, A.; Rabiei, M.; Mehranfar, S.; Saeedipour, S.; Mahmoudzadeh Andwari, A.; García, A.; Reche, C.M. Progress in Battery Thermal Management Systems Technologies for Electric Vehicles. Renew. Sustain. Energy Rev. 2024, 202, 114654. [Google Scholar] [CrossRef] [Scilit]
  12. Wu, W.; Wang, S.; Wu, W.; Chen, K.; Hong, S.; Lai, Y. A Critical Review of Battery Thermal Performance and Liquid Based Battery Thermal Management. Energy Conv. Manag. 2019, 182, 262–281. [Google Scholar] [CrossRef] [Scilit]
  13. Suresh, C.; Awasthi, A.; Kumar, B.; Im, S.; Jeon, Y. Advances in Battery Thermal Management for Electric Vehicles: A Comprehensive Review of Hybrid PCM-Metal Foam and Immersion Cooling Technologies. Renew. Sust. Energ. Rev. 2025, 208, 115021. [Google Scholar] [CrossRef] [Scilit]
  14. Jaguemont, J.; Omar, N.; Van den Bossche, P.; Mierlo, J. Phase-Change Materials (PCM) for Automotive Applications: A Review. Appl. Therm. Eng. 2018, 132, 308–320. [Google Scholar] [CrossRef] [Scilit]
  15. E, J.; Yue, M.; Chen, J.; Zhu, H.; Deng, Y.; Zhu, Y.; Zhang, F.; Wen, M.; Zhang, B.; Kang, S. Effects of the Different Air Cooling Strategies on Cooling Performance of a Lithium-Ion Battery Module with Baffle. Appl. Therm. Eng. 2018, 144, 231–241. [Google Scholar] [CrossRef] [Scilit]
  16. Zhao, Y.; Zou, B.; Zhang, T.; Jiang, Z.; Ding, J.; Ding, Y. A Comprehensive Review of Composite Phase Change Material Based Thermal Management System for Lithium-Ion Batteries. Renew. Sust. Energ. Rev. 2022, 167, 112667. [Google Scholar] [CrossRef] [Scilit]
  17. Wu, C.; Sun, Y.; Tang, H.; Zhang, S.; Yuan, W.; Zhu, L.; Tang, Y. A Review on the Liquid Cooling Thermal Management System of Lithium-Ion Batteries. Appl. Energy 2024, 375, 124173. [Google Scholar] [CrossRef] [Scilit]
  18. Zhao, G.; Wang, X.; Negnevitsky, M.; Li, C. An Up-to-Date Review on the Design Improvement and Optimization of the Liquid-Cooling Battery Thermal Management System for Electric Vehicles. Appl. Therm. Eng. 2023, 219, 119626. [Google Scholar] [CrossRef] [Scilit]
  19. Deng, Y.; Feng, C.; E, J.; Zhu, H.; Chen, J.; Wen, M.; Yin, H. Effects of Different Coolants and Cooling Strategies on the Cooling Performance of the Power Lithium Ion Battery System: A Review. Appl. Therm. Eng. 2018, 142, 10–29. [Google Scholar] [CrossRef] [Scilit]
  20. Lian, Y.; Ling, H.; Song, G.; Gong, K.; Fan, C.; Wang, F.; He, B. Optimization and Thermal Performance Analysis of Direct Cooling Plates with Multi-Splitting-Merging Channels for Electric-Vehicle Battery Thermal Management. Int. J. Therm. Sci. 2025, 214, 109900. [Google Scholar] [CrossRef] [Scilit]
  21. Roe, C.; Feng, X.; White, G.; Li, R.; Wang, H.; Rui, X.; Li, C.; Zhang, F.; Null, V.; Parkes, M.; et al. Immersion Cooling for Lithium-Ion Batteries—A Review. J. Power Sources 2022, 525, 231094. [Google Scholar] [CrossRef] [Scilit]
  22. Chandrasekaran, M.; Jithin, K.; Soundarya, T.; Rajesh, P.K. Comprehensive Experimental Study of Battery Thermal Management Using Single-Phase Liquid Immersion Cooling. J. Energy Storage 2025, 111, 115445. [Google Scholar] [CrossRef] [Scilit]
  23. Rokonuzzaman, A.S.M.; Erdem, K.; Sahin, B.; Ozdemir, M.R. Experimental Study of a Single-Phase Immersion Cooling System with Natural and Forced Convection. Int. J. Therm. Sci. 2025, 214, 109868. [Google Scholar] [CrossRef] [Scilit]
  24. Liu, Q.; Liu, Y.; Zhang, M.; Wang, S.; Li, W.; Zhu, X.; Ju, X.; Xu, C.; Wei, B. Comprehensive Investigation of the Electro-Thermal Performance and Heat Transfer Mechanism of Battery System under Forced Flow Immersion Cooling. Energy 2024, 298, 131404. [Google Scholar] [CrossRef] [Scilit]
  25. Zhang, C.; Wang, H.; Huang, Y.; Zhang, L.; Chen, Y. Immersion Liquid Cooling for Electronics: Materials, Systems, Applications and Prospects. Renew. Sust. Energ. Rev. 2025, 208, 114989. [Google Scholar] [CrossRef] [Scilit]
  26. Liu, Y.; Aldan, G.; Huang, X.; Hao, M. Single-Phase Static Immersion Cooling for Cylindrical Lithium-Ion Battery Module. Appl. Therm. Eng. 2023, 233, 121184. [Google Scholar] [CrossRef] [Scilit]
  27. Huang, Y.; Ge, J.; Chen, Y.; Zhang, C. Natural and Forced Convection Heat Transfer Characteristics of Single-Phase Immersion Cooling Systems for Data Centers. Int. J. Heat Mass Transf. 2023, 207, 124023. [Google Scholar] [CrossRef] [Scilit]
  28. Xu, Q.; Xie, Y.; Huang, H.; Lin, X.-M.; Li, L.; Wang, X.; Zheng, K. Parametric Studies and Design Recommendations for a Novel Hybrid Battery Thermal Management System with Ultrathin PCM Layers between Liquid Cooling Channels and Batteries. Energy 2025, 337, 138622. [Google Scholar] [CrossRef] [Scilit]
  29. Luo, D.; Wu, Z.; Zhang, Z.; Chen, H.; Geng, L.; Ji, Z.; Zhang, W.; Zhang, P. Transient Thermal Analysis of a Thermoelectric-Based Battery Thermal Management System at High Temperatures. Energy 2025, 318, 134833. [Google Scholar] [CrossRef] [Scilit]
  30. Luo, D.; Wu, Z.; Jiang, L.; Yan, Y.; Chen, W.-H.; Cao, J.; Cao, B. Realizing Rapid Cooling and Latent Heat Recovery in the Thermoelectric-Based Battery Thermal Management System at High Temperatures. Appl. Energy 2024, 370, 123642. [Google Scholar] [CrossRef] [Scilit]
  31. Hu, H.; Xu, J.; Li, J.; Xi, H. Immersion Coupled Direct Cooling with Non-Uniform Cooling Pipes for Efficient Lithium-Ion Battery Thermal Management. J. Energy Storage 2025, 116, 116010. [Google Scholar] [CrossRef] [Scilit]
  32. Zhang, Z.; Yao, X.; Zhang, J.; Zhu, X.; Xu, C.; Ju, X. Investigation of a Novel Passive Self-Adaptive Battery Thermal Regulator Combining Liquid Immersion and PCM. J. Energy Storage 2025, 120, 116356. [Google Scholar] [CrossRef] [Scilit]
  33. Tang, A.; Yang, J.; Yang, P.; Zhang, H.; Cai, T. Optimization and Working Performance Analysis of Liquid Cooling Plates in Refrigerant Direct Cooling Power Battery Systems. Int. J. Heat Mass Transf. 2024, 231, 125899. [Google Scholar] [CrossRef] [Scilit]
  34. Miao, Y.; Li, M.; Li, X.; Wang, J.; Qin, Z.; Tang, X. A Reconfigurable Dual-Core R290 Vehicular Thermal Management System Featuring a Variable Area Thermal Unit: Experimental Evaluation and Thermodynamic Analysis. Energy Convers. Manag. 2026, 357, 121452. [Google Scholar] [CrossRef] [Scilit]
  35. Wang, Z.; Yi, Q.; Xia, X.; Xiao, Z.; Zhang, K.; Huang, J.; Tan, B.; Xiao, Y. Drop-in Replacement of Low-GWP Working Fluid R1233zd(E) to R245fa for ORC-VCR Application. Energy 2025, 335, 138163. [Google Scholar] [CrossRef] [Scilit]
  36. Shen, Q.; Sun, D.; Su, S.; Zhang, N.; Jin, T. Development of Heat and Mass Transfer Model for Condensation. Int. Commun. Heat Mass Transf. 2017, 84, 35–40. [Google Scholar] [CrossRef] [Scilit]
  37. Shi, Q.; Liu, Q.; He, K.; Zhu, X.; Ju, X.; Xu, C. Optimization Study on the Immersion Flow Structure Design for High-Capacity Battery Module Using 4-Heat-Source Electro-Thermal Model. Appl. Therm. Eng. 2025, 262, 125226. [Google Scholar] [CrossRef] [Scilit]
  38. Yao, C.; Dan, D.; Zhang, Y.; Wang, Y.; Qian, Y.; Yan, Y.; Zhuge, W. Thermal Performance of a Micro Heat Pipe Array for Battery Thermal Management Under Special Vehicle-Operating Conditions. Automot. Innov. 2020, 3, 317–327. [Google Scholar] [CrossRef] [Scilit]
  39. Bakırcıoğlu, V.; Jond, H.B.; Yilmaz, F. Multi-Objective Optimization and Thermodynamic Analysis of a Supercritical CO2 Brayton Cycle in a Solar-Powered Multigeneration Plant for Net-Zero Emission Goals. Energy Convers. Manag. 2025, 328, 119628. [Google Scholar] [CrossRef] [Scilit]
Figure 1. Geometric structure design: (a) overall view, (b) cross-sectional view A-A, and (c) exploded view.
Batteries 12 00344 g001
Figure 2. Visualization of the ECM model.
Batteries 12 00344 g002
Figure 3. Experimental validation of the ECM [37].
Batteries 12 00344 g003
Figure 4. Numerical meshing of (a) the battery module and (b) the direct cooling plate.
Batteries 12 00344 g004
Figure 5. Total system pressure drop ∆P in (a) direct cooling and (b) indirect cooling modules.
Batteries 12 00344 g005
Figure 6. Pressure contours of the upper and lower cooling plates in the direct and indirect cooling modules.
Batteries 12 00344 g006
Figure 7. Velocity vectors for different cross-sections in direct and indirect cooling modules.
Batteries 12 00344 g007
Figure 8. Average battery temperature Tave in (a) direct cooling and (b) indirect cooling modules.
Batteries 12 00344 g008
Figure 9. Maximum battery temperature difference ∆T in (a) direct cooling and (b) indirect cooling modules.
Batteries 12 00344 g009
Figure 10. Maximum temperature difference among temperature measurement points ∆Ttab in (a) direct cooling and (b) indirect cooling modules.
Batteries 12 00344 g010
Figure 11. Standard deviation of battery temperature SDT in (a) direct cooling and (b) indirect cooling modules.
Batteries 12 00344 g011
Figure 12. Comparison of battery temperature contours in direct and indirect cooling modules.
Batteries 12 00344 g012
Figure 13. Hydraulic pump power P in (a) direct cooling and (b) indirect cooling modules.
Batteries 12 00344 g013
Figure 14. Engineering-weighted TOPSIS comprehensive scores S of (a) direct cooling and (b) indirect cooling systems.
Batteries 12 00344 g014
Figure 15. Test points and fitting surfaces of the direct cooling module: (a) Tave, (b) ∆T, (c) SDT, and (d) P.
Batteries 12 00344 g015
Table 1. The thermophysical parameters of the materials.
ItemDensity
kg∙m−3
Specific Heat Capacity
J∙kg−1∙K−1
Thermal Conductivity
W∙m−1∙K−1
Battery20641068λx = 4, λy = λz = 22
Busbar2700900237
Thermal barrier15010000.018
End plate2700900167
Support bar138012600.52
Positive tab2719871202.4
Negative tab8978381387.6
Cooling plate 2719871202.4
Immersion chamber2719871202.4
Table 2. The thermophysical parameters of the coolants.
ItemDensity
kg∙m−3
Specific Heat Capacity
J∙kg−1∙K−1
Thermal Conductivity
W∙m−1∙K−1
Viscosity
mPa·s
R134a
(vapor)
1.3 × 10⁻²T2 − 6.6T + 866.56.4 × 10−2T2 − 31.3T + 4686.14.8 × 10−7T2 − 1.8 × 10⁻⁴T + 2.6 × 10−12.1 × 10−7T2 − 7.9 × 10⁻⁵T + 1.7 × 10⁻²
R134a
(liquid)
−1.3 × 10⁻²T2 + 3.9T + 1190.24.6 × 10−2T2 − 23.1T + 4226.11.3 × 10−7T2 − 5.1 × 10⁻⁴T + 2.2 × 10−11.5 × 10−5T2 − 1.1 × 10⁻²T + 2.3
50% ethylene glycol solution107133000.352.94
KW8901406.29200.10711.32
Table 3. Grid-independent experiment.
Mesh NumberTaveTP
Mesh11,137,64124.978.122.367
Mesh21,962,58925.078.182.341
Mesh33,745,24625.108.202.33
Mesh45,146,71125.148.232.324
Mesh59,274,83425.168.242.324
Table 4. A comparison of simulation and prediction of performance parameters for the immersion direct cooling system under three candidate flow conditions.
Flow Rate
L⋅min−1
Ratio
%
PredictionSimulation
Tave °CSDT °CT °CP WTave °CSDT °CT °CP W
8.7656.1723.980.0328.290.22623.990.0338.300.226
8.8156.2623.970.0328.290.22923.980.0338.300.229
8.8256.4523.960.0328.280.23123.960.0328.280.231
Table 5. Comparison of performance parameters between the optimized and initial conditions of the immersion direct cooling system.
Flow Rate
L⋅min−1
Ratio
%
Tave
°C
SDT
°C
T
°C
P
W
Initial91026.650.0268.930.48
Optimized8.8256.4523.960.0328.280.23
Difference−10.1%+23.1%−7.2%−52.1%
Disclaimer/Publisher’s Note: The statements, opinions and data contained in all publications are solely those of the individual author(s) and contributor(s) and not of MDPI and/or the editor(s). MDPI and/or the editor(s) disclaim responsibility for any injury to people or property resulting from any ideas, methods, instructions or products referred to in the content.