Article

Battery-Aware Control of a Single-Phase Integrated Battery Charger Using NMPC, EKF, and LUT-Based Lithium-Ion Pack Modeling


by
Phonrut Bousungnoen
and
Padej Pao-la-or
*
School of Electrical Engineering, Institute of Engineering, Suranaree University of Technology, 111 University Avenue, Nakhon Ratchasima 30000, Thailand
*
Author to whom correspondence should be addressed.
Batteries 2026, 12(7), 254; https://doi.org/10.3390/batteries12070254
Submission received: 8 June 2026 / Revised: 10 July 2026 / Accepted: 13 July 2026 / Published: 14 July 2026

Abstract

This paper presents a battery-aware control framework for a single-phase integrated battery charger (IBC) for electric vehicles, in which the traction system is reused as part of the charging hardware. The proposed charger consists of a stator-assisted bridgeless totem-pole power-factor-correction AC–DC stage and a bidirectional buck–boost DC–DC stage connected to a 48 kWh, 400 V lithium-ion battery pack. The battery pack is modeled using a lookup-table-based equivalent circuit model with state-of-charge- and temperature-dependent open-circuit voltage and impedance parameters. A conventional double-loop PI controller is used as the baseline, while the proposed strategy combines nonlinear model predictive control, an extended Kalman filter, and lookup-table-based battery parameterization to regulate charging current under electrical and thermal constraints. The system is evaluated under 7 kW, 230 V/32 A and 22 kW, 230 V/96 A charging cases using average-model simulations, switching-model transient simulations, and finite element thermal assessment of the induction motor stator. The average-model results show stable charging from 20% to 80% SOC, with charging times of approximately 275 min at 7 kW and 90 min at 22 kW. The EKF provides bounded battery state estimation, with maximum SOC estimation errors of approximately 1.3% and 2.0% for the 7 kW and 22 kW cases, respectively, while the core-temperature estimation error converges close to zero. The switching-model results confirm feasible duty-command behavior, bounded battery-current tracking error, and a representative DC-link ripple of approximately 8 Vpp. During grid-voltage reduction, the charging current is reduced to keep the grid-current envelope within the intended limit. FEM results show that charging-only motor temperatures remain low, reaching approximately 27.39 °C at 7 kW and 38.82–38.85 °C at 22 kW. The most critical charging-related thermal case occurs at 22 kW after one hour of full-load motor operation with a 40 °C initial condition, reaching approximately 92.32 °C. Overall, these simulation-based findings support the feasibility of the proposed NMPC–EKF–LUT framework as a battery-aware supervisory control strategy for single-phase IBC operation. The proposed controller improves constraint-aware, battery state-based decision-making, while switching ripple and motor thermal response are mainly governed by the power stage, feasible current trajectory, and initial thermal condition.

1. Introduction

The development of electric vehicles (EVs) has increased the demand for charging systems that are compact, efficient, and compatible with battery safety requirements. In modern EV architectures, the battery-management system (BMS) plays a central role in monitoring, protection, state estimation, and control of lithium-ion battery packs [1]. Integrated on-board charging has also been investigated together with pack-level functions such as cell balancing, indicating that charger operation should be coordinated with battery-management requirements [2]. In electric and hybrid vehicles, BMS functions are essential for supervising battery safety, usable energy, voltage limits, and operating conditions [3]. Accurate state-of-charge (SOC) estimation is particularly important because available capacity, terminal-voltage response, and allowable charging current depend strongly on the battery operating condition [4].
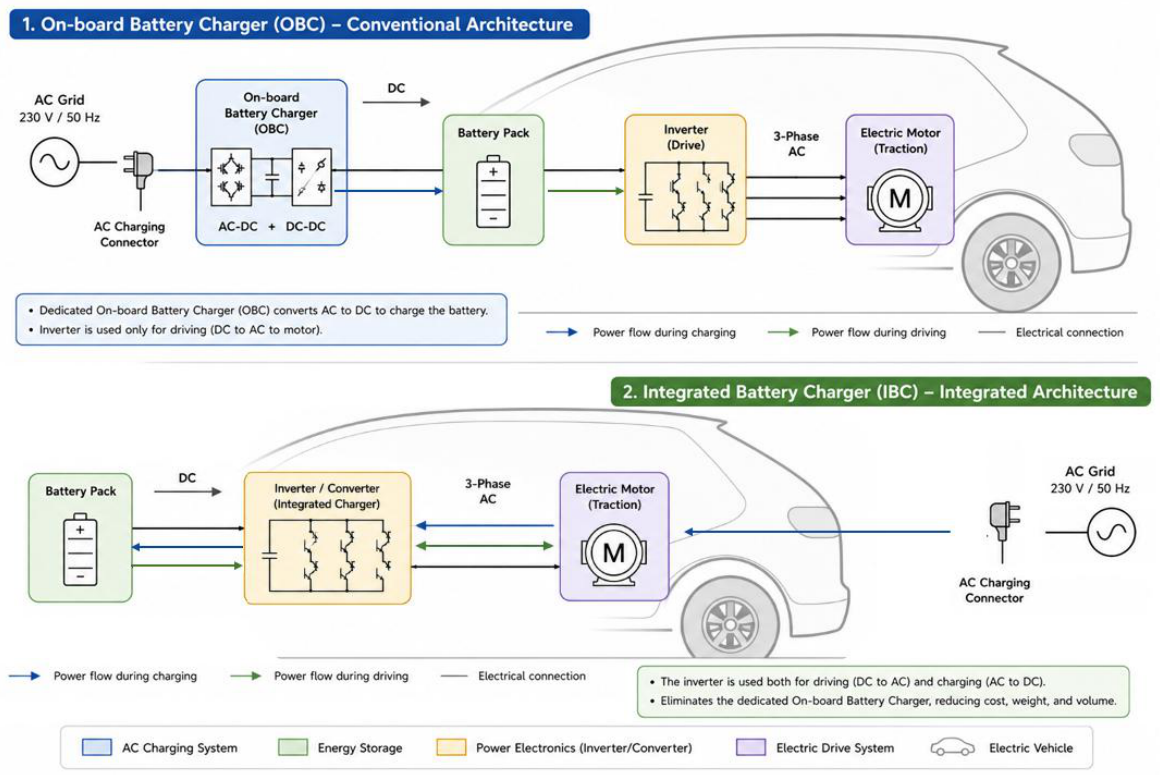
In a conventional on-board charger (OBC), the grid-interface converter, power-factor-correction stage, magnetic components, sensors, and thermal hardware are normally implemented as dedicated charging hardware [5,6]. Although this structure is mature and modular, it increases the weight, volume, and component count of the vehicle charging system. Integrated battery chargers (IBCs) have therefore been investigated as an alternative approach in which selected traction-system components are reused during plug-in charging. Figure 1 illustrates the basic structural difference between a conventional OBC and an IBC, where the conventional charger uses dedicated charging hardware, whereas the IBC reuses selected traction-system components during the charging mode. Model-predictive-control-based IBC operation has been reported as one approach for improving integrated charger dynamics [7]. Dual-inverter and motor-drive-based charging structures have also been investigated to reduce dedicated charging hardware and improve traction-system utilization [8,9].
The main advantage of an IBC is hardware integration; however, the charging mode introduces coupled electrical, battery-related, and thermal constraints. Because the machine windings are reused as part of the charging current path, the charger must maintain grid-current and dc-link requirements while avoiding excessive winding current, unintended torque production, and unacceptable motor thermal loading. Previous integrated charging studies have shown that motor windings and traction-drive components can be used as part of the charging energy-transfer path [10]. Predictive control has also been applied to buck–boost rectifier operation in EV IBC configurations with dual-inverter drives [11]. These issues are especially important when charging starts after high-load propulsion operation, since the motor may already contain residual thermal energy.
For residential and light-commercial charging environments, a single-phase grid input remains relevant because it is widely available and easier to interface with existing infrastructure than a three-phase supply. In this study, a single-phase IBC is considered as a practical compromise between system integration and implementation complexity. The proposed architecture consists of a 230 V, 50 Hz single-phase grid input, a bridgeless totem-pole power-factor-correction (PFC) AC-DC front-end, a bidirectional buck–boost DC-DC charging stage, and the stator windings of a three-phase induction motor used as shared inductive elements. The battery-side converter regulates the charging current injected into a 48 kWh, 400 V, 125 Ah lithium-ion battery pack.
From the battery-management perspective, the charging current should be adjusted according to SOC, terminal voltage, internal impedance, heat generation, and temperature. Conventional double-loop proportional-integral (PI) control is widely used for converter regulation because of its simplicity and low computational requirement. However, PI control is usually tuned around a nominal operating point and reacts mainly to tracking error. When battery voltage, SOC, impedance, and temperature vary during charging, fixed-gain PI control generally requires external limiters or supervisory logic to avoid constraint violation. This motivates a predictive control framework that can anticipate future battery and converter behavior rather than correcting only the present current or voltage error.
Model predictive control (MPC) is suitable for this purpose because it can include system dynamics, operating constraints, and multi-objective cost functions. MPC-oriented studies on integrated OBCs have shown that predictive control can improve dynamic characteristics in charging systems [7]. Predictive control has also been applied to EV battery chargers and converter systems where current regulation and voltage constraints must be handled simultaneously [12,13]. For lithium-ion battery charging, predictive control is relevant because charging involves competing objectives such as reducing charging time, limiting voltage rise, suppressing thermal stress, and reducing degradation. State-monitored predictive charging has been investigated for electrothermal lithium-ion battery management [14]. Nonlinear model predictive control (NMPC) has also been applied to optimize battery charging strategies under nonlinear battery behavior [15]. Constrained predictive charging has been used with coupled thermo-electric battery models to manage current and thermal limitations [16]. Health-aware fast-charging methods further show the importance of temperature-aware current regulation during lithium-ion battery charging [17]. These studies indicate that battery charging control should account for thermal-management requirements, especially under high-charging-rate or high-ambient-temperature conditions [18].
In addition to predictive control, the battery model used by the controller must represent the dependence of electrical parameters on operating conditions. An equivalent circuit model (ECM) provides a practical balance between dynamic-voltage accuracy and computational efficiency for charger-control simulation [19]. Electro-thermal battery models show that heat generation and temperature response should be included when evaluating battery charging behavior [20]. Reviews of lithium-ion battery models for electric transportation also emphasize that model parameters are affected by SOC and temperature [21]. Temperature-dependent second-order RC models have been used to improve SOC estimation accuracy under varying operating conditions [22]. In this study, the ECM is combined with SOC- and temperature-dependent lookup tables (LUTs) for open-circuit voltage (OCV) and impedance parameters. This LUT-based parameterization allows the controller and estimator to account for battery-parameter variation during charging instead of treating the battery pack as a constant-voltage source or a fixed RC load.
An NMPC-based charger also requires reliable internal battery state information. In practical battery packs, SOC, core temperature, and internal heat generation are not directly measurable and must be estimated from available signals such as current, terminal voltage, and surface temperature. Extended Kalman filter (EKF)-based estimation is suitable for this task because it recursively combines nonlinear model prediction with measured voltage and current signals [23]. Battery thermal-management studies further show that temperature supervision is essential for maintaining safety and limiting thermal stress during charging [24]. Therefore, the integration of EKF-based estimation and LUT-based ECM modeling provides the NMPC layer with internal battery states and operating-condition-dependent parameters.
Although IBC topologies, predictive converter control, battery state estimation, and ECM-based battery modeling have been widely investigated, these topics are often treated as separate problems. Topology-oriented IBC studies usually emphasize hardware integration and converter operation, whereas battery-management studies often focus on SOC estimation, thermal supervision, or charging optimization without considering the additional thermal burden imposed on the reused traction motor. For a motor-winding-assisted IBC, the charger controller should therefore be evaluated not only in terms of current tracking, but also in terms of constraint handling, battery state awareness, and motor thermal feasibility.
Table 1 summarizes the relationship between existing approaches and the proposed framework. The comparison clarifies that the novelty of this work is not the isolated use of NMPC, EKF, or LUT-based ECM modeling, but their combined application within a single-phase IBC evaluation workflow that includes PI benchmarking, switching-model transient verification, and finite element method (FEM)-based motor thermal assessment.
Based on these considerations, this paper proposes a battery-aware control framework for a single-phase IBC by integrating NMPC, EKF-based state estimation, and LUT-based lithium-ion battery pack modeling. The proposed controller is applied to the battery-side bidirectional buck–boost DC-DC charging stage, while a conventional double-loop PI controller is used as the baseline strategy. The objective is to regulate the charging current while generating feasible commands under battery-current, battery-voltage, SOC, temperature, duty-cycle, dc-link voltage, and input-power constraints. Because the proposed IBC reuses the stator windings of a three-phase induction motor in the charging path, a three-dimensional FEM thermal assessment is also included to evaluate the motor-temperature response under charging-only and post-full-load operating conditions.
The main contributions of this paper are summarized as follows:
  • A single-phase integrated battery charger architecture is formulated using a bridgeless totem-pole PFC AC-DC front-end, a bidirectional buck–boost DC-DC charging stage, and the stator windings of a three-phase induction motor as shared inductive elements.
  • A battery-aware NMPC formulation is developed for the battery-side charging stage to generate feasible charging current commands under battery-current, terminal-voltage, SOC, core-temperature, duty-cycle, dc-link voltage, and input-power constraints.
  • An EKF-based estimation layer and a SOC- and temperature-dependent LUT-based ECM are integrated to provide the controller with internal battery states and operating-condition-dependent parameters.
  • A conventional double-loop PI controller is implemented as the baseline strategy to distinguish converter-level tracking behavior from battery-aware constraint-handling capability.
  • A multi-layer simulation workflow is established by combining average-model charging simulation, switching-model transient verification, and three-dimensional FEM motor thermal assessment.
The remainder of this paper is organized as follows. Section 2 describes the proposed IBC architecture, battery pack model, PI controller, NMPC formulation, EKF-based estimation method, and FEM thermal model. Section 3 presents the simulation scenarios and results. Section 4 discusses the implications and limitations of the proposed framework. Section 5 concludes the paper and outlines future work.

2. Materials and Methods

This section defines the integrated battery charger (IBC) configuration, the electrical interface, the battery pack model, and the simulation boundaries used in this study. The proposed system is intended for a battery electric vehicle equipped with a three-phase induction motor traction drive and a 48 kWh lithium-ion battery pack. During traction operation, the inverter and motor perform the conventional propulsion function. During plug-in charging, selected traction components are reused as part of the charging circuit, reducing the requirement for additional passive components and improving the power-density potential of the on-board charger. The system is studied using MATLAB/Simulink R2024a at both average-control and switching-model levels, with particular emphasis on the battery-side charging dynamics, state estimation, and thermal safety constraints.

2.1. EV Integrated Battery Charger Architecture

The proposed charger follows a two-stage IBC structure. The first stage is a single-phase AC-DC front-end that interfaces the utility grid with the DC-link. This stage operates in a power-factor-correction (PFC) manner and regulates the DC-link voltage. The second stage is a bidirectional buck–boost DC-DC converter that transfers energy from the DC-link to the battery pack during charging. In the proposed architecture, the stator windings of the three-phase induction motor are used as auxiliary inductive elements in the AC-DC charging path. This approach is consistent with the general concept of integrated on-board charging, in which the traction inverter, motor windings, or drive components are reused during charging to reduce hardware redundancy [2,7,8,9].
The power flow in charging mode can be summarized as shown in Figure 2.
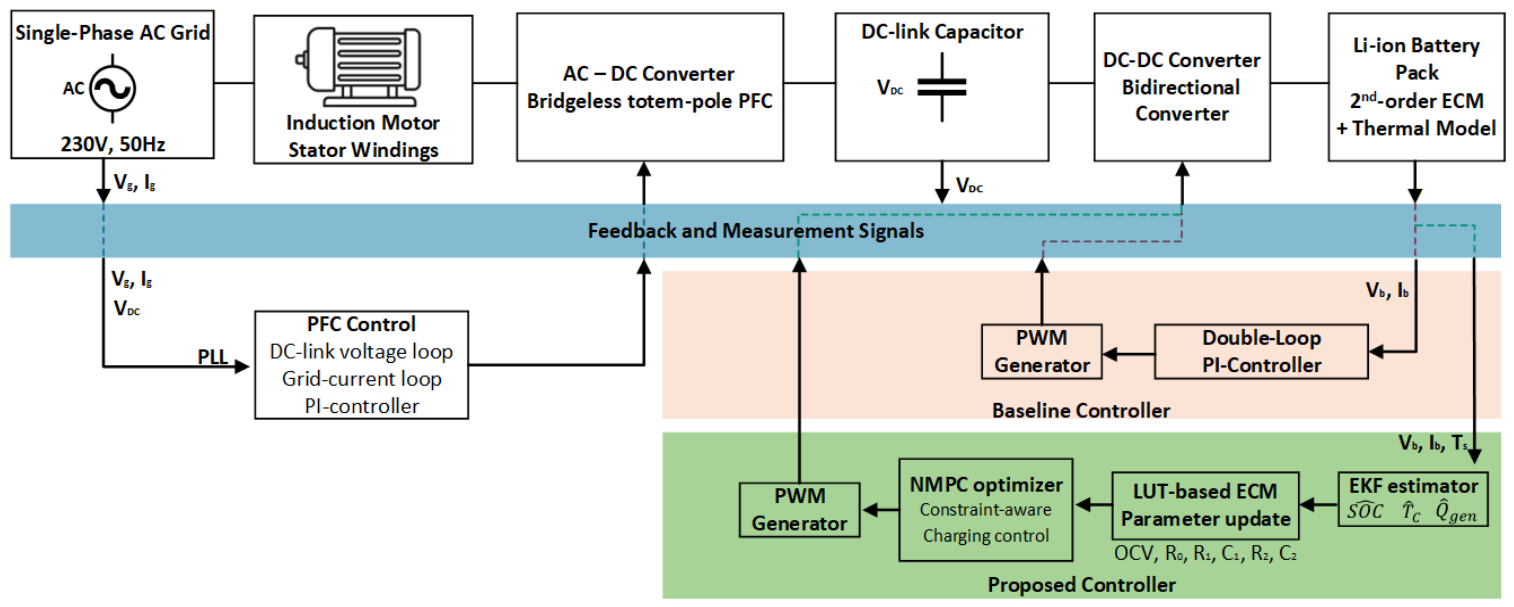
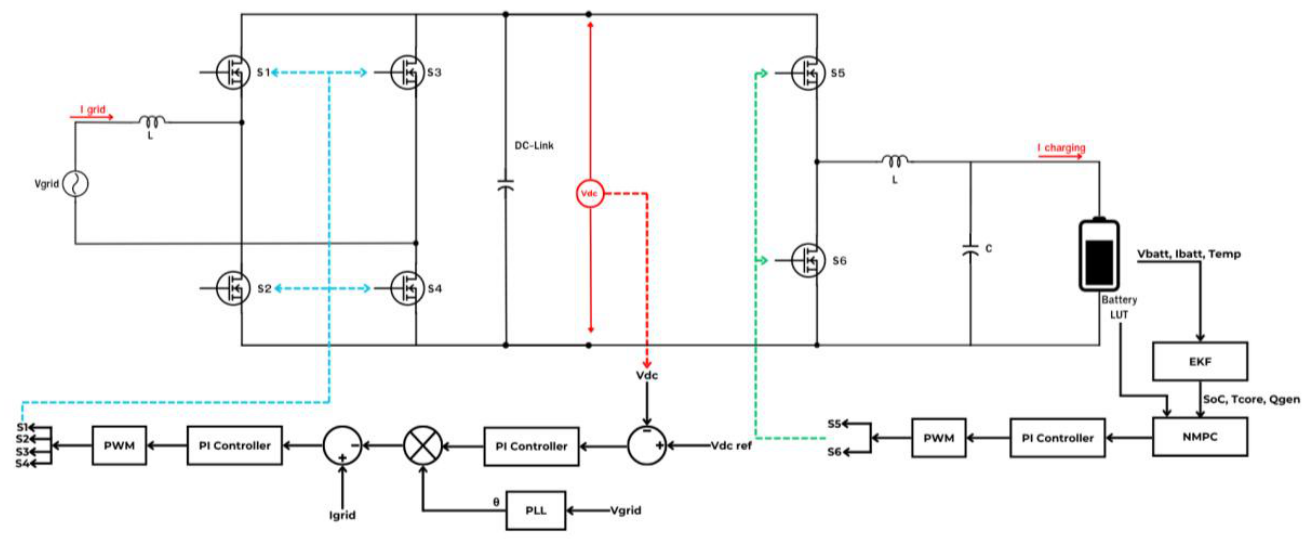
For the proposed charging mode, the traction torque production is assumed to be zero or negligible because the vehicle is stationary. The motor windings are therefore considered as electrical inductive elements rather than as electromechanical torque-producing components. The battery-side converter is controlled by NMPC in the proposed system and by a double-loop PI controller in the baseline system. The comparison is designed to highlight the benefit of dynamic, constraint-aware charging control over fixed-gain cascaded control. Figure 3 presents the overall control architecture and signal flow of the proposed single-phase IBC. The upper part of the diagram represents the power-stage energy-transfer path from the single-phase grid to the lithium-ion battery pack through the stator winding-assisted AC-DC PFC stage, DC-link capacitor, and bidirectional DC-DC converter. The feedback and measurement bus collects the grid-side variables, DC-link voltage, battery voltage, battery current, and battery temperature-related signals for controller and estimator operation.
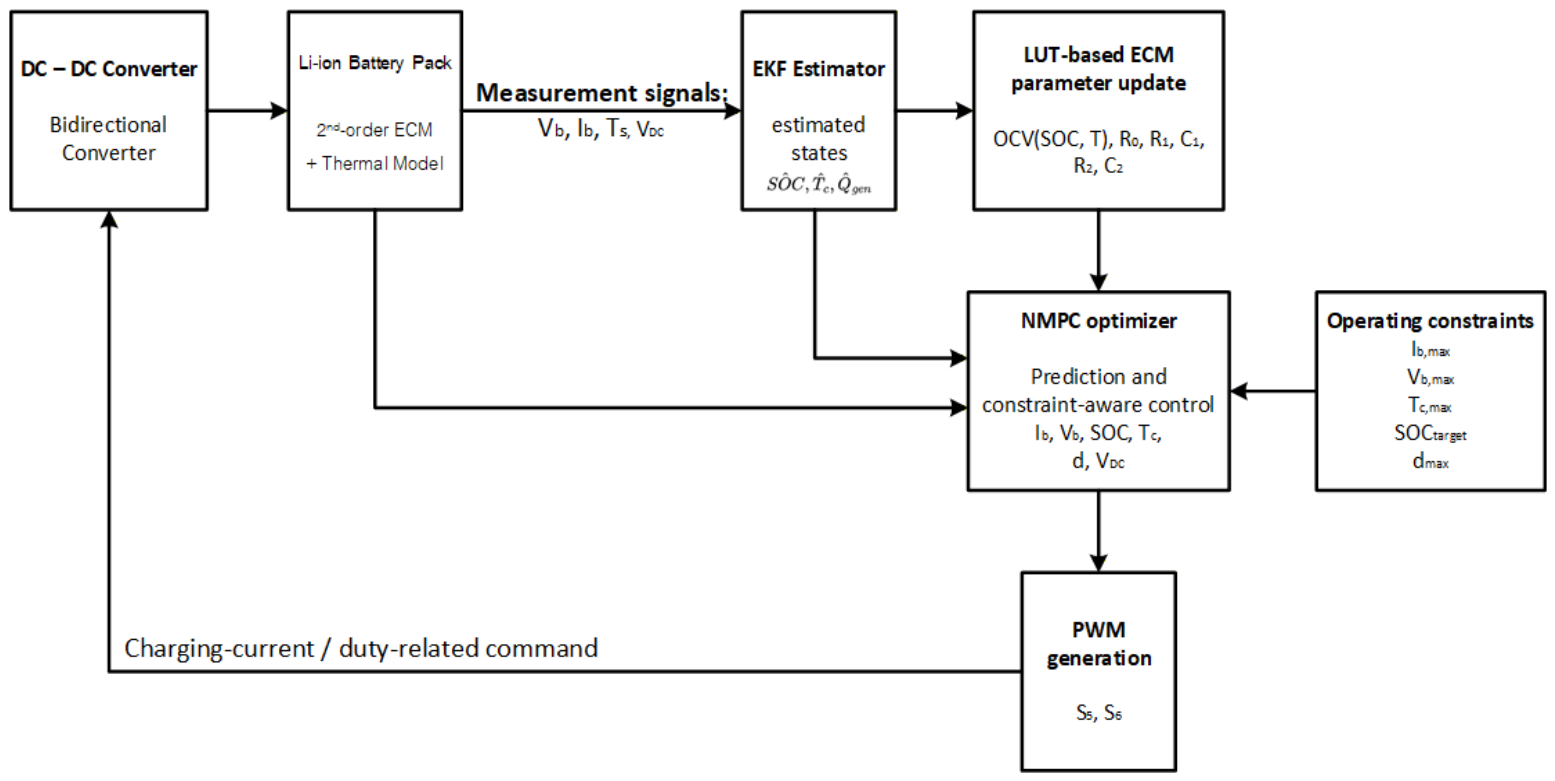
For the baseline case, the double-loop PI controller generates the duty command through the PWM generator using battery voltage and current feedback. For the proposed case, the EKF estimates the internal battery states, including SOC, core temperature, and heat generation, from measurable battery signals. These estimated states are used by the LUT-based ECM block to update the OCV and impedance parameters. The updated parameters and estimated states are then supplied to the NMPC optimizer, which computes a constraint-aware charging command for the DC-DC converter. Therefore, the PI baseline and the proposed NMPC-EKF-LUT controller can be compared under the same power stage, battery model, and operating conditions.

2.2. Single-Phase Grid Interface and Bridgeless Totem-Pole PFC Stage

The AC-DC front-end of the proposed charger is designed as a single-phase bridgeless totem-pole PFC stage. This topology is selected because modern EV on-board chargers increasingly require high efficiency, compact magnetic components, and reduced conduction loss at the grid interface. Unlike a conventional boost PFC rectifier, which places a diode bridge in front of the boost stage, the bridgeless totem-pole PFC removes the input diode bridge and uses active switches to conduct the line current. Recent OBC reviews report that this topology is particularly attractive for compact single-phase chargers in the approximately 1.8–7 kW class, where efficiencies in the 97–99% range can be achieved when wide-bandgap devices such as SiC or GaN switches are used [25]. In this study, the same front-end principle is adapted to an integrated battery charger in which the induction motor stator windings contribute to the AC-side energy-storage path. The grid voltage is represented as
v g ( t ) = 2 V g , rms sin ( ω g t )
where V g , rms = 230 V, f g = 50 Hz, and ω g = 2 π f g . The role of the PFC stage is to draw an input current that follows the grid-voltage waveform while regulating the DC-link voltage. The input current reference can therefore be written as
i g ( t ) = I g , pk sin ( θ g )
where θ g is obtained from a PLL synchronized with the grid voltage and I g , pk is generated by the DC-link voltage controller. Under near-unity-power-factor operation,
P g V g , rms I g , rms
while the more general real-power relationship is
P g = V g , rms I g , rms cos ϕ
For the totem-pole boost-type operation, the fundamental voltage conversion relationship can be expressed using the boost converter equation:
V d c V i n 1 D p f c
where V i n is the rectified or instantaneous equivalent input voltage and D p f c is the PFC duty ratio. Because the single-phase input voltage varies over the line cycle, the controller continuously modulates the switching devices to maintain the DC-link voltage while shaping the input current.
The inductor design of a boost-type PFC stage is commonly estimated from the allowable current ripple:
L p f c V i n D p f c f s w Δ I L
The peak inductor current can be estimated by
I L , peak = I i n , avg + Δ I L 2
and the DC-link capacitance can be initially sized from the allowable voltage ripple:
C d c I o D p f c f s w Δ V d c
In the proposed integrated charger, the external PFC inductance is not treated as a completely independent component. Instead, the stator winding impedance of the three-phase induction motor is incorporated into the AC-side charging path. The per-phase stator impedance is:
Z s = R s + j X s = R s + j ω g L s
Therefore,
L s = X s ω g
The DC-link voltage dynamics are determined by the difference between the power transferred from the AC-DC front-end and the power absorbed by the DC-DC charger:
C d c d V d c d t = i p f c i d c
or, equivalently,
d d t 1 2 C d c V d c 2 = P p f c P d c P l o s s , p f c
The DC-link reference is constrained within 500 V V d c 800 V. For the comparative simulation cases, the nominal reference is set as 500 V. This value is higher than the battery terminal voltage over the target SOC range and provides sufficient voltage headroom for the downstream buck-mode battery charger. At the same time, it avoids unnecessary semiconductor and capacitor voltage stress compared with a higher DC-link setting.
Although the bridgeless totem-pole PFC can provide high efficiency and reduced component count, it also requires careful switching control, current sensing, and EMI management. The source review notes that zero-voltage switching (ZVS) and zero-current detection (ZCD) techniques are often used to mitigate switching losses, while the absence of the diode bridge makes layout parasitics, common-mode noise, and dead-time selection more important [25]. In this work, these hardware-level effects are represented within the defined simulation boundary; detailed EMI filter optimization and semiconductor packaging design are left as future experimental tasks.

2.3. Bidirectional Buck–Boost DC-DC Charging Stage

The second conversion stage is a bidirectional buck–boost converter connected between the DC-link and the battery pack. During grid-to-battery charging, the converter mainly operates in buck mode because the DC-link voltage is higher than the battery voltage. The ideal buck-mode voltage relationship is
V b D V d c
where D is the duty command. In a practical averaged model that includes inductor resistance, the inductor current dynamics are expressed as
L d c d i L d t = D V d c V o R L i L
and the output capacitor dynamics are
C o d V o d t = i L i b
where i L is the DC-DC inductor current, V o is the converter output voltage, i b is the battery charging current, R L is the inductor series resistance, L d c is the DC-DC inductor, and C o is the output capacitor.
The duty command generated by the controller is compared with a carrier signal to produce complementary Pulse Width Modulation (PWM) gate signals. Dead time, device non-idealities, diode recovery, and parasitic capacitances may be included in the switching model depending on the simulation detail level. In the average-level model, the PWM stage is replaced by the duty-dependent averaged voltage D V d c , which reduces computational cost and allows long-duration charging simulation from 20% SOC to 80% SOC.
In the baseline controller, a double-loop PI structure regulates the battery voltage and charging current. In the proposed controller, the NMPC generates the charging current command or duty-related control action by considering current, voltage, SOC, thermal, and converter constraints simultaneously. Figure 4 shows the circuit and controller of the proposed system.

2.4. Lithium-Ion Battery Pack

This section describes the lithium-ion battery pack model used in the proposed integrated battery charger (IBC) study. The model is intended to support two tasks simultaneously: first, to reproduce the electrical response of the battery pack during grid-connected charging; and second, to provide state and constraint information to the nonlinear model predictive controller (NMPC) and the Kalman-filter-based thermal/state estimator. Battery-management studies emphasize that SOC estimation is essential for lithium-ion battery supervision and charging control [4]. To keep the model suitable for control-oriented simulation, the battery pack is represented by an equivalent circuit model (ECM), which provides a practical balance between physical interpretability and computational efficiency [19]. The open-circuit voltage and impedance parameters are obtained from state-of-charge (SOC)- and temperature-dependent lookup tables (LUTs), since lithium-ion battery parameters vary with operating conditions [21,22]. This ECM-based structure is compatible with Kalman-filter-based state estimation because it relates measurable voltage and current signals to internal battery states [23]. Comparative studies of ECM structures also support the use of RC-based battery models for SOC-estimation and control-oriented applications [26].
In this work, the battery pack is specified as a 48 kWh, 400 V, 125 Ah lithium-ion pack with a 120s1p architecture. The notation 120s1p means that 120 cell groups are connected in series and that each series group contains 1 cell in parallel. Therefore, the pack voltage is mainly determined by the number of series-connected cells, whereas the pack capacity and current capability are mainly determined by the number of parallel-connected cells. The same pack specification is used for the double-loop PI controller, the NMPC + KF model, and the NMPC + EKF + LUT model so that differences in the simulation results can be attributed primarily to the control and estimation strategies rather than to differences in the battery model.

2.4.1. Equivalent Circuit Model of the Lithium-Ion Battery Pack

The electrical behavior of the battery is represented using a second-order Thevenin equivalent circuit model. This type of ECM is widely used in control-oriented battery studies because it provides a practical balance between dynamic-voltage representation and computational efficiency [19]. The model consists of an SOC- and temperature-dependent open-circuit voltage source, an ohmic resistance, and two resistance–capacitance polarization branches. The ohmic resistance represents the instantaneous voltage drop associated with charge transfer, electronic conduction, current collectors, and connector losses. The RC branches represent short- and medium-term polarization effects caused by electrochemical diffusion and charge-transfer dynamics. Battery-modeling studies have shown that ECM parameters are affected by SOC and temperature, which supports the use of operating-condition-dependent model parameters [21,22]. Compared with a first-order ECM, the second-order model can better reproduce the transient response under pulse-current or fast-charging conditions while remaining simple enough for real-time control implementation [26].
For the charging convention used in this study, the battery current i b is positive when current flows into the battery pack. The terminal voltage of one representative cell is written as
v c e l l = v o c z , T c + i c e l l R 0 z , T c + v p , 1 + v p , 2
where v c e l l is the cell terminal voltage, v o c is the open-circuit voltage, z is SOC in per-unit form, T c is the battery core temperature, i c e l l is the cell current, R 0 is the ohmic resistance, and v p , 1 and v p , 2 are the voltages across the two polarization branches. If a discharge-positive current convention is used, the signs of the current-dependent voltage terms in (16) should be reversed.
The polarization branch dynamics are described by
v ˙ p , k = 1 R k ( z , T c ) C k ( z , T c ) v p , k + 1 C k ( z , T c ) i c e l l , k = 1 , 2
where R k and C k are the resistance and capacitance of the k -th RC branch. The corresponding time constant is
τ k ( z , T c ) = R k ( z , T c ) C k ( z , T c )
The SOC dynamics are obtained by Coulomb counting:
z ˙ = η c I b 3600 Q p a c k
where Q p a c k is the nominal pack capacity in Ah and η c is the charging Coulombic efficiency. In percentage form,
d S O C % d t = 100 η c I b 3600 Q p a c k
For the 125 Ah pack used in this study, a constant 16.5 A for 7 kW and 60 A for 22 kW require charging current corresponds approximately to 0.13 C and 0.48 C charging rate before voltage, thermal, and aging constraints are considered.

2.4.2. SOC- and Temperature-Dependent OCV and Impedance LUTs

The proposed NMPC + EKF + LUT model uses lookup tables to represent the dependence of battery electrical parameters on SOC and temperature. This approach is suitable for simulation and controller design because lithium-ion battery performance and SOC estimation are strongly affected by operating conditions [4]. In the ECM framework, the OCV and impedance parameters are treated as operating-condition-dependent quantities rather than fixed constants [19]. Battery-modeling studies also emphasize that SOC and temperature influence voltage response, internal resistance, and polarization behavior [21,22]. This parameter dependence is important for Kalman-filter-based estimation because the estimator uses the battery model to relate measurable voltage and current signals to internal battery states [23]. Comparative studies of RC-based ECM structures further support the use of LUT-updated parameters for improving transient-response representation in SOC-estimation and control-oriented applications [26].
The LUT-based cell-level parameters are defined as
v o c = f O C V ( z , T c )
R 0 = f R 0 ( z , T c ) ,       R 1 = f R 1 ( z , T c ) ,       C 1 = f C 1 ( z , T c )
R 2 = f R 2 ( z , T c ) ,       C 2 = f C 2 ( z , T c )
In the present simulation, these LUTs are control-oriented parameter maps. They are shaped to reproduce realistic trends of lithium-ion cells: OCV increases with SOC, ohmic resistance generally decreases at moderate temperature compared with low-temperature operation, and polarization parameters vary with both SOC and temperature. For experimental implementation, the same LUT structure can be populated using measured cell data from OCV characterization and pulse power tests.
The OCV LUT is typically obtained from a low-current charge/discharge test or an incremental OCV relaxation test. In this procedure, the cell is charged or discharged in small SOC steps, followed by rest periods sufficient for terminal-voltage relaxation. The relaxed terminal voltage is then used as the OCV value at the corresponding SOC and temperature [19]. The impedance-related LUTs can be extracted from hybrid pulse power characterization (HPPC), current pulse tests, electrochemical impedance spectroscopy (EIS), or pulse-response fitting methods. Battery-modeling studies show that impedance parameters vary with SOC and temperature, which supports the use of operating-condition-dependent LUTs [21,22]. Comparative studies of RC-based ECM structures also support the use of pulse-response or impedance-fitting approaches for improving transient voltage representation in control-oriented battery models [26]. For charger-control simulation, pulse-test-based parameterization is often sufficient because the controller mainly requires time-domain voltage prediction under dynamic charging current.
For a measured data set, the required LUT inputs and outputs should be organized as shown in Table 2.

2.4.3. Pack Scaling from Cell-Level Parameters to a 120s1p Architecture

The cell-level ECM parameters are scaled to the battery pack level using the series–parallel structure of the pack. For the 120s1p configuration,
N s = 120 ,       N p = 1
The pack nominal capacity is
Q p a c k = N p Q c e l l
Because Q p a c k Ah, the equivalent cell capacity used in the pack scaling is
Q c e l l = Q p a c k N p
The pack open-circuit voltage is
V o c , p a c k ( z , T c ) = N s v o c ( z , T c )
The current in each parallel cell is
i c e l l = I b N p
The resistance terms scale according to the number of series and parallel cells:
R 0 , p a c k ( z , T c ) = N s N p R 0 ( z , T c )
R k , p a c k ( z , T c ) = N s N p R k ( z , T c ) ,     k = 1 , 2
Consequently, the RC time constants remain unchanged by ideal series–parallel scaling:
τ k , p a c k = R k , p a c k C k , p a c k = R k C k = τ k
This result is useful for controller design because the transient voltage time constants identified from a single cell can be retained at pack level when the cells are assumed to be well matched and evenly loaded. In practical packs, additional busbar resistance, contact resistance, current imbalance, thermal gradients, and cell-to-cell aging dispersion may need to be included. In the present work, the pack is assumed to be electrically balanced so that the ECM represents the average pack behavior.

2.4.4. Thermal Network of Battery Core, Surface, and Coolant

Battery temperature affects both safety and electrical performance. During charging, the heat generated inside the battery pack changes the internal resistance, accelerates aging mechanisms, and may constrain the allowable charging current. For this reason, the proposed model includes a three-node thermal network consisting of a battery core node, a surface node, and a coolant node. The core node represents the internal heat generation region of the cells, the surface node represents the external cell/module surface, and the coolant node represents the thermal-management boundary condition.
The irreversible heat generation can be approximated by
Q ˙ g e n I b 2 R e q , p a c k ( z , T c )
where R e q , p a c k is the equivalent pack resistance used for heat calculation. A more complete heat expression may include reversible entropic heat:
Q ˙ g e n = i b 2 R e q , p a c k ( z , T ) + i b T c d V o c , p a c k d T
In this study, (32) is used as the main control-oriented heat input unless measured entropic coefficient data are available. If experimental d V o c / d T data are later obtained, (33) can be activated in the LUT-based thermal model.
The three-node thermal network is expressed as
C c d T c d t = Q ˙ g e n T c T s R c s
C s d T s d t = T c T s R c s T s T c o o l R s c
C c o o l d T c o o l d t = T s T c o o l R s c T c o o l T a m b R c a + Q ˙ c o o l , i n
Here T c , T s , and T c o o l are the core, surface, and coolant temperatures; C c , C s , and C c o o l are thermal capacitances; and R c s , R s c , and R c a are thermal resistances between the core-surface, surface-coolant, and coolant-ambient nodes, respectively. In the simplified simulation, the coolant node may be treated as a controlled boundary condition:
T c o o l = T c o o l , s e t
which reduces the thermal network to a two-state core-surface model. This assumption is reasonable for controller-development simulation when the cooling system is not the main object of study. However, for final validation or hardware-oriented studies, coolant flow rate, inlet temperature, heat exchanger dynamics, and spatial pack gradients should be included [20,24,27].
The thermal model supplies T c to the LUTs and the estimator. As a result, the controller can reduce charging current when predicted temperature approaches the thermal limit. The model also allows the EKF to estimate the internal core temperature from measurable or estimated signals such as pack current, terminal voltage, and surface temperature.

2.4.5. Aging and Degradation Indicator Based on Internal Resistance Growth

Battery degradation during fast charging is represented using a simplified internal resistance growth indicator. The objective is not to reproduce all electrochemical aging mechanisms in detail, but to include a control-relevant aging signal that reflects increasing electrical loss and reduced battery health. In BMS-oriented EV applications, degradation-related indicators are important because battery health affects protection, charging supervision, and allowable operating conditions [1]. Internal resistance is a practical model-based variable because it directly influences terminal-voltage response and can be incorporated into battery state estimation frameworks [23]. For charger-level evaluation, resistance growth is also relevant because it increases electrical loss and thermal stress during charging operation [25]. Battery-modeling and SOC/SOH estimation studies further support the use of resistance-related parameters as indicators of battery health degradation [28].
The total pack resistance used in the degradation indicator is written as
R int , p a c k ( t ) = R 0 , p a c k ( z , T c ) + R S E I , p a c k ( t )
where R S E I , p a c k is an additional aging-related resistance term. The resistance-based degradation index is defined as
D I R ( t ) = R i n t , p a c k ( t ) R i n t , p a c k ( 0 ) R i n t , p a c k ( 0 ) × 100 %
For a more compact state variable, the aging resistance may be updated using
R S E I , p a c k ( t + Δ t ) = R S E I , p a c k ( t ) + k R | I b | α exp E a R g ( T c + 273.15 ) g ( z ) Δ t
where k R is an aging-rate coefficient, α is a current-stress exponent, E a is an activation energy term, R g is the universal gas constant, and g ( z ) is an SOC-dependent stress factor. In the current simulation, the aging indicator is used mainly for comparison between charging strategies. Therefore, k R , α , E a , and g ( z ) may be calibrated later using cycle-aging test data or manufacturer data.
The degradation indicator is linked to heat generation and control constraints in two ways. First, as R i n t , p a c k increases, I b 2 R loss increases for the same charging current. Second, the NMPC can include aging-related penalties or constraints to avoid aggressive current profiles that create excessive thermal and resistance growth stress. This makes the model suitable for evaluating whether an optimized charging strategy provides benefits beyond simple current tracking.

2.5. Baseline Double-Loop PI Controller

The baseline charging controller is based on a conventional cascaded double-loop PI structure. This control architecture is widely used in power electronic converters because it is simple, computationally light, and easy to tune around a nominal operating point. In the proposed IBC, the double-loop PI controller is applied to both the AC-DC front-end and the DC-DC charging stage. The AC-DC stage regulates the DC-link voltage and shapes the grid current, whereas the DC-DC stage regulates the battery charging current and limits the battery terminal voltage.
For the AC-DC stage, the outer voltage loop compares the measured DC-link voltage V d c with its reference V d c r e f . The output of this loop determines the amplitude of the grid-current reference. A grid-synchronized sinusoidal reference is then generated using a phase-locked loop (PLL):
i g r e f ( t ) = I g r e f sin ( θ g )
where I g r e f is the current amplitude generated by the voltage PI controller and θ g is the grid phase angle estimated from the PLL. The inner current loop regulates the measured grid current i g to follow i g r e f . The general PI control law is written as
u ( t ) = K p e ( t ) + K i 0 t e ( τ ) d τ
where e ( t ) is the control error, K p is the proportional gain, and K i is the integral gain. In a digital controller, (42) is implemented in discrete time as
u [ k ] = K p e [ k ] + K i T s j = 0 k e [ j ]
where T s is the controller sampling time.
For the DC-DC bidirectional buck–boost stage, the outer loop typically compares the measured battery voltage V b with the maximum allowable battery voltage V b m a x , while the inner loop regulates the battery current I b to track the charging current reference I b r e f . In constant-current operation, the voltage loop remains inactive or weakly active until the pack voltage approaches its limit. When V b approaches V b m a x , the voltage loop reduces the current command and the charger naturally transitions toward constant-voltage behavior.
The double-loop PI controller is used as the benchmark in this research because it represents a common industrial control method for converter regulation. However, it has two important limitations for battery-aware charging. First, PI control is normally tuned around a limited operating range and does not explicitly predict future SOC, temperature, or voltage constraints. Second, it does not directly optimize charging performance under multiple battery constraints. These limitations motivate the use of NMPC in the proposed controller.
To ensure a fair comparison with the proposed NMPC–EKF–LUT controller, the baseline PI controller was tuned using the same converter parameters, battery pack model, sampling conditions, current limits, voltage limits, and operating scenarios. The PI gains were not intentionally detuned. The inner current loops were tuned first to provide stable and fast current tracking without excessive duty-cycle oscillation. The outer voltage loops were then tuned with a slower bandwidth to maintain DC-link or battery-voltage regulation while avoiding interaction with the inner current loops. Saturation and anti-windup limits were applied consistently with the current, voltage, and duty-cycle limits used in the NMPC formulation.
The PI controller is therefore used as a properly tuned converter-level benchmark. Its role is to represent conventional voltage and current regulation performance under the same plant and operating constraints. In contrast, the proposed NMPC–EKF–LUT controller extends this baseline by adding predictive constraint handling, estimated internal battery states, and SOC- and temperature-dependent battery parameters.

2.6. NMPC Formulation for Battery-Aware Charging

Model predictive control (MPC) is an optimization-based control method in which a dynamic model is used to predict future system behavior over a finite prediction horizon. At each sampling instant, the controller solves an optimization problem, applies only the first control action, and then repeats the calculation at the next sampling instant using updated measurements. This receding-horizon principle allows the controller to handle constraints explicitly and to balance competing objectives such as fast charging, voltage limitation, thermal safety, and aging reduction [29,30,31,32].
In nonlinear model predictive control (NMPC), the prediction model and/or constraints are nonlinear. This is especially suitable for lithium-ion battery charging because the battery voltage, open-circuit voltage, internal resistance, heat generation, and aging behavior are nonlinear functions of SOC, temperature, current, and operating history [14,33,34,35]. In this work, the NMPC uses a control-oriented battery model and charger model to determine the future charging current or converter duty-related command while respecting battery constraints.
The nonlinear state vector can be written as
x = S O C v p , 1 v p , 2 T c T s R S E I T
where S O C is the battery state of charge, v p , 1 and v p , 2 are the polarization voltages of the equivalent circuit model, T c and T s are the battery core and surface temperatures, and R S E I is the degradation-related resistance state. The manipulated variable is selected as the battery charging current reference:
u = I b r e f
For the average model, the current reference is mapped into the DC-DC converter through a control-level current loop. For the switching model, the current command is converted into a duty command and then into complementary PWM signals for the MOSFET-based bidirectional buck–boost converter.
The nonlinear prediction model is expressed in compact form as
x k + 1 = f ( x k , u k , p k )
y k = h ( x k , u k , p k )
where p k contains measured or estimated parameters such as DC-link voltage, coolant temperature, LUT-based battery parameters, and operating limits. The output vector used by the controller is
y = S O C V b I b T c Q ˙ g e n R i n t T
The finite-horizon NMPC optimization problem is formulated as
min Δ U J = i = 1 N p w s o c S O C r e f , k + i S O C k + i 2 + w I I b , k + i I b , r e f , k + i 2 + w T T c , k + i T c , r e f 2 + i = 0 N c 1 w Δ u Δ u k + i 2
subject to
0 I b , k + i I b , m a x
V b , k + i V b m a x
T c , k + i T c m a x
S O C k + i S O C t a r g e t
0 d k + i d m a x
Here N p is the prediction horizon, N c is the control horizon, d is the converter duty command, and w s o c , w I , w T , and w Δ u are weighting factors. The final tuning values and operating limits are summarized later in the Results Section so that the comparison between controllers can be presented clearly.
For the proposed IBC, the main advantage of NMPC is that the charging decision is not made from current error alone. Instead, the controller predicts whether the present charging action will violate voltage, SOC, temperature, or aging-related constraints in the future. This is important for battery management because a current command that is acceptable at the present time may become unsafe or inefficient as the pack voltage approaches its limit, as the internal temperature increases, or as the impedance changes with SOC and temperature.

2.7. EKF-Based Joint Estimation of SOC and Thermal State

Accurate battery state estimation is essential for battery-aware charging. SOC cannot be directly measured by a physical sensor, and the battery core temperature is normally not directly available in a production pack. Therefore, this study applies an EKF to estimate SOC and the internal thermal state from measurable signals such as pack current, pack voltage, and surface or coolant temperature. The EKF is suitable for this application because it extends the linear Kalman filter to nonlinear systems through local linearization [23,36,37,38].
The nonlinear discrete-time battery estimation model is expressed as
x k = f x k 1 , u k 1 + w k 1
y k = h x k , u k + v k
where x k is the EKF state vector, u k is the known input vector, y k is the measurement vector, w k is the process noise, and v k is the measurement noise. The process and measurement noises are assumed to be zero-mean with covariance matrices Qk and Rk, respectively. In this study, the EKF state vector is defined as
x k = [ S O C k , T c , k , Q g e n , k ] T
where SOCk is the battery state of charge, Tc,k is the battery core temperature, and Qgen,k is the estimated heat generation term. The known input vector is written as
u k = [ I b , k , T c o o l , k ] T
where Ib,k is the measured battery charging current and Tcool,k represents the coolant or ambient thermal boundary condition used in the battery thermal model. The measurement vector is selected as
y k = [ V b , k , T s , k ] T
where Vb,k is the measured pack terminal voltage and Ts,k is the measured or simulated battery surface temperature. If a surface-temperature sensor is not available, the EKF can still estimate SOC using voltage and current, but the thermal state becomes less observable and stronger model assumptions are required.
The EKF prediction step is given by
x ^ k | k 1 = f ( x ^ k 1 | k 1 , u k 1 )
P k | k 1 = A k P k 1 | k 1 A k T + Q k
where P is the state covariance matrix, Q is the process-noise covariance matrix, and
A k = f x x ^ k 1 | k 1 , u k 1
is the Jacobian matrix of the nonlinear state model. The measurement update is
K k = P k | k 1 H k T H k P k | k 1 H k T + R k 1
x ^ k | k = x ^ k | k 1 + K k y k y ^ k | k 1
P k | k = ( I K k H k ) P k | k 1
where R is the measurement-noise covariance matrix and
H k = h x x ^ k | k 1 , u k
H k is the Jacobian matrix of the measurement model.
In the proposed NMPC–EKF–LUT model, the EKF, LUT-based ECM parameter update, and NMPC optimizer are coupled through measured signals and estimated internal battery states, as shown in Figure 5. The measured battery voltage, charging current, surface temperature, and DC-link voltage are used by the EKF to estimate SOC, core temperature, and heat generation. The estimated SOC and core temperature are then used to update the LUT-based ECM parameters, including OCV, R0, R1, C1, R2, and C2. These updated parameters, together with the estimated states, measured signals, and operating constraints, are supplied to the NMPC optimizer to predict the future battery response and compute a feasible charging current or duty-related command. The command is converted by the PWM generation block into switching signals for the bidirectional DC–DC converter. This estimation–control integration enables the charger model to account for internal battery state variation and operating-condition-dependent parameters, instead of relying only on measured terminal voltage and current feedback.

2.8. 3-D Finite Element Method for Induction Motor Thermal Model

In the proposed IBC, the stator windings of a three-phase induction motor are used as part of the grid-connected AC-DC charging stage. Although the motor is not used to produce traction torque during charging, the stator windings still conduct current and therefore generate heat. The motor thermal condition is important because the IBC concept shares hardware between traction and charging. If the motor has been operated at high load before charging, the initial temperature of the stator, rotor, and housing may already be elevated. For this reason, a 3-D FEM thermal assessment is included to evaluate whether the stator-assisted charging operation produces acceptable temperature rise under two cases: charging from an initially cool motor and charging after a one-hour full-load motor operation [39,40].
The transient heat conduction problem in a solid domain is governed by [41,42]
ρ c p T t = k T + q ˙
where ρ is material density, c p is specific heat capacity, T is temperature, k is thermal conductivity, and q ˙ is volumetric heat generation.
The heat generation term is obtained from electromagnetic or circuit-derived losses [43]. These losses are then distributed over the corresponding motor regions, such as stator windings, stator core, rotor core, rotor bars, and housing interfaces.
For boundary surfaces exposed to air or cooling flow, the convective boundary condition is
k T n = h ( T s T a m b )
where h is the convective heat transfer coefficient, T s is surface temperature, and T a m b is ambient temperature. Radiation may be included as
k T n = h ( T s T a m b ) + ε σ T s 4 T a m b 4
where ε is surface emissivity and σ is the Stefan–Boltzmann constant. In this study, convection is the primary boundary mechanism, while radiation can be included as an optional refinement if the motor surface temperature becomes high.
The internal heat source of the induction motor is calculated from the electrical losses of the motor. In the charging mode, the stator winding is used as an inductive element in the AC-DC stage. Therefore, the most direct heat source is the stator copper loss:
P c u , s = 3 I p h , r m s 2 R s
where I p h , r m s is the RMS current through each stator phase and R s is the temperature-dependent stator phase resistance.
When the charging current produces significant alternating magnetic flux in the motor core, iron losses should also be included. A simplified Steinmetz-type expression may be used:
P f e = k h f B p k β + k e f 2 B p k 2
where k h and k e are hysteresis and eddy-current coefficients, f is frequency, B p k is peak flux density, and β is a material-dependent exponent. If electromagnetic FEM is available, the iron loss density can be imported directly into the thermal FEM model.
For conventional motoring operation, rotor copper loss and mechanical loss may be estimated using the induction motor equivalent circuit:
P a g = 3 I 2 2 R 2 s
P c u , r = 3 I 2 2 R 2
P m e c h = ( 1 s ) P a g P r o t , l o s s
where I 2 is the rotor current referred to the stator side, R 2 is the referred rotor resistance, and s is slip. During stationary charging operation, the actual rotor loss depends on the selected IBC winding connection, magnetic coupling, and whether the charging control suppresses torque-producing fields. Therefore, rotor heat sources should either be obtained from electromagnetic simulation or bounded using conservative assumptions.
The total motor heat source used in the thermal FEM is
q ˙ t o t a l = q ˙ c u , s + q ˙ f e , s + q ˙ c u , r + q ˙ a d d i t i o n a l
The final 3-D thermal FEM simulation therefore uses the loss-to-volume mapping:
q ˙ j = P j V j ,     j { stator   winding ,   stator   core ,   rotor }

3. Results

This section presents the simulation results of the charging circuits and electric motor evaluated under various predefined operational scenarios. The integrated simulation framework was developed using MATLAB and Simulink, coupling the electrical performance model with a finite element method (FEM)-based thermal model. The following subsections detail the conventional procedures, dynamic responses, high initial conditions and temperature distributions obtained from each scenario.

3.1. Simulation Architecture and Evaluation Protocol

The proposed integrated battery charger (IBC) was evaluated for a single-phase electric-vehicle charging architecture in which the stator windings of a three-phase 90 kW induction motor are used as part of the charging power path. The front-end AC-DC stage was implemented as a bridgeless totem-pole power-factor-correction (BLTP-PFC) converter, while the downstream DC-DC stage was configured as a bidirectional buck–boost converter connected to a 400 V, 48 kWh Li-ion LFP battery pack. Two grid-limited charging ratings were investigated: 7 kW at 230 V/32 A and 22 kW at 230 V/96 A. The DC-DC charging controller was evaluated using two strategies: a conventional double-loop PI controller and the proposed NMPC + EKF + LUT framework.
The evaluation was divided into three groups. First, average-model simulations were used to establish the constant-current charging baseline and to evaluate battery-management scenarios. Second, switching-model simulations were used to evaluate dynamic constraint response under step-current commands and grid-voltage sag. Third, the average model was used to evaluate operating in high-initial-SOC and high-ambient-temperature conditions. The three-dimensional finite element method (FEM) simulations were used to quantify the temperature distribution inside the induction motor during charging-only operation, full-load motor operation, and charging immediately after one hour of full-load motor operation.
Five operating scenarios were applied to both controller configurations, as summarized in Table 3.
The principal circuit and control parameters are listed in Table 4, Table 5, Table 6 and Table 7. The public data for the battery pack utilized in this study specifies pack-level parameters, including the nominal capacity, chemistry, and 400 V architecture. However, internal topologies, open-circuit voltage (OCV) lookup tables (LUTs), impedance LUTs, and detailed thermal networks are not publicly disclosed by the manufacturer. Consequently, the equivalent circuit model (ECM) and thermal parameters used herein were derived via engineering estimations based on commercial Lithium Iron Phosphate (LFP) cell data and further calibrated for the simulation environment. These values represent synthesized engineering data rather than the manufacturer’s proprietary information [44].
To improve transparency of the implemented ECM/LUT data, the battery parameters used in this simulation are separated into three levels. First, the public battery information is used only to define the cell chemistry, nominal cell voltage, cell capacity, series–parallel configuration, and pack-level specification summarized in Table 5. Second, the OCV–SOC profile implemented in the control-oriented battery model is reported explicitly in Table 7. Third, the impedance and thermal parameters used by the second-order ECM and thermal network are summarized as pack-level synthesized parameters in Table 6. Therefore, Table 5, Table 6 and Table 7 should be interpreted together as the implemented battery data set for the simulation study, rather than as a complete manufacturer characterization data set.
The SOC window from 20% to 80% was selected as a representative charging range for evaluating the control performance of the proposed IBC system. This range avoids the strongly nonlinear low-SOC and high-SOC regions, where voltage limits, resistance variation, and aging-related constraints become more dominant [1,4]. The selected window also reduces the influence of extreme OCV curvature and impedance variation near the SOC boundaries, allowing the comparison to focus on feasible current regulation, state estimation, and constraint handling [19,21]. In this study, the objective is to compare the baseline PI controller and the proposed NMPC–EKF–LUT controller within the main usable SOC region, rather than to design a complete commercial 0–100% charging protocol.
Although the dynamic charging simulations are evaluated over the 20–80% SOC window, the implemented OCV–SOC LUT covers the full 0–100% SOC range, as listed in Table 7. This full-range LUT is used to represent the nonlinear OCV behavior outside the selected evaluation window and to support additional high-SOC verification cases. Therefore, the 20–80% range should be interpreted as the selected control-performance evaluation window, while the underlying LUT-based battery model remains defined over the full SOC range.
At the simulation level, the implemented ECM/LUT data are verified using the terminal-voltage response, SOC trajectory, and EKF estimation errors obtained from the charging scenarios. The voltage response is used to confirm that the synthesized OCV and impedance parameters produce a physically consistent 400 V LFP pack behavior during constant-current charging. The EKF-based SOC and core-temperature estimation errors are used to verify that the battery model provides sufficient state information for the proposed NMPC–EKF–LUT controller comparison.
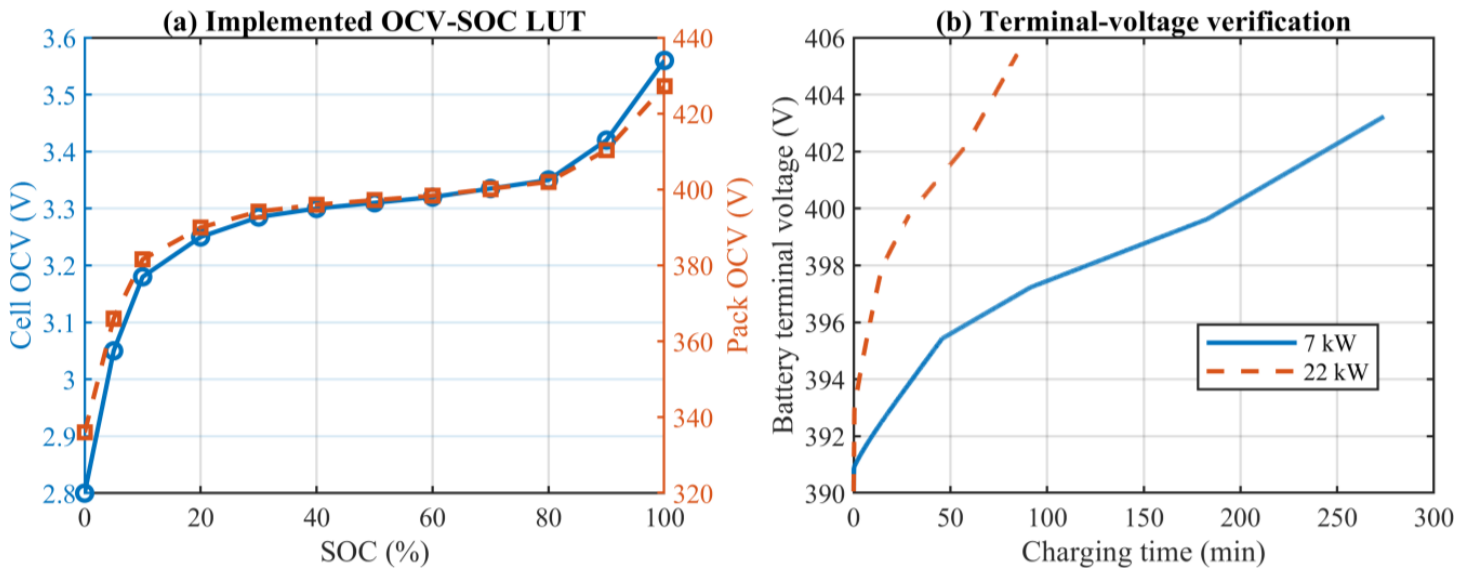
To verify the implemented ECM/LUT data used in the control-oriented LFP battery model, the OCV–SOC profile and terminal-voltage response were examined, as shown in Figure 6. The implemented OCV–SOC curve reflects the characteristic voltage plateau of an LFP cell, while the simulated terminal-voltage responses under 7 kW and 22 kW charging increase smoothly within the expected operating range of the 400 V-class battery pack. This verification confirms that the synthesized OCV and ECM parameters provide physically consistent voltage behavior for the subsequent controller-comparison study.
The EKF configuration used for battery state estimation in the simulation is summarized in Table 8. The table reports the estimated states, known inputs, measured outputs, covariance matrices, initial conditions, sampling time, and estimation-error indicators used to evaluate the estimator. This information complements the EKF formulation in Section 2.7 and clarifies the numerical implementation of the NMPC–EKF–LUT framework.
The implemented ECM/LUT data and their identification basis are summarized in Table 9. The table distinguishes between publicly available battery specifications, implemented OCV–SOC data, synthesized ECM and thermal parameters, and simulation-level verification outputs. This clarification is provided to ensure that the battery model used in this study is interpreted as a control-oriented simulation model rather than proprietary manufacturer characterization data.
The PI controller settings used for the baseline comparison are summarized in Table 10. The PI controller was tuned using the same converter parameters, battery model, operating limits, and test scenarios as the proposed NMPC–EKF–LUT controller. The tuning was performed by first stabilizing the inner current loops and then adjusting the outer voltage loops to avoid interaction with the faster inner-loop dynamics. The same current, voltage, and duty-cycle saturation limits were applied to both controllers to ensure a consistent comparison.

3.2. Normal-Charging Baseline

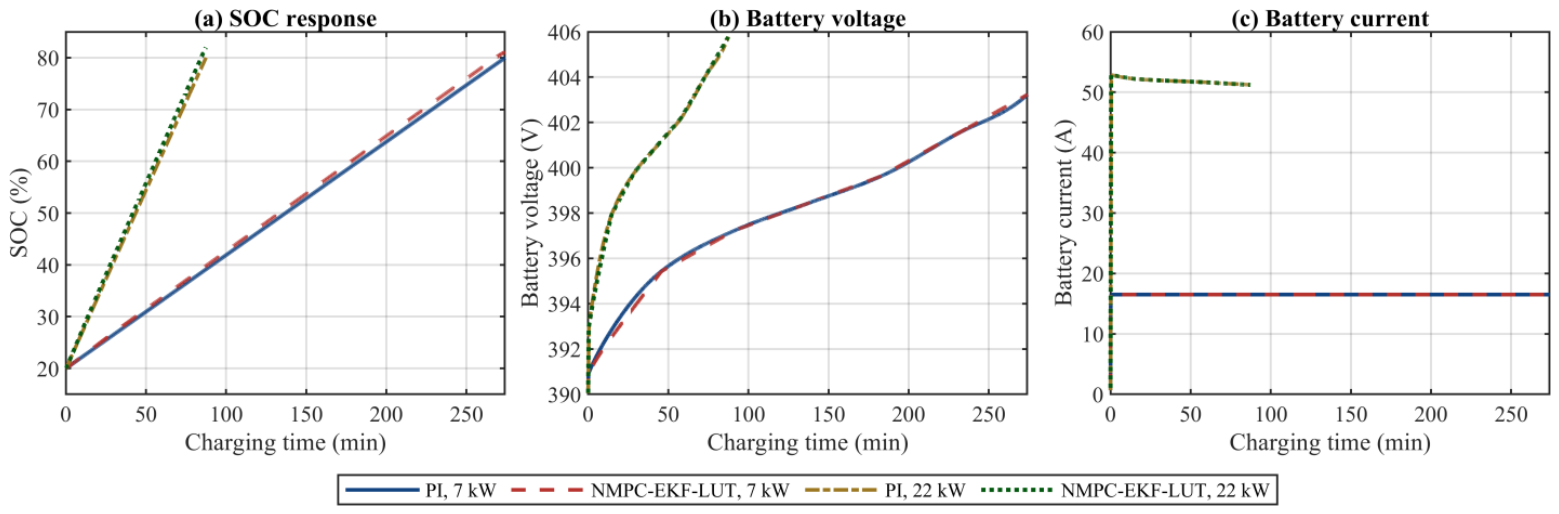
Figure 7 summarizes the normal-charging response of the proposed IBC system under 7 kW and 22 kW constant-current charging conditions. For both the baseline PI controller and the proposed NMPC–EKF–LUT controller, the battery SOC increases nearly linearly from 20% to 80%. The target SOC is reached after approximately 275 min in the 7 kW case and approximately 90 min in the 22 W case. The shorter charging duration in the 22 kW case is consistent with the higher charging current.
The battery terminal voltage increases smoothly from approximately 391 V to 403 V in the 7 kW case and from approximately 393 V to 406 V in the 22 kW case, reflecting the normal-charging behavior of the LFP battery pack. The battery current remains close to the constant-current reference values of approximately 17 A and 52 A for the 7 kW and 22 kW operating modes, respectively. The PI and NMPC–EKF–LUT responses are very similar under this nominal condition because the requested charging current remains feasible and the voltage, current, SOC, and thermal constraints are not strongly activated.
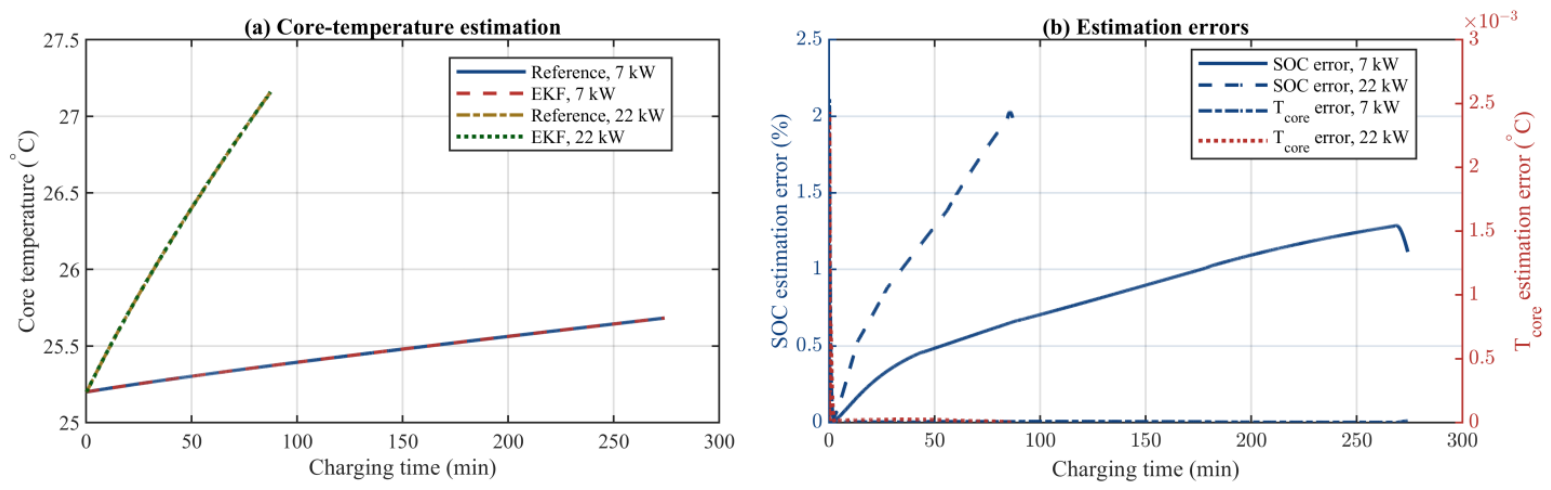
Figure 8 verifies the EKF-based battery state estimation performance of the proposed controller. The estimated SOC and core temperature closely follow the corresponding reference states for both charging powers. The estimated core temperature remains below 27.5 °C, which is significantly lower than the imposed 45 °C thermal limit. The SOC estimation error remains bounded, with maximum values of approximately 1.3% and 2.0% for the 7 kW and 22 kW cases, respectively, while the core-temperature estimation error rapidly converges to a near-zero value. These results indicate that the EKF provides sufficiently accurate internal battery state information for the NMPC constraint layer.

3.3. Dynamic Constraint Response

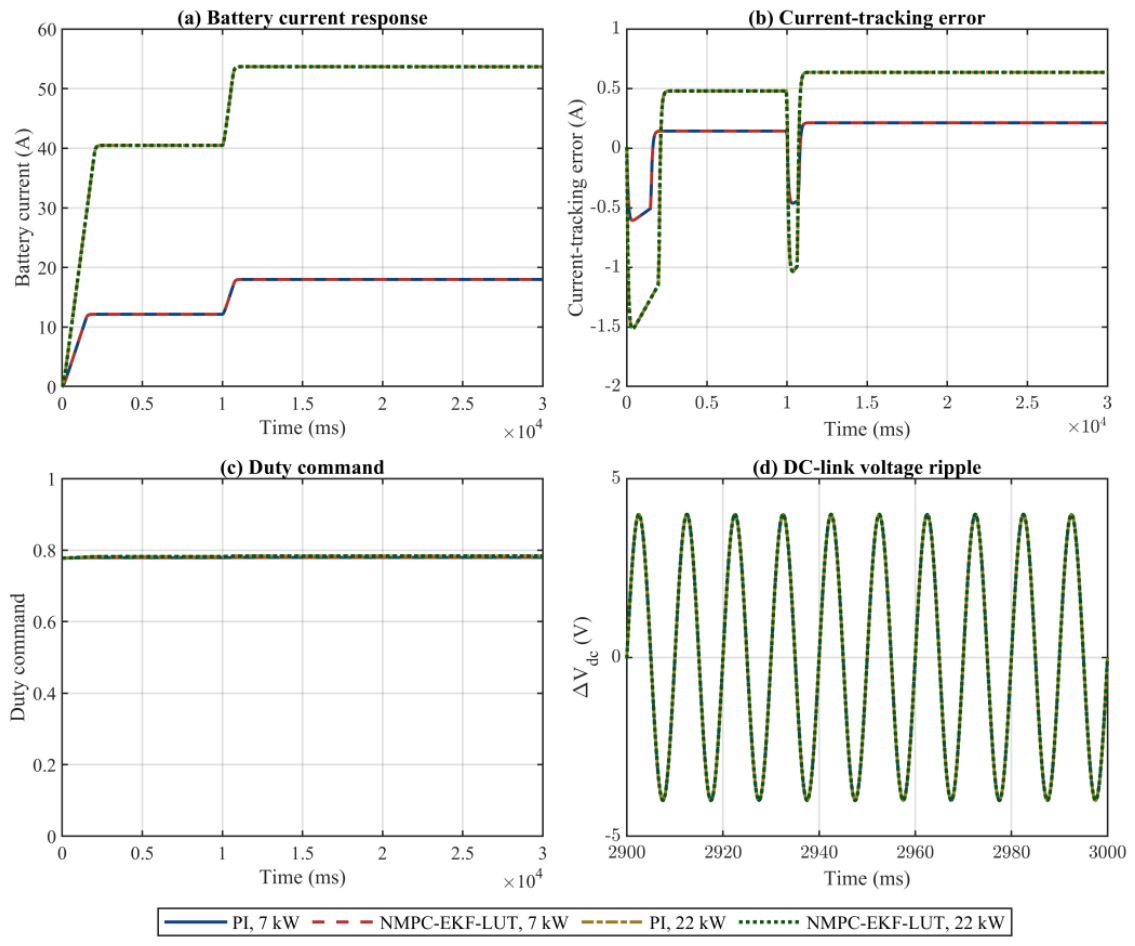
The step-current scenario was used to evaluate the transient response of the charging system when the demanded battery current is increased during operation. As shown in Figure 9, both the baseline PI controller and the proposed NMPC–EKF–LUT controller exhibit stable current transitions under the 7 kW and 22 kW operating conditions. The battery current increases from approximately 12 A to 18 A in the 7 kW case and from approximately 40 A to 54 A in the 22 kW case. The corresponding current-tracking errors remain bounded, while the duty command stays within the allowable range.
The switching-model results in Figure 9 show that the PI and NMPC–EKF–LUT responses are very similar under the step-current condition. This similarity is expected because both controllers are evaluated using the same converter parameters, current limits, duty-cycle limits, and final feasible current schedule. The maximum current-tracking errors are approximately 0.6055 A and 1.5139 A for the 7 kW and 22 kW cases, respectively. Therefore, the step-current test is interpreted primarily as a validation of transient electrical feasibility and current-tracking stability, rather than as the sole evidence of controller superiority.
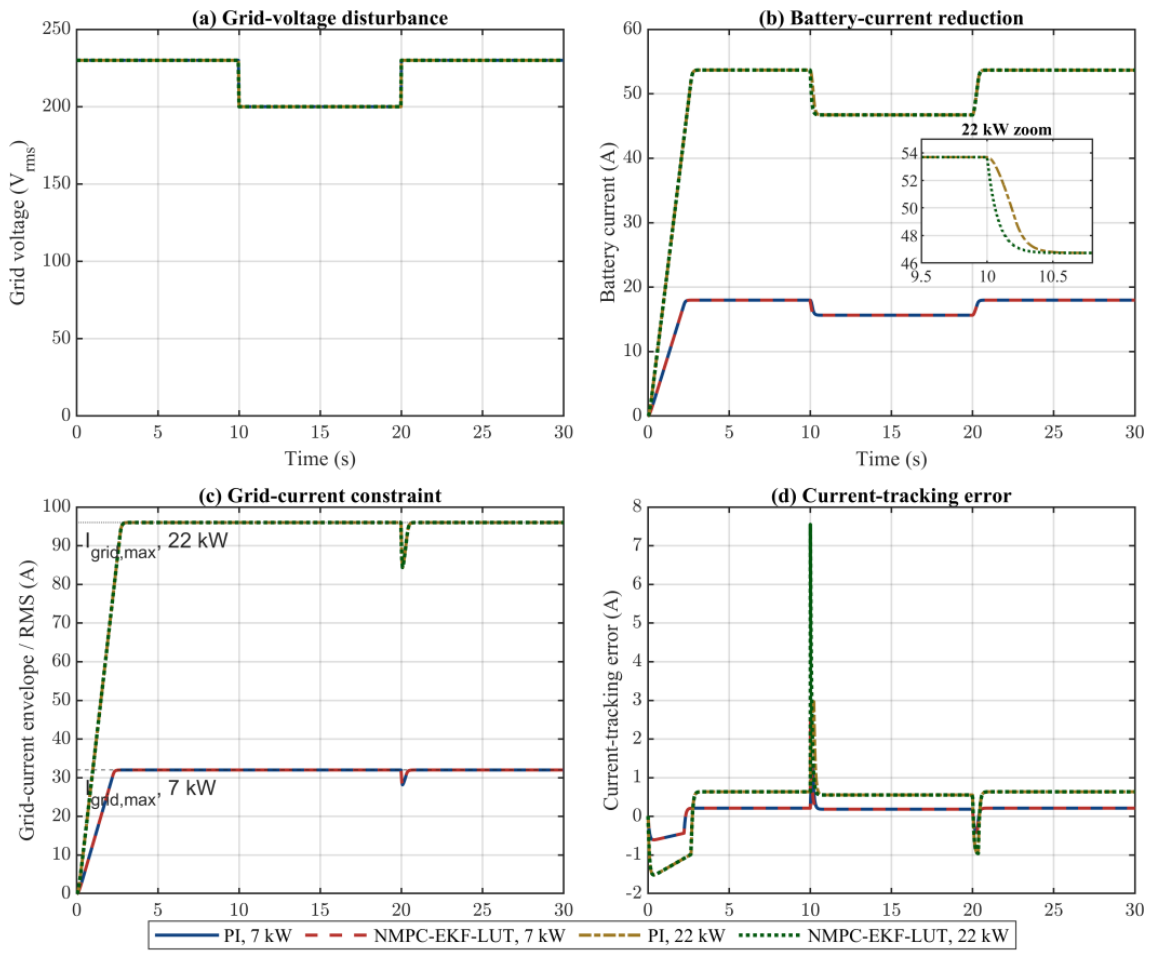
The grid-voltage-drop scenario was used to test input-constraint enforcement under reduced available grid-side power. As shown in Figure 10a, the grid voltage is reduced from 230 V to 200 V during the disturbance interval. Because the allowable grid current is limited, the charging current must be reduced to avoid exceeding the grid-side current constraint. Figure 10b shows that the battery current decreases during the voltage-drop interval and returns to its nominal level after the grid voltage recovers. The inset in Figure 10b highlights the current-reduction behavior in the 22 kW case.
Figure 10c shows that the grid-current envelope remains within the intended current-limited region for both charging-power levels. The 7 kW case operates near the 32 A grid-current limit, whereas the 22 kW case operates near the 96 A limit. The current-tracking error in Figure 10d increases mainly during the disturbance transitions at approximately 10 s and 20 s, reflecting the temporary adjustment of the feasible charging current command. The larger transient error in the 22 kW case is associated with the higher charging current and stronger input-power constraint during the voltage drop.
Overall, the dynamic tests indicate that the proposed NMPC–EKF–LUT controller and the baseline PI controller provide similar switching-level behavior when the same feasible current trajectory and converter constraints are applied. The main implication of the grid-voltage-drop case is that the charging command must be adjusted when the available input power decreases. Therefore, this scenario supports the importance of explicit input-power and grid-current constraints in the proposed charging-control framework.

3.4. Battery-Management-Oriented Scenarios

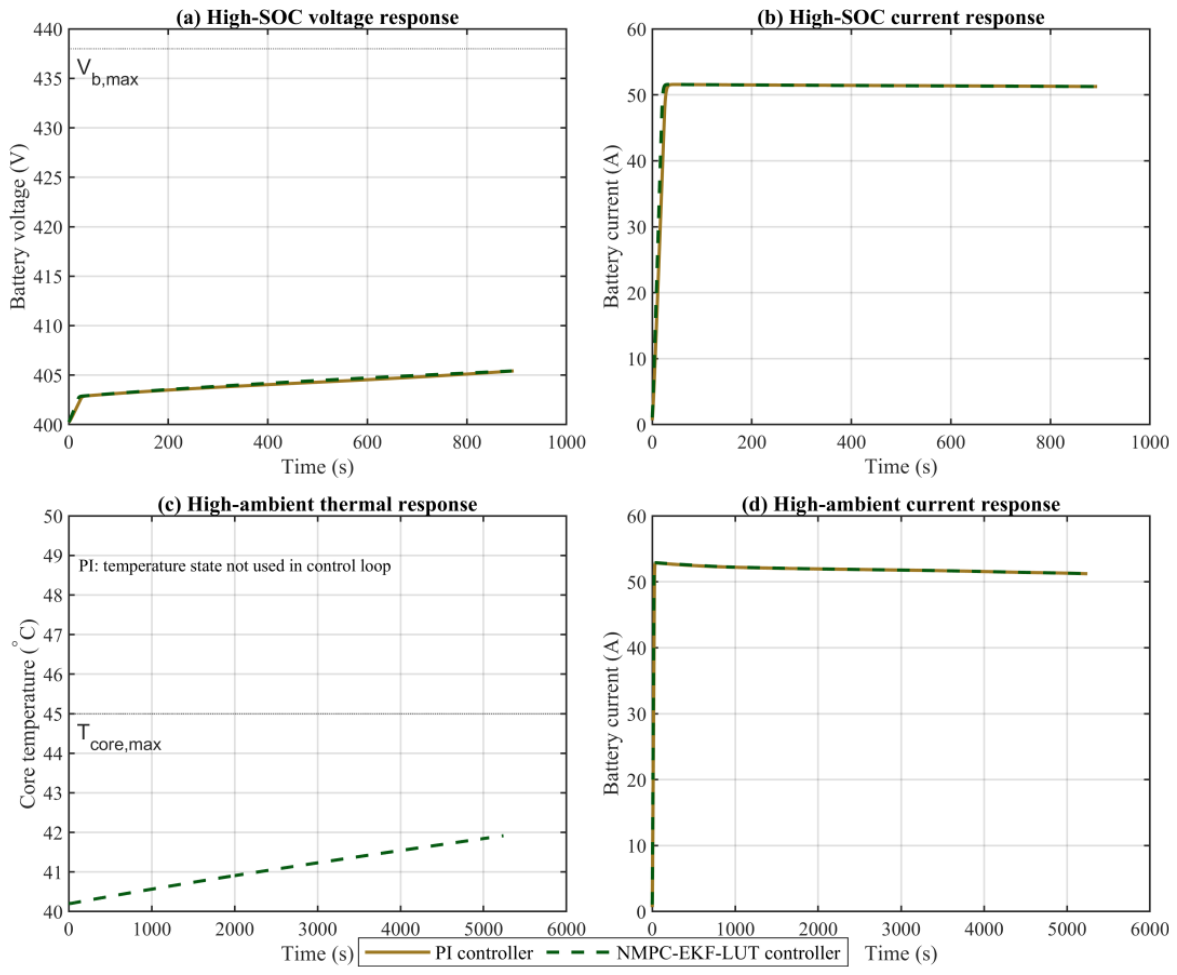
Figure 11 summarizes the battery-management-oriented scenarios under high-initial-SOC and high-ambient-temperature conditions. The high-initial-SOC scenario was included to examine the effect of a higher initial battery voltage on the charging process. As shown in Figure 11a, the battery terminal voltage increases gradually from approximately 400 V to 405 V and remains well below the imposed maximum voltage limit of 438 V. The corresponding battery-current response in Figure 11b remains close to the commanded charging current level for both the baseline PI controller and the proposed NMPC–EKF–LUT controller. This indicates that the high-initial-SOC condition does not activate strong voltage-limiting action within the simulated operating window.
The high-ambient-temperature scenario was included to evaluate the thermal constraint behavior of the proposed controller. As shown in Figure 11c, the NMPC–EKF–LUT controller monitors the estimated battery core temperature and keeps it below the imposed thermal limit of 45 °C. The core temperature increases gradually from approximately 40 °C to below 42 °C during the simulated interval. The PI controller does not use temperature feedback or thermal-state estimation in its control loop. Figure 11d shows that the battery current remains close to the nominal charging level for both controllers, with only a slight reduction during the high-temperature case.
These results indicate that the tested high-SOC and high-ambient-temperature scenarios remain within the imposed voltage and thermal constraints. Therefore, severe voltage limiting or thermal derating is not activated in the short-duration simulation. The results should be interpreted as battery-constraint verification cases rather than as evidence of strong controller separation. A more pronounced difference between the PI controller and the proposed NMPC–EKF–LUT controller is expected under longer-duration charging, higher-power operation, or conditions closer to the voltage and thermal limits.
To consolidate the results after reducing repeated figures, the main performance outcomes of the baseline PI controller and the proposed NMPC–EKF–LUT controller are summarized in Table 11. The comparison includes normal-charging behavior, EKF estimation accuracy, step-current response, grid-voltage-drop response, and battery-management-oriented scenarios. The purpose of this table is not to claim that the proposed controller outperforms the PI controller in every output variable. Instead, it clarifies which responses are mainly determined by the converter hardware and feasible current command and which responses benefit from the proposed constraint-aware supervisory control structure.
Under nominal constant-current charging, both controllers produce similar SOC, voltage, and current responses because the requested charging current remains feasible and the battery constraints are not strongly activated. The main distinction of the proposed NMPC–EKF–LUT controller is its ability to use EKF-estimated internal states, SOC- and temperature-dependent ECM parameters, and explicit voltage, current, SOC, input-power, and thermal constraints. Therefore, the proposed method is most relevant under constraint-sensitive operating conditions, such as grid-voltage reduction, high initial SOC, elevated ambient temperature, or operation near battery voltage and thermal limits.
Table 11 shows that the PI controller and the proposed NMPC–EKF–LUT controller provide similar responses in nominal charging and short-duration switching tests. This result is expected because these cases do not strongly activate the voltage, SOC, or thermal constraint layers. Therefore, the similarity in SOC progression, current regulation, duty command, and DC-link ripple should not be interpreted as a weakness of the proposed method. Instead, it indicates that both controllers are electrically feasible under the same converter and operating conditions.
The main benefit of the proposed controller is observed at the supervisory battery-management level. The NMPC–EKF–LUT framework incorporates estimated SOC and thermal states, LUT-updated ECM parameters, and explicit operating constraints into the charging-command calculation. This structure provides a clearer mechanism for handling grid-side input limits, battery voltage limits, SOC boundaries, and thermal constraints than the baseline PI controller, which relies mainly on local voltage/current loops and external limiter logic.

3.5. FEM-Based Motor Thermal Assessment

The exported grid current was further used for the FEM-based thermal evaluation of the induction motor stator-assisted charging path. Two thermal cases were considered: charging from an initially cool motor and charging after one hour of full-load motor operation. The first case represents a parked vehicle that begins charging without prior traction operation. The second case represents a more severe condition in which residual heat from driving affects the motor temperature at the start of charging.
The control simulation and the motor thermal simulation are connected at the power-loss level. The Simulink charger model provides voltage, current, duty command, SOC, and battery thermal states. The induction motor thermal FEM uses the motor phase-current information and per-phase equivalent circuit parameters to compute heat sources in the motor regions. FEM-based analysis is suitable for evaluating induction motor thermal behavior and spatial temperature distribution [46]. This separation is computationally efficient because the NMPC + EKF charging simulation can be performed in MATLAB/Simulink, while the detailed 3-D thermal distribution of the motor can be evaluated in FEM software MATLAB R2024a using selected operating points or time-series loss inputs. The heat-transfer formulation and boundary-condition treatment follow conventional thermal-analysis principles and electric-machine thermal modeling approaches [47,48]. The coupled thermal-FEM modeling procedure is also consistent with recent conjugate heat-transfer analysis of induction motors [48]. The thermal-model simulation parameters of the three-phase induction motor are listed in Table 12.
The thermal simulation of the electric motor was evaluated under two distinct operating conditions to ensure accuracy. In the idle state (non-operational), cooling is governed by natural convection [49], where the heat transfer coefficient accounts for buoyancy-driven ambient air movement. Conversely, during the operational state (running), forced convection is applied [47]. In this state, a significantly higher convection coefficient is implemented to simulate the active airflow generated by the rotor rotation and the enclosed fan cooling.
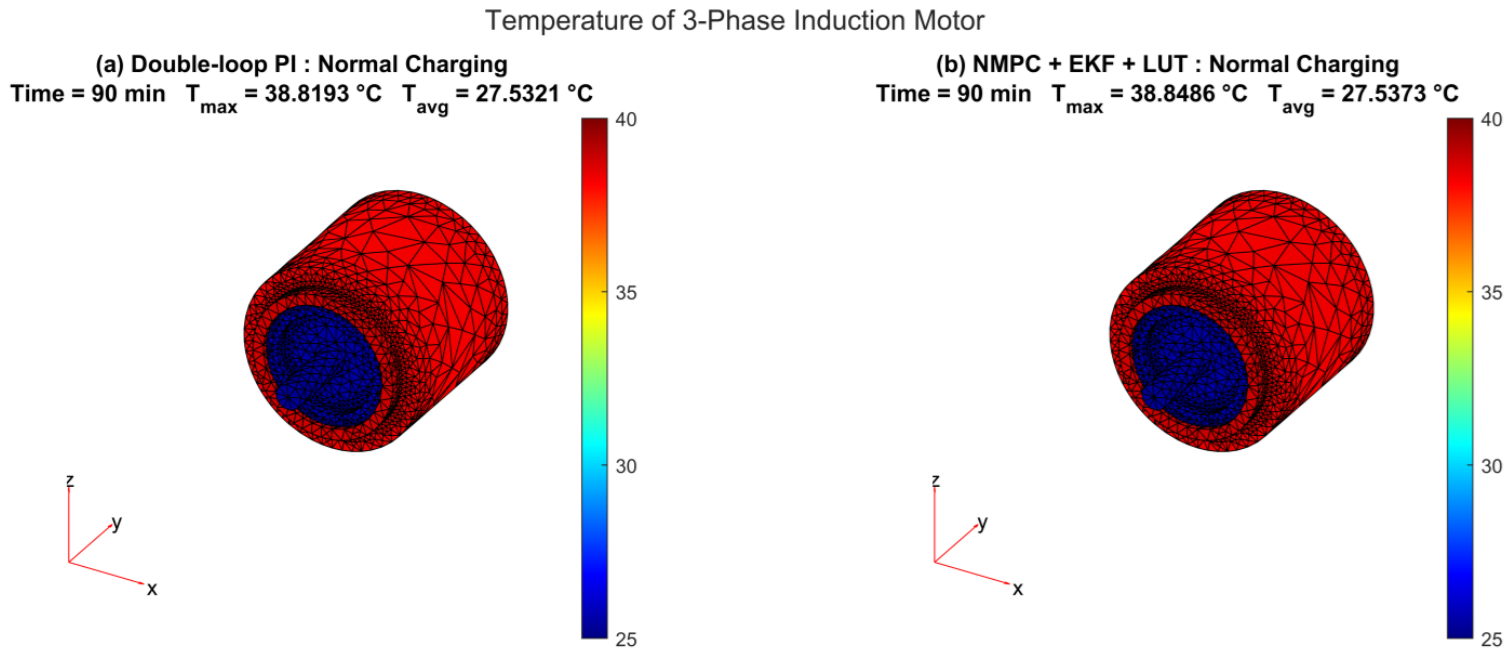
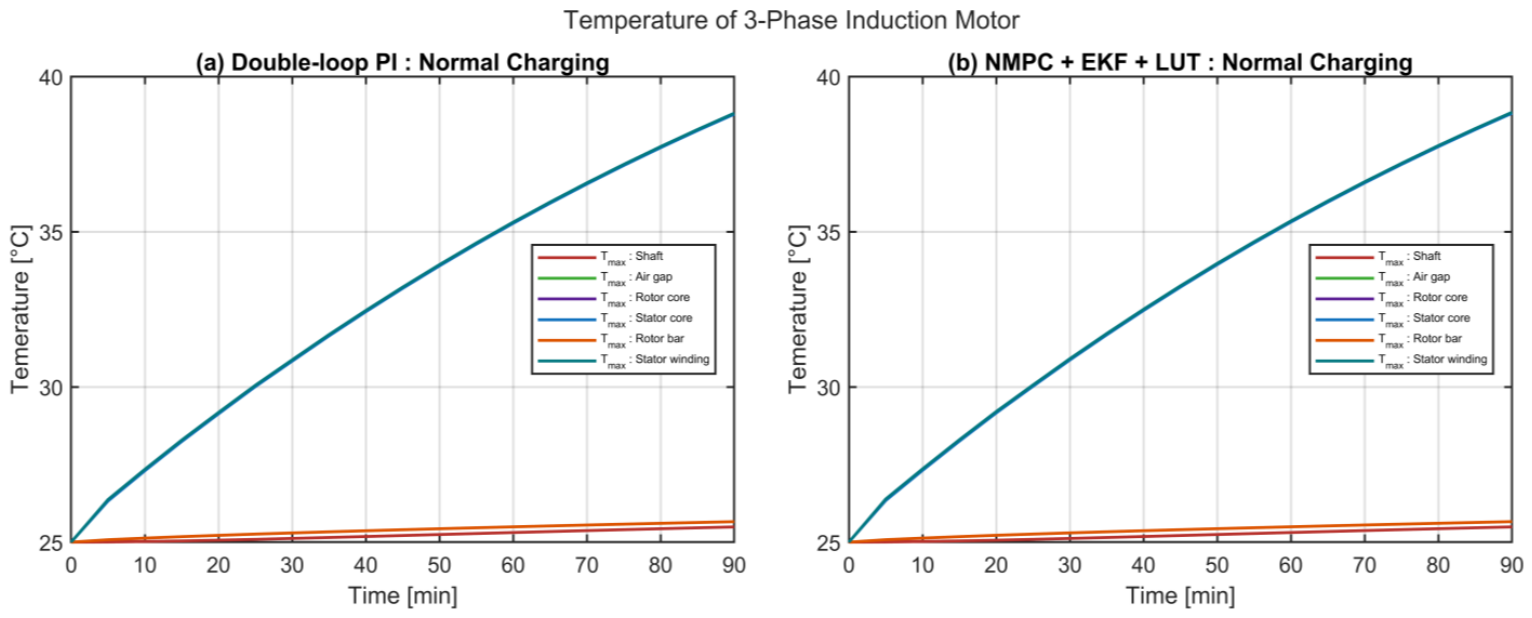
In the charging-only condition, shown in Figure 12, the stator temperature remains below the selected thermal limits of 27.39 °C and 38.8 °C for both the 7 kW and 22 kW operating cases. Figure 13 presents the maximum temperatures within the three-phase induction motor as functions of time for each control strategy under the charging-only condition. The results illustrate the transient thermal responses of the motor components during the charging process and enable a direct comparison of the temperature variations obtained using the double-loop PI and NMPC-based control methods.
The hot-spot region is expected to occur near the winding and slot region where copper loss is concentrated. In the post-full-load condition, the initial motor temperature is higher, and the temperature margin is reduced. However, the FEM results show that the charging current profile does not produce an immediate thermal violation under the investigated operating assumptions.
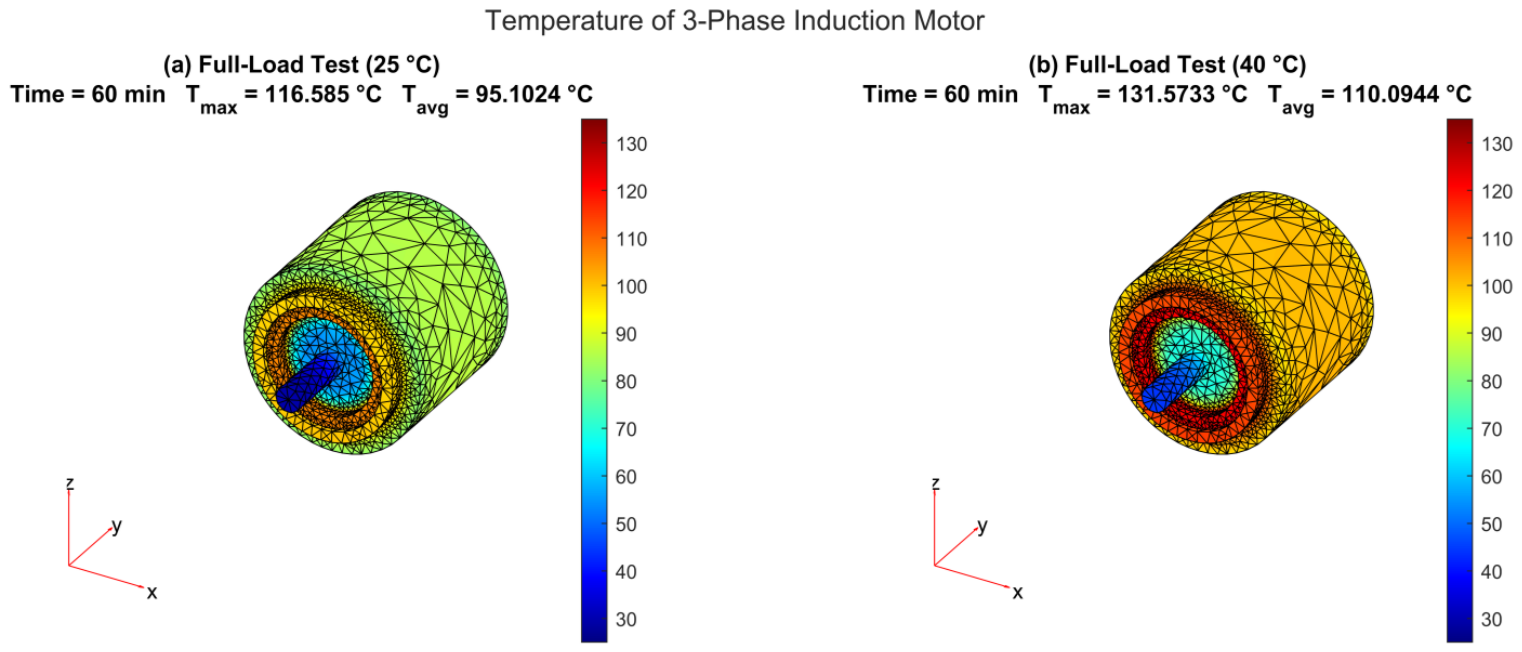
To evaluate the thermal characteristics, the electric motor was subjected to a continuous full-load operation for 1 h, ensuring that the system reached thermal equilibrium. The resulting temperature rise (∆T) within the stator windings was validated against the specified insulation class standards (e.g., IEC 60034-1/NEMA MG-1 [50,51]). For a Class F insulation system, the maximum allowable temperature rise is limited to 105 °K above a standard 40 °C ambient temperature. Figure 14 shows the temperature distribution after one hour of full-load induction motor operation. For an initial temperature of 25 °C, the maximum and average motor temperatures reached 116.59 °C and 95.10 °C, respectively. For an initial temperature of 40 °C, the corresponding values increased to 131.57 °C and 110.09 °C. The simulated thermal results indicate that the predicted temperature and maximum temperature rise are well within the limits specified by the insulation class standards. Consequently, the thermal model and its assigned boundary conditions are validated. The full-load case therefore establishes a much more severe thermal initial condition for subsequent IBC operation than charging-only operation.
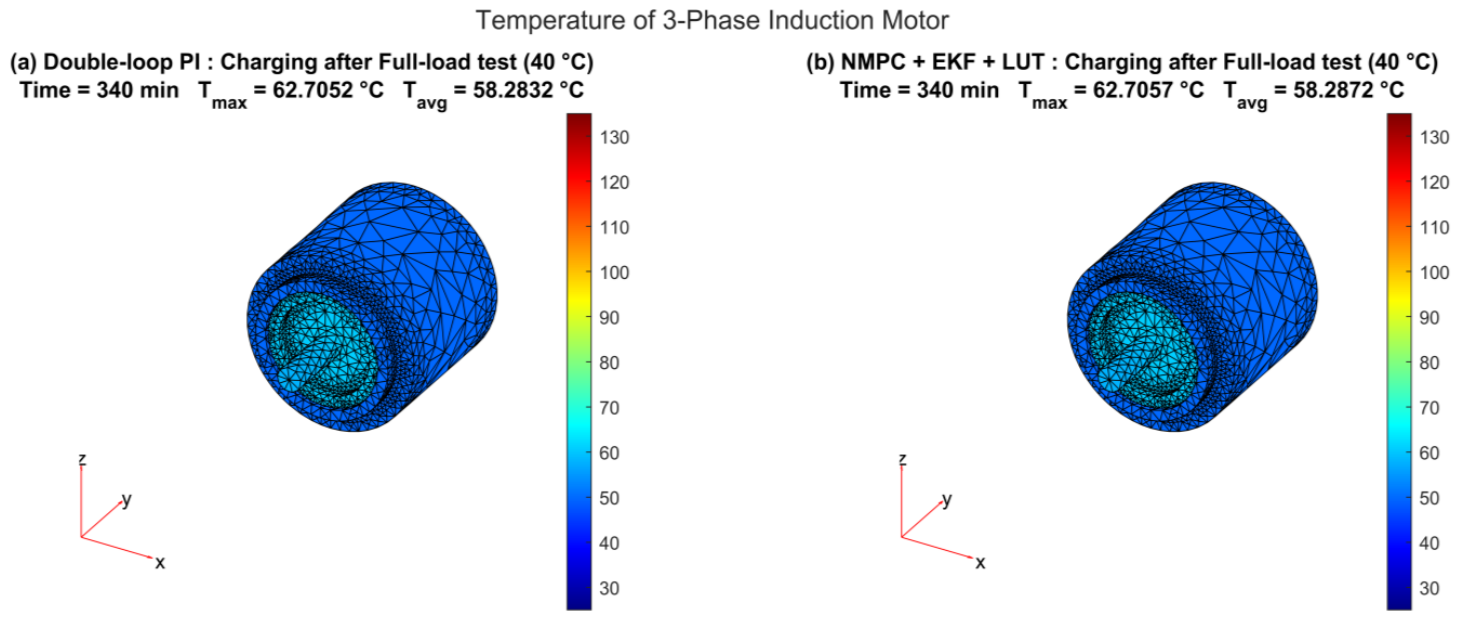
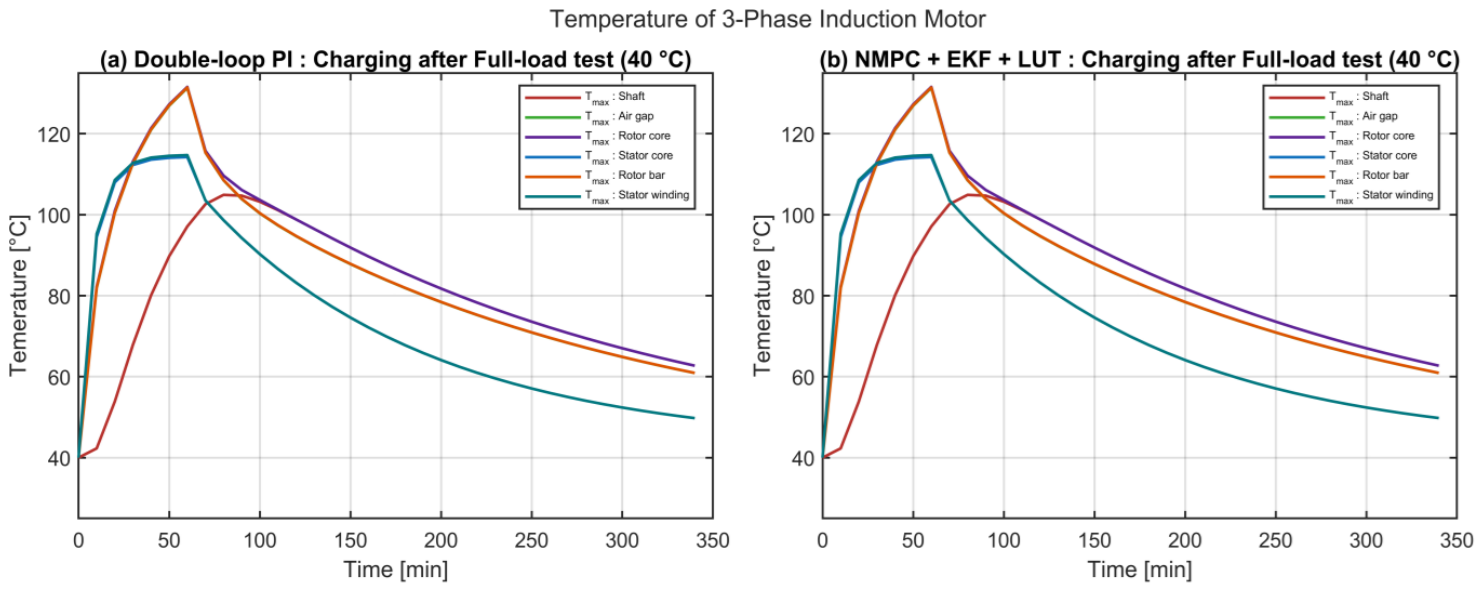
Figure 15 shows the most critical practical case, in which charging begins after one hour of full-load motor operation. The FEM results show that the motor temperature during this condition is dominated by residual thermal energy from the preceding propulsion operation. For 7 kW charging after full-load operation, the PI-controlled case reached 62.7052 °C at 40 °C initial temperature. The NMPC + EKF + LUT cases reached 62.7057 °C, respectively, at the reported terminal times shown in Figure 16.
At the beginning of the charging process, all motor components exhibit elevated temperatures due to residual heat accumulated during the preceding propulsion operation. The rotor bar experiences the highest temperature rise, reaching a peak temperature of approximately 131.57 °C at around 60 min. Similarly, the rotor core temperature increases to approximately 131.57 °C, while the stator winding and stator core reach peak temperatures of approximately 114.72 °C and 114.24 °C, respectively. The shaft temperature increases more gradually and reaches a maximum value of approximately 104.89 °C.
Following the peak thermal condition, all component temperatures decrease continuously as heat is dissipated to the surrounding environment. After approximately 340 min, the temperatures of the rotor bar, rotor core, stator winding, and shaft decrease to approximately 60.92 °C, 62.71 °C, 49.78 °C, and 62.71 °C, respectively, indicating substantial thermal recovery during the charging process.
A comparison between Figure 15a and Figure 15b shows that both control strategies produce nearly identical temperature distributions and cooling trends. The peak temperatures, thermal time constants, and temperature decay characteristics remain very similar throughout the charging period. This indicates that, for the simulated post-run thermal dataset, the final motor temperature is more strongly governed by the initial thermal state, cooling interval, and charging duration than by the small difference between the two DC-DC charging controllers.
Table 13 summarizes the FEM-based thermal assessment of the induction motor under charging-only operation, full-load motor operation, and post-full-load charging scenarios. The purpose of this table is to evaluate the motor thermal feasibility of the stator-assisted IBC charging path rather than to demonstrate direct thermal superiority of the proposed controller.
Under charging-only operation, the maximum motor temperature remains low for both controllers. The 7 kW case reaches approximately 27.39 °C, while the 22 kW case reaches approximately 38.82–38.85 °C. The PI and NMPC–EKF–LUT results are nearly identical because both controllers generate similar feasible charging current profiles under the tested conditions. Therefore, the implication of this table is that the proposed controller does not introduce additional motor thermal stress compared with the PI controller.
The highest temperatures occur during full-load motor operation and post-full-load charging. This indicates that the motor thermal response is dominated by the initial temperature, residual heat from prior traction operation, cooling condition, and charging duration. The 22 kW post-full-load charging case with a 40 °C initial condition is the most critical charging-related condition, reaching approximately 92.32 °C. These results confirm that the thermal history of the traction motor must be considered when assessing induction motor-based IBC systems.

3.6. Engineering-Oriented Verification and Practical Implementation Considerations

Based on the preceding electrical, battery-management, and motor-thermal results, an engineering-oriented verification summary is provided to clarify the practical relevance and validation boundary of the proposed IBC system. Because a hardware prototype or hardware-in-the-loop platform is not included in the present version of this study, the verification presented here should be interpreted as simulation-based engineering verification rather than experimental validation.
The verification is organized around the main practical requirements of an integrated EV charger, including converter transient feasibility, grid-current compliance, battery voltage and current constraints, DC-link regulation, duty-command feasibility, battery thermal-limit monitoring, motor thermal feasibility, sensor requirements, and real-time implementation considerations. These verification items are summarized in Table 14.
The switching-level simulations verify that the selected converter parameters can implement the required charging current commands. In the step-current case, the battery current, current-tracking error, duty command, and DC-link voltage ripple remain bounded, indicating transient electrical feasibility of the converter-level implementation. In the grid-voltage-drop case, the charging current is reduced during the voltage disturbance so that the grid-current envelope remains within the intended current-limited region. These results support the use of input-power and grid-current constraints in the charging-control framework.
The battery-side verification is based on the imposed voltage, current, SOC, and thermal constraints. The normal-charging and high-initial-SOC scenarios confirm that the battery terminal voltage remains below the maximum pack-voltage limit. The high-ambient-temperature scenario verifies that the proposed NMPC–EKF–LUT controller can monitor the estimated core temperature and maintain operation below the imposed thermal limit under the tested short-duration condition. Severe thermal derating is not activated in this case because the simulated temperature remains below the constraint boundary.
The motor-side verification is provided by the FEM-based thermal analysis in Section 3.5. This analysis is included because the proposed IBC concept reuses the induction motor stator winding as part of the charging current path. The FEM results should be interpreted as a thermal feasibility check of the investigated charging scenarios, not as experimental motor-temperature validation. The charging-only cases remain within the investigated thermal boundaries, while the post-full-load operating condition is identified as the more critical motor thermal design case because of residual motor heat and elevated initial temperature.
From an implementation perspective, the proposed controller requires measurable battery voltage, battery current, surface or coolant temperature, DC-link voltage, and grid-current information. These signals are compatible with typical charger and battery-management sensing requirements. The EKF uses the measured voltage, current, and temperature-related signals to estimate internal SOC and thermal states, while the NMPC uses these estimated states and LUT-updated ECM parameters to compute a feasible charging command.
The real-time implementation of the proposed NMPC–EKF–LUT controller is not experimentally demonstrated in this paper. Therefore, prototype testing, hardware-in-the-loop validation, experimentally measured battery LUT generation, and real-time controller deployment are required before practical implementation in an EV charging system.
The engineering-oriented verification items are summarized in Table 14. This table clarifies which practical requirements are checked directly by simulation and which aspects remain outside the scope of the present version. The purpose is to distinguish simulation-based engineering verification from hardware validation.
Therefore, the present results support the simulation-based engineering feasibility of the proposed IBC architecture and control framework within the defined model boundary. However, these results do not replace hardware validation. Experimental prototype testing, hardware-in-the-loop evaluation, measured battery-parameter identification, and real-time NMPC implementation are necessary before practical deployment.

4. Discussion

The results demonstrate that the proposed single-phase IBC can be evaluated using a multi-layer simulation framework that connects average-model charging behavior, switching-model electrical transients, FEM-based motor thermal assessment, and simulation-based engineering verification. This structure is useful for IBC research because the same charging system must satisfy battery-management constraints, grid-interface constraints, converter-level switching requirements, implementation feasibility, and motor thermal limits.
The baseline double-loop PI controller provides stable current and voltage regulation under nominal operating conditions. Its structure is simple, computationally efficient, and widely used in power electronic converters. However, the PI controller does not inherently predict future battery states or explicitly enforce coupled constraints across the battery pack, DC-DC converter, and grid interface. Therefore, additional limiters or supervisory logic are required when the requested charging command conflicts with input-power, grid-current, battery-voltage, SOC, or thermal limits.
The proposed NMPC–EKF–LUT controller extends the charging system by incorporating battery state estimation and SOC- and temperature-dependent battery-parameter variation into the control decision. The LUT-based battery model allows the controller to account for changes in open-circuit voltage and impedance parameters, while the EKF provides estimated SOC and thermal states that are difficult to measure directly during operation. The NMPC then uses these estimated states and updated parameters to select a feasible charging command under current, voltage, SOC, temperature, and input-power constraints. This constraint-aware supervisory capability is the main technical advantage of the proposed method over a conventional PI-only charging controller.
The unified performance comparison shows that the proposed controller should not be interpreted as superior to the PI controller in every output variable. Under nominal constant-current charging, both controllers produce similar SOC progression, battery-voltage response, and battery-current regulation because the requested charging current remains feasible and the battery constraints are not strongly activated. Similarly, the short-duration switching-model results show similar DC-link ripple, duty-command behavior, and current-tracking performance for both controllers. This similarity is expected because the same converter parameters, switching model, duty limits, and feasible current schedules are used. Therefore, the switching-level results should be interpreted primarily as a validation of transient electrical feasibility rather than as the sole evidence of controller superiority.
The main benefit of the NMPC–EKF–LUT framework appears in constraint-sensitive and battery-management-oriented scenarios. In the grid-voltage-drop case, the charging current must be reduced when the available grid-side power decreases under a fixed grid-current limit. This scenario demonstrates the importance of input-power and grid-current constraints in the charging-command calculation. In the high-initial-SOC and high-ambient-temperature cases, the voltage and thermal constraints remain within the imposed limits during the simulated interval. Therefore, severe voltage limiting or thermal derating is not activated in the short-duration tests. These cases should be interpreted as battery-constraint verification scenarios, while stronger controller separation is expected under longer-duration operation, higher-power charging, or conditions closer to the voltage and thermal limits.
The FEM analysis addresses an additional issue that is specific to integrated chargers using motor windings as part of the charging path. The FEM results indicate that the stator-assisted charging path remains within the investigated thermal boundaries under the simulated charging-only cases. However, the motor thermal response is governed mainly by the charging current waveform, initial motor temperature, residual heat from prior traction operation, cooling condition, and elapsed charging time. The small thermal differences between the PI and NMPC–EKF–LUT cases under similar charging current profiles should therefore not be interpreted as a direct thermal superiority of the proposed controller. Instead, the FEM results validate the thermal feasibility of the investigated IBC operating scenarios and identify post-full-load operation as the more critical motor thermal design case.
The engineering-oriented verification presented in Section 3.6 further clarifies the practical relevance and validation boundary of the study. The switching-level, grid-current, battery-voltage, duty-command, DC-link, battery-thermal, and motor-thermal checks support the feasibility of the proposed IBC architecture within the defined simulation boundary. However, these results represent simulation-based engineering verification and do not replace hardware validation. A hardware prototype and hardware-in-the-loop platform are not included in this version of the study; therefore, experimental validation remains necessary before practical deployment.
The novelty of the work can be summarized in four points. First, the study focuses on a single-phase IBC architecture intended to be compatible with residential charging levels while also considering a higher-current benchmark. Second, the charging controller combines NMPC, EKF, and LUT-based battery modeling so that the charging command is generated using estimated battery states and parameter-dependent constraints. Third, both average and switching models are used, allowing long-duration charging behavior and short-duration converter transients to be interpreted together. Fourth, the electrical charging current is linked to FEM thermal analysis of the induction motor stator, which strengthens the feasibility assessment of the integrated charger concept.
Several limitations remain. The battery LUTs should be calibrated using experimental cell or module data before hardware implementation. The switching model should be extended to include detailed semiconductor switching losses, dead-time effects, parasitic capacitances, electromagnetic interference filters, and total harmonic distortion of the grid current. The FEM model should be validated against measured motor-temperature data under controlled charging current injection. In addition, the 22 kW single-phase condition represents a high-current benchmark and may not be permitted in all residential grid standards; therefore, its role should be described as a stress-test case rather than a universal home-charging condition.
Future work should therefore include hardware-in-the-loop validation, experimentally measured battery LUT generation, real-time NMPC implementation, prototype-level testing, grid-code-oriented harmonic analysis, and coupled electro-thermal co-simulation of the charger, battery pack, coolant loop, and motor stator.

5. Conclusions

This study investigated a single-phase integrated battery charger for electric vehicles using an induction motor stator-assisted AC-DC stage and a bidirectional buck–boost DC-DC charging stage. Two charging ratings were considered: a 7 kW residential wallbox-oriented case based on a 230 V, 32 A grid supply, and a 22 kW high-current benchmark based on a 230 V, 96 A grid supply. The battery system was represented as a 48 kWh LFP pack using a LUT-based equivalent circuit model.
The baseline double-loop PI controller achieved stable current and voltage regulation under nominal operating conditions. However, its constraint-handling capability depends on external limiters and does not explicitly use predicted internal battery states. The proposed NMPC–EKF–LUT controller provides a more battery-aware supervisory control structure by using estimated SOC and thermal states together with SOC- and temperature-dependent battery LUTs. This allows the charging command to be generated while considering battery voltage, charging current, SOC, thermal limits, and input-power constraints.
The normal-charging simulations showed successful charging from 20% to 80% SOC under the investigated 7 kW and 22 kW conditions. The dynamic step-current and grid-voltage-drop tests demonstrated that the charging current must be adjusted according to the feasible current schedule and the available grid-side power. The switching-model simulations confirmed that the selected converter parameters can implement the required charging commands with bounded DC-link ripple, feasible duty command, and bounded battery-current tracking error. The similar switching-level responses of the PI and NMPC–EKF–LUT controllers are expected because both controllers use the same power stage, operating limits, and feasible current trajectories.
The battery-management-oriented scenarios further showed that the high-initial-SOC and high-ambient-temperature cases remain within the imposed voltage and thermal limits during the simulated interval. In these cases, strong voltage limiting or severe thermal derating is not activated. Therefore, the results should be interpreted as verification of battery-side constraint handling rather than as evidence of large controller separation under all operating conditions. The main value of the NMPC–EKF–LUT framework is its ability to incorporate estimated internal states, LUT-updated battery parameters, and explicit operating constraints into the charging-command calculation.
The FEM thermal assessment showed that the induction motor stator-assisted charging path can be evaluated using the exported electrical current waveform. Under the simulated charging-only cases, the motor temperature remained within the investigated thermal boundaries. The thermal difference between the PI and NMPC–EKF–LUT cases was negligible because both cases used similar charging current profiles. In contrast, post-full-load motor operation produced significantly higher temperatures, indicating that residual motor heat, initial temperature, cooling condition, and elapsed charging time are dominant factors in induction motor-based IBC thermal design.
The engineering-oriented verification confirmed the simulation-based feasibility of the proposed IBC system within the defined model boundary. The converter transient response, grid-current compliance, battery voltage and thermal constraints, duty-command feasibility, DC-link behavior, sensor requirements, and motor thermal response were checked systematically. However, these results do not constitute experimental validation. A hardware prototype, hardware-in-the-loop testing, experimentally measured battery LUTs, and real-time NMPC implementation are still required before practical deployment.
Overall, the proposed NMPC–EKF–LUT framework is most valuable as a constraint-aware, battery-management-oriented supervisory control method for integrated EV chargers. It complements converter-level current and voltage regulation by introducing predictive constraint handling and estimated internal battery states. The combined average-model, switching-model, FEM, and engineering-oriented verification workflow provides a useful basis for future hardware validation and real-time implementation.

Author Contributions

Conceptualization, P.B. and P.P.-l.-o.; methodology, P.B. and P.P.-l.-o.; software, P.B.; validation, P.B.; investigation, P.B.; writing—original draft preparation, P.B.; writing—review and editing, P.P.-l.-o.; supervision, P.P.-l.-o.; resources, P.P.-l.-o.; funding acquisition, P.P.-l.-o. All authors have read and agreed to the published version of the manuscript.

Funding

This work was supported by (i) Suranaree University of Technology (SUT), (ii) Thailand Science Research and Innovation (TSRI), and (iii) National Science, Research and Innovation Fund (NSRF), (NRIIS number 204218).

Data Availability Statement

The original contributions presented in the study are included in the article; further inquiries can be directed to the author.

Conflicts of Interest

The authors declare no conflicts of interest. The funders had no role in the design of the study; in the collection, analyses, or interpretation of data; in the writing of the manuscript; or in the decision to publish the results.

Abbreviations

The following abbreviations are used in this manuscript:
BMSBattery-management system
ECMEquivalent circuit models
EISElectrochemical impedance spectroscopy
EKFExtended Kalman filter
EMIElectromagnetic interference
EVElectric vehicle
FEMFinite element method
HPPCHybrid pulse power characterization
IBCsIntegrated battery chargers
LUTLookup table
NMPCNonlinear model predictive control
OBCOn-board charger
OCVOpen-circuit voltage
PFCPower factor correction
PWMPulse Width Modulation
SOCState of charge
ZCDZero-current detection
ZVSZero-voltage switching

References

  1. Ashok, B.; Kannan, C.; Mason, B.; Ashok, S.D.; Indragandhi, V.; Patel, D.; Wagh, A.S.; Jain, A.; Kavitha, C. Towards Safer and Smarter Design for Lithium-Ion-Battery-Powered Electric Vehicles: A Comprehensive Review on Control Strategy Architecture of Battery Management System. Energies 2022, 15, 4227. [Google Scholar] [CrossRef] [Scilit]
  2. Nasr Esfahani, F.; Darwish, A.; Ma, X. Design and Control of a Modular Integrated On-Board Battery Charger for EV Applications with Cell Balancing. Batteries 2024, 10, 17. [Google Scholar] [CrossRef] [Scilit]
  3. Xing, Y.; Ma, E.W.M.; Tsui, K.L.; Pecht, M. Battery Management Systems in Electric and Hybrid Vehicles. Energies 2011, 4, 1840–1857. [Google Scholar] [CrossRef] [Scilit]
  4. Ali, M.U.; Zafar, A.; Nengroo, S.H.; Hussain, S.; Alvi, M.J.; Kim, H.J. Towards a Smarter Battery Management System for Electric Vehicle Applications: A Critical Review of Lithium-Ion Battery State of Charge Estimation. Energies 2019, 12, 446. [Google Scholar] [CrossRef] [Scilit]
  5. Zhou, K.; Yang, H.; Zhang, Y.; Che, Y.; Huang, Y.; Li, X. A Review of the Latest Research on the Topological Structure and Control Strategies of On-Board Charging Systems for Electric Vehicles. J. Energy Storage 2024, 92, 112820. [Google Scholar] [CrossRef] [Scilit]
  6. Singh, D.C.D.R.; R, N.; Aldahmashi, J.; Yousef, A. Integrated On-Board Charger, Wireless Charging and Auxiliary Power Topologies for EVs: A Survey. Energies 2026, 19, 689. [Google Scholar] [CrossRef] [Scilit]
  7. Bak, Y. Dynamic Characteristic Improvement of Integrated On-Board Charger Using a Model Predictive Control. Energies 2022, 15, 8745. [Google Scholar] [CrossRef] [Scilit]
  8. Monteiro, V.; Goncalves, H.; Afonso, J.L. Integrated Battery Charger for Electric Vehicles Based on a Dual-Inverter Drive and a Three-Phase Current Rectifier. Electronics 2019, 8, 1199. [Google Scholar] [CrossRef] [Scilit]
  9. Azam, M.K.; Ahmed, A.; Islam, M.; Dristy, A.; Siddiquee, A.; Sozer, Y.; Kisacikoglu, M. On-Board AC Charging Topology Integrated with Electric Vehicle Motor Drive System. In 2024 IEEE Applied Power Electronics Conference and Exposition (APEC); IEEE: New York, NY, USA, 2024; pp. 1448–1452. [Google Scholar] [CrossRef] [Scilit]
  10. Praneeth, A.V.J.S.; Williamson, S.S. Modeling, Design, Analysis, and Control of a Nonisolated Universal On-Board Battery Charger for Electric Transportation. IEEE Trans. Transp. Electrif. 2019, 5, 912–924. [Google Scholar] [CrossRef] [Scilit]
  11. Monteiro, J.; Pires, V.F.; Silva, J.F.; Pinto, S. A Model Predictive Controller for a Buck-Boost Rectifier of an Electric Vehicle Integrated Battery Charger with a Dual-Inverter Drive. In Proceedings of the 2022 IEEE 8th International Conference on Energy Smart Systems (ESS), Kyiv, Ukraine, 12–14 October 2022; pp. 258–263. [Google Scholar] [CrossRef] [Scilit]
  12. Makhamreh, H.; Kanzari, M.; Trabelsi, M. Model Predictive Control of a PUC5-Based Dual-Output Electric Vehicle Battery Charger. Sustainability 2023, 15, 14483. [Google Scholar] [CrossRef] [Scilit]
  13. Kang, H.-S.; Kim, S.-M.; Lee, K.-B. Integrated Battery Charging Circuit and Model Predictive Current Controller for Hybrid Electric Vehicles. In 2019 IEEE Applied Power Electronics Conference and Exposition (APEC); IEEE: New York, NY, USA, 2019; pp. 3315–3319. [Google Scholar] [CrossRef] [Scilit]
  14. Zou, C.; Hu, X.; Wei, Z.; Tang, X. Electrothermal Dynamics-Conscious Lithium-Ion Battery Cell-Level Charging Management via State-Monitored Predictive Control. Energy 2017, 141, 250–259. [Google Scholar] [CrossRef] [Scilit]
  15. Wang, Y.; Zhou, C.; Chen, Z. Optimization of Battery Charging Strategy Based on Nonlinear Model Predictive Control. Energy 2022, 241, 122877. [Google Scholar] [CrossRef] [Scilit]
  16. Liu, K.; Li, K.; Zhang, C. Constrained Generalized Predictive Control of Battery Charging Process Based on a Coupled Thermoelectric Model. J. Power Sources 2017, 347, 145–158. [Google Scholar] [CrossRef] [Scilit]
  17. Yin, Y.; Choe, S. Actively Temperature Controlled Health-Aware Fast Charging Method for Lithium-Ion Battery Using Nonlinear Model Predictive Control. Appl. Energy 2020, 271, 115232. [Google Scholar] [CrossRef] [Scilit]
  18. Ghaeminezhad, N.; Wang, Z.; Ouyang, Q. A Review on Lithium-Ion Battery Thermal Management System Techniques: A Control-Oriented Analysis. Appl. Therm. Eng. 2023, 219, 119497. [Google Scholar] [CrossRef] [Scilit]
  19. Madani, S.S.; Schaltz, E.; Kaer, S.K. An Electrical Equivalent Circuit Model of a Lithium Titanate Oxide Battery. Batteries 2019, 5, 31. [Google Scholar] [CrossRef] [Scilit]
  20. Huang, B.; Hu, M.; Chen, L.; Jin, G.; Liao, S.; Fu, C.; Wang, D.; Cao, K. A Novel Electro-Thermal Model of Lithium-Ion Batteries Using Power as the Input. Electronics 2021, 10, 2753. [Google Scholar] [CrossRef] [Scilit]
  21. Graber, G.; Sabatino, S.; Calderaro, V.; Galdi, V. Modeling of Lithium-Ion Batteries for Electric Transportation: A Comprehensive Review of Electrical Models and Parameter Dependencies. Energies 2024, 17, 5629. [Google Scholar] [CrossRef] [Scilit]
  22. Xu, Y.; Hu, M.; Fu, C.; Cao, K.; Su, Z.; Yang, Z. State of Charge Estimation for Lithium-Ion Batteries Based on Temperature-Dependent Second-Order RC Model. Electronics 2019, 8, 1012. [Google Scholar] [CrossRef] [Scilit]
  23. Plett, G.L. Extended Kalman Filtering for Battery Management Systems of LiPB-Based HEV Battery Packs: Part 1. Background. J. Power Sources 2004, 134, 252–261. [Google Scholar] [CrossRef] [Scilit]
  24. Ortiz, Y.; Arévalo, P.; Peña, D.; Jurado, F. Recent Advances in Thermal Management Strategies for Lithium-Ion Batteries: A Comprehensive Review. Batteries 2024, 10, 83. [Google Scholar] [CrossRef] [Scilit]
  25. Dini, P.; Saponara, S.; Chakraborty, S.; Hegazy, O. System-Level Compact Review of On-Board Charging Technologies for Electrified Vehicles: Architectures, Components, and Industrial Trends. Batteries 2025, 11, 341. [Google Scholar] [CrossRef] [Scilit]
  26. Lai, X.; Zheng, Y.; Sun, T. A comparative study of different equivalent circuit models for estimating state-of-charge of lithium-ion batteries. Electrochim. Acta 2018, 259, 566–577. [Google Scholar] [CrossRef] [Scilit]
  27. Bernardi, D.; Pawlikowski, E.; Newman, J. A General Energy Balance for Battery Systems. J. Electrochem. Soc. 1985, 132, 5–12. [Google Scholar] [CrossRef] [Scilit]
  28. Dini, P.; Colicelli, A.; Saponara, S. Review on Modeling and SOC/SOH Estimation of Batteries for Automotive Applications. Batteries 2024, 10, 34. [Google Scholar] [CrossRef] [Scilit]
  29. Rawlings, J.B.; Mayne, D.Q.; Diehl, M. Getting Started with Model Predictive Control. In Model Predictive Control: Theory, Computation, and Design, 2nd ed.; Nob Hill Publishing: Madison, WI, USA, 2017; pp. 1–60. [Google Scholar]
  30. Camacho, E.F.; Bordons, C. Model Predictive Control, 2nd ed.; Springer: London, UK, 2007. [Google Scholar] [CrossRef] [Scilit]
  31. Qin, S.J.; Badgwell, T.A. A Survey of Industrial Model Predictive Control Technology. Control Eng. Pract. 2003, 11, 733–764. [Google Scholar] [CrossRef] [Scilit]
  32. Houska, B.; Ferreau, H.J.; Diehl, M. ACADO Toolkit: An Open-Source Framework for Automatic Control and Dynamic Optimization. Optim. Control Appl. Methods 2011, 32, 298–312. [Google Scholar] [CrossRef] [Scilit]
  33. Zou, C.; Manzie, C.; Nešić, D. Nonlinear Model Predictive Control for Lithium-Ion Battery Optimal Charging. IEEE Trans. Mechatron. 2018, 23, 947–957. [Google Scholar] [CrossRef] [Scilit]
  34. Perez, H.E.; Hu, X.; Dey, S.; Moura, S.J. Optimal Charging of Li-Ion Batteries with Coupled Electro-Thermal-Aging Dynamics. IEEE Trans. Veh. Technol. 2017, 66, 7761–7770. [Google Scholar] [CrossRef] [Scilit]
  35. Hu, X.; Zou, C.; Zhang, C.; Li, Y. Technological Developments in Batteries: A Survey of Principal Roles, Types, and Management Needs. IEEE Power Energy Mag. 2017, 15, 20–31. [Google Scholar] [CrossRef] [Scilit]
  36. Kalman, R.E. A New Approach to Linear Filtering and Prediction Problems. J. Basic Eng. 1960, 82, 35–45. [Google Scholar] [CrossRef] [Scilit]
  37. Plett, G.L. Extended Kalman Filtering for Battery Management Systems of LiPB-Based HEV Battery Packs. Part 2: Modeling and Identification. J. Power Sources 2004, 134, 262–276. [Google Scholar] [CrossRef] [Scilit]
  38. Plett, G.L. Extended Kalman Filtering for Battery Management Systems of LiPB-Based HEV Battery Packs. Part 3: State and Parameter Estimation. J. Power Sources 2004, 134, 277–292. [Google Scholar] [CrossRef] [Scilit]
  39. Boglietti, A.; Cavagnino, A.; Staton, D.; Shanel, M.; Mueller, M.; Mejuto, C. Evolution and Modern Approaches for Thermal Analysis of Electrical Machines. IEEE Trans. Ind. Electron. 2009, 56, 871–882. [Google Scholar] [CrossRef] [Scilit]
  40. Madhavan, S.; P B, R.D.; Gundabattini, E.; Mystkowski, A. Thermal Analysis and Heat Management Strategies for an Induction Motor, a Review. Energies 2022, 15, 8127. [Google Scholar] [CrossRef] [Scilit]
  41. Xie, Y.; Guo, J.; Chen, P.; Li, Z. Coupled Fluid-Thermal Analysis for Induction Motors with Broken Bars Operating under the Rated Load. Energies 2018, 11, 2024. [Google Scholar] [CrossRef] [Scilit]
  42. Zhang, K.; Qing, J.; Jin, H.; Jin, H. Digital Twin-Enabled Predictive Thermal Modeling for Stator Temperature Monitoring in Induction Motors. Electronics 2025, 14, 2814. [Google Scholar] [CrossRef] [Scilit]
  43. Hwang, C.; Pan, C. Thermal analysis of induction motors using 3D finite element method. J. Chin. Inst. Eng. 1989, 12, 599–610. [Google Scholar] [CrossRef] [Scilit]
  44. Chen, M.; Rincon-Mora, G.A. Accurate Electrical Battery Model Capable of Predicting Runtime and I–V Performance. IEEE Trans. Energy Convers. 2006, 21, 504–511. [Google Scholar] [CrossRef] [Scilit]
  45. CALB. CALB L173F125 3.2V 125Ah LiFePO4 Battery Cell. Available online: https://calb-battery.us/calb-l173f125.html (accessed on 4 May 2026).
  46. Yetgin, A.G.; Durmuş, B. Analysis of the Effect of Rotor Slot Type on Torque Ripple in Induction Motors by Finite Element Method. EL-Cezeri J. Sci. Eng. 2020, 7, 536–542. [Google Scholar] [CrossRef] [Scilit]
  47. Staton, D.A.; Cavagnino, A. Convection Heat Transfer and Flow Calculations Suitable for Electric Machines Thermal Models. IEEE Trans. Ind. Electron. 2008, 55, 3509–3516. [Google Scholar] [CrossRef] [Scilit]
  48. Gebauer, M.; Blejchař, T.; Brzobohatý, T.; Nevřela, M. Conjugate Heat Transfer Model for an Induction Motor and Its Adequate FEM Model. Symmetry 2023, 15, 1294. [Google Scholar] [CrossRef] [Scilit]
  49. Incropera, F.P.; DeWitt, D.P.; Bergman, T.L.; Lavine, A.S. Fundamentals of Heat and Mass Transfer, 7th ed.; Wiley: Hoboken, NJ, USA, 2011. [Google Scholar]
  50. IEC 60034-1:2022; Rotating Electrical Machines—Part 1: Rating and Performance. International Electrotechnical Commission: Geneva, Switzerland, 2022.
  51. ANSI/NEMA MG 1-2016 (Revised 2018); Motors and Generators. National Electrical Manufacturers Association: Rosslyn, VA, USA, 2018.
Figure 1. Comparison of conventional OBC and integrated IBC architectures. Blue and green arrows indicate power flow during charging and driving, respectively. Black arrows indicate the electrical power direction and type, while gray lines represent electrical connections.
Batteries 12 00254 g001
Figure 2. Charging mode power flow of single-phase IBC. S1–S4 denote the electronic switches configured in a bridge structure within the totem-pole bridgeless PFC AC-to-DC converter.
Batteries 12 00254 g002
Figure 3. Overall control architecture and signal flow of the proposed single-phase IBC. The plant consists of the single-phase AC grid, induction motor stator windings, bridgeless totem-pole PFC AC-DC converter, DC-link capacitor, bidirectional DC-DC converter, and lithium-ion battery pack. The baseline controller uses a conventional double-loop PI structure, whereas the proposed controller integrates EKF-based state estimation, LUT-based ECM parameter updating, and NMPC-based constraint-aware charging control. Solid arrows indicate power or signal flow, dashed lines represent feedback and measurement paths, and the blue, red, and green areas denote the measurement layer, baseline controller, and proposed controller, respectively. Both controllers are evaluated using the same power stage and battery pack to ensure a consistent comparison.
Batteries 12 00254 g003
Figure 4. Control architecture of the proposed single-phase IBC. Switches S1–S4 form the bridgeless totem-pole PFC AC–DC stage, while S5 and S6 form the bidirectional DC–DC stage. Solid red arrows indicate the grid and charging-current directions. Blue, green, and red dashed lines represent the PWM gate signals for the AC–DC stage, PWM gate signals for the DC–DC stage, and DC-link-voltage feedback, respectively.
Batteries 12 00254 g004
Figure 5. Detailed controller–estimator workflow of the proposed NMPC–EKF–LUT strategy for the battery-side DC–DC charging stage. The measured signals from the battery-side plant, including battery voltage, charging current, surface temperature, and DC-link voltage, are used for state estimation and predictive control. The EKF estimates the internal battery states, including SOC, core temperature, and heat generation. The LUT-based ECM block updates the OCV and impedance parameters according to the estimated SOC and temperature. These estimated states, updated model parameters, measured signals, and operating constraints are supplied to the NMPC optimizer to generate a constraint-aware charging current or duty-related command, which is converted into gate signals by the PWM generation block. The arrows indicate the direction of measurement, estimation, parameter-update, control-command, and feedback signal flow among the functional blocks.
Batteries 12 00254 g005
Figure 6. ECM/LUT verification results for the synthesized LFP battery model: (a) implemented full-range OCV–SOC lookup curve from 0% to 100% SOC and (b) simulated pack terminal-voltage response during 7 kW and 22 kW normal-charging operation. In panel (a), circular markers represent the cell-level OCV data points, whereas square markers represent the corresponding pack-level OCV data points used to construct the LUT. The full-range OCV–SOC curve verifies that the LUT covers the complete SOC domain, although the controller-performance comparison is evaluated over the representative 20–80% SOC window.
Batteries 12 00254 g006
Figure 7. Normal-charging summary of the baseline PI controller and the proposed NMPC–EKF–LUT controller under 7 kW and 22 kW operation: (a) SOC response, (b) battery terminal voltage, and (c) battery charging current. Both controllers achieve stable constant-current charging under nominal feasible conditions. The 22 kW case reaches the target SOC faster than the 7 kW case because of the higher charging current, while the PI and NMPC–EKF–LUT responses remain close because the voltage, current, SOC, and thermal constraints are not strongly activated in this nominal case.
Batteries 12 00254 g007
Figure 8. EKF-based battery state estimation verification of the proposed NMPC–EKF–LUT framework under 7 kW and 22 kW normal-charging operation: (a) core-temperature estimation, and (b) SOC and core-temperature estimation errors. The EKF closely follows the reference SOC and core-temperature states, while the estimation errors remain bounded throughout charging.
Batteries 12 00254 g008
Figure 9. Representative step-current response of the baseline PI controller and the proposed NMPC–EKF–LUT controller under 7 kW and 22 kW operation: (a) battery-current response, (b) current-tracking error, (c) duty command, and (d) DC-link voltage ripple. The figure verifies the dynamic feasibility of both controllers under a changing current command and shows the corresponding converter-level response.
Batteries 12 00254 g009
Figure 10. Grid-voltage-drop constraint response of the baseline PI controller and the proposed NMPC–EKF–LUT controller under 7 kW and 22 kW operation: (a) grid-voltage disturbance, (b) battery-current response, (c) grid-current envelope or RMS response, and (d) current-tracking error. The figure verifies the input-constraint response when the available grid-side power is reduced, requiring the charging current to be adjusted to avoid grid-current-limit violation.
Batteries 12 00254 g010
Figure 11. Battery-management-oriented constraint response under high-initial-SOC and high-ambient-temperature conditions: (a) battery-voltage response in the high-initial-SOC case, (b) battery-current response in the high-initial-SOC case, (c) NMPC–EKF–LUT core-temperature response in the high-ambient-temperature case, and (d) battery-current response in the high-ambient-temperature case. The core-temperature trace is reported only for the proposed controller because the baseline PI controller does not use temperature feedback or thermal-state estimation in the control loop.
Batteries 12 00254 g011
Figure 12. FEM thermal distribution of the induction motor during charging-only operation at 22 kW: (a) double-loop PI controller; (b) NMPC + EKF + LUT. The contour shows the winding and stator regions under the exported charging current excitation.
Batteries 12 00254 g012
Figure 13. Maximum thermal distribution of the induction motor during charging-only operation at 22 kW: (a) double-loop PI; (b) NMPC + EKF + LUT. The red, green, purple, blue, orange, and cyan curves represent the shaft, air gap, rotor core, stator core, rotor bar, and stator winding, respectively. The green, purple, and blue curves are present but nearly overlap with the red curve because these motor regions exhibit very similar temperature responses over the simulated charging period.
Batteries 12 00254 g013
Figure 14. FEM thermal distribution of the induction motor during full-load operation: (a) 25 °C initial temperature condition; (b) 40 °C initial temperature condition.
Batteries 12 00254 g014
Figure 15. Three-dimensional FEM temperature distribution for 7 kW charging after one hour of full-load operation at a 40 °C initial temperature: (a) double-loop PI; (b) NMPC + EKF + LUT.
Batteries 12 00254 g015
Figure 16. Maximum temperature response corresponding to 7 kW charging after one hour of full-load operation at a 40 °C initial temperature: (a) double-loop PI; (b) NMPC + EKF + LUT. The red, green, purple, blue, orange, and cyan curves represent the shaft, air gap, rotor core, stator core, rotor bar, and stator winding, respectively. The maximum air-gap temperature represented by the green curve is very close to that of the rotor bar represented by the orange curve. Similarly, the maximum stator-core temperature represented by the blue curve closely follows that of the stator winding represented by the cyan curve.
Batteries 12 00254 g016
Table 1. Comparison between existing EV charging control approaches and the proposed NMPC-EKF-LUT-based IBC framework.
ApproachMain FocusLimitation in Battery-Aware IBC OperationPosition of the Proposed Work
BMS-oriented EV battery controlMonitoring,
protection, and state estimation [1,3]
Usually separated from
converter-level charging
control
Uses estimated internal battery states as control inputs
Conventional OBC controlDedicated AC-DC and DC-DC charger hardware [5,6]Increases hardware volume and does not reuse traction componentsReuses selected traction-system elements in a single-phase IBC
IBC topology and motor-drive-based chargingHardware integration using inverter or
motor-winding reuse [7,8]
Often emphasizes topology and current controlCouples IBC operation with battery-aware control
Motor-winding-
assisted IBC
Reuse of machine windings in the
charging path [9,10]
Motor thermal loading may not be fully assessed after
propulsion operation
Adds FEM assessment for charging-only and post-full-load cases
Predictive EV charger controlPredictive regulation of converter current or voltage [7,11]May focus mainly on
converter dynamics
Applies NMPC to the battery-side
converter of the proposed IBC
Battery predictive chargingOptimization under
voltage, thermal, or degradation
constraints [14,15]
Often considered separately from motor-winding-assisted IBCsUses NMPC for battery-aware charging current generation
ECM, LUT, and EKF-based battery managementBattery modeling and internal-state
estimation [19,23]
Model and estimator outputs may remain separated from charger decisionsFeeds LUT-updated parameters and EKF states to the NMPC layer
Proposed NMPC-EKF-LUT IBC
framework
Integrated battery-aware charging controlSimulation-based; hardware validation remains future workCombines NMPC, EKF, LUT-based ECM, PI benchmarking, switching verification, and FEM thermal assessment
Table 2. Recommended LUT data required for the battery ECM.
LUT ItemSymbolUnitIndependent
Variables
Typical Experimental Source
Open-circuit
voltage
v o c V/cellSOC, temperatureOCV relaxation or
low-C-rate test
Ohmic resistance R 0 Ω /cellSOC, temperatureHPPC pulse, EIS,
current interrupt
First polarization
resistance
R 1 Ω /cellSOC, temperatureHPPC pulse fitting
First polarization
capacitance
C 1 F/cellSOC, temperatureHPPC pulse fitting
Second polarization
resistance
R 2 Ω /cellSOC, temperatureHPPC pulse fitting
Second polarization
capacitance
C 2 F/cellSOC, temperatureHPPC pulse fitting
Entropic coefficient d V oc / d T V/KtemperatureCalorimetry or OCV-
temperature test
Thermal resistances R c s , R s c K/WtemperatureThermal test or
calibration
Thermal capacitances C c , C s J/WtemperatureThermal test or
cell data
Table 3. Operating scenarios.
ScenarioPurposeMain Disturbance or ConditionExpected Controller Response
Normal chargingBaseline validationRated grid voltage and nominal charging commandStable current tracking and acceptable
DC-link ripple
Step-current chargingDynamic command responseIncrease in charging current
demand
Smooth transition without exceeding
input-power/current limits
Grid-voltage dropInput constraint
validation
Temporary grid-voltage
reduction
Reduction or limitation of battery current
to prevent grid overcurrent
High initial SOCBattery-management validationHigher initial battery
voltage/SOC
Adjusted duty and current demand
consistent with battery voltage
High ambient temperatureThermal constraint validationElevated ambient/coolant
temperature
Temperature-aware control margin and thermal-limit compliance
Table 4. IBC system parameters.
ParameterSymbol7 kW Case22 kW CaseUnit
Grid voltage V g r i d 230230V rms
Grid-current limit I g r i d , m a x 3296A rms
Nominal charging power P i n , m a x 722kW
DC-link reference V d c , r e f 500500V
Battery energy E b a t t 4848kWh
Battery architecture-120s1p120s1p-
Battery voltage range V b a t t 400400V
Maximum battery temperature T b a t t , m a x 4545C
AC-DC inductor L s 0.83650.8365mH
DC-link capacitor C d c l i n k 24002400uF
DC-DC inductor L d c 2.28832.2883mH
Output capacitor C o 21,85021,850uF
Switching frequency f s w 1010kHz
Target efficiency η ≥95≥95%
Table 5. Battery pack parameters [45].
ParameterSymbolValueUnit
Cell chemistry-LFP-
Cell nominal voltage V c e l l , n o m 3.2V
Cell capacity Q c e l l 125Ah
Series cells N s 120-
Parallel strings N p 1-
Pack nominal voltage V p a c k , n o m 384V
Pack nominal capacity Q p a c k 125Ah
Pack nominal energy E p a c k 48.0kWh
Cell maximum voltage V c e l l , m a x 3.65V
Cell minimum voltage V c e l l , m i n 2.50V
Pack maximum voltage V p a c k , m a x 438V
Pack minimum voltage V p a c k , m i n 300V
Initial SOC S O C 0 20%
Target SOC S O C t a r g e t 80%
Table 6. Synthesized pack-level ECM and thermal parameters used in the control-oriented LFP battery model.
ParameterSymbolValueUnit
Ohmic resistance R 0 , p a c k 0.040 Ω
Short RC resistance R 1 , p a c k 0.012 Ω
Short RC capacitance C 1 , p a c k 25,000F
Long RC resistance R 2 , p a c k 0.006 Ω
Long RC capacitance C 2 , p a c k 120,000F
Bus/tab/contact resistance R t a b , b u s 0.006 Ω
Initial degradation resistance R s e i , 0 0.004 Ω
Maximum degradation resistance R s e i , M a x 0.030 Ω
Core heat capacity C c o r e 3.2 × 10⁵J/°C
Surface heat capacity C s u r f 1.8 × 10⁵J/°C
Core-surface thermal resistance R c o r e , S u r f 0.035°C/W
Surface-coolant thermal resistance R s u r f , C o o l 0.040°C/W
Table 7. Implemented cell-level OCV–SOC lookup table and SOC–temperature interpolation grid for the synthesized LFP battery model.
SOC00.050.100.200.300.400.500.600.700.800.901.00
O C V c e l l * (V)2.803.053.183.253.2853.3003.3103.3203.3353.3503.4203.560
Temperature grid for ECM LUT, Tc (°C) 0, 10, 25, 35, 45, 55
* The OCV values represent the implemented control-oriented OCV–SOC map used in the simulation. The temperature grid defines the SOC–temperature interpolation breakpoints used for the LUT-based ECM parameters. These values are not claimed to be proprietary manufacturer characterization data.
Table 8. EKF configuration used for battery state estimation.
ItemSymbolImplemented Setting/Description
State vector x k [ S O C k ,   T c , k ,   Q g e n , k ] T
Known input vector u k [ I b , k , \   T c o o l , k ] T
Measurement vector y k [ V b , k ,   T s , k ] T
Process-noise covariance Q k diag([2 × 10⁻¹⁰, 5 × 10⁻⁵, 2.0 × 10³])
Measurement-noise covariance R k diag([3.02, 0.122])
Initial covariance P 0 diag([0.0022, 0.82, 25002])
Initial state x ^ { 0   0 } [ 0.20 ,   25 ,   0 ] T for the normal-charging case,
[ 0.70 ,   25 ,   0 ] T for the high-initial-SOC case,
[ 0.20 ,   40 ,   0 ] T for the high-ambient-temperature case
Sampling time Δ t E K F 1.0 s (for the average model)
100 µs (for the switching model)
Estimated outputs S O C , T c , Q g e n
Error indicatorsSOC MAE, SOC RMSE, SOC maximum error,
T c MAE, T c RMSE, T c maximum error
Table 9. Summary of implemented ECM/LUT data and identification basis for simulation.
Model ItemImplementedIdentification or Calibration BasisRole in Verification
Pack specificationTable 5Public cell/pack-level specification [45]Defines 120s1p, voltage, capacity, and
energy
OCV LUTTable 7Synthesized OCV–SOC map for control-oriented applications [19]Verifies terminal-voltage trend
R 0 Table 6Pack-level synthesized ohmic
resistance [44]
Instantaneous voltage drop and heat
generation
R 1 , C 1 Table 6Short-term polarization branch [21,22]Fast voltage-transient response
R 2 , C 2 Table 6Medium-term polarization branch [21,22]Slower voltage recovery behavior
Thermal
parameters
Table 6Synthesized thermal-network
parameters [20,24]
T C estimation and thermal-limit
checking
EKF verificationFigure 6Simulation-level estimation checkSOC and T C estimation errors
Table 10. PI controller parameters and tuning principles used for the baseline comparison.
Converter StageControl LoopControlled
Variable
Reference/LimitKpKiTuning Principle
AC-DC
converter
Outer voltage loopVDCVDC,ref = 500 V125Slower loop for DC-link regulation
AC-DC
converter
Inner current loopIgIg,ref, Igrid,max2100Faster loop for grid-current tracking
DC-DC
converter
Outer voltage-limit loopVbVb,max = 438 V125Activated near battery-voltage limit
DC-DC
converter
Inner current loopIbIb,ref250Main charging current tracking loop
PI limiter/
saturation
Saturation blockDuty/current
command
Duty = [0, 0.95]Prevents unfair overcurrent or overvoltage operation
Note: The listed PI gains are normalized simulation gains used in the implemented MATLAB/Simulink control model. The PI controller and the proposed NMPC–EKF–LUT controller were evaluated using the same converter parameters, battery model, current limits, voltage limits, duty-cycle limit, and operating scenarios. Controller sampling time: 100 μs for the switching model and 1.0 s for the average supervisory model.
Table 11. Unified performance comparison between the baseline PI controller and the proposed NMPC–EKF–LUT controller.
ScenarioKey MetricPINMPC–EKF–LUTInterpretation
Normal charging, 7 kWSOC target timeApprox. 275 minApprox. 275 minSimilar under feasible CC charging
Normal charging, 22 kWSOC target timeApprox. 90 minApprox. 90 minHigher power reduces charging time
Normal chargingVoltage/current behaviorStableStableBoth controllers regulate the charger under nominal conditions
EKF estimationSOC max.
error
N/A1.3% at 7 kW;
2.0% at 22 kW
EKF provides SOC information for NMPC
EKF estimationTcore errorN/ANear-zero
convergence
Supports thermal-state-aware control
Step-current
response
Max. current
error
0.6055 A/
1.5139 A
0.6055 A/
1.5139 A
Similar switching-level response
Grid-voltage dropGrid-current
constraint
Maintained
near limit
Maintained
near limit
Confirms input-constraint feasibility
High initial SOCBattery
voltage
400–405 V;
below 438 V
400–405 V;
below 438 V
Voltage limit not strongly activated
High ambient temperatureCore
temperature
N/A40–42 °C;
below 45 °C
Thermal state is monitored by proposed controller
OverallMain
advantage
Simple local
regulation
Predictive constraint handlingBenefit appears near operating
constraints
Note: N/A indicates that the corresponding internal state is not estimated or not directly used in the baseline PI control loop. Similar responses in nominal and short-duration switching tests are expected because both controllers are evaluated using the same converter parameters, battery model, operating limits, and feasible current commands.
Table 12. Thermal model of 3-phase induction motor parameters.
ParameterSymbolValueUnit
Motor rated power P m o t o r 90kW
Grid frequency f g 50Hz
Stator resistance R s 0.0675Ω/phase
Stator reactance X s 0.1265Ω/phase
Winding thermal conductivity K W i n d i n g 386kg⋅m⋅s−3⋅K−1
Winding specific heat capacity C W i n d i n g 385J/(kg·K)
Winding density ρ W i n d i n g 8900kg/m3
Core thermal conductivity K C o r e 39kg⋅m⋅s−3⋅K−1
Core specific heat capacity C C o r e 470J/(kg·K)
Core density ρ C o r e 7700kg/m3
Shaft thermal conductivity K S h a f t 50.2kg⋅m⋅s−3⋅K−1
Shaft specific heat capacity C S h a f t 434J/(kg·K)
Shaft density ρ S h a f t 7850kg/m3
Air thermal conductivity K A i r 0.03kg⋅m⋅s−3⋅K−1
Air specific heat capacity C A i r 1013J/(kg·K)
Air density ρ A i r 1.164kg/m3
Natural heat convection coefficient h v , n a t u r a l 10W/m2K
Forced heat convection coefficient h v , f o r c e d 150W/m2K
Ambient temperature T a m b 25, 40°C
Initial temperature T 0 25, 40°C
Table 13. FEM-based induction motor thermal assessment for evaluating stator-assisted IBC charging feasibility under different controllers, power, and initial thermal conditions.
Operating ConditionPowerControllerInitial Condition (°C)Time (min)Tmax (°C)Tavg (°C)∆T (°C)
Charging only7 kWDouble-loop PI2527527.393525.45682.3935
Charging only7 kWNMPC + EKF + LUT2527527.394225.45692.3942
Charging only22 kWDouble-loop PI259038.819327.532113.8193
Charging only22 kWNMPC + EKF + LUT259038.848627.537313.8486
Full-load motor operation90 kWMotor run only2560116.585095.102491.5850
Full-load motor operation90 kWMotor run only4060131.5730110.094491.5730
Charging after 1 h full-load7 kWDouble-loop PI2534047.709343.285922.7093
Charging after 1 h full-load7 kWDouble-loop PI4034062.705258.283222.7052
Charging after 1 h full-load7 kWNMPC + EKF + LUT2534047.709943.290222.7099
Charging after 1 h full-load7 kWNMPC + EKF + LUT4034062.705758.287222.7057
Charging after 1 h full-load22 kWDouble-loop PI2515077.332570.911052.3325
Charging after 1 h full-load22 kWDouble-loop PI4015092.315185.904452.3151
Charging after 1 h full-load22 kWNMPC + EKF + LUT2515077.332570.911052.3325
Charging after 1 h full-load22 kWNMPC + EKF + LUT4015092.315185.904452.3151
Table 14. Simulation-based engineering verification summary for the proposed IBC system.
Engineering ItemVerification MethodMain Checked QuantityPractical Implication
Converter
transient
feasibility
Switching-level step-
current simulation
Battery current, tracking error, duty command, DC-link rippleConfirms that the selected converter model can implement the required
charging command
Grid-current complianceGrid-voltage-drop
simulation
Grid-current envelope and battery-current reductionVerifies that charging current is adjusted when available grid-side power decreases
Battery voltage constraintNormal-charging and high-initial-SOC casesBattery voltage below Vpack,maxConfirms operation within the imposed pack-voltage boundary
Battery thermal constraintHigh-ambient-
temperature case
Estimated Tcore below thermal limitVerifies thermal-state monitoring in the proposed controller
Duty-command feasibilitySwitching-level
simulations
Duty command within allowable rangeIndicates that the required converter
command remains implementable
DC-link
regulation
Switching-level
simulations
DC-link voltage and rippleConfirms converter-level electrical
feasibility
Motor thermal feasibility3-D FEM thermal
simulation
Motor-temperature distribution and maximum temperatureChecks thermal feasibility of stator-assisted charging
Sensor
requirements
Controller and EKF
signal definition
Vb, Ib, Ts, VDC, IgDefines measurable signals required for practical implementation
Real-time
feasibility
Algorithmic
configuration and
simulation timing
EKF/NMPC sampling configuration and state dimensionProvides a basis for implementation;
real-time testing remains future work
Hardware
validation
status
Not included in this studyNo prototype or HIL test reportedResults are simulation-based engineering verification, not experimental validation
Disclaimer/Publisher’s Note: The statements, opinions and data contained in all publications are solely those of the individual author(s) and contributor(s) and not of MDPI and/or the editor(s). MDPI and/or the editor(s) disclaim responsibility for any injury to people or property resulting from any ideas, methods, instructions or products referred to in the content.