1. Introduction
The transition to electromobility is a major development influencing various sectors of society and the global economy. Numerous international initiatives support the deployment of zero-emission vehicles, including the Electric Vehicle Initiative [
1], the Zero-Emission government fleet declaration [
2], and national programs like the European Green Deal. Most developed nations, such as those in the European Union, have announced plans to phase out the sale of internal combustion engine (ICE) vehicles by 2035 [
3].
Battery electric vehicles (BEVs) and fuel cell electric vehicles (FCEVs) are the two primary alternatives to ICE vehicles. Based on current trends, BEVs are the more popular choice among consumers. According to the International Energy Agency (IEA) [
4], by the end of 2024, the global BEV stock reached approximately 39 M units, while FCEVs numbered around 70 k. Despite this growth, BEVs still represent a minority of the global vehicle fleet. Norway leads globally with a BEV stock of 32%, followed by Iceland (18%) and Sweden (13%).
As BEV adoption continues to rise, concerns have emerged about the stability and capacity of electricity grids. Public charging infrastructure and its corresponding tariffs in Germany were assessed in the work [
5]. Grid overloads and charging restrictions have been reported in countries such as the Netherlands [
6]. By 2050, electric vehicles are projected to account for approximately 9.5% of total electricity consumption in the European Union. Meeting this demand will require an estimated additional installed capacity of 150 GW dedicated to vehicle charging infrastructure [
7]. A smaller share of electric vehicle charging can be covered by an off-grid solution, e.g., the integration of rooftop photovoltaic (PV) systems—common on commercial buildings—can complement daytime charging [
8]. A notable example is the rooftop PV installation solar carport in Lannach (Austria) with 3.35 MWp and 96 charging points for EVs. Agrovoltaic systems, which combine agricultural use with solar energy production, also offer novel opportunities, such as enabling in-field charging for electric agricultural machinery [
9].
These challenges coincide with the broader transition toward renewable energy sources, which are inherently variable in output. Thus, infrastructure development is essential, including smart grid technologies, enhanced grid capacity, and increased deployment of renewable energy sources. In this context, smart charging and vehicle-to-grid (V2G) approaches are increasingly discussed as mechanisms for reducing peak-load stress, improving demand-side flexibility, and supporting renewable-energy integration. A critical factor for managing demand effectively will therefore be the charging behavior of EV users.
Several data sources have been utilized to gain insights into EV user behavior. One of the most prevalent is the analysis of data from charging stations. While this method allows for large-scale analysis, it lacks information on individual users and their motivations. For instance, [
10] analyzed public charging station usage in Ireland, focusing on metrics such as charging duration, energy delivered per session, and daily usage trends. Similarly, research in the Netherlands [
11] identified clusters of charging session types, while the UK study [
12] developed a model to investigate EV charging demand characteristics in a specific geographic area. In Canada, an analysis of nearly 2 million charging sessions [
13] incorporated state-of-charge (SOC) data and weekly charging patterns, applying advanced modeling techniques (e.g., CHAODA—Clustered Hierarchical Anomaly and Outlier Detection Algorithms) to distinguish between AC and DC charging and to assess station utilization and seasonality. Beta mixture models (BMMs) were used to analyze Dutch charging data [
14], and Gaussian mixture models (GMMs) were applied to U.S. data [
15]. In Italy, a simulation of hourly charging profiles, including duration and energy demand, was conducted using the “emobpy” tool and validated against real-world data from South Tyrol, Italy [
16]. In Central Europe, studies such as [
17] in Switzerland explored spatial and temporal aspects of charging station utilization, while research in Germany [
18,
19] focused on their profitability. The study [
20] applied millions of charging station records in Wuhan, China, to empirically validate a two-step optimization model aimed at enhancing both fairness and efficiency in electric vehicle charging infrastructure planning.
There is a very small number of studies focusing on real-world data from workplace charging. The study [
21] analyzes a limited dataset comprising 3395 charging sessions from 85 users in the United States, aiming to identify distinct user groups based on charging behavior. Lee et al. [
22] apply Gaussian mixture models to ACN-Data, which contains over 30,000 charging sessions, to learn and predict EV charging behavior. Although this dataset provides valuable insights, it is considerably smaller than the dedicated workplace dataset used in the present study and its workplace-related observations are based primarily on university campus charging environments, where workplace and public-access use are partly intertwined because some stations are accessible to non-employees. In contrast, as detailed in
Section 2, the present study analyzes more than 226,000 charging sessions from a closed corporate charging system used by an internal fleet of BEVs and PHEVs. This substantially larger and more clearly defined workplace dataset enables a more direct assessment of workplace charging behavior and its comparison with public charging within the same national market.
Another analytical method involves the use of data loggers in electric vehicles, which enables the collection of user-specific data. However, these datasets are usually smaller due to technical constraints. The study [
23] employed data from 300 electric vehicles in a Chinese province to model user-specific behavioral characteristics, whereas study [
24] utilized a dataset comprising 233 vehicles and over six million charging records to evaluate the impact of EV charging on the electrical grid in California. Reference [
25] used data from the “My Electric Avenue” project in the UK monitored 221 EVs over a two-year period and use of probability density functions based on GMMs to represent key charging metrics of EVs.
Surveys represent a third method for studying EV user behavior. While they allow for the collection of large amounts of data, results can be biased due to self-reporting. For example, a survey of nearly 8000 participants in California was used to classify EV user behavior [
26]. In Saudi Arabia, responses from 662 individuals were used to simulate grid demand [
27]. The study [
5] utilized a survey-based choice experiment to investigate consumer preferences and willingness to pay for various attributes of public electric vehicle charging tariffs and infrastructure reliability in Germany. In the United States, ref. [
28] examined the environmental motivations of EV drivers. The National Household Travel Survey (NHTS) is frequently utilized as a foundational dataset for modeling EV user behavior. For instance, ref. [
29] employed NHTS data to simulate EV charging load patterns in Shanghai, China.
All the reviewed studies focus exclusively on a single country or region from Western Europe, China or the USA. This regional limitation constrains the generalizability of the findings and may not capture behavioral patterns or trends in more advanced EV markets. Furthermore, most studies pay limited attention to the technological maturity and evolution of EV technology over time. Notably, workplace charging (a key component of daily charging behavior) remains significantly underexplored in the current body of literature.
The present study focuses on EV away-from-home charging behavior in the Czech Republic and presents the first in-depth analysis based on real-world data of workplace charging behavior in the EU. At the end of 2023, the Czech Republic had a population of approximately 10.8 million inhabitants and a passenger-car fleet of about 6.6 million vehicles. The shares of BEVs and PHEVs were 0.3% and 0.2%, respectively [
30]. The public charging infrastructure consisted of 4664 publicly accessible recharging points, which is comparatively low relative to EU countries with a similar population size, such as Sweden (37,166) or Belgium (44,363) [
31]. However, when considering the ratio of battery-electric cars to fast charging points—ca. 16 BEVs per DC fast charger—the Czech Republic offers relatively favorable conditions for EV users compared with many other EU member states [
31]. This combination of low EV market penetration and a still-developing charging infrastructure closely resembles the situation in several Central and Eastern European countries. Therefore, the findings and conclusions presented in this study are broadly transferable across the region.
According to the International Energy Agency (IEA), the global distribution of EV charging energy by 2030 is expected to be roughly 60% from private home chargers, 10% from workplace charging, and 30% from public infrastructure [
32]. However, national differences are substantial. Electromobility policy in the Czech Republic is strongly shaped by European Union climate and transport objectives, while domestic EV adoption is still at an early stage. The updated National Action Plan for Clean Mobility (NAP CM) and the National Energy and Climate Plan (NECP) commit the country to a rapid expansion of zero-emission vehicles and a dense network of charging points, supported by subsidy schemes such as the National Recovery Plan, the Operational Programme Transport and the State Environmental Fund of the Czech Republic. These documents set quantitative targets for the roll out of tens of thousands of publicly accessible charging points and prioritize high power recharging along the TEN-T network and in major urban nodes, in line with the Alternative Fuels Infrastructure Regulation (AFIR).
While public fast charging infrastructure benefits directly from these support schemes, the development of workplace charging has so far relied mainly on voluntary investments by large employers, with subsidy eligibility often conditioned by public accessibility of the charging points. At the same time, only about 45% of the Czech population lives in single family houses; the remaining majority is concentrated in multi apartment buildings and may have limited access to private home charging, increasing their dependence on public and workplace infrastructure. This combination of low current EV penetration, ambitious infrastructure targets driven by EU regulation and constrained opportunities for home charging makes the Czech Republic representative of many Central and Eastern European “late adopter” markets and provides a strong policy rationale for a detailed case study of public and workplace charging behavior.
Using unique real-world datasets from the Czech Republic, we provide the first in depth comparison between public and workplace EV charging, identifying key differences in session duration, energy delivered per session, and temporal usage patterns.
We demonstrate that workplace charging is not merely a subset of public charging, but a behaviorally distinct charging context characterized by different weekly peaks, start-time distributions, session durations and energy delivered per session.
We provide empirical evidence that charging-session parameters are sensitive to contextual factors such as provider-specific pricing rules.
We explicitly link observed charging trends to fleet composition, particularly the evolving share BEVs and PHEVs, highlighting how technological adoption shapes user behavior over time.
We apply robust statistical methods to confirm significant distinctions in charging behavior between user groups, charging types, and over time, linking these trends to changes in fleet composition and policy interventions.
Beyond descriptive statistics, the methodological contribution consists of a harmonized comparative framework that links statistically tested differences in charging-session parameters to charging context, AC/DC technology, provider pricing rules, overstay-fee policies, temporal development, and BEV/PHEV fleet composition.
Our findings highlight the strategic importance of workplace and on-street AC charging for future smart grid integration, including smart charging and potential V2G applications, and provide actionable insights for EV infrastructure planning and policy in the region.
2. Materials and Methods
This study utilizes two datasets derived from EV charging stations in the Czech Republic (
Table 1). The first dataset originates from a public charging provider and represents standard public charging activity for various BEV categories (e.g., passenger cars and light commercial vehicles); nevertheless, we assume that most charging events correspond to passenger cars based on the confirmation of the data provider. To better understand user motivation and behavior, this dataset was further categorized into the following three subgroups based on the presumed parking purpose.
Commercial—locations such as shopping centers, supermarkets, restaurants, etc.
On-street—locations adjacent to office and residential zones.
Petrol stations—high-traffic areas such as motorways, typically at petrol stations.
The pricing policy of the public provider evolved over time; however, the following principles remained consistent throughout the study period:
Energy delivered per kWh, differentiated by charging type: ultra-fast charging (UFC > 150 kW), fast DC charging (50–150 kW), and AC charging (max. 22 kW). The price of the basic tariff increased from 0.32 €/kWh for UFC, 0.24 €/kWh for DC and 0.2 €/kWh for AC in the year 2022, to 0.56 €/kWh for UFC, 0.48 €/kWh for DC and 0.36 €/kWh for AC at the end of 2023 (all prices incl. VAT, basic tariff).
Time-based overstay fee, applied per minute after a predefined time limit (e.g., 180 min for AC and 60 min for DC), intended to incentivize users to vacate the charging station promptly. Throughout the observation period, the price remained, 0.04 €/min. for AC and 0.08 €/min. for DC and UFC charging (all prices incl. VAT, basic tariff).
During the observed period, the analyzed public charging network experienced rapid growth, nearly doubling in size between 2022 and 2023. Approximately 80% of all charging stations are located in towns with populations exceeding 50,000 inhabitants.
The second dataset was provided by a private company operating a large fleet of electric passenger cars (BEVs and PHEVs), deployed as company cars used for both business and private use, as well as an extensive internal charging infrastructure. This dataset enabled an in-depth analysis of workplace charging. Compared to public providers, the company offers employees more favorable pricing and does not charge for the duration of stay at the charger. The vehicle fleet is highly homogeneous, predominantly serving a single vehicle brand. Most employees with fleet vehicles follow a standard work schedule (8:00–17:00), although some operate within a three-shift system typically beginning at 6:00, 14:00, and 22:00.
All data and analyzed parameters distinguish between AC charging sessions (max. 22 kW) and DC charging sessions (>50 kW). Ultra-fast charging (UFC, >150 kW) is categorized within DC charging, as the available data did not separately identify this charging category.
Both datasets include detailed information on the start/end times and dates of sessions, energy delivered, and charging locations (see
Table 2). Data cleaning was performed to eliminate unsuccessful or erroneous sessions. All sessions that did not meet at least one of the criteria were considered erroneous and excluded from the dataset; the following filtering criteria were applied.
The filtering procedure removed approximately 1% of raw sessions from the public charging dataset and up to 33% from the workplace charging dataset. The substantially higher exclusion rate in the workplace dataset reflects the fact that these data had not been pre-cleaned by the provider and included test, diagnostic, maintenance, and other non-user sessions used to verify charger operation. These records did not represent actual EV user charging behavior and were therefore excluded. Applying identical filtering criteria to both datasets ensured that the final datasets were comparable and contained only user-relevant charging sessions.
Unfortunately, information on vehicle type, battery capacity, state-of-charge (SOC) and possible charging power is not available. Notably, PHEVs typically have much smaller battery capacities (usually less than 10 kWh) in comparison to BEVs. However, significant variations also exist among battery electric vehicles (BEVs), with battery capacities ranging from 24 kWh to 100 kWh. AC charging power for PHEVs is generally limited to 3.6 kW, whereas BEVs commonly support up to 11 kW AC. DC fast charging is primarily relevant for BEVs, starting at 50 kW and reaching up to 350 kW for certain models during short periods. Charging speed can vary depending on the state of charge, ambient temperature, and grid conditions. All these technical factors must be considered when analyzing EV user behavior based on charging station data.
Several statistical tests were used to evaluate differences in charging behavior across charging categories and temporal groups. Since empirical charging-session data are typically skewed and may contain extreme values, non-parametric methods were preferred where appropriate, as they do not require normally distributed data [
33].
The Friedman test is a non-parametric alternative to repeated-measures ANOVA and is used to compare three or more related groups or repeated observations. The Kruskal–Wallis test is a non-parametric alternative to one-way ANOVA and is used to compare three or more independent groups. In both cases, a statistically significant result indicates that at least one group differs from the others, and post hoc comparisons are needed to identify the specific differences. The chi-square test is used to compare categorical frequency distributions and determine whether observed frequencies differ significantly from expected or between-group distributions. Statistical significance was evaluated using a threshold of p < 0.05.
3. Results
3.1. Charging by Day of the Week
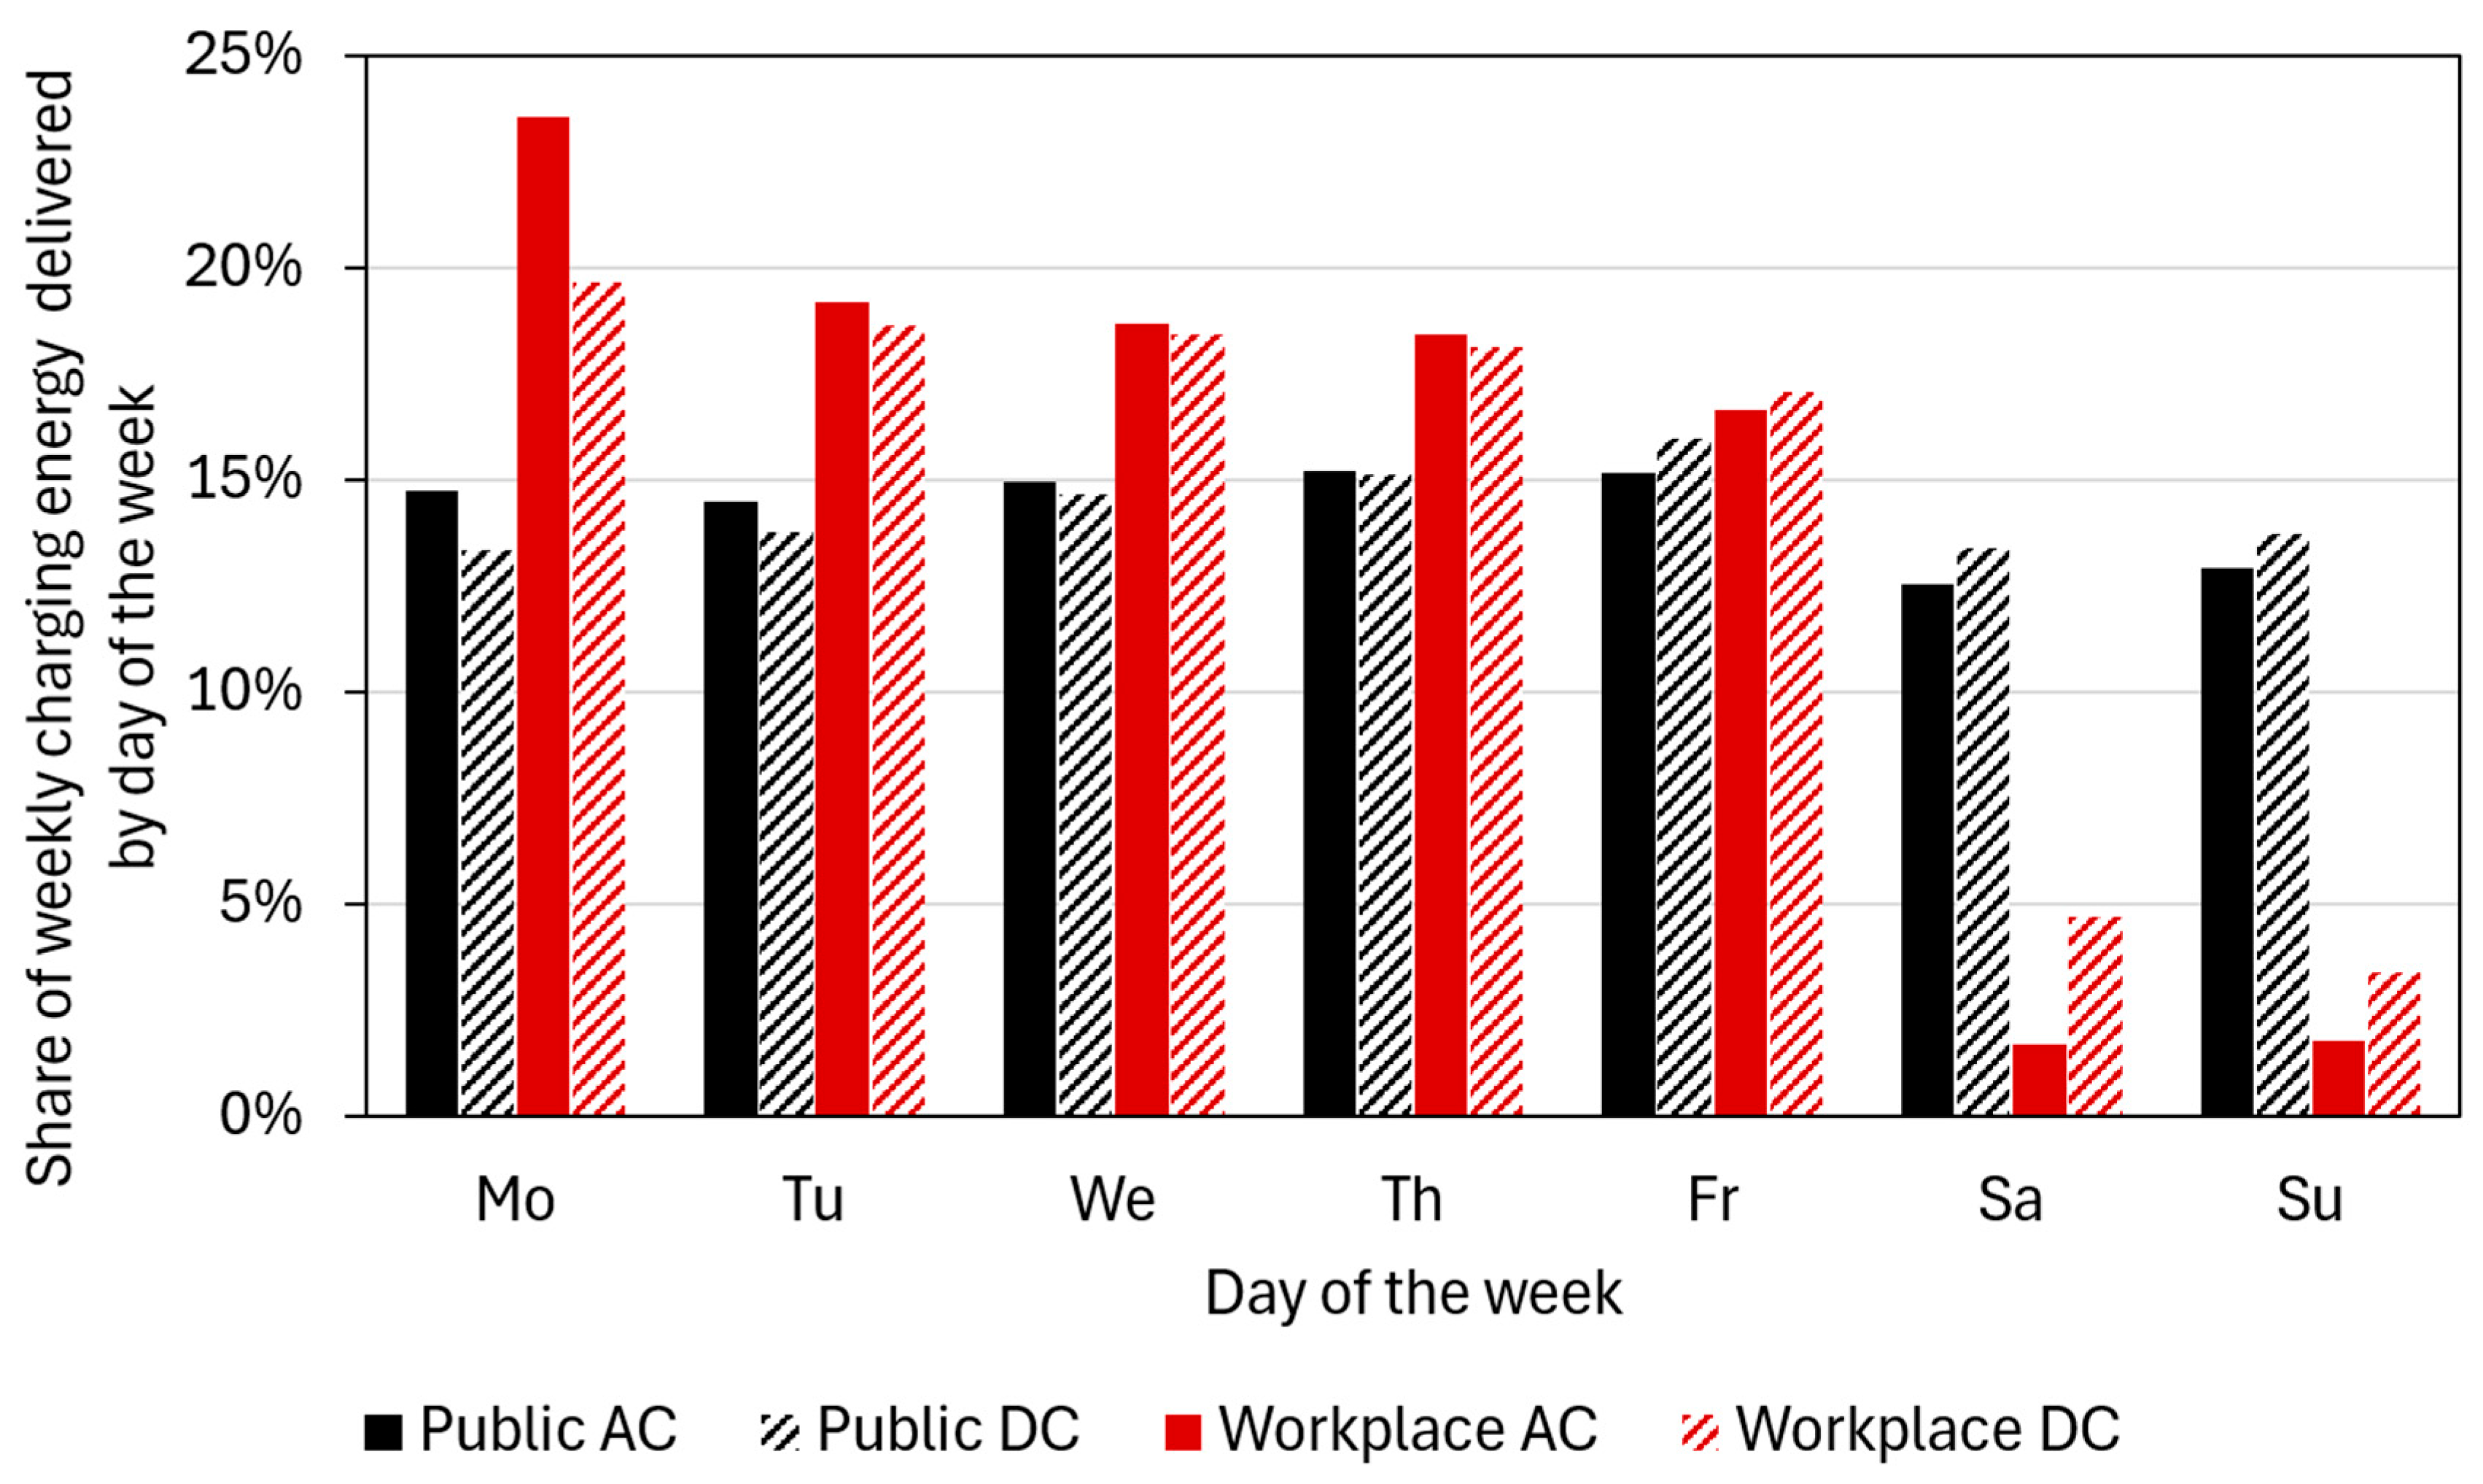
Figure 1 illustrates the weekly share of energy delivered per session for EV charging at public and workplace charging facilities. A clear distinction is observed between charging behaviors during weekdays and weekends across the two infrastructure types.
Workplace charging exhibits a pronounced peak on Mondays. This can be attributed to some users postponing charging over the weekend and instead charging upon returning to work, either due to a lack of home charging options or more favorable pricing conditions provided by the employer compared to public providers.
By contrast, public charging exhibits a modest peak on Fridays, followed by significantly reduced charging during weekends. This behavior may be linked to a common practice in the Czech Republic, where individuals travel to rural areas on Fridays, where charging infrastructure is often lacking. This pattern is consistent for both AC and DC charging.
The Friedman test revealed statistically significant differences in energy delivered per session across the days of the week for each charging type (p < 0.05). Post hoc analyses were subsequently conducted to identify specific pairwise differences. For public AC charging, significant differences were observed between the weekend and both Friday and Thursday, as well as between Saturday and Wednesday (p < 0.05). In the case of public DC charging, energy delivered on Friday differed significantly from that on all other days, with the exception of Thursday (p < 0.05). For both workplace AC and DC charging, a statistically significant difference was confirmed between weekends and weekdays (p < 0.05). In addition, Monday consistently differed from all other days (p < 0.05).
3.2. Session Start Time
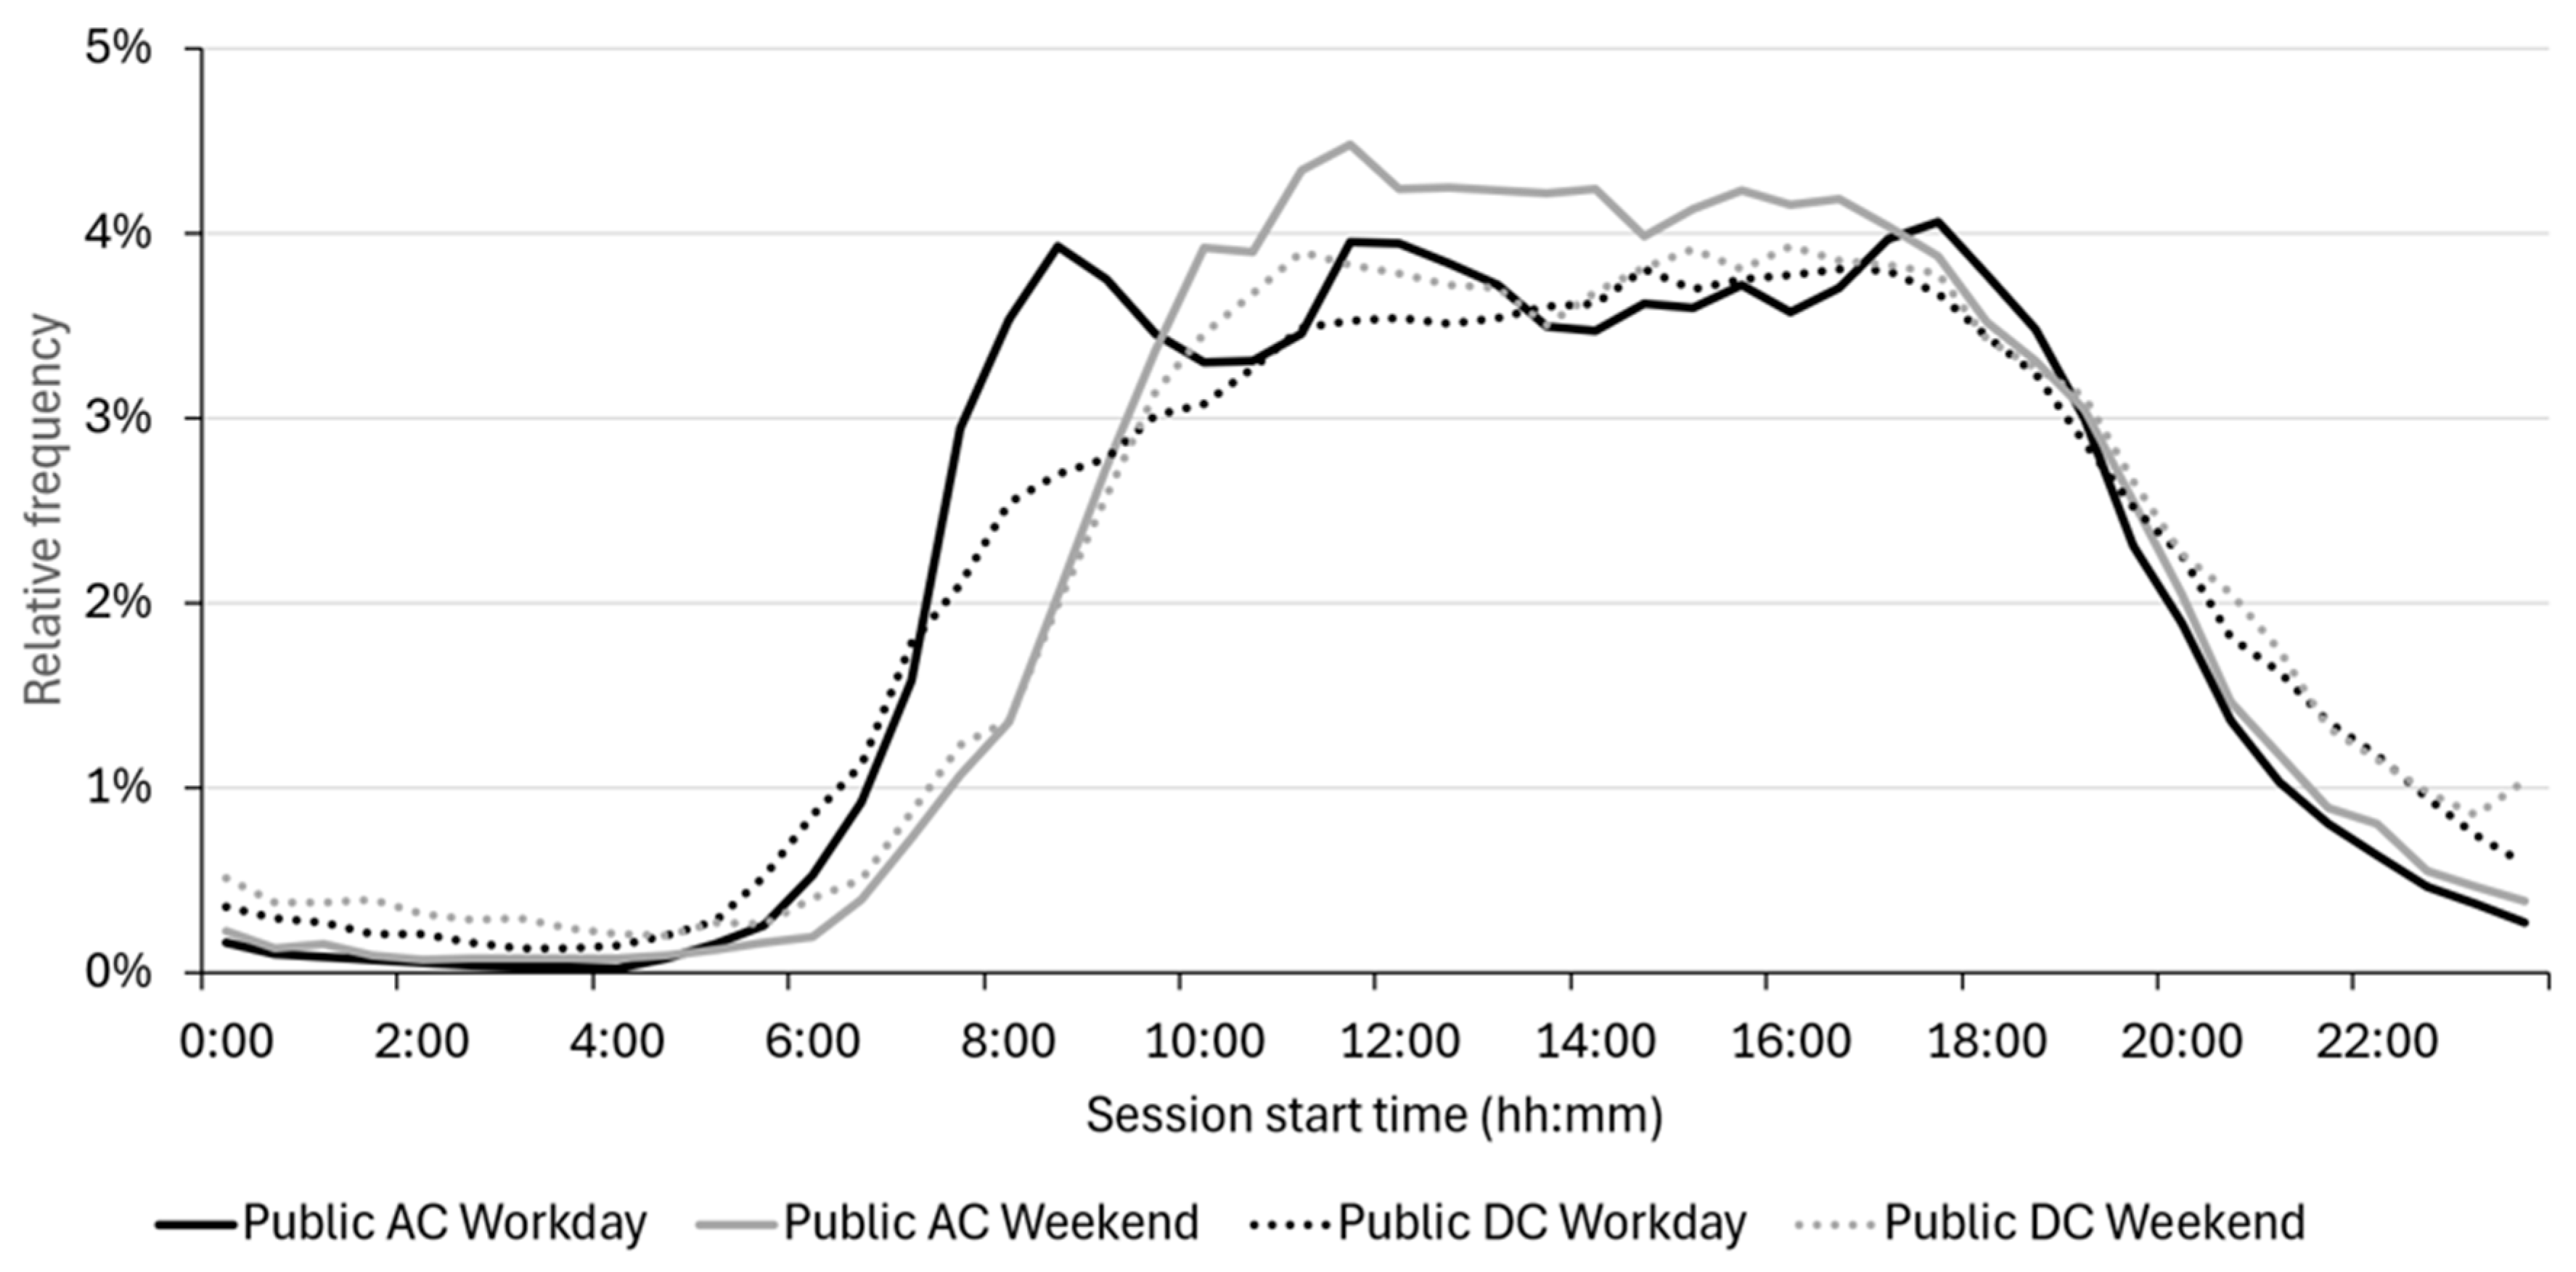
Figure 2 presents the distribution of charging event counts over session starts, analyzed in 30 min intervals and disaggregated by charging type (AC and DC) and day type (weekday and weekend) for public charging stations.
On weekdays, AC charging exhibits distinct peaks at 07:00–08:00 (commute-related charging), 11:00–12:00 (midday break), and 17:00–18:00 (post-work charging). In contrast, weekday DC charging displays a more uniform distribution, with a moderate increase in activity during the late afternoon (around 17:00–18:00). On weekends, the early morning peak (07:00–08:00) is absent, reflecting the reduced influence of commuting. The AC and DC charging patterns on weekends are generally more similar.
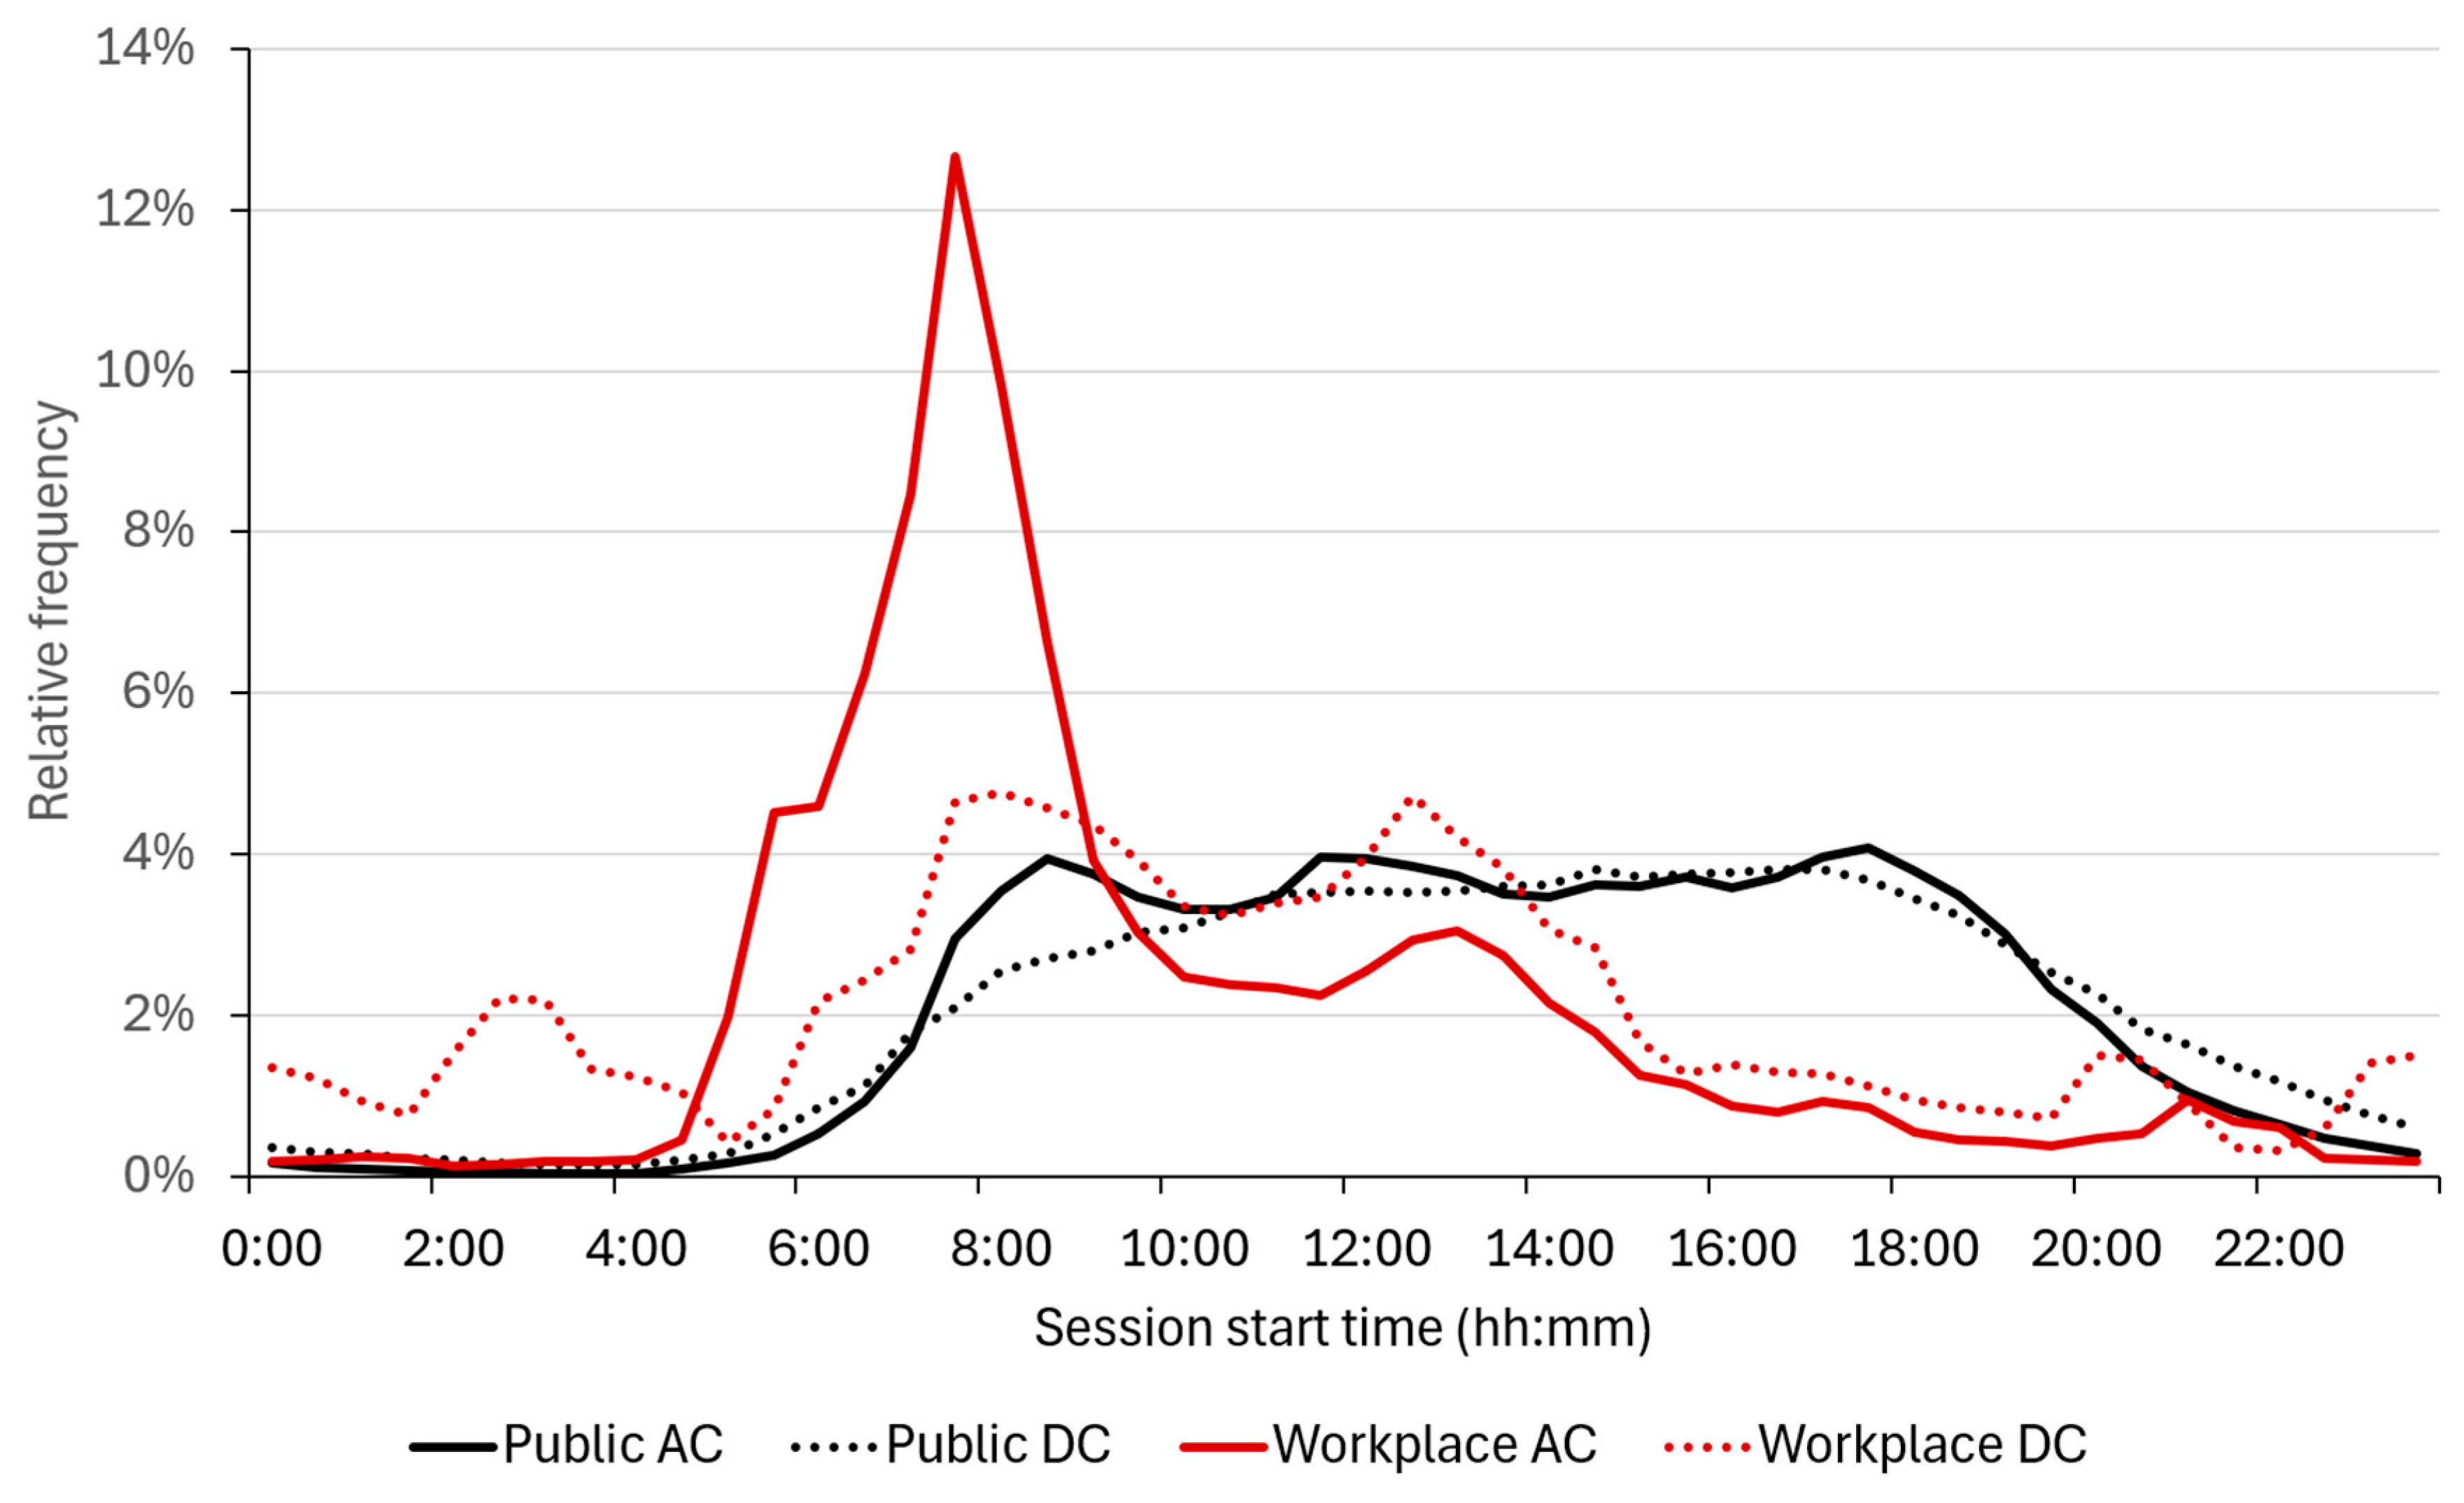
Figure 3 compares charging patterns between public and workplace charging during weekdays. The most pronounced differences appear in AC charging. Morning arrival and midday break peaks are more distinct in workplace charging, followed by a sharp decline in activity compared to public charging.
A chi-square test was conducted to assess the differences in the distribution of charging session start times between the public and workplace datasets. The results indicate statistically significant differences for both AC and DC charging (p-value < 0.05).
3.3. Charging Duration per Session
When analyzing charging duration, it is essential to account for the entire period between plug-in and disconnect, including idle time when the vehicle remains parked after reaching full charge. To reduce charger occupancy time when no active charging occurs, some network providers impose overstay fees beyond a specified time limit.
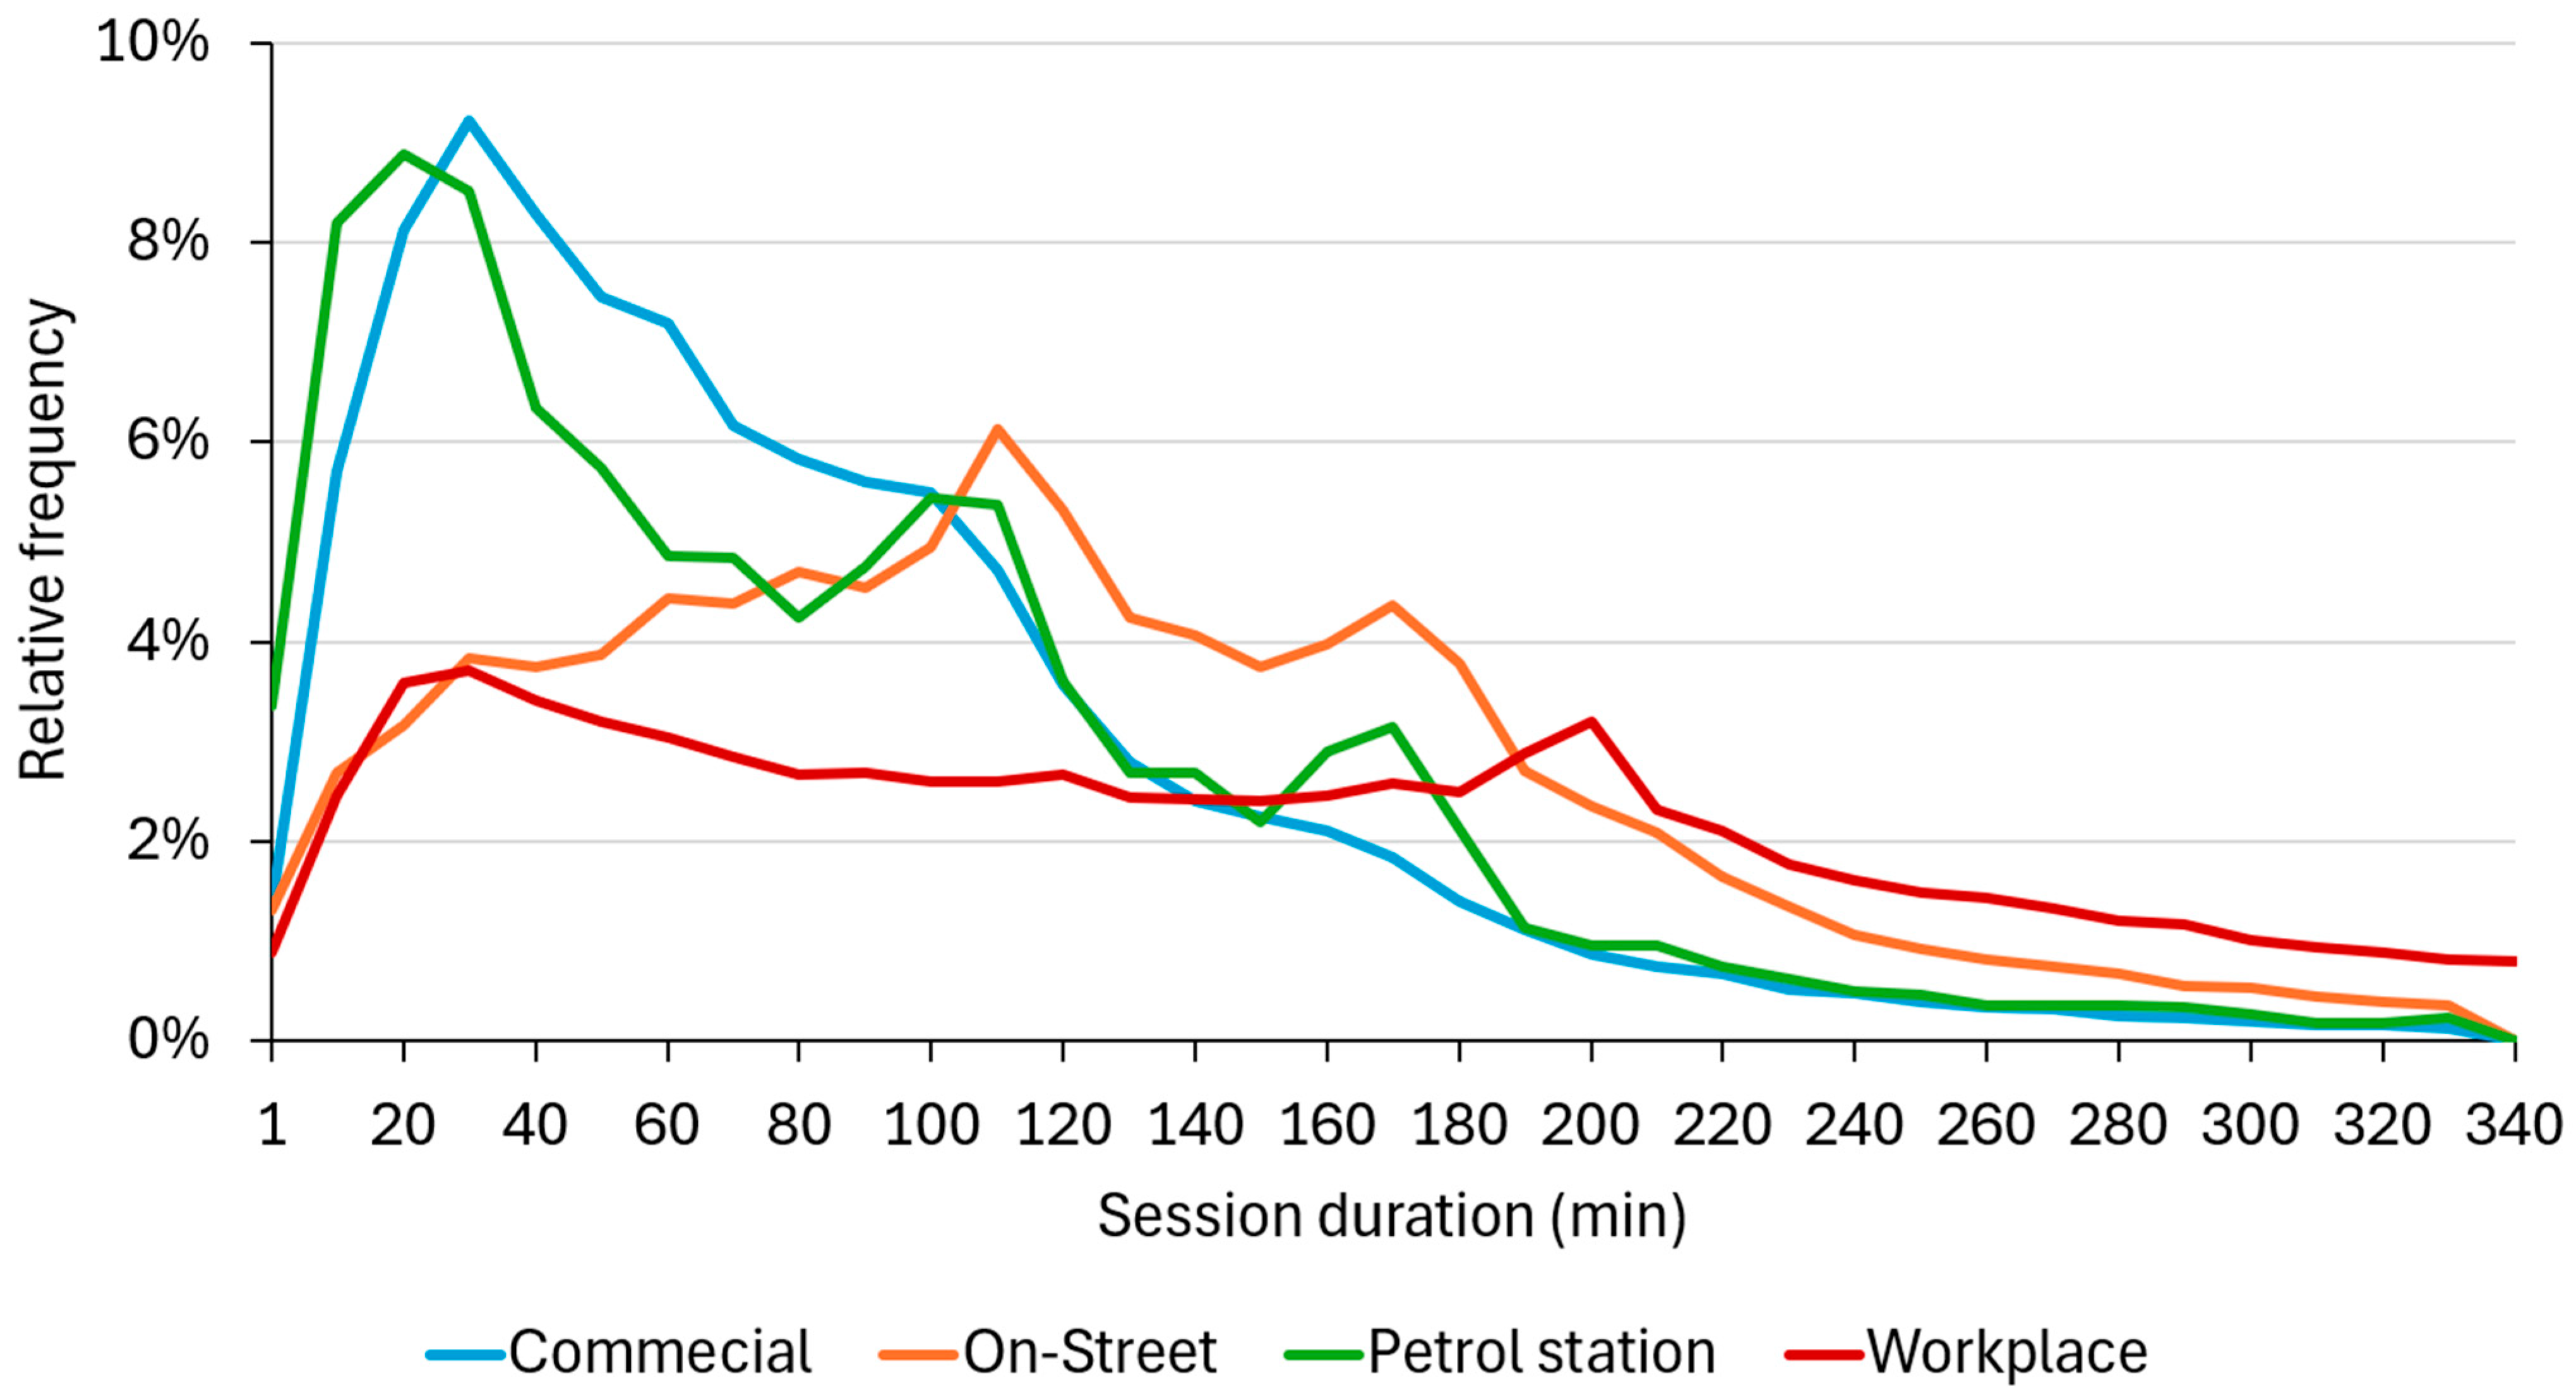
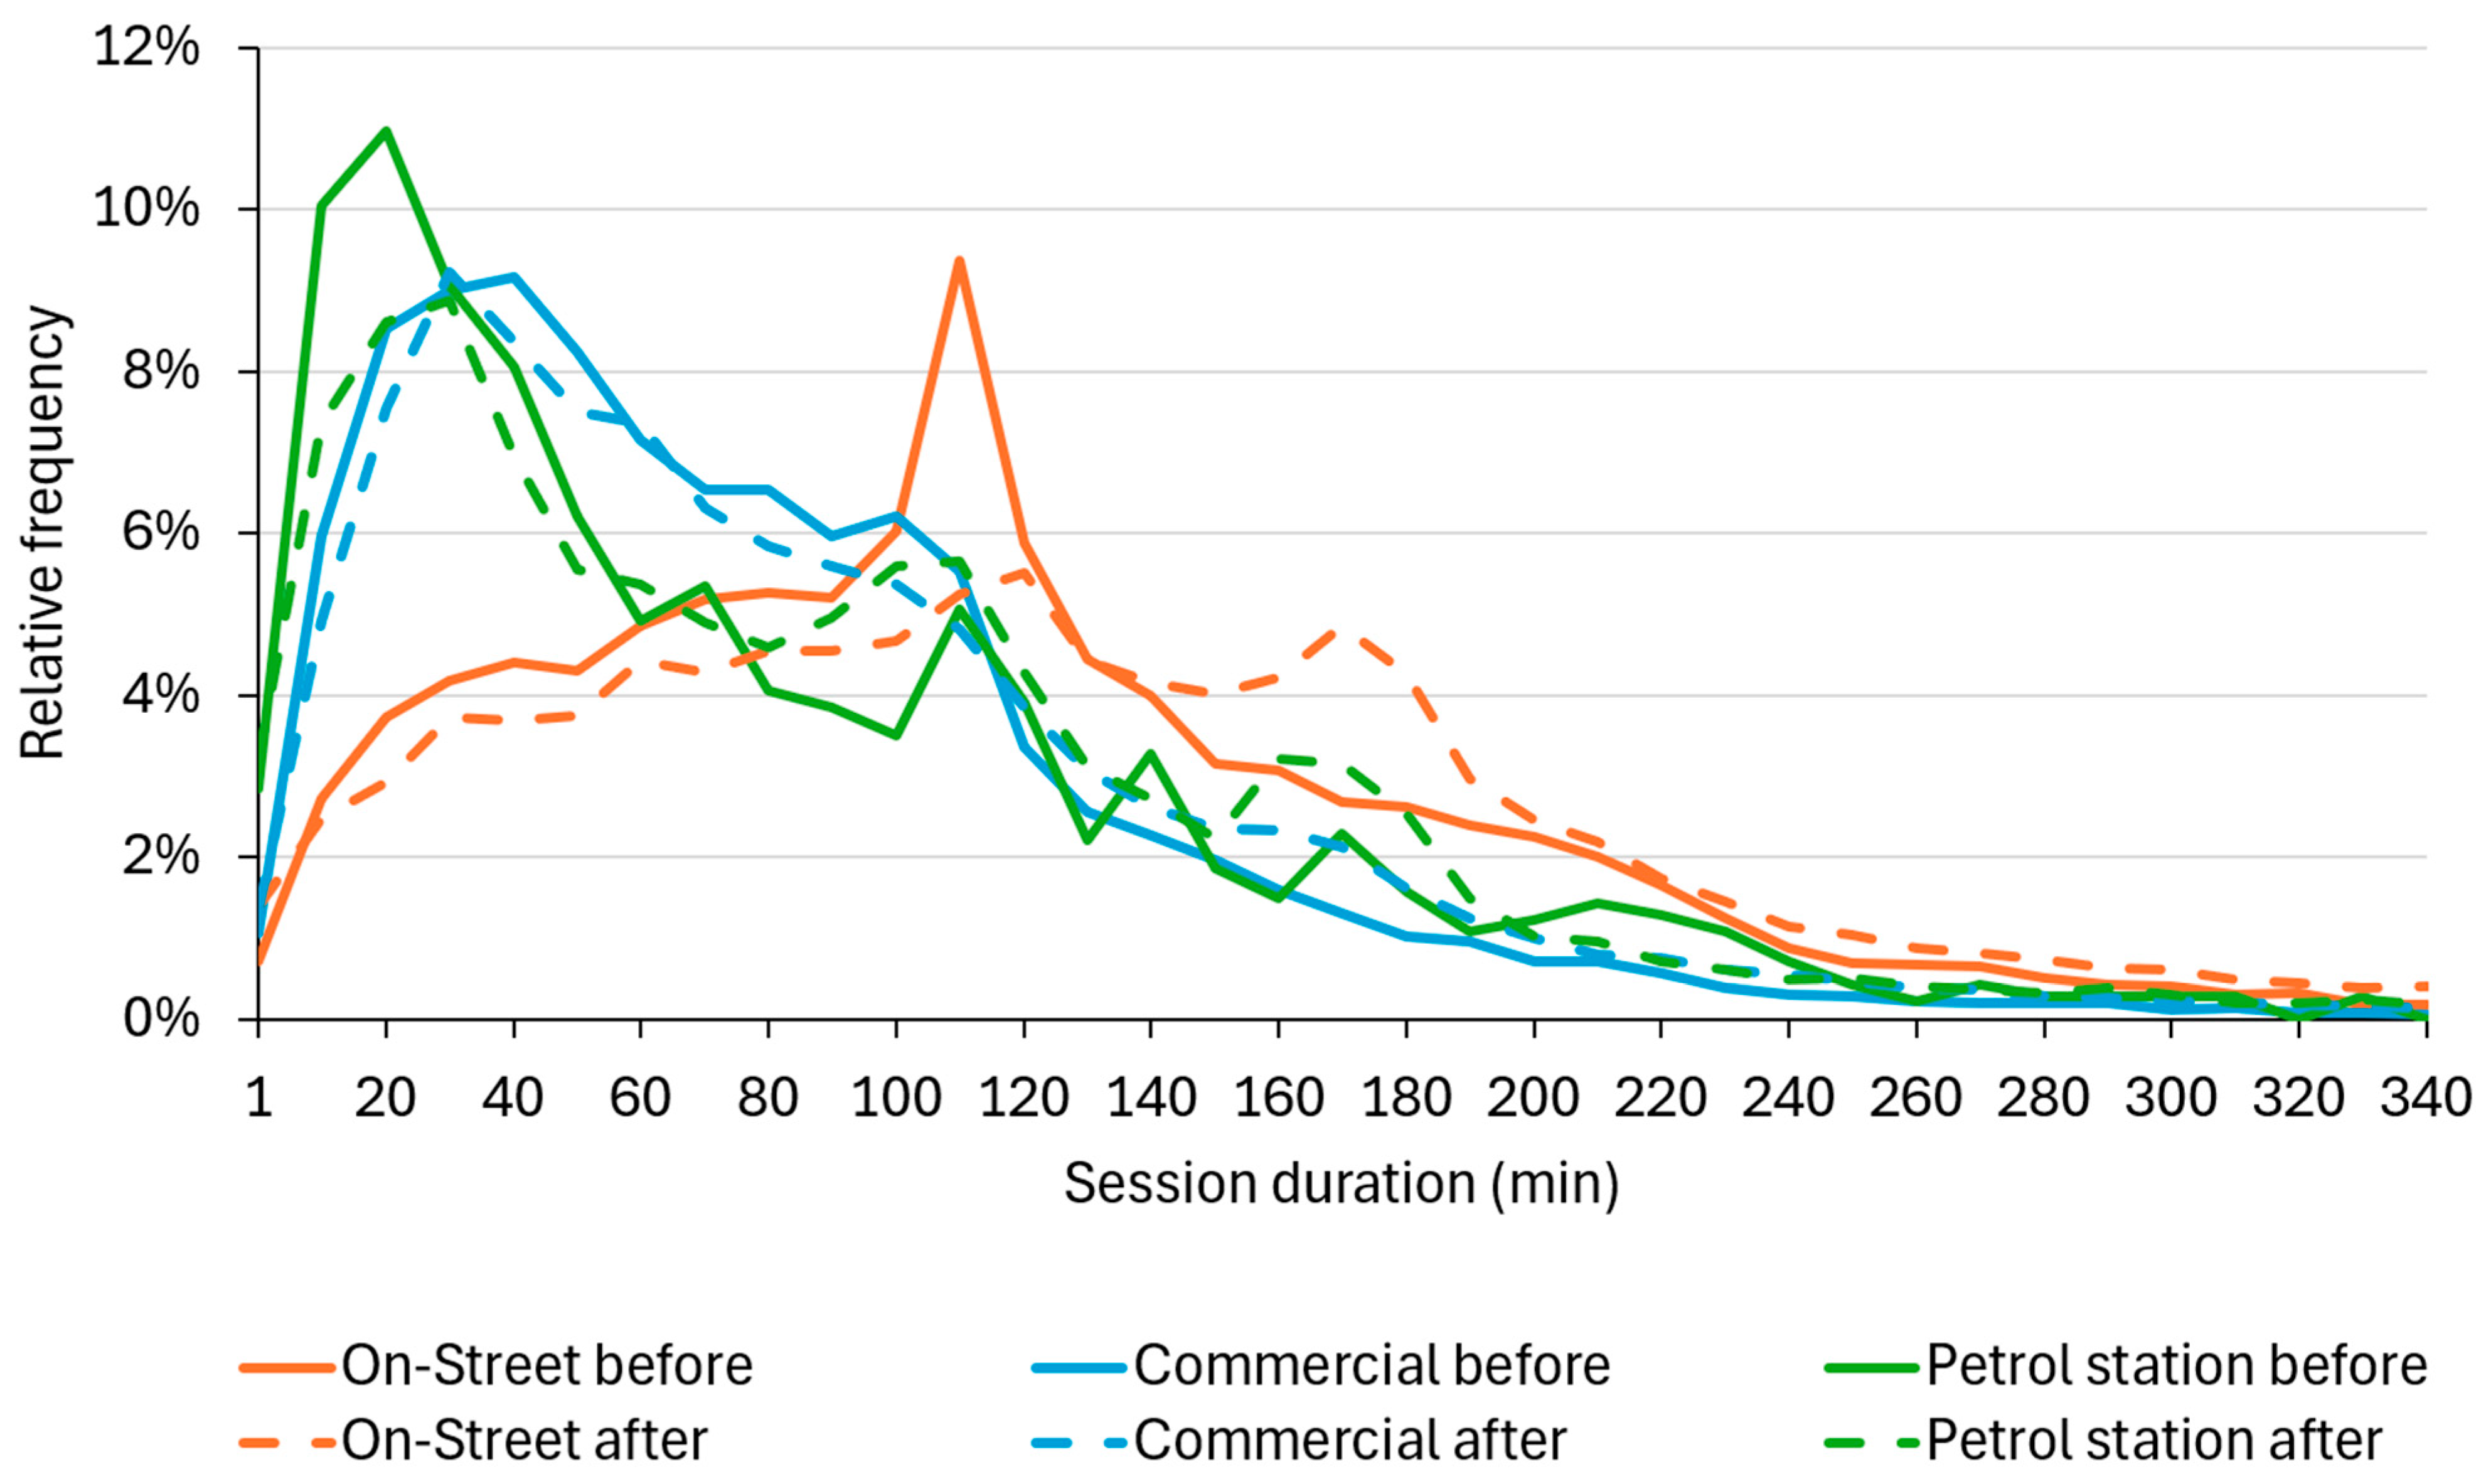
Figure 4 illustrates the distribution of AC charging session durations. In this specific case, the overstay-fee exemption period for public AC charging was initially set at 120 min and increased to 180 min starting in September 2022. This policy appears to have influenced the charging behavior in the public charging subgroup on-street, as evidenced by a distinct local maximum in their duration distribution. In contrast, as shown in
Figure 5, the commercial and petrol station subgroups does not exhibit a similar response to the time limit. The on-street subgroup shows the longest average charging duration among public charging subgroups (see
Table 3).
In comparison, the duration distribution for workplace charging presents a more balanced profile, with notable peaks around 30 and 200 min. The average session duration for workplace charging is substantially longer than for public charging, reflecting different usage patterns and user expectations (see
Table 2).
The results of the Kruskal–Wallis test confirm that there is a statistically significant difference among all types of charging (p-value < 0.05). However, the difference between the commercial and petrol station subgroups was not found to be statistically significant based on the post hoc test.
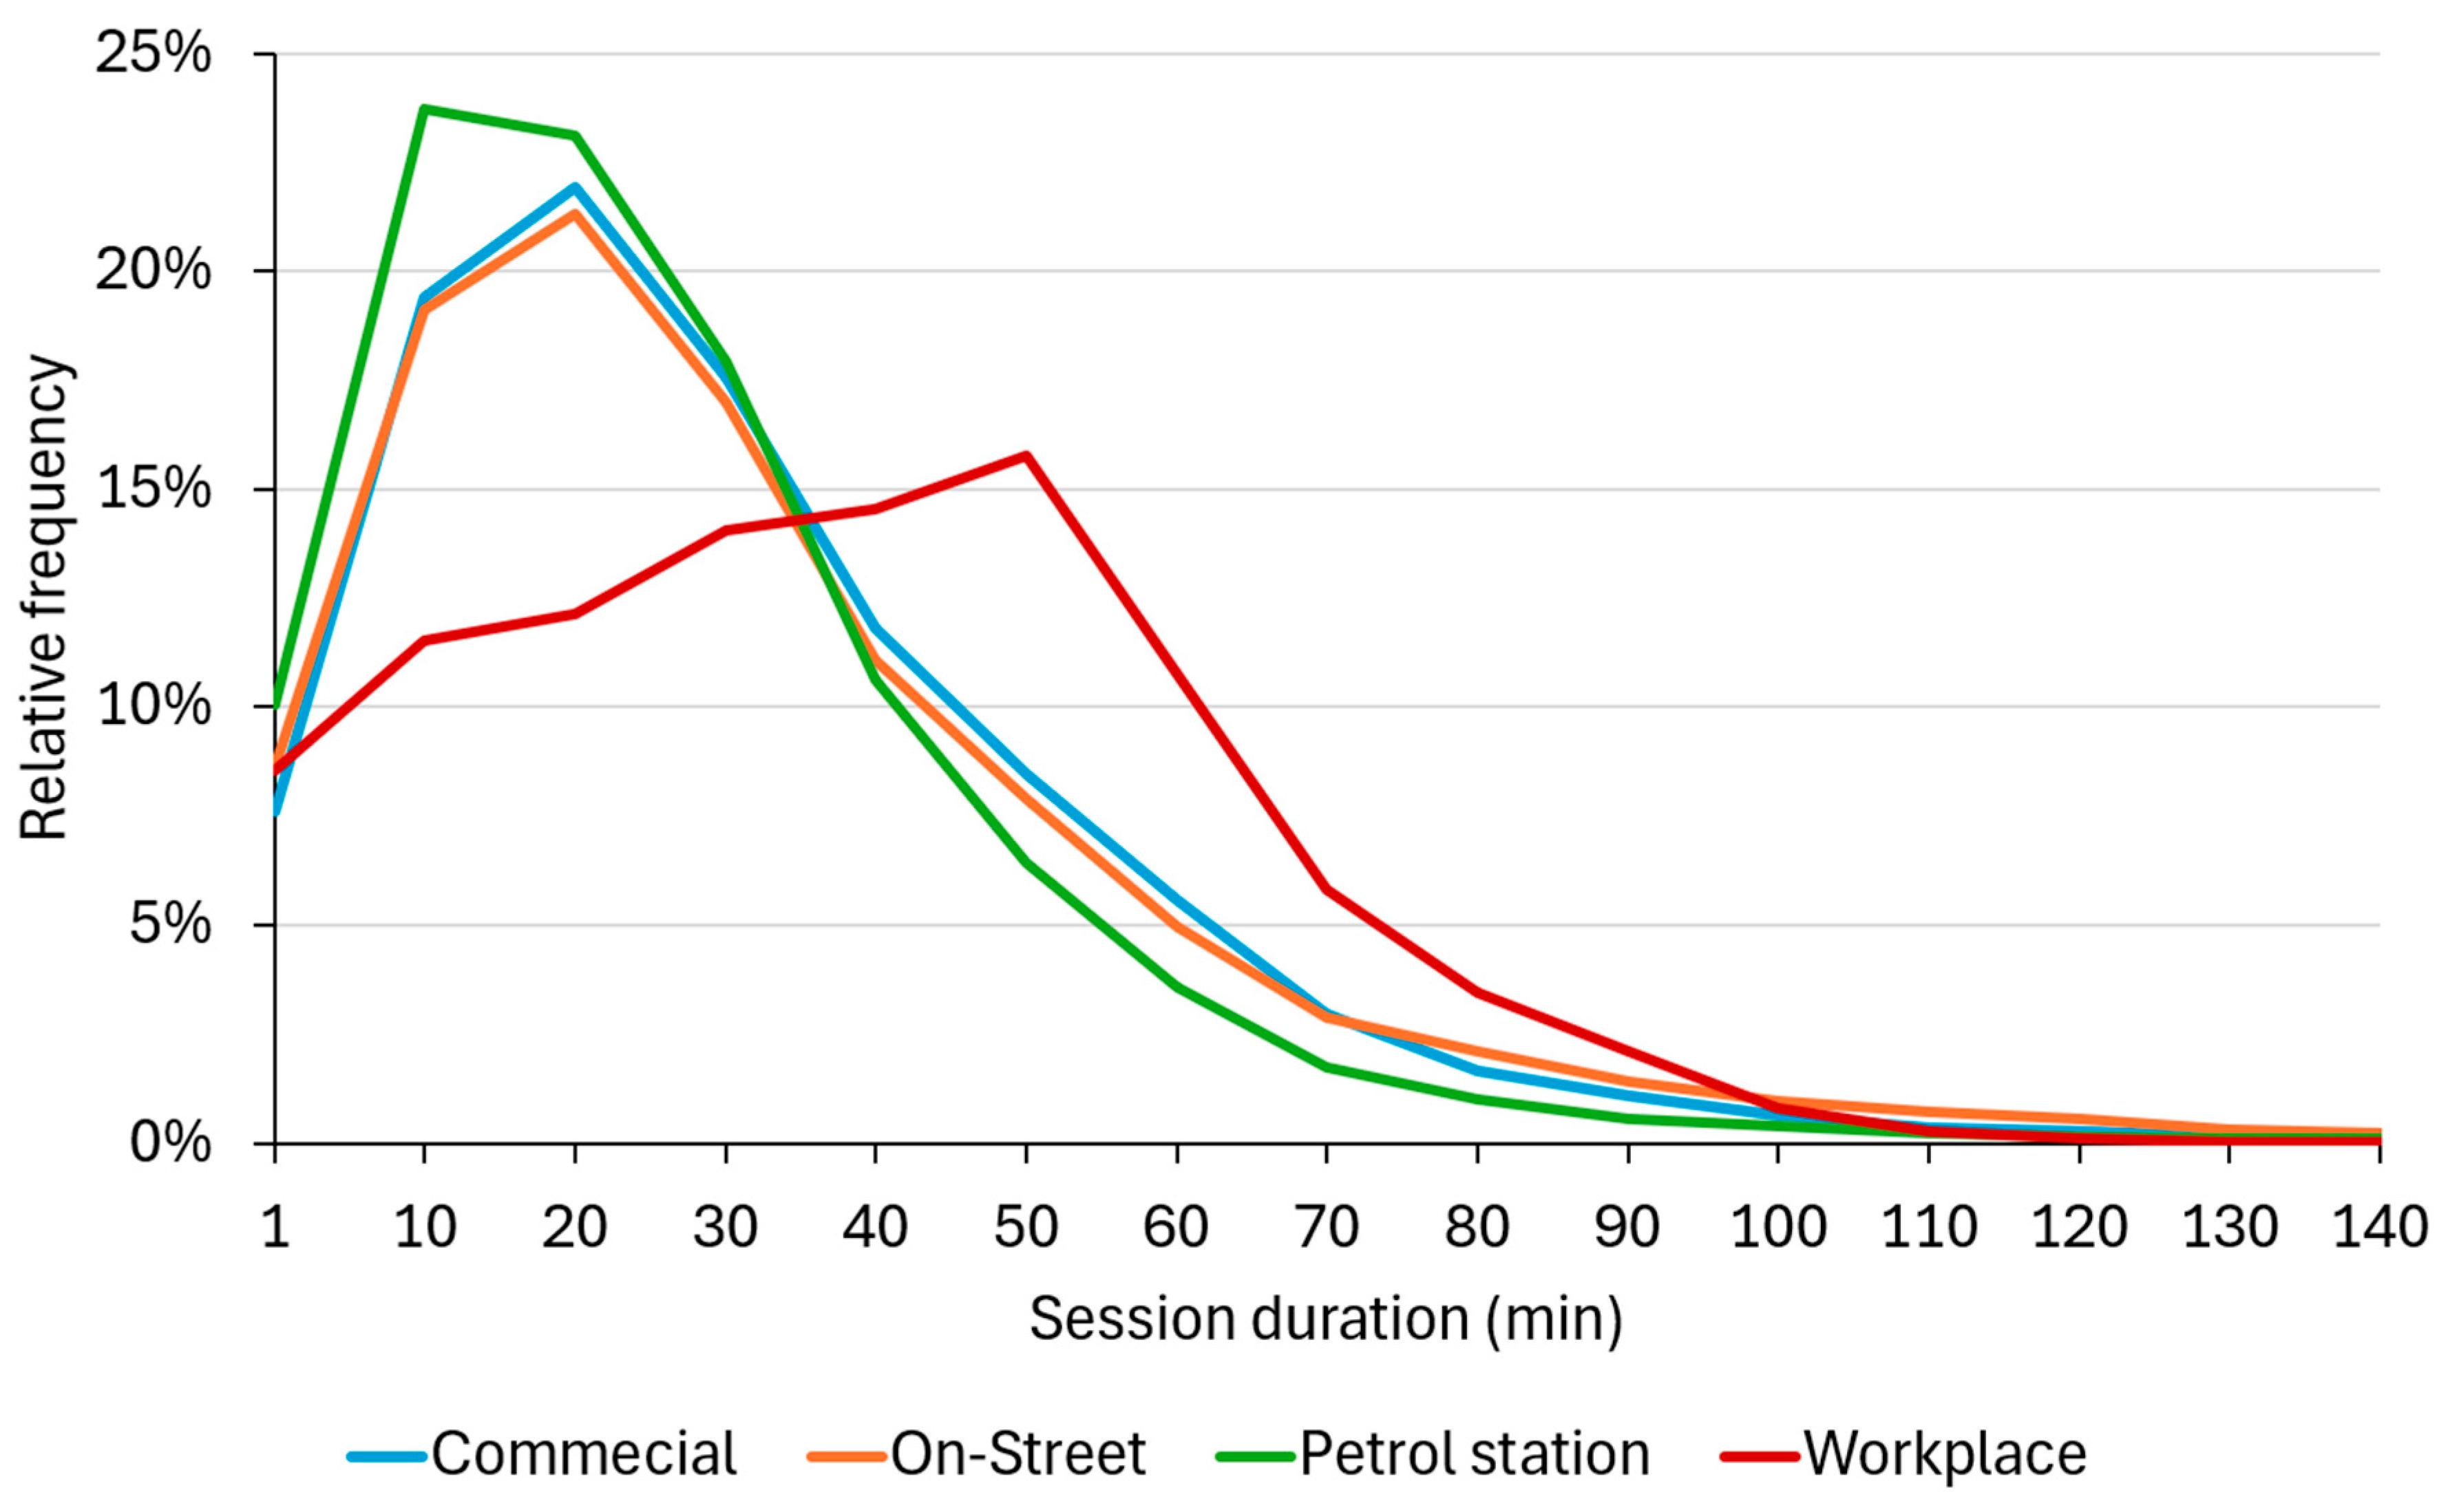
Figure 6 presents the characteristics of DC charging duration. All categories of public DC charging display a similar peak around 20–30 min, followed by a nearly identical distribution. The overstay fee for public DC charging is triggered after 60 min in this concrete case; however, no significant peak in session duration is observed at this threshold. This indicates that drivers generally perceive approximately 30 min as the optimal stopover duration during a journey, despite this period typically being insufficient for a full recharge.
For workplace DC charging, the peak session duration is shifted to the 50–60 min range. This shift is reflected in the significantly longer average session duration, as presented in
Table 4. This may indicate that users tend to charge their vehicles to the desired level since they are not constrained by being on the road.
According to the Kruskal–Wallis test, there is no statistically significant difference between on-street and commercial DC charging. However, the difference between the remaining subgroups is statistically significant (p-value < 0.05).
3.4. Energy Delivered per Session
The amount of energy delivered during a single charging session primarily depends on the vehicle’s battery capacity and its SOC at the start and end of the session, this is why the mix of PHEVs/BEVs has an essential influence on the final result.
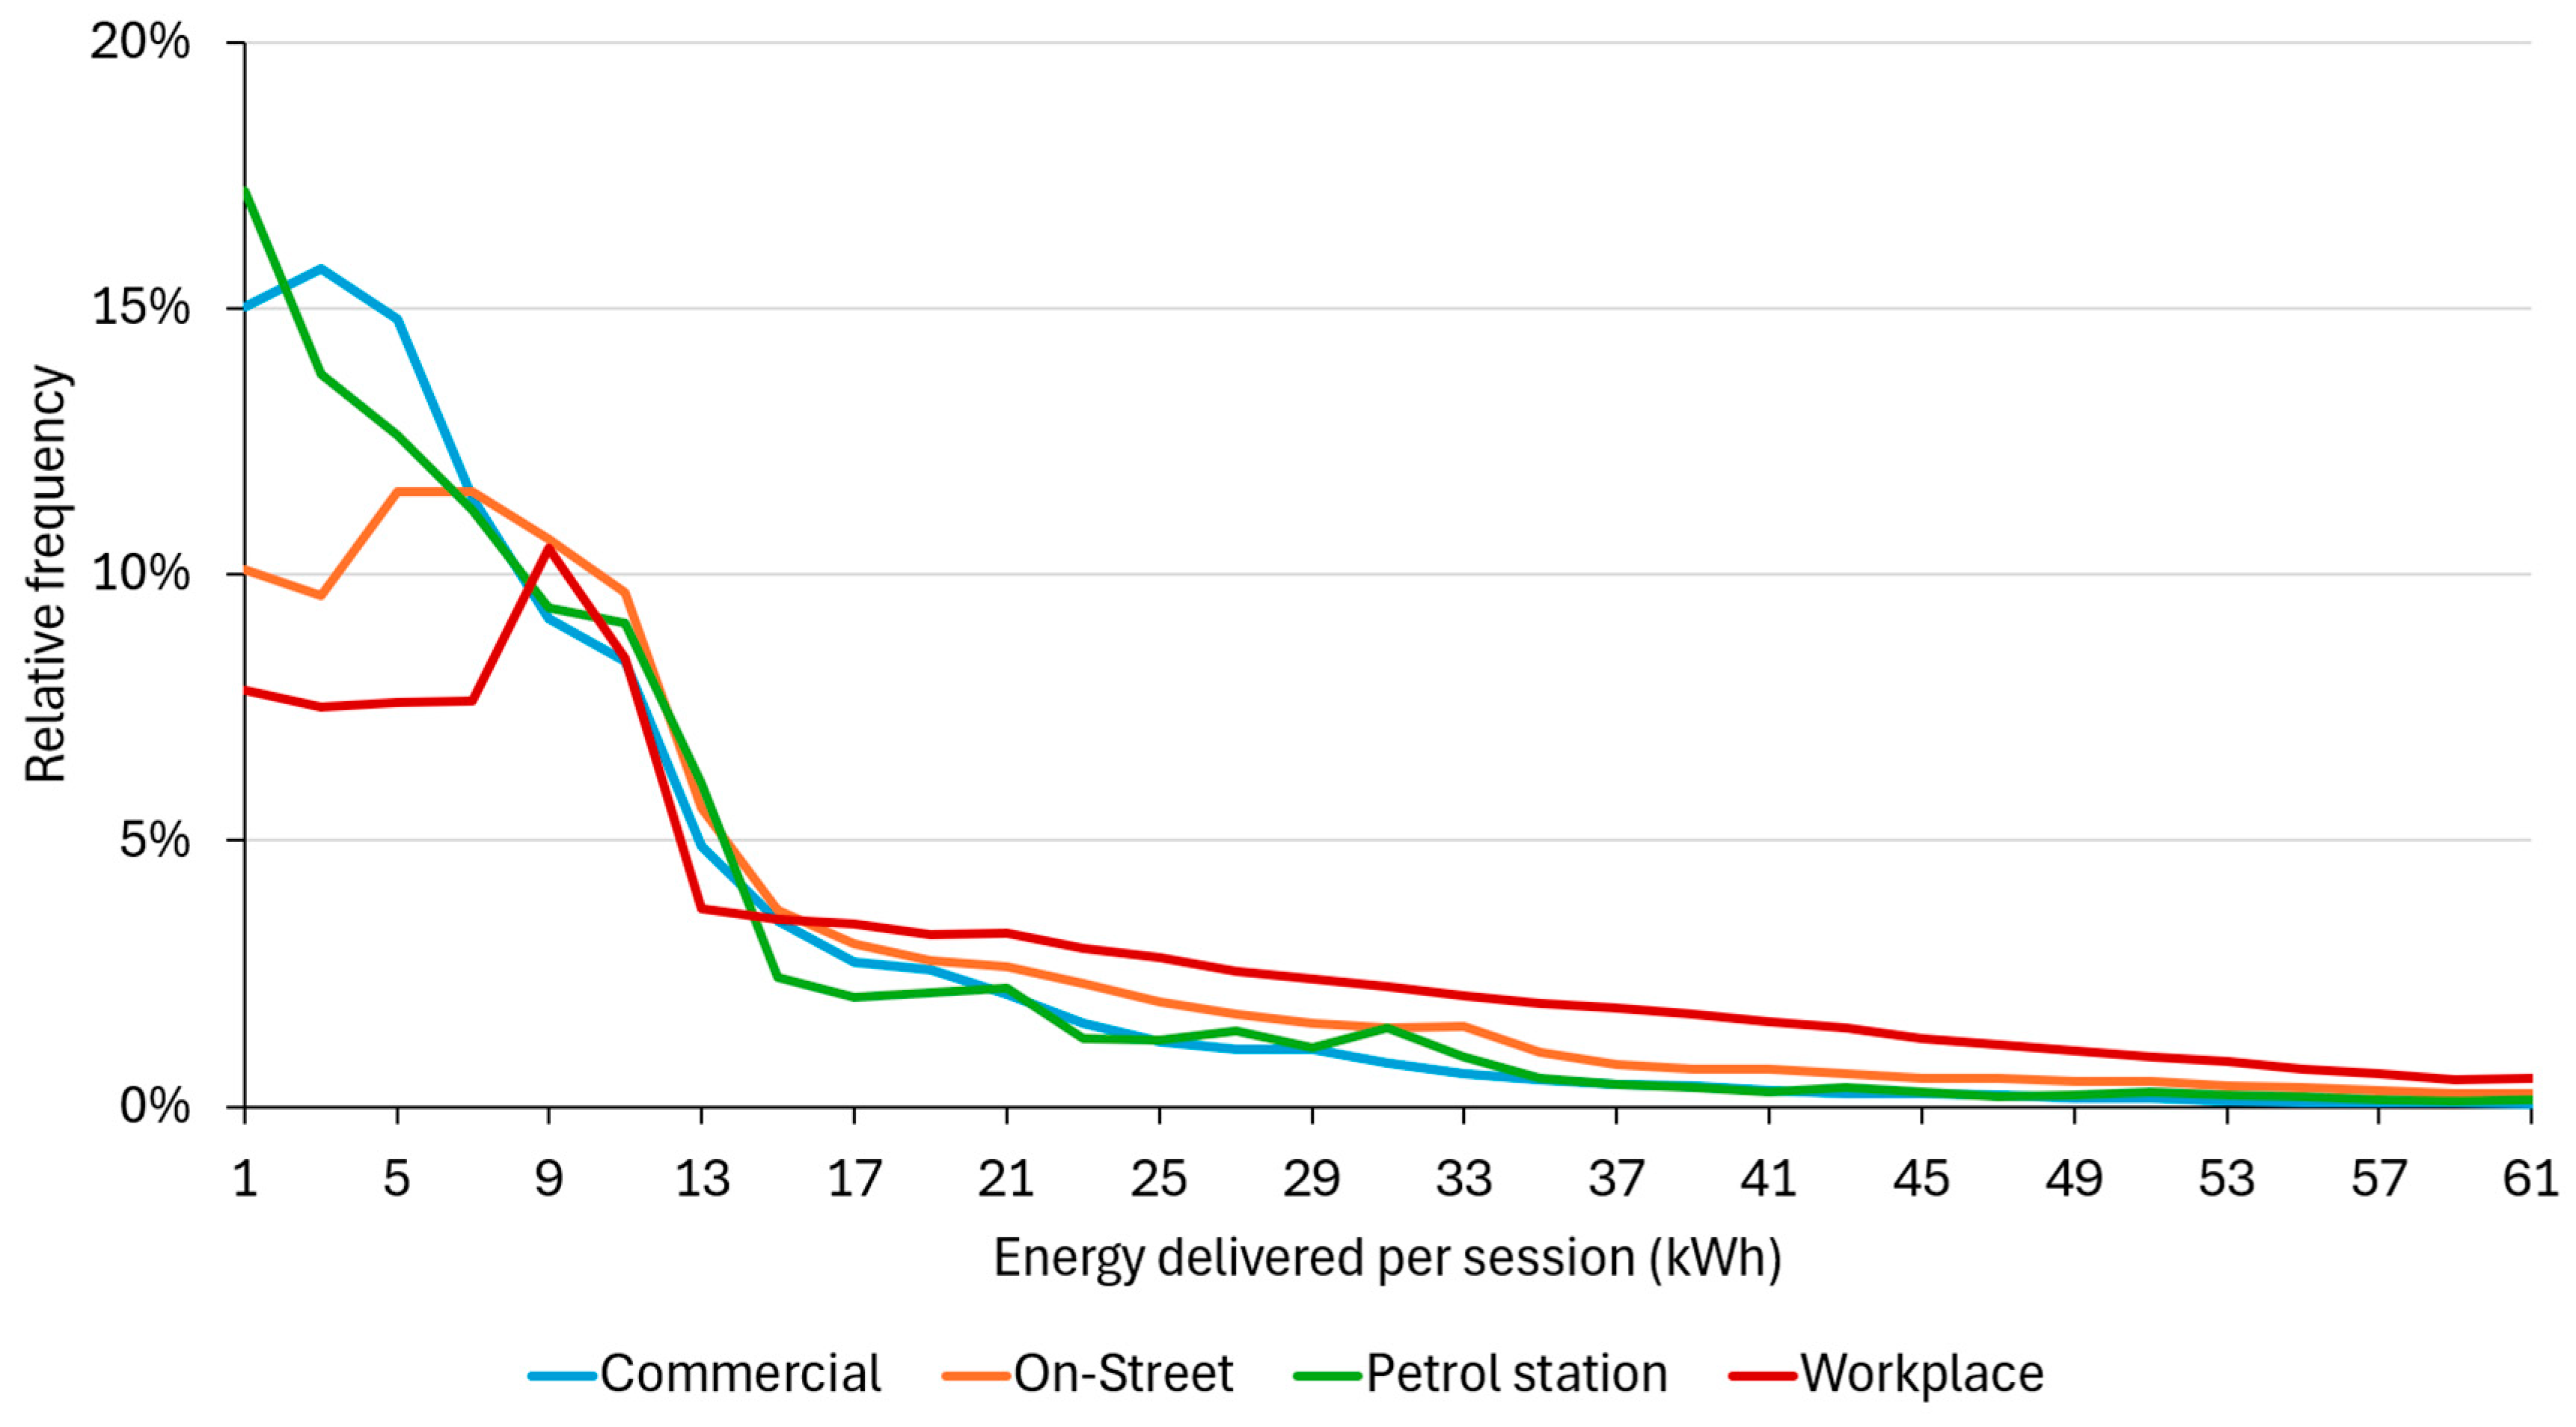
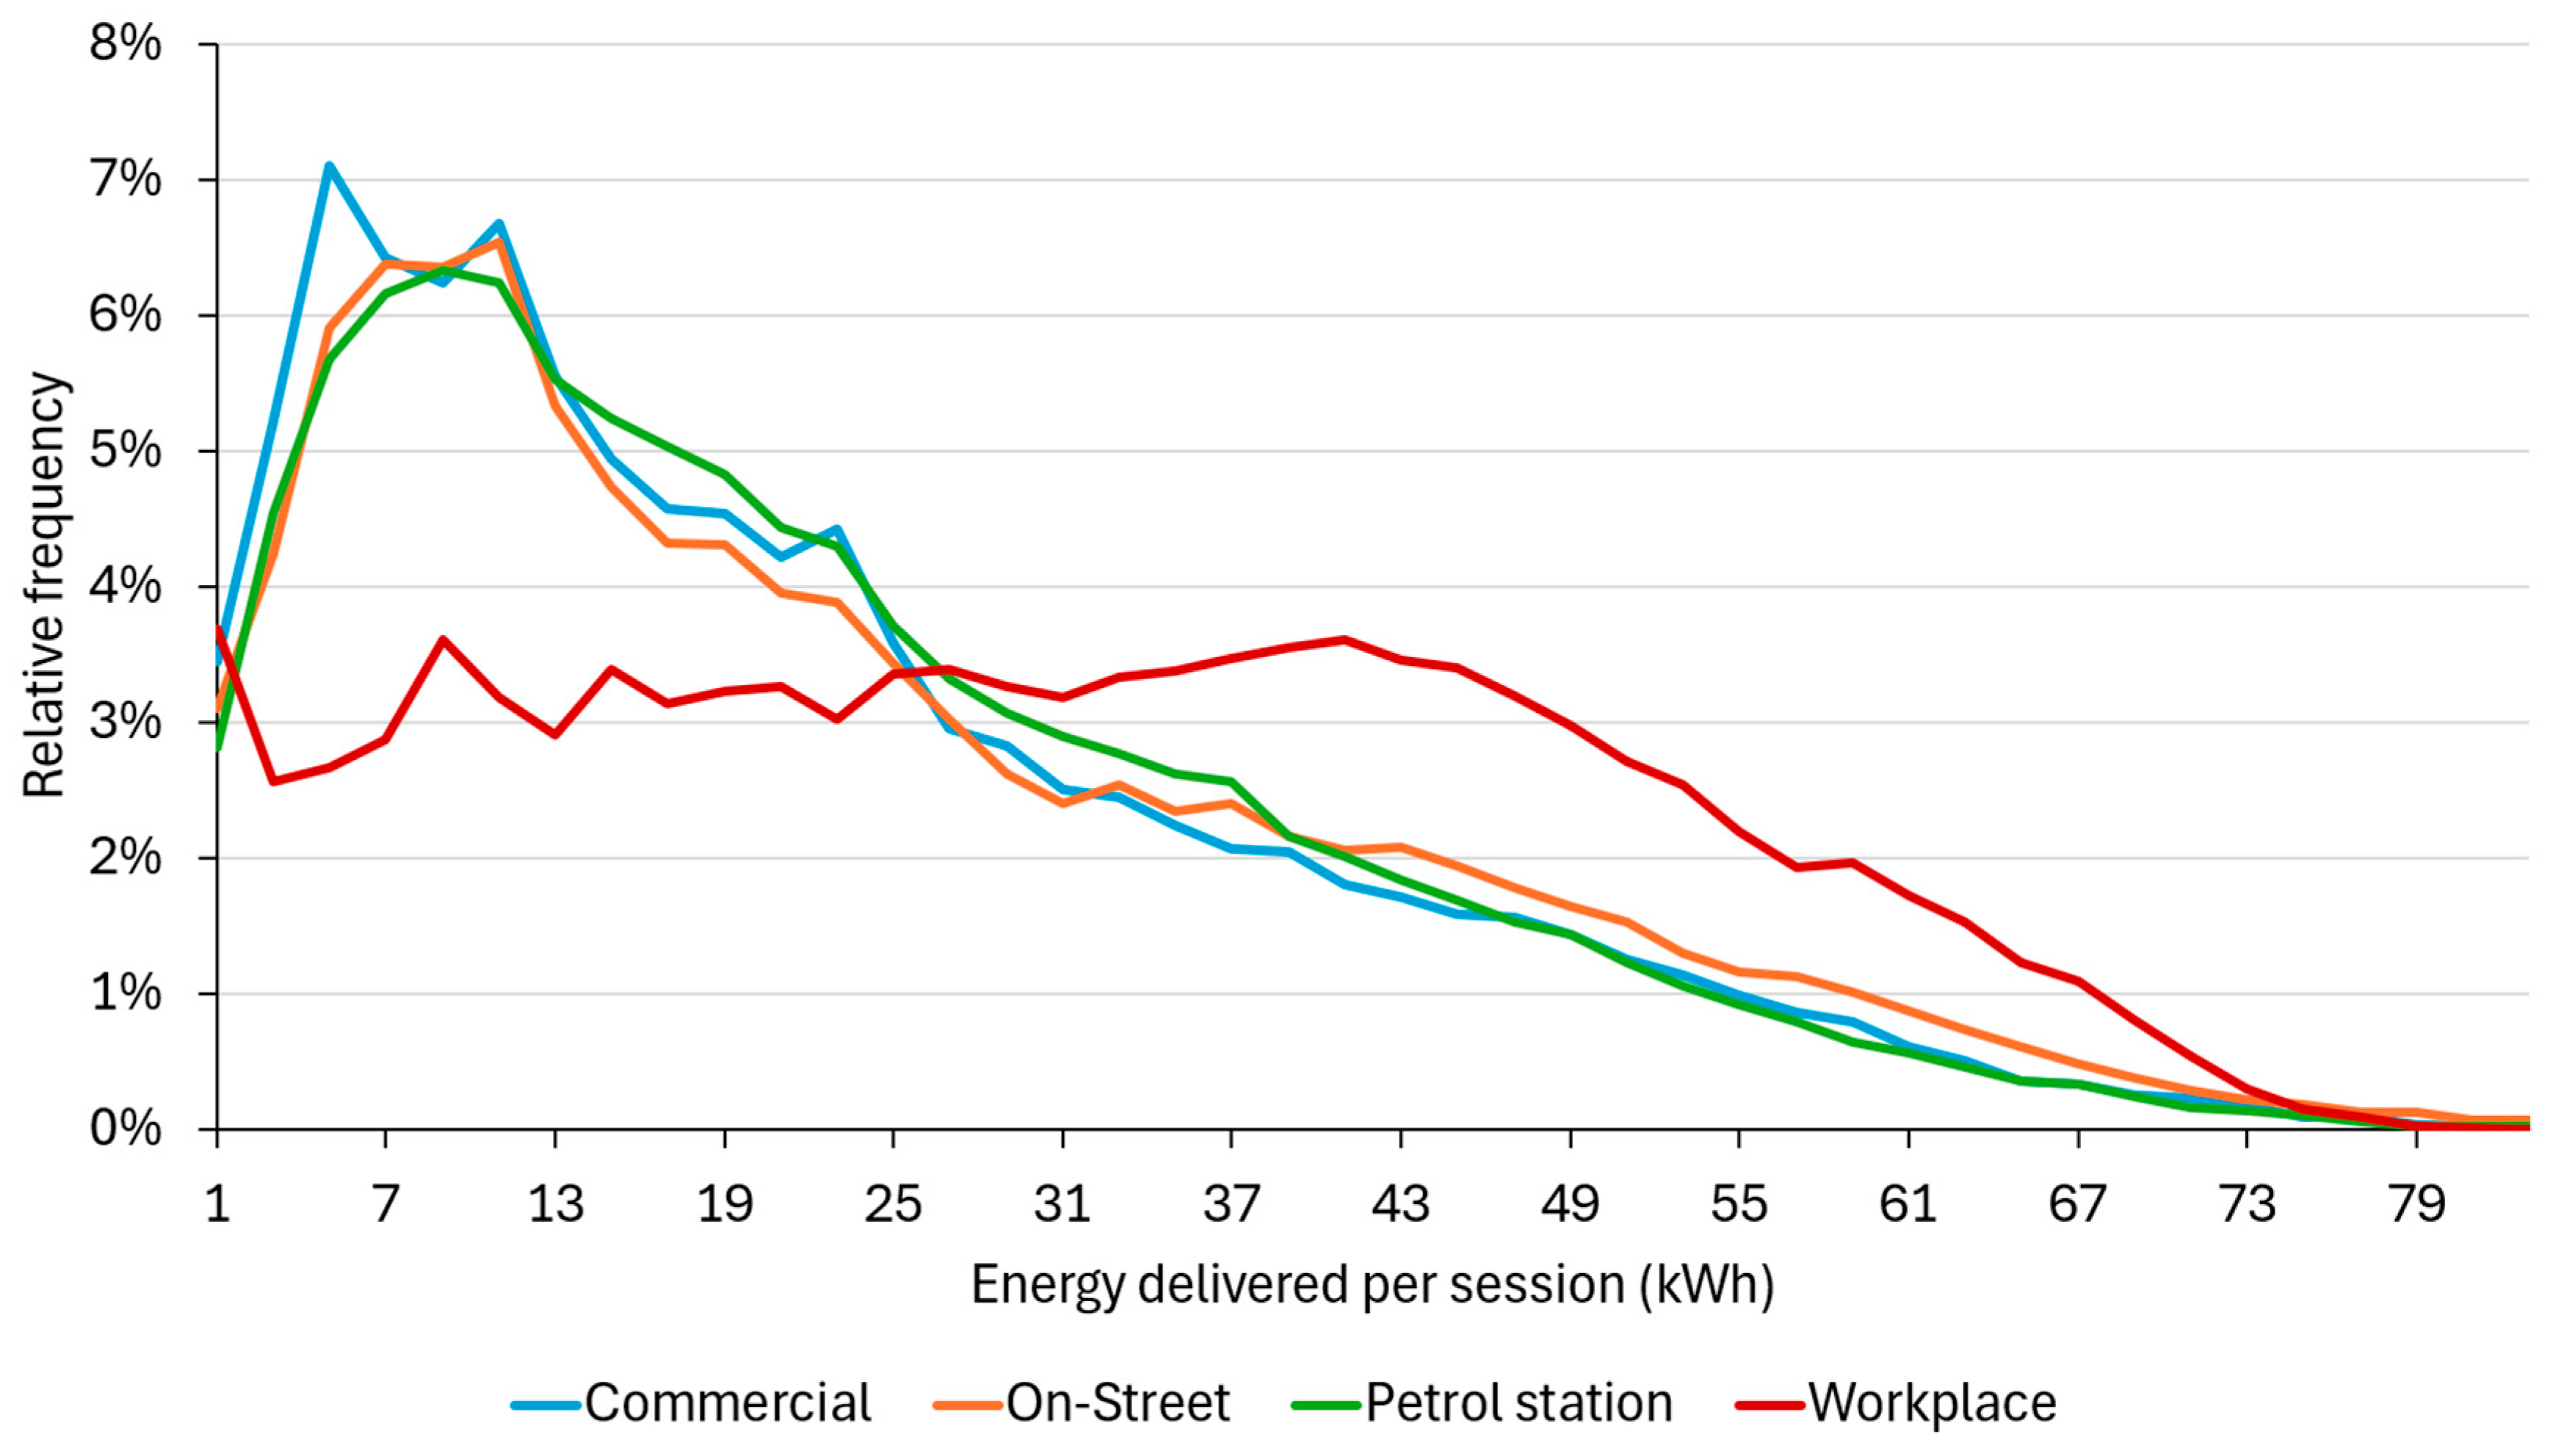
As shown in
Figure 7 and
Table 5, the average energy delivered per session at public AC charging stations ranges from 10 to 14 kWh, depending on the subgroup. When compared to charging duration (see
Section 3.3), the observed energy peaks—around 7 kWh for the public charging clusters—correspond to charging session durations of 20–30 min for BEVs charging at 11 kW (a typical value), 120 min for PHEVs/BEVs charging at 6.6–7.4 kW, and up to 180 min for PHEVs charging at 3.6 kW.
In the context of workplace charging, a distinct peak is observed at approximately 9–11 kWh. This reflects the prevalence of 11 kWh battery-equipped PHEV models in corporate fleets and the common user behavior of charging from 0% to 100% SOC. The average energy delivered per session at workplace charging stations is nearly 20 kWh, significantly higher than at public charging points. However, for workplace charging, the relationship between session duration and energy delivered per session is more difficult to interpret, as users are not incentivized to vacate the charging space once the vehicle is fully charged. This results in longer parking durations being included in the session time, leading to a distortion of statistical outputs.
A Kruskal–Wallis test revealed no statistically significant difference between the commercial and petrol station subgroups, while the differences between the other groups were statistically significant (p-value < 0.05).
In the case of public DC charging, only minor differences were observed between the defined subgroups (see
Figure 8 and
Table 6). Similar peaks in energy delivered per session were identified as in the case of charging duration (see
Figure 5); specifically, a peak at 7–10 kWh corresponds to a 10–20 min charging session at an approximate rate of 50 kW. Based on the average energy delivered (23.6 kWh) and the average session duration (34.2 min), the calculated average charging power reaches 41 kW, which appears realistic.
For workplace charging, the average energy delivered is again higher (32.8 kWh) compared to public DC charging (23.6 kWh). A peak at around 40–42 kWh (see
Figure 8) aligns with a corresponding peak in session duration observed in the charging duration distribution (
Figure 6).
In this case, the Kruskal–Wallis test confirmed statistically significant differences across all charging types (p-value < 0.05).
3.5. Temporal Trends in Charging Behavior
Based on the comparison of selected parameters (average session length and average energy delivered per session) for public charging between 2022 and 2023 (see
Table 7), a clear trend can be observed: both the average charging duration and energy delivered per AC charging session increased by 13% and 17%, respectively. This trend reflects the growing battery capacities of EVs available on the market. A supporting factor is the extension of the free charging time limit without incurring an overstay fee from 120 to 180 min. These effects outweighed opposing trends, such as the slight decrease in the BEV/PHEV ratio (from 70/30 to 68/32) and the generally higher ambient temperatures during 2023. The observed increases in charging time and energy delivered per session were statistically confirmed using the Kruskal–Wallis test (
p-value < 0.05).
In the case of DC public charging, the energy delivered per session increased by 20%, while charging duration rose by 8%, indicating an increase in effective charging power. This can likely be attributed to the expansion of DC chargers exceeding 80 kW introduced during 2023, as well as a growing number of EVs capable of higher charging rates.
It is anticipated that energy delivered per charging session will continue to increase over time, driven by the ongoing development of EVs with larger battery capacities, advancements in fast-charging technologies in EVs on the market, and the wider deployment of high-power charging infrastructure. A similar upward trend is expected in the duration of AC charging sessions, assuming a fixed maximum charging power of 22 kW. In contrast, the evolution of DC charging duration will largely depend on the adoption and utilization of UFCs, which have the potential to significantly reduce charging times.
Furthermore, the observed increase in both analyzed parameters within the “On-Street” charging cluster is significantly higher compared to the “Commercial” or “Petrol station” clusters. This may reflect different user motivations when utilizing charging stations across these subgroups. Users charging at shopping centers or petrol stations are generally less willing to remain at the location longer than necessary.
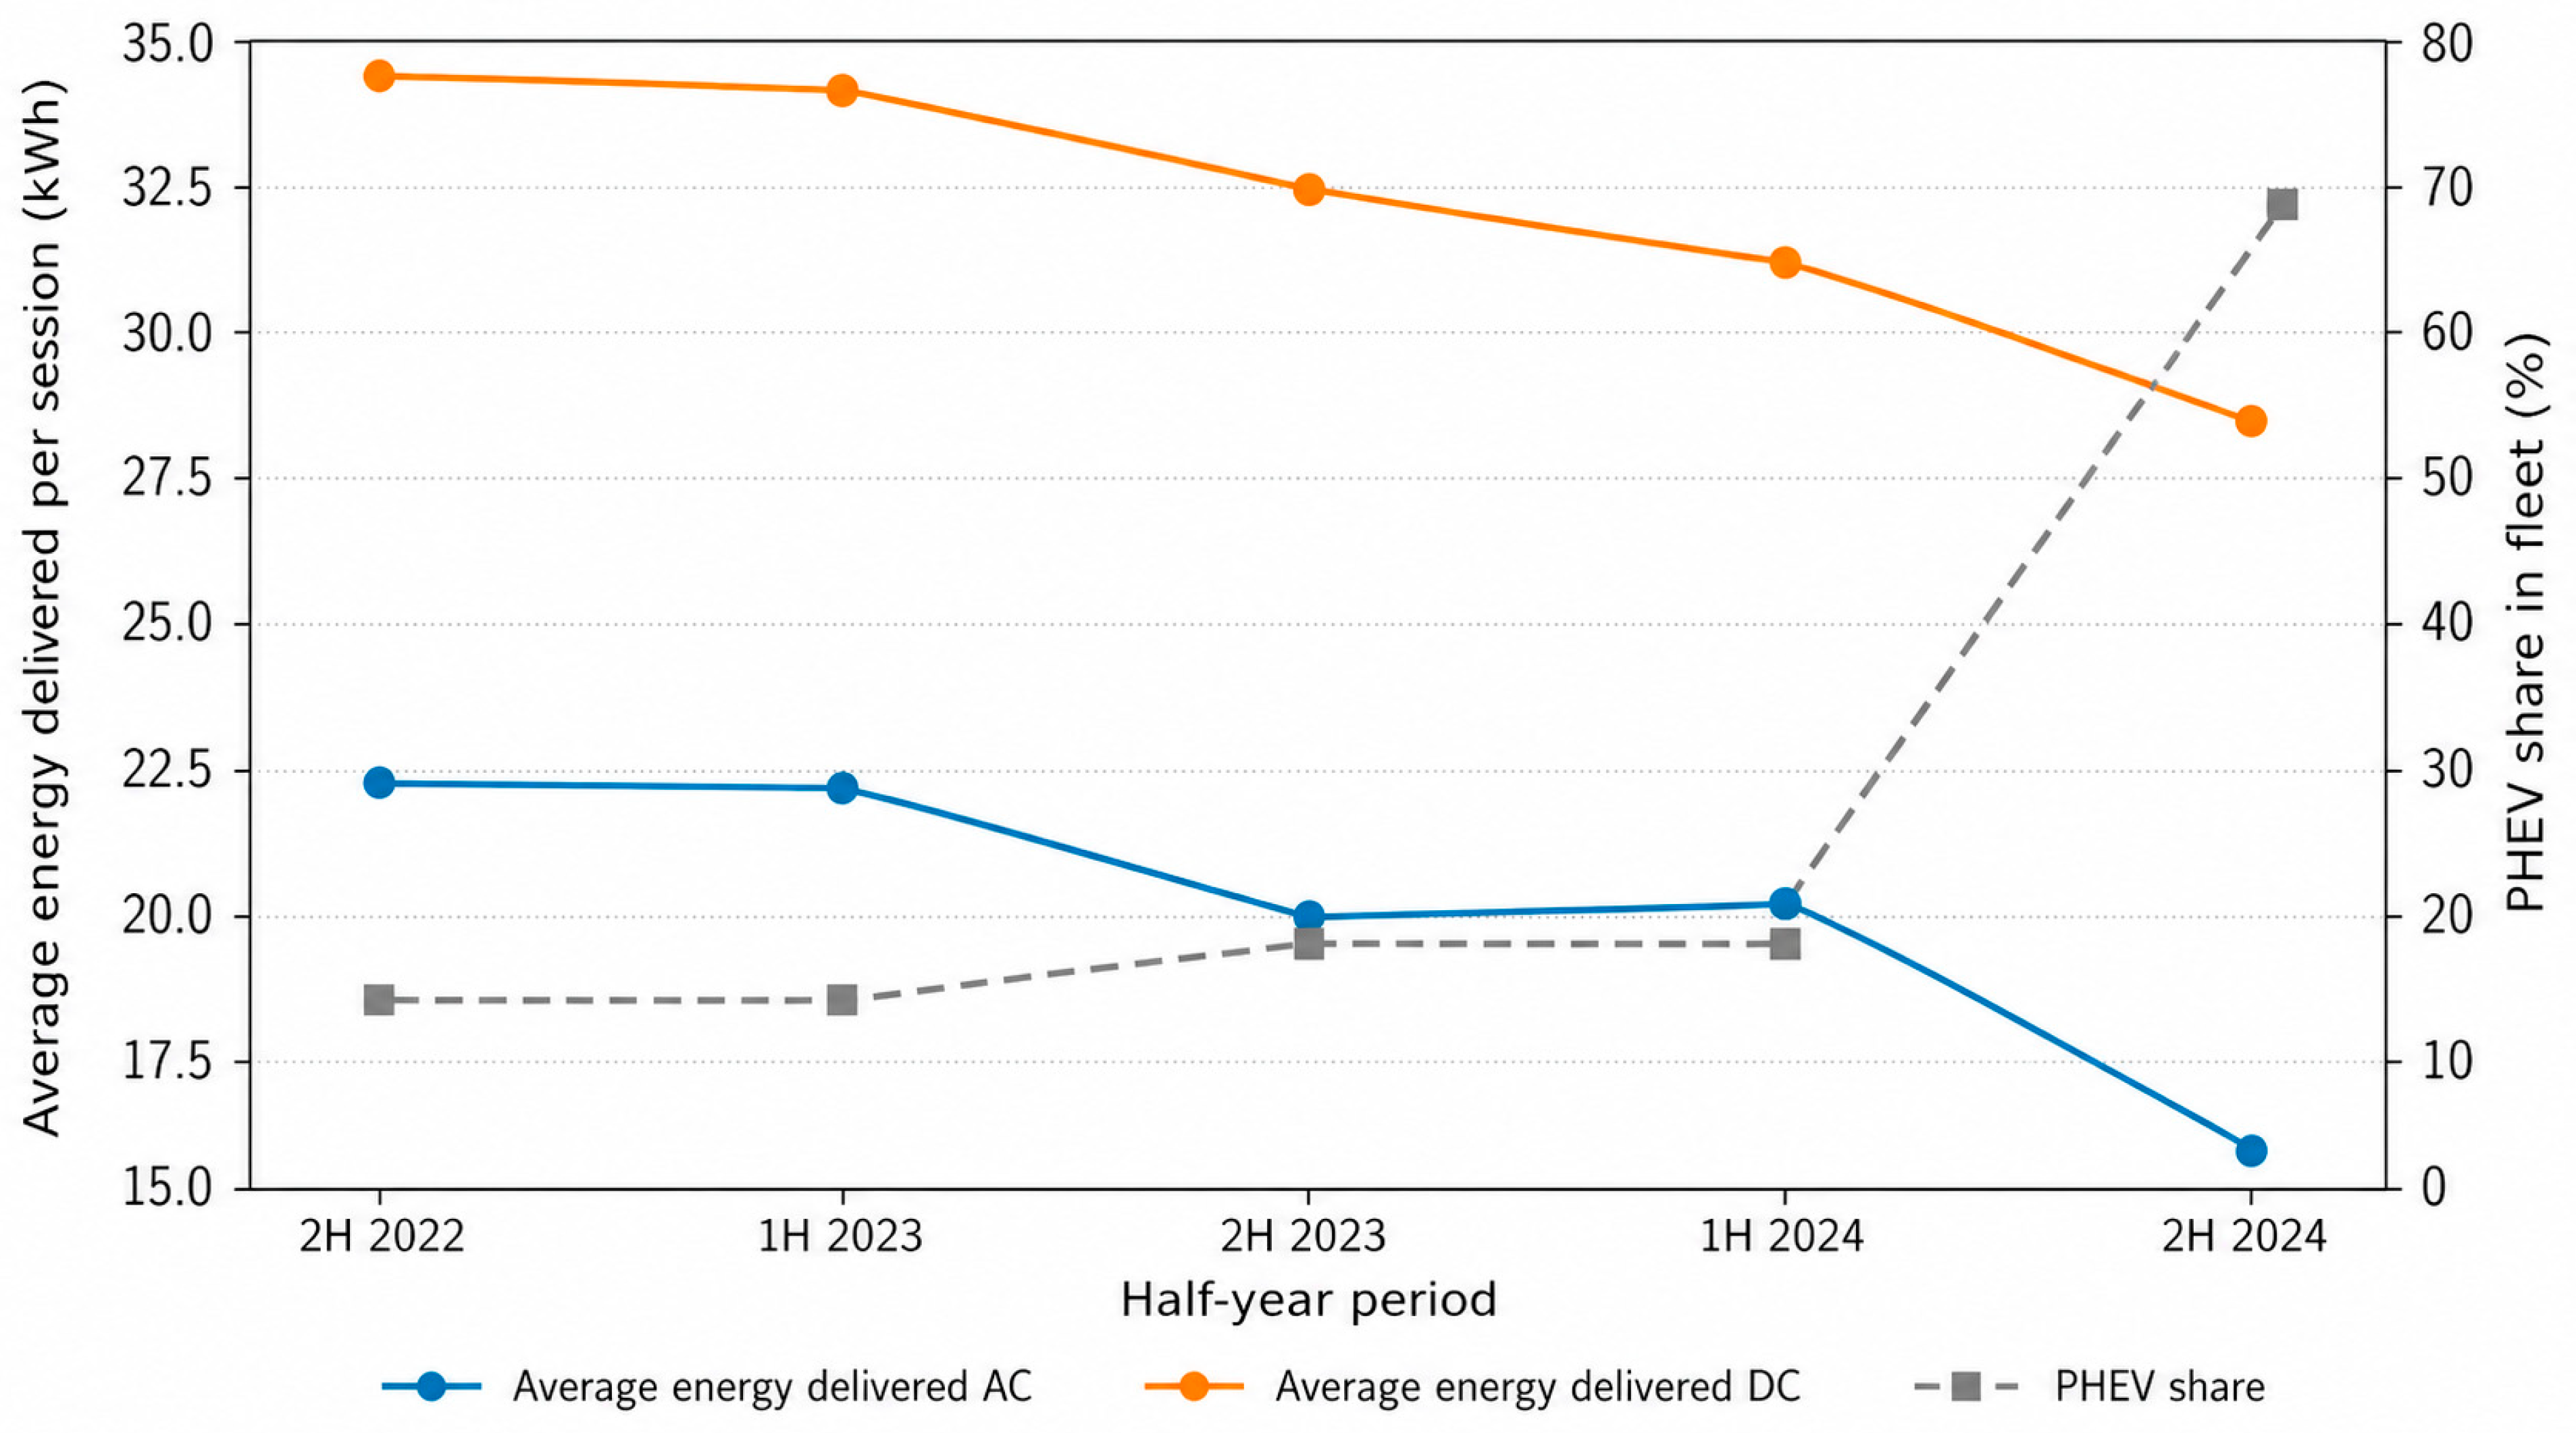
A similar analysis of workplace charging yielded different results, as presented in
Figure 9. Between 2022 and 2024, both examined parameters showed a significant decline across both charging types. A likely explanation lies in the substantial shift in the vehicle fleet composition based on the change of an internal fleet policy: the ratio of PHEVs to BEVs changed from 15/85 in 2022 to 68/32 by the end of 2024. This increase in the share of PHEVs with both AC and DC charging capability, which typically have smaller battery capacities compared to BEVs, led to shorter charging durations and reduced energy delivered per charging session for both AC and DC charging.
4. Discussion
This study examines charging behavior of EV users in the Czech Republic, emphasizing the contrasting patterns observed between public and workplace charging. A key finding highlights a distinct divergence in weekly peak energy delivered per session: workplace charging peaks on Mondays, whereas public charging reaches its maximum on Fridays. This trend is consistent across both AC and DC charging.
Some studies analyzing public charging sessions confirm the peak on Friday for AC and DC, e.g., ref. [
34] for the UK. Data [
35] in for Scotland show peak on Thursday for AC and on Friday for DC. There is a similar inconsistence to be seen in [
13] for Canada with an AC peak on Thursday and DC peak on Saturday. In the case of Italy, concretely Southern Tyrol [
16], there is a very strong consumption in weekends in comparison to working day. This specific area is strongly influenced by tourism, which can be the reason for that. But also in Germany DC charging especially on Saturday is very strong explained by long weekend trips [
18]. Anyway, there are also differences in the workplace charging, in data from the Netherlands [
36], Monday does not prevail in distribution of charging sessions.
Further behavioral distinctions are evident in the temporal distribution of charging session start times. Workplace AC charging shows a sharp peak between 07:00 and 08:00, aligning with standard work arrival times. There is a very similar picture in [
36] in the case of the Netherlands, but postponed to 9 a.m., which is determined by the typical start of working hours in the given region or industry.
In contrast, public charging sessions are more evenly spread throughout the day, with a decline following a peak at 18:00. AC public charging displays three notable peaks—at 08:00, 12:00, and 18:00—while DC public charging is most frequent between 14:30 and 17:00. Data from the Netherlands [
36] indicate demand peaks around 9:00 and after 18:00, without distinguishing between AC and DC charging. In Norway and Sweden, DC charging shows a peak followed by a decline after 15:00, as reported in [
37]. Canadian data [
13] reveal that DC charging peaks around 16:00, while AC charging exhibits primary peaks around 7:00 and again at approximately 13:00. Similarly, data from Germany [
18] demonstrate distinct peak times for AC and DC charging—AC charging typically begins to rise between 6:00 and 9:00 and declines after 16:00, whereas DC charging peaks around 11:00. Three primary behavioral patterns were identified for public AC charging: initiation upon arrival at work (commuters), prior to departure, and after returning home. DC charging, by contrast, is typically associated with travel or shopping, showing peak usage between 11:00 and 18:00.
Charging session duration and energy delivered per session further differentiate public from workplace charging. These disparities are largely influenced by variations in parking infrastructure and pricing strategies. At workplaces, users are not incentivized to disconnect their vehicles upon reaching full charge, benefiting instead from electricity prices significantly below market rates. As a result, both AC and DC workplace sessions tend to be longer and consume more energy on average compared to public sessions. From a grid-integration perspective, this means that workplace charging provides a longer and more predictable flexibility window than most public charging contexts. This interpretation is supported by recent research on a real-world workplace charging facility [
38]. Charging can potentially be shifted within the working day, coordinated with local photovoltaic generation at company sites, or managed at the fleet level to reduce simultaneous charging peaks. Such controlled charging could support load balancing by limiting morning demand spikes and distributing charging demand more evenly over working hours. Therefore, workplace charging should be considered not only as an additional charging location, but also as a potentially controllable demand-side resource.
This flexibility is particularly relevant for future smart-charging and V2G applications, because vehicle availability and plug-in duration are key prerequisites for using EVs as flexible distributed storage. However, V2G implementation also requires economic incentives and must account for battery degradation, which is increasingly treated as a central constraint in vehicle–grid interaction models [
39,
40,
41]. Several real-world V2G pilots illustrate the practical relevance of fleet-based and workplace-oriented charging for flexibility services. The Parker project in Denmark [
42] demonstrated the technical feasibility of using company-fleet EVs and bidirectional DC chargers to provide grid services, including frequency containment reserve. The more recent ongoing V2VNY project from UK [
43] explicitly targets AC-based V2G workplace and fleet charging. These examples suggest that workplace charging is a particularly promising context for managed charging and potential V2G deployment, although large-scale implementation still depends on compatible vehicles, bidirectional chargers, aggregation platforms, user incentives, and the economic treatment of battery degradation.
The results also indicate that the BEV/PHEV fleet composition is an important factor influencing aggregate charging parameters. This effect is most evident in the workplace dataset, where the increasing share of PHEVs in the corporate fleet was accompanied by a decrease in average energy delivered per session and shorter charging durations. This relationship is technically plausible, because PHEVs typically have smaller battery capacities and lower charging-power requirements than BEVs, and therefore require less energy per charging event. This interpretation is also consistent with previous empirical evidence from charging-session data, where vehicle technology, battery capacity, and charging-related parameters were shown to be associated with charging behavior, including dwell time and energy delivered per session [
44]. In the public charging dataset, the effect of PHEVs is more difficult to identify directly, because individual sessions in the available dataset cannot be assigned to specific vehicle types. Nevertheless, some peaks in the AC energy delivered per session distributions may plausibly reflect charging events of PHEVs or smaller-battery BEVs, although this interpretation should be treated only as a hypothesis. The future relevance of this effect remains uncertain. Under the current EU regulatory framework, new passenger cars and vans are expected to reach zero tailpipe CO
2 emissions from 2035, which would substantially reduce the role of newly registered PHEVs. However, this policy framework may still evolve. Therefore, the share of PHEVs within the electrified vehicle fleet should continue to be monitored, as it can substantially affect average session energy, charging duration, AC/DC charging demand, and the interpretation of aggregate charging station data.
Another relevant finding concerns the sensitivity of charging duration to provider-specific pricing rules, particularly overstay-fee policies. In the public AC dataset, the extension of the overstay-fee exemption period from 120 to 180 min was followed by a visible shift in the session-duration distribution, especially in the on-street subgroups. This suggests that users may adapt their parking and charging behavior to the time thresholds embedded in tariff structures. Previous studies have addressed overstay mainly through optimization or behavioral models, showing that penalty design can reduce overstaying and improve charger utilization, but also involves trade-offs with user acceptance and service attractiveness [
45,
46]. In this respect, our results provide rare empirical evidence that changes in overstay-fee rules may be reflected in aggregate charging-session parameters.
Table 8 presents a comparative analysis of selected available international datasets of public charging, whereas the data from Scandinavia originate from a report published by a charging service provider and are therefore not supported by an openly available dataset, nor have they been subjected to the peer-review process. The compared data differ not only by country, but also by observation period, EV market penetration, fleet composition, charging infrastructure maturity, and the availability of high-power DC and ultra-fast charging. These differences make any direct cross-country comparison very difficult, and the results should therefore be interpreted only as an indicative contextual comparison rather than a direct like-for-like benchmark.
For AC charging, average session durations range from 131 min in the Czech dataset to 186 min in the German dataset, while the average energy delivered per session ranges from 8.8 kWh in Canada to 17.4 kWh in Norway. This indicates that longer AC session duration does not necessarily correspond to proportionally higher energy delivered per session. The observed variation may primarily reflect differences in the BEV/PHEV fleet composition in the respective countries, the share of smaller-battery vehicles, local parking behavior, provider-specific pricing and overstay-fee policies, and the composition of individual AC charging subtypes, such as on-street, commercial, residential-adjacent, or destination charging. Therefore, AC charging indicators should be interpreted not only as a proxy for charging demand, but also as a result of the underlying parking context and vehicle mix.
For DC charging, the interpretation is even more sensitive to the technical structure of the dataset. The German value of 57 min clearly differs from the other compared countries and may be related to the specific dataset composition, for example a higher share of older or lower-power DC charging stations, different utilization conditions, or longer dwell times included in the reported session duration. In contrast, Canada and Scotland show relatively low average delivered energy per DC session, both at 12.9 kWh. This may again reflect the inclusion of charging stations with lower charging speeds, older infrastructure, different stopping behavior, or a higher share of short top-up sessions. By contrast, Scandinavian data are influenced by a much higher share of ultra-fast charging; according to the charging service provider report, UFC accounted for approximately 67% of delivered energy in Scandinavia in 2023, whereas the corresponding share in the Czech dataset is estimated to be below 10%. Given Scandinavia’s leading EV adoption rates, its data are considered indicative of emerging trends. This trend is also confirmed in the Global EV Outlook by IEA [
47]. The observed regional differences should therefore not be attributed to country-specific user behavior alone. A rigorous explanation of these differences would require harmonized multi-country datasets with comparable station types, vehicle-level information, pricing conditions, and observation periods. A similar comparison for workplace charging was not possible due to lack of data for other countries.
Table 8.
Comparison of average charging duration and energy delivered per session, public charging.
Table 8.
Comparison of average charging duration and energy delivered per session, public charging.
| | AC Charging (Mean) | DC Charging 1 (Mean) | Year | EV Share 2 |
|---|
| | Duration (min) | En. Delivered (kWh) | Duration (min) | En. Delivered (kWh) | | Incl. PHEV (%) |
|---|
| Czech Republic 3 | 131.4 | 12.7 | 34.2 | 23.6 | 2022–2023 | 0.5 |
| Italy (S. Tyrol) [16] | 165 | 13.2 | 36.4 | 30 | 2021–2023 | 1.2 |
| Germany [19] | 186 | No data | 57 | No data | 2019–2020 | 1.3 |
| Norway [48] | NA | 17.4 | 29.6 | 20.9 | 2023 | 30 |
| Sweden [48] | NA | 14.3 | 33.6 | 26.7 | 2023 | 11 |
| Finland [48] | NA | 10.8 | 27.7 | 25.2 | 2023 | 7 |
| Scotland, UK [35] | 174 | 10.4 | 40.8 | 12.9 | 2018–2019 | 0.8 |
| Canada [13] | 144.6 | 8.8 | 25.7 | 12.9 | 2018–2020 | 0.8 |
This study is subject to several limitations specific to the Czech Republic, which may have influenced the results and their generalizability:
Low penetration of electric vehicles in the national vehicle fleet—The relatively small share of EVs limits the statistical robustness of the dataset and may not fully reflect future trends under higher adoption scenarios.
Uneven adoption of electric vehicles across socio-economic groups—EV users are very specific at this stage with a high representation of innovators and early adopters based on the theory of diffusion of innovation [
49]. Another group is car users according to companies within the framework of green policy.
Rapid development of charging infrastructure—The ongoing and dynamic expansion of charging networks, particularly the rollout of UFC, may lead to shifts in user behavior that are not fully captured in the analyzed period.
Geographic concentration of charging infrastructure—The predominance of public charging stations in larger urban centers limits the analysis of rural or less densely populated areas, potentially overlooking regional disparities.
Data filtering and session exclusions—The necessary exclusion of erroneous or incomplete charging sessions from the dataset may have introduced a bias, especially if certain types of errors correlate with specific user behaviors or station types.
The absence of vehicle-level information in datasets, particularly the distinction between BEVs and PHEVs—The datasets do not include vehicle identifiers, vehicle type, battery capacity, nominal charging capability, or SOC at the start and end of each session. Therefore, individual charging events could not be reliably classified as BEV or PHEV sessions. This constrains the interpretation of both energy delivered per session and charging duration, as these variables are strongly influenced by battery size, initial SOC, charging power, and idle time after charging has ended. Consequently, the impact of BEV/PHEV fleet composition can only be interpreted at the aggregate level.
These limitations should be considered when interpreting the findings. The low EV penetration and uneven user base may lead to underrepresentation of certain behavioral patterns, particularly among future or emerging user groups. Similarly, the dynamic expansion of infrastructure introduces a temporal bias: the observed patterns may reflect a transitional phase rather than a stable state of the charging ecosystem.
The concentration of charging points in urban environments limits the transferability of conclusions to rural or peripheral areas, where charging behavior may differ significantly due to travel distances, access to private chargers, or socio-economic factors.
The data filtering process, although necessary to ensure analytical consistency, may have inadvertently excluded relevant but irregular usage behavior, such as failed sessions or non-standard charging attempts.
Finally, availability of charging station records with vehicle-level, charging power, clean charging time without dwelling or SOC data would enable more precise conclusions regarding the role of BEV/PHEV mix in charging behavior, infrastructure sizing, and smart-charging potential.
Future research should aim to address these constraints by incorporating larger and more diverse datasets, considering longitudinal analysis over multiple years, and including qualitative aspects of user behavior. Additionally, detailed comparative studies based on real-world datasets with countries at different stages of EV adoption could provide valuable context and strengthen the generalizability of the results.
5. Conclusions
Data collected from charging stations offer valuable insights into the real-world behavior of EV users. Quantitatively, the differences between public and workplace charging are substantial. For AC charging, the average workplace session duration reached approximately 249 min, compared with 131 min for public charging, while the average energy delivered per session was 19.8 kWh compared with 12.7 kWh. For DC charging, workplace sessions were also longer and more energy-intensive, with an average duration of 43 min and 32.8 kWh per session, compared with 34 min and 23.6 kWh for public DC charging. These differences confirm that workplace charging is not merely an alternative location for EV charging, but a distinct charging context with different implications for infrastructure planning, load management, and smart grid integration. Moreover, substantial differences also exist between individual clusters of public charging, particularly with respect to AC charging characteristics. From a smart grid and flexibility perspective, the different charging types exhibit varying potential, with workplace charging and public on-street AC charging being the most valuable, primarily due to their longer dwell times and, in the case of workplace charging, more predictable daily patterns. We have shown that user behavior at charging stations is strongly influenced by the following factors:
the pricing policy of charging providers for public charging or employer for workplace charging;
current EV technology, including battery capacity and charging speed for battery electric vehicles BEVs and PHEVs;
status of the vehicle fleet (mix of BEVs/PHEVs) and the overall EV share of the vehicle fleet;
availability and accessibility of charging stations, especially UFC.
These factors are subject to continuous change, which means that EV user behavior is also dynamic, as demonstrated by the temporal and usage patterns observed in our data. Other factors, not examined in detail in this study, may nonetheless have a significant impact on the charging behavior of EV users:
battery-health considerations, particularly the perceived or expected degradation effects of frequent DC fast charging and their implications for residual vehicle value;
urban conditions, population density, and intercity distances;
climatic zone, seasonal effects, and weather conditions, particularly ambient temperature and its influence on vehicle energy consumption and charging demand.
The highlighted insights into EV user behavior can be used not only to shape strategies for charging infrastructure deployment and pricing policies, taking into account user preferences and habits across different countries and regions, but also to inform policy-making at the national and EU levels regarding the optimization of the electric grid in the smart grids transformation.
The current European and national policy framework for electromobility primarily focuses on overall CO2 reduction, expansion of the zero-emission vehicle fleet and the deployment of publicly accessible high-power charging infrastructure along major transport corridors. What is still missing are clear strategic objectives for the charging mix structure, defining how home, workplace, and different forms of public charging should contribute not only to the total energy supplied to EVs, but also to the flexibility services required by future smart grids. In this respect, workplace and on-street AC charging may be particularly relevant for future smart-charging and V2G pilot schemes, because these charging contexts combine longer dwell times with more predictable temporal patterns. Existing support schemes in the Czech Republic in particular tend to prioritize fast and ultra-fast DC stations on the TEN-T network and at major traffic nodes, even though these installations are the most demanding from the perspective of distribution-grid capacity. From the viewpoint of system operators and regulators, this implies that an undifferentiated expansion of public fast charging is unlikely to yield an optimal utilization of network capacity, whereas a more balanced mix that better exploits workplace and on-street public charging could reduce the need for costly grid reinforcements.
Based on the findings of this study, we argue that future revisions of national electromobility strategies and funding programs should not only specify absolute targets for the number and installed power of charging points, but also define indicative targets for the composition of the charging mix by location type and user segment (home, workplace, various public clusters such as petrol stations, commercial sites and on-street chargers). Aligning subsidy schemes and regulatory incentives with such mix targets would help to direct investment towards those charging segments that both support user needs and contribute to a more favorable temporal distribution of load. Such a conception should be aligned with national and EU smart grid transformation plans.
Indicative targets for the charging mix should differ according to the maturity of national EV markets. In Central and Eastern European late-adopter markets, such as the Czech Republic, EV penetration remains low and charging behavior is still strongly influenced by early adopters, corporate fleets, and users with specific charging access. These countries should therefore not simply replicate the infrastructure trajectory of more mature Western European markets, where charging networks are already more developed and policy priorities increasingly focus on utilization, grid-congestion management, dynamic pricing, interoperability, and smart-charging integration. Instead, CEE countries have an opportunity to shape the charging ecosystem before mass adoption occurs by defining a balanced mix that includes high-power public DC charging, workplace charging, and urban on-street AC charging. This is particularly relevant where access to private home charging is limited by a high share of multi-apartment housing. Early support for workplace and on-street AC charging could reduce future dependence on costly high-power public infrastructure, improve the temporal distribution of charging demand, and create better conditions for smart charging and flexibility services.
At the same time, such targets for charging infrastructure in dense urban areas should be carefully aligned with sustainable urban-mobility and urban-planning goals, so as not to inadvertently encourage additional car commuting, worsen congestion or undermine policies that prioritize public transport, walking and cycling and aim to limit the number of cars in city centers.
Recent industry developments, including next-generation ultra-fast and megawatt-class charging technologies, suggest that selected public charging hubs may require substantially higher grid capacity in the future. For Central and Eastern European late-adopter markets, this highlights the importance of future-proof technical standards and strategic siting of high-power hubs along TEN-T corridors and major interurban nodes. However, these technologies should complement rather than replace a balanced charging mix that also exploits workplace and on-street AC charging for flexibility-oriented smart-charging applications.
Because the Czech Republic is broadly representative of other Central and Eastern European countries with a similarly low but rapidly growing EV share, the policy implications identified here are likely to be transferable to those markets as well. For this group of countries, a shift from purely quantitative infrastructure targets towards a more nuanced, system-oriented view of the charging mix may be crucial for achieving a cost-effective and grid-compatible transition.




 ,
,