3.1. Model Validation
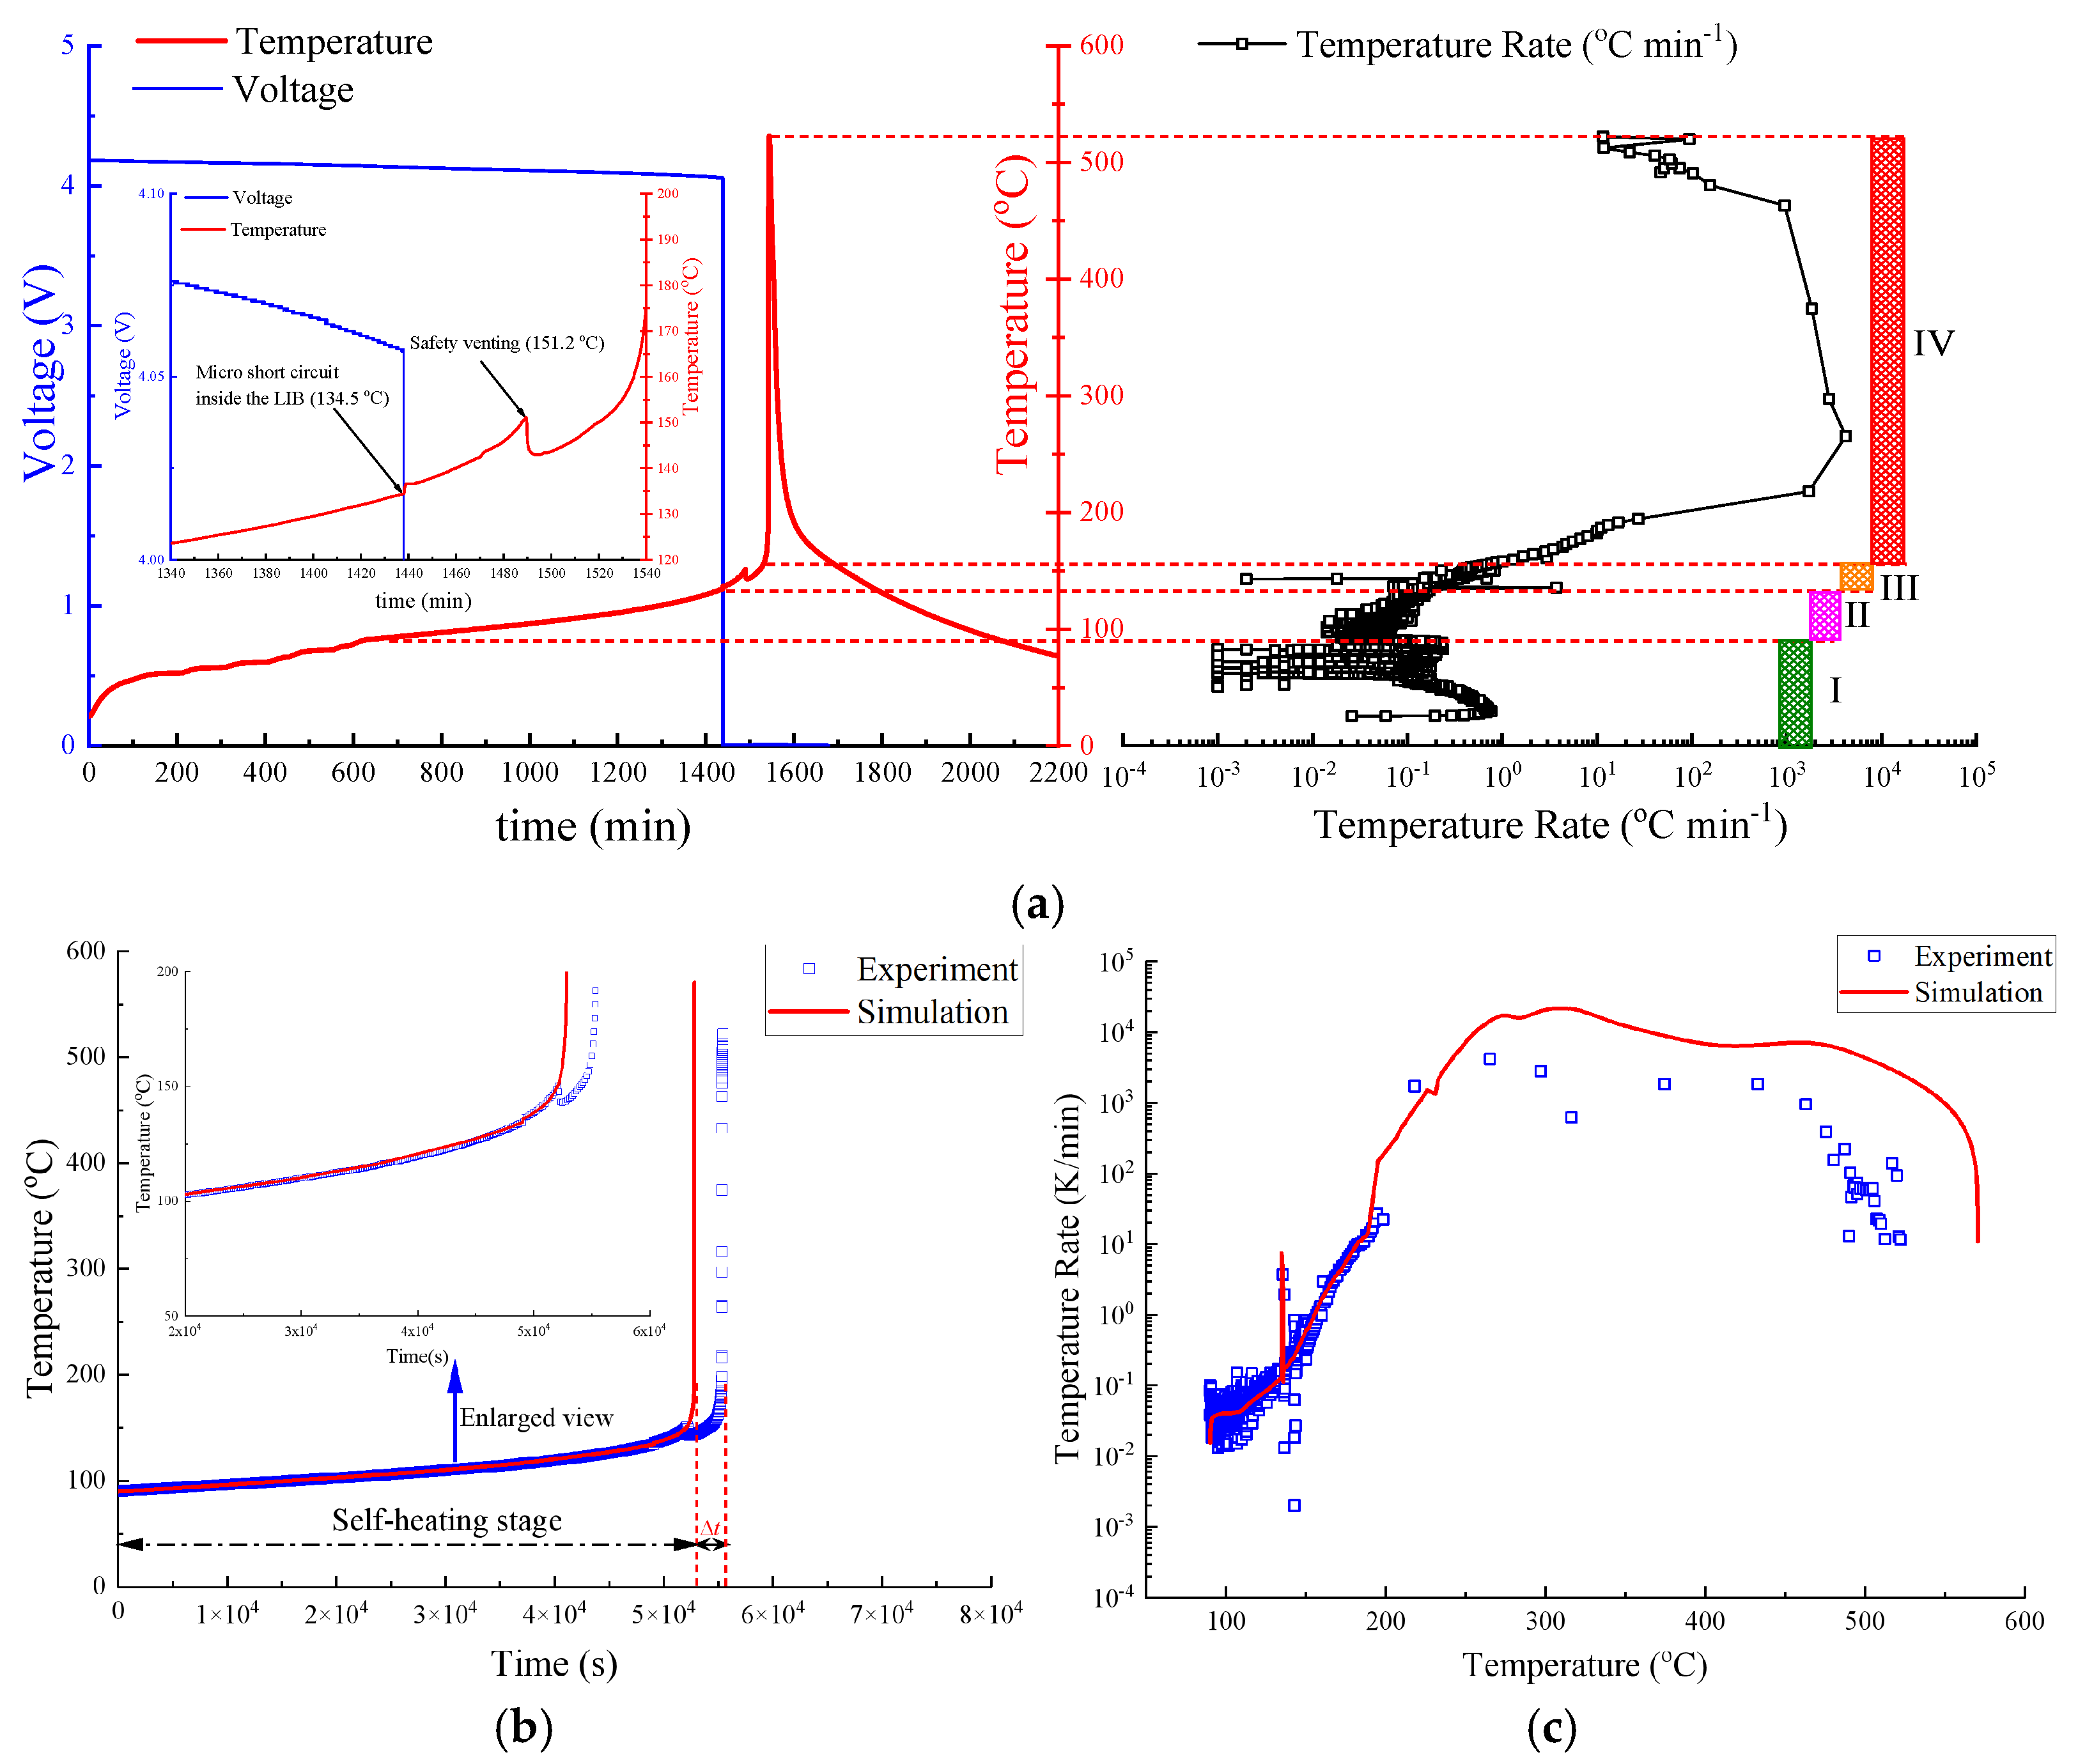
Figure 3a displays the profiles of the temperature variation with time and temperature rate variation with temperature for the EV-ARC test in Ref. [
7]. The progress of the LIB from normal to thermal runaway was divided into four stages, with some special phenomena, such as the micro short-circuit and safety venting, as well material ejection behavior. All of these behaviors contribute to the energy tally when the LIB undergoes thermal runaway.
Figure 3b,c show the comparison of the predicted temperature and self-heating rate of the LIB with the measurements in previous studies. It can be seen that the simulation results fit the experimental measurements well for both the temperature– time and temperature rate–temperature curves during the self-heating stage.
It is worth mentioning that a notable difference in temperature rise data exists between experiments and simulations. The safety venting behavior will release some hot gases, which will result in a slight temperature decrease in the LIB, as shown in the enlarged photo in
Figure 3a. However, the repeated experiments show that this behavior lacks a clear pattern; this phenomenon was not observed in thermal runaway propagation tests, as the LIB was heated violently in our previous study [
7]. In order to reduce the uncertainty and the amount of the computation, the effects of safety venting and ejecta are not considered in detail, but are included in the effective coefficient (η). Therefore, the predicted time of the thermal runaway event is earlier than the experimental result, which is denoted as Δt, as shown in
Figure 3b. Furthermore, the simulated temperature rise rate is slightly higher than the experimental result in the ARC test.
In the adiabatic thermal runaway experiments, the peak temperature of the lithium-ion battery during thermal runaway was 522.6 °C, which is lower than the peak temperature of 600–700 °C observed under normal environmental conditions in the thermal runaway propagation process. This discrepancy may result from the severe swelling of the battery, which causes the measured surface temperature to be lower than the actual temperature. Further, the value is set at 0.4 to fit the experimental result in the thermal runaway propagation model to bring the simulated peak temperature closer to the peak temperature observed in the actual experiments.
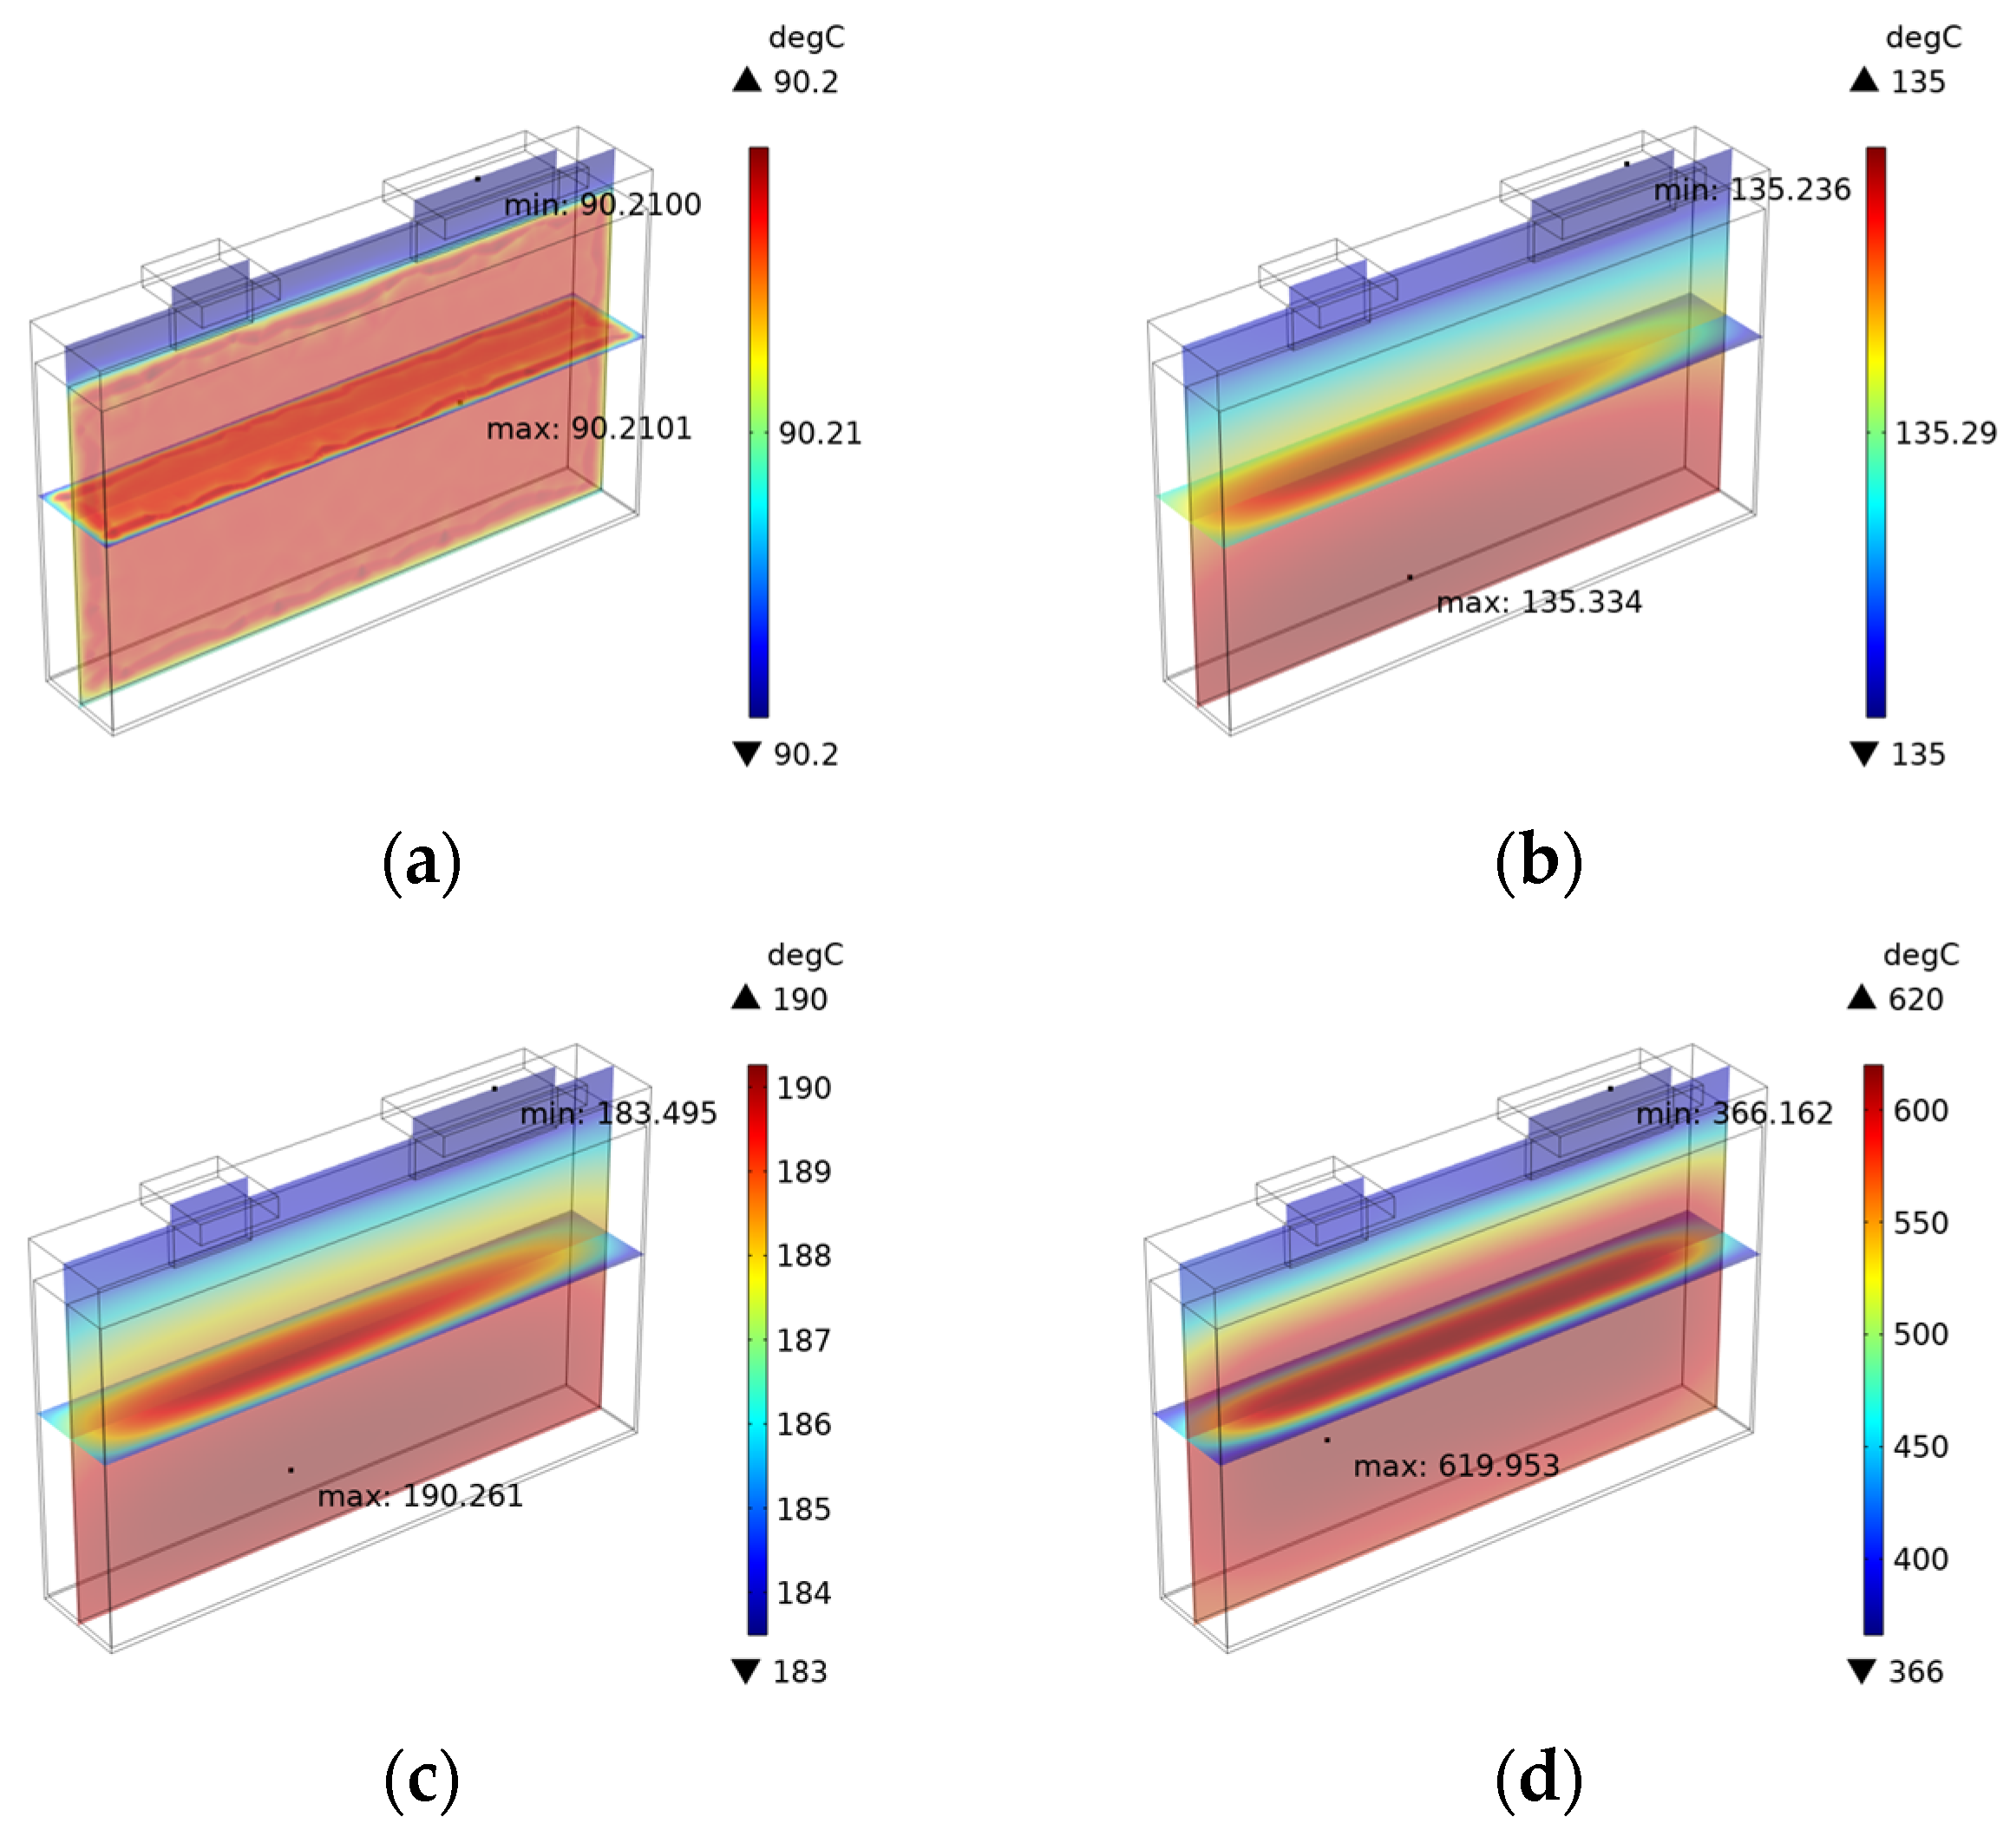
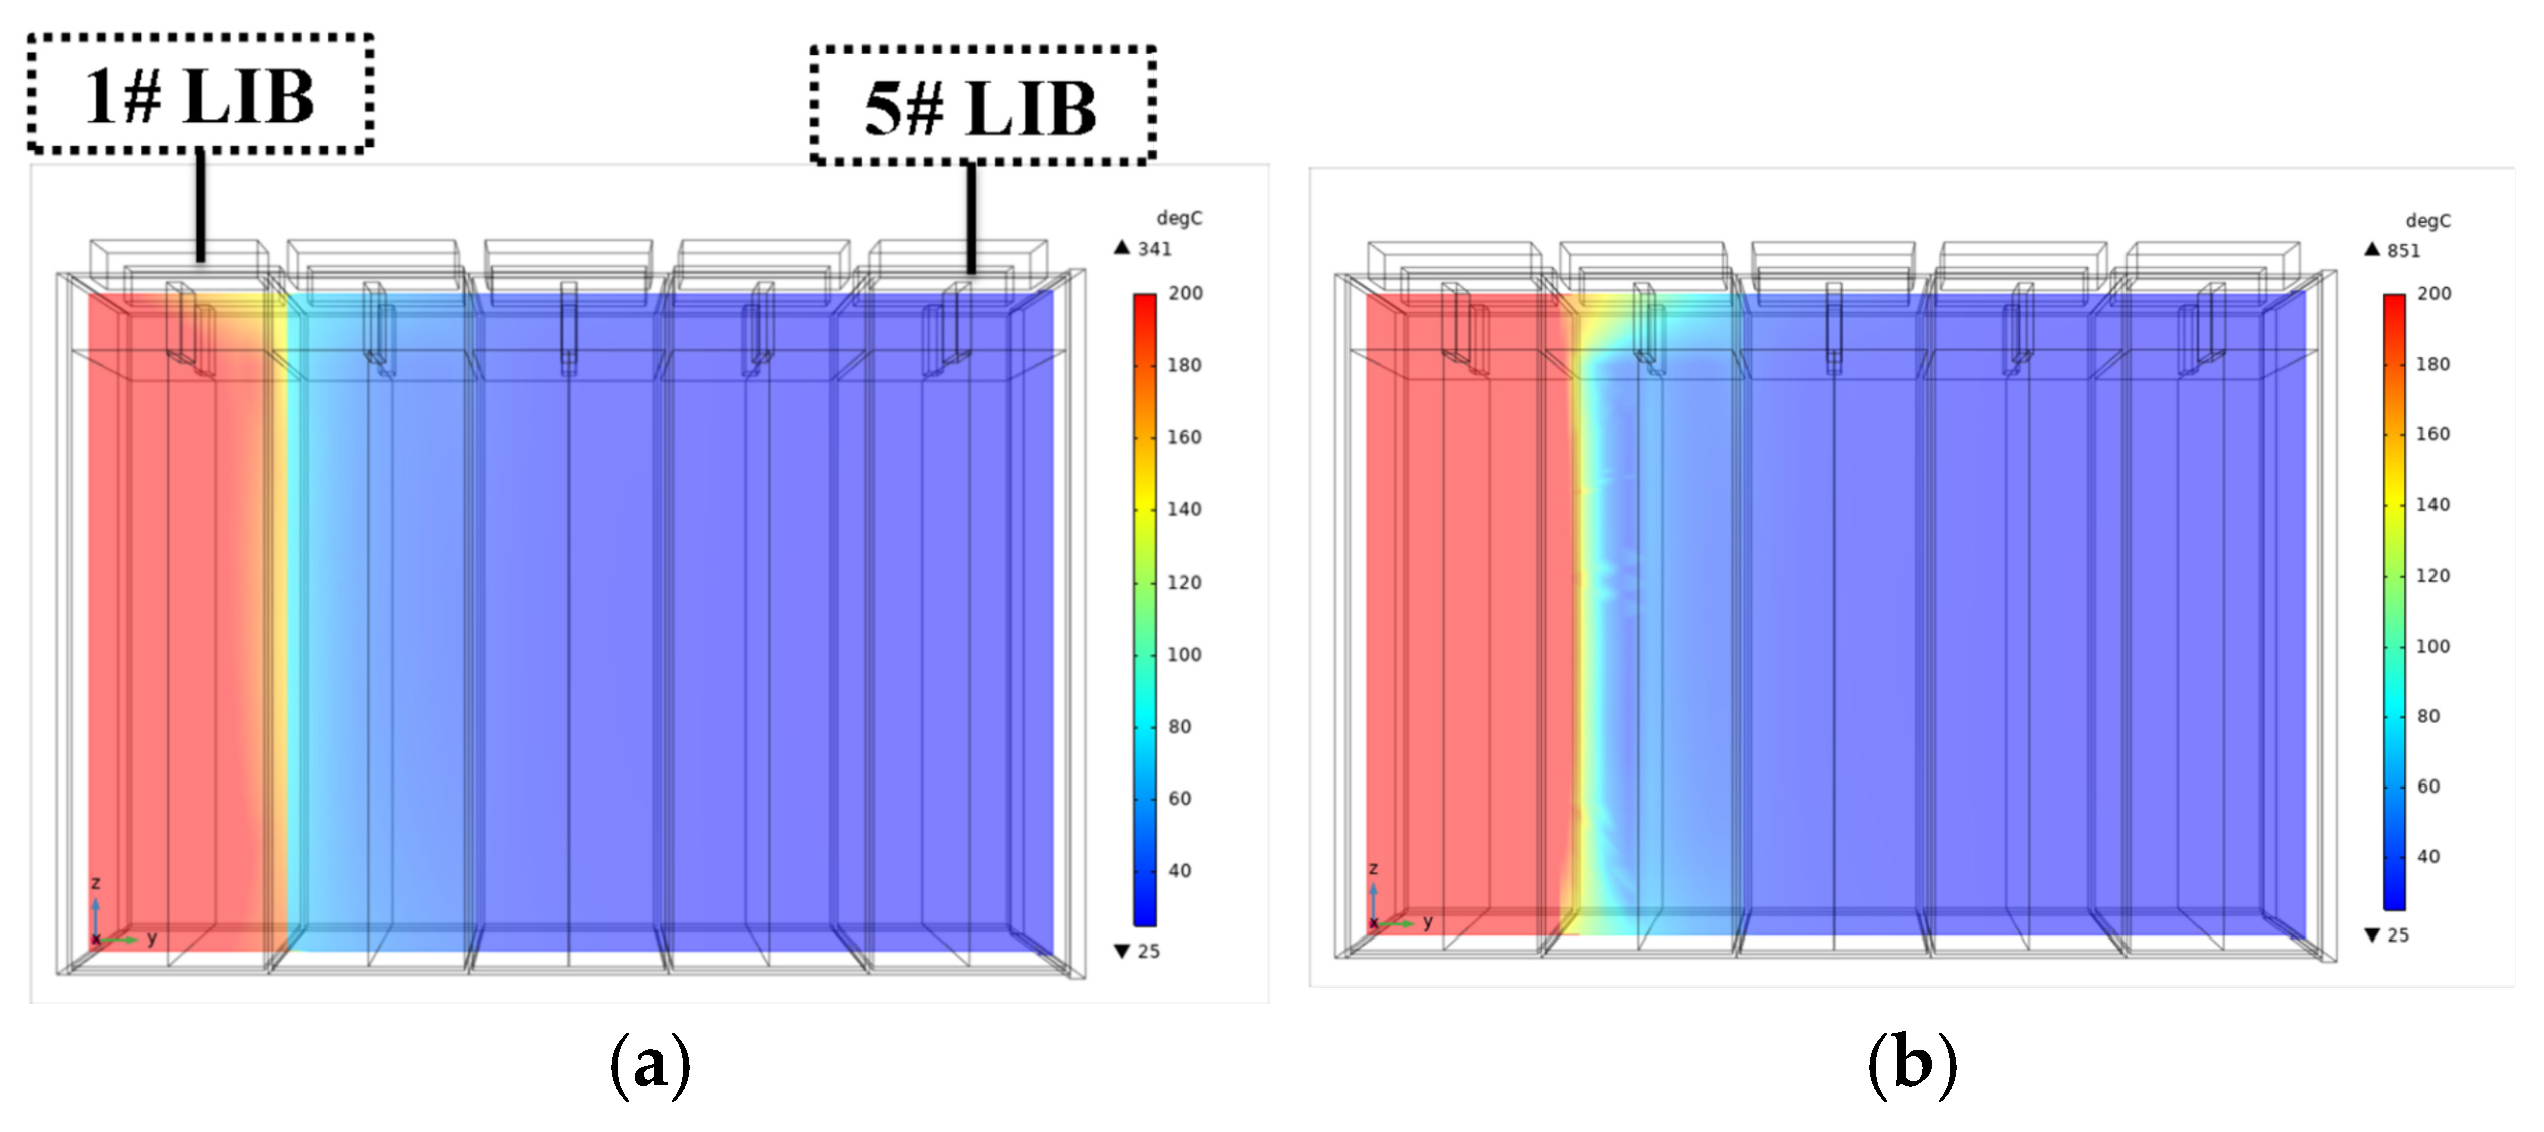
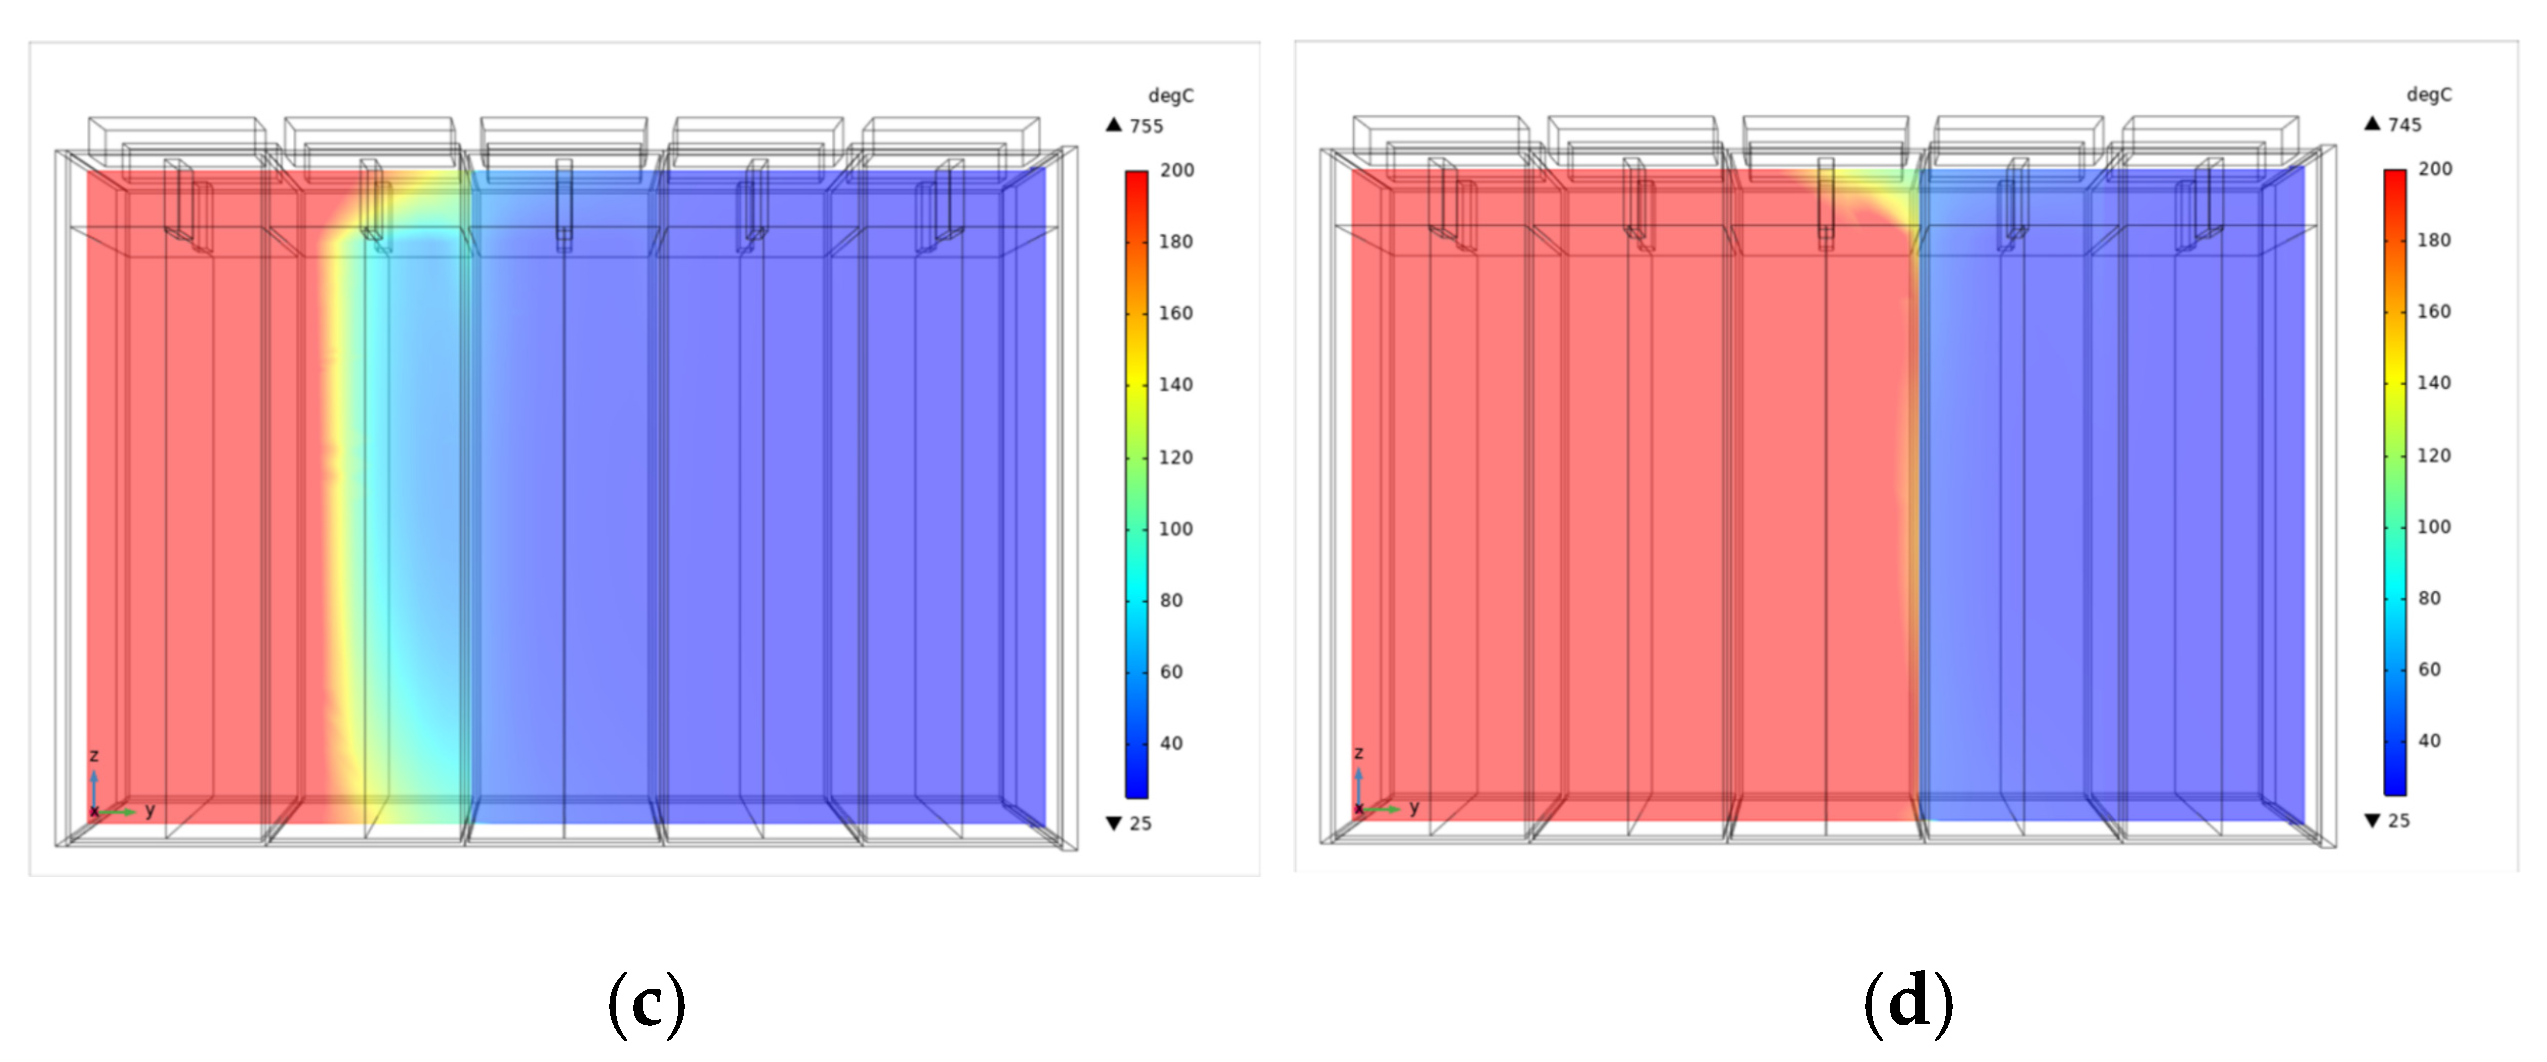
The temperature distribution of the LIB during the self-heating stage is shown in
Figure 4. In the adiabatic environment, the temperature rise of the battery is primarily caused by the exothermic chemical reactions of its internal materials. Therefore, the temperature increased slowly and showed little difference between the internal and external temperatures during the initial stage of self-heating as shown in
Figure 4a,b. The maximum temperature gradient across the cell remains below 1 °C. However, the temperature was increased rapidly when the intense heat was released in thermal runaway stage. As shown in
Figure 4c, the maximum temperature gradient is around 7 °C with the acceleration of the exothermic chemical reactions inside the battery. And approximately 253 °C temperature gradient was observed between the internal and shell of the LIB as shown in
Figure 4d, which was primarily influenced by the thermal conductivity of its material structure and the location of heat sources.
In the thermal runaway propagation event in our previous studies, heated cells indeed exhibit a significant temperature gradient inside the battery due to the presence of two jelly rolls and an air gap. Moreover, approximately 8–10 s was needed to spread thermal runaway from the layer near the front surface to the whole battery. In addition, a 228–437 °C temperature difference was observed between the front and back surface. In this study, a lumped model is constructed to maintain computational efficiency while focusing on heat transfer and barrier analysis. The temperature difference between the front and back surface was around 360 °C as shown in
Figure 5a. The results partly support the feasibility of the lumped method.
3.2. Thermal Runaway Propagation in the LIB Module
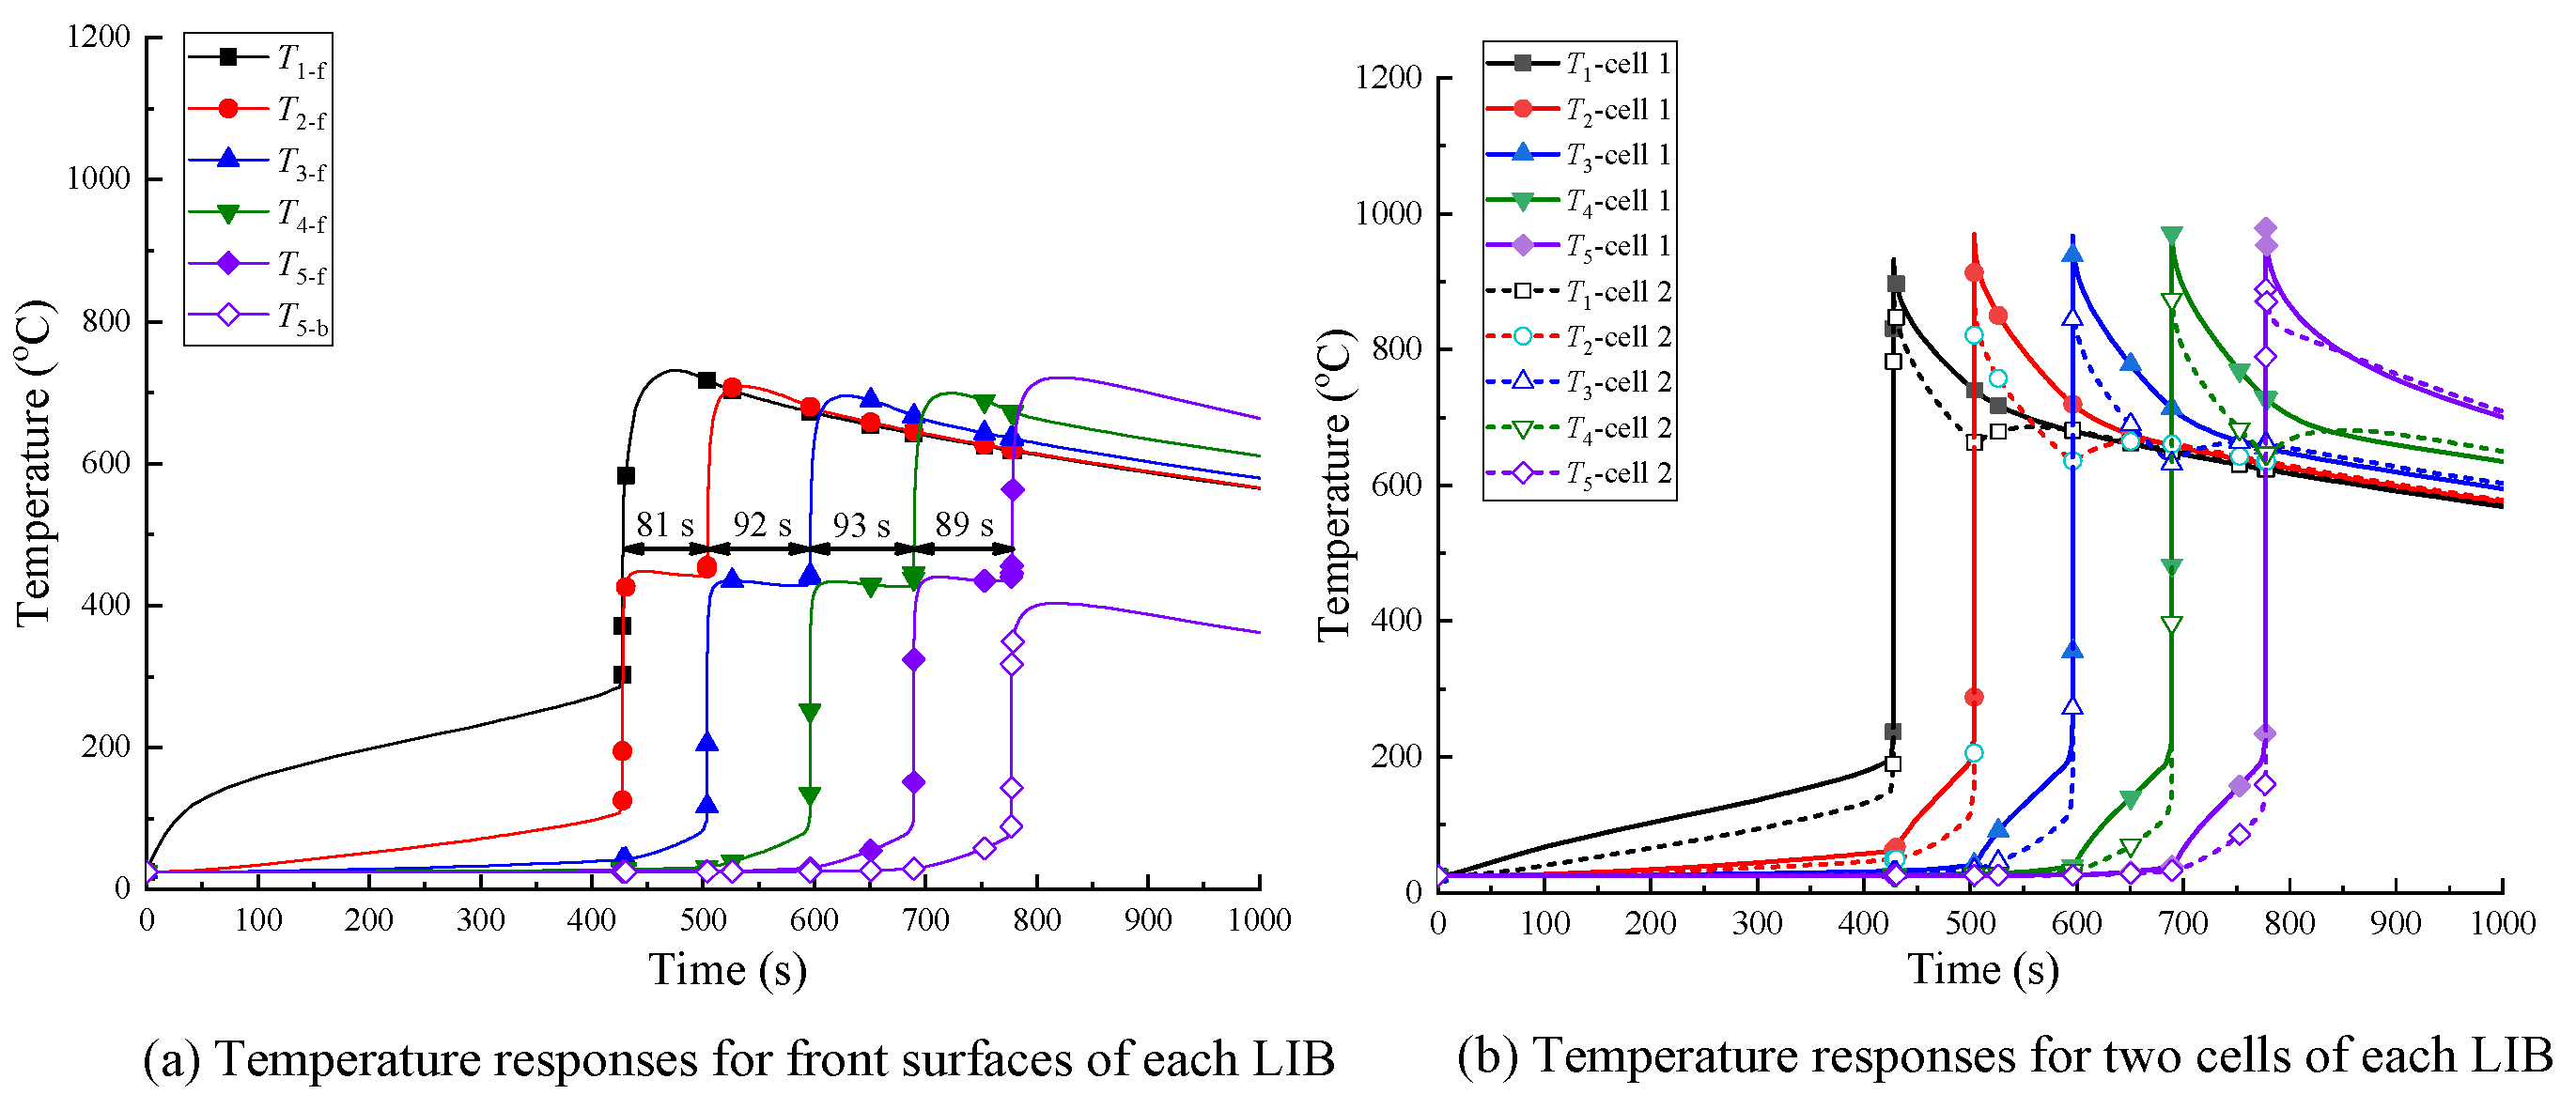
Figure 5 displays the temperature variation in the front surface of each lithium-ion battery in the simulation work. The result indicates that the thermal runaway has been propagated in the module without any prevention measures. A large amount of heat will be released when the LIB undergoes thermal runaway, and the front surface temperature of its neighbor will rapidly increase to around 430 °C, as shown in
Figure 5a. Then, the next LIB will be induced after a heat balance stage. In this simulation, the average propagated time between each two LIBs is 89 s, which is close to the 87 s in the experiment [
1]. The internal temperature of the LIB is shown in
Figure 5b. It can be seen that the peak temperature inside the LIB can reach approximately 970 °C, which is much higher than its surface temperature.
For a better explanation, the thermal runaway propagation process between 1# and 2# LIBs are discussed and the temperature distribution of the module’s cross section is illustrated in
Figure 6. As shown in
Figure 5b, the front surface’s temperature increases steeply when 1# LIB undergoes thermal runaway, and there was a significant temperature difference between cells 1 and 2 inside 2# LIB because each LIB consists of two cells. The exothermic chemical reactions of cell 1 were first induced at 412 s and further contribute to its temperature rise, as shown in
Figure 6b. After approximately 58 s, the thermal runaway of cell 1 inside 2# LIB was triggered, further resulting in an immediate thermal runaway event of the whole 2# LIB, as shown in
Figure 6c.
3.3. Thermal Runaway Mitigation in the LIB Module
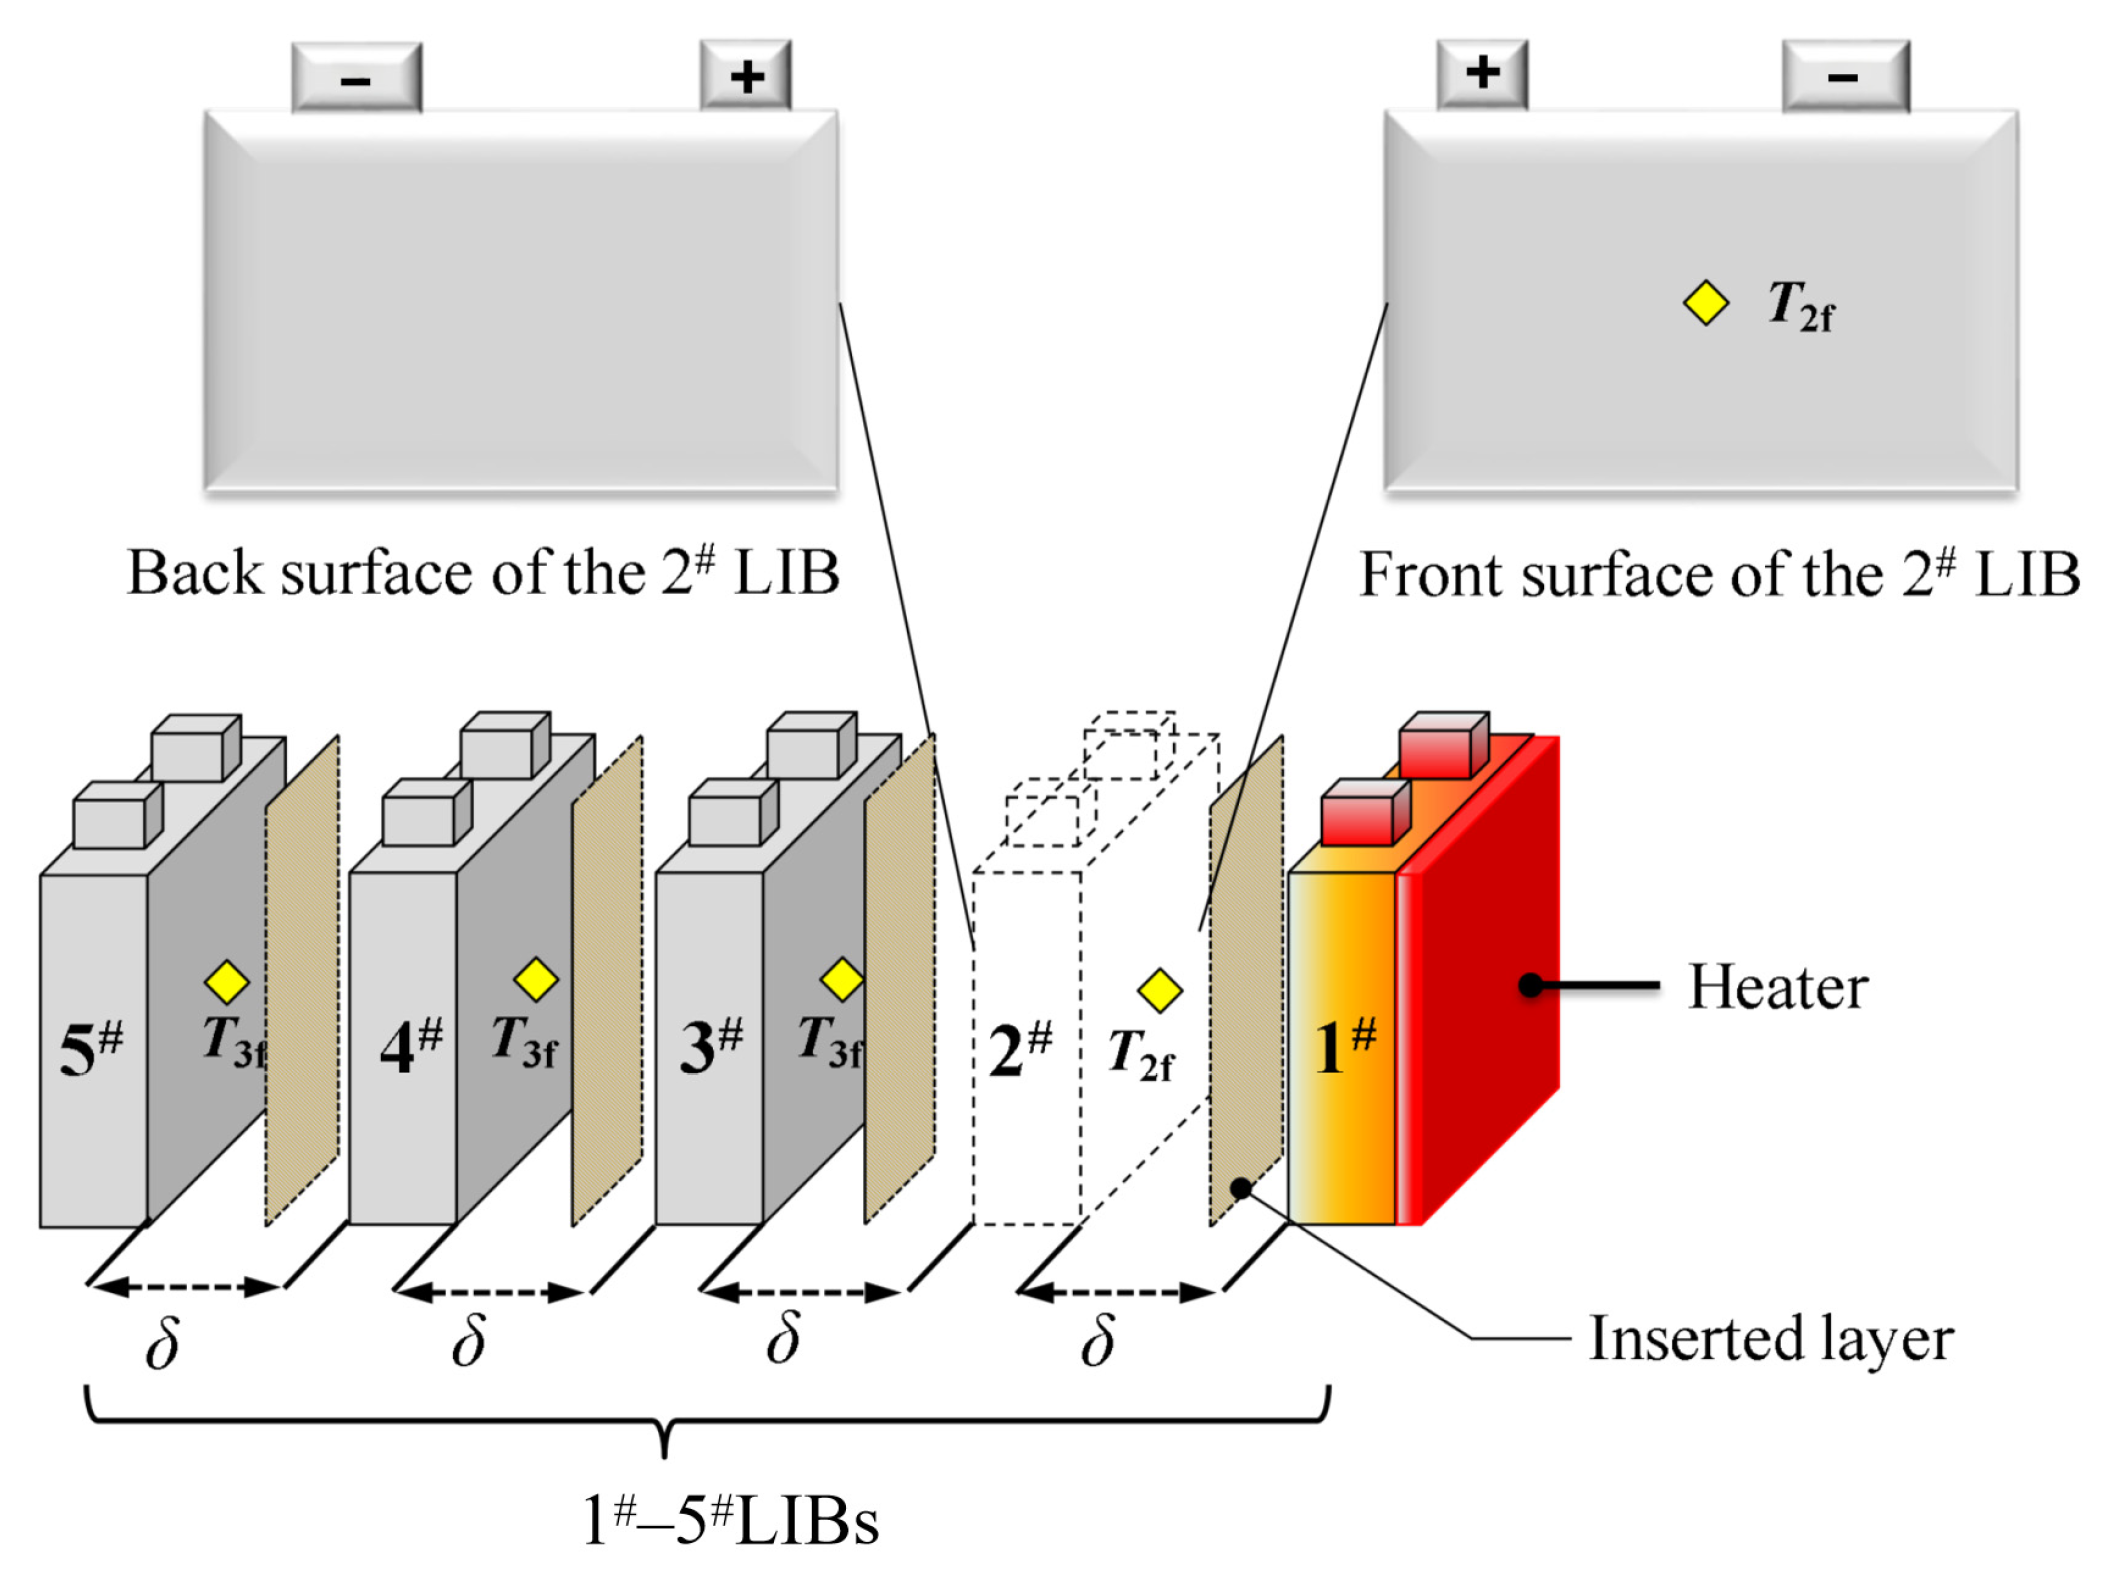
Because there are no prevention measures in “Case 1”, the released heat from the LIB in thermal runaway can be directly transferred to its neighbors, resulting in thermal runaway propagation event in the module. According to the simulation result in “Case 1”, measures should be taken to avoid the formation of a local hot spot on the cell inside the LIB. In this study, the effect of four insulation materials was analyzed in “Case 2–5” in
Table 4.
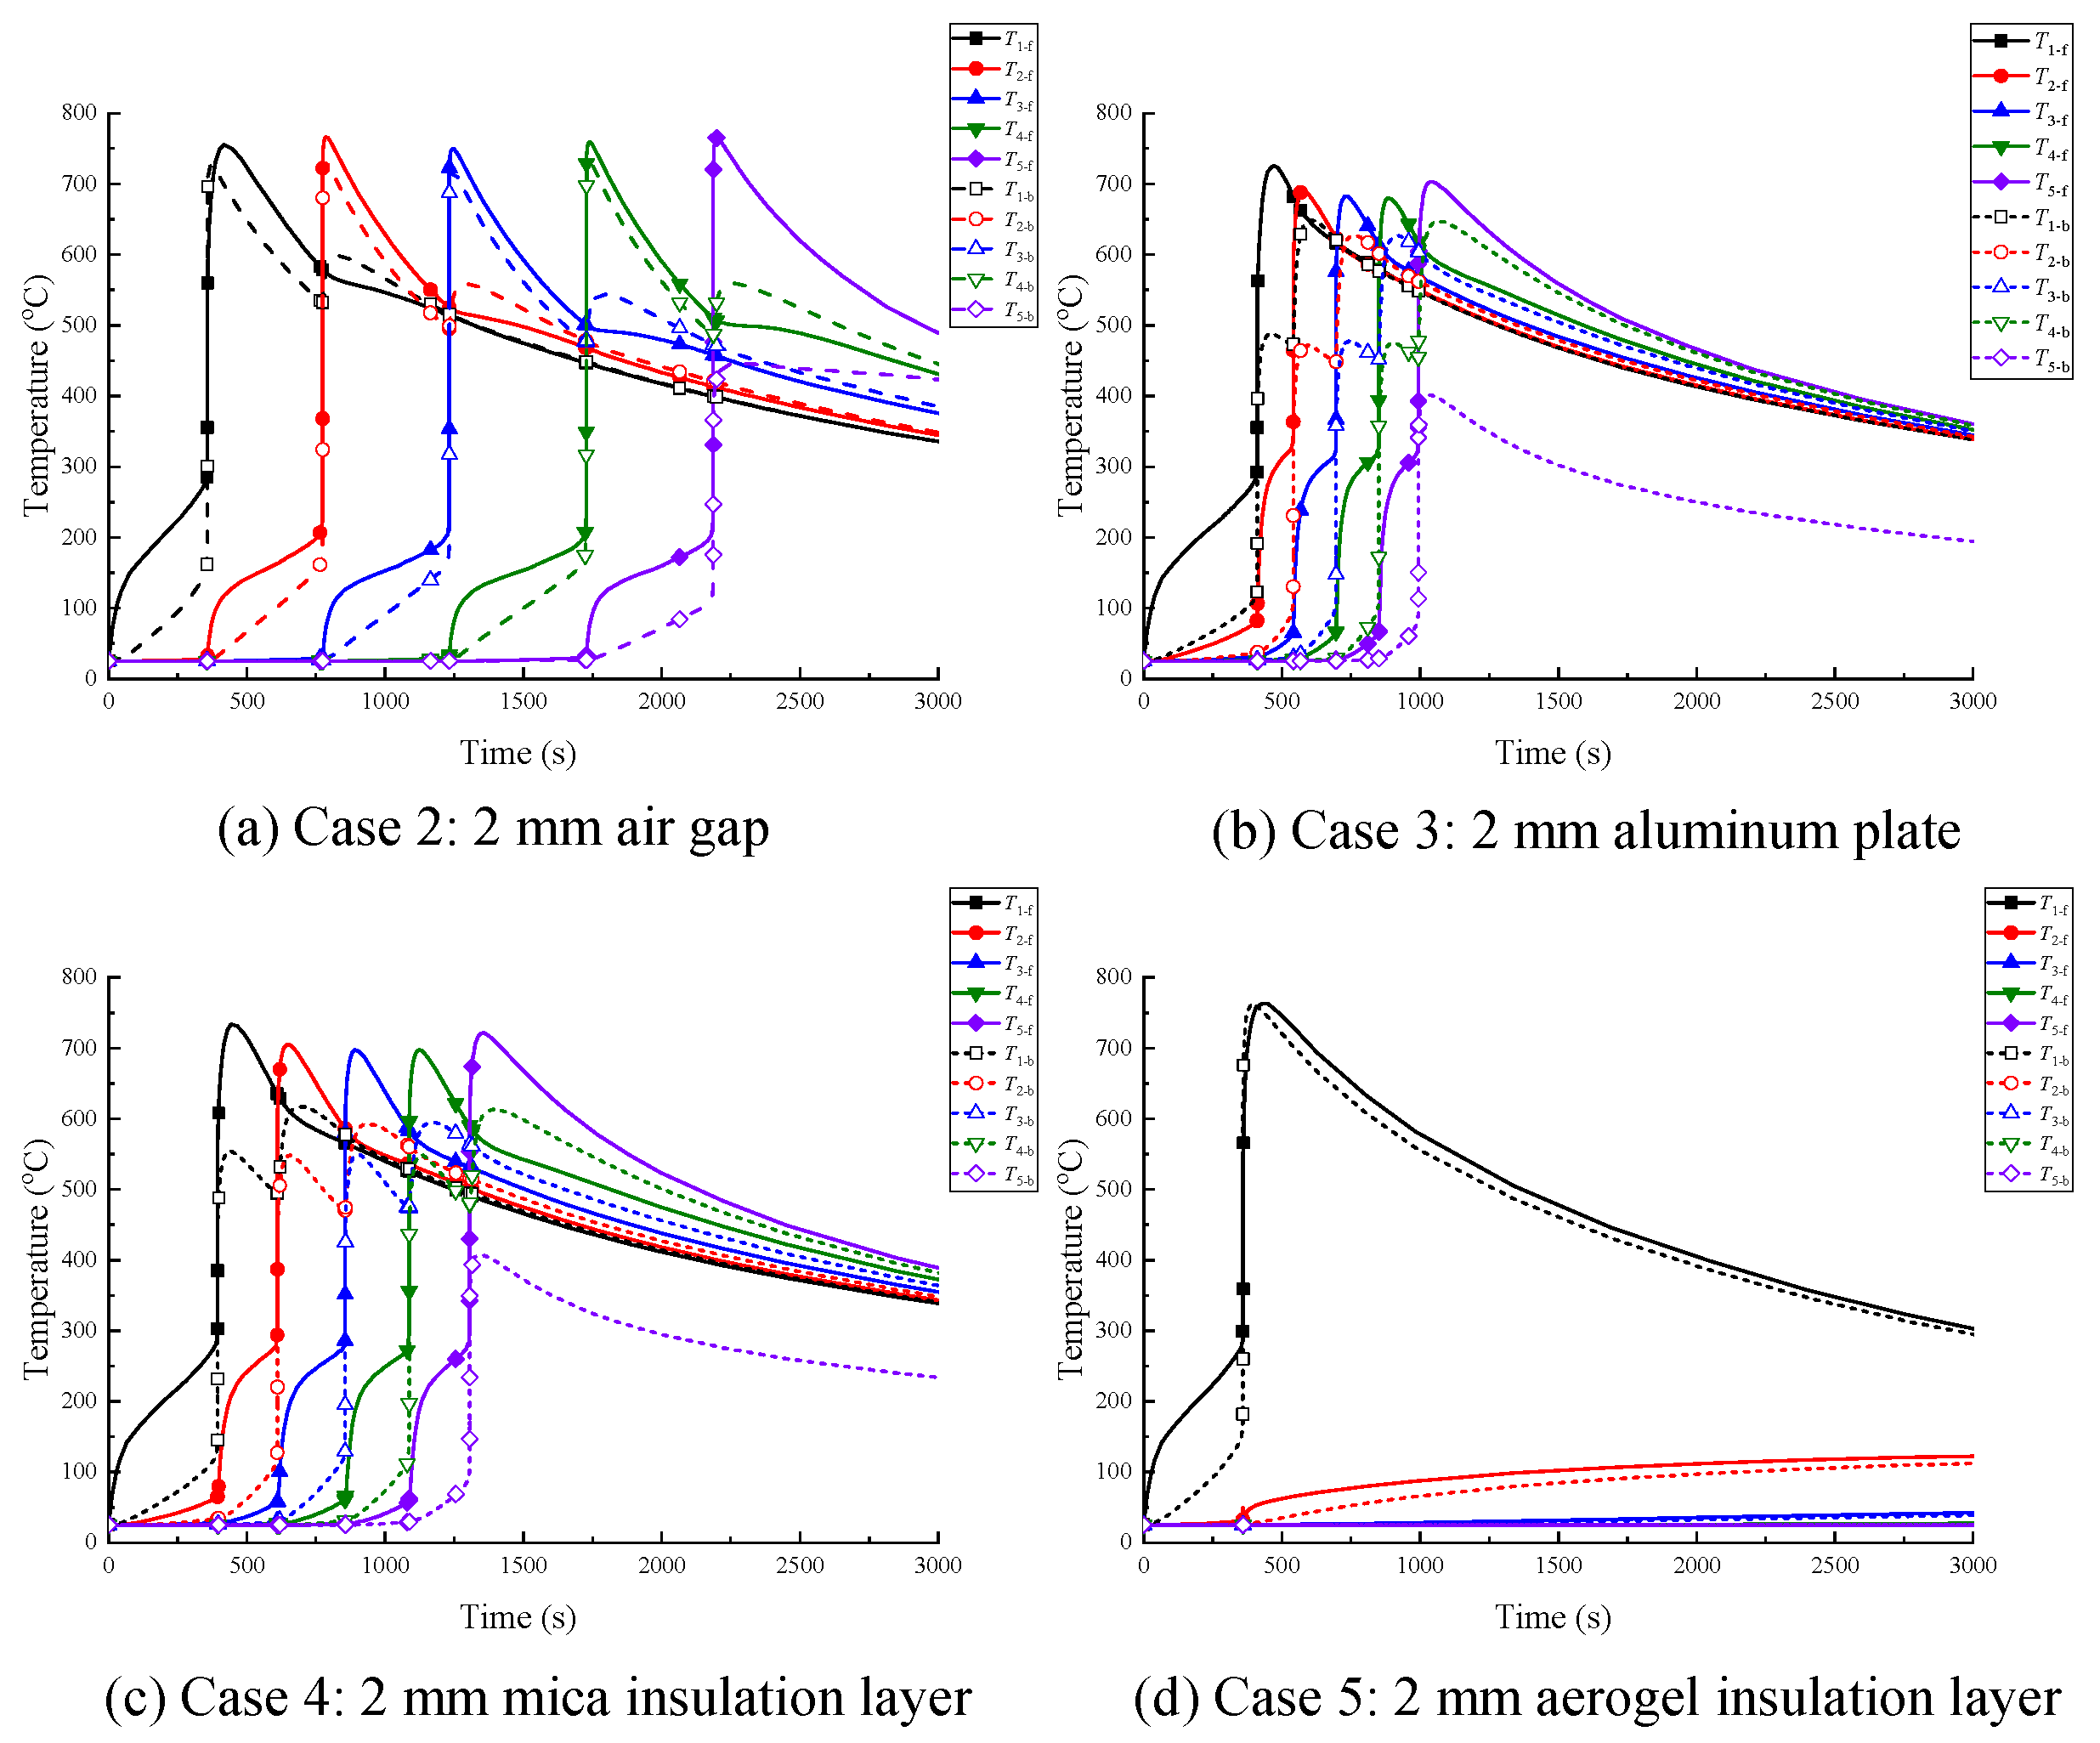
Figure 7a–d display the temperature variations with time in each LIB in “Case 2–5”, respectively. It can be seen that thermal runaway is prevented in “Case 5” due to the excellent thermal insulation effect of aerogel in the normal condition. In some extreme scenarios, the necessary thickness of the aerogel should in the battery be further investigated. However, thermal runaway is still propagated to the entire LIB module in “Case 2–4”, in which the air gap, aluminum plate and mica insulation layer are placed between the LIBs, respectively. In addition, the propagation time between each adjacent LIB is listed in
Table 6. In “Case 2”, the average time is around 458 s, which is much higher than the 147 s in “Case 3” and 227 s in “Case 4”. This indicates that the air gap shows a significant effect on the delay of the thermal runaway propagation time due to the change in the dominated heat transfer mode. In “Case 2”, the heat is mainly transferred through convection and radiation, while conduction is the dominant heat transfer mode in “Case 3–5”.
However, Li et al. indicate that heat absorption by the aluminum plate is the key factor in thermal runaway propagation event, and this phenomenon is also observed in this study.
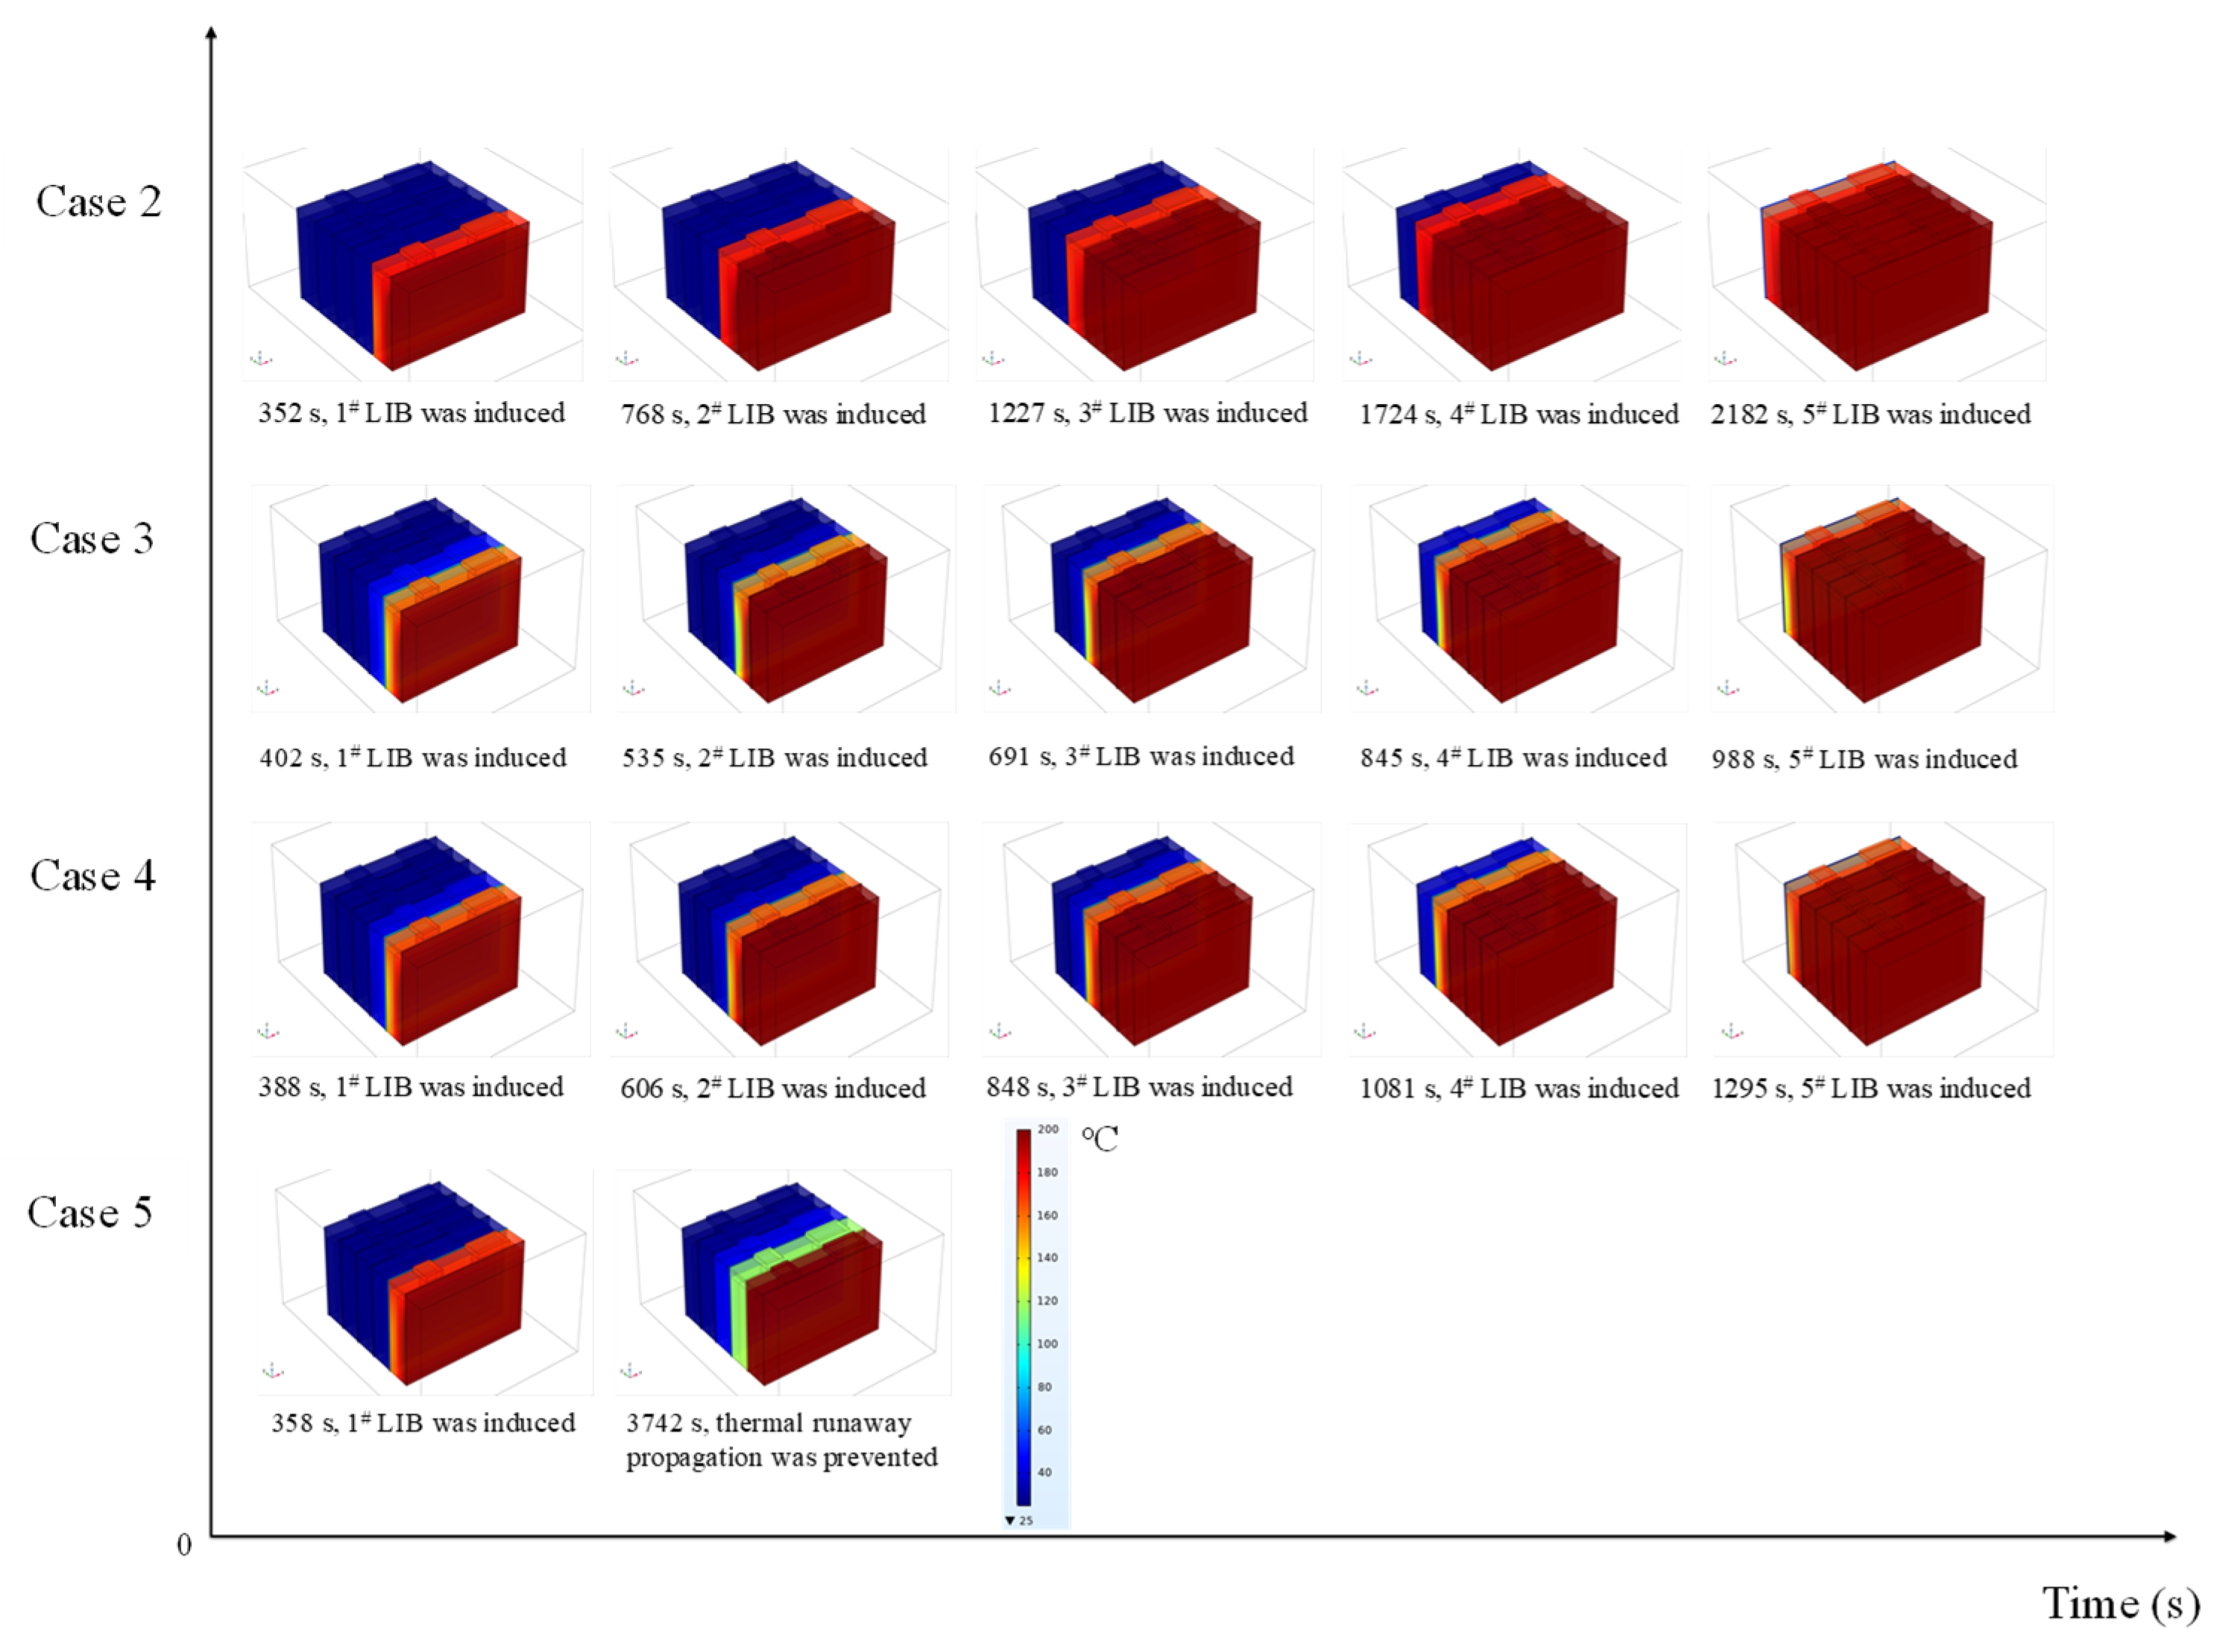
Figure 8 shows the temperature distribution of each LIB in thermal runaway in “Case 2–5”. The heat from the LIB in thermal runaway was dissipated rapidly due to the high thermal conductivity of the aluminum plate. Thus, the peak temperature of the back surface of the LIBs in thermal runaway in “Case 3” is around 487 °C, which is much lower than the 730 °C in “Case 2”, with the air gap, and 761 °C in “Case 5”, with the aerogel insulation layer. In addition, the high thermal conductivity of the aluminum plate also contributes to the heat sink, and thus more time is needed to induce thermal runaway of 1# LIB.
Further, thermal runaway was prevented when the 2 mm aerogel insulation layer was placed between each two batteries. However, the peak temperature of the cells in 2# LIB can reach around 120 °C at 3742 s, as shown in the “Case 5” section in
Figure 8. This value is high enough to induce the self-heating reactions inside the LIB. Then, the temperature of the 2# LIB starts to decrease, as its total heat generation rate is lower than the heat transfer rate from it to the next ambient LIB.
Moreover, the simulations coupling insulation layer thickness and thermal conductivity was also conducted to assess the applicability limits of thermal insulation materials under extreme conditions.
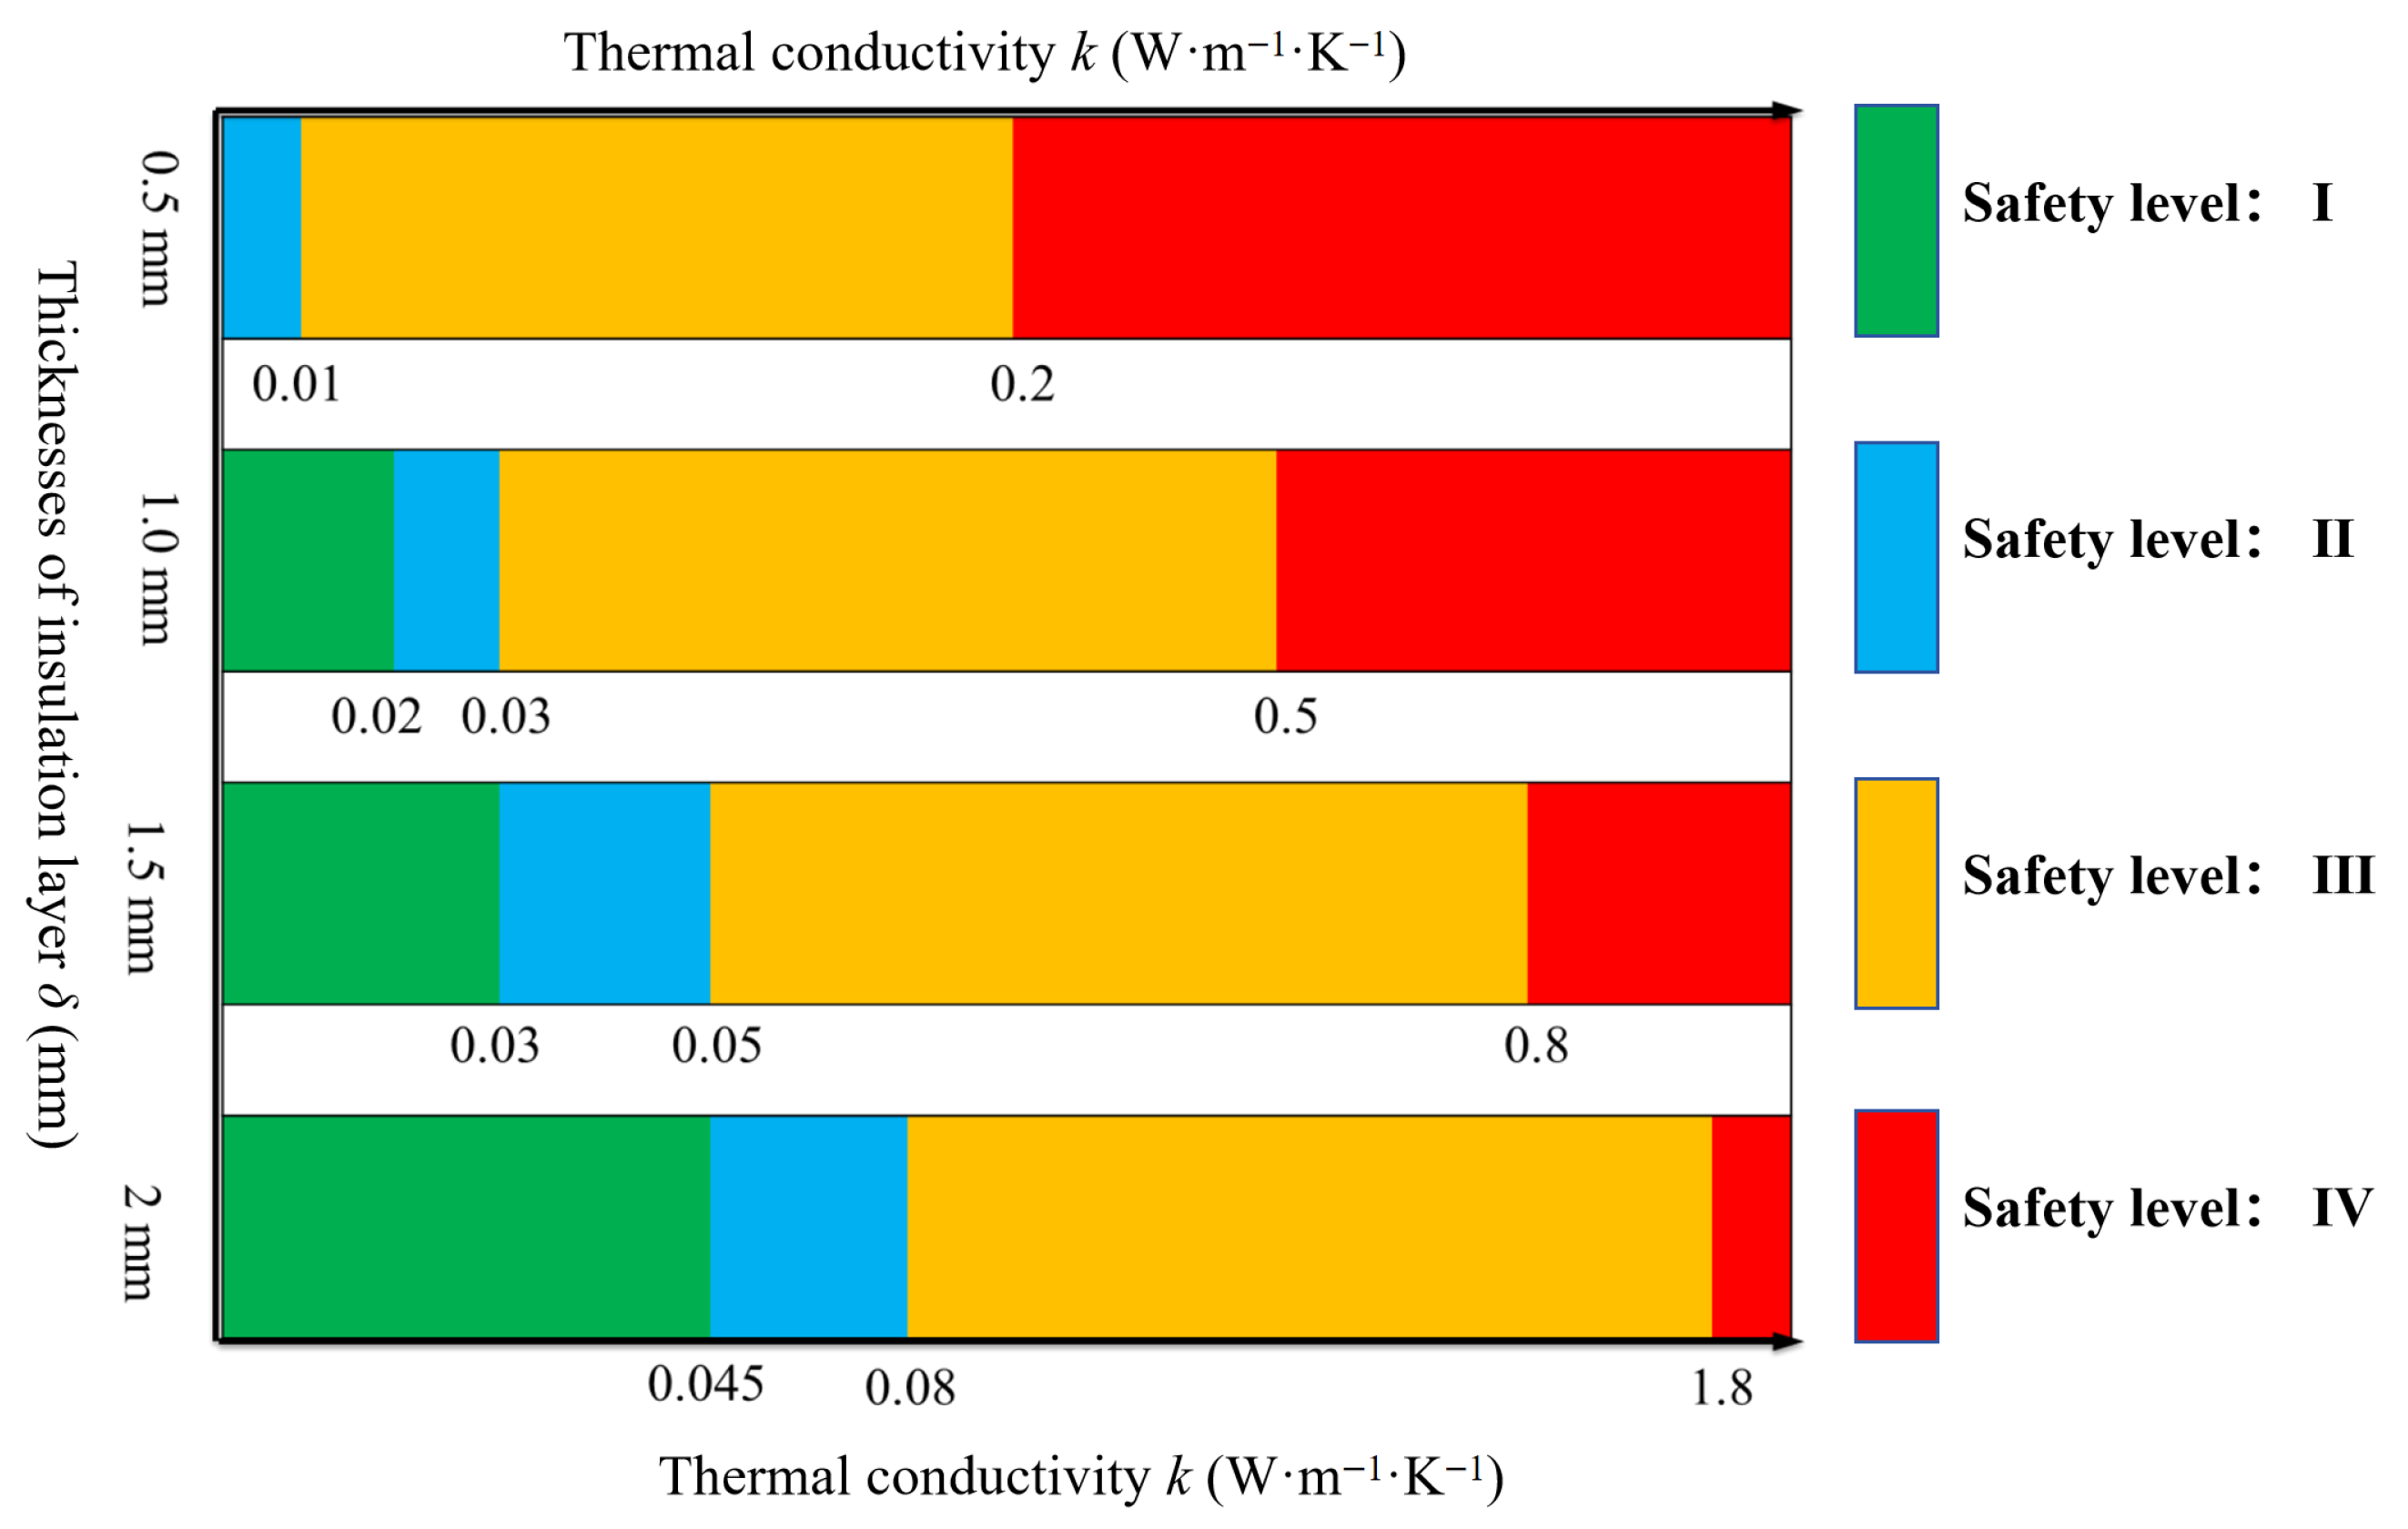
In practical applications, high energy density requirements for battery systems limit the insulation layer thickness (δ) to within 2 mm (δ = 0.5, 1.0, 1.5, 2.0 mm). And safety levels are assigned according to the propagation time (Δ
ti#–(i+1)#) as shown in
Table 7.
As shown in
Figure 9, the results indicated that the internal core temperature of the adjacent battery still approaches the melting temperature of the separator (135 °C) under the effect of the battery undergoing thermal runaway even the thermal conductivity
k is reduced to 0.01 W·m
−1·K
−1 at a thickness of 0.5 mm.
When the thickness of the thermal insulation layer is increased to 1 mm, the thermal insulation material with k < 0.02 W·m−1·K−1 can effectively suppress thermal runaway propagation. The aerogel materials can meet this basic requirement. For insulation layer thicknesses of 1.5–2 mm, the corresponding thermal conductivity can be increased to 0.03 W·m−1·K−1 and 0.05 W·m−1·K−1, respectively, allowing the use of materials such as fiberglass and rock wool board as insulation layers.
3.4. Heat Transfer Between LIBs in the LIB Module
According to the simulation results, the heat transfer rate from an LIB in thermal runaway to the next fresh LIB can determine the thermal runaway propagation event.
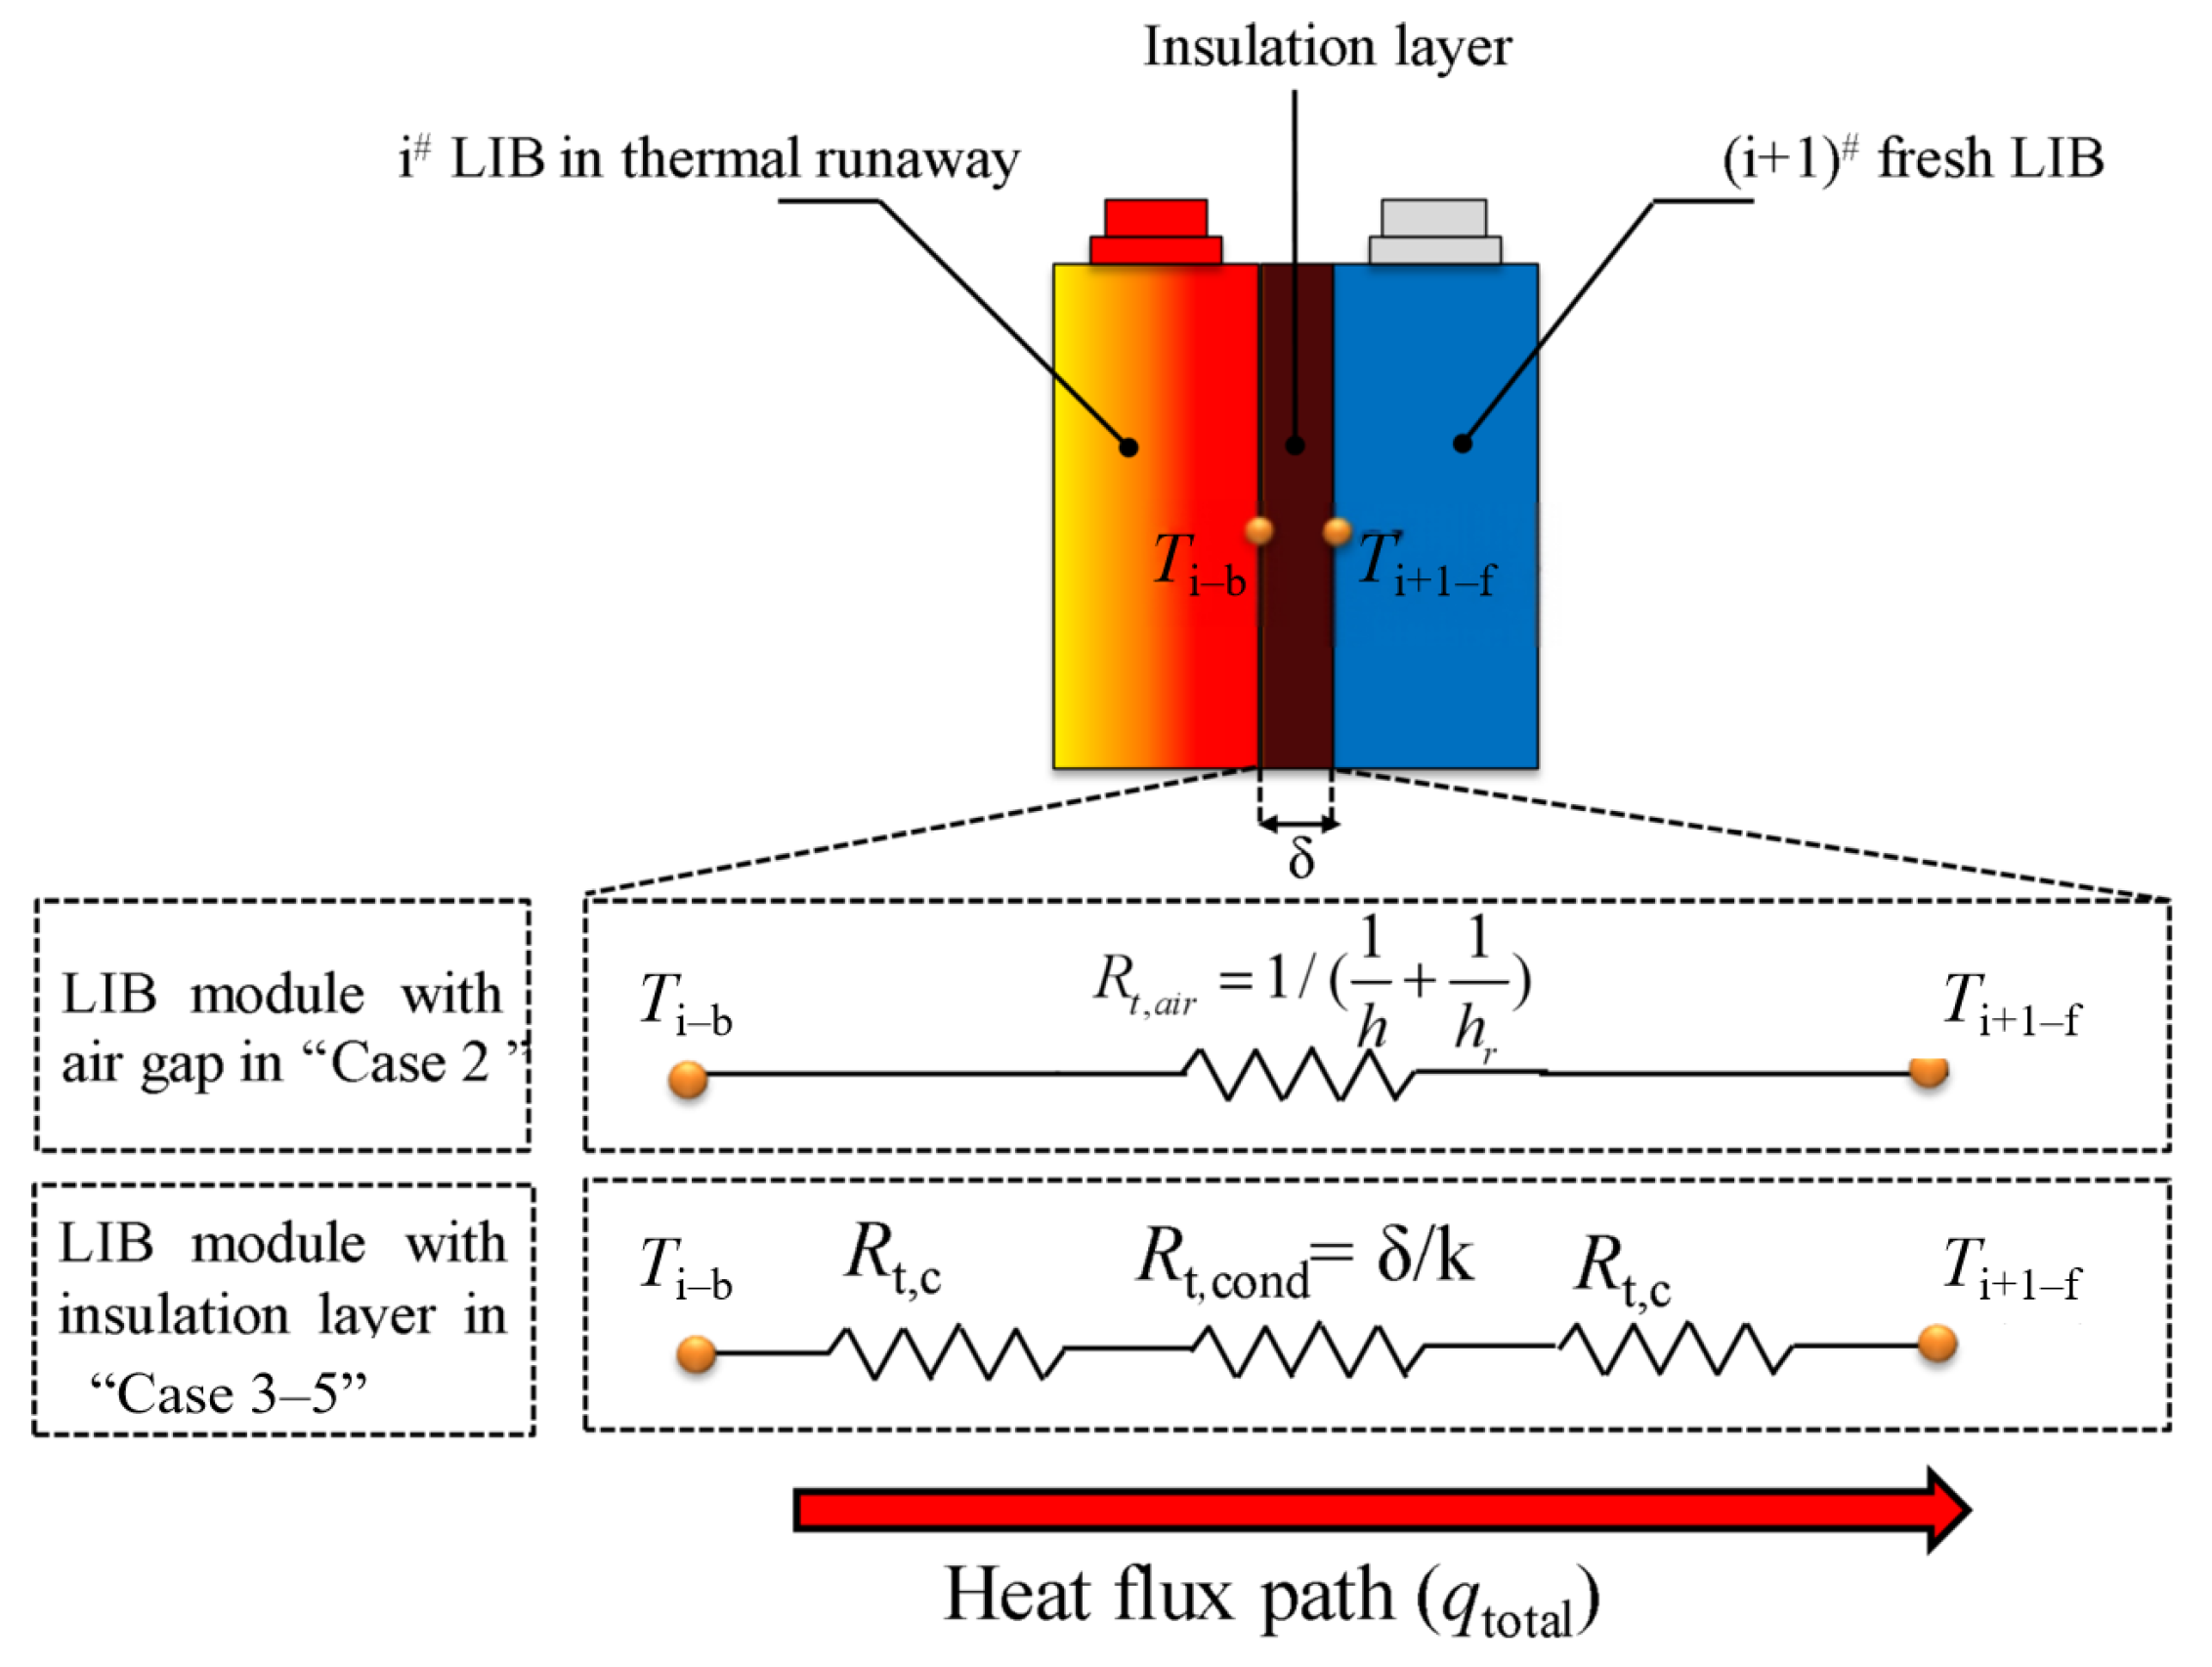
Figure 9 illustrates the network of heat transfer paths between each two adjacent LIBs in “Cases 3–5”; the thermal resistance consists of the contact resistance (
Rt,c) and the conduction resistance (
Rt,cond). In addition, there is no conduction between LIBs in “Case 2”, and thus the thermal resistance is replaced by convection resistance (
Rt,conv = 1/h) and radiation resistance (
Rt,rad = 1/h).
The amount of heat transfer between adjacent LIBs during the thermal runaway propagation event can be calculated as follows [
23,
24]:
where
is the contact walls;
is the total heat flux from the LIB in thermal runaway to next LIB;
is the thermal runaway propagation time between adjacent LIBs; and
is thermal resistance between each two LIBs. Equations (10) and (11) are derived from the thermal resistance network under the following assumptions: (1) heat transfer through the insulation layer and contact interfaces is one-dimensional and at steady state; (2) the thermal contact resistance
Rt,c is assumed to be constant with temperature, which is a simplification justified because the intense thermal runaway transient limits the time for meaningful variation; (3) the thermal resistance values in this study are primarily determined by the thermal conductivities of the adjacent materials, as heat conduction is the dominated mode of heat transfer in all cases, as shown in
Figure 10.
The amount of heat transfer between each two adjacent LIBs is shown in
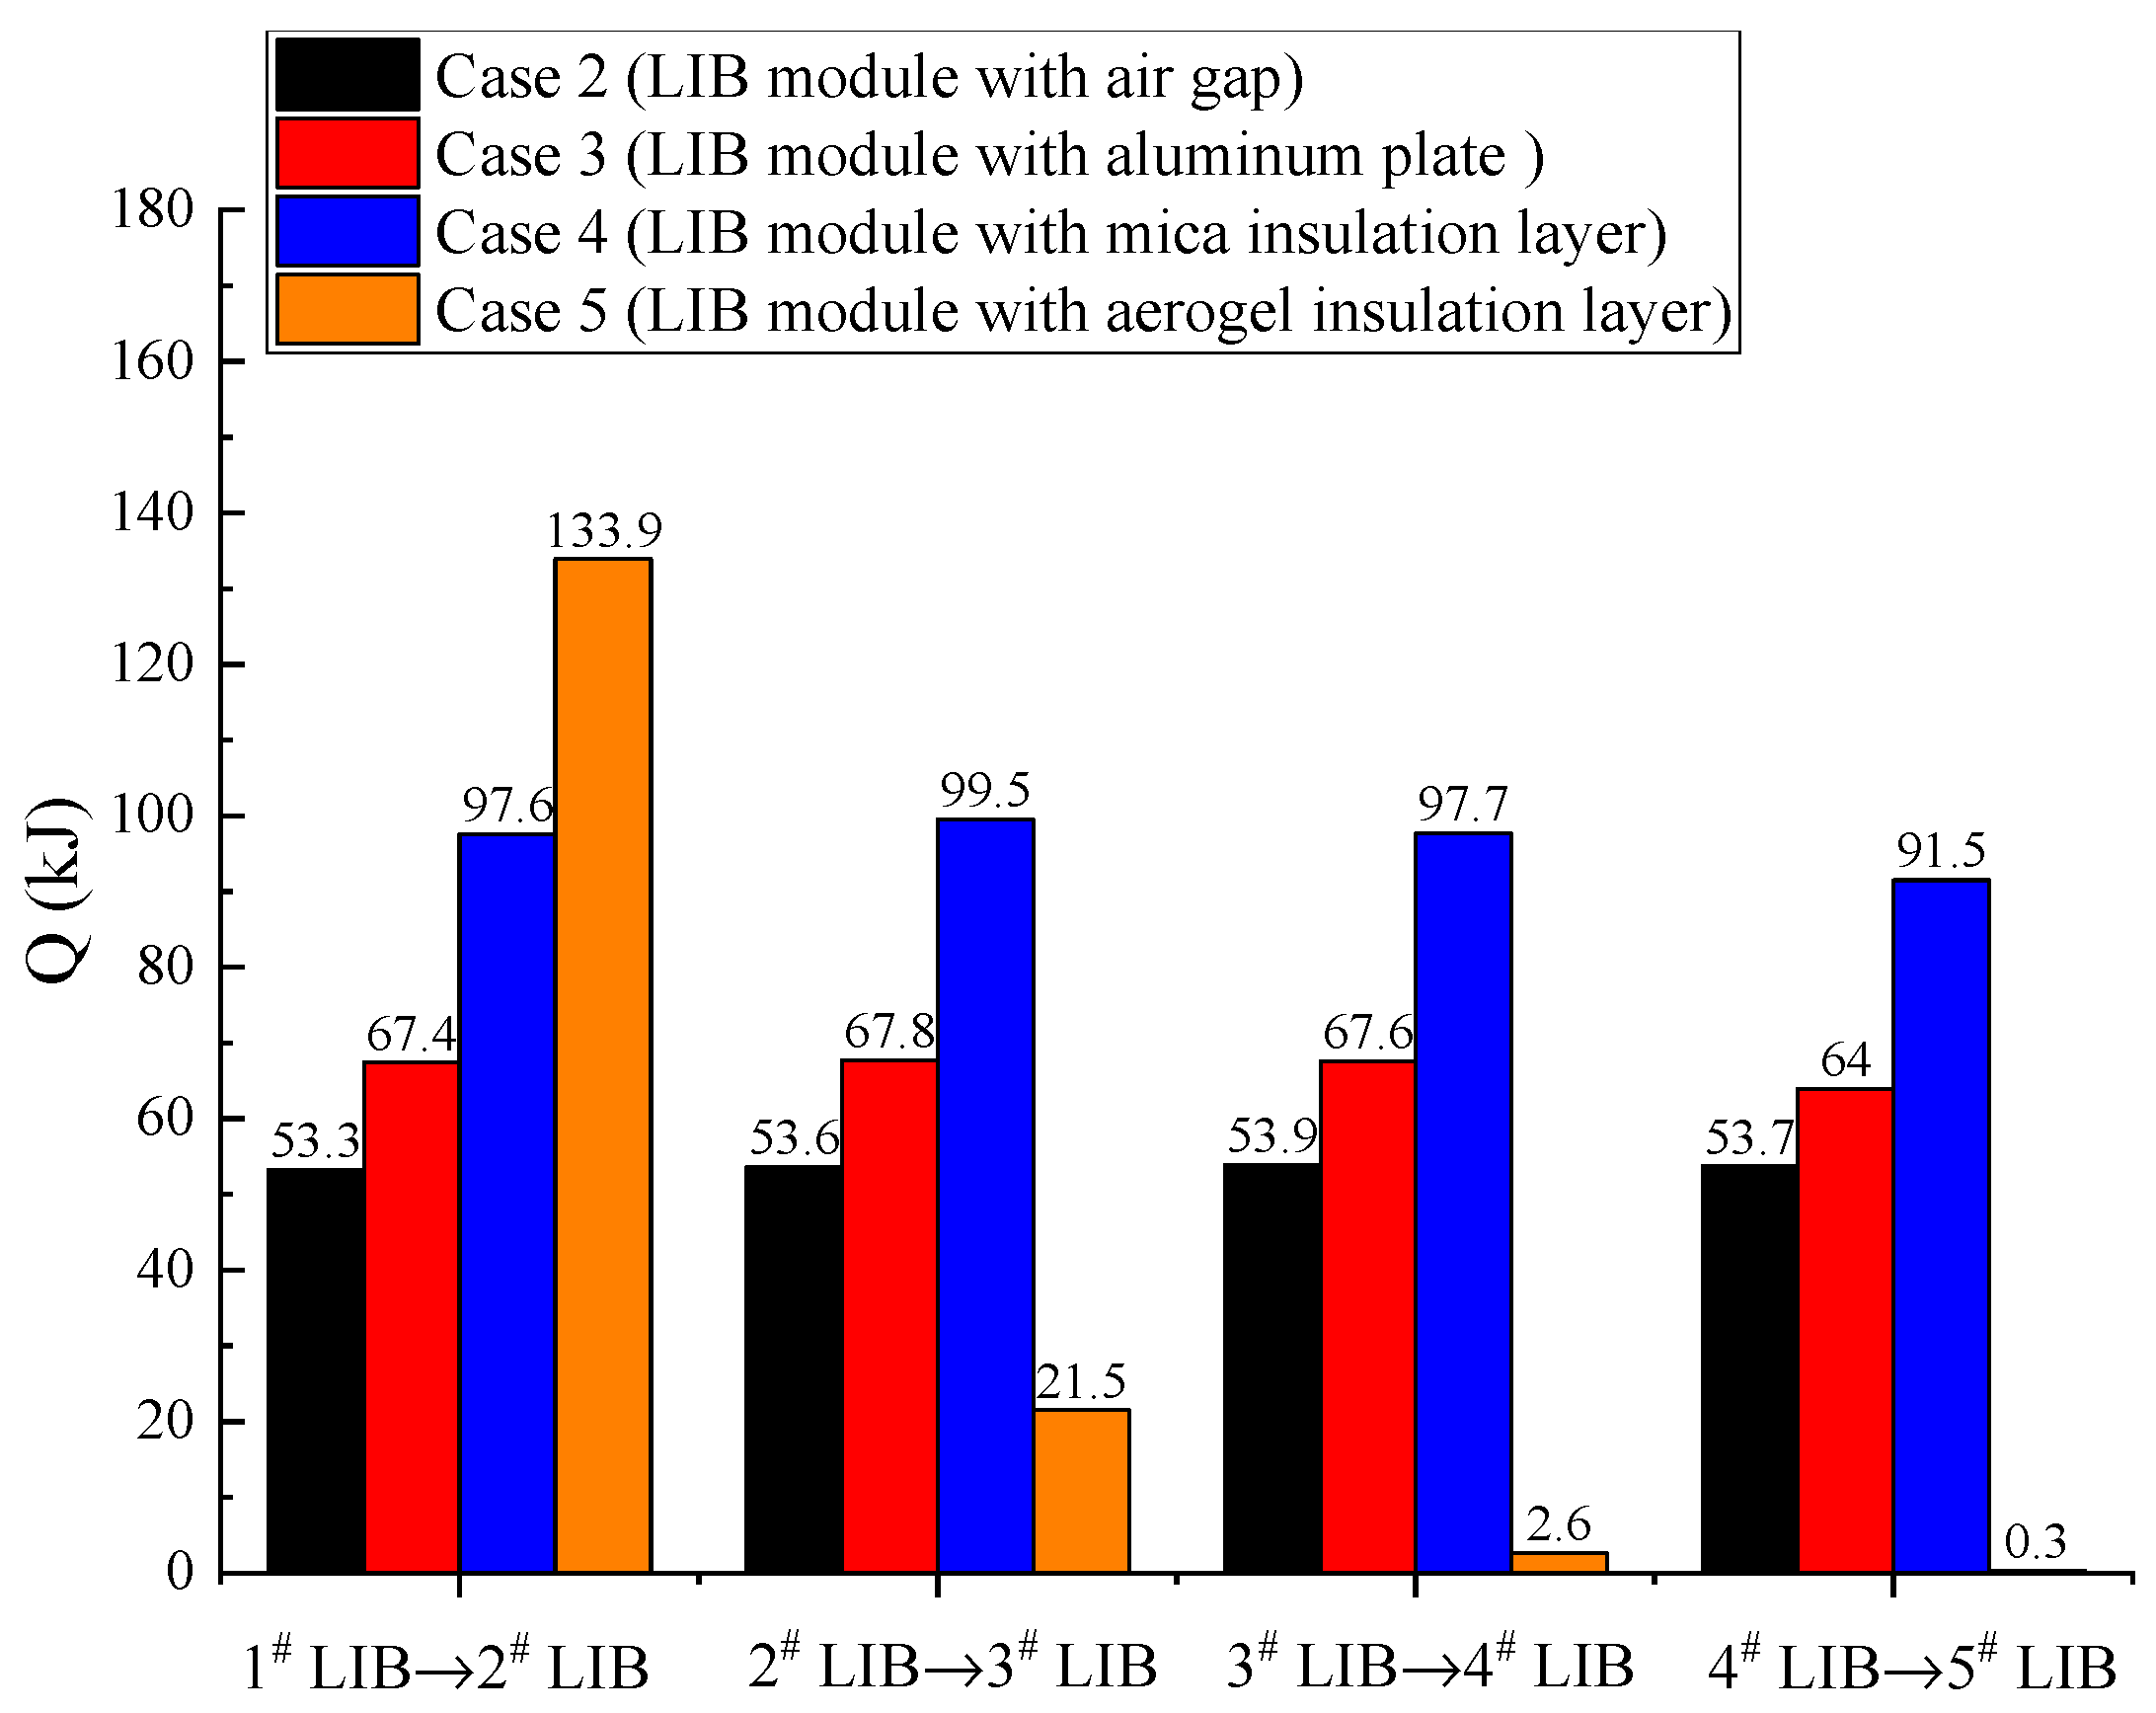
Figure 11. It can be seen that the lowest amount of heat is required to induce thermal runaway of the next fresh LIB in “Case 2”, at around 53.3 to 53.9 kJ, as the LIB is separated by an air gap. This demonstrates that the heat sink of the insulation material can contribute to the mitigation of thermal runaway propagation event.
According to
Figure 10, the thermal conductivity of the insulation material has a negative correlation with the conduction resistance when its thickness remains constant. Thus, the value of the transferred heat between LIBs increased with the decreased thermal conductivity of the insulation material in this study, as shown in
Figure 10. For the LIB module with the aluminum plate and mica insulation layer in “Cases 2 and 3”, it takes approximately 64 to 67.8 kJ and 91.5 to 99.5 kJ to propagate thermal runaway between LIBs, respectively. It is worth noting that thermal runaway was mitigated in “Case 5”, and the time from the thermal runaway of 1# LIB to the peak temperature of 2# LIB is considered to be the thermal runaway propagation time. Therefore, the 2# LIB still does not undergo thermal runaway even if a large amount of heat is transferred from 1# LIB to 2# LIB. Furthermore, the thermal resistance in Case 4 is approximately 533 times that in Case 3 in this study, and the results indicate that the average thermal runaway propagation time between adjacent cells in Case 4 is significantly longer than that in Case 3, representing an increase of about 54%. Meanwhile, the amount of heat transferred from the runaway cell to the adjacent cell in Case 4 (91.5–99.5 kJ) is also considerably higher than that in Case 3 (64–67.8 kJ), showing an increase of approximately 40–45%.
The results in this study indicate that insulation materials can contribute to the mitigation of thermal runaway propagation event in the battery module, but they can also weaken the heat dissipation condition and further aggravate the severity of the thermal runaway event. If the total heat transfer rate from an LIB in thermal runaway next to a fresh LIB is higher than the heat sink rate, the temperature of the next LIB will be increased constantly until the occurrence of thermal runaway. Therefore, effective prevention measures should be considered to balance the heat insulation and dissipation conditions in battery modules. It is essential to strike an optimal balance between “rapid heat conduction” for uniform heat source distribution and “effective heat dissipation” for efficient heat removal to the environment in practical engineering. For example, this can be achieved by designing anisotropic composite insulation layers (such as high-thermal-conductivity surface layers combined with low-thermal-conductivity core layers) or employing gradient composite structures between aerogels and aluminum plates. Furthermore, the incorporation of phase change materials alongside thermal insulation materials represents a promising approach to reconciling the competing demands of heat conduction and dissipation. Collectively, these strategies offer a direct quantitative foundation for the passive thermal management design of high-safety lithium-ion battery modules.
It should be emphasized that the quantitative results reported in this work are specific to the 38 Ah NCM square cell. Therefore, the direct extrapolation of the quantitative results should re-parameterize again for the battery module with substantially different capacities, chemistry and form factors, which includes propagation times and critical heat transfer amounts. Nonetheless, the selection method of thermal insulation materials from this study are expected to remain broadly applicable across a wide range of lithium-ion battery modules.
In most existing thermal runaway propagation models, a constant thermal conductivity for the insulation layer is assumed and the temperature-dependent behavior of separator melting was also neglected. Several improvements have also been identified, as follows. Firstly, the present model explicitly incorporates the separator melting temperature (135–150 °C) as a critical threshold for propagation risk and systematically evaluates the combined effect of insulation thickness (δ) and thermal conductivity (k). Moreover, the model quantitatively analyzes the delay times (Δti#–(i+1)#) and establishes a four-level safety classification (Levels I–IV), which can offer direct guidance for material selection in practical applications.
More importantly, the model can be applied to engineering scenarios without significant revision. For example, the predicted preventing conditions (δ = 1.0 mm, k < 0.02 W·m−1·K−1) for thermal runaway propagation event were fully consistent with the thermal conductivity of commercial aerogel materials. Similarly, the recommended k values of 0.03 to 0.05 W·m−1·K−1 correspond directly to readily available materials such as fiberglass and rock wool board when the thickness is 1.5 and 2 mm, respectively. These material parameters are directly substituted into the model without any case-specific tuning, demonstrating its ready-to-use nature for battery thermal barrier design.