Article

Formation of Non-Doped Cubic Lithium Lanthanum Zirconium Oxide Nanofibers: Insights from In Situ Synchrotron X-Ray Scattering


1
Argonne National Laboratory, Lemont, IL 60439, USA
2
Lawrence Berkeley National Laboratory, Berkeley, CA 94720, USA
*
Author to whom correspondence should be addressed.
Batteries 2026, 12(5), 171; https://doi.org/10.3390/batteries12050171
Submission received: 18 March 2026 / Revised: 5 May 2026 / Accepted: 5 May 2026 / Published: 14 May 2026

Abstract

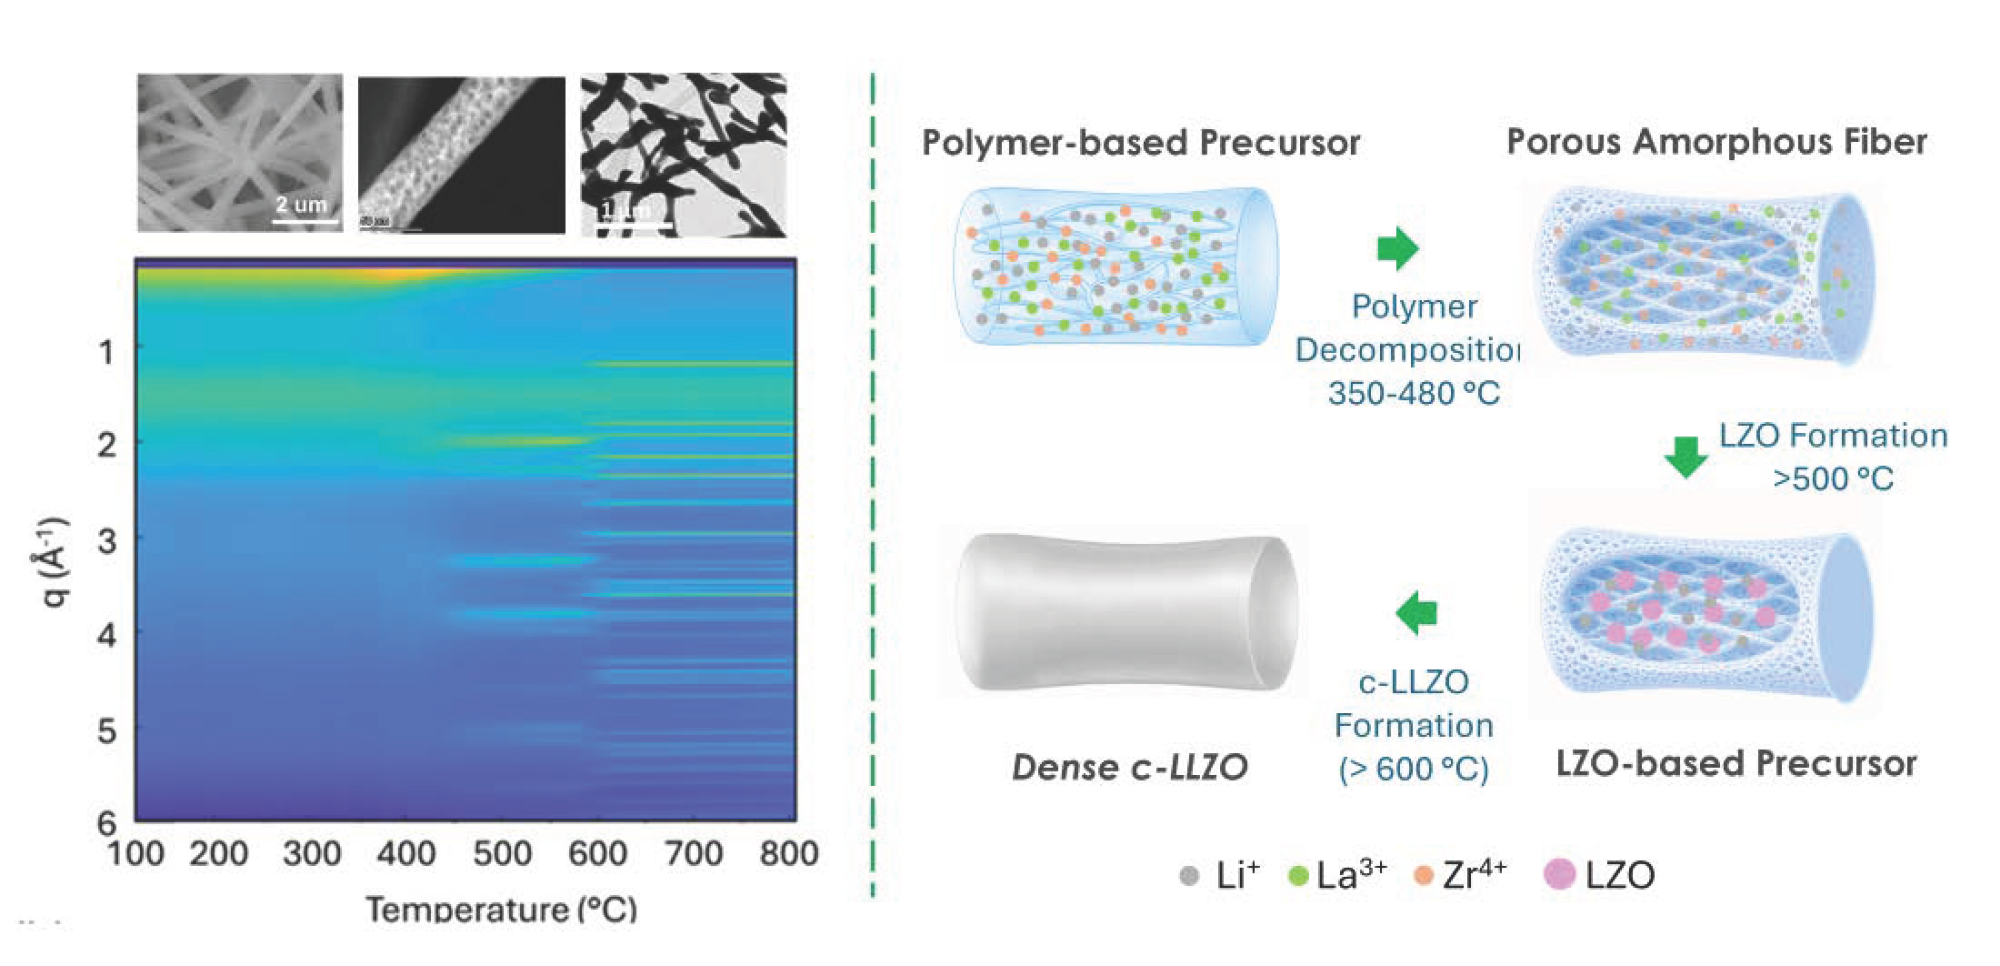
This study investigates the formation mechanism of non-doped cubic lithium lanthanum zirconium oxide (c-LLZO) nanofibers using in situ synchrotron X-ray scattering techniques. Electrospun polymer precursor nanofibers were annealed at temperatures up to 800 °C, enabling real-time tracking of phase transitions via simultaneous small-angle X-ray scattering (SAXS), wide-angle X-ray scattering (WAXS), and evolved CO2 gas analysis. The results reveal a three-step transformation pathway: polymer decomposition, formation of La2Zr2O7 (LZO), and direct conversion of LZO to c-LLZO without intermediate tetragonal phases detected within the sensitivity of our in situ WAXS measurement. Cryo-electron energy loss spectroscopy (EELS) further elucidates the role of lithium diffusion, showing Li enrichment at fiber surfaces and Li deficiency in the interior, which stabilizes the cubic phase. This Li segregation effect in nanostructured LLZO materials extends beyond the previously reported size effect. This work advances the understanding of c-LLZO formation mechanisms and provides practical insights for optimizing synthesis routes to achieve phase-pure c-LLZO for solid-state battery applications.

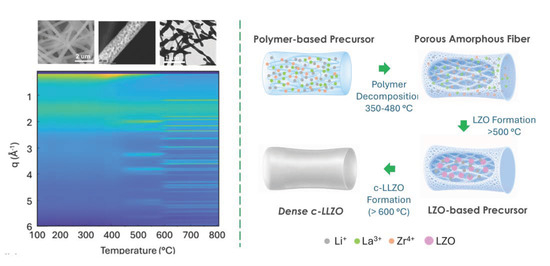
Graphical Abstract

1. Introduction

Li7La3Zr2O12 (LLZO) has been intensively studied in the past decade as a highly promising ceramic solid electrolyte material due to its high ionic (~10−3 S·cm−1) and low electronic conductivity (~10−10 S·cm−1) at room temperature, exceptional stability against lithium (Li) metal [1,2,3,4,5], and capability to operate with high voltage cathodes [2,6,7]. These properties make LLZO one of the top candidates for next-generation all-solid-state batteries (ASSBs) with improved energy density and safety. Despite its advantages, synthesizing cubic phase LLZO (c-LLZO; the crystal phase that offers a higher ionic conductivity in comparison to its tetragonal polymorph) presents significant material engineering challenges. Conventional solid-state synthesis of c-LLZO requires extremely high-temperature calcination (>1000 °C) and extended durations (>8 h) to obtain a well-crystallized garnet phase [8,9,10,11]. Such harsh conditions tend to cause lithium loss and the formation of secondary phases (e.g., La2Zr2O7 pyrochlore), both of which degrade the electrolyte’s performance. Overcompensation of lithium in the green body is often required to obtain an optimal lithium content of 6.4 ± 0.1, a composition associated with the highest Li+ conductivity [11,12,13,14]. Additionally, because a low-Li+-conductivity tetragonal polymorph tends to form as an intermediate product at moderate temperatures, introducing extrinsic dopants (e.g., Ga, Al, Ta) is crucial to stabilize the fast ion-conducting cubic-LLZO phase at room temperature [15,16]. However, using dopants also introduces chemical and microstructural heterogeneities that predispose LLZO to form interphases at surfaces and grain boundaries. Those interphases often change after contact with Li metal, sometimes improving initial wetting but ultimately enabling electron conduction and Li penetration along grain boundaries, which raises interfacial resistance and causes premature shorting [17,18,19,20,21]. These requirements further complicate the fabrication process and motivate the search for synthesis routes that can directly yield the c-LLZO without prolonged heating or excessive doping.
Early exploration was made through sol–gel and polymer-assisted combustion methods [22,23,24,25]. It was found that these approaches can bypass the tetragonal phase and generate nanocrystalline c-LLZO from a finely mixed precursor at comparatively lower temperatures than conventional solid-state sintering processes [4,10,11]. One particularly effective approach is electrospinning, which fabricates amorphous polymeric nanofiber precursors. After calcination, these fibers yield stable c-LLZO nanofibers at a temperature range between 700 and 800 °C, even without any dopants [26,27]. For instance, Yang et al. reported the successful synthesis of c-LLZO nanofibers from precursors after 3 h of calcination at 700 °C [28].
Despite the reported evidence in the literature, the understanding of cubic phase formation in nanoscale LLZO is still unclear. Yang et al. found that a shorter calcination time (1.5–2 h) resulted in La2Zr2O7 (LZO), which gradually transformed into c-LLZO after 2 h annealing [28]. This intermediate LZO phase has also been reported by others, and it was believed that the incorporation of Li into LZO drives the phase transition to cubic-LLZO [22,29]. Another hypothesis includes the reduced grain size effect. Most studies are made on samples formed from ex situ heat treatments, leaving the real-time transformation pathway and intermediate phases poorly understood.
Thus, in this work, we studied phase transformation during nanocrystalline LLZO synthesis using in situ synchrotron X-ray scattering, which tracked the structural evolution of precursors continuously from room temperature (RT) to 800 °C. Electrospun nanofibers were used as a model system. By combining simultaneous small-angle X-ray scattering (SAXS) and wide-angle X-ray scattering (WAXS) with evolved CO2 gas analysis, we were able to capture comprehensive information on chemical reaction, phase formation, and microstructure change all at once during LLZO calcination from precursors. c-LLZO was obtained directly from the low-temperature LZO precursor phase for all the samples, with and without Al dopants. Electron energy loss spectroscopy (EELS) further elucidates the role of lithium diffusion, showing Li enrichment at fiber surfaces and Li deficiency in the interior region, which stabilizes the cubic phase. This Li segregation effect in nanostructured LLZO materials extends beyond the previously reported size effect [30].
Nanostructured LLZO offers enhanced cubic phase stability, enabling the fabrication of stable and conductive c-LLZO at lower synthesis temperatures (e.g., ≤750 °C) compared to bulk LLZO (e.g., >1000 °C). This approach preserves phase purity by avoiding the formation of tetragonal LLZO phases and reducing Li loss typically associated with high-temperature sintering. The improved phase stability and purity could contribute to maintaining interfacial chemical stability and suppressing dendrite formation, as known for well-established c-LLZO electrolytes [31]. These findings not only advance fundamental understanding of c-LLZO formation mechanisms but also offer practical guidance on tailoring the material composition and synthesis pathways to achieve pure-phase c-LLZO at moderate temperatures.

2. Materials and Methods

2.1. Preparation of Electrospun Precursor Nanofibers

Precursor nanofibers were fabricated by electrospinning. The electrospinning feedstock was prepared by dissolving nitrate salts, LiNO3, La(NO3)3∙6H2O, and ZrO(NO3)2∙6H2O, in organic solvents, together with a polyvinylpyrrolidone (PVP) carrier polymer through a two-step process. The salts were dissolved in isopropanol (iPA) at a Li:La:Zr molar ratio of 8.3:3:2. Excessive Li was introduced to compensate for Li loss during high-temperature annealing of nanofibers. PVP was separately dissolved into a mixture of DMF and acetic acid (AA). The two solutions were then combined, resulting in a mixture wherein the solids (polymer and salts) comprised 15 wt.% of the solution, and the remaining 85 wt.% consisted of a 58:12:30 (wt. ratio) DMF:AA:iPA solvent mixture. All chemicals listed above were purchased from Sigma-Aldrich (St. Louis, MO, USA). The homogeneous solution was electrospun using a commercial roll-to-roll electrospinning apparatus (Inovenso, Cambridge, MA, USA), where the precursor was pumped through an array of nozzles at 10 mL/h. An electrospinning voltage of 28 kV and a working distance of 22.5 cm were used to fabricate nanofibers in a N2 environment at low (<20%) relative humidity. The electrospun precursor fibers were collected onto an aluminum foil substrate for the following thermal treatment.
A two-step annealing process was developed to convert the precursor nanofibers into LLZO nanofibers. In the first step, the precursor fibers (still adhered to Al foil) were annealed at 300 °C for 30 min with a 10 °C/min ramp rate to reinforce the nanofiber shape of the precursor. The as-spun fibers were gently removed from the Al-foil substrate and were then subjected to the first annealing step at 300 °C in a borosilicate glass jar. After the first annealing step, the fibers were loaded into a quartz crucible and annealed at elevated temperatures (up to 750 °C) to convert the Al-free fibers to c-LLZO.

2.2. In Situ Simultaneous SAXS and WAXS Characterization with CO2 Detection

In situ X-ray scattering during precursor fiber calcination was performed at the beamlines 12-ID-B and 9-ID of the Advanced Photon Source (APS) at Argonne National Laboratory. The precursor fibers, after annealing at 300 °C, were subjected to an in situ annealing process, where they were heated from RT to 800 °C while SAXS and WAXS data were simultaneously collected at a sampling rate of 1 min per data point. The X-ray wavelength was λ = 0.8856 Å, and the wave vector q was in the range of 10−2–6 Å−1. The heating rate was set as 10 °C/min between RT and 400 °C and 5 °C between 400 °C and 800 °C to capture the phase transformation. Precursor fibers were loosely packed into a quartz capillary (1.5 mm diameter, 0.05 mm wall thickness) and secured with quartz wool. The capillary was then mounted into a test cell, as shown in Figure A1, which is fitted with a thermocouple and resistive heaters to set, control, and measure sample temperatures. To obtain accurate temperature measurements, the thermocouple was inserted into the capillary tube in the vicinity of the precursor fiber samples. A CO2 sensor (Spring infrared (IR) CO2 sensor) was connected to the outlet of the capillary tube to monitor polymer decomposition during annealing. During in situ annealing, an oxygen–helium mixture (composition 20% O2–80% He) was fed through the capillary to ensure the exposure of nanofibers to oxygen to facilitate LLZO phase formation.

2.3. Microstructure and Composition Characterization

The morphology of as-spun and annealed nanofibers was characterized via scanning electron microscopy (SEM) imaging. The microstructure of the LLZO nanofibers was measured using the JEOL JEM-2100F Transmission Electron Microscope (TEM; JEOL, Peabody, MA, USA) at the Center for Nanoscale Materials (CNM) of Argonne National Laboratory. The composition of the LLZO nanofibers was examined by inductively coupled plasma (ICP) analysis after microwave digestion, which showed that the Li:La:Zr molar ratio of the fibers annealed at 750 °C was 7.3:3:2. The slight excess of Li compared with the stoichiometric composition of Li7La3Zr2O12 resulted from intentional Li compensation in the precursor nanofibers to offset Li loss during annealing.
Ex situ XRD characterization of precursor and LLZO fibers before and after annealing in air (up to 750 °C and cooling back to ambient conditions) was conducted using the Bruker D8 X-ray diffraction(XRD: λ = 1.5406 Å; Bruker, Billerica, MA, USA), with the fibers held in place on the XRD stage using Kapton tape. The surface of LLZO fibers was examined by X-ray photoelectron spectroscopy (XPS:SPECS PHOIBOS 150 hemispherical energy analyzer; SPECS, Berlin, Germany) within the energy range of 0–1100 eV. A cryo-STEM EELS experiment was performed on a Thermo Fisher Scientific Spectra 200 (Thermo Fisher, Waltham, MA, USA) operated at 200 kV and equipped with a Gatan Quantum EELS spectrometer (Gatan, Pleasanton, CA, USA). A liquid-nitrogen cryo-TEM holder (Fischione, Export, PA, USA) was employed to mitigate electron-beam damage, in combination with a low-dose electron probe (beam current ~6 pA).

2.4. Electrochemical Characterization

c-LLZO nanofiber pellet (diameter: 12.7 mm) was prepared by die-pressing at 150 MPa followed by sintering at 1200 °C for 4 h with a ramp rate of 2 °C in Ar. To avoid direct contact of c-LLZO to the alumina crucible, graphite paper was used. The sintered c-LLZO pellet was sputtered with gold (Au) as a blocking electrode for ionic conductivity measurement within a symmetric cell Au|c-LLZO|Au. Electrochemical impedance spectroscopy (EIS; BioLogic, Knoxville, TN, USA) was conducted at RT and in the temperature range of 15–55 °C between 7 MHz and 100 mHz with an amplitude of 10 mV, using a Biologic VSP-300 potentiostat and Test Equity TEC-1 thermal chamber (BioLogic, Knoxville, TN, USA).

3. Results

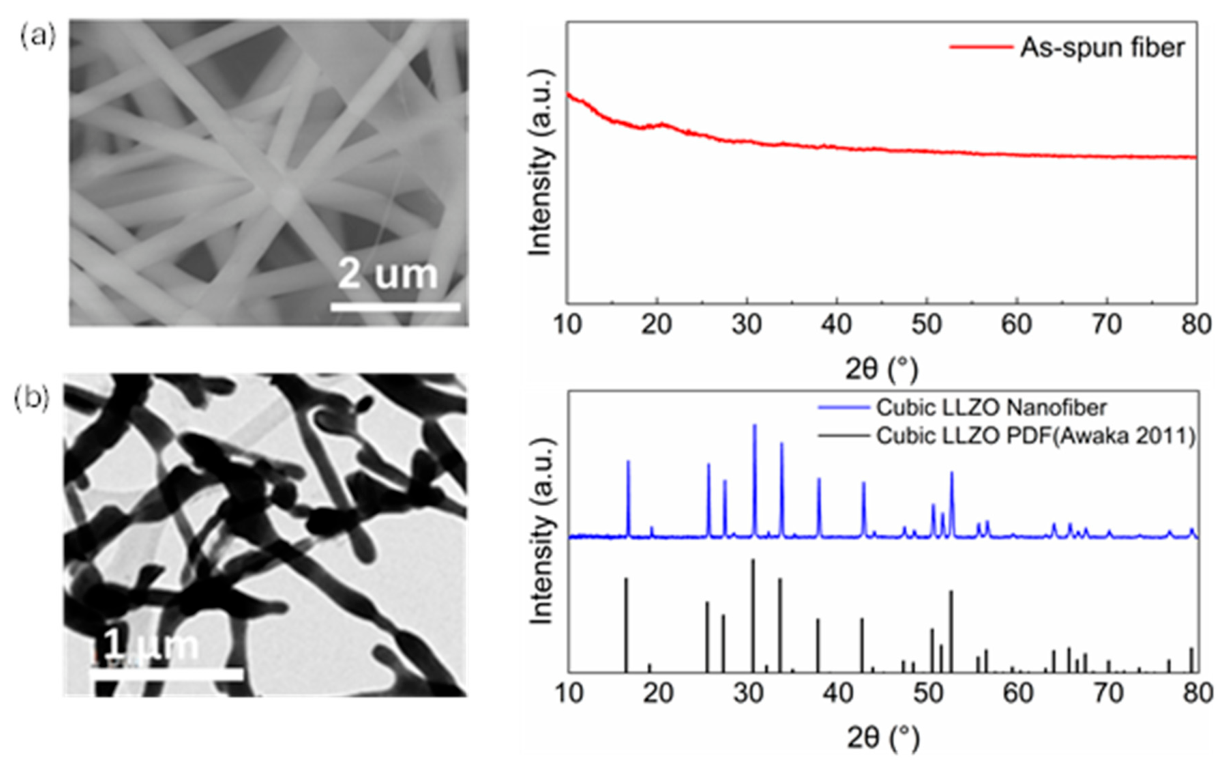
The as-spun precursor nanofibers exhibit an average fiber diameter of 371 ± 47 nm without defects (e.g., without droplets or beads). X-ray diffraction (XRD) of these fibers indicates an amorphous structure (Figure 1a). The obtained precursor nanofibers were first annealed at 300 °C for 30 min to reinforce their fiber morphology and then annealed at 700–750 °C for 2 h to form the LLZO phase. Figure 1b shows the bright-field TEM image of the high-temperature annealed fibers, which showed a reduced diameter of 135 ± 31 nm. Their XRD profile shows peaks at 2Ɵ angles consistent with cubic-LLZO [30].
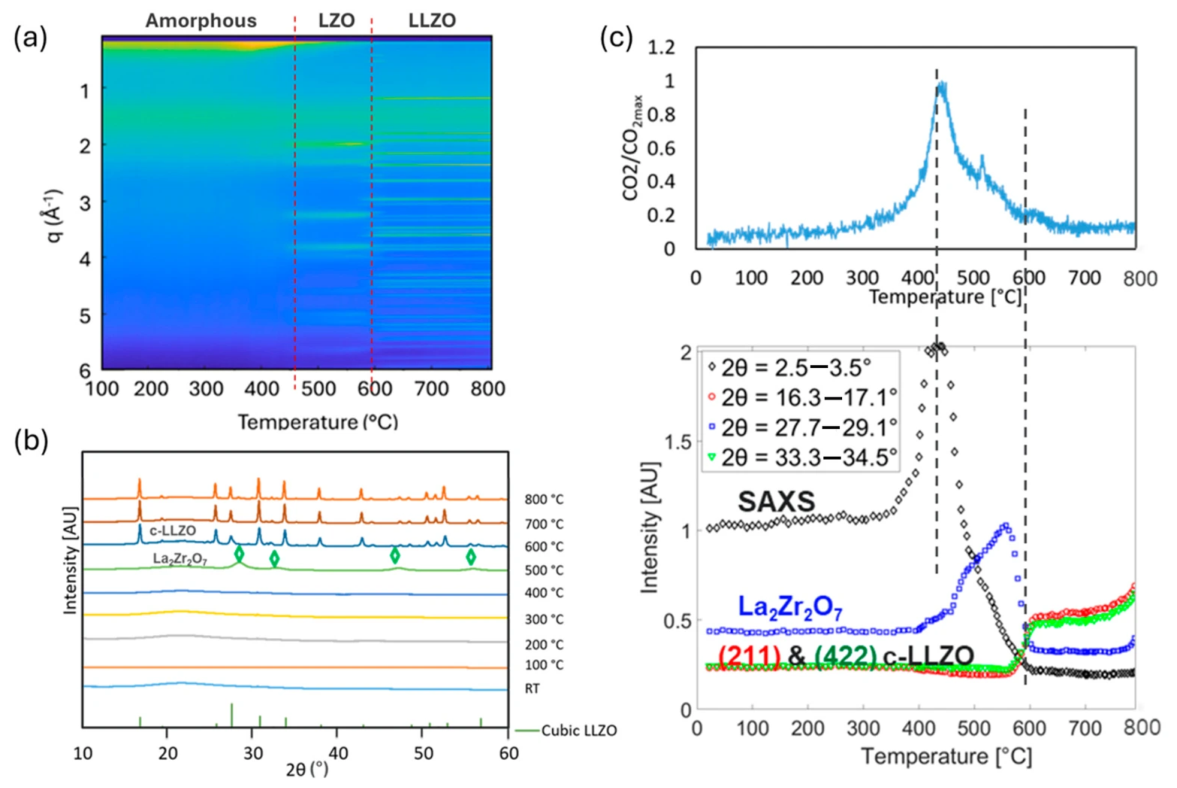
To understand the phase transition from precursor nanofibers to c-LLZO nanofibers, in situ SAXS and WAXS were examined for the 300 °C pre-annealed precursor fibers during annealing from RT to 800 °C at the synchrotron facility. In Figure 2a, a series of 1D WAXS datasets acquired as the temperature rises are combined into a 2D image. Representative profiles are replotted in Figure 2b as conventional XRD patterns by converting the wavevector q to the diffraction angle 2θ using the relationship q = 4 π sin θ λ , where λ = 1.5406 Å. As shown in Figure 2b, no apparent X-ray peaks are observed up to 400 °C, indicating that the 300 °C pre-annealed precursor nanofibers remain amorphous. Fibers started to show WAXS intensity above 450 °C (Figure 2a), indicating the onset of crystalline structures. In the converted θ-2θ XRD profile, these peaks are consistent with those that correspond to LZO (Figure 2b). The LZO peaks are broad, suggesting a nanocrystalline domain size. Further increasing the annealing temperatures to 600 °C forms c-LLZO with high phase purity. The cubic phase is stable to the end of the experiments at 800 °C. Temperature-dependent CO2 release is shown in the top panel of Figure 2c. The bottom panel of Figure 2c represents the temperature-dependent evolution of diffraction peaks. We integrated the intensities of the characteristic LZO 222 peak (2θ = 27.7–29.1°) and the LLZO phase 211 and 422 peaks (2θ = 16.3–17.1° and 33.3–34.5°, respectively), along with the SAXS peak (2θ = 2.5–3.5°). These peaks clearly indicate that c-LLZO forms at the expense of the LZO phase. Prior to the formation of LZO, SAXS intensity spikes up following the CO2 release profile, suggesting the formation of nanopores in the amorphous nanofibers as the polymer decomposes thermally, which scatters X-rays like “amorphous nano-particulates”. This is consistent with the nanofiber morphology observed at the temperature range 350–480 °C (Figure A2) and the reported PVP decomposition temperature of 350–450 °C in the literature [32,33]. This finding indicates that the morphology changes to nanofibers observed in in situ X-ray experiments are mostly associated with PVP polymer decomposition, which generates CO2 gas. It is worth mentioning that the decomposition of some of the nitrate precursor salts can also occur within the temperature range of 300–500 °C [34,35,36], which can leave behind nanopores capable of scattering small-angle X-rays (SAXS). SAXS intensity decreases soon after the CO2 release peak, indicating that any air gap between the particulates formed due to the decomposition of PVP is sealed. However, it stops decreasing at 450 °C, resembling the CO2 release profile and exhibiting a tail between 480 °C and 600 °C, where the LZO peak evolves. Because SAXS intensity arises from density contrast, its presence in the temperature range where bulk PVP has decomposed indicates carbonized, complex organic species tightly bound to particle surfaces, most likely Li-rich. The emergence of sharp LLZO diffraction peaks, accompanied by a reduction in broad LZO peaks, indicates that, as residual grain-boundary carbon decomposes, Li atoms infiltrate the LZO domains and promote their sintering.
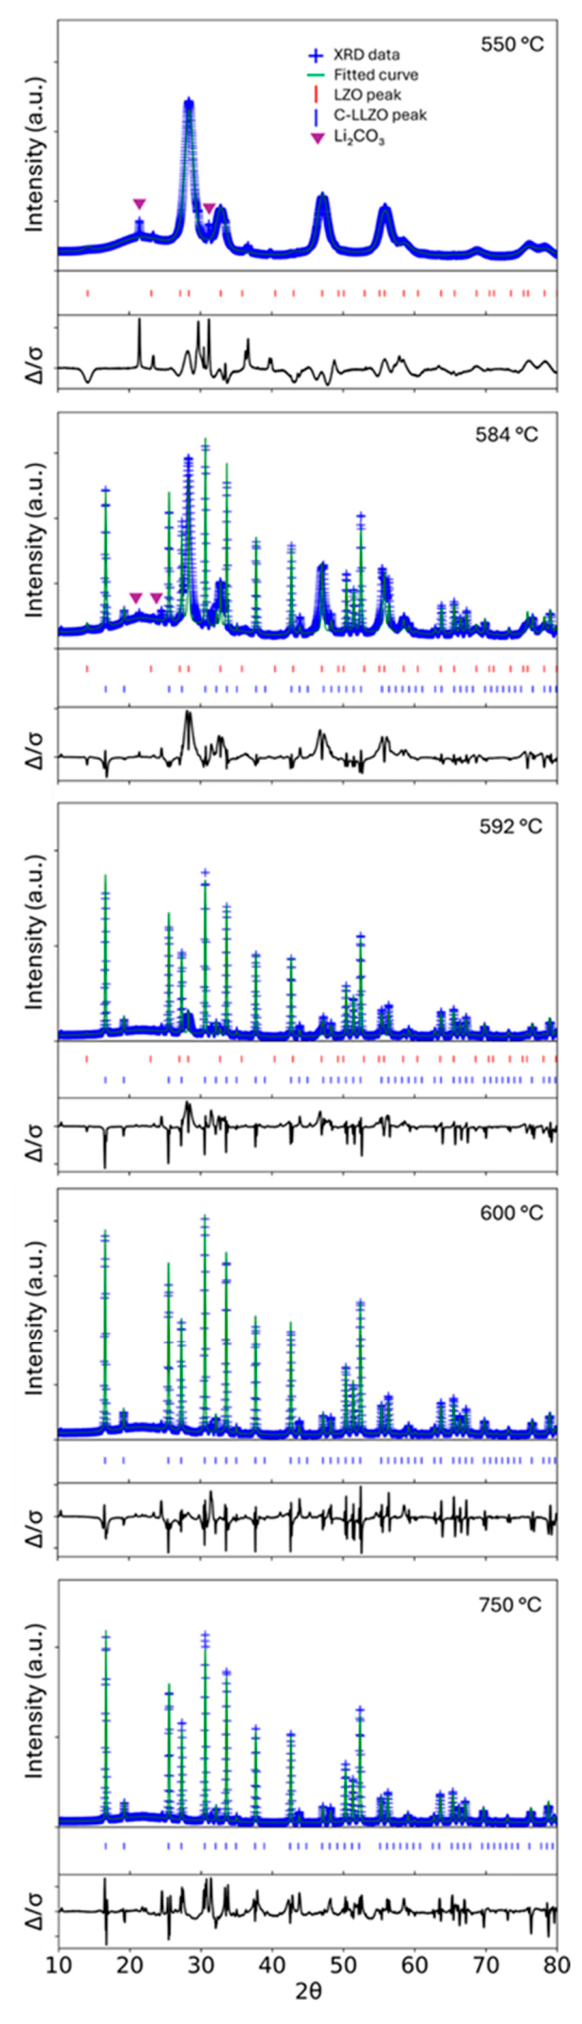
The in situ simultaneous SAXS, WAXS and CO2 detection suggest the formation of c-LLZO from polymer precursor nanofibers through three steps: PVP decomposition, LZO formation, and transition from LZO to LLZO. The first two steps are accompanied by CO2 outgassing. Notably, SAXS and WAXS patterns were collected continuously during heating at intervals of approximately 5–10 °C. Within the detection limit of the in situ WAXS experiment, no tetragonal LLZO phase was observed at any temperature during the thermal annealing process. Rather, the diffraction data indicate a direct transformation of the intermediate LZO precursor into cubic garnet LLZO under the present synthesis conditions. This interpretation is supported by the continuous evolution of the integrated LZO and c-LLZO X-ray intensity in Figure 2 and by the quantitative analysis of the phase volume fraction in Table A1, where the temperature-resolved diffraction data collected between 550 °C and 750 °C were fitted using Rietveld refinement. The refinement identified La2Zr2O7 (Fd-3m, lattice constant ~10.904 Å) and c-LLZO (Ia-3d, lattice constant ~12.994 Å). Tetragonal LLZO has not been identified across the entire experimental temperature range. Phase fractions were determined by multiphase Rietveld refinement, and the refined scale factors were converted to weight fractions. The refinement results (Table A1) show that the precursor initially crystallized as La2Zr2O7 and subsequently transformed directly into cubic-LLZO, with no detectable tetragonal LLZO at any intermediate temperature within the sensitivity of the measurement. Additionally, this c-LLZO formation occurred at a remarkably low temperature as compared to bulk LLZO, where the cubic phase often forms at above 1200 °C [37].
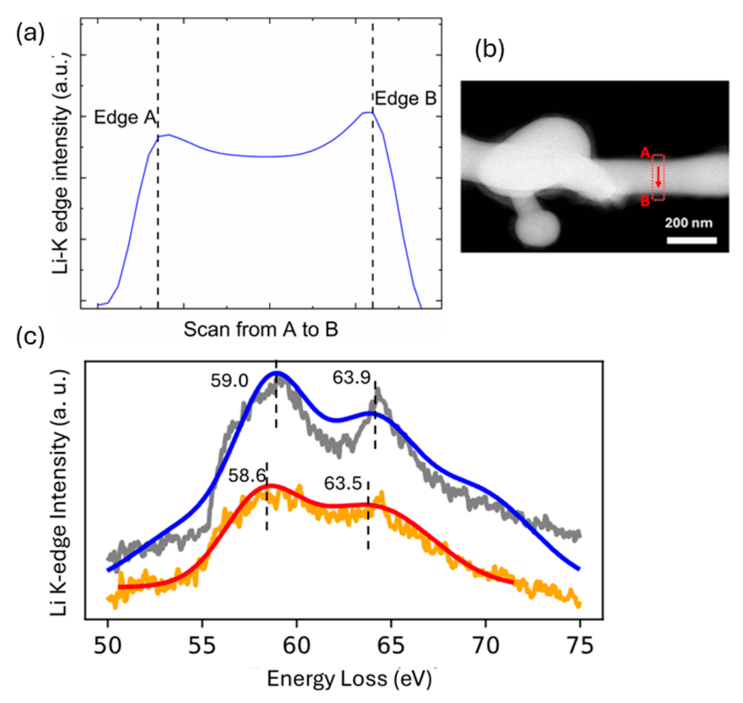
Experimental examination of Li concentration distribution within individual nanofibers was conducted by cryo-STEM Li EELS, as shown in Figure 3. The EELS line scan acquired across the LLZO nanofiber diameter (e.g., from A to B in Figure 3a,b) shows nonuniform Li distribution, where the near-surface region contains more Li than the fiber interior, as suggested by a higher Li-K edge intensity. This observation is consistent with prior reports that Li can segregate to LLZO surfaces and form Li-rich interfacial regions under relevant synthesis conditions [38]. Through a careful comparison of the Li-K EELS spectra collected from the edge and the center regions of our c-LLZO nanofibers (Figure 3c), we have identified several key features. First, both spectra exhibit two broad peaks near 55–62 eV and ~63–67 eV, a signature of the Li K-edge for c-LLZO. However, the intensity of the peaks collected at the fiber surface is higher than that measured at the center region, indicating a lower Li content near the surface. Additionally, peak positions of the center region EELS spectrum shift to lower eV as compared to the near-surface EELS spectrum, e.g., both the peak at 55–62 eV and the peak at 63–67 eV shift by about 0.4 eV. Similar peak shifts have been reported by Ma et al. for an in situ STEM-EELS study of LLZO interfaces, which revealed that the Li-K edge moved to lower energies due to modifications in the local electronic structure of Li associated with increased Li occupancy [39,40]. Thus, we attribute the Li-K shift observed in this work to a different Li electronic environment in the center region as compared with the fiber surface region, related to local variations in Li concentration or site occupancy within the LLZO lattice.
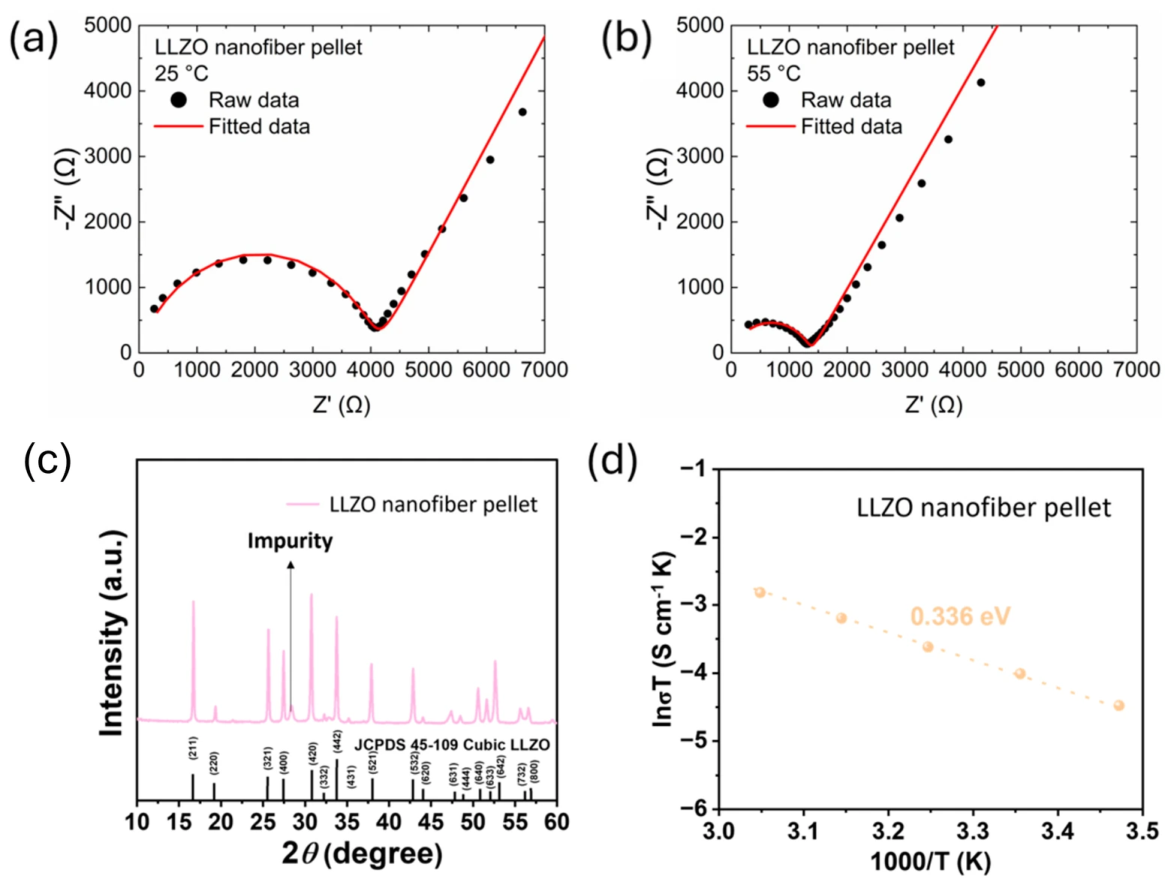
The ionic conductivity of c-LLZO nanofibers was evaluated by fabricating a solid pellet out of c-LLCO nanofibers, as it is challenging to measure the conductivity of single fibers. The pellet was fabricated by cold die-pressing of c-LLZO fibers, followed by annealing at 1200 °C for 4 h under an argon atmosphere (Figure 4a,b). High-temperature annealing is required to enhance inter-nanofiber contact and reduce interfacial resistance, as mechanical compression alone yields a packing density of only ~79%. After sintering, the pellet density increased to 87%, indicating partial densification was achieved. SEM imaging of the pellet cross-section indicates that fiber morphology has converted to a heterogeneous multi-crystallite structure due to abnormal grain growth during sintering (Appendix A.6), while the cubic garnet structure was maintained based on X-ray diffraction (Figure 4c). These results indicate that the high-temperature annealing process did not induce any phase transformation and that the c-LLZO phase remains structurally stable after pellet fabrication.
The temperature dependence of the ionic conductivity was also measured in the temperature range of 15 °C to 55 °C, and an activation energy of 0.336 eV was extracted from the Arrhenius analysis of the conductivity plots (Figure 4d), which is consistent with the literature [41]. The total ionic conductivity was 6.1 × 10⁻⁵ S/cm at room temperature, which increased to 1.8 × 10⁻⁴ S cm−1 at 55 °C, demonstrating thermally activated Li+ transport [42,43]. The temperature-dependent impedance spectra (Figure 4a,b and Figure A6) were fitted using an equivalent-circuit model. The fitting results (Table A2) indicate a low bulk resistance at all measured temperatures, corresponding to a bulk conductivity as high as 3.0 × 10⁻⁴ S cm−1 at room temperature. The interfacial resistance remains comparatively large, which is consistent with the SEM observation of a multi-crystallite structure of the sintered pellets. It is worth mentioning that lithium conductivity in LLZO is a function of both the migration energy barrier as well as the concentration of mobile lithium ions and vacancies [44]. Although the cubic phase is retained after sintering, undoped LLZO generally possesses a less optimized Li-sublattice defect chemistry, with a lower concentration of Li vacancies and a higher degree of local Li ordering than doped counterparts. Previous studies have shown that Li+ transport in garnet electrolytes is vacancy-mediated and strongly enhanced by Li-site disorder. Consequently, insufficient vacancy concentration in the undoped LLZO limits the availability of energetically accessible hopping sites and suppresses long-range percolative Li+ diffusion, even when the migration activation energy remains comparable to that of doped compositions [45,46,47]. To verify this, we have also prepared an Al-doped c-LLZO nanofiber pellet using the same c-LLZO synthesis (electrospinning followed with 750 °C annealing) and pellet fabrication (cold pressing followed by 1200 °C sintering) approaches, which showed higher ionic conductivities across the entire temperature range and a conductivity of 2.7 × 10⁻⁴ S/cm at RT (Appendix A.7). This observation indicates that inefficient Li-vacancy is the major cause of reduced Li-ion conductivity in our non-doped c-LLZO sample, which is more dominant than microstructural effect since both doped- and non-doped LLZO pallets had a similar density of ~87% and microstructure. The low density can be associated with poor interfacial contact between c-LLZO crystallites, and the excess interfacial resistance typically causes higher activation barriers [44,48,49].

4. Discussion

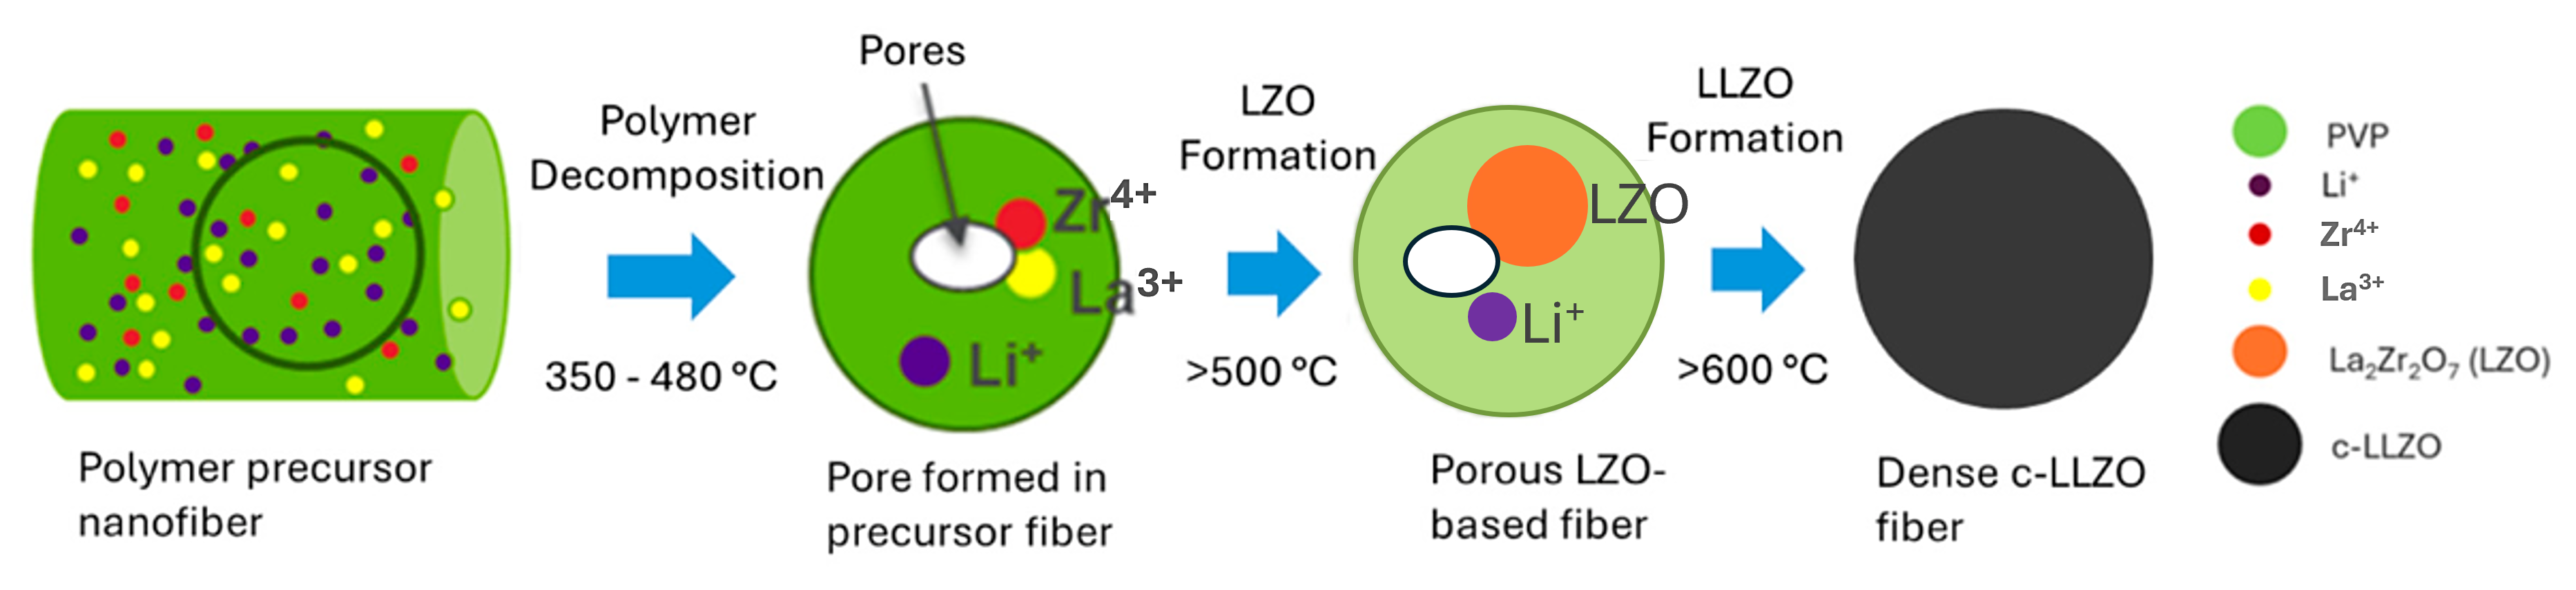
In this work, we systematically explored the formation of c-LLZO from polymer nanofiber precursors using in situ synchrotron X-ray characterization and first-principles simulations. The X-ray study clearly revealed a three-step sequence of reactions, as illustrated in Figure 5. First, PVP decomposes within the amorphous polymer nanofibers above 350 °C, resulting in the formation of nanopores in the fibers. Second, the porous structure facilitates O2 exposure to the metal ions incorporated into the precursor fibers through electrospinning, leading to the formation of the LZO phase. Upon further increasing the annealing temperature, the residual polymers are completely consumed, and the LZO phase is converted to LLZO. Throughout this entire process, no other crystalline phases, such as tetragonal LLZO, were detected within the sensitivity of our in situ WAXS measurement, indicating the high stability of the c-LLZO phase.
The cubic phase stability of our non-doped LLZO fibers is likely related to a radial Li concentration inhomogeneity that develops as Li diffuses toward the fiber surface during annealing. STEM-EELS analysis shows higher Li intensity at the fiber surface and relatively weaker Li signal in the center, indicating a Li-enriched shell and a comparatively Li-deficient interior. This distribution is physically plausible: theory predicts that Li can segregate to LLZO surfaces, making Li-rich surface regions thermodynamically favorable, while microscopy studies have shown that LLZO can also sustain localized Li enrichment at internal interfaces such as grain boundaries. Prior studies have shown that the cubic-LLZO phase is generally stabilized by Li vacancies and lattice-level Li-site disorder. Specifically, about 0.4–0.5 Li vacancies per formula unit are required to stabilize the cubic polymorph [50]. Therefore, the Li-deficient interior observed in our fibers may promote the formation of Li vacancies and associated local Li-site disorder within the LLZO lattice, which in turn helps stabilize the cubic garnet structure [5,47]. At the same time, theory predicts that Li can segregate to LLZO surfaces, making Li-rich surface regions thermodynamically possible, while microscopy studies have shown that LLZO can sustain localized Li enrichment at internal interfaces such as grain boundaries [6,38]. In parallel, nanostructured LLZO has been reported to favor the cubic phase, including electrospun LLZO nanowires that form cubic material at reduced calcination temperature and revert toward tetragonal character upon coarsening and grain growth [28]. Thus, our results are best interpreted as a coupled size–stoichiometry effect: Li segregation to the surface of nanoscale fibers lowers surface energy while creating a more Li-deficient fiber interior, which favors the vacancy/disorder states that stabilize cubic-LLZO even without dopants [36,47,50]. Many of the issues reported for doped LLZO, particularly those related to interfacial stability, have been linked to dopant reactivity. In this context, the undoped cubic phase observed here may represent a promising alternative, provided that sufficient control over synthesis, composition, and microstructure enables the formation of adequate Li vacancies in the c-LLZO lattice. Future work directed toward evaluating the electrochemical performance of non-doped c-LLZO formed through microstructure design would be interesting.

5. Conclusions

In this work, we systematically explored the cubic phase formation mechanism for nanoscale LLZO materials using LLZO nanofiber as a model system. Simultaneously, SAXS, WAXS, and CO2 sensing were conducted during in situ annealing of precursor nanofibers of the non-doped LLZO between RT and 800 °C. The results confirmed the formation of stable c-LLZO above 600 °C without any intermediate tetragonal phase detected within the sensitivity of our in situ WAXS measurement. Cryo-EELS study revealed that cubic phase stability is linked to Li diffusion from fiber body to surface, which creates Li vacancies within fiber interior. This study provides new insights into phase evolution and stability of nanostructured LLZO during low-temperature synthesis. It also offers practical guidance for tailoring synthesis pathways to achieve phase-pure c-LLZO for solid-state battery applications.

Author Contributions

Conceptualization, S.T. and Y.Z.; Methodology, B.L. and Y.Z.; Formal analysis, G.W., B.L., D.P. and Y.-G.L.; Investigation, G.W., D.P., Y.-G.L. and Y.L.; Data curation, B.L.; Writing—original draft, G.W. and Y.Z.; Writing—review & editing, M.B., Y.-G.L., M.C.T., J.S.Y., P.B., Y.L., V.S. and S.T.; Supervision, Y.Z.; Funding acquisition, S.T. and Y.Z. All authors have read and agreed to the published version of the manuscript.

Funding

This research was funded by the U.S. Department of Energy Solid-State Batteries program and the U.S. Department of Energy Laboratory Directed Research and Development Program.

Data Availability Statement

The original contributions presented in this study are included in the article. Further inquiries can be directed to the corresponding author.

Acknowledgments

The authors thank Jungkuk Lee, Ashley Simons, and Wooseok Go for their help with Al-doped LLZO nanofiber synthesis and conductivity measurement. This work was funded by the U.S. Department of Energy Transportation Technologies Office (TTO) and the Laboratory Directed Research and Development (LDRD) program. Use of the Center for Nanoscale Materials and the Advanced Photon Source, the Office of Science user facility, was supported by the U. S. Department of Energy, Office of Science, Office of Basic Energy Sciences, under Contract No. DE-AC02-06CH11357. A substantial portion of the work was conducted at the Materials Engineering Research Facility (MERF), Argonne National Laboratory, a U.S. DOE Office of Science laboratory operated by UChicago Argonne, LLC, under contract DEAC02-06CH11357. This manuscript has been authored by an author at Lawrence Berkeley National Laboratory under Contract No. DE-AC02-05CH11231 with the U.S. Department of Energy.

Conflicts of Interest

The authors declare no conflict of interest.

Abbreviations

LLZOLithium Lanthanum Zirconium Oxide
c-LLZOCubic Lithium Lanthanum Zirconium Oxide
ASSBsAll-solid-state batteries
LZOPhase impurity (La2Zr2O7 pyrochlore)
RTRoom temperature
SAXSSmall-angle X-ray scattering
WAXSWide-angle X-ray scattering
PVPPolyvinylpyrrolidone
iPAIsopropanol
DMFN, N-Dimethylformamide
AAAcetic acid
APSAdvanced Photon Source
IRInfrared
CNMCenter for Nanoscale Materials
SEMScanning electron microscopy
TEMTransmission electron microscope
STEMScanning transmission electron microscopy
Cryo-STEMCryogenic scanning transmission electron microscopy
EELSElectron Energy Loss Spectroscopy
HADDFHigh-angle annular dark-field
ICPInductively coupled plasma
XPSX-ray photoelectron spectroscopy
EISElectrochemical impedance spectroscopy
XRDX-ray diffraction
DOEU.S. Department of Energy
VTOVehicle Technologies Office
LDRDLaboratory Directed Research and Development
MERFMaterials Engineering Research Facility

Appendix A. Additional Experimental Information and Results

Appendix A.1. X-Ray Synchrotron Experimental Setup
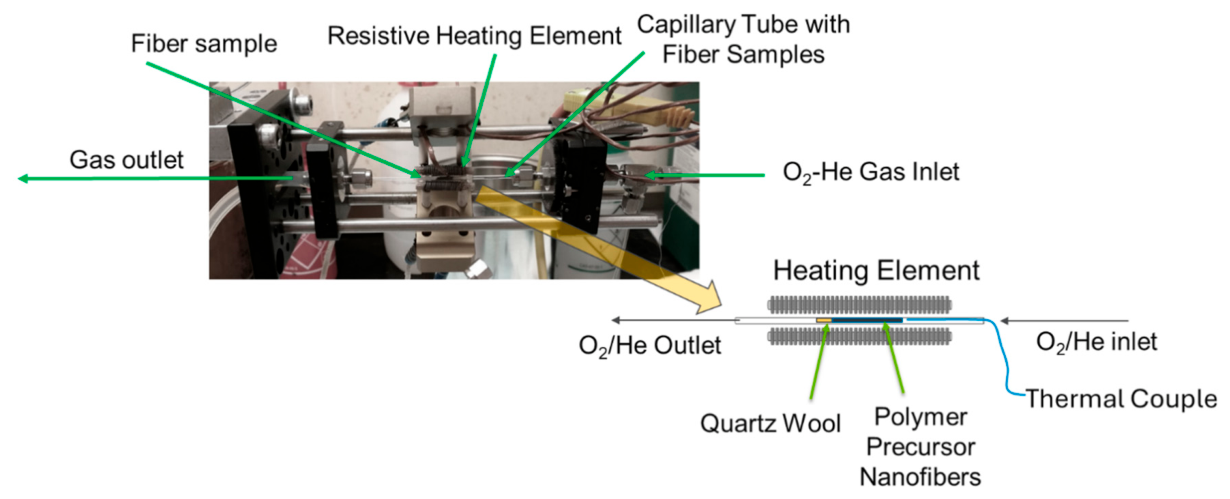
The in situ annealing apparatus used for simultaneous SAXS, WAXS, and CO2 detection at the synchrotron source is shown in Figure A1. The nanofiber precursor materials were loaded into a quartz tube, where a mixture of O2 and He gas was supplied during annealing to provide oxygen for polymer decomposition. The quartz tube was surrounded by resistive heating elements, and a thermocouple was placed inside the tube to accurately monitor the annealing temperature. The X-ray beam passed through the quartz tube in an orthogonal direction.
Figure A1. In situ annealing apparatus used for simultaneous SAXS, WAXS and CO2 detection at the synchrotron source.
Batteries 12 00171 g0a1

Appendix A.2. Morphology of 450 °C Annealed Precursor Fibers

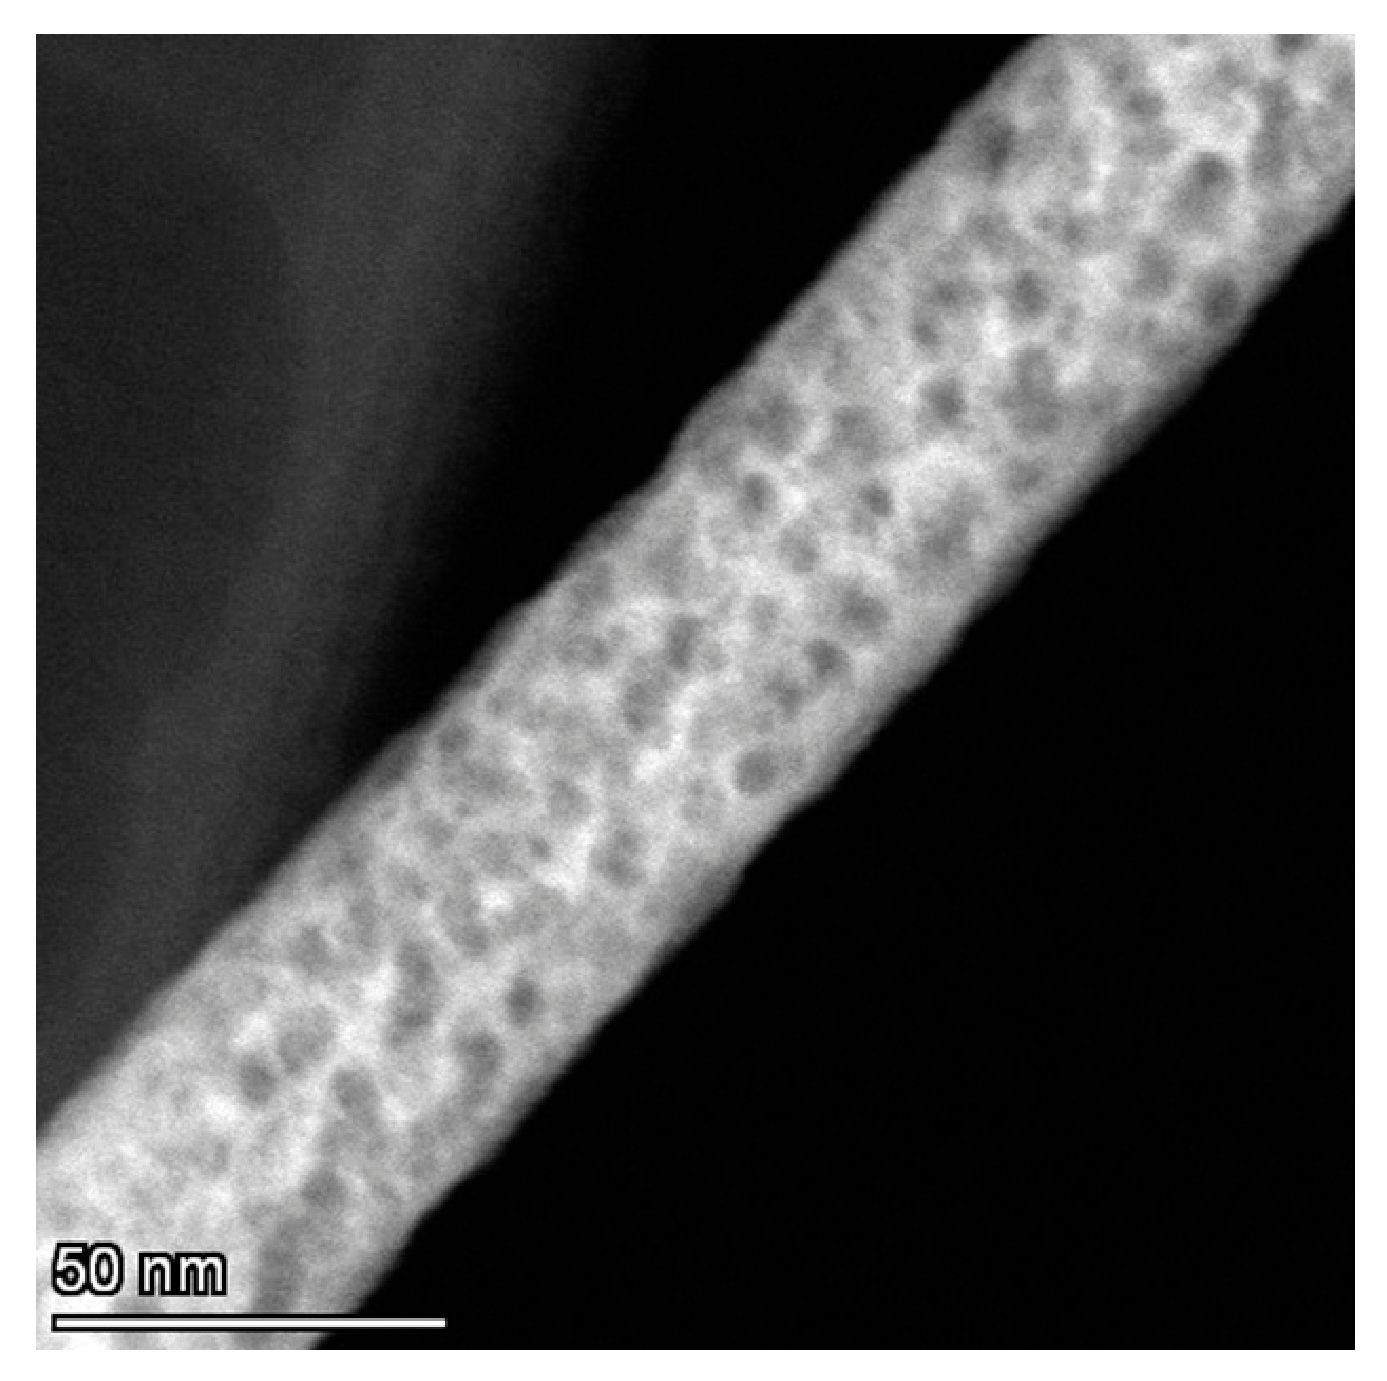
Our synchrotron SAXS experiments indicated that nanofibers annealed at 350–450 °C developed a porous structure due to polymer decomposition. This observation was confirmed by STEM imaging of a representative fiber sample annealed at 450 °C. The dark field STEM image clearly reveals pores as black spots within the bright fiber matrix.
Figure A2. Dark field STEM image of a nanofiber sample annealed at 450 °C, showing multiple pores within the fiber matrix.
Batteries 12 00171 g0a2

Appendix A.3. In Situ SAXS/WAXS X-Ray Scattering and Rietveld Refinement

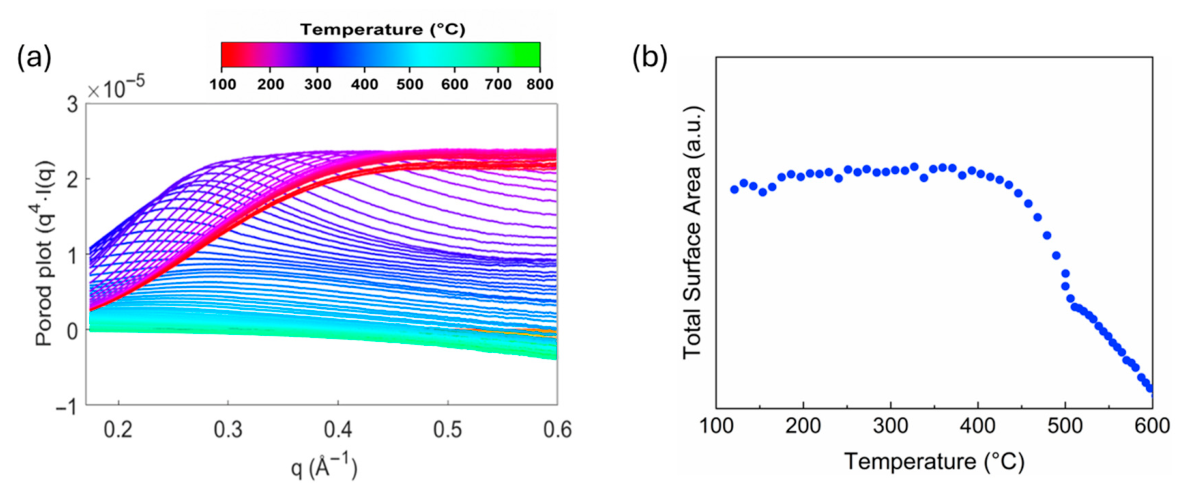
Figure A3a shows the Porod plot of the in situ X-ray scattering data between room temperature and 800 °C in the q range of 0.2–0.6 Å, which corresponds to the SAXS region. The plot exhibits distinct features in different temperature ranges. At low temperatures (e.g., below 300 °C), a flat plateau is observed at q ~ 0.4–0.6 Å, indicating well-defined interfaces, which are consistent with sharp, distinct nanofiber boundaries. At intermediate temperatures (350–450 °C), the curves bend downward at q ~ 0.2–0.4 Å, which indicates less sharp interfaces and corresponds to the formation of pore structures due to polymer decomposition. Further increasing the temperatures above 500 °C flattens the curves, indicating tighter packing and more uniform fibers. This is consistent with the formation of crystalline LZO and LLZO, as well as densification of nanofibers with increasing temperatures. It is also consistent with the sharp drop in the surface area of the nanofibers between 450 °C and 600 °C (Figure A3b) due to the formation of dense crystalline fibers.
Figure A3. (a) Porod plot of the in situ X-ray scattering data in the low-q region collected from room temperature to 800 °C; (b) the change in total surface area of fibers with annealing temperatures between 100 °C and 600 °C, extracted from the in situ SAXS and WAXS data.
Batteries 12 00171 g0a3
The Rietveld refinement identified La2Zr2O7 (Fd-3m, lattice constant ~10.904 Å) and c-LLZO (Ia-3d, lattice constant ~12.994 Å). Tetragonal LLZO has not been identified across the entire experimental temperature range. Phase fractions were determined by multiphase Rietveld refinement, and the refined scale factors were converted to weight fractions. The refinement results (Table A1) show that the precursor initially crystallized as La2Zr2O7 and subsequently transformed directly into c-LLZO, with no detectable tetragonal LLZO at any intermediate temperature within the sensitivity of the measurement.
Table A1. Phase fraction from Rietveld refinement.
Temperature (°C)LZO Fraction (wt%)Tetragonal LLZO Fraction (wt%)Cubic-LLZO Fraction (wt%)Lattice Parameter (Å)
LZO/Cubic-LLZO
550100.00.00.010.903/(n/a)
56299.90.00.110.904/(n/a)
57477.30.022.710.919/13.030
58424.90.075.110.927/13.038
5924.50.095.510.940/13.057
6000.00.0100.0(n/a)/13.054
6500.00.0100.0(n/a)/12.963
7000.00.0100.0(n/a)/12.986
7500.00.0100.0(n/a)/12.994
8000.00.0100.0(n/a)/13.046
Figure A4. Rietveld refinement was performed on selected X-ray profiles generated from an in situ WAXS study. The weighted residual (black line: Δ/σ) remained within ±0.025, indicating a reasonable agreement between the observed and calculated patterns. Li2CO3 peaks appeared at low temperature together with the formation of LZO. These Li2CO3 peaks disappeared at approximately 592 °C, suggesting that Li2CO3 reacts with the precursor during the formation of cubic-LLZO.
Batteries 12 00171 g0a4

Appendix A.4. Reaction Rates Associated with the Direct Conversion from the LZO to the Cubic-LLZO Phase

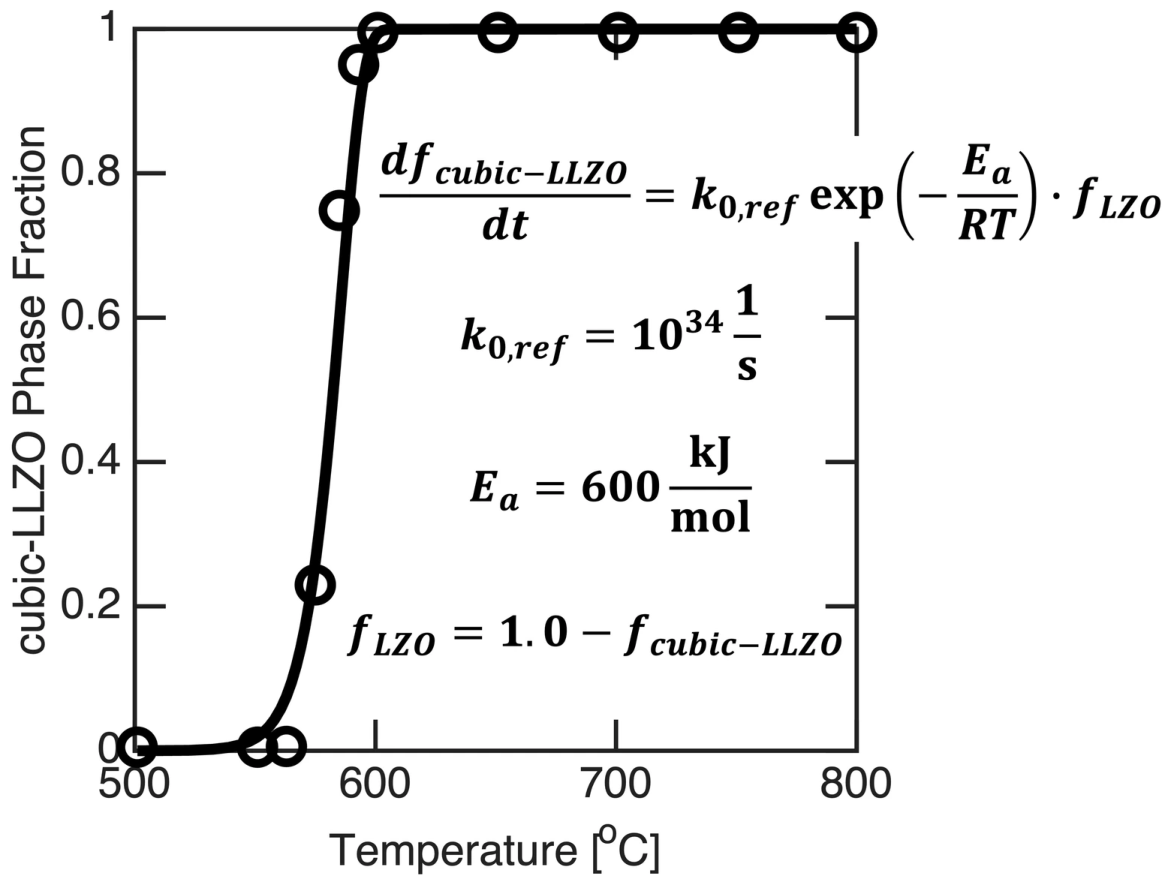
From the in situ X-ray scattering analysis of conversion of LZO to cubic-LLZO, it is possible to extract the reaction rate constants and activation energies associated with the chemical transformation. The evolution of phase fraction obtained from the Rietveld analysis of in situ XRD data is taken from Table A1, and a first-order chemical reaction model is used to fit the increase in cubic-LLZO phase fraction f c u b i c - L L Z O from the LZO precursors f L Z O . The rate of increase in the cubic-LLZO phase d f c u b i c - L L Z O / d t can be written as:
d f c u b i c - L L Z O d t = k 0 , r e f · exp E a R T · f L Z O
where k 0 , r e f indicates the reaction rate constant, E a is the activation energy associated with the conversion from LZO to cubic-LLZO, R indicates the universal gas constant, and T is the temperature in Kelvin scale. The time-dependent increase in cubic-LLZO phase fraction is estimated as:
f c u b i c - L L Z O t + Δ t = f c u b i c - L L Z O t + d f c u b i c - L L Z O d t · Δ t
where the f c u b i c - L L Z O t + Δ t indicates the fraction of cubic-LLZO at time “ t + Δ t ”, f c u b i c - L L Z O t denotes cubic-LLZO phase fraction at time “ t ”, and Δ t denotes the incremental time step. The magnitude of the reaction rate constant k 0 , r e f and the activation energy E a is obtained by comparing the model-predicted and experimentally observed evolution of cubic-LLZO phase from the LZO precursors. A temperature ramp of 5 °C/min is assumed for extracting the increase in temperature with time. The analysis reveals reaction rate constants around 3 × 1037 1/s along with activation energies of 650 kJ/mol associated with the conversion from LZO to cubic-LLZO. According to the authors’ knowledge, this is the first attempt at extracting reaction rate constants and activation energies associated with the direct conversion of LZO to cubic-LLZO.
Figure A5. Extraction of reaction rate constants and activation energies for the conversion of LZO to cubic-LLZO by comparing in situ experimental characterization with model predictions. Increase in cubic-LLZO phase fraction is reported as a function of temperature. The black circles denote experimental observations, and the solid line indicates model predictions. Direct conversion from LZO to the cubic-LLZO phase is analyzed here without the formation of any intermediates.
Batteries 12 00171 g0a5

Appendix A.5. Temperature-Dependent Impedance Spectra and Fitting Data

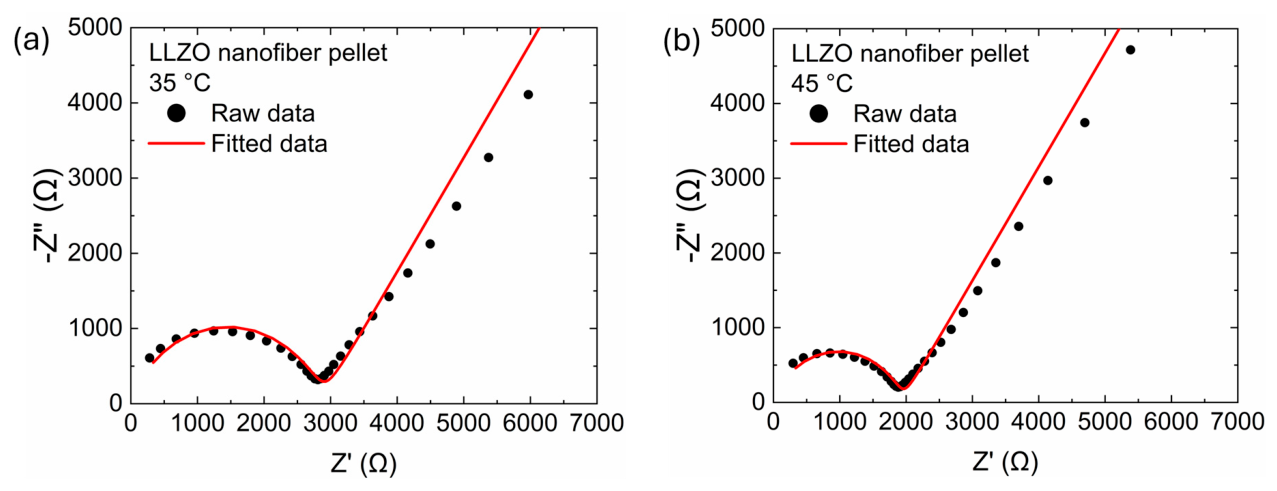
The temperature-dependent impedance spectra (Figure 4a,b and Figure A6) were fitted using an equivalent-circuit model. The fitting results (Table A2) indicate a low bulk resistance at all measured temperatures, corresponding to a bulk conductivity as high as 3.0 × 10⁻⁴ S cm−1 at room temperature, while the interfacial resistance remains comparatively large.
Figure A6. (a,b) Nyquist plot of sintered non-doped LLZO nanofiber pellet, measured at 35 °C (a) and 45 °C (b).
Batteries 12 00171 g0a6
Table A2. Fitting data of temperature-dependent impedance.
Temperature
(°C)
Bulk Resistance (Ohm)Interfacial
Resistance (Ohm)
Bulk Conductivity
(S/cm)
Total Conductivity
(S/cm)
151500.44865.71.66 × 10−43.95 × 10⁻⁵
25837.53282.52.97 × 10−46.08 × 10⁻⁵
35641.91771.53.87 × 10−48.71 × 10⁻⁵
45441.91465.55.62 × 10−41.29 × 10⁻⁴
55321.71192.97.73 × 10−41.82 × 10⁻⁴

Appendix A.6. SEM Image of the LLZO Pellet After 1200 °C Sintering

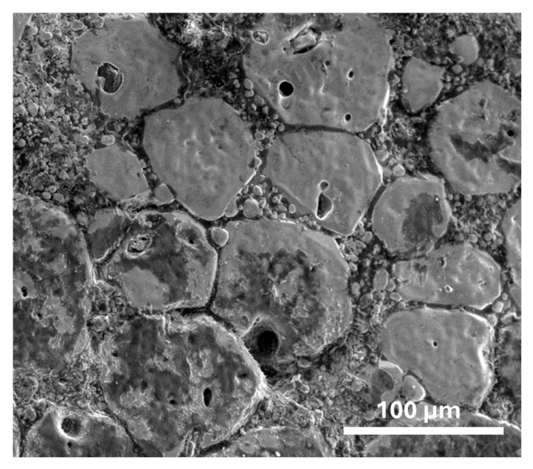
The SEM cross-sectional image of the LLZO pellet sintered at 1200 °C showed a heterogeneous microstructure consisting of large and small LLZO crystallites, indicating that fiber morphology was not retained. The bimodal microstructure results from abnormal grain growth, which typically occurs in high-temperature sintered LLZOs. Previous studies have suggested that there is no significant difference in conductivity between pellets with homogeneous and heterogeneous grain sizes [51].
Figure A7. SEM cross-sectional image of the LLZO pellet after 1200 °C sintering.
Batteries 12 00171 g0a7

Appendix A.7. Ionic Conductivity of Al-Doped LLZO Fibers

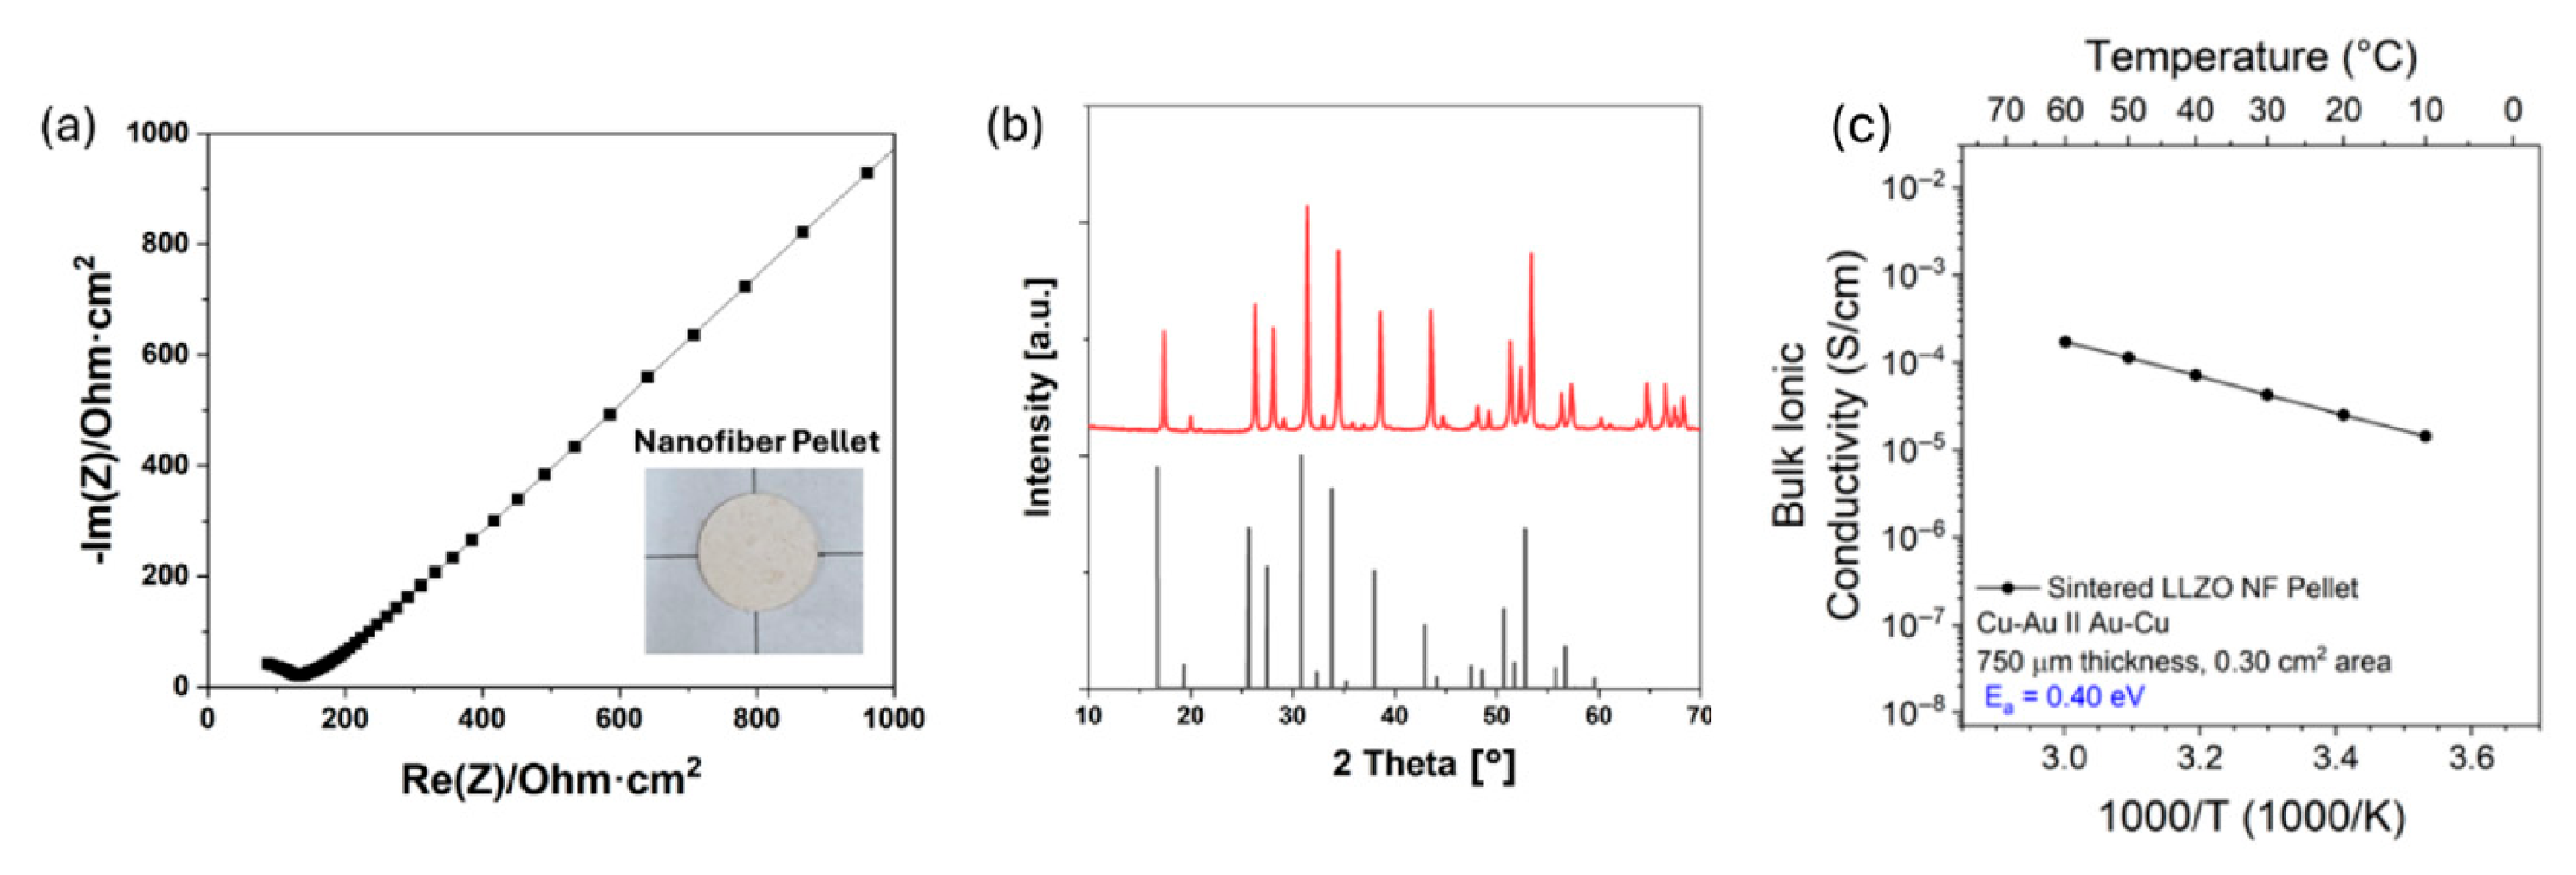
The Al-doped LLZO fibers were synthesized in a similar way to the non-doped LLZO fibers, except that an amount of Al-salt was added to the electrospinning precursors to achieve a composition of Al0.25Li6.25La3Zr2O12. The Al-doped LLZO was fabricated into a pellet using the same pressing and sintering approaches and obtained a density of ~87%, similar to the pellet of the non-doped LLZO fibers. A cubic structure was confirmed for the sintered pellet by XRD measurements. This sintered pellet showed an ionic conductivity of 2.7 × 10⁻⁴ S/cm at RT and an activation energy of 0.4 eV. Figure A8 shows the Nyquist plot, XRD profile, and the conductivity versus temperature results of the sintered Al-doped c-LLZO pellet.
Figure A8. (a) Nyquist plot of sintered Al-doped LLZO nanofiber pellet, measured at RT; (b) XRD profile for the sintered LLZO pellet (red) as compared with standard cubic phase XRD profile (black), indicating our LLZO nanofiber pellet maintains a stable cubic phase after sintering; (c) temperature dependence of bulk conductivity for the same pellet showing an activation energy of 0.4 eV.
Batteries 12 00171 g0a8

References

  1. Jung, S.-K.; Gwon, H.; Kim, H.; Yoon, G.; Shin, D.; Hong, J.; Jung, C.; Kim, J.-S. Unlocking the hidden chemical space in cubic-phase garnet solid electrolyte for efficient quasi-all-solid-state lithium batteries. Nat. Commun. 2022, 13, 7638. [Google Scholar] [CrossRef] [PubMed]
  2. Kim, S.; Kim, J.-S.; Miara, L.; Wang, Y.; Jung, S.-K.; Park, S.Y.; Song, Z.; Kim, H.; Badding, M.; Chang, J. High-energy and durable lithium metal batteries using garnet-type solid electrolytes with tailored lithium-metal compatibility. Nat. Commun. 2022, 13, 1883. [Google Scholar] [CrossRef]
  3. Wang, M.J.; Carmona, E.; Gupta, A.; Albertus, P.; Sakamoto, J. Enabling “lithium-free” manufacturing of pure lithium metal solid-state batteries through in situ plating. Nat. Commun. 2020, 11, 5201. [Google Scholar] [CrossRef]
  4. Chen, S.; Nie, L.; Hu, X.; Zhang, Y.; Zhang, Y.; Yu, Y.; Liu, W. Ultrafast Sintering for Ceramic-Based All-Solid-State Lithium-Metal Batteries. Adv. Mater. 2022, 34, e2200430. [Google Scholar] [CrossRef]
  5. Huang, J.; Li, C.; Jiang, D.; Gao, J.; Cheng, L.; Li, G.; Luo, H.; Xu, Z.L.; Shin, D.M.; Wang, Y. Solid-State Electrolytes for Lithium Metal Batteries: State-of-the-Art and Perspectives. Adv. Funct. Mater. 2025, 35, 2411171. [Google Scholar] [CrossRef]
  6. Wang, T.; Duan, J.; Zhang, B.; Luo, W.; Ji, X.; Xu, H.; Huang, Y.; Huang, L.; Song, Z.; Wen, J.; et al. A self-regulated gradient interphase for dendrite-free solid-state Li batteries. Energy Environ. Sci. 2022, 15, 1325–1333. [Google Scholar] [CrossRef]
  7. Ren, Y.; Danner, T.; Moy, A.; Finsterbusch, M.; Hamann, T.; Dippell, J.; Fuchs, T.; Müller, M.; Hoft, R.; Weber, A. Oxide-based solid-state batteries: A perspective on composite cathode architecture. Adv. Energy Mater. 2023, 13, 2201939. [Google Scholar] [CrossRef]
  8. Sakamoto, J.; Rangasamy, E.; Kim, H.; Kim, Y.; Wolfenstine, J. Synthesis of nano-scale fast ion conducting cubic Li7La3Zr2O12. Nanotechnology 2013, 24, 424005. [Google Scholar] [CrossRef]
  9. Cheng, L.; Park, J.S.; Hou, H.; Zorba, V.; Chen, G.; Richardson, T.; Cabana, J.; Russo, R.; Doeff, M. Effect of microstructure and surface impurity segregation on the electrical and electrochemical properties of dense Al-substituted Li7La3Zr2O12. J. Mater. Chem. A 2014, 2, 172–181. [Google Scholar] [CrossRef]
  10. Huang, M.; Liu, T.; Deng, Y.; Geng, H.; Shen, Y.; Lin, Y.; Nan, C.-W. Effect of sintering temperature on structure and ionic conductivity of Li7−xLa3Zr2O12−0.5x (x = 0.5~0.7) ceramics. Solid State Ion. 2011, 204, 41–45. [Google Scholar] [CrossRef]
  11. Xue, W.; Yang, Y.; Yang, Q.; Liu, Y.; Wang, L.; Chen, C.; Cheng, R. The effect of sintering process on lithium ionic conductivity of Li6.4Al0.2La3Zr2O12 garnet produced by solid-state synthesis. RSC Adv. 2018, 8, 13083–13088. [Google Scholar] [CrossRef]
  12. Xie, H.; Alonso, J.A.; Li, Y.; Fernández-Díaz, M.T.; Goodenough, J.B. Lithium Distribution in Aluminum-Free Cubic Li7La3Zr2O12. Chem. Mater. 2011, 23, 3587–3589. [Google Scholar] [CrossRef]
  13. Schwab, C.; Häuschen, G.; Mann, M.; Roitzheim, C.; Guillon, O.; Fattakhova-Rohlfing, D.; Finsterbusch, M. Towards economic processing of high performance garnets–case study on zero Li excess Ga-substituted LLZO. J. Mater. Chem. A 2023, 11, 5670–5680. [Google Scholar] [CrossRef]
  14. Gonzalez Puente, P.; Song, S.; Cao, S.; Rannalter, L.Z.; Pan, Z.; Xiang, X.; Shen, Q.; Chen, F. Garnet-type solid electrolyte: Advances of ionic transport performance and its application in all-solid-state batteries. J. Adv. Ceram. 2021, 10, 933–972. [Google Scholar] [CrossRef]
  15. Zhu, Y.; Connell, J.G.; Tepavcevic, S.; Zapol, P.; Garcia-Mendez, R.; Taylor, N.J.; Sakamoto, J.; Ingram, B.J.; Curtiss, L.A.; Freeland, J.W. Dopant-dependent stability of garnet solid electrolyte interfaces with lithium metal. Adv. Energy Mater. 2019, 9, 1803440. [Google Scholar] [CrossRef]
  16. Connell, J.G.; Fuchs, T.; Hartmann, H.; Krauskopf, T.; Zhu, Y.; Sann, J.; Garcia-Mendez, R.; Sakamoto, J.; Tepavcevic, S.; Janek, J. Kinetic versus thermodynamic stability of LLZO in contact with lithium metal. Chem. Mater. 2020, 32, 10207–10215. [Google Scholar] [CrossRef]
  17. Counihan, M.J.; Hood, Z.D.; Zheng, H.; Fuchs, T.; Merola, L.; Pavan, M.; Benz, S.L.; Li, T.; Baskin, A.; Park, J. Effect of Propagating Dopant Reactivity on Lattice Oxygen Loss in LLZO Solid Electrolyte Contacted with Lithium Metal. Adv. Energy Mater. 2025, 15, 2406020. [Google Scholar] [CrossRef]
  18. Klenk, M.; Paul, N.; Counihan, M.J.; Hood, Z.D.; Zhu, Y.; Connell, J.G.; Hervoches, C.; Gilles, R.; Sakamoto, J.; Tepavcevic, S. Comparative Analysis of Reactivity of Al and Ga Doped Garnet Solid State Electrolyte at the Interface with Li Metal. ACS Mater. Lett. 2024, 6, 5216–5221. [Google Scholar] [CrossRef]
  19. Porz, L.; Swamy, T.; Sheldon, B.W.; Rettenwander, D.; Frömling, T.; Thaman, H.L.; Berendts, S.; Uecker, R.; Carter, W.C.; Chiang, Y.M. Mechanism of lithium metal penetration through inorganic solid electrolytes. Adv. Energy Mater. 2017, 7, 1701003. [Google Scholar] [CrossRef]
  20. Cheng, E.J.; Sharafi, A.; Sakamoto, J. Intergranular Li metal propagation through polycrystalline Li6.25Al0.25La3Zr2O12 ceramic electrolyte. Electrochim. Acta 2017, 223, 85–91. [Google Scholar] [CrossRef]
  21. Swamy, T.; Park, R.; Sheldon, B.W.; Rettenwander, D.; Porz, L.; Berendts, S.; Uecker, R.; Carter, W.C.; Chiang, Y.-M. Lithium metal penetration induced by electrodeposition through solid electrolytes: Example in single-crystal Li6La3ZrTaO12 garnet. J. Electrochem. Soc. 2018, 165, A3648–A3655. [Google Scholar] [CrossRef]
  22. Kokal, I.; Somer, M.; Notten, P.H.L.; Hintzen, H.T. Sol–gel synthesis and lithium ion conductivity of Li7La3Zr2O12 with garnet-related type structure. Solid State Ion. 2011, 185, 42–46. [Google Scholar] [CrossRef]
  23. Weller, J.M.; Whetten, J.A.; Chan, C.K. Nonaqueous polymer combustion synthesis of cubic Li7La3Zr2O12 nanopowders. ACS Appl. Mater. Interfaces 2019, 12, 953–962. [Google Scholar] [CrossRef] [PubMed]
  24. Xie, H.; Li, Y.; Goodenough, J.B. Low-temperature synthesis of Li7La3Zr2O12 with cubic garnet-type structure. Mater. Res. Bull. 2012, 47, 1229–1232. [Google Scholar] [CrossRef]
  25. Janani, N.; Ramakumar, S.; Dhivya, L.; Deviannapoorani, C.; Saranya, K.; Murugan, R. Synthesis of cubic Li7La3Zr2O12 by modified sol–gel process. Ionics 2011, 17, 575–580. [Google Scholar] [CrossRef]
  26. Sharma, J.; Polizos, G.; Jafta, C.J.; Wood, D.L.; Li, J. Review—Electrospun Inorganic Solid-State Electrolyte Fibers for Battery Applications. J. Electrochem. Soc. 2022, 169, 050527. [Google Scholar] [CrossRef]
  27. Wu, M.; Liu, D.; Qu, D.; Xie, Z.; Li, J.; Lei, J.; Tang, H. 3D Coral-like LLZO/PVDF Composite Electrolytes with Enhanced Ionic Conductivity and Mechanical Flexibility for Solid-State Lithium Batteries. ACS Appl. Mater. Interfaces 2020, 12, 52652–52659. [Google Scholar] [CrossRef]
  28. Yang, T.; Gordon, Z.D.; Li, Y.; Chan, C.K. Nanostructured Garnet-Type Solid Electrolytes for Lithium Batteries: Electrospinning Synthesis of Li7La3Zr2O12 Nanowires and Particle Size-Dependent Phase Transformation. J. Phys. Chem. C 2015, 119, 14947–14953. [Google Scholar] [CrossRef]
  29. Murugan, R.; Thangadurai, V.; Weppner, W. Fast lithium ion conduction in garnet-type Li7La3Zr2O12. Angew. Chem. Int. Ed. Engl. 2007, 46, 7778–7781. [Google Scholar] [CrossRef]
  30. Awaka, J.; Takashima, A.; Kataoka, K.; Kijima, N.; Idemoto, Y.; Akimoto, J. Crystal structure of fast lithium-ion-conducting cubic Li7La3Zr2O12. Chem. Lett. 2011, 40, 60–62. [Google Scholar] [CrossRef]
  31. Paolella, A.; Zhu, W.; Bertoni, G.; Savoie, S.; Feng, Z.; Demers, H.; Gariepy, V.; Girard, G.; Rivard, E.; Delaporte, N. Discovering the influence of lithium loss on garnet Li7La3Zr2O12 electrolyte phase stability. ACS Appl. Energy Mater. 2020, 3, 3415–3424. [Google Scholar] [CrossRef]
  32. Du, Y.K.; Yang, P.; Mou, Z.G.; Hua, N.P.; Jiang, L. Thermal decomposition behaviors of PVP coated on platinum nanoparticles. J. Appl. Polym. Sci. 2006, 99, 23–26. [Google Scholar] [CrossRef]
  33. Kumar, M.; Devi, P.; Shivling, V.D. Thermal stability and electrochemical properties of PVP-protected Ru nanoparticles synthesized at room temperature. Mater. Res. Express 2017, 4, 085006. [Google Scholar] [CrossRef]
  34. Peng, C.; Liu, F.; Wang, Z.; Wilson, B.P.; Lundström, M. Selective extraction of lithium (Li) and preparation of battery grade lithium carbonate (Li2CO3) from spent Li-ion batteries in nitrate system. J. Power Sources 2019, 415, 179–188. [Google Scholar] [CrossRef]
  35. Ruiz, M.L.; Lick, I.D.; Ponzi, M.I.; Castellón, E.R.; Jiménez-López, A.; Ponzi, E.N. Thermal decomposition of supported lithium nitrate catalysts. Thermochim. Acta 2010, 499, 21–26. [Google Scholar] [CrossRef]
  36. Wang, X.; Zheng, H.; Guo, X.; Li, Y. Magnetically driven droplet manipulation on a smart surface prepared by electrospinning. Colloids Surf. A Physicochem. Eng. Asp. 2024, 685, 133308. [Google Scholar] [CrossRef]
  37. Tao, S.; Li, J.; Liu, Y.; Huang, Z.; Fu, H.; He, G.; Shen, K.; Liu, Z.; Yin, Z. Research on synthesis process and calcination reaction mechanism of porous LLZO with high specific surface area. Solid State Ion. 2025, 433, 117086. [Google Scholar] [CrossRef]
  38. Canepa, P.; Dawson, J.A.; Sai Gautam, G.; Statham, J.M.; Parker, S.C.; Islam, M.S. Particle morphology and lithium segregation to surfaces of the Li7La3Zr2O12 solid electrolyte. Chem. Mater. 2018, 30, 3019–3027. [Google Scholar] [CrossRef]
  39. Ma, C.; Cheng, Y.; Yin, K.; Luo, J.; Sharafi, A.; Sakamoto, J.; Li, J.; More, K.L.; Dudney, N.J.; Chi, M. Interfacial stability of Li metal–solid electrolyte elucidated via in situ electron microscopy. Nano Lett. 2016, 16, 7030–7036. [Google Scholar] [CrossRef]
  40. Ma, C.; Chi, M. Novel solid electrolytes for Li-ion batteries: A perspective from electron microscopy studies. Front. Energy Res. 2016, 4, 23. [Google Scholar] [CrossRef]
  41. Lu, W.; Xue, M.; Zhang, C. Modified Li7La3Zr2O12 (LLZO) and LLZO-polymer composites for solid-state lithium batteries. Energy Storage Mater. 2021, 39, 108–129. [Google Scholar] [CrossRef]
  42. Kodgire, P.; Tripathi, B.; Chandra, P. Review of Garnet-Based Solid Electrolytes for Li-Ion Batteries (LIBs). J. Electron. Mater. 2024, 53, 2203–2228. [Google Scholar] [CrossRef]
  43. Huang, X.; Lu, Y.; Guo, H.; Song, Z.; Xiu, T.; Badding, M.E.; Wen, Z. None-mother-powder method to prepare dense Li-garnet solid electrolytes with high critical current density. ACS Appl. Energy Mater. 2018, 1, 5355–5365. [Google Scholar] [CrossRef]
  44. Xiang, X.; Chen, F.; Shen, Q.; Zhang, L.; Chen, C. Effect of the lithium ion concentration on the lithium ion conductivity of Ga-doped LLZO. Mater. Res. Express 2019, 6, 085546. [Google Scholar] [CrossRef]
  45. Sastre, J.; Priebe, A.; Döbeli, M.; Michler, J.; Tiwari, A.N.; Romanyuk, Y.E. Lithium garnet Li7La3Zr2O12 electrolyte for all-solid-state batteries: Closing the gap between bulk and thin film Li-ion conductivities. Adv. Mater. Interfaces 2020, 7, 2000425. [Google Scholar] [CrossRef]
  46. Afyon, S.; Krumeich, F.; Rupp, J.L. A shortcut to garnet-type fast Li-ion conductors for all-solid state batteries. J. Mater. Chem. A 2015, 3, 18636–18648. [Google Scholar] [CrossRef]
  47. Jeong, W.; Park, S.S.; Yun, J.; Shin, H.R.; Moon, J.; Lee, J.-W. Tailoring grain boundary structures and chemistry of Li7La3Zr2O12 solid electrolytes for enhanced air stability. Energy Storage Mater. 2023, 54, 543–552. [Google Scholar] [CrossRef]
  48. Sharafi, A.; Yu, S.; Naguib, M.; Lee, M.; Ma, C.; Meyer, H.M.; Nanda, J.; Chi, M.; Siegel, D.J.; Sakamoto, J. Impact of air exposure and surface chemistry on Li–Li7La3Zr2O12 interfacial resistance. J. Mater. Chem. A 2017, 5, 13475–13487. [Google Scholar] [CrossRef]
  49. Han, X.; Gong, Y.; Fu, K.; He, X.; Hitz, G.T.; Dai, J.; Pearse, A.; Liu, B.; Wang, H.; Rubloff, G. Negating interfacial impedance in garnet-based solid-state Li metal batteries. Nat. Mater. 2017, 16, 572–579. [Google Scholar] [CrossRef] [PubMed]
  50. Thompson, T.; Wolfenstine, J.; Allen, J.L.; Johannes, M.; Huq, A.; David, I.N.; Sakamoto, J. Tetragonal vs. cubic phase stability in Al–free Ta doped Li7La3Zr2O12 (LLZO). J. Mater. Chem. A 2014, 2, 13431–13436. [Google Scholar] [CrossRef]
  51. Go, W.; Doeff, M.M.; Tucker, M.C. Investigation of MgO additives on microstructure and properties of thin LLZO electrolytes for all-solid-state batteries. J. Mater. Chem. A 2025, 13, 8835. [Google Scholar] [CrossRef]
Figure 1. (a) SEM image and X-ray diffraction of as-spun precursor fibers; (b) TEM image and X-ray diffraction of LLZO fibers after high-temperature annealing (750 °C, 2 h) [30].
Batteries 12 00171 g001
Figure 2. (a) In situ 2D WAXS data measured during nanofibers annealing from room temperature to 800 °C (the dashed lines mark the temperature range of LZO and LLZO phases for the eyes); (b) XRD patterns converted from the WAXS data, green diamond signs indicate the LZO peaks; and (c) CO2 detection during annealing and the integrated intensity of the signature XRD peaks of SAXS, LZO, and c-LLZO phases. The first dashed line marks the temperature at which the maximum CO2 release coincides with the strongest SAXS intensity peak. The second dashed line indicates the temperature associated with the phase transition from LZO to c-LLZO.
Batteries 12 00171 g002
Figure 3. (a) EELS line scan across an individual c-LLZO nanofiber shown in (b) STEM-HAADF image from fiber surface A to surface B (red arrow), showing Li intensity variation across the fiber diameter. Dashed lines in (a) indicate the highest Li intensity at surface A and surface B in (b); (c) EELS spectra collected from the near-surface and center regions of the fiber, showing the Li-K edge in the 50–80 eV energy-loss window. A peak shift between the center and near-surface spectra is observed. Blue and red lines represent the fitted Li-K edge curves, and dashed lines indicate the Li-K edge peak positions.
Batteries 12 00171 g003
Figure 4. (a,b) Nyquist plot of sintered non-doped LLZO nanofiber pellet, measured at RT (a) and 55 °C (b); (c) XRD profile for the sintered LLZO pallet (pink) as compared with standard cubic phase XRD profile (black), indicating our LLZO nanofiber pellet maintains a stable cubic phase after sintering with minimum LZO impurity; (d) temperature dependence of bulk conductivity for the same pellet showing an activation energy of 0.336 eV.
Batteries 12 00171 g004
Figure 5. Schematic illustration of c-LLZO formation from polymer precursor nanofibers containing Li, Zr, and La ions. The circle on the polymer precursor nanofiber indicates a zoom-in area.
Batteries 12 00171 g005
Disclaimer/Publisher’s Note: The statements, opinions and data contained in all publications are solely those of the individual author(s) and contributor(s) and not of MDPI and/or the editor(s). MDPI and/or the editor(s) disclaim responsibility for any injury to people or property resulting from any ideas, methods, instructions or products referred to in the content.