3.1. Impact of Cathode Orientation on Performance
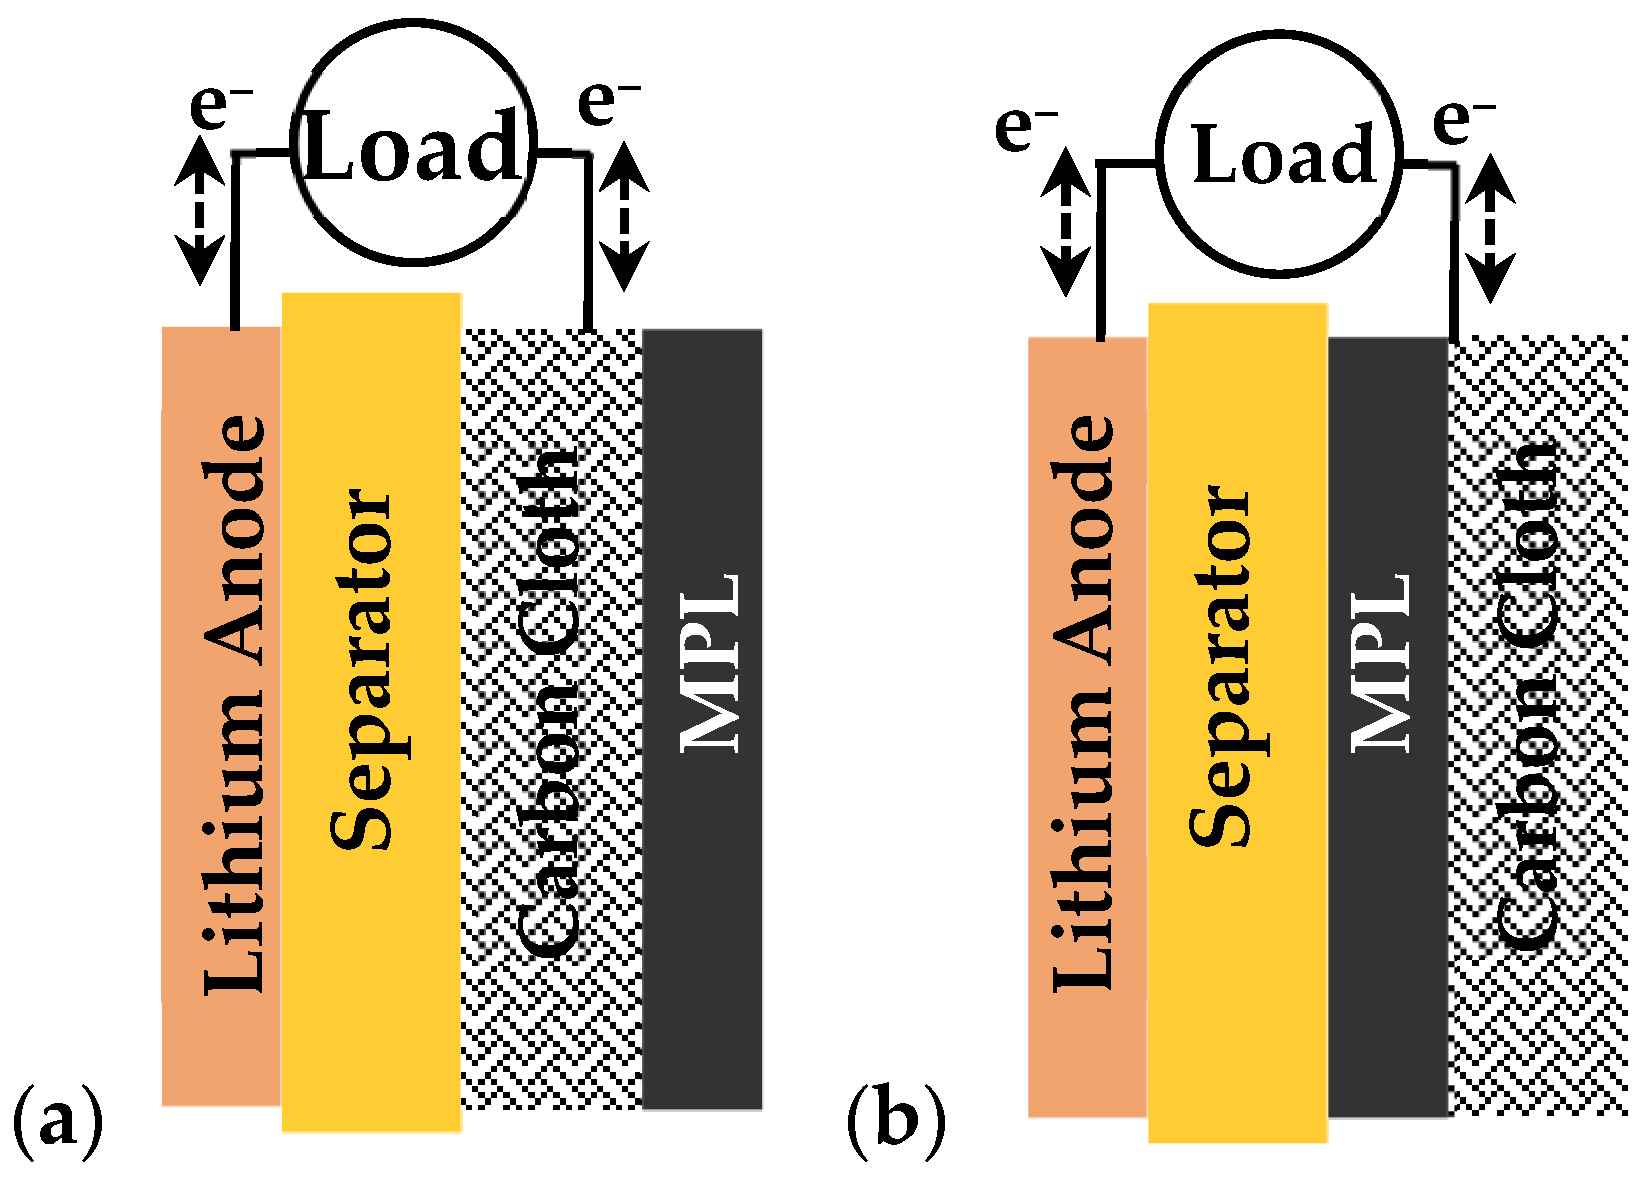
Figure 2 shows a schematic of the two cathode orientations: the microporous layer (MPL) facing away from the separator (MPL Outward) and toward the separator (MPL Inward). These two scenarios used identical electrodes, which are made from MPL coated on carbon cloth, with the only difference being the orientation of the cathode electrode during assembly.
To determine the dependence of the discharge and charge capacity on cathode orientation, batteries with two different cathode orientations were run under the same conditions, as described in
Section 2.2.
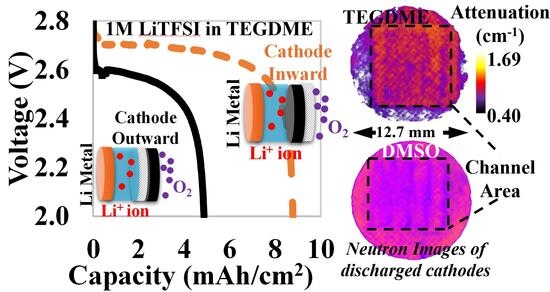
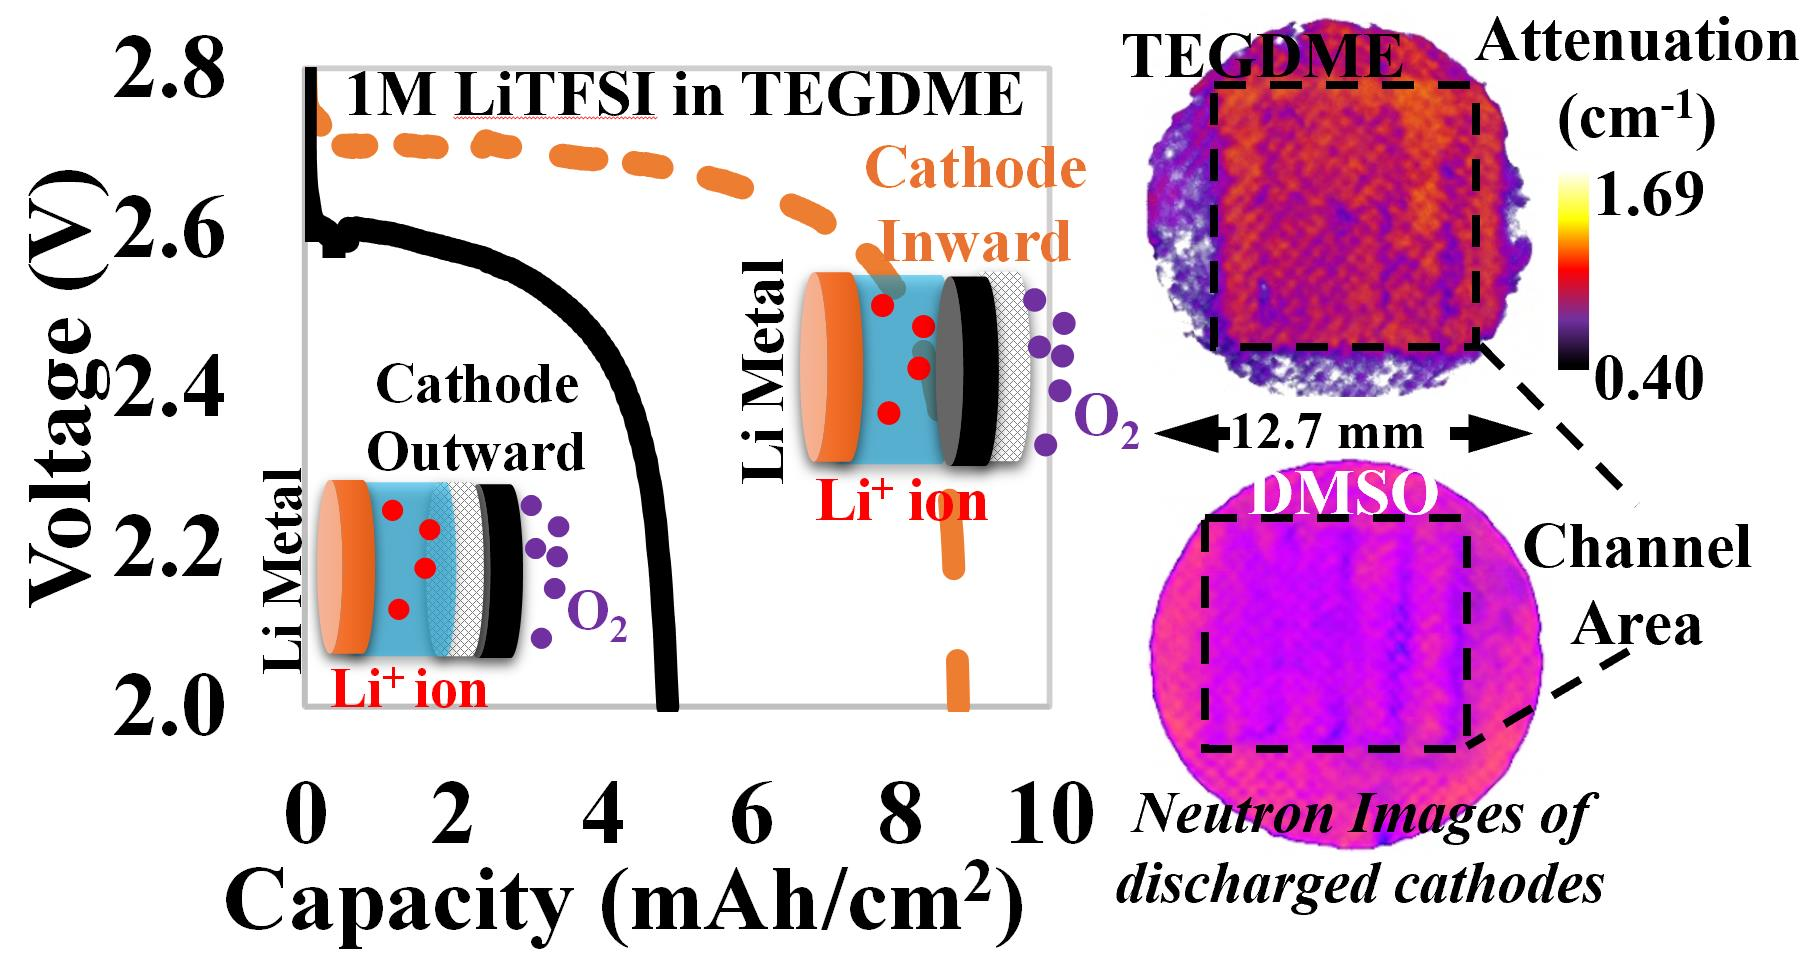
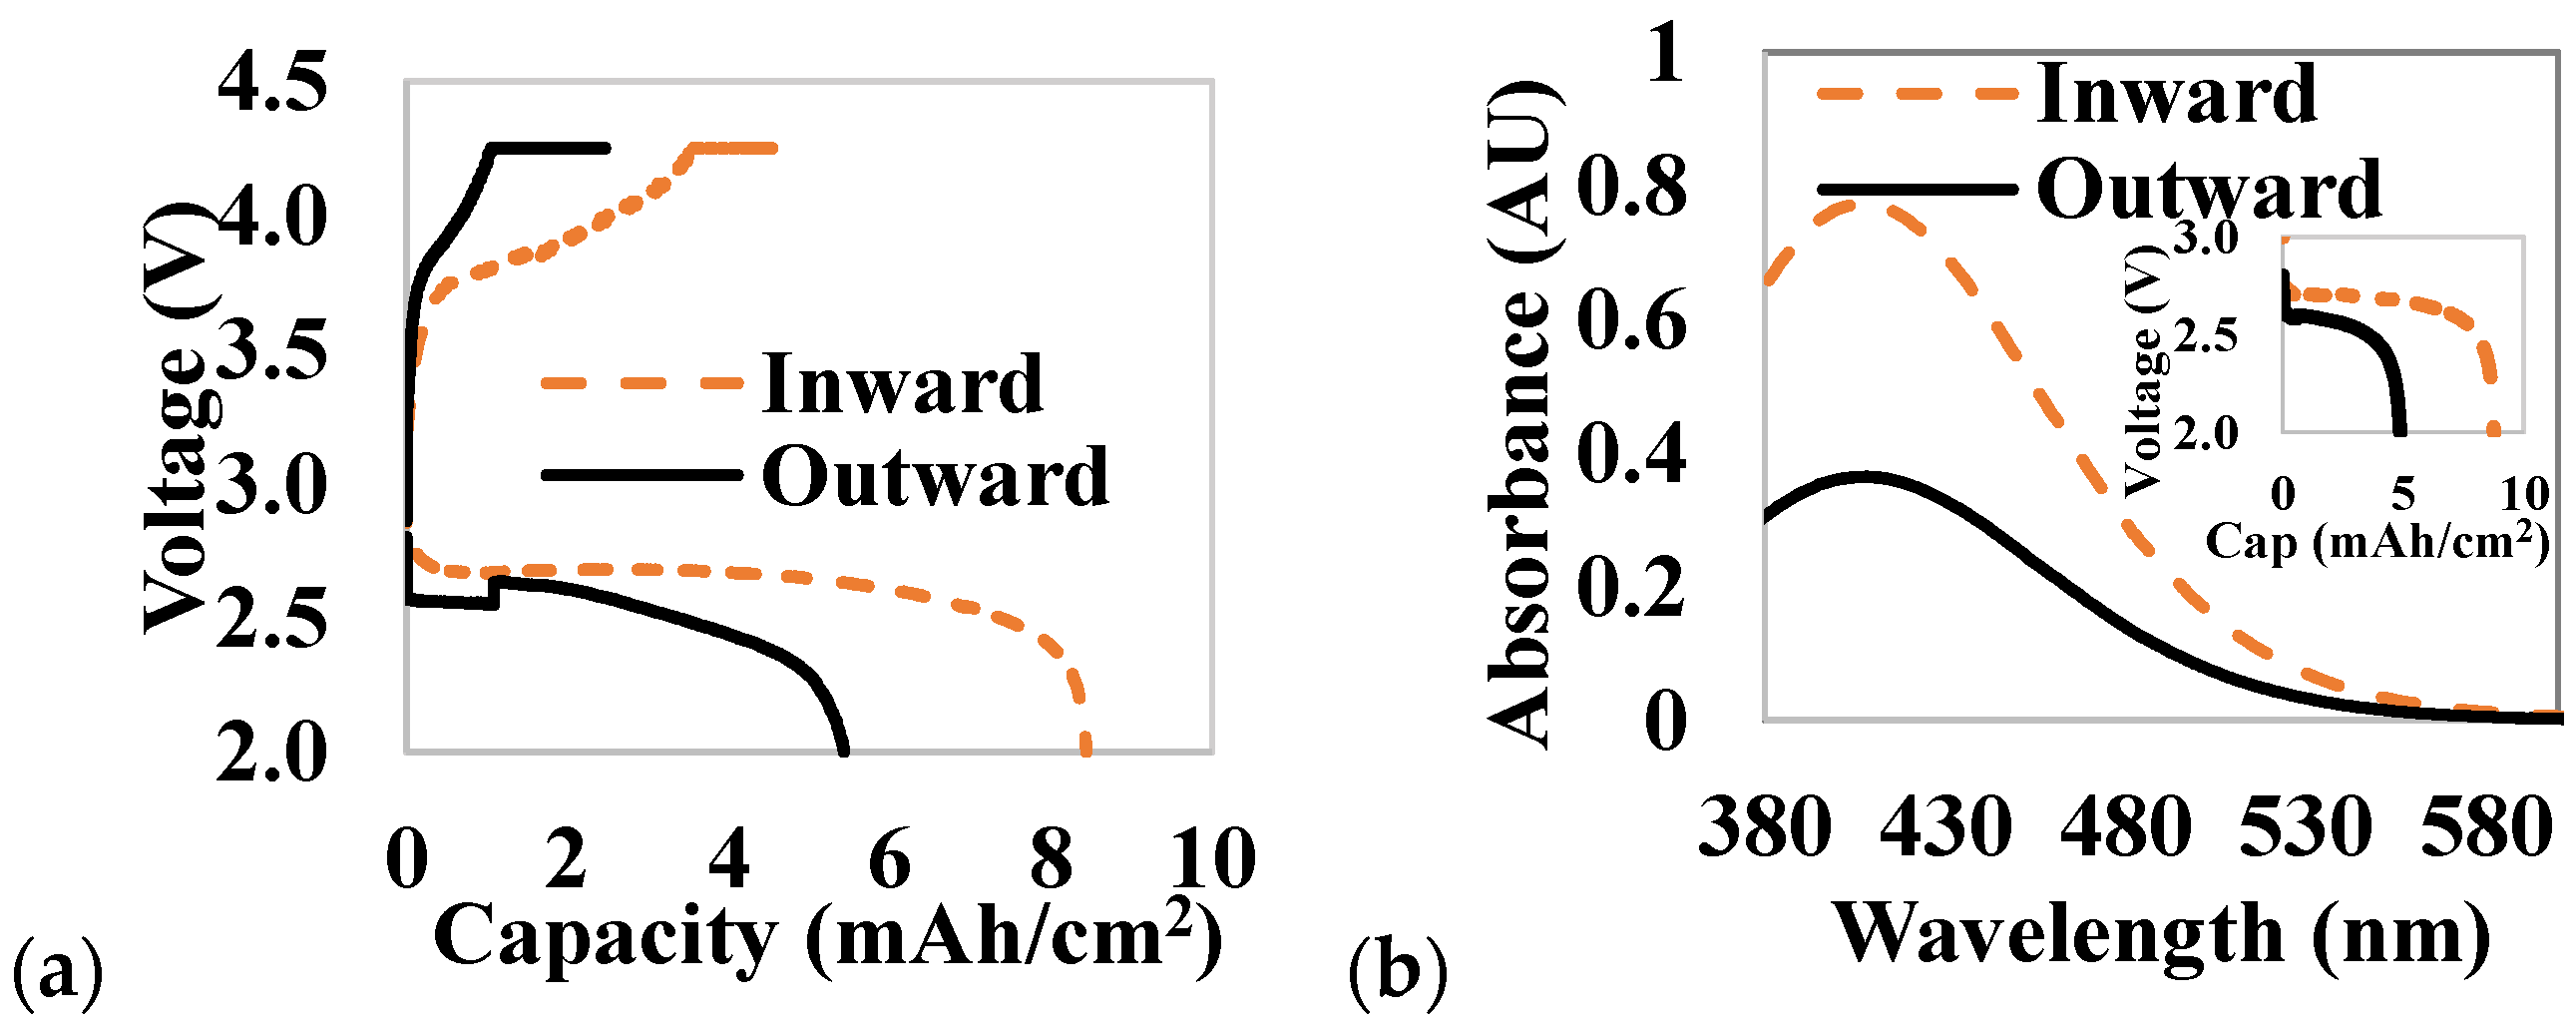
Figure 3a plots voltage as a function of the areal capacity for an MPL Outward and an MPL Inward sample.
The areal discharge capacities of the MPL Outward and MPL Inward samples in
Figure 3a are 5.44 mAh/cm
2 and 8.44 mAh/cm
2, respectively. After repeating multiple discharge experiments, the average areal discharge capacities were 5.79 ± 3.30 for MPL Outward samples and 7.69 ± 1.13 mAh/cm
2 for MPL Inward samples. These results indicate that the areal discharge capacity of MPL Outward samples is lower than that of MPL Inward samples. Separate discharge experiments were conducted using these two different orientations, and the Li
2O
2 contents of discharged electrodes at the end of discharge were measured using the titration and UV–visible spectrophotometry method.
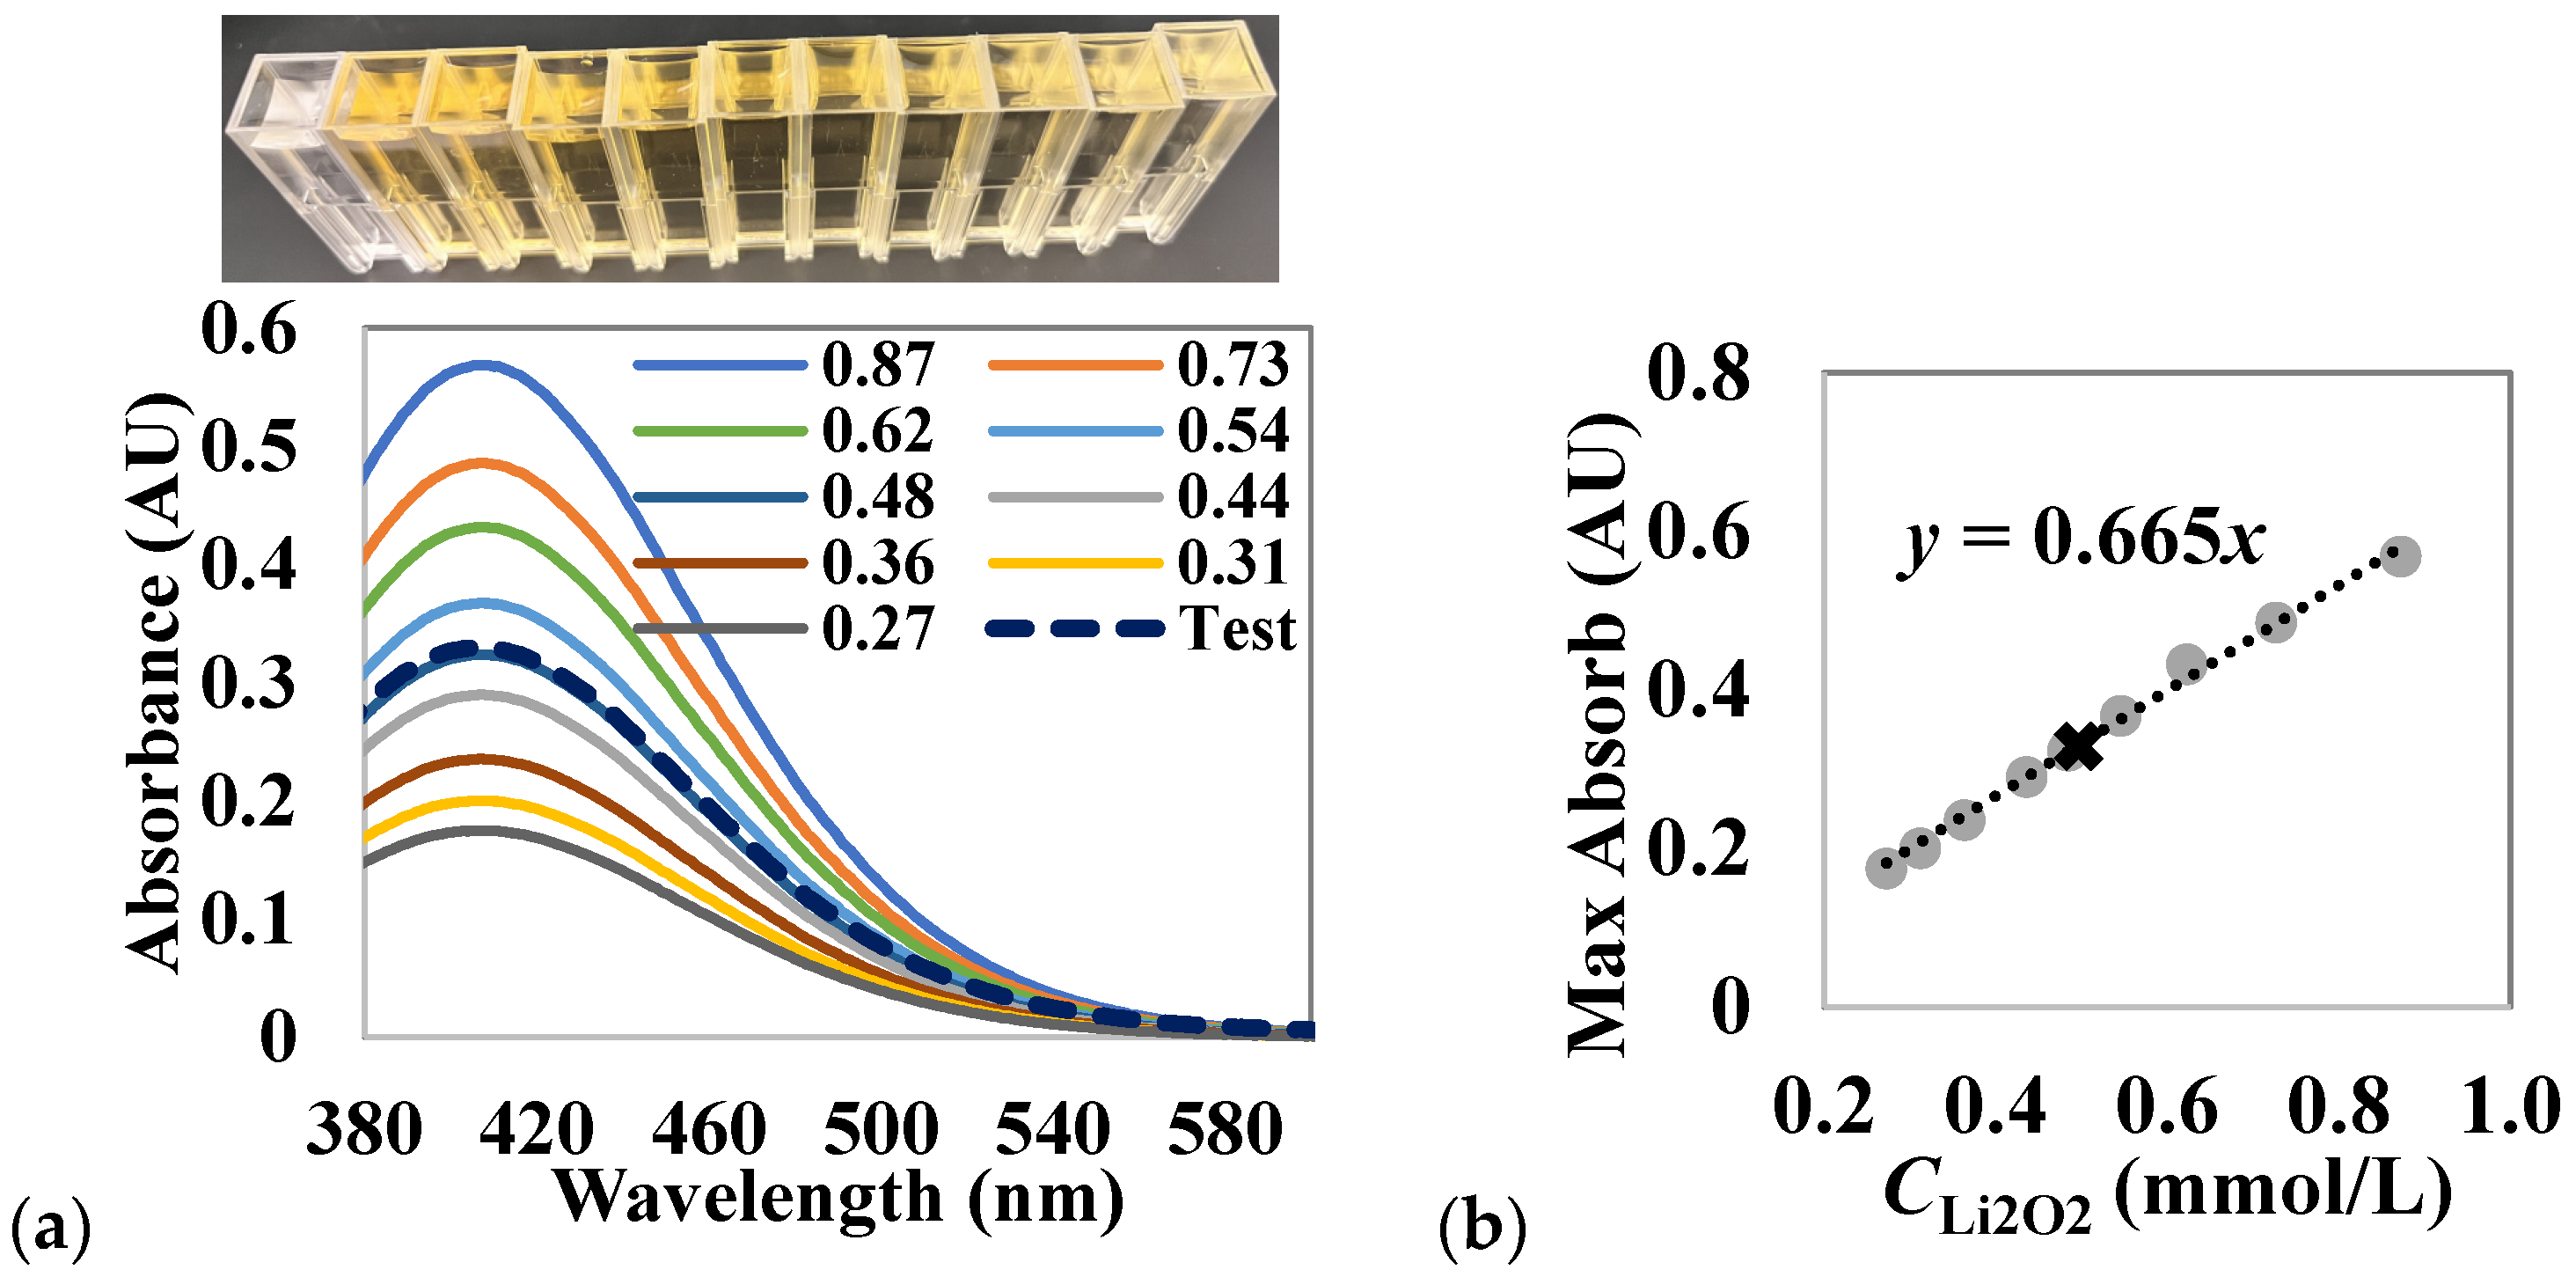
Figure 3b plots absorbance as a function of wavelength for the two cathode orientations, MPL Outward and MPL Inward. The MPL Outward sample has a peak absorbance of 0.37 AU at a wavelength of 408 nm. The MPL Inward sample has a peak absorbance of 0.77 AU at a wavelength of 407 nm. After fitting data generated using controlled concentrations of Li
2O
2 (
Figure 1), the amount of Li
2O
2 in the MPL Outward and MPL Inward electrodes were determined to be 1.49 and 3.16 mg, respectively.
It is important to note that the two samples discharged in
Figure 3b are different from the two samples discharged and charged in
Figure 3a. The discharge capacities of the MPL Outward and MPL Inward samples in
Figure 3b are 4.87 and 8.77 mAh/cm
2. The theoretical amounts of Li
2O
2 produced in these samples are 2.65 and 4.77 mg in these two samples, respectively. The mass fractions between the experimental measurement and theoretical Li
2O
2 mass are approximately 56.2% and 66.3%.
While the measured amounts of Li
2O
2 are both lower than theoretical predictions, the titration experiments confirm that the amount of Li
2O
2 correlates with the discharge capacity. Discrepancies between the theoretical estimations and measurements can be attributed to the Li
2O
2 loss caused by sample washing using AN during electrode preparation. Washing the discharged electrodes removes Li
2O
2 formed via the solution deposition mechanism [
13,
24], and only Li
2O
2 formed on the electrode surface by the surface deposition mechanism could be detected in the titration experiment. The higher mass fraction of the measurable Li
2O
2 in the MPL Inward sample also suggests that the MPL Inward orientation may produce a higher fraction of Li
2O
2 on the electrode surface than in the solution.
It can be seen in
Figure 3a that the MPL Outward sample has a lower initial discharge voltage, indicating a higher activation overpotential. The average discharge voltage for the MPL Outward and MPL Inward samples are 2.49 V and 2.61 V, respectively. The areal charge capacities of the MPL Outward and MPL Inward samples in
Figure 3a reached 2.44 mAh/cm
2 and 4.54 mAh/cm
2, respectively, suggesting that the MPL Inward orientation allows for higher charge capacities. The columbic efficiencies, defined as the ratio between the charge capacity and the discharge capacity, of the MPL Outward and MPL Inward samples are 44.85% and 53.80%, respectively. The charging activation overpotential on the MPL Outward sample is visually greater, which is supported by the average charging voltage for the MPL Outward sample being greater than that of the MPL Inward sample, at 4.14 V and 4.02 V, respectively.
3.2. Effect of Cathode Orientation on Mass and Ion Transport
The carbon cloth as the substrate has a low surface area and has negligible contributions to the capacities; most reactions occur within the MPL [
25]. To confirm this, we conducted experiments using carbon cloths without the MPL as the electrode (Fuel Cell Store, item number W0S1009), which have a thickness of 0.33 mm and a mass of 12 mg/cm
2. Batteries utilizing only carbon cloths without MPL as the electrode showed capacities of less than 0.1 mAh/cm
2 with both electrolytes. When the MPL faces the separator (Inward), the travel distance of the Li
+ from Li metal to the cathode electrode is about 75 µm, which is the sum of the thickness of the separator (25 µm) and half of the thickness of the MPL (100 µm). The oxygen transfer distance through the liquid electrode is about 50 µm, which is half of the thickness of the MPL. In passive cells, both O
2 and Li
+ transfer through battery components by diffusion. The diffusivities of O
2 and Li
+ in TEGDME are 0.217 × 10
−9 m
2/s and 0.08 × 10
−9 m
2/s [
15,
26], respectively. The concentration of dissolved O
2 at the air–electrode interface is 1.23 × 10
−4 kg/kg (4.43 × 10
−3 mol/L); the concentration of the Li
+ in the electrolyte is about 0.26 kg/kg (1 mol/L). The mass flux,
N [kg/(m
2∙s)], can be calculated from the density of electrolyte,
ρ, effective diffusivity,
Deff [m
2/s], concentration difference, Δ
C, and mass transfer distance,
x:
The maximum mass fluxes for O
2 and Li
+ are 5.33 × 10
−7 and 2.77 × 10
−4 kg/(m
2·s), respectively. The maximum current density this mass flux can support can be calculated from the mass flux,
N, molecular weight,
M, number of electrons per molecule,
n, and Faradic constant, 96,485 C/mol:
The corresponding current densities calculated from the mass balance are 0.32 and 382.3 mA/cm2, respectively.
In comparison, when the MPL faces the channel (Outward), the travel distance of the Li+ from Li metal to the cathode electrode is about 300 µm, which is the sum of the thickness of the separator (25 µm), half of the thickness of the MPL (100 µm), and the thickness of the carbon cloth (175 µm). The oxygen transfer distance through the liquid electrode is still about 50 µm, which is half of the thickness of the MPL. The maximum mass fluxes for O2 and Li+ are calculated to be 5.33 × 10⁻⁷ and 6.93 × 10⁻⁵ kg/(m2·s), respectively. The maximum current densities calculated from the mass balance are 0.32 and 95.6 mA/cm2, respectively. The maximum current density of the MPL Inward electrode is about four times as high as the maximum current density of the MPL Outward electrode.
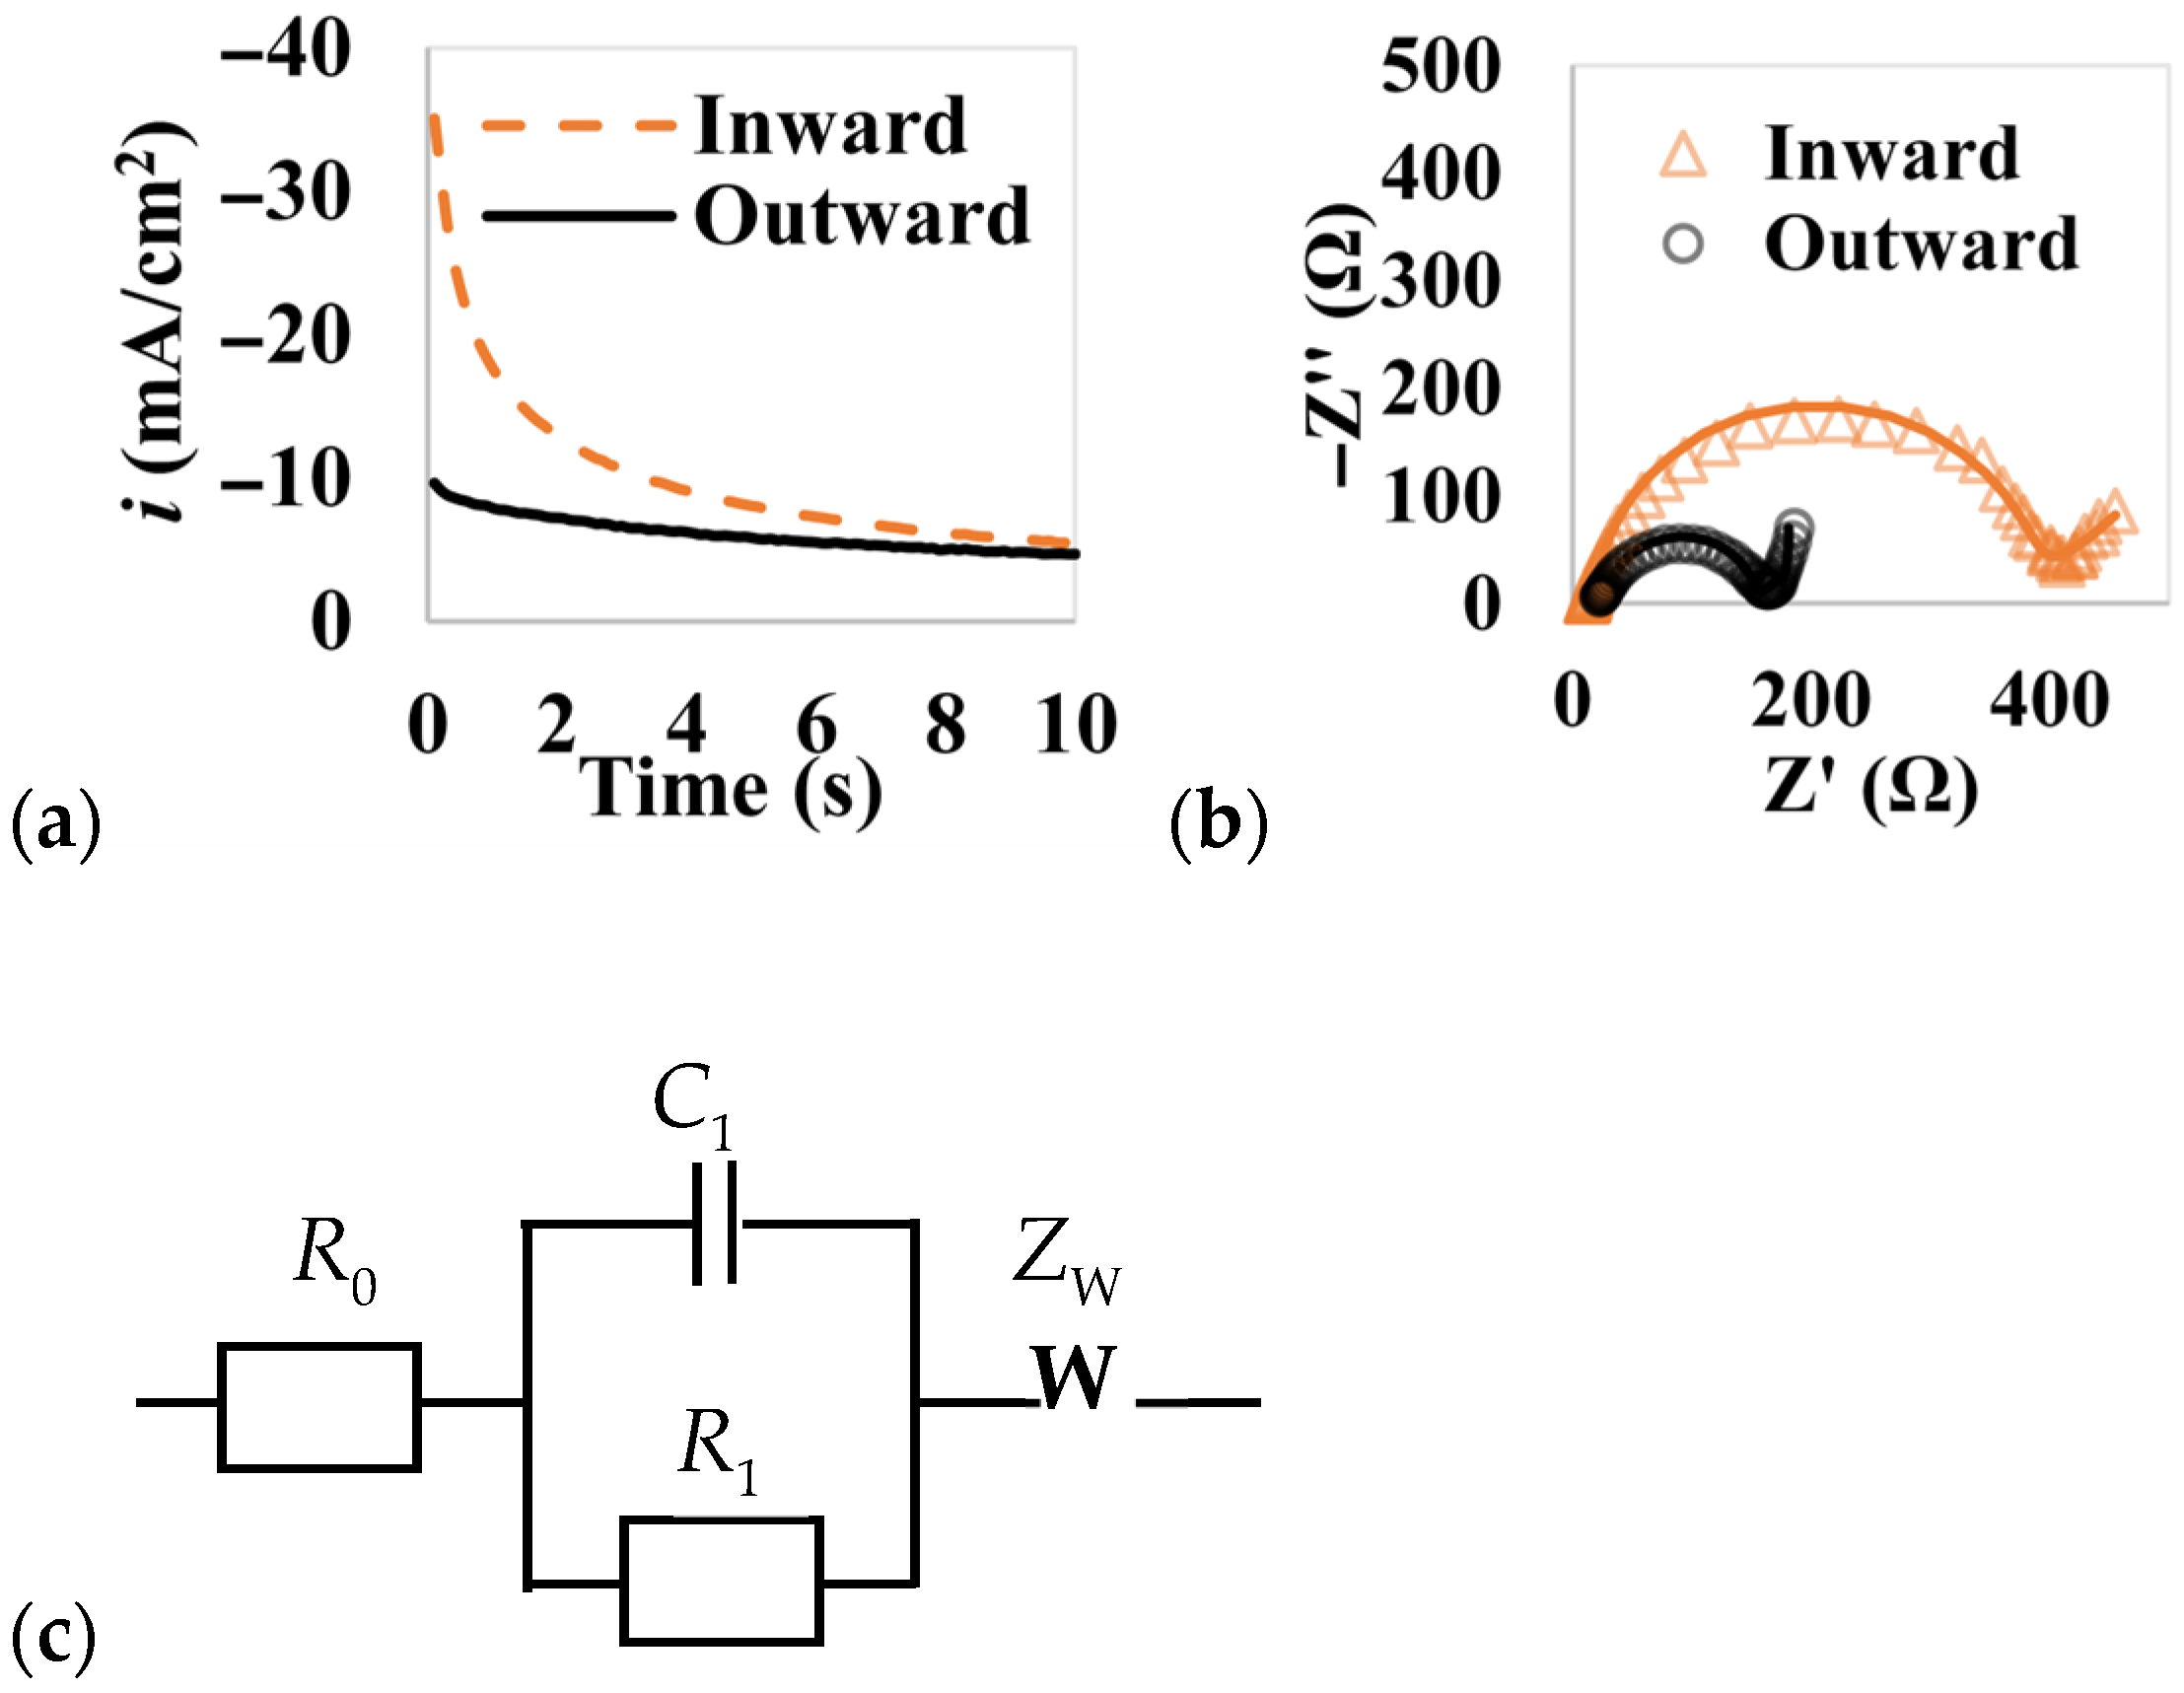
It should be noted that the simplified diffusion-based model makes assumptions for the uniform initial concentration, reaction rate in the electrode, and electrolyte distributions. Despite these assumptions, simplified analysis is valuable for explaining the observed differences between MPL Inward and MPL Outward orientations. To validate the prior analysis of the maximum current density, we performed chronoamperometry tests using two different MPL orientations. The experiment was conducted at a high overpotential, maintaining a constant voltage of 2.0 V, to make sure that the discharge current densities reached the limiting current density constrained by the mass transfer of reactive species. As shown in
Figure 4a, the cell with the MPL Inward clearly has a much higher initial discharge current density (35.1 mA/cm
2) than the cell with the MPL Outward (9.65 mA/cm
2). Given the fact that both cells have been saturated by oxygen, the discharge current is proportional to the available Li
+ or ionic conductivity. Since the majority of reaction sites are in the MPL, when MPL faces inward (the separator), the distance for the Li
+ transfer is much shorter than when the MPL faces the channel. As a result, the limiting current density of the MPL Inward electrode is about 3.6 times as high as the limiting current density of the MPL Outward electrode at the beginning of the chronoamperometry test. The roughly fourfold difference in the maximum limited current density measured through chronoamperometry shows a similar trend with the theoretical analysis. While the absolute values of the model predictions may be approximations, the relative comparisons between configurations are robust.
To quantitatively analyze the transport phenomena within the electrode, we conducted EIS measurements of batteries using the Whatman separator before discharge and charge cycles at OCV.
Figure 4b shows the Nyquist plots of the two cells with different electrode orientations. The equivalent circuit model (ECM) used to fit the data is shown in
Figure 4c. In the ECM,
R0,
R1, C
1, and
ZW represent ohmic resistance, charge transfer resistance, the constant phase element, and the Warburg constant, respectively. The values of parameters fitted based on the EIS data are compared in
Table 1. The ohmic resistances, calculated using the high-frequency intercept at the real axis, reflect the ionic resistance of the electrolyte. The significant difference in
R0 between the two orientations (28.7 Ω for MPL Outward versus 18.5 Ω for MPL Inward) confirms that the long travel distance of Li
+ leads to a higher ohmic resistance. Since both experiments used an identical electrolyte, the ionic conductivity,
σ, of these two orientations stays the same. The difference in ohmic resistance is proportional to the travel distance of the Li
+. Meanwhile, the charge transfer resistance
R1, associated with the diameter of the semicircle in the Nyquist plot, of the MPL Outward electrode (121.4 Ω) is significantly lower than that of the MPL Inward electrode (356.5 Ω). The lower charge transfer resistance of the Outward orientation indicates more facile electrochemical kinetics, likely due to the balanced access of both Li
+ and O
2 to the reactive sites within the MPL. The Warburg element
ZW, observed as the linear tail at low frequencies, characterizes mass transfer limitations within the electrode. The substantially lower Warburg coefficient for the MPL Outward electrode confirms that the shorter O
2 diffusion path enhances mass transport kinetics. Collectively, these fitted parameters provide quantitative evidence that electrode orientation fundamentally governs both charge transfer kinetics and mass transport characteristics, directly supporting the observed performance differences in the discharge capacity and rate capability.
3.3. Influence of Electrolyte on Capacity
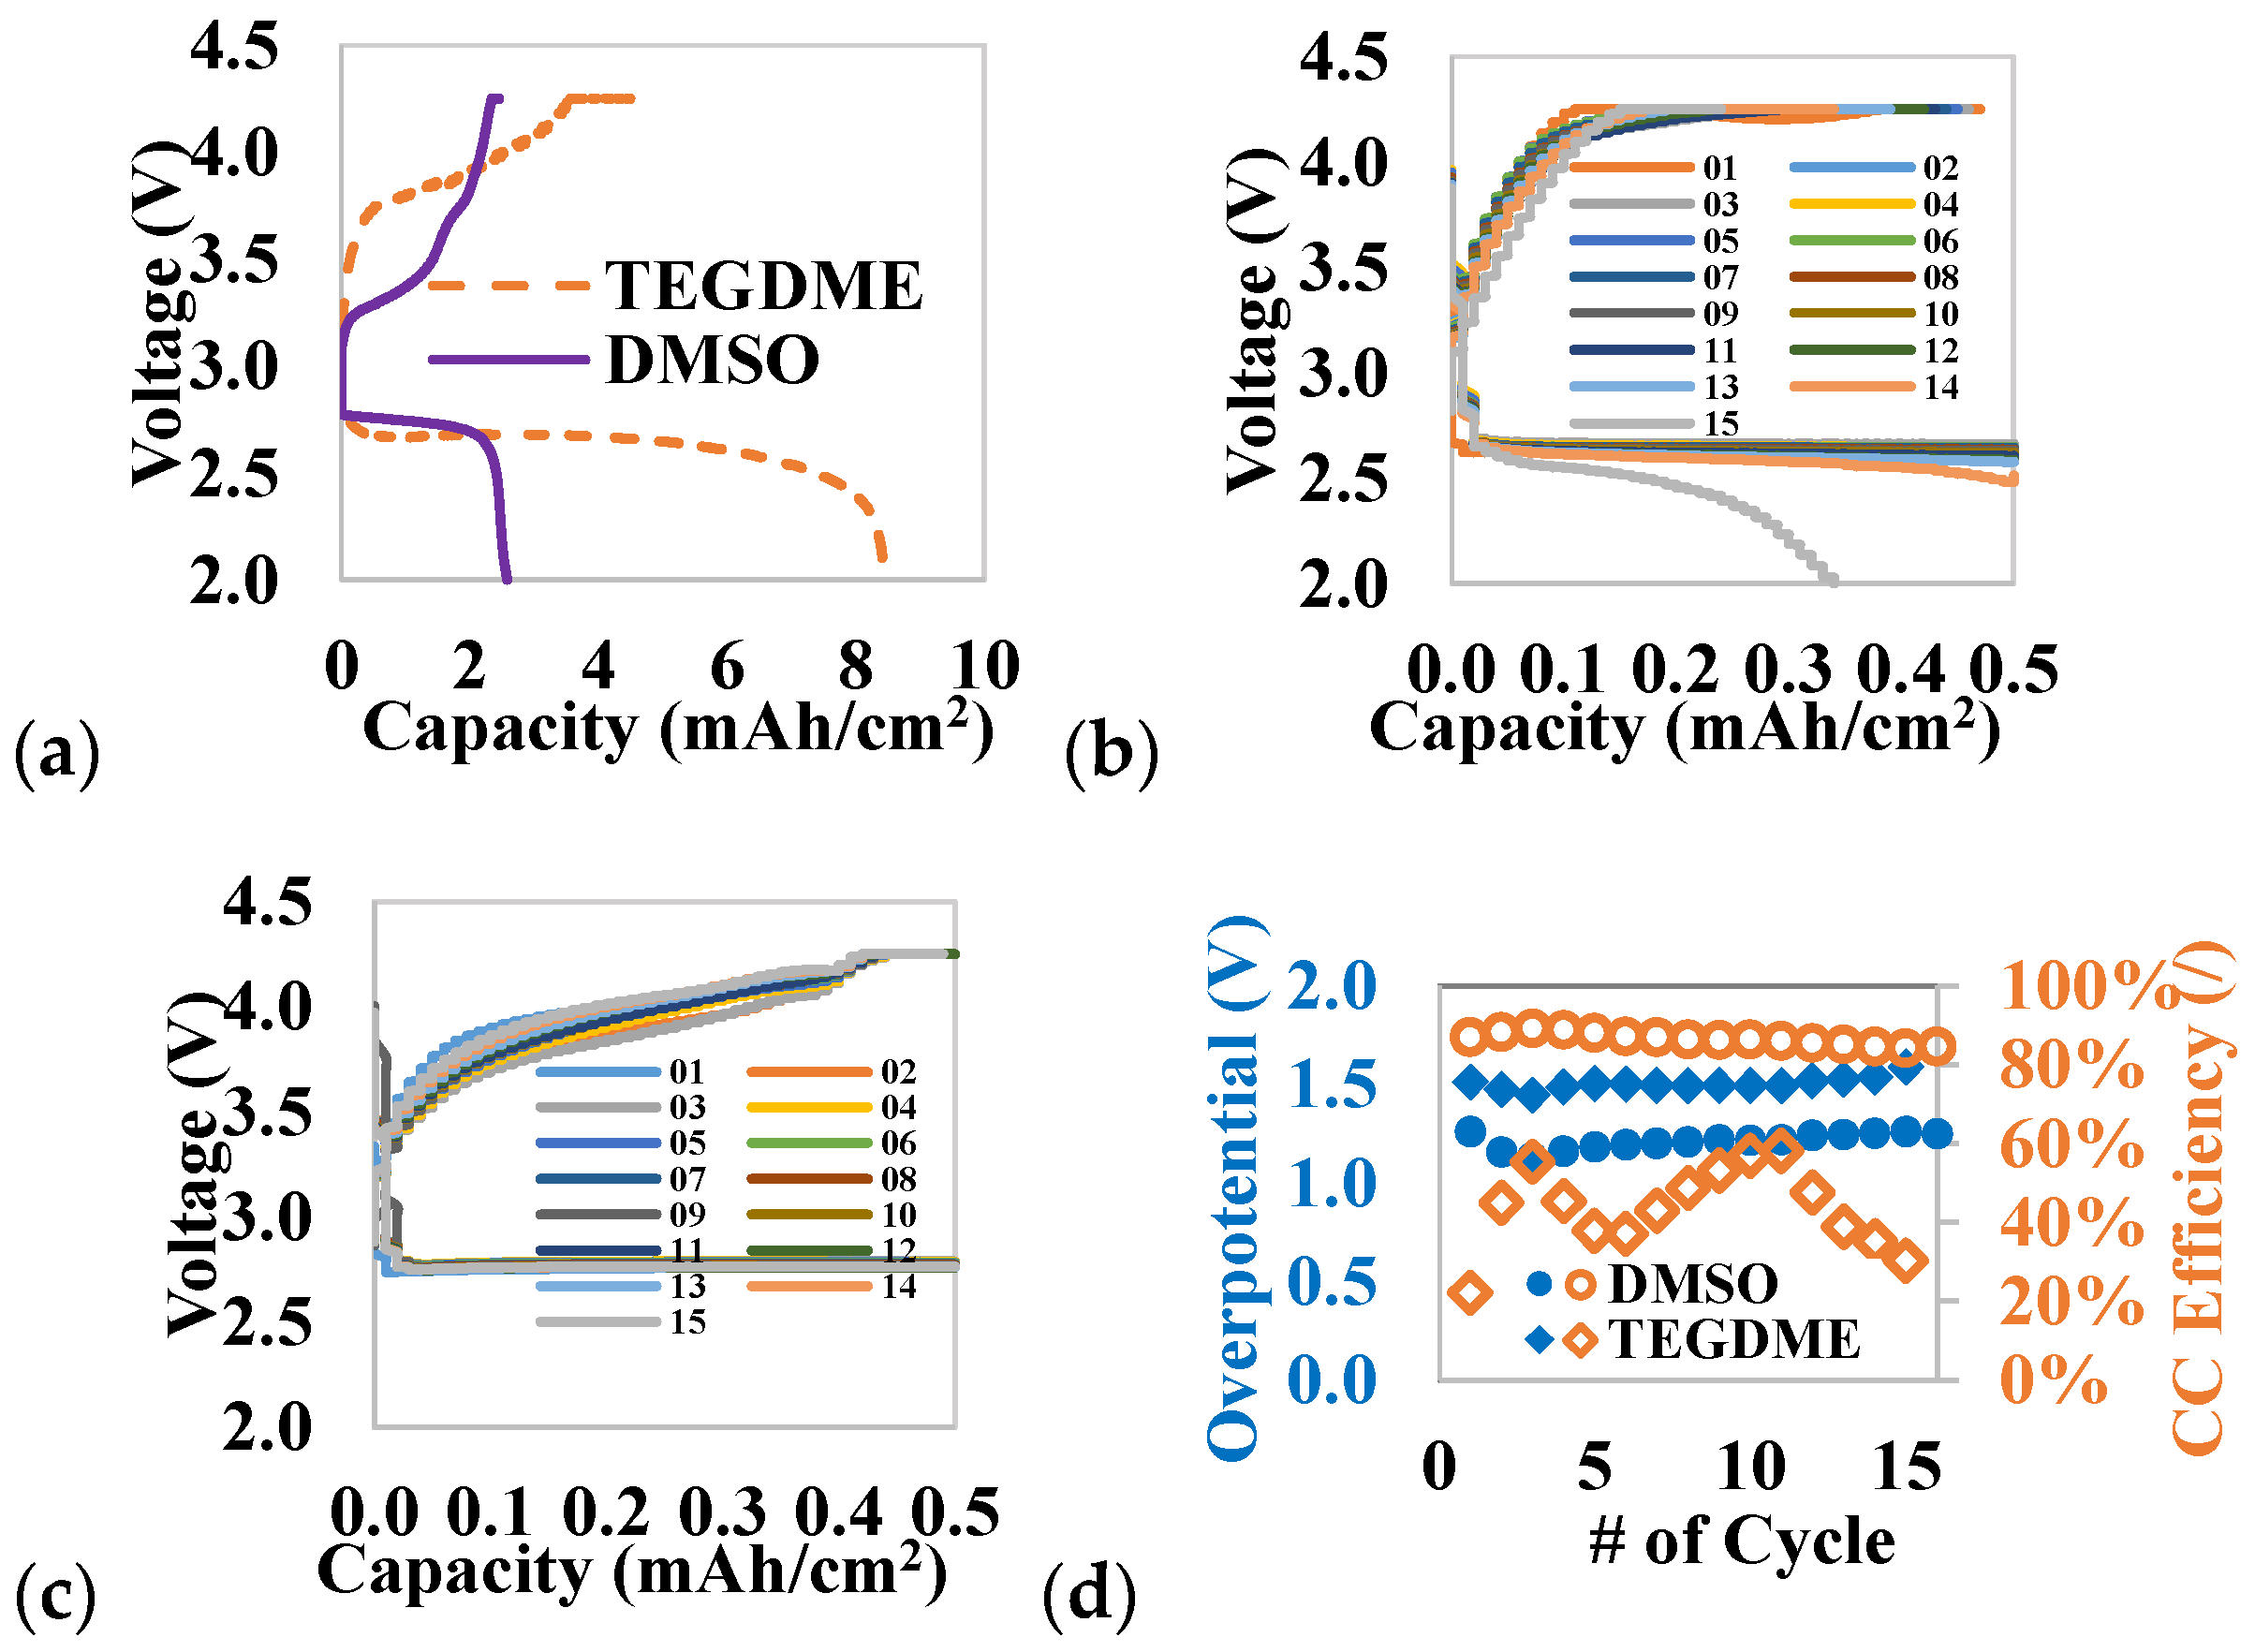
To determine the dependence of the discharge and charge capacities on the electrolyte solvent, batteries using TEGDME and DMSO as solvents are compared.
Figure 5a plots a TEGDME sample and a DMSO sample, both discharged and charged at a current density of 0.1 mA/cm
2. The areal discharge capacities of the TEGDME and DMSO samples in
Figure 5a are 8.47 mAh/cm
2 and 2.59 mAh/cm
2, respectively. The areal capacity decreases by 70.96% when the electrolyte is switched from TEGDME to DMSO. The TEGDME sample has a visually higher discharge activation overpotential than the DMSO sample. The average discharge voltage of the TEGDME sample is lower than the DMSO sample at 2.61 V and 2.69 V, respectively, supporting the difference in activation overpotential. Trahan et al. observed a similar pattern of higher discharge voltages in batteries with DMSO-based electrolytes compared to other non-aqueous electrolytes [
27].
The areal charge capacities of the TEGDME and DMSO samples are 5.13 and 2.46 mAh/cm2, respectively, corresponding to a 39.18% decrease. This is evident from the smaller difference between the discharge and charge capacity, suggesting less capacity degradation compared to the TEGDME sample. The coulombic efficiencies of the TEGDME and DMSO samples are 60.57% and 94.98%, respectively. In addition, the charge activation overpotential is visually higher in the TEGDME sample compared to the DMSO sample, with average charge voltages of 4.02 V and 3.56 V, respectively. The lower discharge and charge overpotentials observed with the DMSO-based electrolyte can be attributed to its higher DN compared to TEGDME. The DN of the solvent plays a critical role in stabilizing intermediate species during reactions. High-DN solvents like DMSO strongly solve Li+ cations, weakening the Li+-O2− interaction and promoting a solution-phase mechanism for Li2O2 formation. This solution-mediated pathway leads to faster decomposition during charging, reducing charge overpotential. In contrast, low-DN solvents like TEGDME favor a surface-mediated mechanism that forms thin, film-like Li2O2 layers on the electrode surface, which are more difficult to oxidize and lead to higher charge overpotentials.
To further elucidate the electrolyte’s properties on battery cycling, we performed cycling tests at a fixed capacity of 0.5 mAh/cm
2 with a current density of 0.1 mA/cm
2 and cutoff voltages of 2.0V and 4.25V. Once the charging voltage reaches 4.25V, charging switches to constant voltage charging until the charging current density is less than 0.05 mA/cm
2. This charging protocol follows the constant voltage constant current (CCCV) charging used in many rechargeable batteries. The results in
Figure 5b,c show that the DMSO electrolyte can complete more than 15 cycles, all with a 100% coulombic efficiency (defined as the charging capacity divided by the discharge capacity). In contrast, the TEGDME electrolyte only achieves a 94.4% coulombic efficiency on the first cycle, and this efficiency keeps decreasing to 70% by the 15th cycle. The discharge–charge cycle of the TEGDME electrolyte stops at cycle 15 as the discharge voltage reaches 2.0 V, whereas the DMSO electrolyte continues charging beyond the 15th cycle. For clear comparison, we only show the first 15 cycles for both electrolytes in
Figure 5d. Additionally, we compared the coulombic efficiency of constant current (CC) charging, which is defined as the charging capacity during CC divided by the discharge capacity. The average coulombic efficiency of CC charging for DMSO is 86.5%, significantly higher than the average of 43.7% for TEGDME. Furthermore,
Figure 5d compares the overpotential between discharge and charge. The average overpotential is 1.51 V for TEGDME and only 1.21 V for DMSO. The lower overpotential of the DMSO electrolyte indicates a lower reaction barrier, which is facilitated by the solvent-driven reactions attributed to the high DN of the DMFC.
Furthermore, we discharged batteries with TEGDME and DMSO electrolytes to a capacity of 2 mAh/cm
2, both at a current density of 0.1 mA/cm
2, to investigate the impact of the electrolyte properties on the morphology of discharged Li
2O
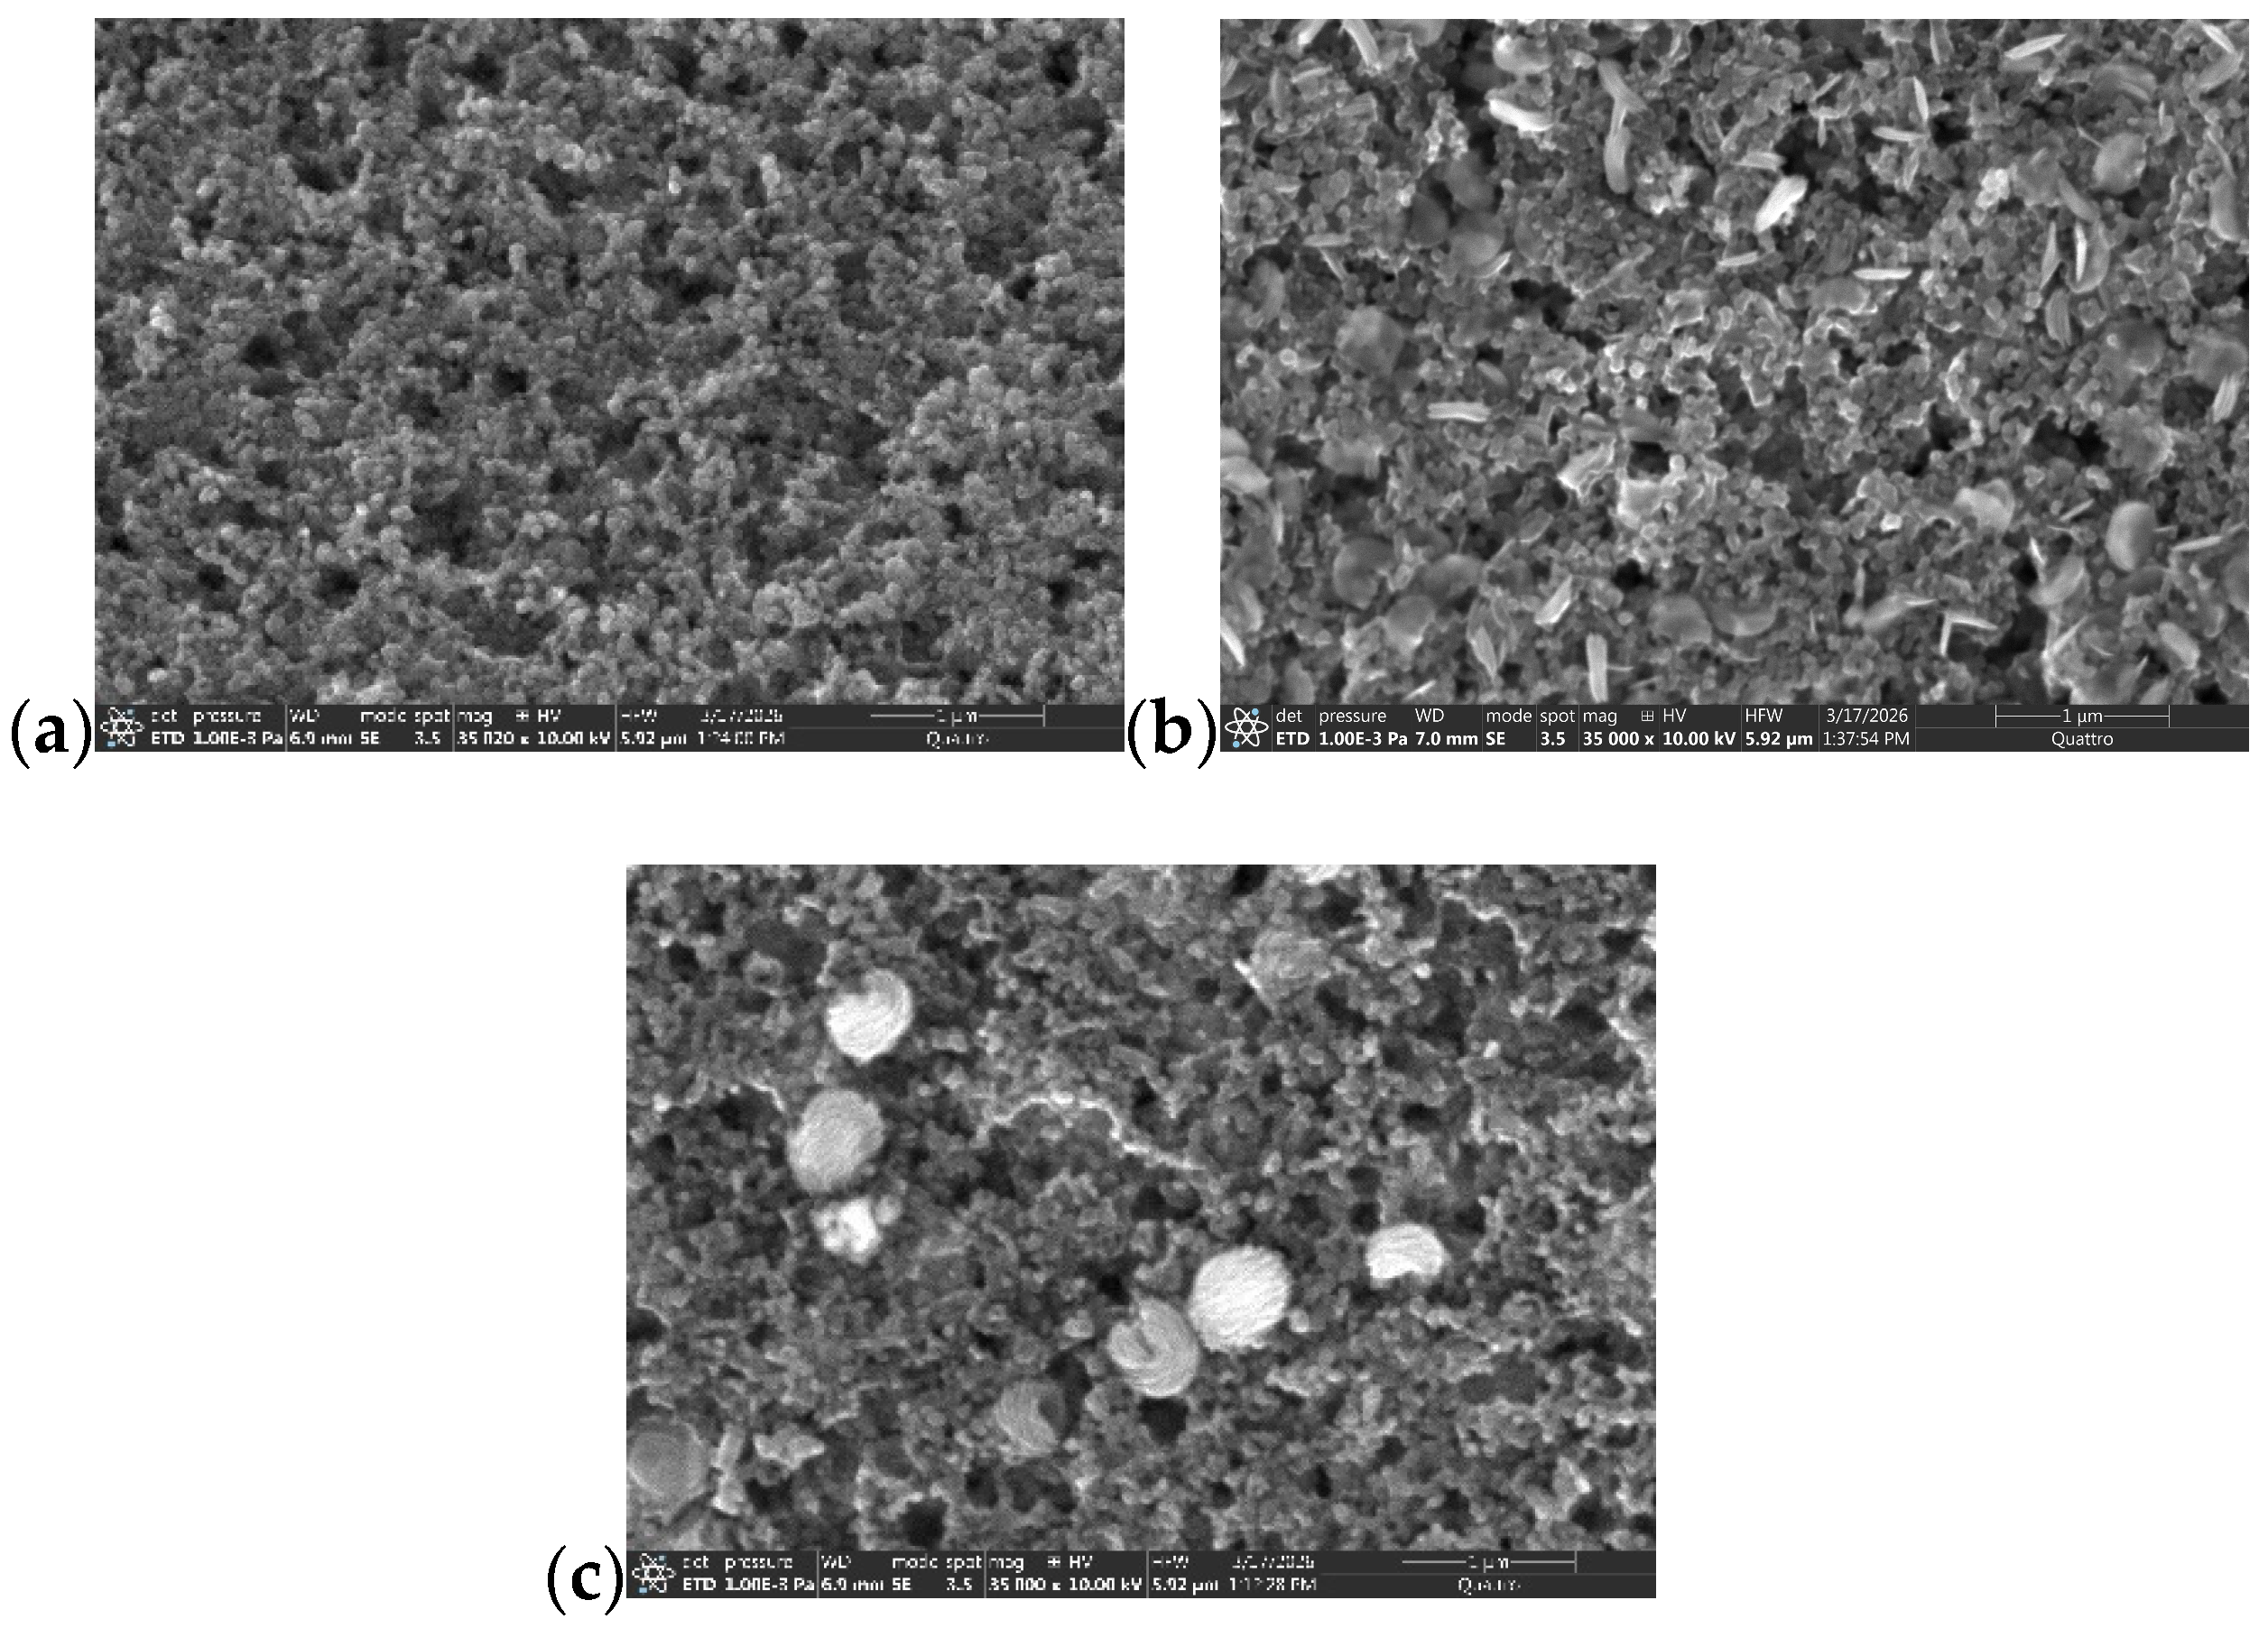
2. The top view of discharge electrodes was then analyzed using SEM to visualize the morphological differences between the two electrolytes. As shown in
Figure 6, TEGDME tends to form a Li
2O
2 film or small needle-like structures on the surface of the electrode, whereas DMSO results in large and dispersed Li
2O
2 toroid particles in the electrolyte. This observation supports the understanding that the higher DN of DMSO facilitates solvent-based deposition and Li
2O
2 growth. Additionally, the stronger solvation of Li
+ in DMSO enhances the kinetics of ORR by stabilizing the intermediate, lowering the activation energy for the initial electron transfer and reducing discharge overpotential. These effects collectively explain the improved voltage efficiency observed with DMSO-based electrolytes.
The Li
2O
2 content in the cathodes of a TEGDME and DMSO sample after deep discharge at 0.1 mA/cm
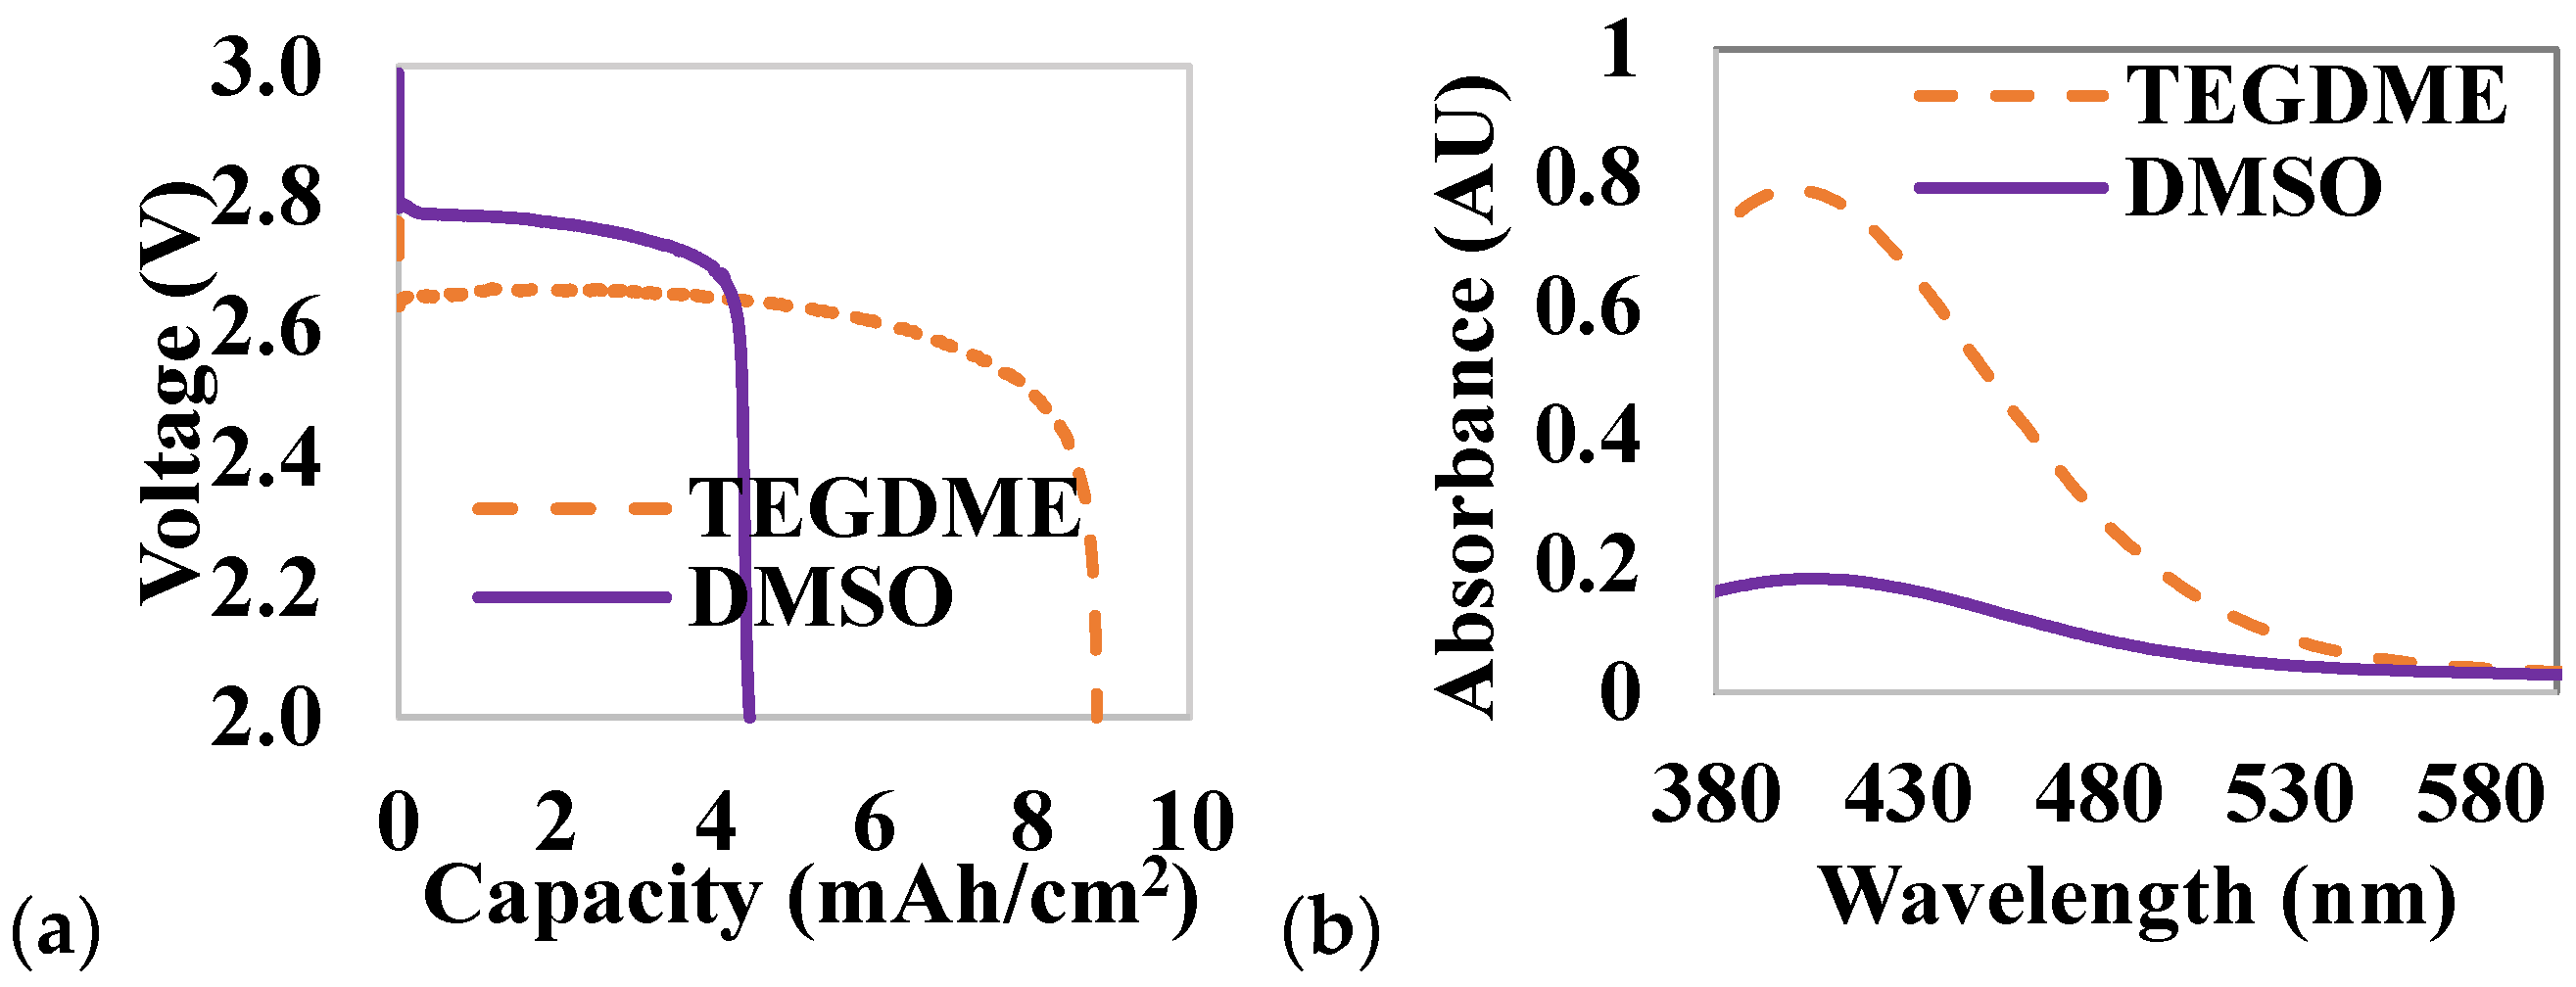
2 was analyzed using the titration and UV–visible spectrophotometry methods. The areal discharge capacities of the DMSO and TEGDME samples in
Figure 7 are 4.44 mAh/cm
2 and 8.82 mAh/cm
2, respectively. The theoretical amounts of Li
2O
2 produced in these samples are 2.41 and 4.79 mg, respectively. The DMSO sample has a peak absorbance of 0.176 AU at a wavelength of 404 nm, while the TEGDME sample has a peak absorbance of 0.78 AU at a wavelength of 400 nm. Based on fitting the peak absorbance data from
Figure 1, the amount of Li
2O
2 in these two electrodes were estimated to be 0.778 and 3.46 mg, respectively. The mass fractions of the experimentally measured Li
2O
2 to the theoretical Li
2O
2 mass are approximately 32.3% and 72.1%, respectively. The lower mass fraction of the measured Li
2O
2 compared to the theoretical amount in the DMSO sample aligns with the observation that electrolytes with a high DN (such as DMSO) produce a higher fraction of Li
2O
2 in the solution rather than on the surface of the electrode.
3.4. Influence of Current Density on Capacity
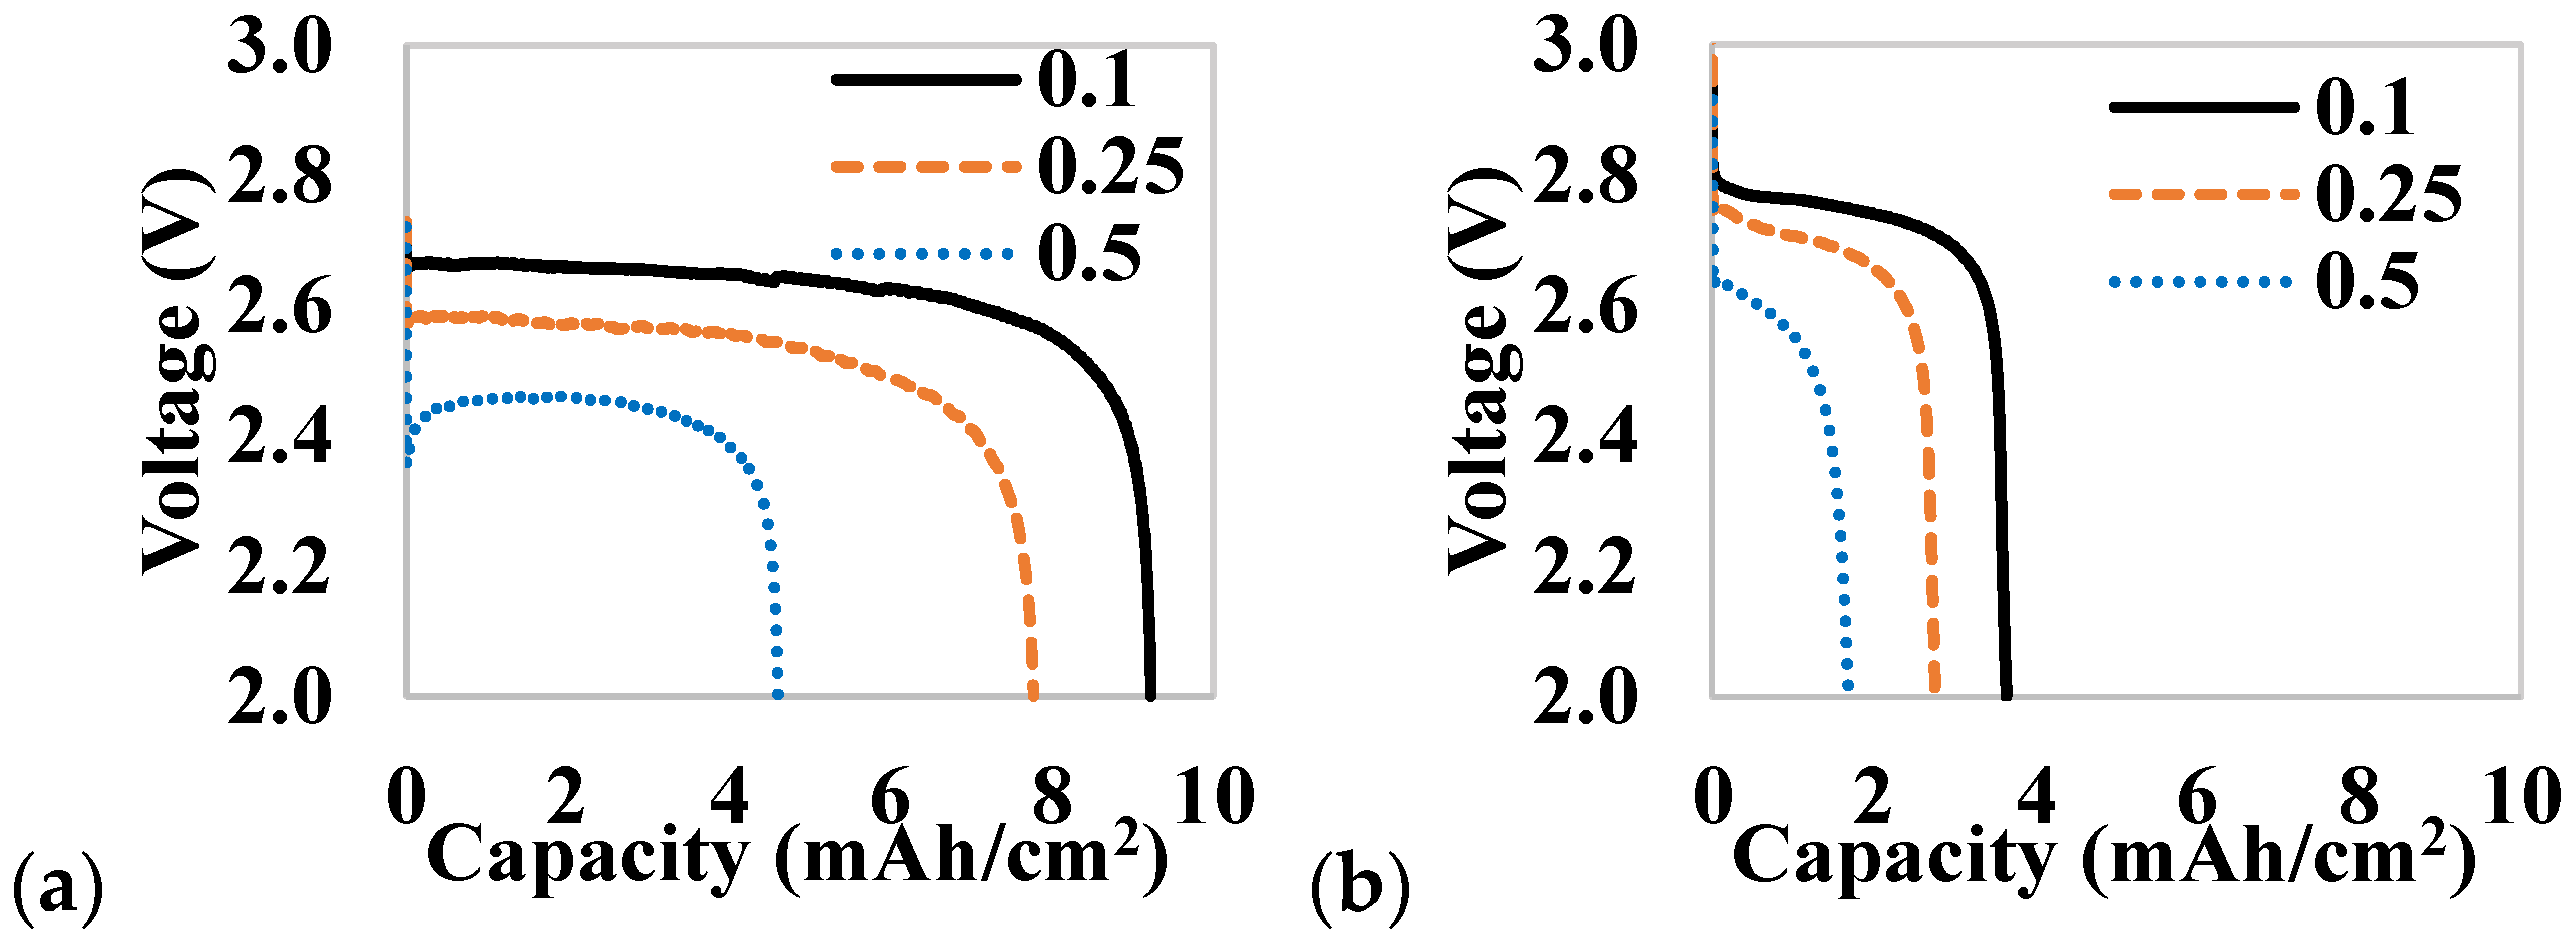
The discharge curves of TEGDME (
Figure 8a) and DMSO samples (
Figure 8b) are compared at three current densities: 0.1 mA/cm
2, 0.25 mA/cm
2, and 0.5 mA/cm
2. In
Figure 8a, the discharge capacities as current density increases are 9.24 mAh/cm
2, 7.79 mAh/cm
2, and 4.62 mAh/cm
2, respectively. The average discharge voltages as current density increases are 2.61 V, 2.52 V, and 2.42 V, respectively. In
Figure 8b, the discharge capacities as the current density increases are 3.65 mAh/cm
2, 2.76 mAh/cm
2, and 1.69 mAh/cm
2, respectively. The average discharge voltages as current density increases are 2.71 V, 2.66 V, and 2.53 V, respectively.
Figure 8 has a clear trend that, as current density increases, in both the TEGDME and DMSO samples, the discharge capacity decreases and the activation overpotential increases. A similar trend is seen by Adams et al., which determined that the increasing discharge current density decreases the discharge capacities due to the difference in Li
2O
2 morphology [
11].
While batteries using the DMSO electrolyte have a lower activation overpotential compared to batteries using the TEGDME electrolyte, the DMSO electrolyte results in a significantly lower discharge capacity compared to TEGDME at all current densities, as can be seen in
Figure 5 and
Figure 8. Batteries using the DMSO electrolyte were reported to have higher discharge capacities compared to the TEGDME electrolyte [
14,
27,
28,
29,
30]. However, as seen in
Figure 5 and
Figure 8, our test data suggest batteries using the TEGDME electrolyte have much higher discharge and charge capacities than batteries using the DMSO electrolyte. The discrepancy could be the result of a difference in the amount of electrolyte within the carbon cloth cathodes. The surface tensions of TEGDME and DMSO at 25 °C are 33.74 mN/m and 42.86 mN/m, respectively [
31]. Due to the higher surface tension of DMSO, the DMSO electrolyte struggles to wet porous cathode electrodes. Our contact angle measurements indicate that the DMSO electrolyte generally forms a non-wetting sphere on the electrode surface, while the TEGDME electrolyte is rapidly absorbed by the same porous electrode in less than a second. Even after soaking the electrode overnight in DMSO electrolyte, it is likely not fully wet. Consequently, the liquid saturation in a cathode with DMSO is lower than in one with TEGDME.
To quantitatively assess the differences in wetting behavior between the two electrolytes, we measured the contact angles of pure TEGDME and DMSO on a PTFE sheet using a goniometer (ramé-hart Model 250) under atmosphere condition. TEGDME had a contact angle of 101.75° ± 2.55°, while DMSO exhibited a contact angle of 118.45° ± 3.75°. These measurements align with our observations that TEGDME more easily wets porous battery electrodes and separators compared to DMSO. Consequently, the capacity difference between TEGDME and DMSO can be partially attributed to differences in wetting and saturation. Our previous study quantitatively assessed how electrolyte saturation affects battery performance. The test results from this study suggest that, for typical porous cathodes with PTFE binders, maintaining a relatively high electrolyte saturation (>40%) remains a challenge, hindering the discharge and charge performance of the battery. A hydrophilic cathode, on the other hand, would result in more similar saturation levels of the cathodes and potentially produce significantly different results.
3.5. Neutron Imaging of Selected Electrodes After Discharging
Neutron tomography of discharged battery electrodes can reveal the spatial distribution of lithium products (mainly Li2O2). We measured the neutron tomography of discharged electrodes using ORNL’s MARS instrument. The high-resolution tomography (~48 μm) provides a 3D distribution of neutron attenuation coefficient, which is directly related to element concentration within the material. The neutron attenuation coefficient of lithium (natLi) is significantly higher than that of C, H, and O. As a result, the spatial distribution of the neutron attenuation coefficient within the sample is proportional to the concentration of lithium salts. The spatial distribution of lithium salts within porous cathode electrodes after battery discharge allows us to observe the distribution patterns throughout the electrode material.
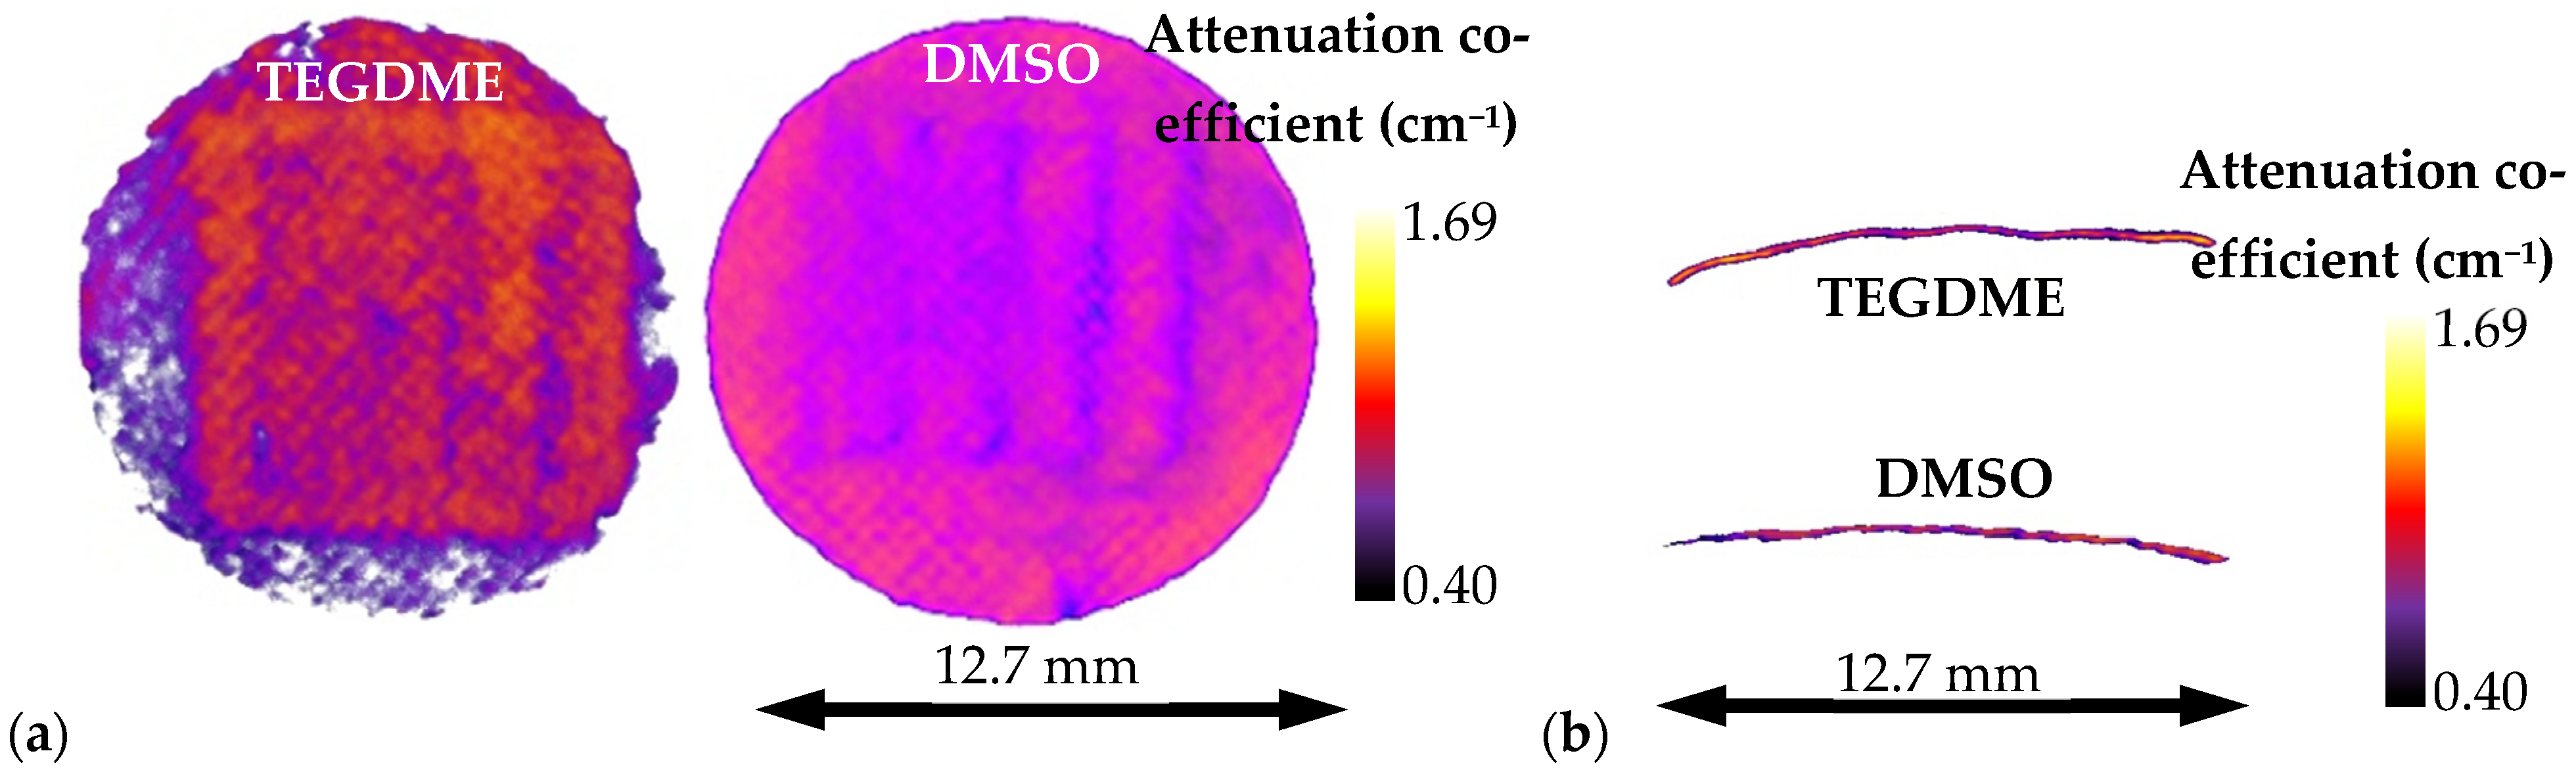
A higher attenuation coefficient indicates a higher concentration of lithium salts. Regions of high lithium product accumulation indicate higher cumulative discharge reactions, while regions of lower lithium product accumulation indicate lower cumulative discharge reactions. The top views of the discharged electrodes at 0.1 mA/cm
2 (
Figure 9a) clearly show patterns of the gas channels. The absorption intensities, which are directly proportional to lithium salt concentration, in the channel areas are higher than those outside the channels, indicating higher concentrations of Li
2O
2. This suggests higher cumulative reaction rates under the channels due to more effective O
2 transfer. Such spatial heterogeneity cannot be detected through electrochemical measurements or titration alone, which average across the entire electrode. Neutron tomography thus uniquely reveals how electrode architecture and operating conditions create localized reaction hot spots. This insight is critical for designing electrodes with more uniform utilization.
Additionally, the battery using TEGDME achieved a significantly higher capacity (9.22 mAh/cm
2) compared to the battery using DMSO as the electrolyte (3.65 mAh/cm
2). The neutron imaging data show similar trends, with the average attenuation coefficient of the TEGDME electrode (0.914 cm
−1) being higher than those of the DMSO electrode (0.794 cm
−1). The attenuation coefficient is determined by scattering and absorption cross-sections of the elements present. Lithium has an exceptionally high neutron attenuation cross-section compared to carbon and oxygen. Therefore, the reconstructed attenuation coefficient is proportional to the local concentration of Li
2O
2 within the electrode, as described by the Beer–Lambert law:
where
I and
I0 are the transmitted and incident neutron intensities,
d is the material thickness,
ε is the molar attenuation coefficient, and
C is the concentration of Li
2O
2. In addition, the cross-sectional views (
Figure 9b) show alternating Li
2O
2 concentrations beneath the channels and ribs. For the TEGDME electrode discharged at 0.1 mA/cm
2, the attenuation coefficient under gas channels is 0.904 cm
−1, compared to 0.893 cm
−1 under ribs. The higher attenuation under the channels indicates a greater concentration of lithium products in those regions. However, the spatial distributions of Li
2O
2 along the thickness direction of the electrodes are not very clear due to the thin electrode thickness and the limited spatial resolution of ~48 μm. For future experiments, using thicker electrodes could better demonstrate the gradients of reaction rates and Li
2O
2 production rates. In future work, we also plan to continue experiments at a neutron facility to achieve a more quantitative analysis of lithium peroxide (Li
2O
2) distribution. Future experiments will use controlled reference samples with precisely controlled amounts of Li
2O
2. These controlled experiments aim to establish a direct correlation between its concentration and the corresponding neutron attenuation coefficient. This calibration will allow us to conduct more qualitative observations and accurately quantify the Li
2O
2 content within our electrochemical samples, providing deeper insights into reaction mechanisms.
At higher current densities (0.25 and 0.5 mA/cm
2), the spatial distributions are not as clear due to a significant capacity reduction with increasing current density. A quantitative analysis of attenuation values generally aligns with the capacity (Li
2O
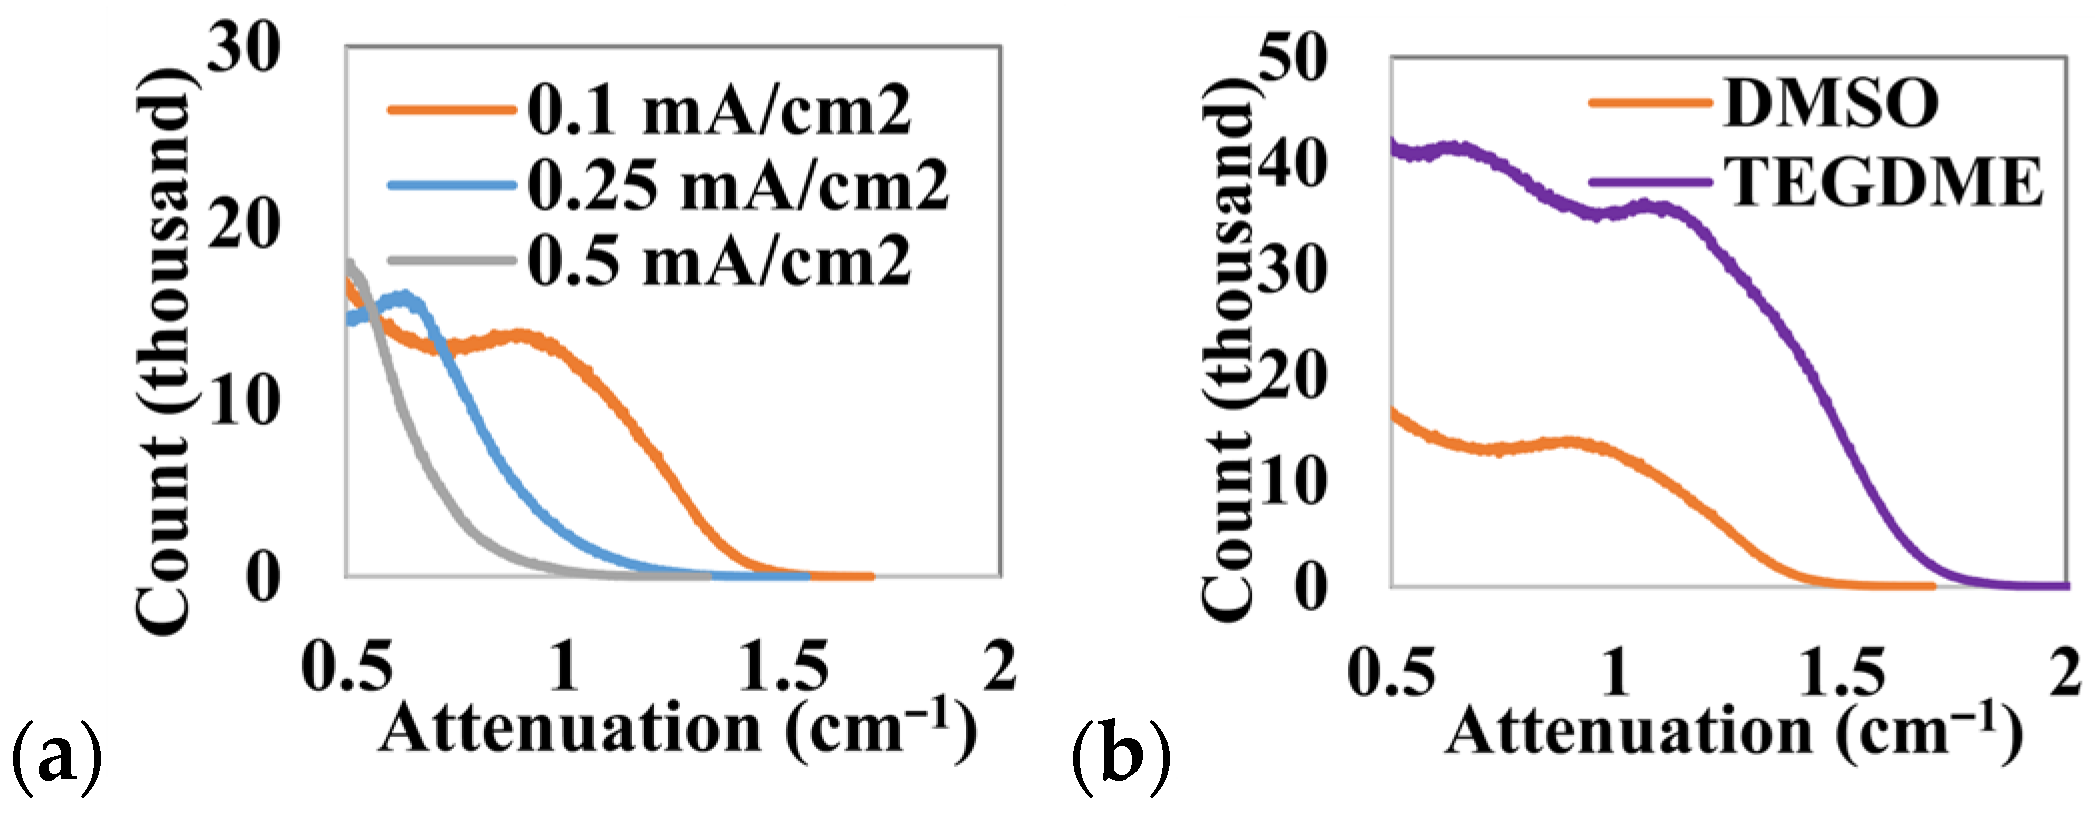
2 production rates), as shown in the histogram of grayscale values in
Figure 10. As shown in the figure, batteries using a DMSO electrolyte achieved capacities of 3.65, 2.76, and 1.68 mAh/cm
2 at current densities of 0.1, 0.25, and 0.5 mA/cm
2, respectively. Correspondingly, the average attenuation coefficients (0.794, 0.653, and 0.560 cm
−1) decreased with the decreasing discharge capacity, showing a similar trend.
Comparisons between fully discharged electrodes using the two electrolytes at a discharge current density of 0.1 mA/cm2 suggest a similar trend. The TEGDME electrode attained a discharge capacity of 9.92 mAh/cm2, with an average attenuation coefficient of 0.914 (cm−1). In comparison, the DMSO electrode achieved a discharge capacity of 3.65 mAh/cm2 and an average attenuation coefficient of 0.794 (cm−1). The agreement between the tomography-derived attenuation coefficient and titration measurements confirms that neutron imaging provides not only spatial distribution information but also an accurate bulk quantification of lithium products. This capability of spatially resolved quantification is uniquely enabled by neutron tomography and cannot be achieved through electrochemical measurements or titration alone. These results suggest that neutron imaging is a powerful tool for battery research, offering quantitative insights into the 3D spatial variations in reaction rates within battery electrodes under different operating conditions. These findings significantly enhance our understanding of electrochemical processes in porous electrodes.