Abstract
High-power lithium-ion batteries impose stringent requirements on output power. Tetramethylene sulfone (TMS), serving as a novel electrolyte additive, effectively enhances the stability of electrolytes under high-voltage conditions due to its high flash point and high dielectric constant, thereby boosting the output performance of lithium-ion batteries. In this work, we selected lithium hexafluorophosphate (LiPF6) as the lithium salt, using a solvent carrier consisting of a mixture of ethylene carbonate (EC), dimethyl carbonate (DMC), and ethyl methyl carbonate (EMC). TMS was added as an additive to create a novel high-power electrolyte system. We prepared five electrolytes with different TMS concentrations and conducted in-depth investigations into their impacts on the performance of lithium-ion batteries. The findings indicate that the electrolytes with TMS ratios of 2 wt% and 5 wt% demonstrated good synergistic cathode–anode stability in the NCM//soft carbon system, and the electrolyte with a 5 wt% TMS ratio demonstrated the most significant improvement in the overall performance of the full battery.
1. Introduction
Lithium-ion batteries are characterized by a high voltage plateau, excellent cycle performance, and high energy density, making them widely used in popular fields such as electric vehicles and electronic devices [1,2,3,4,5]. However, constrained by battery internal resistance, lithium-ion batteries (LIBs) experience rapid voltage decline under high-rate charging/discharging conditions, typically resulting in lower power density [6,7,8]. To broaden the application of LIBs in more areas such as electromagnetic catapult systems and smart grids, the development of LIBs with high output power is particularly important [9,10,11,12]. An effective strategy to elevate the output power of LIBs is using high-voltage electrolyte additives in appropriate proportions [13,14,15,16]. These additives effectively avert the degradation of the electrolyte under high-voltage conditions by reinforcing the compactness and stability of the electrode interface film during charging and discharging processes, thereby enhancing the stability of the electrolyte [17,18,19]. They are crucial components for fabricating high-performance, high-power LIBs [20].
Currently, the main types of high-voltage lithium-ion electrolyte additives include boron-based additives [21,22,23,24,25], phosphorus-based additives [26,27,28,29,30], sulfone-based additives [31,32,33,34,35], and others. Among various electrolyte additives under investigation, sulfone-based additives stand out as one of the most promising avenues. Their exceptional film-forming capabilities enable the formation of a uniform solid electrolyte interface (SEI) film on the electrode surface, thereby enhancing electrode stability [36]. Tetramethylene sulfone (TMS), as a high-power electrolyte additive, exhibits significant advantages compared to traditional sulfone additives. Its oxidation potential reaches as high as 5.6 V (vs. Li+/Li), which is markedly higher than that of traditional sulfone additives (typically ≤5.0 V vs. Li+/Li). This characteristic enables it to meet the operational requirements of high-voltage cathode materials [37]. Additionally, TMS possesses a higher dielectric constant (43.4) than traditional sulfones, which can enhance the dissociation efficiency of lithium salts [38]. Notably, TMS also demonstrates excellent safety performance, featuring high anode stability (>6.0 V) and a flash point as high as 166 °C [39]. This not only significantly improves the stability of the electrolyte under high-voltage conditions but also substantially reduces the risk of thermal runaway. While one notable drawback of TMS is its high viscosity, when used as an additive, its impact on viscosity is nearly negligible due to its small overall proportion in the electrolyte. In recent years, research on the application of TMS in the battery field has primarily focused on batteries with high voltage, high safety, and high energy density. Hao et al. [40] designed a localized high-concentration electrolyte based on a solvent mixture of TMS and trimethyl phosphate, combined with a high-flash-point diluent, 1H,1H,5H-octafluoropentyl 1,1,2,2-tetrafluoroethyl ether. This electrolyte is non-flammable and exhibits high safety. In graphite||LiNi0.8Mn0.1Co0.1O2 batteries, the optimal locally high-concentration electrolyte achieved capacity retention rates of 87.1% and 81.7% after 500 cycles at 25 °C and 45 °C, respectively. He et al. [41] reported a locally high-concentration electrolyte composed of a highly oxidation-resistant TMS solvent mixed with a non-solvent diluent. This electrolyte demonstrates excellent oxidation stability and can enable stable cycling of the cathode NaNi1/3Mn1/3Fe1/3O2. The assembled sodium-ion battery achieved a capacity retention rate of 79.48% after 300 cycles at a 1 C rate, and a capacity retention rate of 81.15% after 400 cycles at a 2 C rate under a high charging voltage of 4.2 V. Zhou et al. [42] developed a TMS-based electrolyte with dual-interface stabilization for high-safety, high-voltage lithium metal batteries. High-voltage lithium metal pouch cells assembled with this electrolyte exhibited a high energy density of 435 Wh kg−1 and maintained a capacity retention rate as high as 83.2% after more than 100 charge–discharge cycles. Table 1 summarizes recent applications of TMS in various battery systems.

Table 1.
Applications of TMS in various battery systems.
This paper presents a high-power electrolyte system constructed with LiPF6 as the lithium salt, a mixed solvent of dimethyl carbonate (DMC)/ethyl methyl carbonate (EMC)/ethylene carbonate (EC) with a mass ratio of 3:5:3, and TMS as an additive. As illustrated in Figure S4, in comparison with EC, DMC, and EMC, TMS exhibits a lower lowest unoccupied molecular orbital (LUMO) energy level (0.42 eV) and a higher highest occupied molecular orbital (HOMO) energy level (−7.79 eV) [47]. This indicates that during the charge/discharge processes, the TMS additive preferentially participates in the formation of the cathode–electrolyte interphase (CEI) or SEI on the electrode surfaces. Consequently, this reduces the consumption of electrolyte solvents during cycling and enhances the interfacial stability [48]. Furthermore, the introduction of TMS modifies the solvation structure of Li+, thereby enhancing the interfacial stability of lithium-ion batteries and promoting lithium salt dissociation. Liu et al. [49] demonstrated that the addition of TMS can regulate the solvation structure of electrolytes. Their findings revealed that TMS exhibits competitive coordination with Li+, displacing water molecules from the primary solvation sheath of Li+, which subsequently facilitates the formation and stabilization of the SEI. Similarly, Jitti et al. [50] investigated the potential of TMS to modulate ionic solvation structures in electrolytes. Their results indicated that TMS strongly coordinates with Li+, displacing PF6− anions from the solvation shell and promoting the separation between Li+ and PF6−.
In this paper, TMS is applied as a high-voltage electrolyte additive in high-power lithium-ion battery systems, aiming to significantly enhance the stability and output performance of the batteries under high-voltage conditions. Given that an excessively high TMS addition leads to overly high electrolyte viscosity, while an insufficient amount compromises its stability under high voltage, this paper systematically investigates the impact of different TMS ratios on battery performance and ultimately identifies 5 wt% TMS as the optimal proportion. This finding provides specific guiding parameters for the application of TMS in high-power batteries. The results indicate that the electrolyte with a TMS content of 5 wt% exhibits optimal high-power performance. In electrolytes with TMS contents of 10 wt% and 20 wt%, the excessive TMS ratio leads to increased viscosity and hindered ion transport, resulting in poorer electrochemical performance. Furthermore, it maintains good cycling stability at a high voltage of 4.5 V. It demonstrates that an electrolyte with a TMS content of 5 wt% plays a crucial role in enhancing the voltage window and high-power performance of batteries, which is of great significance for research on high-voltage electrolyte additives for LIBs (Scheme 1).
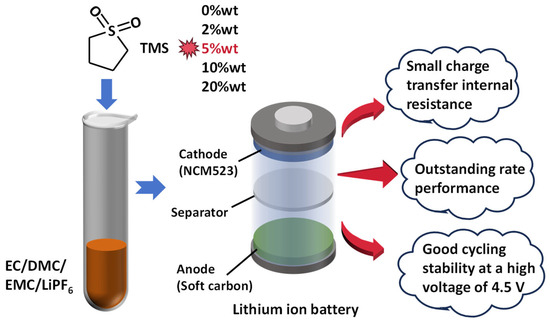
Scheme 1.
TMS as an electrolyte additive for high-power lithium-ion batteries.
2. Materials and Methods
2.1. Preparation of Electrolyte
LiPF6 was used as the lithium salt, and EC, DMC, and EMC were blended in a mass ratio of 3:5:3. After mixing, TMS was added as an additive to create a novel high-power electrolyte system. Firstly, EC was heated to 50 °C inside the glovebox. Subsequently, DMC and EMC were added, and these three substances were mixed for 5 min at a mass ratio of 3:5:3. Then, accurately weighed LiPF6 was added and mixed at room temperature for approximately 5 min. Finally, TMS was added as an additive and stirring and mixing were continued for another 5 min. All the aforementioned materials are sourced from Capchem Technology Co., Ltd. in Shenzhen, China. The specific compositions are shown in Table 2.

Table 2.
Composition of 5 groups of electrolytes.
2.2. Preparation of Electrode
In this work, the cathode material is LiNi0.5Co0.2Mn0.3 NCM523-type ternary material, provided by Beijing Easpring Material Technology Co., Ltd. (Beijing, China). This material has a theoretical specific capacity of 278 mAh g−1 and an actual specific capacity of approximately 150 mAh g−1 with a theoretical operating voltage of 4.35 V. The conductive carbon black (Super C45) is sourced from Imerys graphite & carbon Co., Ltd. (Shanghai, China), the binder polyvinylidene fluoride (PVDF) is provided by Arkema (France), and the solvent N-methylpyrrolidone (NMP) is from Beijing Chemical Works (Beijing, China) . Firstly, PVDF and NMP were premixed and then ball-milled for a duration of 0.5 h. Subsequently, the conductive agent was introduced and ball-milled for an additional hour to ensure homogeneity. Once thoroughly blended, NCM was added and further ball-milled for 2 h. The mass ratio of NCM, Super C45, and PVDF is 8:1:1. The resultant slurry was evenly applied onto a blank carbon-coated aluminum foil. The coating thickness was meticulously adjusted (33 µm), and the coated electrode was subsequently dried in a drying oven to obtain the cathode electrode. The areal loading of cathode active material in the experiment was 3.349 mg/cm2.
The anode slurry was comprised of soft carbon (SC) sourced from Hitachi Chemical Co. (Tokyo, Japan), carbon black, styrene–butadiene rubber (SBR), and sodium carboxymethyl cellulose (CMC), with a specific mass ratio of 90:5:3:2. In the anode fabrication process, the well-blended slurry was cast onto a porous copper foil. Then, the coated electrode was subsequently dried in a drying oven to obtain the anode electrode. The areal loading of anode active material in the experiment was 3.143 mg/cm2.
2.3. Preparation of Coin Half-Cells
After being prepared, the electrode was punched into a circular shape with a diameter of 12 mm. Subsequently, the punched electrode was subjected to pressing. Thereafter, the electrode was placed in a vacuum oven and dried at 100 °C for a duration exceeding 12 h to eliminate any residual moisture. Once dried, it was rapidly transferred into a glovebox (MBraun, Munich, Germany, H2O < 0.1 ppm, O2 < 0.1 ppm). In this work, the coin cell was assembled within the glovebox. The half-cells were constructed with a single-faced NCM electrode (utilizing SC for the anode half-cells), and a lithium foil served as the counter electrode. A Celgard2400 separator (sourced from Celgard, LLC, Charlotte, NC, USA) was employed to isolate the NCM (or SC) electrode from the lithium electrode. The amount of electrolyte used was 53.05 μL/cm2. After the electrolyte was added, the half-cells were sealed using a sealing machine.
2.4. Preparation of Pouch Full Cells
Cathode electrodes (NCM) and anode electrodes (SC) as well as separators were assembled in a stacked configuration to form the cell structures. The NCM cathodes and SC anodes were stacked, with separators employed to separate them. The cathode electrodes and NCM cathodes were connected to Al tabs via welding, while the anode electrode SC anodes were similarly joined to Ni tabs. Subsequently, the assembled cells were placed in a vacuum drying oven and subjected to drying at 120 °C for 12 h. They then underwent drying treatment at a temperature of 120 °C for a duration of 12 h. After the drying process was completed, the cells were quickly transferred into the Ar atmosphere glove box. Each cell and a Li-foil electrode were put into an aluminum–plastic package. After dripping enough electrolyte, the package was sealed in vacuum. Upon completion of the drying procedure, the cells were promptly transferred into an argon-filled glovebox. Subsequently, the assembled unit, comprising both the electrode stack and lithium foil, was encapsulated within an aluminum-laminate pouch. Following the precise addition of an adequate amount of electrolyte, the pouch cell was vacuum-sealed. Finally, the assembled cell was allowed to rest for a period of time (at 25 °C) so that the electrolyte fully infiltrated the electrodes.
2.5. Electrochemical Testing
This study’s electrochemical tests includes galvanostatic charge–discharge, cyclic voltammetry, electrochemical impedance spectroscopy (EIS), rate capability, and cycling performance testing. Cyclic voltammetry (CV) and EIS were performed on the BioLogic Battery Testing System (EC lab Bio-Logic VMP3, Seyssinet-Pariset, France), while the others (including rate capability testing under the condition of 50 C) were conducted on the Neware Battery Testing System (CT-4008, Shenzhen, China).
3. Results and Discussion
3.1. Electrolyte Ionic Conductivity and Viscosity
The prepared electrolyte system was tested for its ionic conductivity and viscosity. The ionic conductivity measurements were conducted using a Leici DDSJ-308F conductivity meter (Shanghai INESA Scientific Instrument Co., Ltd., Shanghai, China), while the viscosity was determined using an NDJ-55 digital viscometer (Shanghai Fangrui Instrument Co., Ltd., Shanghai, China). Both measurements were performed at 25 °C, and the results are summarized in Figure 1. When the TMS content is within the range of 0 wt% to 5 wt%, the conductivity and viscosity of the electrolyte do not change significantly. However, once the TMS content increases to 10 wt% or 20 wt%, there is a noticeable decrease in electrolyte ionic conduction and a noticeable increase in the viscosity of the electrolyte. In terms of specific values, although its conductivity is slightly lower at 12.86 mS cm−1 compared to the commonly used propylene carbonate-based electrolyte in the industry, it still falls within an acceptable range.
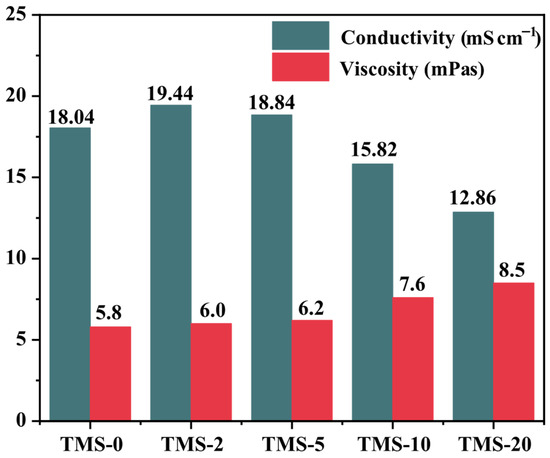
Figure 1.
Conductivity of TMS electrolytes with different compositions and electrolyte viscosity with different TMS contents.
3.2. Cathode Half-Cells
After the cathode half-cells were assembled, galvanostatic charge–discharge tests were first conducted on the batteries, with a test voltage range of 3.0–4.4 V and a current set at the 1 C rate. The first-cycle discharge curves for each battery group are shown in Figure 2a. From the figure, it can be observed that all battery groups exhibited high first-cycle discharge specific capacities, specifically exceeding 150 mAh g−1. In terms of the initial coulombic efficiency, TMS-5 performed the best, achieving 90.2%, while TMS-0 performed relatively poorly, with 84.7%. Overall, from the perspective of specific capacity, the batteries prepared with electrolytes containing TMS did not show significant performance enhancement. However, in terms of first-cycle coulombic efficiency, these batteries showed noticeable improvement compared to those prepared with electrolytes without TMS, especially the TMS-5 battery, which had the best performance with a first-cycle coulombic efficiency of up to 90.2%.
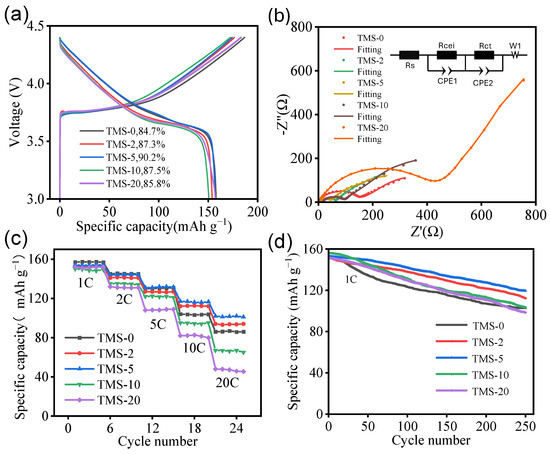
Figure 2.
(a) First charge–discharge curve of NCM//Li half-cells with different TMS contents. (b) Impedance fitting curves of NCM//Li half-cells with different TMS contents, with the inset showing the equivalent circuit diagram. (c) Rate capability of NCM//Li half-cells with different TMS contents. (d) Cycle curve of NCM//Li half-cells with different TMS contents under 4.5 V.
To further investigate the impact of TMS additives on the impedance of cathode half-cells, EIS tests (Figure 2b) and rate capability tests (Figure 2c) were conducted on half-cells corresponding to five electrolytes with different TMS proportions. EIS tests employed a 10 mV alternating voltage signal within a frequency range of 10 mHz to 100 kHz, while rate tests were performed at a voltage range of 3.0–4.35 V, involving five charge–discharge cycles at rates of 1 C, 2 C, 5 C, 10 C, and 20 C, respectively. Upon incorporating 5 wt% TMS into the electrolyte, the corresponding half-cell demonstrates the lowest internal resistance associated with charge transfer and the smallest cathode–electrolyte interphase (CEI) impedance. Based on the fitting outcomes, the CEI impedance is 37.82 Ω (Table S1). In contrast, the half-cell associated with the electrolyte comprising 20 wt% TMS exhibits the highest internal resistance for charge transfer and the largest CEI impedance, with a CEI impedance value of 119.6 Ω. Compared to the sample without TMS addition, the samples containing 2 wt% and 5 wt% TMS show obvious advantages in terms of charge transfer internal resistance. This indicates that within an appropriate addition range, as the proportion of TMS additive in the electrolyte increases, the internal resistance of the battery tends to gradually decrease. Regarding the lithium-ion diffusion coefficients, as indicated by the calculation results (Table S1), the values for TMS-0, TMS-2, and TMS-5 exhibit negligible differences. In contrast, the lithium-ion diffusion coefficient for TMS-20 is the smallest, measuring approximately 0.286 × 10⁻¹² cm2 s−1. This reduction is primarily attributed to the elevated viscosity associated with TMS-20. As shown in the Figure 2c, there is a significant decline in capacity for TMS-0, TMS-10, and TMS-20 when the rate increases above 5 C. Specifically, under the 10 C condition, the discharge specific capacities of the batteries in each group are 103.1, 114.1, 120.4, 95.3, and 82.1 mAh g−1, respectively, with capacity retention rates of 64.2%, 70.2%, 75.3%, 60.5%, and 53.2%, respectively. TMS-2 and TMS-5 exhibit superior discharge specific capacities and capacity retention rates at high C-rates, indicating that 2–5 wt% TMS additive can effectively enhance the stability of the electrolyte under high voltage and high current conditions and improve its ionic conductivity, thus significantly boosting the rate capability of lithium-ion batteries. Conversely, TMS-10 and TMS-20 show poorer discharge-specific capacities and capacity retention rates at 10 C and 20 C, suggesting that high doses of TMS additive can lead to excessively high electrolyte viscosity, deteriorating the rate capability of lithium-ion batteries. Overall, the TMS-5 sample demonstrates the optimal rate capability, maintaining good levels of discharge specific capacity and capacity retention rate at high rates.
In order to explore the potential of TMS additives in enhancing the high-voltage performance of lithium-ion batteries, cycle life tests (Figure 2d and Figure S5) were conducted on five groups of half-cells under different voltage conditions. Figure 2d presents the results after 250 cycles at a 1 C rate within the voltage range of 3.0–4.5 V. The findings reveal that the capacity retention rates of the TMS-0, TMS-10, and TMS-20 samples after 250 cycles at 4.5 V had all dropped below 70%, with the TMS-20 sample having a retention rate of only 63.7%. In contrast, the TMS-2 and TMS-5 samples exhibit relatively higher capacity retention rates of 73.3% and 81.3%, respectively, after 250 cycles at 4.5 V. Notably, the TMS-5 sample’s capacity retention rate exceeds 80%, meeting the standards for practical application of LIBs. These results further demonstrate that the addition of 5 wt% TMS additive can enhance the cyclic stability of the electrolyte and thus the battery at high voltages, thereby improving the battery’s voltage window.
Furthermore, CV tests (Figure 3 and Figure S6) were conducted on lithium-ion batteries containing five different proportions of TMS additives within various voltage ranges. The voltage windows were set to 3.0–4.0 V, 3.0–4.1 V, 3.0–4.2 V, 3.0–4.3 V, 3.0–4.4 V and 3.0–4.5 V, respectively, with a consistent scan rate of 0.2 mV/s. As illustrated in Figure S6, the charge–discharge processes of all sample groups exhibit a predominantly stable behavior under relatively low test voltages. To elucidate the performance disparities among these samples within the low-voltage regime, the coulombic efficiencies of each battery were systematically calculated based on the CV curves acquired across various voltage intervals (detailed in Table S2). The derived coulombic efficiency data were subsequently subjected to further analytical processing, the results of which are presented in Figure S7. Notably, within the low-voltage range, the TMS-2 and TMS-5 samples demonstrate superior charge–discharge stability compared to the other sample groups.
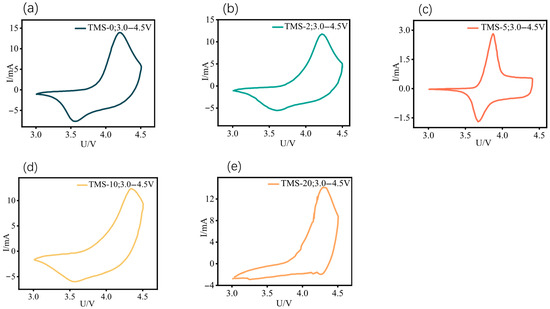
Figure 3.
CV curve of NCM//Li half-cells with different TMS contents in the voltage range of 3.0–4.5 V, and the scan rate at 0.2 mV s−1: (a) TMS-0; (b) TMS-2; (c) TMS-5; (d) TMS-10; (e) TMS-20. All potentials in this figure are referenced to the Li+/Li electrode.
As shown in the Figure 3, within the voltage range of 3.0 to 4.5 V, as observed from the CV curves, the charging and discharging processes of the batteries in each group are relatively unstable, with noticeable upward trends at the end of the curves. Electrochemical characterization through cyclic voltammetry (Figure 3) reveals instability in the charge/discharge behavior across all tested cells within the operational voltage window (3.0–4.5 V). Among the five samples, TMS-5 exhibits the best performance, with a relatively stable charging and discharging process and no significant upward trend at 4.5 V at the end of the curve. In contrast, the CV curves of TMS-10 and TMS-20 batteries become irregular within the voltage window of 3.0 to 4.5 V, with severe upward trends at 4.5 V at the end of the curves. In contrast, the electrodes of TMS-10 and TMS-20 batteries exhibit greater polarization, and their cyclic voltammetry (CV) curves become irregular. Especially for the TMS-20 sample, the overall curve shows multiple fluctuations, indicating extreme instability throughout the charging and discharging process. When compared with Figure S6, an expansion of the test voltage range to 3.0–4.5 V reveals that, owing to the optimal proportion of TMS, the TMS-5 sample exhibits superior high-voltage performance, manifesting as relatively stable charging and discharging behavior within the 3.0–4.5 V voltage range. This stability is reflected by minimal alterations in the CV curve relative to that observed at lower voltage ranges. Conversely, other samples undergo significant electrode polarization, leading to pronounced changes in the CV curve morphology and shifts in peak positions when compared with their respective curves at lower voltage ranges. Therefore, the addition of 5 wt% TMS can help improve the voltage window of the battery, allowing it to maintain relative stability during charging and discharging at a high voltage of 4.5 V. This represents a significant improvement in performance compared to batteries without TMS. However, an excessively high proportion of TMS can have a negative effect, making the charging and discharging process even more unstable at high voltages.
3.3. Anode Half-Cells
Anode half-cells were assembled and cyclic voltammetry tests were conducted on five groups of anode half-cells, each with different proportions of TMS additive. The voltage window was set to 0–3.0 V for all tests, at a scanning rate of 0.2 mV s−1. Each group was cycled twice, and the test results for each group are shown in Figure 4a–e, respectively. The data demonstrate that the cyclic voltammetry curves of the batteries in each group exhibit little difference, and the cycling process is relatively stable. The good reproducibility over two cycles suggests that the irreversible capacity during the charging and discharging processes of each group of batteries is low, and the formation of the SEI film is stable. To further compare and verify the compatibility between TMS additive and soft carbon negative electrode, rate capability tests (Figure 4f) were conducted on these five groups of negative half-cells with different proportions of TMS additive. The test conditions were set to a potential range of 0.01–3.0 V, with five charge–discharge cycles at rate conditions of 0.1 C, 0.2 C, 1 C, 5 C, 10 C, 20 C, and 50 C, respectively. As shown in the figure, the specific capacity and capacity retention rate of the TMS-10 and TMS-20 samples under various rate conditions are significantly inferior to the others, with the capacity almost decaying to zero at high rates. This is due to the excessive TMS content, which results in excessively high viscosity of the electrolyte. For the TMS-0, TMS-2, and TMS-5 samples, the specific capacities during charging and discharging are relatively stable at various rates, demonstrating good cycle stability.
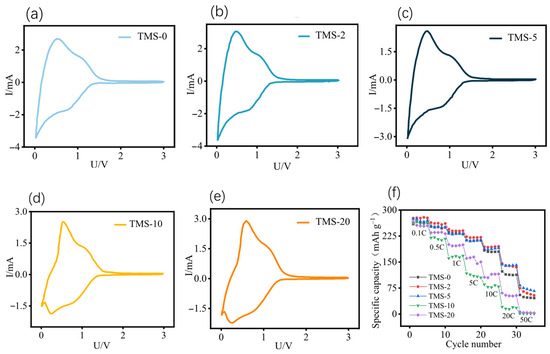
Figure 4.
CV curves of SC//Li half-cells with different TMS contents: (a) TMS-0; (b) TMS-2; (c) TMS-5; (d) TMS-10; (e) TMS-20; (f) rate curve of SC//Li half-cells with different TMS contents. All potentials in this figure are referenced to the Li+/Li electrode.
At low rates, there is almost no difference in specific capacity among the three samples. However, at high rates of 20 C and 50 C, the TMS-0 sample experiences significant capacity decay, with a specific capacity of 54.3 mAh g−1 and a capacity retention rate of only 19.7% at 50 C. In contrast, the TMS-5 sample has a specific capacity of 91.2 mAh g−1 and a capacity retention rate of 33.1% at 50 C. Comparative analysis reveals that incorporating TMS additives at 5 wt% concentrations significantly enhances the electrochemical performance of soft carbon anodes.
3.4. Full Cells
To deeply explore the performance and practical application potential of TMS additives in a full-cell system, electrolytes containing five different proportions of TMS additives were prepared and assembled into pouch-type full cells for a series of electrochemical tests. Among these, the cathode employed a 4.35 V high-energy-density power-type NCM ternary material, while the anode utilized soft carbon material. The method utilized for pre-lithiation was electrochemical, with a pre-lithiation capacity of 12 mAh g−1.
Following the pre-lithiation process, in order to verify the capacity matching between the lithium-inserted positive and negative, galvanostatic charge–discharge tests were conducted on five lithium-ion battery samples with different proportions of TMS additives. During the tests, the dynamic positive and negative potentials were monitored. The current condition was set at a rate of 0.2 C, and the voltage window ranged from 3.4 to 4.4 V. Galvanostatic charging and discharging were performed on each group of lithium-ion batteries. The curves representing the potential changes in the positive and negative during the charge–discharge tests for each group are shown in Figure 5a–e. The results indicate that the lower limits of the anode potentials for each group of batteries fall within the range of 0.02 to 0.05 V, and the upper limits are between 0.20 and 0.35 V. The lower limits of the cathode potentials are between 3.57 and 3.75 V, while the upper limits are between 4.42 and 4.45 V. The cell voltage of each group of batteries remains relatively stable throughout the entire charging and discharging process, demonstrating good consistency and indicating an appropriate selection of pre-lithiated capacity.
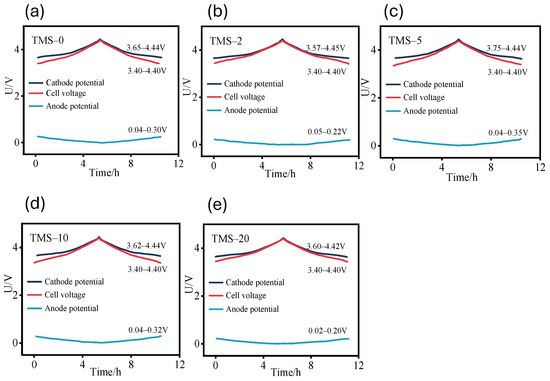
Figure 5.
Cathode and anode electrode potential during charging and discharging: (a) TMS-0; (b) TMS-2; (c) TMS-5; (d) TMS-10; (e) TMS-20. All potentials in this figure are referenced to the Li+/Li electrode.
After the appropriate lithium intercalation capacity was determined, lithium-ion batteries with electrolytes containing TMS additives at five different proportions were prepared, using this capacity as the basis. Following this, galvanostatic charge–discharge tests were conducted on the five groups of batteries. The specific capacity–voltage curves for the first discharge cycle and the first-cycle coulombic efficiencies for each group are shown in Figure 6a. Apart from the TMS-0 sample, the specific capacity–voltage curves of the remaining four battery groups are very similar, almost overlapping, which indicates that batteries with TMS additives have an advantage in overall capacity performance compared to those without TMS. Additionally, there is no significant difference in this performance indicator among batteries with varying TMS addition ratios. In terms of the initial coulombic efficiency, the TMS-2 and TMS-5 samples performed the best, with efficiencies exceeding 90%. In contrast, the TMS-10 and TMS-20 samples performed poorly, with the lowest efficiency being only 83.6%.
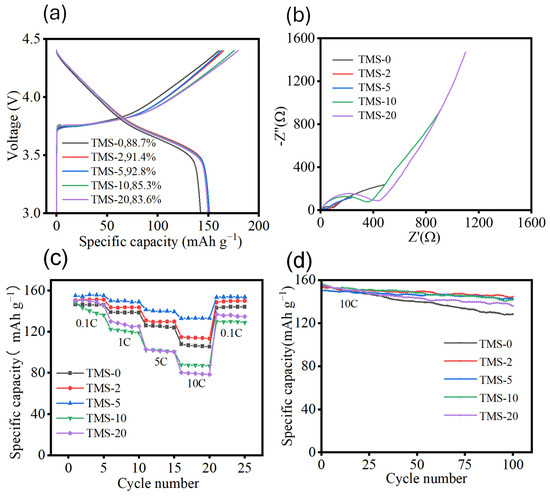
Figure 6.
(a) Specific discharge capacity voltage curve of the first cycle of cycle curve of full cells (NCM//SC) with different TMS contents. (b) Electrochemical impedance spectra of full cells (NCM//SC) with different TMS contents. (c) Curves of the rate performance of (NCM//SC) full cells with different TMS contents. (d) High-rate cycling performance curves of full cells (NCM//SC) with different TMS contents.
Subsequently, EIS tests (Figure 6b) were conducted on these stabilized batteries. The test conditions were set with an alternating voltage signal amplitude of 10 mV and a frequency range from 10 mHz to 100 kHz. As shown in the figure, TMS-5 exhibits the smallest charge transfer internal resistance, measuring only 48.4 Ω, while TMS-20 has the largest internal resistance, reaching 431.6 Ω. When the proportion of TMS additive is 5 wt%, the corresponding lithium-ion full battery demonstrates the lowest internal resistance. However, as the proportion of TMS additive increases to 10 wt% and 20 wt%, the impedance performance of the electrolyte and battery decreases instead. This is because an excessively high proportion of TMS increases the viscosity of the electrolyte, thereby hindering ion transport. To investigate the impact of different proportions of TMS additive on the rate performance of full cells, rate tests were conducted on five groups of full cell samples (Figure 6c). The test conditions were set at a potential range of 3.0 to 4.4 V, with charge–discharge cycles at 0.1 C, 1 C, 5 C, 10 C, and back to 0.1 C, each cycle being repeated five times. The results indicate that the rate performance of full cells with TMS contents of 2 wt% and 5 wt% is improved compared to full cell samples without TMS additive. Among them, the TMS-5 sample exhibits the most outstanding rate performance, with discharge specific capacities of 154.7, 151.2, 142.5, and 133.1 mAh g−1 at 0.1 C, 1 C, 5 C, and 10 C. The capacity retention rate at 10 C is 86.0%, demonstrating that a 5 wt% proportion of TMS additive effectively enhances the rate performance of the full cell by improving the stability of the electrolyte and thus the battery under high voltage and high current conditions. In contrast, the TMS-20 sample has discharge specific capacities of 150.0, 128.7, 101.9, and 80.1 mAh g−1 at 0.1 C, 1 C, 5 C, and 10 C, respectively, with a capacity retention rate of only 53.4% at 10 C, indicating poor rate performance. This suggests that a high dosage of TMS additive actually deteriorates the rate performance of the full cell, primarily due to the excessive TMS proportion increasing the overall viscosity of the electrolyte, which, in turn, hinders ion transport within the electrolyte.
The electrochemical cycling behavior of full cells with different proportions of TMS (Figure 6d) under high rate conditions was further investigated by conducting cyclic constant current charging and discharging tests on five groups of battery samples at a high rate. The test conditions were set at a potential range of 3.0 to 4.35 V, with cycling performed at a high rate of 10 C for 100 cycles. The experimental results demonstrate that full cell samples with TMS addition exhibit superior performance under high-rate charge–discharge cycling compared to those without TMS. This superiority is primarily reflected in higher-capacity retention rates and a more stable cycling process. Specifically, except for the TMS-20 sample, the capacity retention rates of the remaining samples remain above 90% after 100 cycles. In contrast, the sample without TMS addition shows a capacity retention rate of only 83.6% after the same number of cycles, indicating a more significant performance decay under high-rate conditions. Among the full cell samples containing different proportions of TMS, TMS-2 and TMS-5 exhibit better cycling performance at high rates, with capacity retention rates of 93.8% and 94.9%, respectively, after 100 cycles, while TMS-10 and TMS-20 show slightly lower rates. This outcome suggests that electrolytes containing 2 wt% and 5 wt% TMS additives can significantly enhance the stability of batteries under high voltage and high current conditions, thereby improving the high-rate cycling performance of the full cells. Conversely, for samples containing 10 wt% and 20 wt% TMS additives, the excessive TMS content increases the viscosity of the electrolyte, which is detrimental to the improvement of cycling performance.
After the cycling process at a high rate was completed, the full cells were disassembled. The cathode and anode electrode sheets of the TMS-0 and TMS-5 samples were removed from the pouch-type full cell, cleaned with DMC solvent to remove residual electrolyte and fiber separator, and then dried completely. Scanning electron microscopy was employed to analyze the morphological features of the electrodes. The morphology of the cathode electrode sheet is shown in Figure 7, and that of the anode electrode sheet is shown in Figure 8.
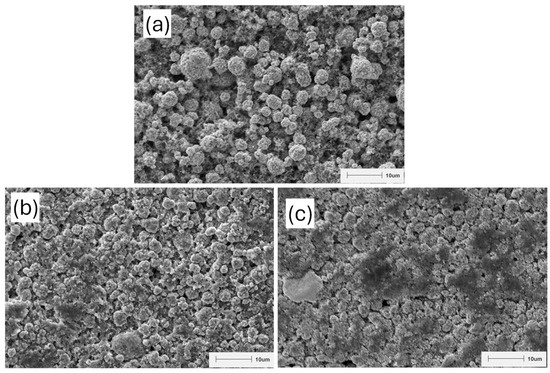
Figure 7.
Scanning electron microscope image of cathode electrode: (a) before cycling, (b) TMS-0 cathode electrode after cycling, (c) TMS-5 cathode electrode after cycling.
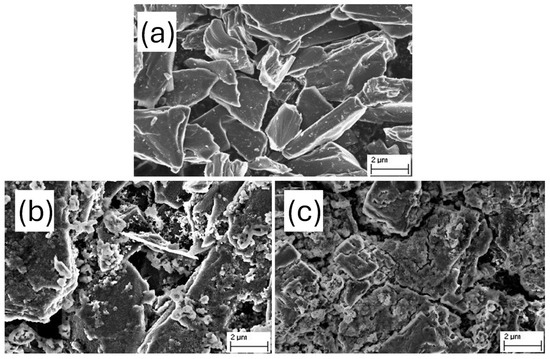
Figure 8.
Scanning electron microscope image of anode electrode: (a) before cycling, (b) TMS-0 anode electrode after cycling, (c) TMS-5 anode electrode after cycling.
As shown in Figure 7, after high-rate cycling, the cathode surface of the TMS-5 cell developed a relatively intact, block-like passivation layer, which effectively prevents cathode oxidation and decomposition, thereby enhancing the stability of the cathode under high voltage. In contrast, the TMS-0 cell exhibited an indistinct passivation layer after high-rate cycling, with a more fragmented electrode morphology. After 100 high-rate cycles (Figure 8), the carbon layer on the anode surface of the TMS-0 sample exhibited significant collapse with numerous fractures, resulting in an irregular overall morphology and failure to form a complete SEI layer. In contrast, the anode surface of the TMS-5 sample maintained a well-preserved structure, clearly developing a block-like SEI layer that effectively enhances the anode’s stability under high voltage.
4. Conclusions
Aiming to achieve high output power for LIBs, this work attempted to incorporate a novel high-voltage additive, TMS, into the electrolyte of lithium-ion batteries and studies the influence of its proportion on the electrochemical behavior of these batteries. Based on different TMS ratios in the electrolyte, the novel electrolytes used in this paper are divided into five groups, and corresponding lithium-ion batteries are prepared for each group to study their comprehensive performance and determine the optimal TMS ratio. The results indicate that the electrolyte with a TMS proportion of 5 wt% demonstrates the best electrochemical performance. In electrolytes with TMS proportions of 10 wt% and 20 wt%, the excessive TMS content increases the viscosity of the electrolyte and enhances the hindrance to ion transport, leading to a deterioration in a series of electrochemical properties. Compared to samples without TMS, samples with TMS proportions of 2 wt% and 5 wt% exhibit superior performance in various aspects such as internal resistance, rate capability, and cycle stability at high voltages, with the 5% TMS proportion sample being the best. The above research fully demonstrates that the novel additive TMS plays a crucial role in enhancing the voltage window and high-power performance of batteries, and clarifies that the optimal proportion is 5 wt%. This study provides crucial insights for developing advanced electrolyte formulations targeting high-voltage LIBs applications.
Supplementary Materials
The following supporting information can be downloaded at https://www.mdpi.com/article/10.3390/batteries11070270/s1: Figure S1: (a) SEM images of power-type 4.35 V NCM powder. (b) X-ray diffraction pattern of power-type 4.35 V NCM powder; Figure S2: SEM images of soft carbon at different magnifications: (a) 2000 times; (b) 20000 times; Figure S3. The linear fitting curve of Z′ versus ω−0.5, with the inset showing the equivalent circuit diagram. Table S1: Impedance fitting table for NCM//Li half-cells with different TMS contents. Figure S4: HOMO and LUMO energy levels of EC, DMC, EMS, and TMS. Figure S5: Cycle curve of NCM//Li half-cells with different TMS contents under 4.35 V:(a) TMS-0;(b) TMS-2;(c) TMS-5;(d) TMS-10;(e) TMS-20. Figure S6: CV Curve of NCM//Li half-cells with different TMS contents under different voltage ranges: (a) TMS-0; (b) TMS-2; (c) TMS-5; (d) TMS-10; (e) TMS-20; Table S2: Coulombic efficiency values of NCM//Li half-cells with different TMS contents in different voltage ranges; Figure S7: R curve of NCM//Li half-cells with different TMS contents under different cutoff voltages; Figure S8: Coulombic efficiency value of the first cycle of SC//Li half-cells with different TMS contents.
Author Contributions
Conceptualization, W.L. and G.C.; methodology, N.W.; validation, W.L., G.C. and X.S.; investigation, C.L.; resources, X.S.; data curation, Y.X.; writing—original draft preparation, W.L.; writing—review and editing, X.S.; visualization, X.Z. (Xiaohu Zhang); supervision, K.W.; project administration, X.Z. (Xiong Zhang); funding acquisition, N.W. All authors have read and agreed to the published version of the manuscript.
Funding
This research was funded by the Open Project of Salt Lake Chemical Engineering Research Complex of Qinghai University (2023-DXSSKF-05), the National Natural Science Foundation of China (Nos. 52377218 and 52207250).
Data Availability Statement
The original contributions presented in the study are included in the article; further inquiries can be directed to the corresponding authors.
Conflicts of Interest
The authors declare no conflicts of interest.
Abbreviations
The following abbreviations are used in this manuscript:
| LIBs | Lithium-ion batteries |
| TMS | Tetramethylene sulfone |
| EC | Ethylene carbonate |
| DMC | Dimethyl carbonate |
| EMC | Ethyl methyl carbonate |
| SEI | Solid electrolyte interface |
| PVDF | Polyvinylidene fluoride |
| NMP | N-methylpyrrolidone |
| SC | Soft carbon |
| SBR | Styrene–butadiene rubber |
| CMC | Carboxymethyl cellulose |
| EIS | Electrochemical impedance spectroscopy |
| CEI | Cathode–electrolyte interphase |
| HOMO | Highest occupied molecular orbital |
| LUMO | Lowest unoccupied molecular orbital |
References
- Binder, M.; Kuenzel, M.; Diemant, T.; Jusys, Z.; Behm, R.J.; Binder, J.R.; Stock, S.; Diller, F.; Daub, R.; Passerini, S.; et al. Ternary electrolyte additive mixture for 5V lithium-ion battery cells. J. Power Sources 2025, 630, 236073. [Google Scholar] [CrossRef]
- Wang, Q.; Jiang, L.; Yu, Y.; Sun, J. Progress of enhancing the safety of lithium ion battery from the electrolyte aspect. Nano Energy 2019, 55, 93–114. [Google Scholar] [CrossRef]
- Zhou, P.; Zhu, L.; Fu, D.; Du, J.; Zhao, X.; Sun, B. Research on the Performance Improvement Method for Lithium-Ion Battery in High-Power Application Scenarios. Energies 2024, 17, 1746. [Google Scholar] [CrossRef]
- Guo, Z.; Liu, Z.; Chen, W.; Sun, X.; Zhang, X.; Wang, K.; Ma, Y. Battery-Type Lithium-Ion Hybrid Capacitors: Current Status and Future Perspectives. Batteries 2023, 9, 74. [Google Scholar] [CrossRef]
- Zhao, S.; Sun, X.; An, Y.; Guo, Z.; Li, C.; Xu, Y.; Li, Y.; Li, Z.; Zhang, X.; Wang, K.; et al. Lithium Plating Accurate Detection of Lithium-Ion Capacitors Upon High-Rate Charging. Green Energy Intell. Transp. 2025, 100268. [Google Scholar] [CrossRef]
- Deng, Z.; Jia, Y.; Deng, Y.; Xu, C.; Zhang, X.; He, Q.; Peng, J.; Wu, H.; Cai, W. Coordination structure regulation in non-flammable electrolyte enabling high voltage lithium electrochemistry. J. Energy Chem. 2024, 96, 282–290. [Google Scholar] [CrossRef]
- Guo, Z.; Lu, C.; Liu, Z.; Wang, N.; An, Y.; Li, C.; Xu, Y.; Sun, X.; Zhang, X.; Wang, K.; et al. Dynamic analysis of bi-material cathode in lithium-ion battery capacitors by DRT method. Next Mater. 2025, 6, 100462. [Google Scholar] [CrossRef]
- Liu, W.; Sun, X.; Yan, X.; Gao, Y.; Zhang, X.; Wang, K.; Ma, Y. Review of Energy Storage Capacitor Technology. Batteries 2024, 10, 271. [Google Scholar] [CrossRef]
- Ajuria, J.; Aguesse, F. An ultrafast battery performing as a supercapacitor: Electrode tuning for high power performance. Electrochim. Acta 2020, 334, 135587. [Google Scholar] [CrossRef]
- Wang, L.; Zhang, X.; Kong, Y.-Y.; Li, C.; An, Y.-B.; Sun, X.-Z.; Wang, K.; Ma, Y.-W. Metal–organic framework-derived CoSe2@N-doped carbon nanocubes for high-performance lithium-ion capacitors. Rare Met. 2024, 43, 2150–2160. [Google Scholar] [CrossRef]
- Wang, L.; Zhao, S.; Zhang, X.; Xu, Y.; An, Y.; Li, C.; Yi, S.; Liu, C.; Wang, K.; Sun, X.; et al. In Situ Construction of Bimetallic Selenides Heterogeneous Interface on Oxidation-Stable Ti3C2TX MXene Toward Lithium Storage with Ultrafast Charge Transfer Kinetics. Small 2024, 20, 2403078. [Google Scholar] [CrossRef]
- Liu, W.; An, Y.; Zhang, X.; Wang, L.; Li, C.; Xu, Y.; Zhang, X.; Li, S.; Yi, S.; Gong, Y.; et al. General Synthesis of Graphene/Metal Oxide Heterostructures for Enhanced Lithium Storage Performance. Adv. Funct. Mater. 2024, 34, 2313274. [Google Scholar] [CrossRef]
- Hu, M.; Pang, X.L.; Zhou, Z. Recent progress in high-voltage lithium ion batteries. J. Power Sources 2013, 237, 229–242. [Google Scholar] [CrossRef]
- Kim, J.; Pham, H.Q.; Chung, G.J.; Hwang, E.H.; Kwon, Y.G.; Song, S.W. Impacts of fluorinated phosphate additive on interface stabilization of 4.6 V battery cathode. Electrochim. Acta 2021, 367, 137527. [Google Scholar] [CrossRef]
- Zhao, Y.; Zhu, H.; Xing, L.; Yu, D.Y.W. Electrolyte design for high power dual-ion battery with graphite cathode for low temperature applications. Chem. Eng. J. 2024, 493, 152602. [Google Scholar] [CrossRef]
- Liu, J.; Li, B.; Cao, J.; Xing, X.; Cui, G. Challenges in Li-ion battery high-voltage technology and recent advances in high-voltage electrolytes. J. Energy Chem. 2024, 91, 73–98. [Google Scholar] [CrossRef]
- Lan, G.; Xing, L.; Bedrov, D.; Chen, J.; Guo, R.; Che, Y.; Li, Z.; Zhou, H.; Li, W. Enhanced cyclic stability of Ni-rich lithium ion battery with electrolyte film-forming additive. J. Alloys Compd. 2020, 821, 153236. [Google Scholar] [CrossRef]
- Li, G.J.; Feng, Y.; Zhu, J.Y.; Mo, C.Y.; Cai, Q.Q.; Li, W.S.; Liao, Y.H. Achieving a Highly Stable Electrode/Electrolyte Interface for a Nickel-Rich Cathode via an Additive-Containing Gel Polymer Electrolyte. ACS Appl. Mater. Interfaces 2022, 14, 36656–36667. [Google Scholar] [CrossRef]
- Zhang, C.M.; Li, F.; Zhu, X.Q.; Yu, J.G. Triallyl Isocyanurate as an Efficient Electrolyte Additive for Layered Oxide Cathode Material-Based Lithium-Ion Batteries with Improved Stability under High-Voltage. Molecules 2022, 27, 3107. [Google Scholar] [CrossRef]
- Dong, Y.; Chen, Y.; Zeng, Q.; Feng, J.; Fang, M.; Shi, Z.; Liu, J.; Sheng, Y.; Yue, X.; Liang, Z. Challenges and Strategies of Fast-Charging Li-Ion Batteries with a Focus on Li Plating. Energy Mater. Adv. 2024, 5, 0113. [Google Scholar] [CrossRef]
- Dong, Q.Y.; Guo, F.; Cheng, Z.J.; Mao, Y.Y.; Huang, R.; Li, F.S.; Dong, H.C.; Zhang, Q.Y.; Li, W.; Chen, H.; et al. Insights into the Dual Role of Lithium Difluoro(oxalato)borate Additive in Improving the Electrochemical Performance of NMC811∥Graphite Cells. ACS Appl. Energy Mater. 2020, 3, 695–704. [Google Scholar] [CrossRef]
- Luo, S.; Ge, C.; Ou, L.; Zeng, F.; Wang, Y.; Lu, H. Construction of stable two-sided interface via the addition of phenylboric acid in Lithium-ion batteries. Electrochim. Acta 2024, 498, 144684. [Google Scholar] [CrossRef]
- Cha, J.; Han, J.G.; Hwang, J.; Cho, J.; Choi, N.S. Mechanisms for electrochemical performance enhancement by the salt-type electrolyte additive, lithium difluoro(oxalato)borate, in high-voltage lithium-ion batteries. J. Power Sources 2017, 357, 97–106. [Google Scholar] [CrossRef]
- Parida, R.; Lee, J.Y. Boron based podand molecule as an anion receptor additive in Li-ion battery electrolytes: A combined density functional theory and molecular dynamics study. J. Mol. Liq. 2023, 384, 122236. [Google Scholar] [CrossRef]
- Zhang, W.; Sun, T.; Ma, T.; Hao, W.; Zha, Z.; Cheng, M.; Tao, Z. Dynamically constructing robust cathode-electrolyte-interphase on nickel-rich cathode by organic boron additive for high-performance lithium-ion batteries. Chem. Eng. J. 2024, 491, 151946. [Google Scholar] [CrossRef]
- Park, S.; Choi, G.; Lim, H.Y.; Jung, K.M.; Kwak, S.K.; Choi, N.S. A Phosphorofluoridate-Based Multifunctional Electrolyte Additive Enables Long Cycling of High-Energy Lithium-Ion Batteries. ACS Appl. Mater. Interfaces 2023, 15, 33693–33702. [Google Scholar] [CrossRef]
- Zhang, Z.H.; Hu, J.G.; Hu, Y.; Wang, H.M.; Hu, H.P. Tri(2-furyl)phosphine-induced robust interphases for durable Nickel-rich Lithium-ion batteries. Appl. Surf. Sci. 2023, 624, 157027. [Google Scholar] [CrossRef]
- Jiang, W.Z.; Zhang, G.Q.; Deng, J.H. Comparable Investigation of Phosphorus-Based Flame Retardant Electrolytes on LiFePO4 Cathodes. J. Electrochem. Soc. 2022, 169, 050532. [Google Scholar] [CrossRef]
- Lai, J.; Huang, Y.; Zeng, X.; Zhou, T.; Peng, Z.; Li, Z.; Zhang, X.; Ding, K.; Xu, C.; Ying, Y.; et al. Molecular Design of Asymmetric Cyclophosphamide as Electrolyte Additive for High-Voltage Lithium-Ion Batteries. ACS Energy Lett. 2023, 8, 2241–2251. [Google Scholar] [CrossRef]
- Park, J.W.; Park, D.H.; Go, S.; Nam, D.-H.; Oh, J.; Han, Y.-K.; Lee, H. Malonatophosphate as an SEI- and CEI-forming additive that outperforms malonatoborate for thermally robust lithium-ion batteries. Energy Storage Mater. 2022, 50, 75–85. [Google Scholar] [CrossRef]
- Björklund, E.; Göttlinger, M.; Edström, K.; Younesi, R.; Brandell, D. Sulfolane-Based Ethylene Carbonate-Free Electrolytes for LiNi0.6Mn0.2Co0.2O2-Li4Ti5O12 Batteries. Batter. Supercaps 2020, 3, 201–207. [Google Scholar] [CrossRef]
- Jia, H.; Xu, Y.B.; Zou, L.F.; Gao, P.Y.; Zhang, X.H.; Taing, B.; Matthews, B.E.; Engelhard, M.H.; Burton, S.D.; Zhong, L.R.; et al. Sulfone-based electrolytes for high energy density lithium-ion batteries. J. Power Sources 2022, 527, 231171. [Google Scholar] [CrossRef]
- Yim, T.; Kang, K.S.; Mun, J.; Lim, S.H.; Woo, S.G.; Kim, K.J.; Park, M.S.; Cho, W.; Song, J.H.; Han, Y.K.; et al. Understanding the effects of a multi-functionalized additive on the cathode-electrolyte interfacial stability of Ni-rich materials. J. Power Sources 2016, 302, 431–438. [Google Scholar] [CrossRef]
- Zhang, X.; Wu, Q.; Guan, X.; Cao, F.; Li, C.; Xu, J. Lithium dendrite-free and fast-charging for high voltage nickel-rich lithium metal batteries enabled by bifunctional sulfone-containing electrolyte additives. J. Power Sources 2020, 452, 227833. [Google Scholar] [CrossRef]
- Li, Y.Q.; Hao, X.Q.; Liu, H.R.; Zou, J.X.; Wang, W.J. Ethyl Isopropyl Sulfone Modulating to Achieve Stable High-Voltage Electrolyte for Lithium-Ion Batteries. ACS Appl. Mater. Interfaces 2024, 16, 55362–55371. [Google Scholar] [CrossRef] [PubMed]
- Choi, W.I.; Park, I.; An, J.S.; Kim, D.Y.; Koh, M.; Jang, I.; Kim, D.S.; Kang, Y.S.; Shim, Y. Controlling Gas Generation of Li-Ion Battery through Divinyl Sulfone Electrolyte Additive. Int. J. Mol. Sci. 2022, 23, 7328. [Google Scholar] [CrossRef] [PubMed]
- Cai, H.; Jing, H.; Zhang, X.; Shen, M.; Wang, Q. Improving High-Voltage Performance of Lithium-Ion Batteries with Sulfolane as an Electrolyte Additive. J. Electrochem. Soc. 2017, 164, A714. [Google Scholar] [CrossRef]
- Wu, W.; Bai, Y.; Wang, X.; Wu, C. Sulfone-based high-voltage electrolytes for high energy density rechargeable lithium batteries: Progress and perspective. Chin. Chem. Lett. 2021, 32, 1309–1315. [Google Scholar] [CrossRef]
- Xu, D.; Wang, Z.-l.; Xu, J.-j.; Zhang, L.-l.; Wang, L.-m.; Zhang, X.-b. A stable sulfone based electrolyte for high performance rechargeable Li–O2 batteries. Chem. Commun. 2012, 48, 11674–11676. [Google Scholar] [CrossRef]
- Jia, H.; Broekhuis, B.; Xu, Y.; Yang, Z.; Kautz, D.; Zhong, L.; Engelhard, M.H.; Zhao, Q.; Bowden, M.E.; Matthews, B.E.; et al. Rational Electrolyte Design for Elevated-Temperature and Thermally Stable Lithium-Ion Batteries with Nickel-Rich Cathodes. ACS Appl. Mater. Interfaces 2025, 17, 6260–6270. [Google Scholar] [CrossRef]
- He, X.; Peng, J.; Lin, Q.; Li, M.; Chen, W.; Liu, P.; Huang, T.; Huang, Z.; Liu, Y.; Deng, J.; et al. Sulfolane-Based Flame-Retardant Electrolyte for High-Voltage Sodium-Ion Batteries. Nano-Micro Lett. 2024, 17, 45. [Google Scholar] [CrossRef] [PubMed]
- Zhou, J.; Zhang, C.; Wang, H.; Guo, Y.; Xie, C.; Luo, Y.; Wang, C.; Wen, S.; Cai, J.; Yu, W.; et al. Dual-Interphase-Stabilizing Sulfolane-Based Electrolytes for High-Voltage and High-Safety Lithium Metal Batteries. Adv. Sci. 2024, 11, 2410129. [Google Scholar] [CrossRef] [PubMed]
- Chen, Y.; Zhao, Y.; Wang, A.; Zhang, D.; Li, B.; He, X.; Fan, X.; Liu, J. Cosolvent occupied solvation tuned anti-oxidation therapy toward highly safe 4.7 V-class NCM811 batteries. Energy Environ. Sci. 2024, 17, 6113–6126. [Google Scholar] [CrossRef]
- Zhang, B.-H.; Chen, P.-P.; Hou, Y.-L.; Chen, J.-Z.; Wang, H.-Y.; Wen, W.-X.; Li, Z.-A.; Lei, J.-T.; Zhao, D.-L. Localized High-Concentration Sulfone Electrolytes with High-Voltage Stability and Flame Retardancy for Ni-Rich Lithium Metal Batteries. Small 2024, 20, 2402123. [Google Scholar] [CrossRef]
- Hai, F.; Tian, X.; Yi, Y.; Wu, Z.; Zheng, S.; Guo, J.; Tang, W.; Hua, W.; Li, M. A sulfolane-based high-voltage electrolyte with dispersed aggregates for 5 V batteries. Energy Storage Mater. 2023, 54, 641–650. [Google Scholar] [CrossRef]
- Ko, S.; Yamada, Y.; Yamada, A. An overlooked issue for high-voltage Li-ion batteries: Suppressing the intercalation of anions into conductive carbon. Joule 2021, 5, 998–1009. [Google Scholar] [CrossRef]
- Kuang, W.; Zhou, X.; Fan, Z.; Chen, X.; Yang, Z.; Chen, J.; Shi, X.; Li, L.; Zeng, R.; Wang, J.-Z.; et al. Sulfur-Containing Inorganic-Rich Interfacial Chemistry Empowers Advanced Sodium-Ion Full Batteries. ACS Energy Lett. 2024, 9, 4111–4118. [Google Scholar] [CrossRef]
- Wang, C.; Fu, X.; Ying, C.; Liu, J.; Zhong, W.-H. Natural protein as novel additive of a commercial electrolyte for Long-Cycling lithium metal batteries. Chem. Eng. J. 2022, 437, 135283. [Google Scholar] [CrossRef]
- Liu, D.; Yuan, L.; Li, X.; Chen, J.; Xiong, R.; Meng, J.; Zhu, S.; Huang, Y. Tuning the Electrolyte Solvation Structure via a Nonaqueous Co-Solvent to Enable High-Voltage Aqueous Lithium-Ion Batteries. ACS Appl. Mater. Interfaces 2022, 14, 17585–17593. [Google Scholar] [CrossRef]
- Kasemchainan, J.; Teeraburanapong, S.; Suttipong, M. Enhanced Ion Solvation and Conductivity in Lithium-Ion Electrolytes via Tailored EMC-TMS Solvent Mixtures: A Molecular Dynamics Study. ACS Omega 2025, 10, 2141–2149. [Google Scholar] [CrossRef]
Disclaimer/Publisher’s Note: The statements, opinions and data contained in all publications are solely those of the individual author(s) and contributor(s) and not of MDPI and/or the editor(s). MDPI and/or the editor(s) disclaim responsibility for any injury to people or property resulting from any ideas, methods, instructions or products referred to in the content. |
© 2025 by the authors. Licensee MDPI, Basel, Switzerland. This article is an open access article distributed under the terms and conditions of the Creative Commons Attribution (CC BY) license (https://creativecommons.org/licenses/by/4.0/).