Article

SOC Estimation of Lithium-Ion Batteries Utilizing EIS Technology with SHAP–ASO–LightGBM

School of Science and Technology, Hong Kong Metropolitan University, Hong Kong SAR, China
*
Author to whom correspondence should be addressed.
Batteries 2025, 11(7), 272; https://doi.org/10.3390/batteries11070272
Submission received: 3 June 2025 / Revised: 7 July 2025 / Accepted: 14 July 2025 / Published: 17 July 2025

Abstract

Accurate State of Charge (SOC) estimation is critical for optimizing the performance and longevity of lithium-ion batteries (LIBs), which are widely used in applications ranging from electric vehicles to renewable energy storage. Traditional SOC estimation methods, such as Coulomb counting and open-circuit voltage measurement, suffer from cumulative errors and slow response times. This paper proposes a novel machine learning-based approach for SOC estimation by integrating Electrochemical Impedance Spectroscopy (EIS) with the SHapley Additive exPlanations (SHAP) method, Atom Search Optimization (ASO), and Light Gradient Boosting Machine (LightGBM). This study focuses on large-capacity lithium iron phosphate (LFP) batteries (3.2 V, 104 Ah), addressing a gap in existing research. EIS data collected at various SOC levels and temperatures were processed using SHAP for feature extraction (FE), and the ASO–LightGBM model was employed for SOC prediction. Experimental results demonstrate that the proposed SHAP–ASO–LightGBM method significantly improves estimation accuracy, achieving an RMSE of 3.3%, MAE of 1.86%, and R2 of 0.99, outperforming traditional methods like LSTM and DNN. The findings highlight the potential of EIS and machine learning (ML) for robust SOC estimation in large-capacity LIBs.

1. Introduction

Lithium-ion batteries (LIBs) are widely employed in applications spanning consumer electronics to electric vehicles (EVs), where they serve as the primary power source for electric drivetrains. In recent years, LIBs have also gained traction in the renewable energy sector as energy storage systems (ESSs), enhancing the stability of intermittent energy sources such as wind and solar power. Their popularity stems from key advantages, including high energy density, long cycle life, and reliable performance [1]. In practical applications, one of the most critical parameters for assessing battery performance is the remaining charge, which indicates the available capacity left in the battery. This is typically expressed as the state of charge (SOC)—a measure of the remaining charge relative to the battery’s full capacity. Accurate SOC estimation is essential for optimizing battery efficiency, preventing overcharging or deep discharge, and prolonging battery lifespan. However, unlike measurable parameters such as voltage and current, SOC cannot be directly measured and must instead be estimated using specialized methods [2].
SOC estimation remains challenging due to the nonlinear electrochemical behavior of LIBs, which is affected by factors such as temperature fluctuations, aging, and varying operating conditions [3,4]. Traditional SOC estimation methods, including Coulomb counting and open-circuit voltage (OCV) measurement, often face limitations such as cumulative errors and slow response times [3]. Coulomb counting (also known as the ampere-hour integral method) calculates SOC by integrating current over time to determine the charged or discharged capacity. In this approach, the remaining capacity at any given moment is derived by adjusting the previous capacity value with the net charge flow. The SOC is then expressed as the percentage ratio of the remaining capacity to the battery’s total available capacity, as shown below [5]:
S O C ( t 0 + t ) = S O C ( t 0 ) + η t 0 t 0 + t I ( t ) d t C ( t o t a l ) × 100 %
where
  • SOC(t0+Δt): SOC value at time t0 + Δt;
  • SOC(t0): SOC value at time t0;
  • η: Efficiency of the battery’s charge and discharge process;
  • I(t): Current during charging or discharging at time t;
  • C(total): Total available capacity of the battery.
From Equation (1), it is evident that the Coulomb counting method is highly sensitive to the initial SOC value and prone to accumulated errors, as it operates as an open-loop estimation technique. Alternatively, the open-circuit voltage (OCV) method relies on the well-documented relationship between OCV and SOC in LIBs. This approach is often combined with Coulomb counting to provide an initial SOC reference for the integration process [6]. However, a key limitation of the OCV method is that it requires the battery to be in a fully relaxed (quiescent) state for accurate measurement [3].
To overcome these limitations, model-based approaches have been developed. These methods primarily utilize equivalent circuit models (ECMs) and electrochemical models (EMs) to describe the dynamic and static behavior of LIBs [1,7,8].
The SOC estimation framework of ECM-based methods is illustrated in Figure 1. In this framework, datasets such as cell voltage, current, temperature, and time are collected through measurements. These datasets are then used to identify ECM parameters and calculate OCV, which is subsequently employed to estimate SOC values using SOC–OCV curves. For example, a fractional-order equivalent circuit model [1], a 2-RC equivalent circuit model [7], and the Thevenin model [8] were utilized to estimate SOC. The advantages of ECM-based methods include a simple model structure and clear physical meaning, making them highly suitable for real-time operation in battery management system (BMS), which are typically combined with Kalman filtering algorithms to achieve robust real-time state updates even in noisy environments [9]. The primary drawback of ECM-based SOC estimation is the inherent trade-off between real-time performance and accuracy. While lower-order models are often used to meet computational constraints, they inadequately capture complex dynamic and nonlinear behaviors. Furthermore, the accuracy of these models critically depends on precise parameterization—yet key parameters (e.g., ohmic resistance and OCV–SOC relationship) exhibit strong dependence on temperature, aging, and operating conditions. This sensitivity, combined with the challenge of robust online parameter identification, makes sustaining high accuracy over time difficult [10].
EM-based SOC estimation methods were explored in [11,12], which utilized the pseudo-two-dimensional (P2D) model to characterize LIBs’ mechanisms. The advantages of EM-based SOC estimation directly describe the microscopic mechanisms such as the diffusion and reactions of lithium ions within the electrode, which can fundamentally reveal the dynamic characteristics of the battery [11,12]. Therefore, it has extremely high potential for theoretical accuracy. Its drawbacks include the complex systems of partial differential equations and the huge computational demands, which make it difficult to run in resource-constrained BMS in real time. Moreover, parameter identification (such as solid phase diffusion coefficient and reaction rate constant) has extremely high requirements for experimental equipment and calibration accuracy, thereby limiting its engineering practicability.
With the rapid advancements in artificial intelligence (AI) technology, data-driven approaches have garnered significant attention as model-free methods for enhancing SOC estimation performance. These methods typically rely on characteristic datasets as input variables to train neural networks, enabling SOC prediction without the need for constructing complex performance models [13]. The general framework of data-driven approaches is depicted in Figure 2, where datasets are divided into training and testing subsets. Training datasets are utilized for model development, while testing datasets are used to validate model accuracy and predict target outcomes. Recent studies have explored various hybrid and advanced data-driven techniques. For example, a hybrid method combining a Convolutional Neural Network (CNN) and a Bidirectional Weighted Gated Recurrent Unit (BWGRU) was investigated [14]. Additionally, an enhanced SOC estimation approach leveraging a Gated Recurrent Unit (GRU) and transfer learning was proposed for small target sample sets [15]. A novel Long Short-Term Memory Recurrent Neural Network (LSTM-RNN) with extended input (EI) and constrained output (CO) was employed for battery SOC estimation [16]. Furthermore, a BiLSTM–AKEF hybrid SOC prediction method incorporating the Ah integral was introduced in [17]. While effective, these data-driven approaches primarily rely on simple time-domain measurements, such as voltage, current, and temperature. However, these measurements often struggle to rapidly and accurately capture the internal dynamics of LIBs during charge–discharge cycles. As the demand for detailed battery monitoring continues to grow, alternative data-driven strategies may be required to address these limitations. Electrochemical Impedance Spectroscopy (EIS) has emerged as a powerful alternative, offering frequency-domain insights into the dynamic electrochemical behavior of batteries [18]. By leveraging EIS, it may be possible to develop novel estimation methods that enhance the accuracy and robustness of SOC predictions without compromising computational efficiency.
This paper explores an innovative approach that leverages EIS techniques to collect datasets at various SOC points across a temperature range from low to high. The feature data of EIS is further extracted using the Shapley Additive exPlanations (SHAP) method, which is then utilized as input for training a model based on the Atom Search Optimization (ASO) algorithm and Light Gradient Boosting Machine (LightGBM). Once fully trained, the ASO–LightGBM neural network processes new EIS feature data to estimate SOC. The key contributions of this study are summarized as follows:
  • Development of an EIS Data Test Bench: An EIS test bench was established to collect EIS data at different SOC points under specified temperature conditions. Using this setup, EIS datasets were successfully obtained for two lithium iron phosphate (LFP) battery cells with a capacity of 3.2 V and 104 Ah.
  • Focus on Large-Capacity Lithium-Ion Batteries: Unlike most reported studies, which rarely examine EIS data for large-capacity lithium-ion batteries, particularly those exceeding 100 Ah, this research extracts EIS data from LFP batteries with a capacity of 3.2 V and 104 Ah. The feature data are derived using the SHAP method.
  • ML-Based SOC Estimation: An ML approach utilizing the ASO–LightGBM model was developed for SOC estimation using EIS. The ASO algorithm optimizes the hyperparameters of the LightGBM model, while the extracted feature data are used for model training and SOC prediction.
  • Validation of Accuracy and Robustness: The proposed SHAP–ASO–LightGBM algorithm for SOC estimation was rigorously validated against existing methods. Comparative results demonstrated that the SHAP–ASO–LightGBM approach significantly improves the accuracy and robustness of SOC estimation for lithium-ion batteries.
The remainder of the article is organized as follows: Section 2 delves deeper into the SOC estimation method utilizing EIS techniques, covering the fundamental principles of EIS and an analysis of the current state of research on SOC estimation using these techniques. Section 3 outlines the setup of the EIS experimental environment, the process of EIS data collection, and the extraction method of feature data. Section 4 provides a comprehensive explanation of the proposed SHAP–ASO–LightGBM algorithm model for SOC estimation. Section 5 details the simulation process based on the proposed estimation method and includes a comparative analysis with existing studies. Finally, Section 6 offers a summary of the overall research findings.

2. EIS-Based SOC Estimation: Current Status and Analysis

2.1. The Basic Principles of EIS Techniques

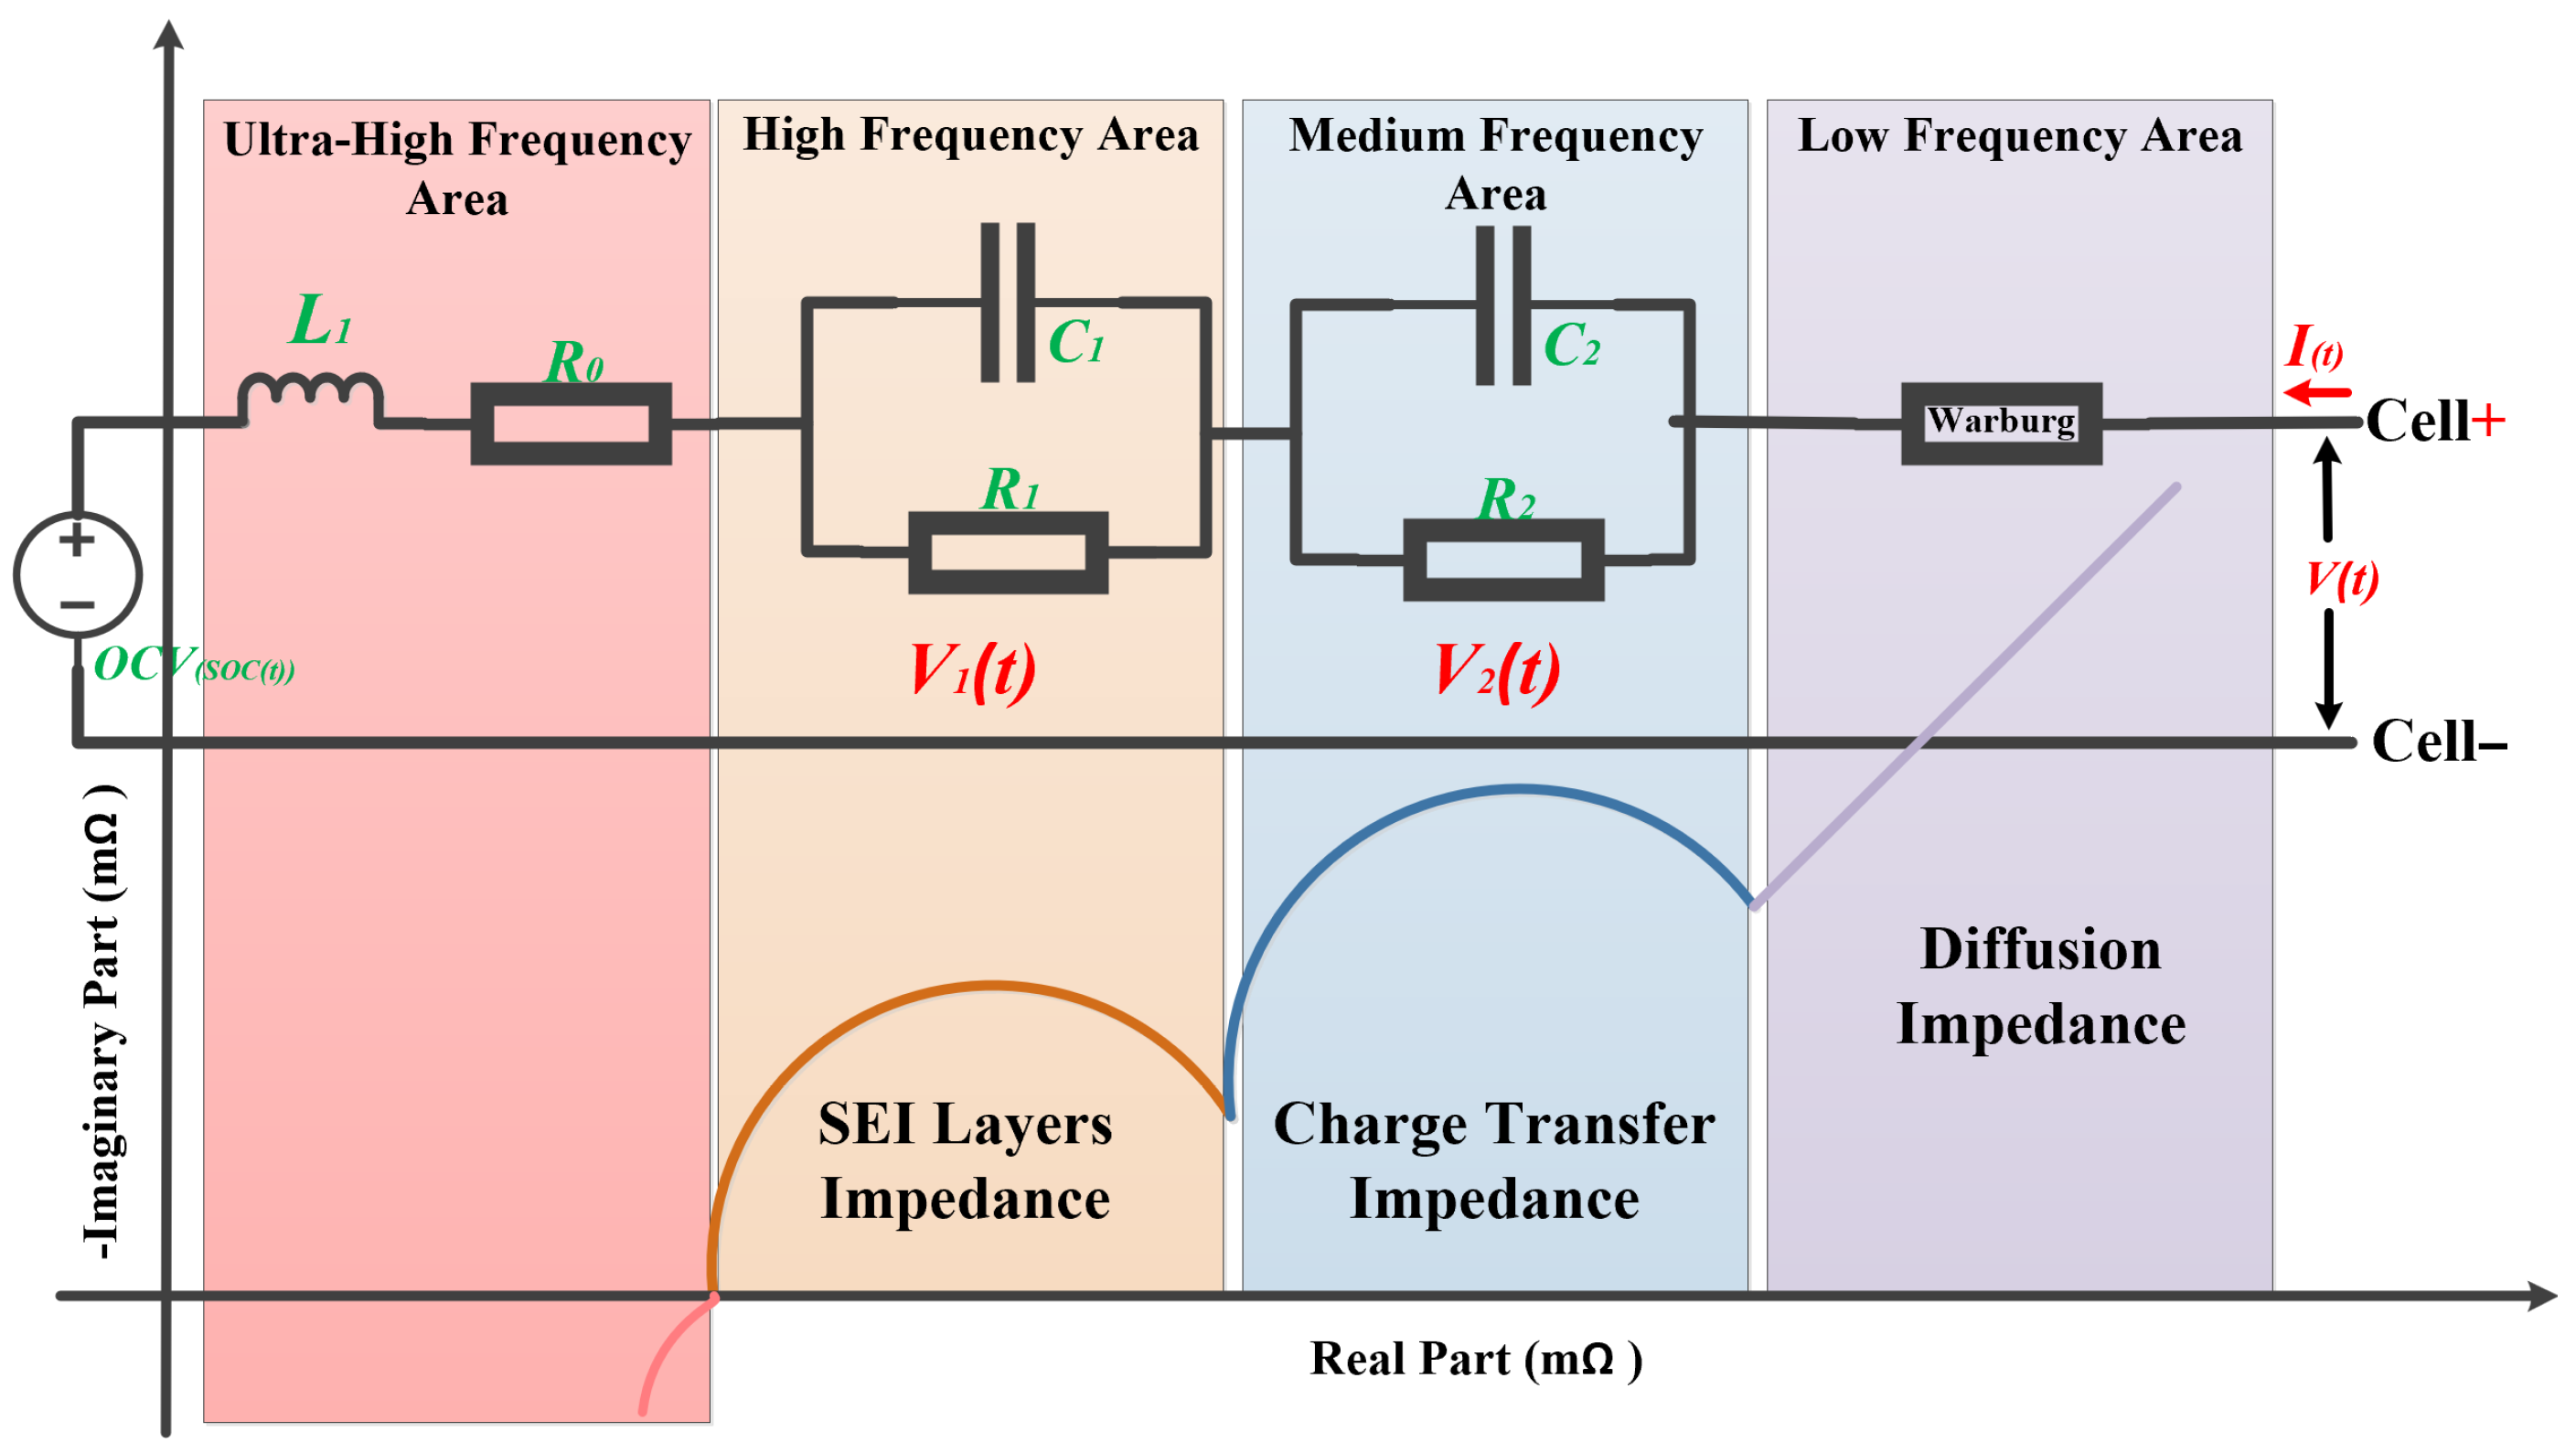
Electrochemical Impedance Spectroscopy (EIS) is an advanced analytical technique used to examine the electrical properties of materials and interfacial systems [19]. Conducting EIS experiments involves generating stimulus signals, typically sinusoidal in nature, and measuring the corresponding battery voltage and current. These stimulus signals span a frequency range from a few millihertz (mHz) to several kilohertz (kHz). By analyzing the impedance response across this broad frequency spectrum, EIS provides valuable insights into fundamental kinetic and mechanistic processes [19]. The equivalent circuit model used in EIS incorporates both electrical circuit components and electrochemical elements. The impedance spectra generated from this model closely align with the actual EIS behavior observed in batteries. Figure 3 demonstrates the connection between the Nyquist plot of LIBs and fractional-order models, as well as their corresponding electrochemical processes [20]. In EIS, the Nyquist plot is typically divided into four distinct regions: the ultra-high frequency (UHF) region, which represents the internal resistance and inductance of LIBs; the high frequency (HF) region, associated with the impedance of the solid electrolyte interface (SEI); the medium frequency (MF) region, which reflects charge transfer processes; and the low frequency (LF) region, indicative of ion diffusion [21].

2.2. The Calculation of Impedance Spectrum

EIS is performed by applying disturbance signals and analyzing the resulting excitation response. These disturbance signals are typically sinusoidal waves of current or voltage at varying frequencies. During the measurement, both the amplitude and phase of the excitation response—either voltage or current—are recorded, enabling the calculation of impedance across different frequencies [22,23]. When a sinusoidal current disturbance signal with an angular frequency ω and amplitude Im is applied, it can be expressed as shown in Equation (2). The corresponding voltage response signal is represented as a sinusoidal wave with amplitude Vm, the same angular frequency ω, and a phase shift φ, as described in Equation (3). Using Euler’s formula, the voltage and current signals are expressed mathematically, leading to the derivation of the complex impedance function in Equation (4). In this equation, j denotes the imaginary unit, the square root of minus 1, and Zm represents the impedance amplitude. From this, the real and imaginary components of the impedance can be calculated [24]. In practical applications, specialized EIS detection equipment, such as electrochemical workstations, is used to facilitate these calculations and measurements.
I t = I m sin ( ω t )
V t = V m sin ( ω t + φ )
Z = V t I t = V m sin ω t + φ I m sin ω t = V m e ( j ω t + j φ ) I m e ( j ω t ) = Z m e ( j φ ) = Z m ( cos φ + j sin φ )

2.3. EIS-Based SOC Estimation

Electrochemical impedance spectroscopy (EIS) is highly effective in capturing the dynamic electrochemical characteristics of batteries from a frequency-domain perspective [16]. Leveraging this capability, some researchers have integrated EIS technology with data-driven approaches for SOC estimation. For instance, a Deep Neural Network (DNN) was explored for SOC prediction using both raw EIS datasets and equivalent circuit model parameters derived from EIS data [18]. The study emphasized the importance of using the raw EIS data for SOC estimation, which can help reduce input dimensions and improve system robustness. In [25], the Pearson correlation coefficient (PCC) was applied for feature selection within EIS datasets. The research utilized a cylindrical 18650 lithium-ion battery cell with a specification of 3.6 V and 2750 mAh. However, since PCC analysis is more suitable for linear data and normally distributed datasets, a nonlinear analysis method was recommended to validate the PCC results for nonlinear EIS datasets. In [26], a study evaluated 11 ML methods for SOC estimation using EIS datasets from 3.6 V 2600 mAh LIBs, with the Long Short-Term Memory (LSTM) neural network demonstrating superior performance. While LSTM excels in handling large sequential datasets, however, its applicability to small and medium-sized structured tabular EIS data is relatively limited. In [27], another study focused on cylindrical LIBs with a capacity of 3.6 V 2600 mAh and investigated a Gaussian Process Regression (GPR) model for EIS-based SOC estimation at a temperature of 25 °C.
These prior studies primarily concentrated on small-capacity batteries (≤4.8 Ah) for SOC estimation using EIS datasets [18,25,26,27]. As large-capacity battery cells become more widely adopted in applications like electric vehicles (EVs) and energy storage systems (ESS), the demand for these high-capacity cells is increasing. Their use helps simplify battery pack assembly and improves overall system reliability. Hence, this paper will focus on the applications of large-capacity lithium iron phosphate (LFP) battery cells with a capacity of 3.2 V 104 Ah, which better align with real-world application demands.

3. Experimental Testing and Feature Extraction Method (FEM)

3.1. EIS Data Collection: Experimental Procedure

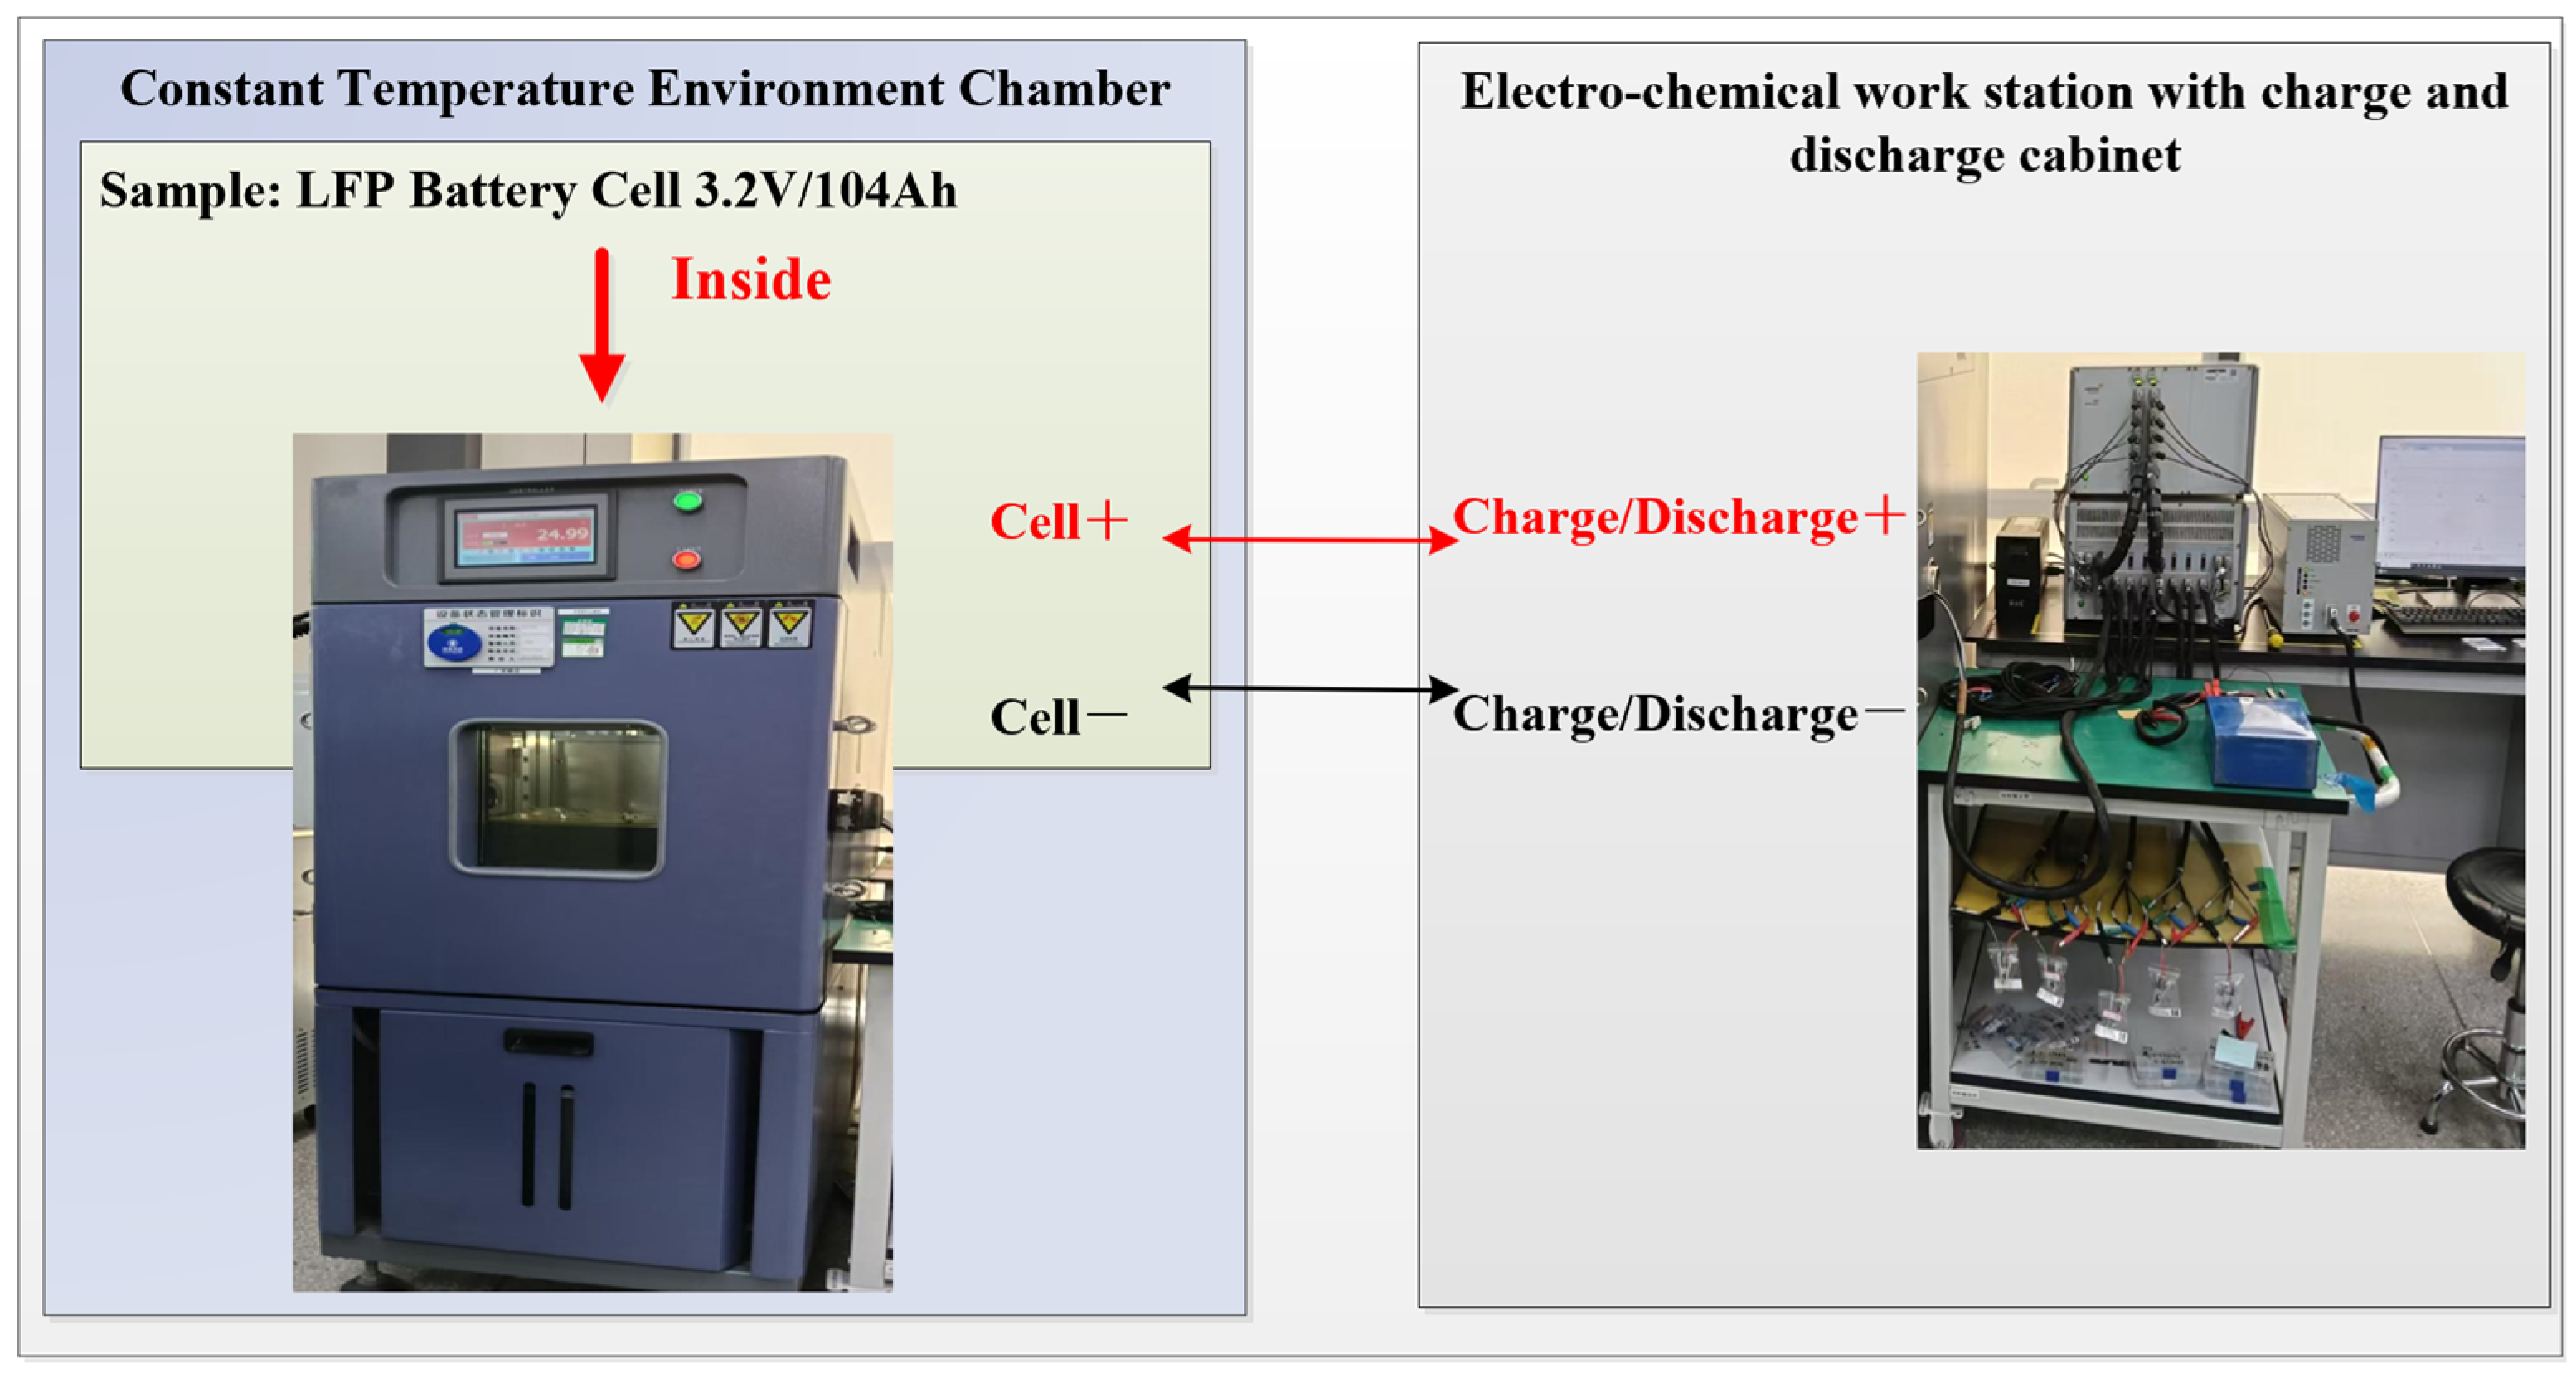
The experimental setup is illustrated in the schematic diagram shown in Figure 4. A temperature-controlled environmental chamber was employed to maintain a stable thermal environment, while an electrochemical workstation (UK Solartron models 1455 and 1470) integrated with a charge–discharge cabinet supplied a sinusoidal excitation current of 0.1 C (e.g., approximately 10.4 A for batteries with a rated capacity of 104 Ah) and facilitated charging and discharging operations. This setup enabled the acquisition of electrochemical impedance spectroscopy (EIS) data for the batteries. Figure 5 illustrates the experimental procedure for collecting EIS data across various temperature points. In lithium iron phosphate (LFP) batteries, the relationship between state of charge (SOC) and open-circuit voltage (OCV) exhibits a relatively flat curve within the SOC range of 5% to 95%. While OCV measurements can reliably determine SOC outside this range, accurately estimating SOC within the flat region poses a significant challenge [28]. This study, therefore, aims to improve SOC estimation specifically within the flat SOC–OCV region of LFP batteries. As shown in Figure 5, the battery’s SOC decreases progressively from 95% to 0% in 5% steps. At each SOC level, the batteries were allowed to rest for one hour (with the resting duration subject to adjustment based on practical factors such as temperature) before EIS data collection commenced. The experiment concluded once all SOC measurement points at the specified temperature had been thoroughly tested. Throughout the experiment, real-time data recording was performed using the electrochemical workstation.

3.2. Feature Extraction Method (FEM)

To improve the performance of ML models, a common approach involves preprocessing the data through correlation analysis, specifically feature extraction (FE). Various techniques are employed in correlation analysis, including the following: the Pearson Correlation Coefficient (PCC), which measures linear relationships; Kendall’s Tau and Spearman’s Rank Correlation Coefficient (SRCC), both non-parametric methods suited for ordinal data, which accounts for interactions between variables; the Chi-Square Test (CST) for analyzing categorical relationships [29]. However, due to the complex nonlinear characteristics of electrochemical impedance spectroscopy (EIS) in lithium-ion batteries, traditional correlation analysis methods often fall short in capturing intricate relationships. In contrast, SHapley Additive exPlanations (SHAP) offer significant advantages over these conventional techniques, excelling in modeling complex relationships, enhancing model interpretability, and supporting decision-making. As a result, SHAP has emerged as the preferred tool for feature importance analysis in the era of ML [30,31]. Its ability to calculate contribution percentages makes it particularly well-suited for feature selection tasks.
SHAP is based on the Shapley value in game theory and quantifies the importance of each feature by fairly allocating its marginal contribution to the model’s prediction. Figure 6 illustrates the calculation process of Shapley values, which primarily includes data preprocessing, model training, TreeSHAP algorithm selection, and computing SHAP values. Its core formula is as follows [30,31].
ø i = E F { i } E ! F E 1 ! F ! ( f ( E { i } ) f ( E ) )
where øi denotes the Shapley value of feature i, E represents the set that does not contain feature i, F expresses the set of all features, f(E) manifests the use of the predicted values in subset E.
To further enhance the credibility of the SHAP analysis, Table 1 provides a comparative assessment of the SHAP method against several traditional correlation analysis techniques. The evaluation focuses on key aspects such as computational efficiency, numerical data handling, time-sequential data, nonlinear data, and tolerance for missing values [29,30,31]. The traditional methods included in the comparison are the Pearson Correlation Coefficient (PCC) [32], Kendall’s Tau [33], Spearman’s Rank Correlation Coefficient (SRCC) [34], and the Chi-Square Test (CST) [35]. As illustrated in Table 1, the SHAP method achieves computational efficiency on par with Kendall’s Tau, though it is slightly less efficient than the PCC method. For numerical data, PCC demonstrates slightly better performance than SHAP. In terms of tolerance for missing values, SHAP and PCC perform similarly. However, the SHAP method excels over all other methods in its ability to handle nonlinear data. In conclusion, due to the highly nonlinear characteristics of the EIS data, the SHAP method stands out as the most appropriate choice for this application.

4. The Proposed SHAP–ASO–LightGBM ML Method

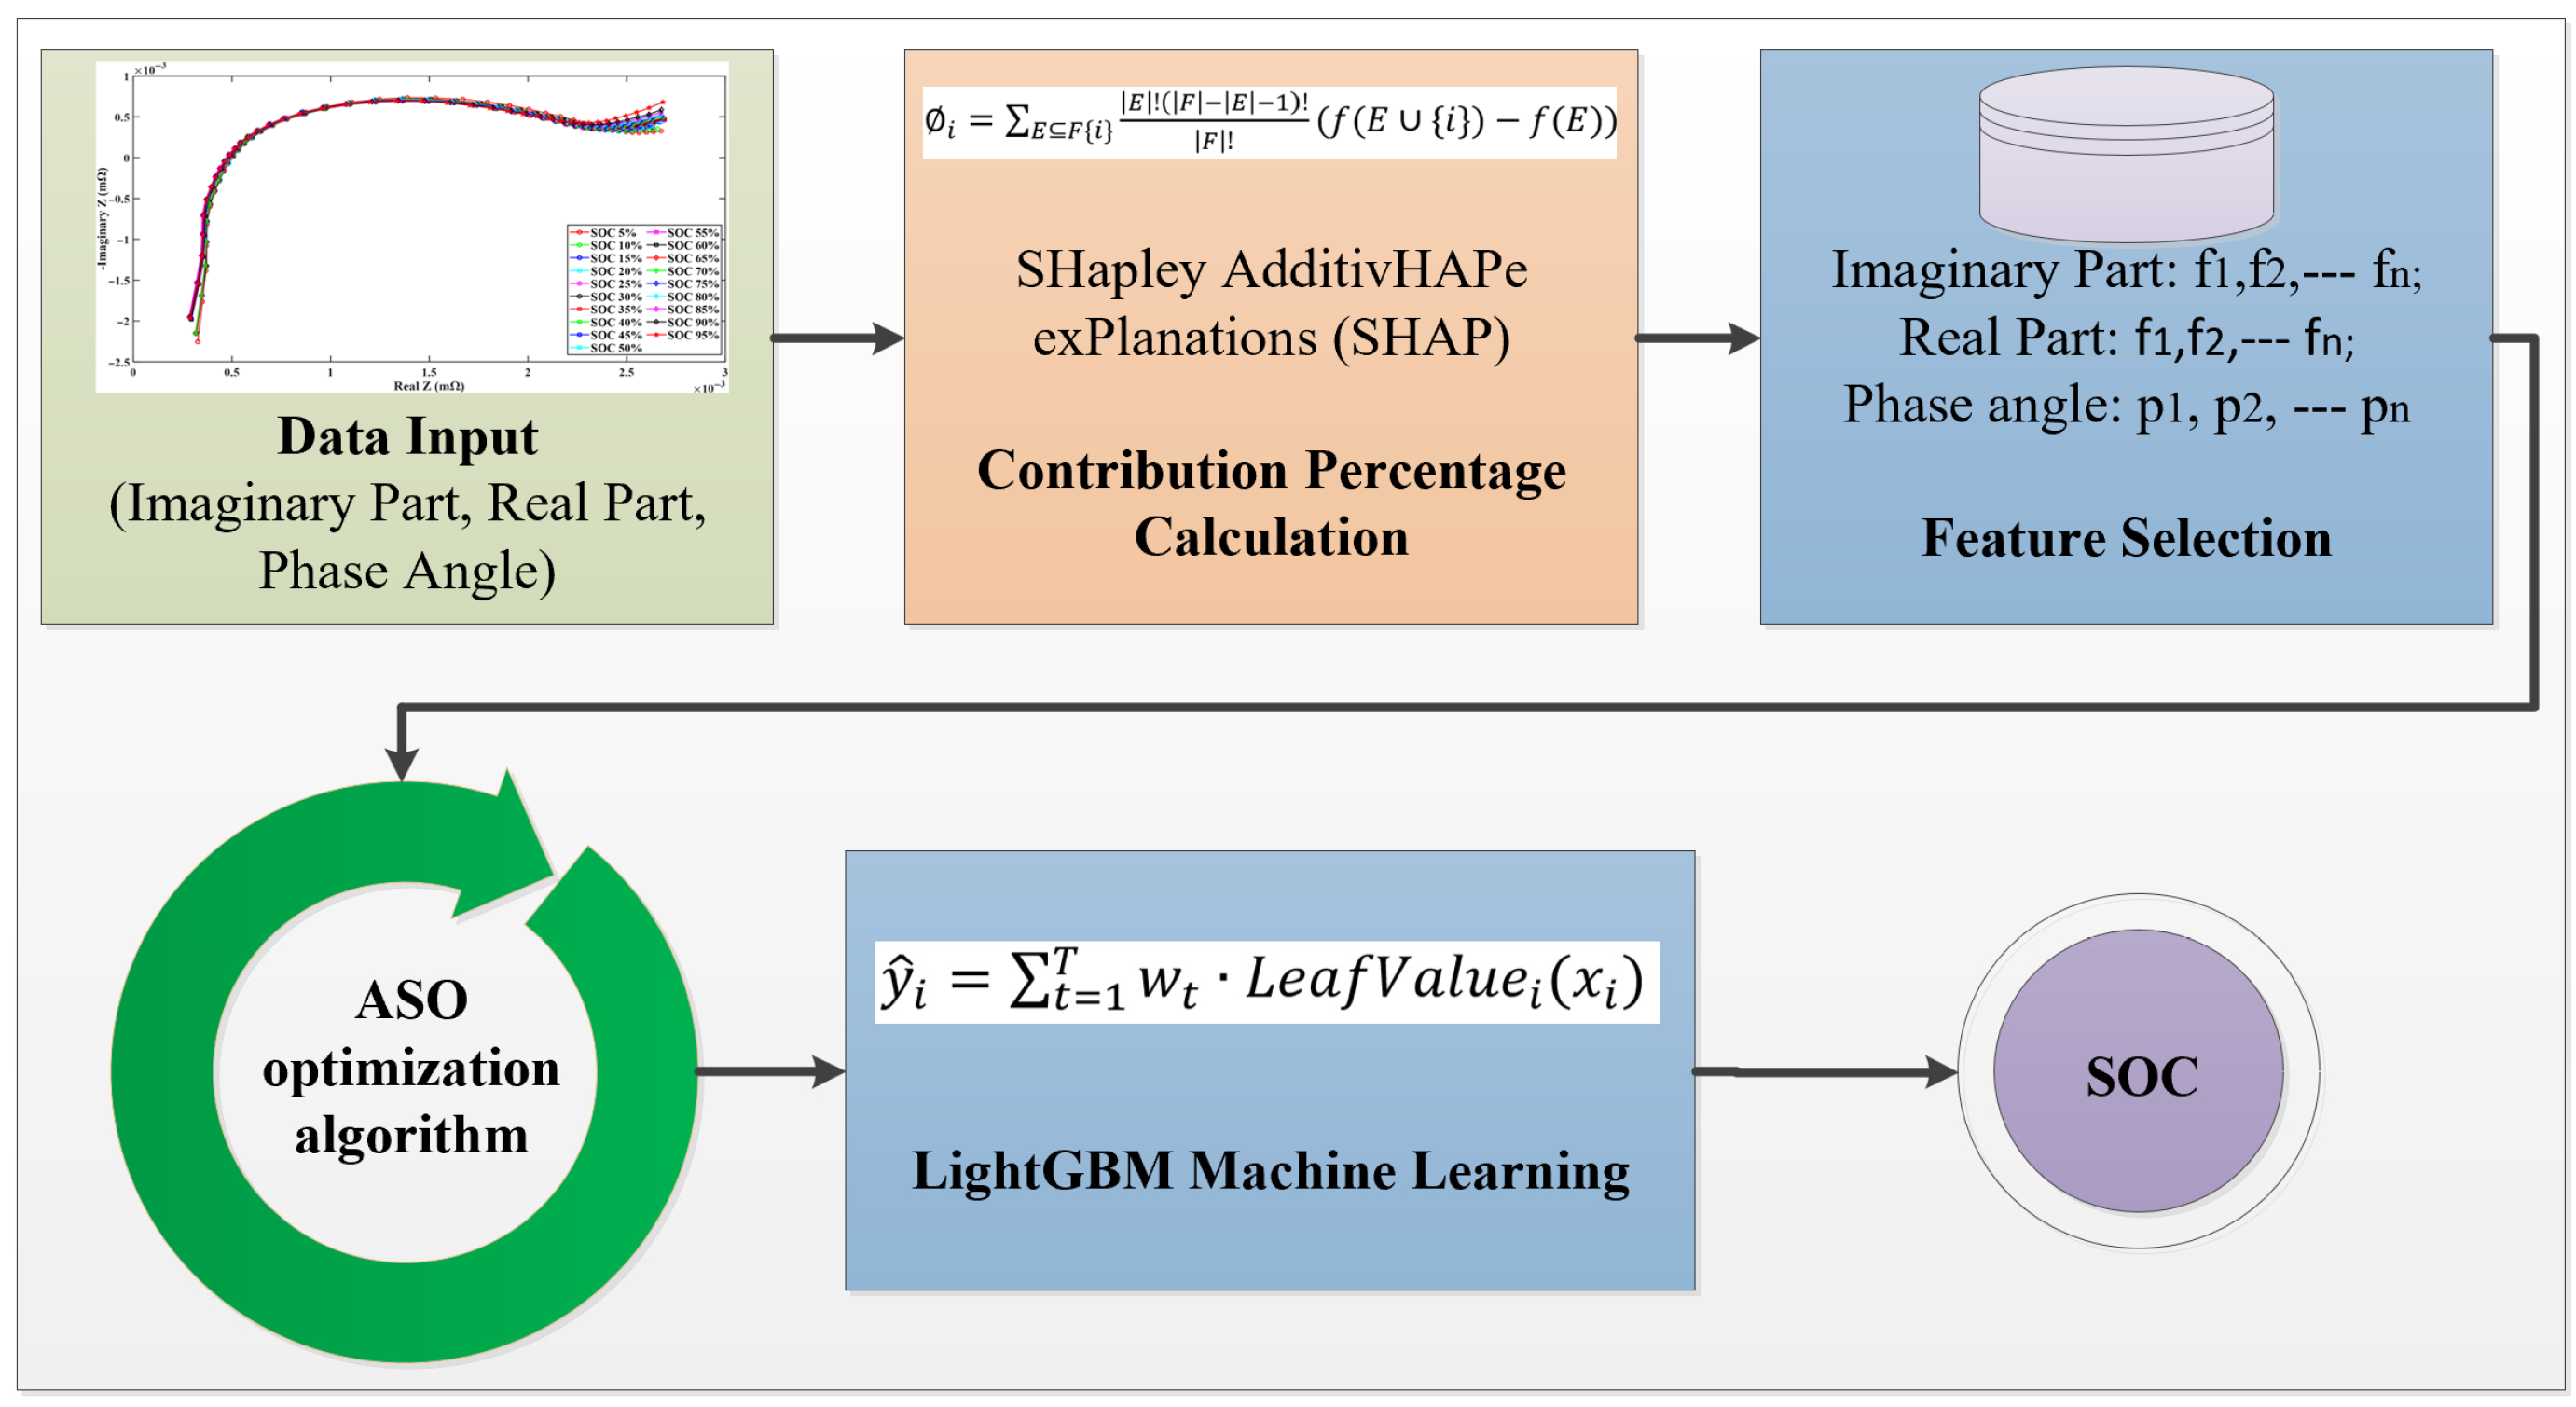
Building on the analysis and discussions presented/being presented in previous/coming sections, a SHAP (SHapley Additive exPlanations)–ASO (Atom Search Optimization)–LightGBM ML method was developed to explore the effectiveness of EIS for SOC estimation in larger-capacity batteries and to optimize solutions to existing challenges. The conceptual framework of the proposed ML approach is illustrated in Figure 7. The process begins with data input (detailed in Section 3.1), incorporating three key EIS-related parameters: the imaginary part, the real part, and the phase angle. These parameters are analyzed using a method that evaluates their contributions to the model output. SHAP quantifies the importance of each feature by calculating its marginal effect across various subset combinations, ensuring an equitable distribution of feature contributions (detailed in Section 3.2). Based on the SHAP values, the contribution percentages of each feature are calculated, transforming complex numerical outputs into intuitive percentage formats to facilitate the identification of key influencing factors. Next, the feature selection stage is initiated, where features with contribution percentages exceeding the average are extracted (further detailed in Section 5.2.2). This step minimizes redundant information and enhances computational efficiency. Following feature selection, the ASO (Atomic Search Optimization) algorithm is applied to optimize the hyperparameters of the LightGBM ML model (detailed in Section 4.1). The ASO algorithm employs a heuristic search inspired by the interaction forces between atoms to identify optimal hyperparameter configurations. Finally, the LightGBM ML framework is utilized for modeling (detailed in Section 4.2). LightGBM leverages an efficient histogram-based algorithm and a leaf-wise growth strategy driven by gain splitting to rapidly train gradient boosting decision tree models. Using the optimized feature set, the framework outputs prediction results with improved accuracy and efficiency.

4.1. Atom Search Optimization (ASO) Algorithms

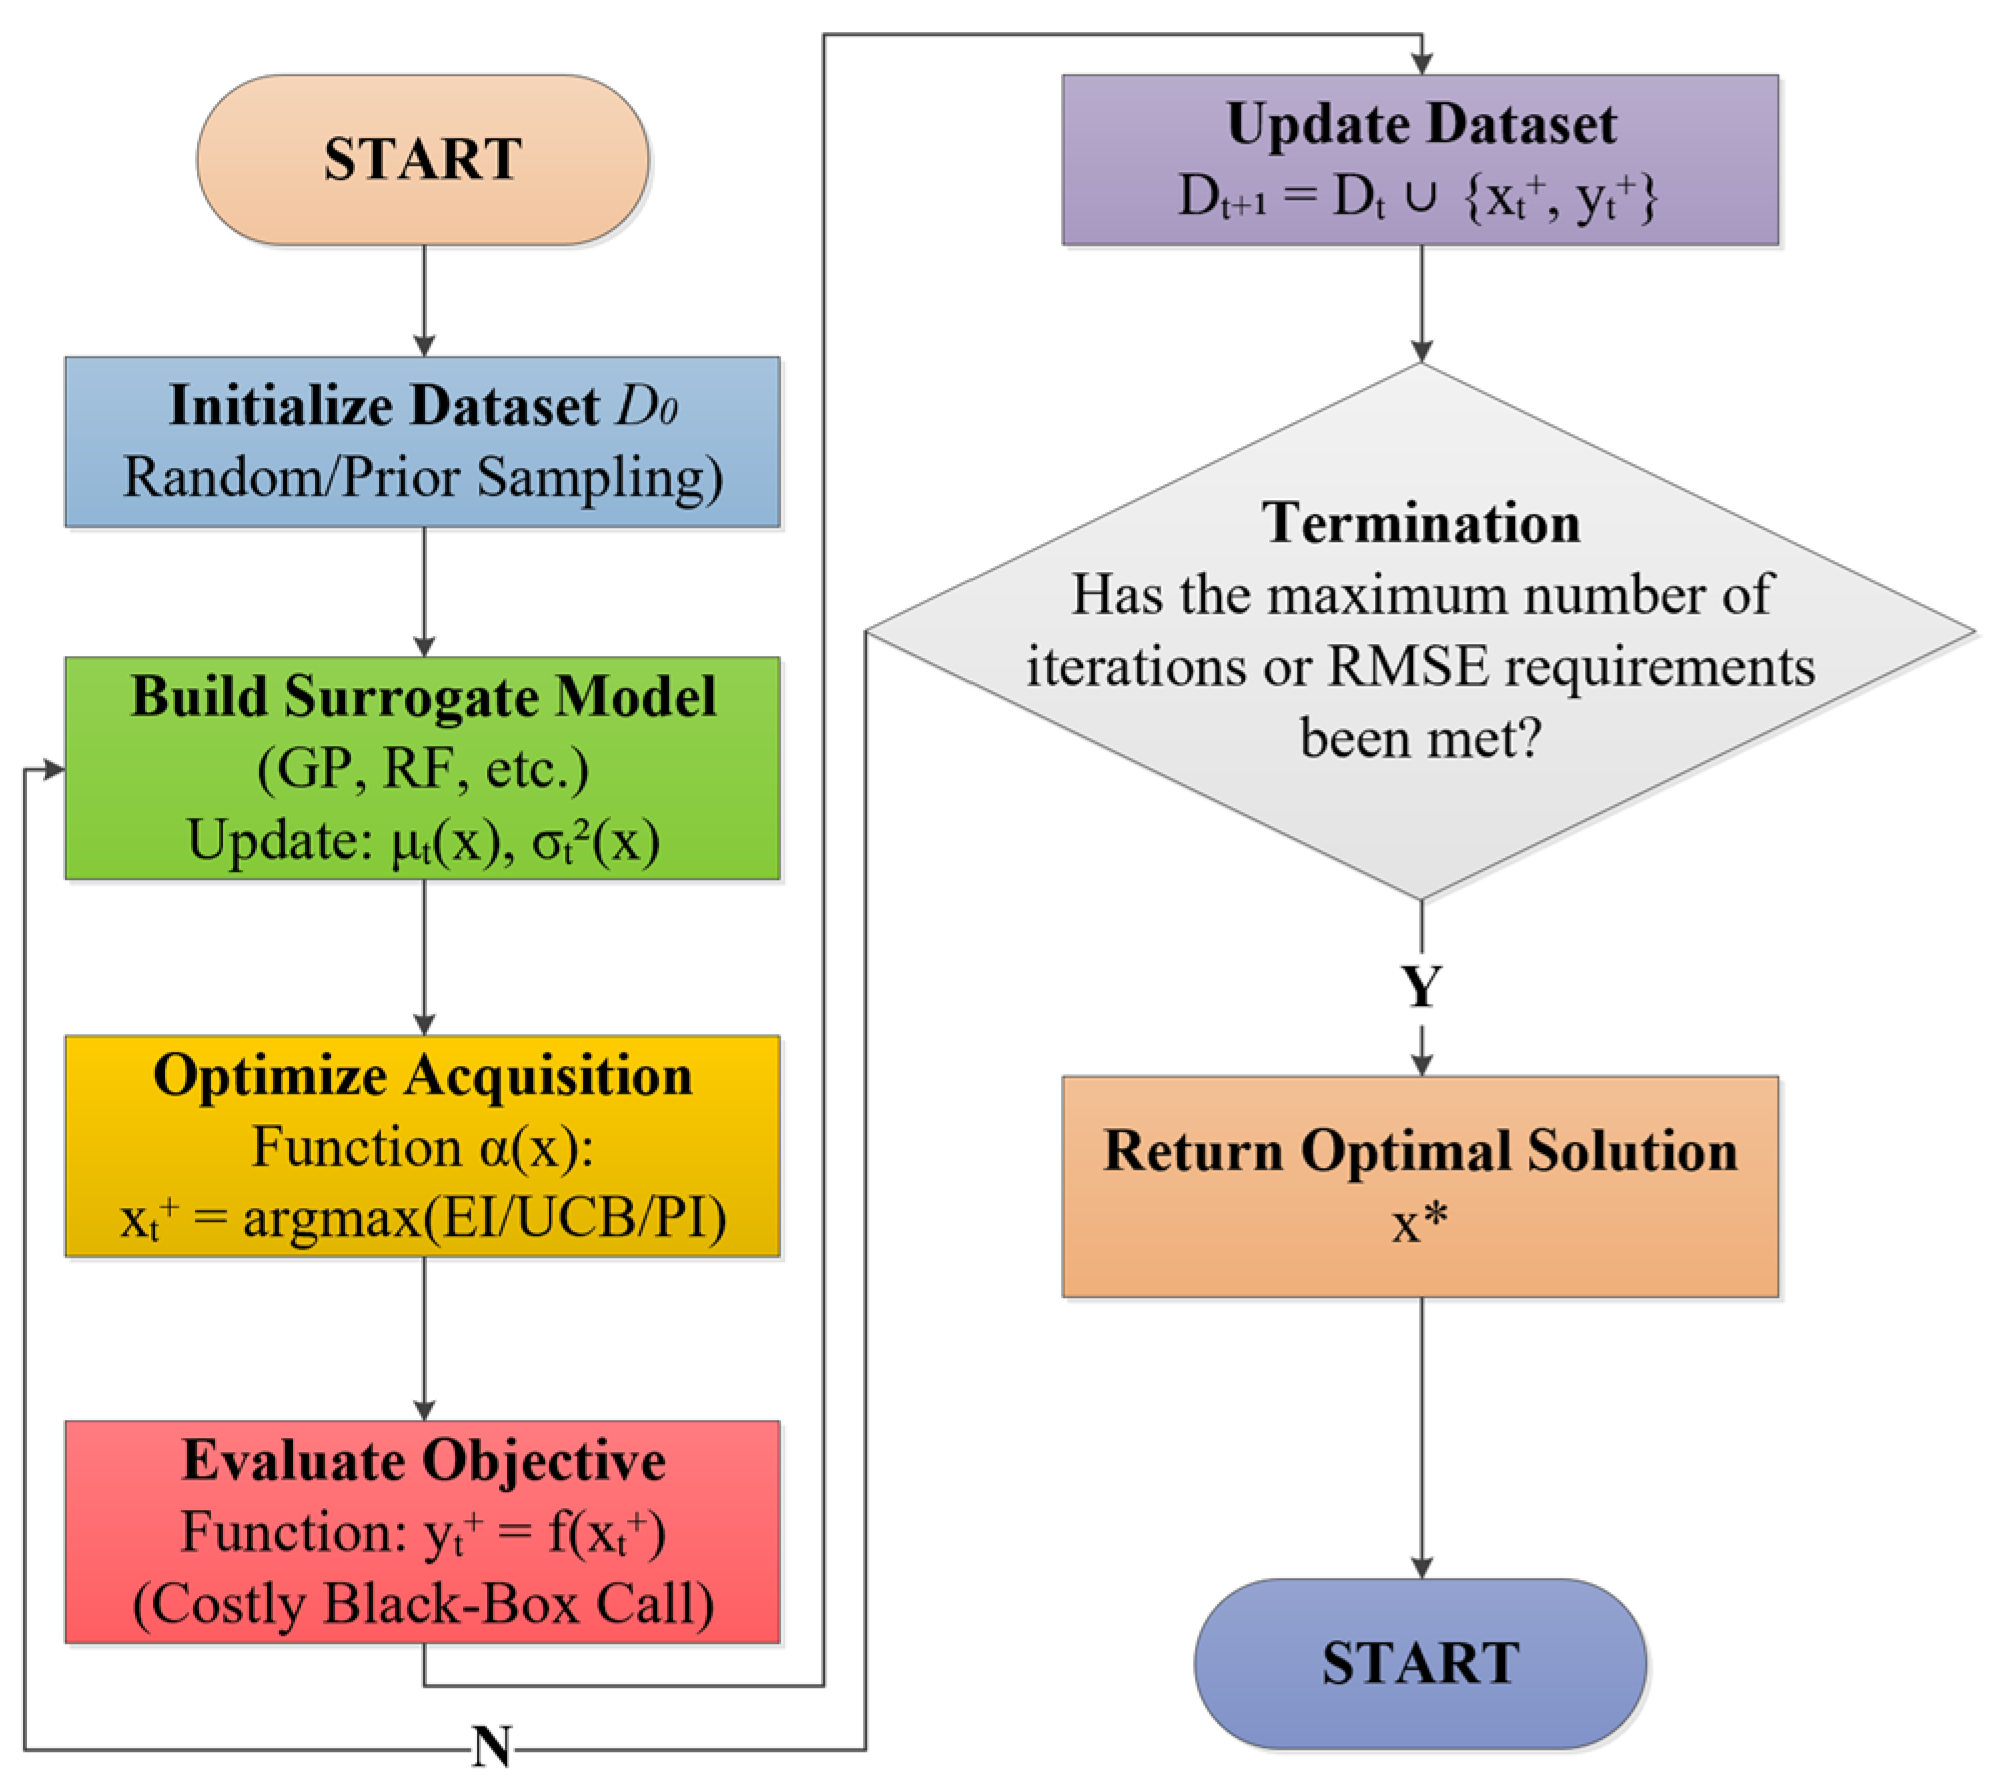
In the field of machine learning (ML), optimization algorithms are typically employed to improve the accuracy of estimation results by searching for the optimal hyperparameters of ML methods [36]. Common optimization algorithms include particle swarm optimization (PSO), genetic algorithm (GA), and simulated annealing (SA). However, PSO and GAs tend to easily fall into local optima [36], while SA algorithms are highly sensitive to the number of iterations, which may lead to missing the global optimum [37]. In [38], it demonstrates that atom search optimization (ASO) exhibits superior performance compared to PSO, GA, and SA. The ASO algorithm was developed by Weiguo Zhao et al. in 2019. It was a physics-inspired metaheuristic algorithm and was developed based on the principles of fundamental molecular dynamics, which formulated a mathematical model of atomic motion by considering interaction and binding forces [29]. In the ASO method, an Atom represents a candidate solution to an optimization problem, and the Mass is determined by the fitness value. The greater the mass, that is, the better the fitness, the better the solution. The working process of the ASO algorithm is shown in Figure 8, which mainly includes the following seven steps [38].
  • The first step is the initialization of the population, which randomly generates the initial positions of N atoms (Xi) within the search space. The following formula is utilized, where Xmax and Xmin is the upper and lower bounds of the search space, and rand is a uniformly distributed random number [0, 1].
    X i = X m i n + r a n d × ( X m a x X m i n )
  • The second step is to calculate the fitness value of each atom and record the current global optimal solution according to target function, which is expressed as follows.
    f i = f ( X i )
  • The third step is to calculate the interaction forces between atoms. Interaction forces include attractive and repulsive forces. Attraction can cause atoms to move towards a better solution (promoting local development applications). Repulsive force (Repulsion) can prevent the aggregation of atoms from converging prematurely (maintaining global exploration). The Coulomb force model is usually adopted in this step, which is shown as follows, where Fij and Fi express interaction forces and the resultant force, respectively. rij represents Euclidean distance between Xi and Xj, Ke manifests the Coulomb constant, and qi and qj represent the charge values, respectively.
    F i j = k e × q i q j r i j 2 × X j X i r i j
    F i = j N e i g h b o r s ( i ) F i j
  • The fourth step is to update the motion state of the atom, which includes the acceleration, velocity, and position of the atom according to Newton’s laws of motion, which are expressed as follows. Where ai represents acceleration, and mi represents mass. w is the inertia weight (hyperparameter, usually set to linearly decrease from 0.9 to 0.4), and Δt denotes the time step.
    a i = F i m i
    v i t + 1 = w · v i t + a i · Δ t
    x i t + 1 = x i t + v i t + 1 · Δ t
  • The fifth step is to update the global optimal solution. This process will compare the fitness values of all atoms and update the global optimal solution, which is represented as follows, where xbest represents the global optimal solution.
    x b e s t = a r g m i n i f ( x i )
  • The sixth step is to determine whether the maximum number of iterations or the global optimal solution has been reached. If it has been reached, the process ends; if not, it will continue to return to the third step for loop execution.

4.2. LightGBM Machine Learning Algorithms

The commonly used ML methods mainly include DNN [18], LSTM [26], GPR [27], etc. DNN relies on massive amounts of data, higher memory, and existing requirements. LSTM is sensitive to noise and requires data cleaning. The iterative calculation of sequences is computationally expensive. GPR relies on the design of the kernel function and is not suitable for high real-time online scenarios. In contrast, LightGBM has better interpretability, low memory occupancy, high noise robustness, is insensitive to missing values and outliers, efficient processing capability for structured non-strictly timed sequence data, and has high real-time prediction capability [39]. LightGBM is more suitable for structured data of EIS on small and medium scales.
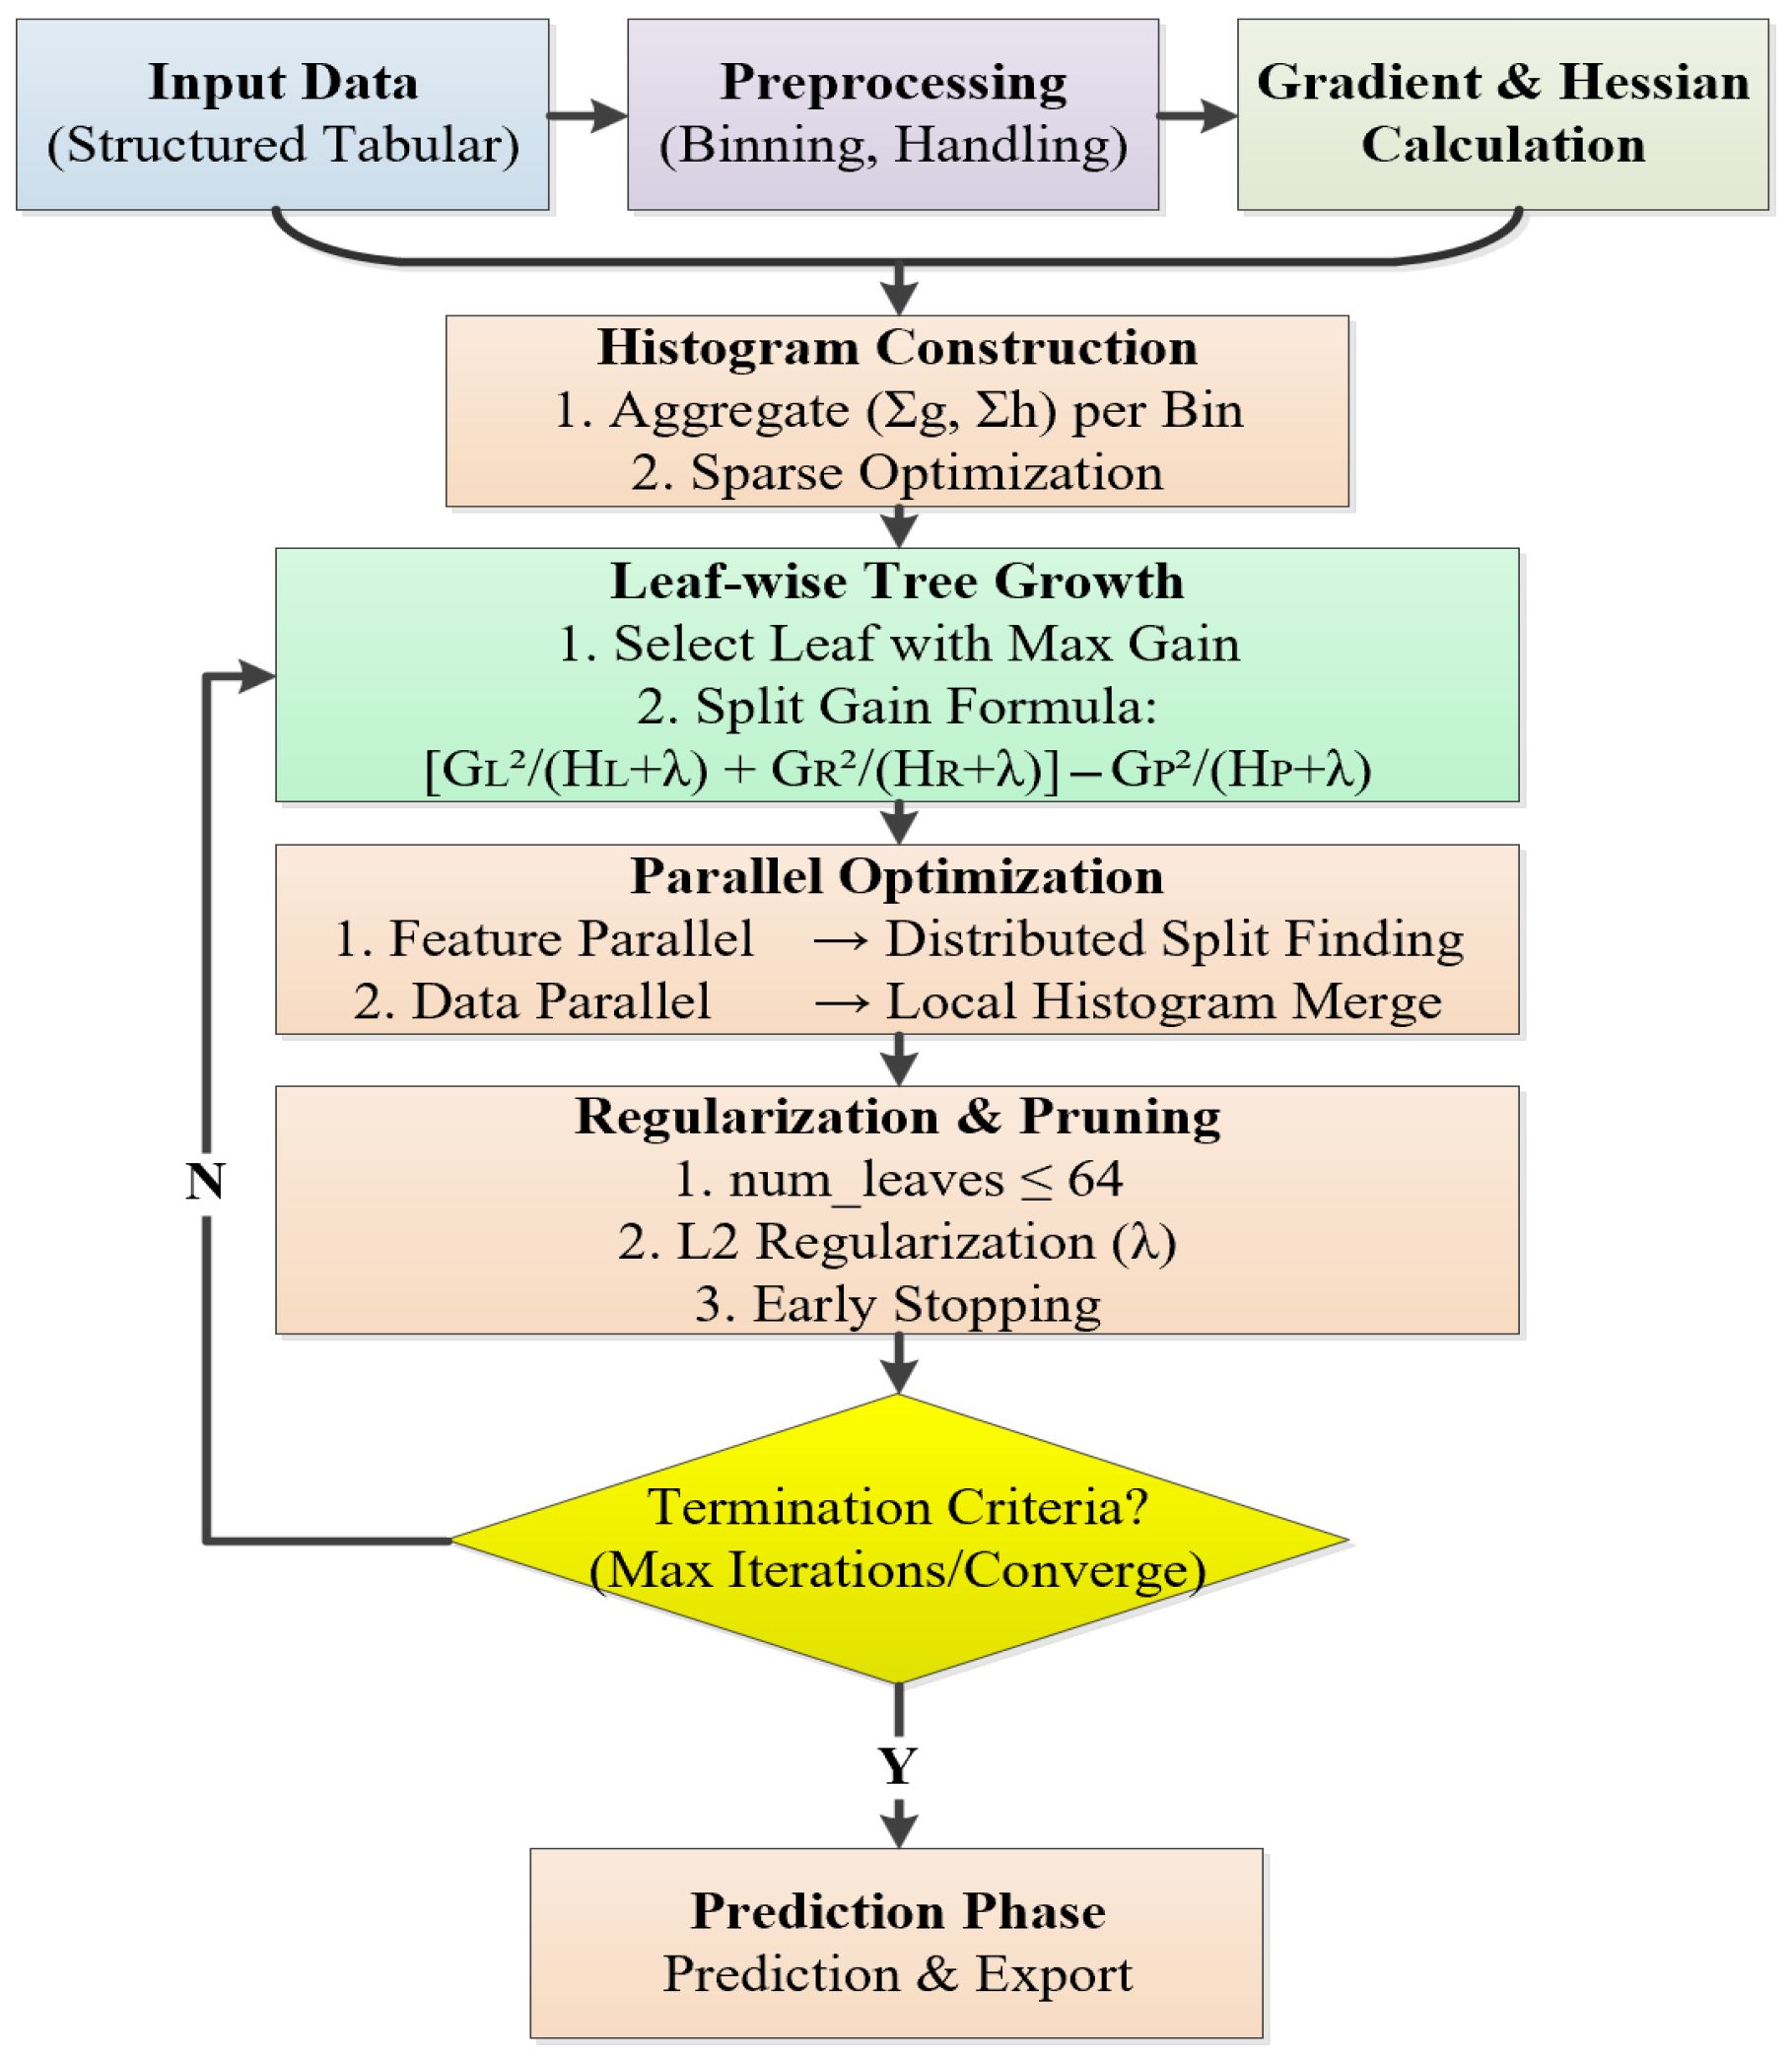
Light Gradient Boosting Machine (LightGBM) is a gradient boosting decision tree (GBDT) framework developed by Microsoft, specifically designed for efficient processing of large-scale data and high-dimensional features. Its core innovations include histogram-based learning, leaf-wise growth strategy, and parallel optimization, which make it significantly superior to traditional GBDT implementations (such as XGBoost) in terms of training speed, memory usage, and prediction accuracy [39]. The main principal framework of the LightGBM machine learning is presented in Figure 9, which primarily includes the following eight steps [39]:
  • The first step is data input, which should be in a structured tabular format.
  • The second step is Data Preprocessing, which mainly includes category feature processing: sorting by category occurrence frequency and binning to avoid dimension explosion. And continuous feature binning: discretizing into 256 intervals, which can be expressed by the following formula, where x is the original feature value, while xmin and xmax are the minimum and maximum values of this feature. Bin(x) is the discretized result of the feature value x after binning, with a value range from 0 to 255.
    B i n x = x x m i n x m a x x m i n × 255
  • The third step is the calculation of gradients, which can be expressed as follows. Where g i represents the first-order gradient, h i denotes second-order gradient.
    g i = L ( y i , y ^ i ) y ^ i
    h i = 2 L ( y i , y ^ i ) y ^ i 2
  • The fourth step is histogram construction, which mainly includes gradient aggregation and histogram storage. Gradient aggregation mainly accumulates the gradient g and the second derivative h for each bin of the feature. The histogram storage mainly stores the Gb and Hb of all bins, which can be formulated as follows.
    G b = i B i n b g i
    H b = i B i n b h i
  • The fifth step is tree growth, which employs a leaf-wise strategy to split nodes with maximum gain.
  • The sixth step is parallel optimization, mainly including feature parallelism and data parallelism. Feature parallelism mainly involves multiple machines/threads, respectively, handling the selection of split points for different features and merging the optimal results. Data parallelism mainly involves dividing the data into blocks, with each node independently constructing local histograms and merging them into a global histogram.
  • The seventh step is regularization and pruning strategies.
  • Finally, there is a model prediction and termination condition judgment. For each input sample, traverse the nodes of each tree and enter the left or right subtree based on the split condition. After reaching the leaf nodes, accumulate the predicted values of all trees and output the result. Then, the termination condition is judged. The process will be terminated when the maximum number of iterations is reached or the most appropriate convergence degree is achieved. The prediction values can be expressed as follows.
    y ^ i = t = 1 T w t · L e a f V a l u e i ( x i )

5. Results and Discussion

5.1. Simulation Settings and Performance Metrics

The proposed ASO–LightGBM with SHAP machine learning method, described in Section 4, was implemented using MATLAB R2023a for algorithm modeling and simulation. Electrochemical impedance spectroscopy (EIS) data—including the real and imaginary parts as well as the phase angles of the impedances—were collected during experiments conducted at 0 °C, with frequency samples ranging from 0.1 to 1000 Hz (as detailed in Section 5.2.1). These experiments utilized two LFP 3.2 V 104 Ah batteries, as summarized in Table 2. The testing temperature was set at 0 °C to optimize the experiment duration, as higher temperatures may require longer resting times (hours) between measurements [15]. EV battery packs are commonly equipped with heating systems to maintain their temperature within an optimal range (e.g., 0 °C to 55 °C). Although collecting EIS data across this full range would be valuable for practical applications, it requires significant time and effort (see Section 3.1). Since this study aims to (1) evaluate the feasibility of the proposed algorithm and (2) lay the groundwork for future experiments at other temperatures within this range, we initially focus on EIS data collection at 0 °C. For simulation performance evaluation, data from cell #01 were used as the training set and processed through the SHAP module for feature extraction (explained in Section 5.2.2). The extracted features were then input into the ASO–LightGBM framework for model parameter optimization and training. EIS data from cell #02 were used as the test set to validate the accuracy of the proposed method for SOC estimation. Eventually, the estimation results and algorithm performance were evaluated using metrics such as root mean square error (RMSE), mean absolute error (MAE), and R-squared (R2), as defined in references [3,18,26,27].
R M S E = 1 n i = 1 n ( S O C i S O C ^ i ) 2
M A E = 1 n i = 1 n S O C i S O C ^ i
R 2 = 1 S S r e s S S t o t

5.2. Feature Extraction of EIS Datasets

5.2.1. Feature Data Analysis

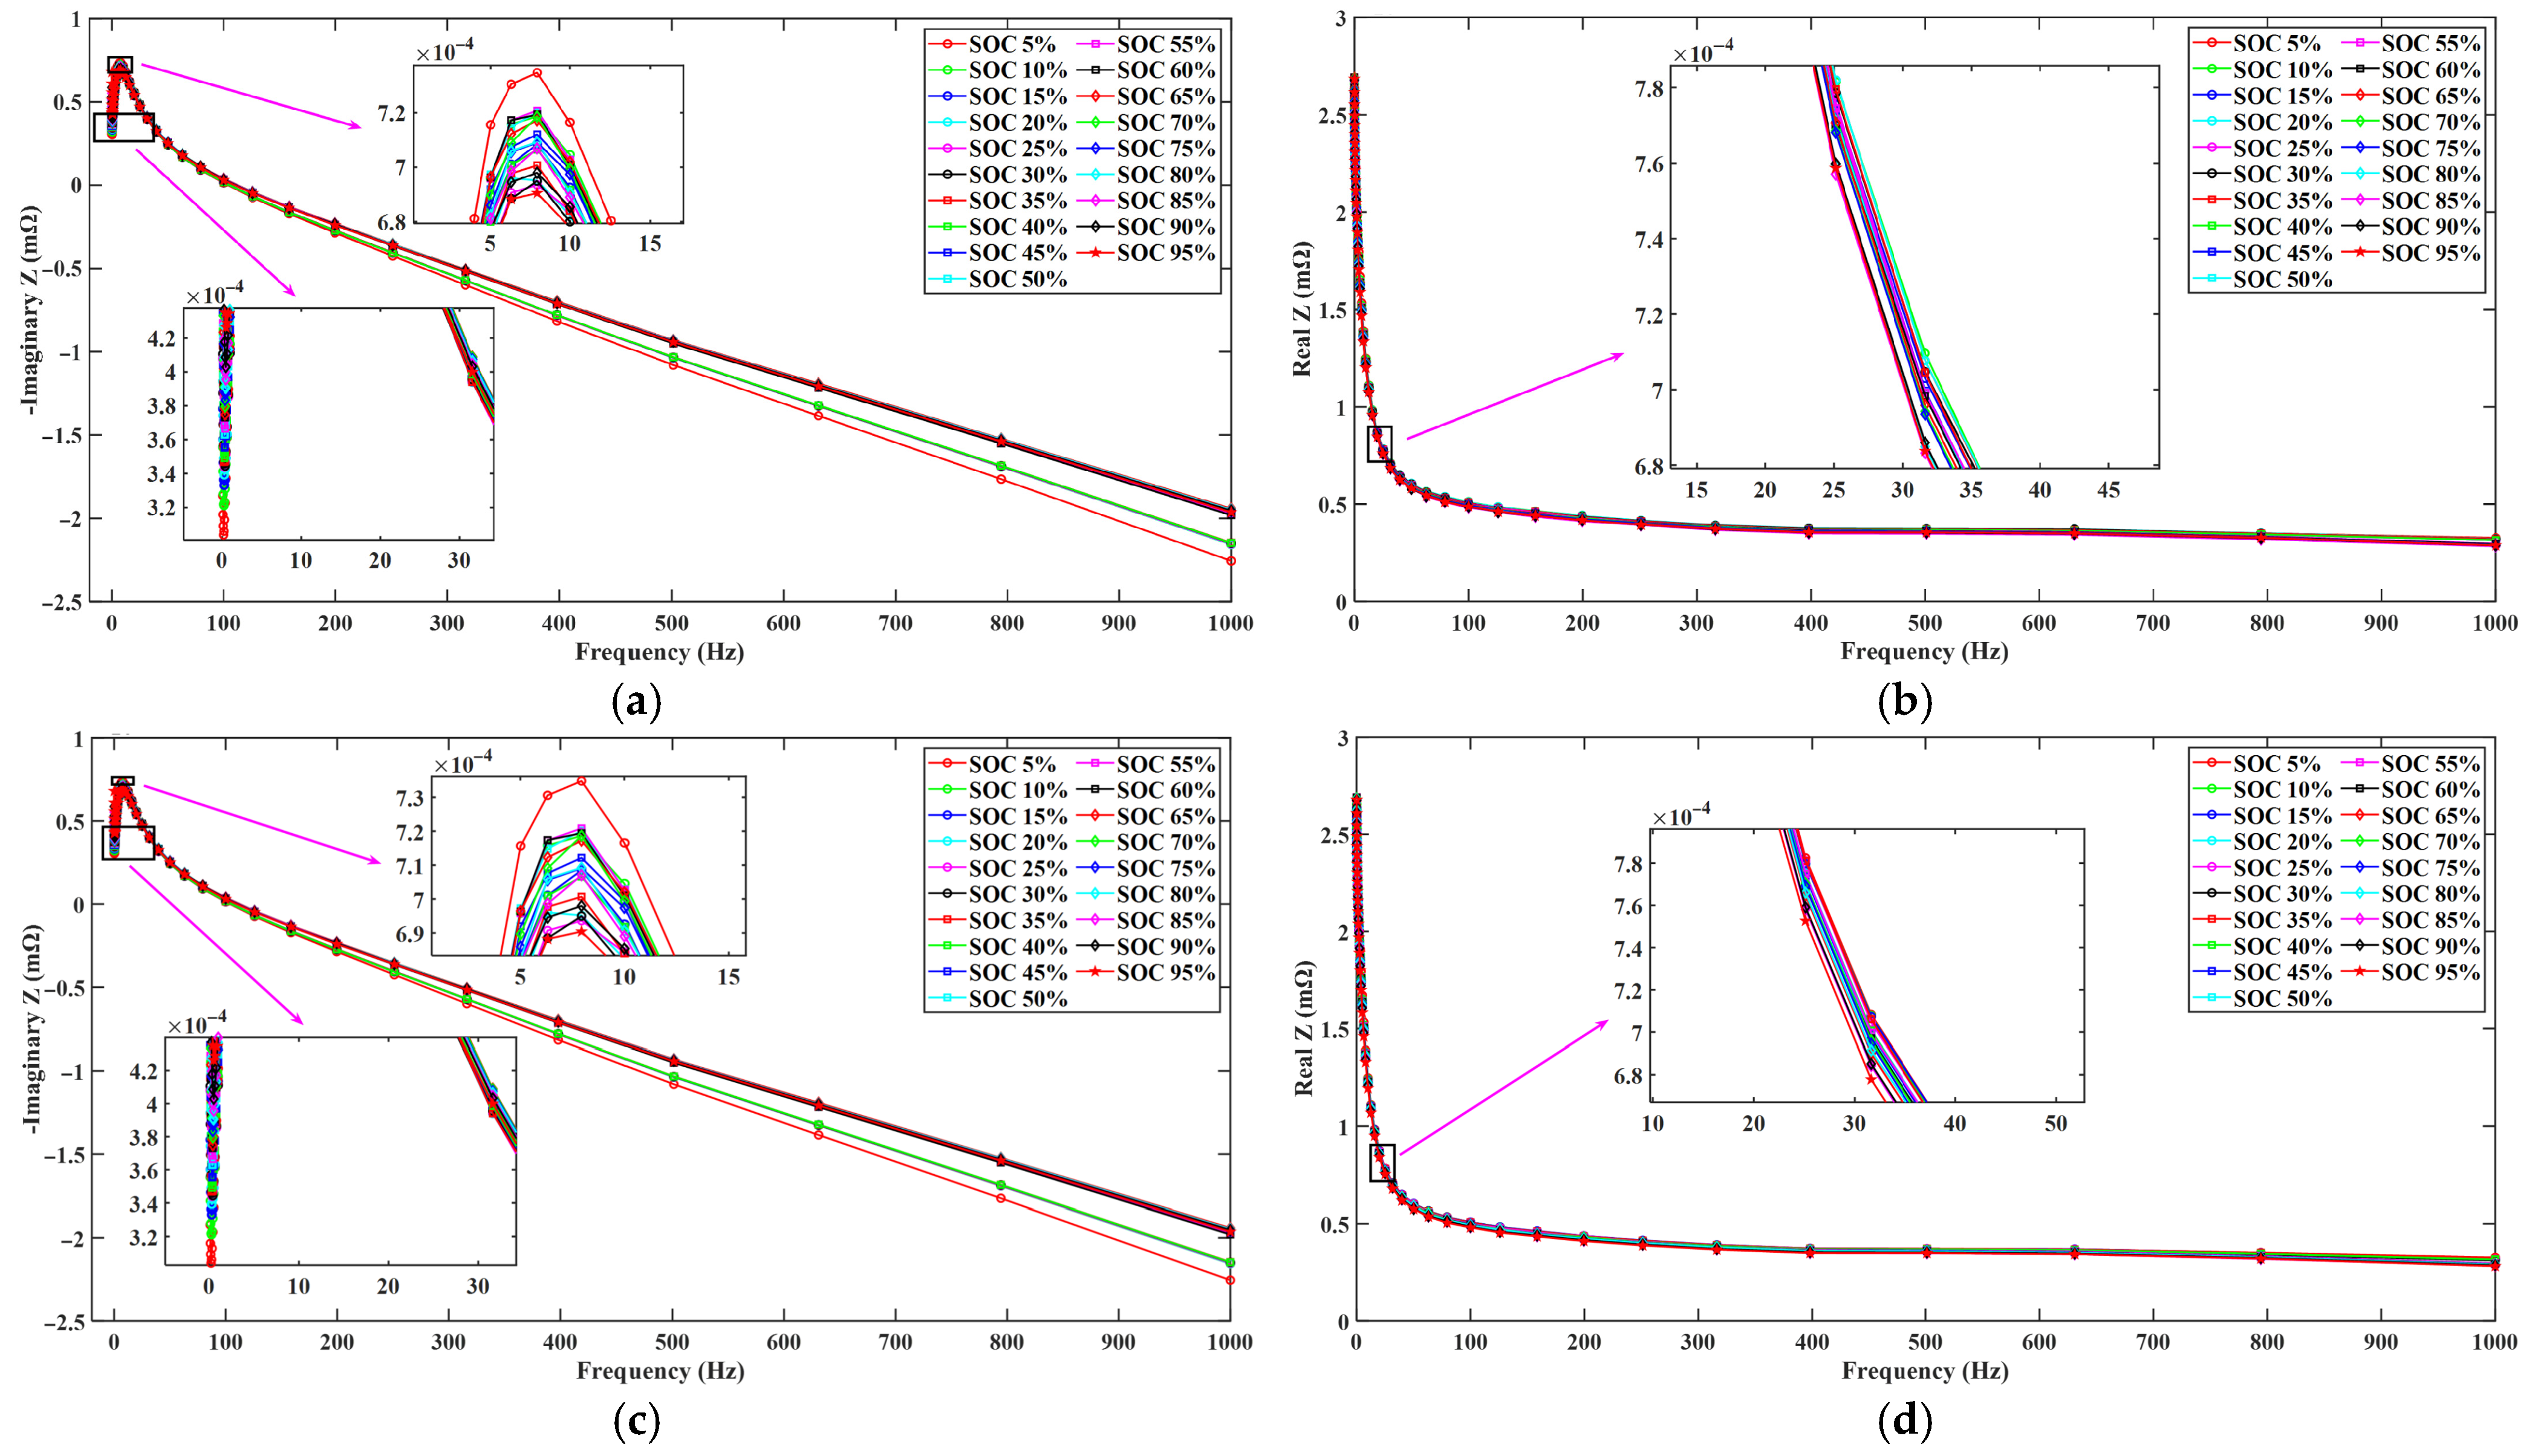
According to experimental environment and testing procedures in Section 3.1, Figure 10 presents the Nyquist plots of the EIS testing results of the SOC from 5% to 95% at 0 °C, tested for cell#01 and cell#02. Furthermore, in order to study the relationship between the imaginary and real parts of the EIS at different frequency points and the SOC, which are illustrated in Figure 11. Figure 11a and Figure 11c, respectively, show the imaginary part data of cell #01 and cell #02 at 0 °C, with the increase in frequency (0.1–1000 Hz), the imaginary impedance gradually decreases, reflecting the capacitive behavior (the polarization effect weakens at high frequencies). The imaginary impedance of the battery shows a significant U-shaped relationship with the state of charge (SOC), The imaginary impedance increases under extreme SOC (low 5–20%/high 90–95%), and the optimal operating range is the mid-range SOC (50–80%). Therefore, the imaginary part of impedance can be regarded as one of the important parameters for SOC estimation.
Figure 11b and Figure 11d, respectively, show the real part data of cell #01 and cell #02 at 0 °C, where the real impedance gradually decreases with the increase in frequency. At low frequencies, diffusion impedance dominates, and SOC sensitivity is high. High frequency: dominated by ohmic resistors, with low SOC sensitivity. At low frequencies, the real impedance mainly reflects the diffusion impedance (Warburg impedance), which is related to the transport of lithium ions in the electrode. Low frequency and low SOC (5–20%): The real impedance is relatively high. Due to the low lithium-ion concentration on the electrode surface, the diffusion resistance increases. In low frequencies, SOC (50–80%): The real impedance is the lowest, the diffusion process is efficient, and the ion transport resistance is the smallest. Low-frequency high SOC (90–95%): The real impedance rises again due to the saturation of electrode materials (such as limited lithium removal at the positive electrode), local depletion of the electrolyte, and restricted diffusion. At medium and high frequencies, the real impedance approaches the ohmic resistance, which is mainly determined by the ionic conductivity of the electrolyte and the contact resistance. Therefore, the real impedance under low-frequency conditions can also be used as one of the important parameters for estimating SOC.
Figure 12a and Figure 12b, respectively, show the phase angle data of cell #01 and cell #02 between multi-level SOC and frequency at 0 °C; the low-frequency phase angle is more negative (close to −40°), and the low-frequency extreme SOC (5%, 95%): the phase angle is slightly higher (such as −33° to −35°). Low-frequency mid-range SOC (50–80%): the phase angle is the most negative (such as −38° to −40°). In medium and high frequencies, the phase angle gradually decreases with the increase in frequency (the negative value decreases). Extreme SOC (5%, 95%): the negative phase angle is relatively small (such as −30° to −32°). Mid-stage SOC (50–80%): the negative phase angle is relatively large (such as −34° to −36°). The phase angle in the low-frequency region is more sensitive to the change in SOC, while the sensitivity in the high-frequency region decreases. Therefore, the phase angle in the low-frequency region can also be employed as one of the important parameters for estimating SOC.
Based on the analysis of the relationship characteristics between the three parameters of the real part, imaginary part, and phase angle, and SOC, respectively, as mentioned above, the imaginary part impedance, the real impedance under low-frequency conditions, and the phase angle at low frequencies can be adopted as vital parameters to estimate SOC values. Subsequently, in order to further analyze the importance and contribution of the specific characteristics of the three parameters in SOC estimation, the key characteristic parameters with higher contribution are further selected as input.

5.2.2. Contribution Percentage Analysis of Feature Data

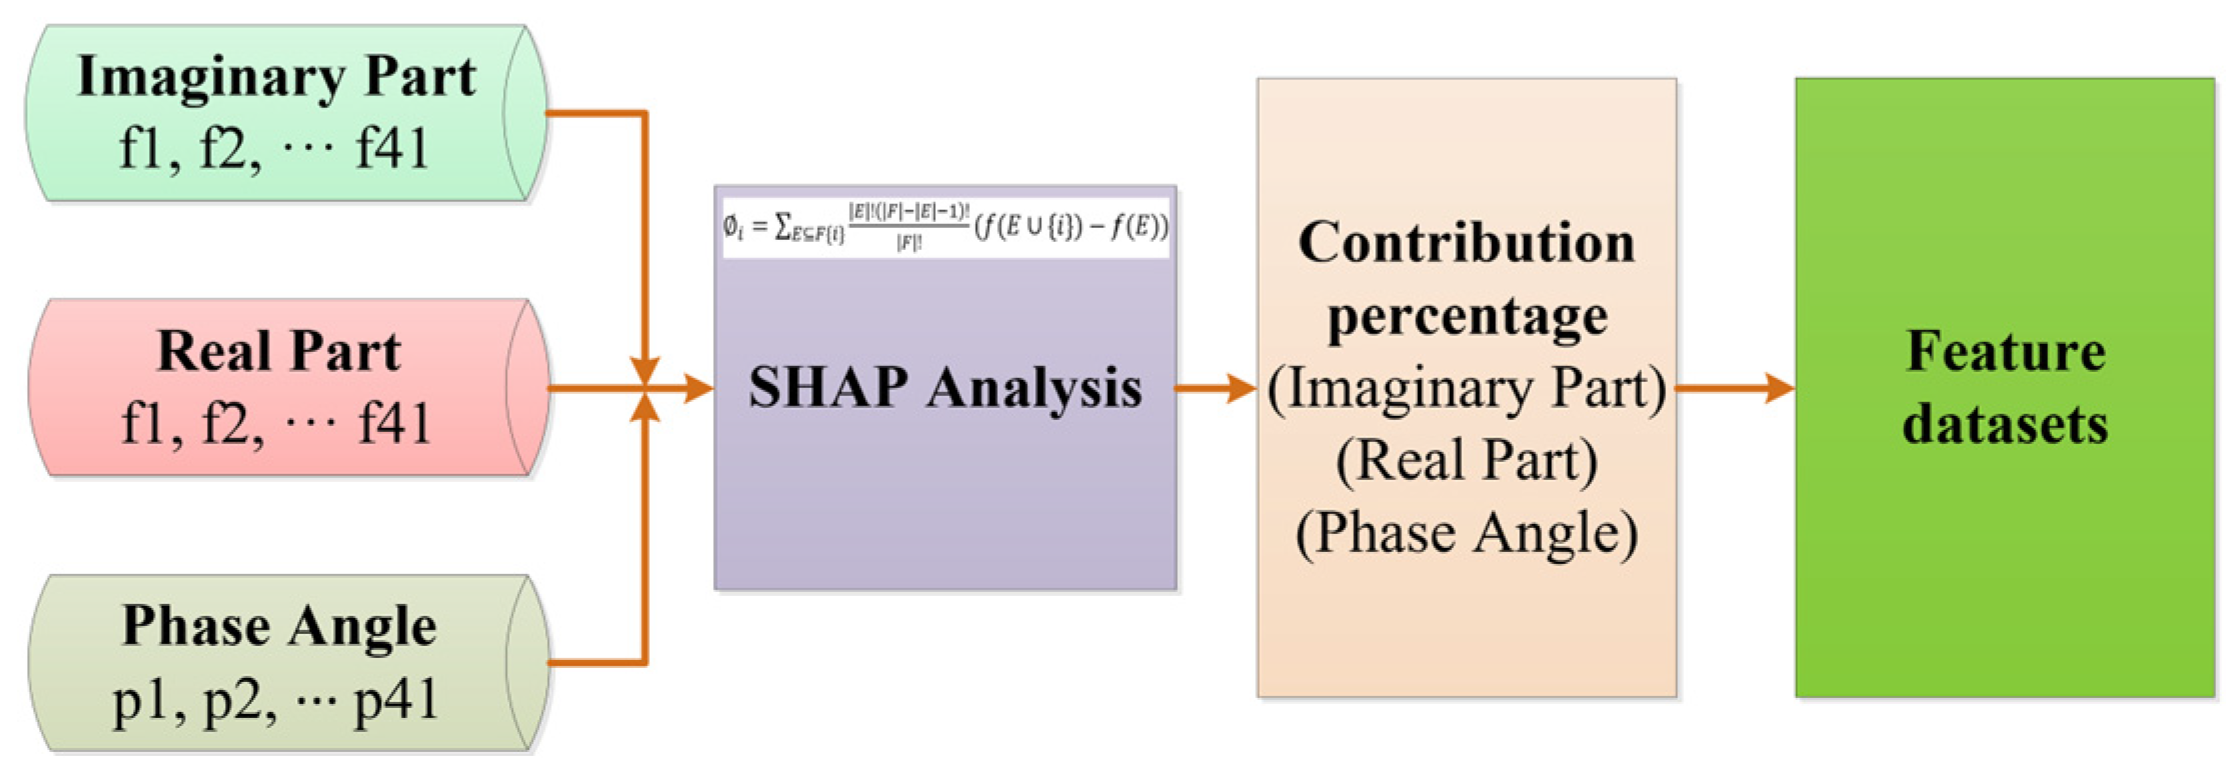
Figure 13 illustrates the feature selection process for these parameters. The EIS data spans a frequency range from 0.1 Hz to 1000 Hz, comprising 41 evenly distributed frequency points tested within this range, sequentially labeled as f1, f2, …, f41 from high to low frequency. Corresponding phase angles are denoted as p1, p2, …, p41. These features underwent analysis for feature extraction, during which the SHAP method was employed to calculate their contribution percentages. Frequency points with contribution percentages exceeding the mean were selected to form a refined feature dataset. This new dataset incorporates the imaginary part, real part, and phase angle data, which were chosen for SOC estimation.
Figure 14 illustrates the distribution of contribution percentages within the EIS datasets, encompassing the imaginary part (Figure 14a), real part (Figure 14b), and phase angle (Figure 14c). The extracted feature datasets are presented in Table 3 and will be used as inputs for SOC estimation.

5.3. Comparative Evaluation and Discussion

Table 4 demonstrates a detailed comparison of five machine learning (ML) methods—ASO–LightGBM with SHAP (A-LGBM-S), ASO–LightGBM with PCC (A-LGBM-P), LightGBM without ASO and with SHAP (LGBM-S), LSTM [26], and DNN [18] in terms of battery type, battery capacity, feature extraction methods, machine learning algorithms, estimation accuracy, and application scenarios. In LSTM [26] and DNN [18] methods, the NCM battery with 3.7 V/2.6 Ah and the NCM battery with 3.7 V/4.8 Ah are, respectively, investigated, and all datasets are separately employed as the input for the LSTM and DNN, and no feature extraction method (FEM) is adopted in both methods. Therefore, since no data dimensionality reduction is performed, all the data are employed as the input for training, which requires high computing power and is not suitable for online real-time BMS. It is more appropriate for offline high-computing-power systems. The three types of LightGBM methods in this study employ the LFP battery with larger capacity with 3.2 V/104 Ah. Both the proposed A-LGBM-S method and the LGBM-S method utilize the dimension-reduced data extracted by the SHAP method as the input. The A-LGBM-P method takes the dimension-reduced data processed by PCC as its input. Since these three LightGBM methods employ data dimensionality reduction algorithms, their demand for computing power is lower. Compared with the aforementioned LSTM [26] and DNN [18], these three LightGBM methods are more suitable for application in online real-time BMS.
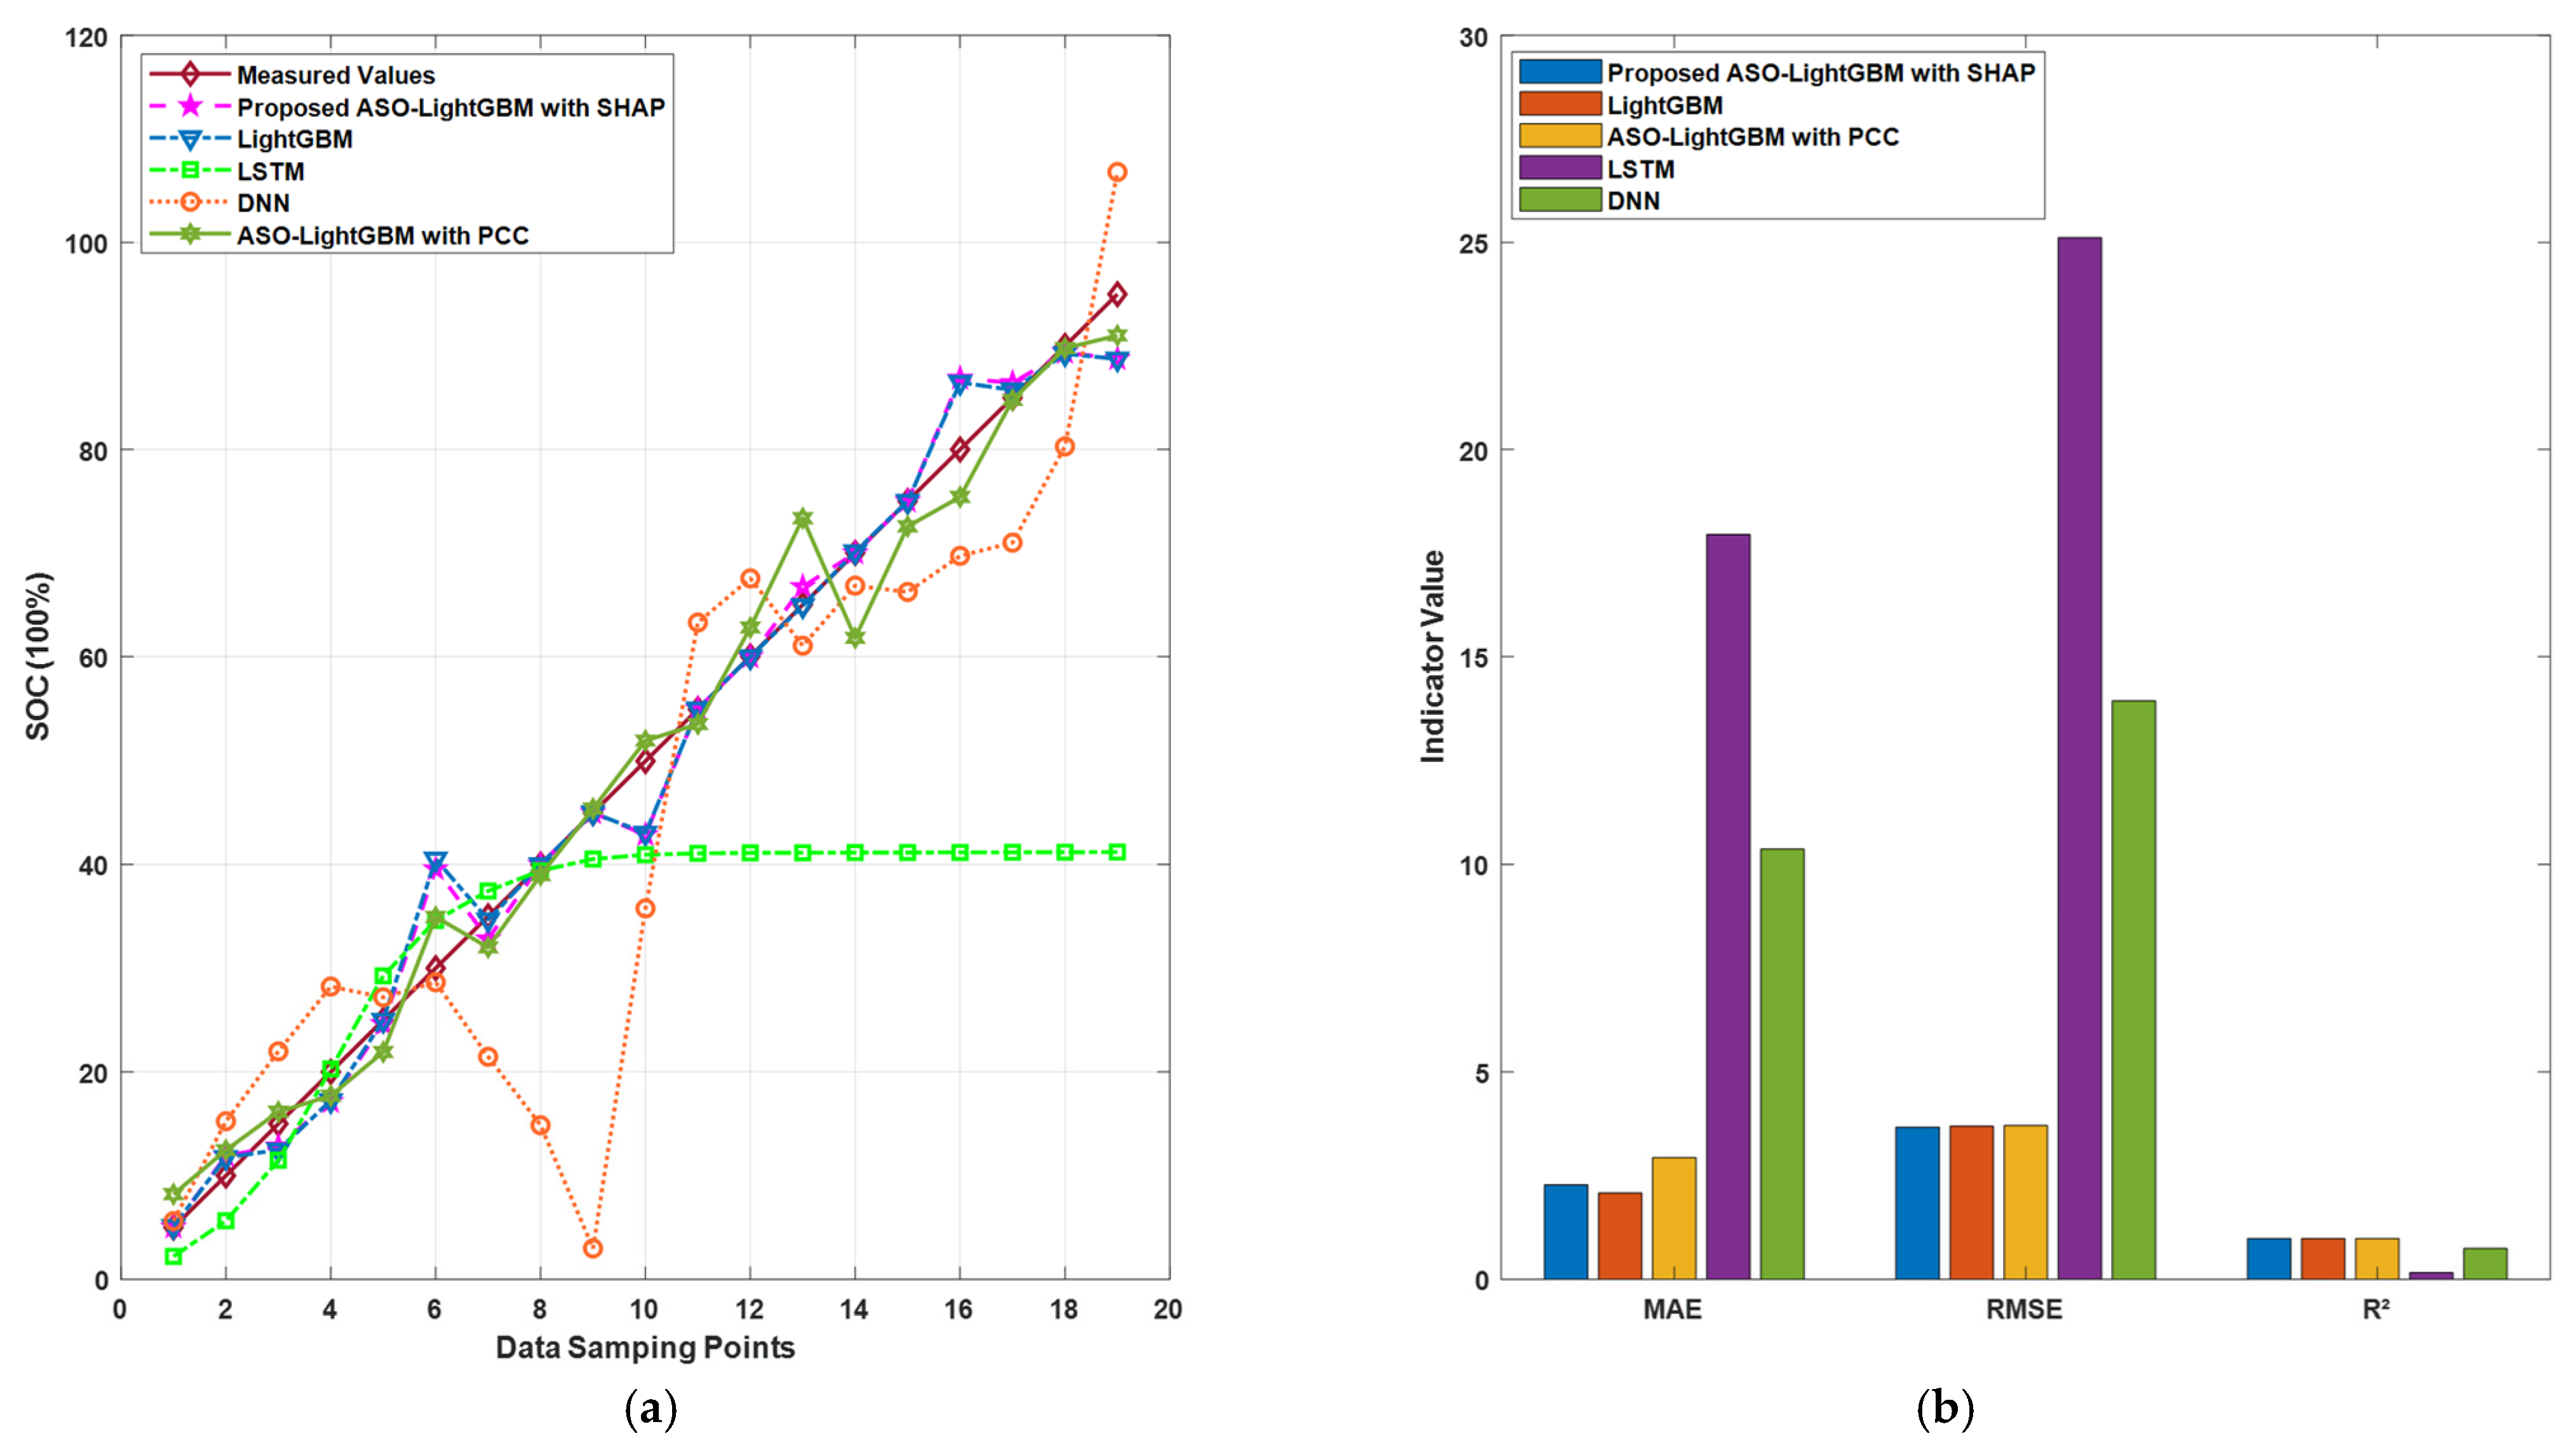
To present the estimation results of several machine learning methods in a more intuitive way, Figure 15 presents a systematic comparison of five machine learning (ML) models without k-fold cross-validation through (a) data trend visualization and (b) evaluation metrics.
In Figure 15a, the horizontal axis represents data sampling points, encompassing 19 points ranging from 5% to 95%, while the vertical axis denotes the SOC percentage. The “Measured Values” line represents the actual SOC data, while the other five lines correspond to the predictions of the respective models. Notably, the proposed ASO–LightGBM with SHAP (A-LGBM-S) model (labeled as “Proposed ASO–LightGBM with SHAP”) demonstrates the closest alignment with the measured values, particularly between sampling points 5 and 20, where its fluctuations are minimal. In contrast, LSTM and DNN exhibit significant deviations, indicating their limited ability to capture complex data patterns. The fluctuations of ASO–LightGBM with the PCC (A-LGBM-P) method are the closest to the proposed A-LGBM-S method.
Figure 15b evaluates model performance using three metrics: Mean Absolute Error (MAE), Root Mean Squared Error (RMSE), and Coefficient of Determination (R2). The proposed ASO–LightGBM with SHAP (A-LGBM-S) method achieves an RMSE of 3.67%, an MAE of 2.28%, and an R2 of 0.982. In comparison, the ASO–LightGBM with PCC (A-LGBM-P) generates an RMSE of 3.71%, an MAE of 2.93%, and an R2 of 0.981. The LightGBM method without ASO and with SHAP (LGBM-S) records a RMSE of 3.69%, an MAE of 2.08%, and an R2 of 0.981. The LSTM method yields an RMSE of 25.12%, an MAE of 17.94%, and an R2 of 0.159, while the DNN method produces an RMSE of 13.95%, an MAE of 10.37%, and an R2 of 0.74. The proposed A-LGBM-S model achieves the lowest error values and the highest R2, outperforming all baseline models. While the A-LGBM-P method ranks second, its error metrics remain higher than those of the proposed A-LGBM-S method, which denotes that the SHAP feature extraction method outperforms the PCC method in dealing with nonlinear problems. The LGBM-S method ranks third; its error metrics are higher than those of the proposed A-LGBM-S method, which indicates the significance of optimizing algorithms in the application of LightGBM machine learning. LSTM and DNN demonstrate inferior regression performance, with significantly higher errors and lower R2 values. The superior performance of the proposed ASO–LightGBM method with SHAP can be attributed to its integration of the ASO algorithm and the SHAP method with the LightGBM framework, which effectively extracts the key feature parameters and dynamically optimizes hyperparameters and feature weights to improve nonlinear pattern fitting and enhance resilience to noise. These findings underscore the effectiveness of the hybrid ASO–LightGBM with SHAP model, highlighting its precision and stability, particularly in regression tasks involving high noise levels or complex interactions.
Using a single test set for model validation may fail to adequately capture its generalization capability. To ensure a comprehensive evaluation of the proposed method’s performance, we employed k-fold cross-validation [40,41] for both the ASO–LightGBM with SHAP and ASO–LightGBM with PCC approaches. The experimental dataset was divided into five (k = 5) equally sized subsets, with each iteration utilizing four subsets for training and the remaining subset for testing. After completing five iterations, the average performance across all test folds was calculated to provide a robust evaluation metric.
As presented in Table 5, the k-fold cross-validation comparative analysis demonstrates that the SHAP-based feature extraction method significantly outperforms the PCC approach in capturing nonlinear relationships within the data, consistent with the findings in Table 4. Furthermore, all performance indicators (RMSE, MAE, and R2) exhibit improved values compared to those reported in Table 4. While requiring additional computational resources for repeated training, this cross-validation approach provides a more robust performance assessment than single-test-set evaluation by substantially reducing potential biases from data partitioning.

6. Conclusions

This study presents a hybrid SOC estimation framework for large-capacity lithium iron phosphate batteries by integrating EIS technology with the SHAP–ASO–LightGBM machine learning model. Experimental validation on 3.2 V 104 Ah LFP cells under 0 °C conditions demonstrated that EIS-derived frequency-domain features, particularly low-frequency impedance and phase angle, exhibit strong sensitivity to SOC variations. The SHAP method effectively identified critical features, reducing input dimensionality and enhancing model robustness. By optimizing LightGBM hyperparameters via the ASO algorithm, the proposed method achieved superior accuracy (RMSE: 3.3%, MAE: 1.86%, R2: 0.99) compared to LightGBM without optimization, traditional DNN, and LSTM models, which showed significant errors. These results underscore the advantages of combining interpretable feature selection with metaheuristic optimization for SOC estimation in high-capacity LIBs.
In the future research plan, this framework will be expanded to cover multiple temperature scenarios, and its applicability in health status (SOH) estimation will be explored, as well as its application performance verification in other chemical system batteries. We will conduct further research on the application of this technology in an actual battery management system (BMS). This will further advance the BMS for electric vehicles and renewable energy storage.

Author Contributions

Conceptualization, P.H., C.Y.L. and C.C.L.; methodology, P.H.; software, P.H.; validation, P.H.; formal analysis, P.H., and C.Y.L.; investigation, P.H.; resources, P.H. and C.C.L.; data curation, P.H.; writing—original draft preparation, P.H.; writing—review and editing, P.H. and C.Y.L.; visualization, P.H.; supervision, C.Y.L. and C.C.L.; project administration, P.H., C.Y.L. and C.C.L.; funding acquisition, C.C.L. All authors have read and agreed to the published version of the manuscript.

Funding

This work was supported by the Hong Kong SAR Research Grants Council (RGC) under the Faculty Development Scheme (Project Nos. UGC/FDS16/E04/21, UGC/FDS16/E10/22, and UGC/FDS16/E05/23) and the Research Matching Grant Scheme (Project No. 2021/3008), as well as internal funding from Hong Kong Metropolitan University (Grant No. R6732).

Data Availability Statement

The data used to support the findings of this study are included within this article.

Conflicts of Interest

The authors declare no conflicts of interest.

Abbreviations

The following abbreviations are used in this manuscript:
ASOAtomic search optimization
A-LGBM-SASO–LightGBM with SHAP
A-LGBM-PASO–LightGBM with PCC
BMSBattery management system
DNNDeep neural network
EISElectrochemical impedance spectroscopy
EVsElectric vehicles
ESSEnergy storage system
FEMFeature extraction method
LSTMLong short-term memory
LIBsLithium-ion batteries
LightGBMLight Gradient Boosting Machine
LGBM-SLightGBM method without ASO and with SHAP
MLMachine learning
MAEMean Absolute Error
PCCPearson correlation coefficient
RMSERoot Mean Squared Error
R2Coefficient of Determination
SOCState of charge
SHAPSHapley Additive exPlanations

References

  1. Chai, H.; Gao, Z.; Jiao, Z.; Zhou, B. State of charge estimation of lithium-ion batteries with unknown parameters using an adaptive fractional-order center difference Kalman filter. Measurement 2025, 247, 116705. [Google Scholar] [CrossRef]
  2. Monsalve, G.; Acevedo-Bueno, D.; Cardenas, A.; Martinez, W. An Improved ECM-Based State-of-Charge Estimation for SLA and LFP Batteries Used in Low-Cost Agricultural Mobile Robots. IEEE Access 2024, 12, 146265–146276. [Google Scholar] [CrossRef]
  3. Hu, P.; Tang, W.F.; Li, C.H.; Mak, S.-L.; Li, C.Y.; Lee, C.C. Joint State of Charge (SOC) and State of Health (SOH) Estimation for Lithium-Ion Batteries Packs of Electric Vehicles Based on NSSR-LSTM Neural Network. Energies 2023, 16, 5313. [Google Scholar] [CrossRef]
  4. Shu, X.; Li, Y.; Wei, K.; Yang, W.; Yang, B.; Zhang, M. Research on the output characteristics and SOC estimation method of lithium-ion batteries over a wide range of operating temperature conditions. Energy 2025, 317, 134726. [Google Scholar] [CrossRef]
  5. Xiong, X.; Wang, S.L.; Fernandez, C.; Yu, C.M.; Zou, C.Y.; Jiang, C. A novel practical state of charge estimation method: An adaptive improved ampere-hour method based on composite correction factor. Int. J. Energy Res. 2020, 44, 11385–11404. [Google Scholar] [CrossRef]
  6. Yang, N.; Zhang, X.; Li, G. State of charge estimation for pulse discharge of a LiFePO4 battery by a revised Ah counting. Electrochim. Acta 2015, 151, 63–71. [Google Scholar] [CrossRef]
  7. Meng, S.; Meng, F.; Chi, H.; Chen, H.; Pang, A. A robust observer based on the nonlinear descriptor systems application to estimate the state of charge of lithium-ion batteries. J. Frankl. Inst. 2023, 360, 11397–11413. [Google Scholar] [CrossRef]
  8. Chen, G.; Zhou, H.; Ba, T.; Xu, Y.; Yang, J.; Xiao, R.; Pan, N.; Gong, H. Online joint estimation of state of charge and state of health based on equivalent circuit model with limited test time for lithium-ion batteries. Sens. Actuators A Phys. 2025, 383, 116250. [Google Scholar] [CrossRef]
  9. Guo, W.; Wang, Q.; Li, G.; Xie, S. Dual-time scale collaborative estimation of SOC and SOH for lithium-ion batteries based on FOMIRUKF-EKF. Comput. Electr. Eng. 2025, 123, 110048. [Google Scholar] [CrossRef]
  10. Hu, P.; Tsang, C.-W.; Lu, X.-Y.; Li, C.Y.; Lee, C.C. Enhancing Electric Wheelchair Safety via Battery State of Charge Estimation With PCC–NSSR–LSTM Method. Electron. Lett. 2025, 61, e70228. [Google Scholar] [CrossRef]
  11. Gao, Y.; Liu, K.; Zhu, C.; Zhang, X.; Zhang, D. Co-Estimation of State-of- Charge and State-of- Health for Lithium-Ion Batteries Using an Enhanced Electrochemical Model. IEEE Trans. Ind. Electron. 2022, 69, 2684–2696. [Google Scholar] [CrossRef]
  12. Yang, R.; Li, Z.; Chen, Z.; Ali, M.S.; Chen, G. Fast State-of-Charge Estimation for Lithium-Ion Batteries Using a Simplified Electrochemical Model Without Initial State Restrictions. IEEE Trans. Transp. Electrif. 2024, 10, 4159–4172. [Google Scholar] [CrossRef]
  13. Yang, K.; Tang, Y.; Zhang, S.; Zhang, Z. A deep learning approach to state of charge estimation of lithium-ion batteries based on dual-stage attention mechanism. Energy 2022, 244, 123233. [Google Scholar] [CrossRef]
  14. Cui, Z.; Kang, L.; Li, L.; Wang, L.; Wang, K. A hybrid neural network model with improved input for state of charge estimation of lithium-ion battery at low temperatures. Renew. Energy 2022, 198, 1328–1340. [Google Scholar] [CrossRef]
  15. Wang, Y.-X.; Chen, Z.; Zhang, W. Lithium-ion battery state-of-charge estimation for small target sample sets using the improved GRU-based transfer learning. Energy 2022, 244, 123178. [Google Scholar] [CrossRef]
  16. Chen, J.; Zhang, Y.; Wu, J.; Cheng, W.; Zhu, Q. SOC estimation for lithium-ion battery using the LSTM-RNN with extended input and constrained output. Energy 2023, 262, 125375. [Google Scholar] [CrossRef]
  17. Ji, C.; Jin, G.; Zhang, R. State of charge estimation for lithium-ion batteries based on a digital twin hybrid model. Energy Rep. 2025, 13, 2174–2185. [Google Scholar] [CrossRef]
  18. Messing, M.; Shoa, T.; Ahmed, R.; Habibi, S. Battery SoC Estimation from EIS using Neural Nets. In Proceedings of the 2020 IEEE Transportation Electrification Conference & Expo (ITEC), Chicago, IL, USA, 23–26 June 2020; pp. 588–593. [Google Scholar] [CrossRef]
  19. Bourelly, C.; Vitelli, M.; Milano, F.; Molinara, M.; Fontanella, F.; Ferrigno, L. EIS-Based SoC Estimation: A Novel Measurement Method for Optimizing Accuracy and Measurement Time. IEEE Access 2023, 11, 91472–91484. [Google Scholar] [CrossRef]
  20. Zhang, L.; Liu, H.; Wang, X.; Li, M. State-of-charge estimation for lithium primary batteries: Methods and verification. J. Energy Storage 2024, 86, 111189. [Google Scholar] [CrossRef]
  21. Kong, L.; Fang, S.; Niu, T.; Chen, G.; Yang, L.; Liao, R. Fast State of Charge Estimation for Lithium-ion Battery Based on Electrochemical Impedance Spectroscopy Frequency Feature Extraction. IEEE Trans. Ind. Appl. 2024, 60, 1369–1379. [Google Scholar] [CrossRef]
  22. Carthy, K.M.; Gullapalli, H.; Ryan, K.M.; Kennedy, T. Review—Use of impedance spectroscopy for the estimation of Li-ion battery state of charge, state of health and internal temperature. J. Electrochem. Soc. 2021, 168, 080517. [Google Scholar] [CrossRef]
  23. Meddings, N.; Heinrich, M.; Overney, F.; Lee, J.-S.; Ruiz, V.; Napolitano, E.; Seitz, S.; Hinds, G.; Raccichini, R.; Gaberšček, M.; et al. Application of electrochemical impedance spectroscopy to commercial Li-ion cells: A review. J. Power Sources 2020, 480, 228742. [Google Scholar] [CrossRef]
  24. Chang, C.; Pan, Y.; Wang, S.J.; Jiang, J.C.; Tian, A.; Gao, Y.; Jiang, Y.; Wu, T.Z. Fast EIS acquisition method based on SSA-DNN prediction model. Energy 2024, 288, 129768. [Google Scholar] [CrossRef]
  25. Babaeiyazdi, I.; Rezaei-Zare, A.; Shokrzadeh, S. State of charge prediction of EV Li-ion batteries using EIS: A machine learning approach. Energy 2021, 223, 120116. [Google Scholar] [CrossRef]
  26. Ojukwu, S.J.; Maheshwari, S.; Shafik, R.; Yakovlev, A.; Mamlouk, M. AI-Driven Battery State-of-Charge Estimation using Electrochemical Impedance Spectroscopy. In Proceedings of the 2023 International Symposium on the Tsetlin Machine (ISTM), Newcastle upon Tyne, UK, 29–30 August 2023. [Google Scholar] [CrossRef]
  27. Santoni, F.; De Angelis, A.; Moschitta, A.; Carbone, P. Training Gaussian process regression through data augmentation for battery SOC estimation. J. Energy Storage 2024, 98, 113073. [Google Scholar] [CrossRef]
  28. Hu, P.; Lam, S.S.K.; Li, C.Y.; Lee, C.C. Novel Passive Equalization Methods for Lithium-Ion Batteries Utilizing Real-Time Internal Resistance Measurements. IEEE Access 2024, 12, 186362–186379. [Google Scholar] [CrossRef]
  29. Ye, Z.W.; Xu, Y.; He, Q.Y.; Wang, M.W.; Bai, W.F.; Xiao, H.W. Feature Selection Based on Adaptive Particle Swarm Optimization with Leadership Learning. Comput. Intell. Neurosci. 2022, 2022, 1825341. [Google Scholar] [CrossRef] [PubMed]
  30. Gu, X.; See, K.W.; Wang, Y.; Zhao, L.; Pu, W. The Sliding Window and SHAP Theory—An Improved System with a Long Short-Term Memory Network Model for State of Charge Prediction in Electric Vehicle Application. Energies 2021, 14, 3692. [Google Scholar] [CrossRef]
  31. Ji, X.; Liao, Y.; Tu, J.; Liu, Q.; Qing, X. PSO-GPR model for state estimation of lithium-ion battery using ultrasonic guided waves with multi-feature fusion technique. J. Energy Storage 2025, 112, 115580. [Google Scholar] [CrossRef]
  32. Ly, A.; Marsman, M.; Wagenmakers, E.J. Analytic posteriors for Pearson’s correlation coefficient. Stat. Neerl. 2018, 72, 4–13. [Google Scholar] [CrossRef] [PubMed]
  33. Valencia, D.; Lillo, R.E.; Romo, J. A Kendall correlation coefficient between functional data. Adv. Data Anal. Classif. 2019, 13, 1083–1103. [Google Scholar] [CrossRef]
  34. Kumar, A.; Abirami, S. Aspect-based opinion ranking framework for product reviews using a Spearman’s rank correlation coefficient method. Inf. Sci. 2018, 460–461, 23–41. [Google Scholar] [CrossRef]
  35. Pandis, N. The chi-square test. Am. J. Orthod. Dentofac. Orthop. 2016, 150, 898–899. [Google Scholar] [CrossRef] [PubMed]
  36. Hua, L.; Zhang, C.; Peng, T.; Ji, C.; Shahzad Nazir, M. Integrated framework of extreme learning machine (ELM) based on improved atom search optimization for short-term wind speed prediction. Energy Convers. Manag. 2022, 252, 115102. [Google Scholar] [CrossRef]
  37. Zhang, Y.; Zhang, Y.H.; Wu, T.Z. Estimation of state of health based on charging characteristics and back-propagation neural networks with improved atom search optimization algorithm. Glob. Energy Interconnect. 2023, 6, 228–237. [Google Scholar] [CrossRef]
  38. Zhao, W.; Wang, L.; Zhang, Z. Atom search optimization and its application to solve a hydrogeologic parameter estimation problem. Knowl.-Based Syst. 2019, 163, 283–304. [Google Scholar] [CrossRef]
  39. Zhou, Y.F.; Wang, S.L.; Li, Z.H.; Feng, R.J.; Fernandez, C. Battery pack capacity estimation based on improved cooperative co-evolutionary strategy and LightGBM hybrid models using indirect health features. J. Energy Storage 2025, 114, 115914. [Google Scholar] [CrossRef]
  40. Xu, Y.; Goodacre, R. On Splitting Training and Validation Set: A Comparative Study of Cross-Validation, Bootstrap and Systematic Sampling for Estimating the Generalization Performance of Supervised Learning. J. Anal. Test. 2018, 2, 249–262. [Google Scholar] [CrossRef] [PubMed]
  41. Sulaiman, M.H.; Mustaffa, Z. State of charge estimation for electric vehicles using random forest. Green Energy Intell. Transp. 2024, 3, 100177. [Google Scholar] [CrossRef]
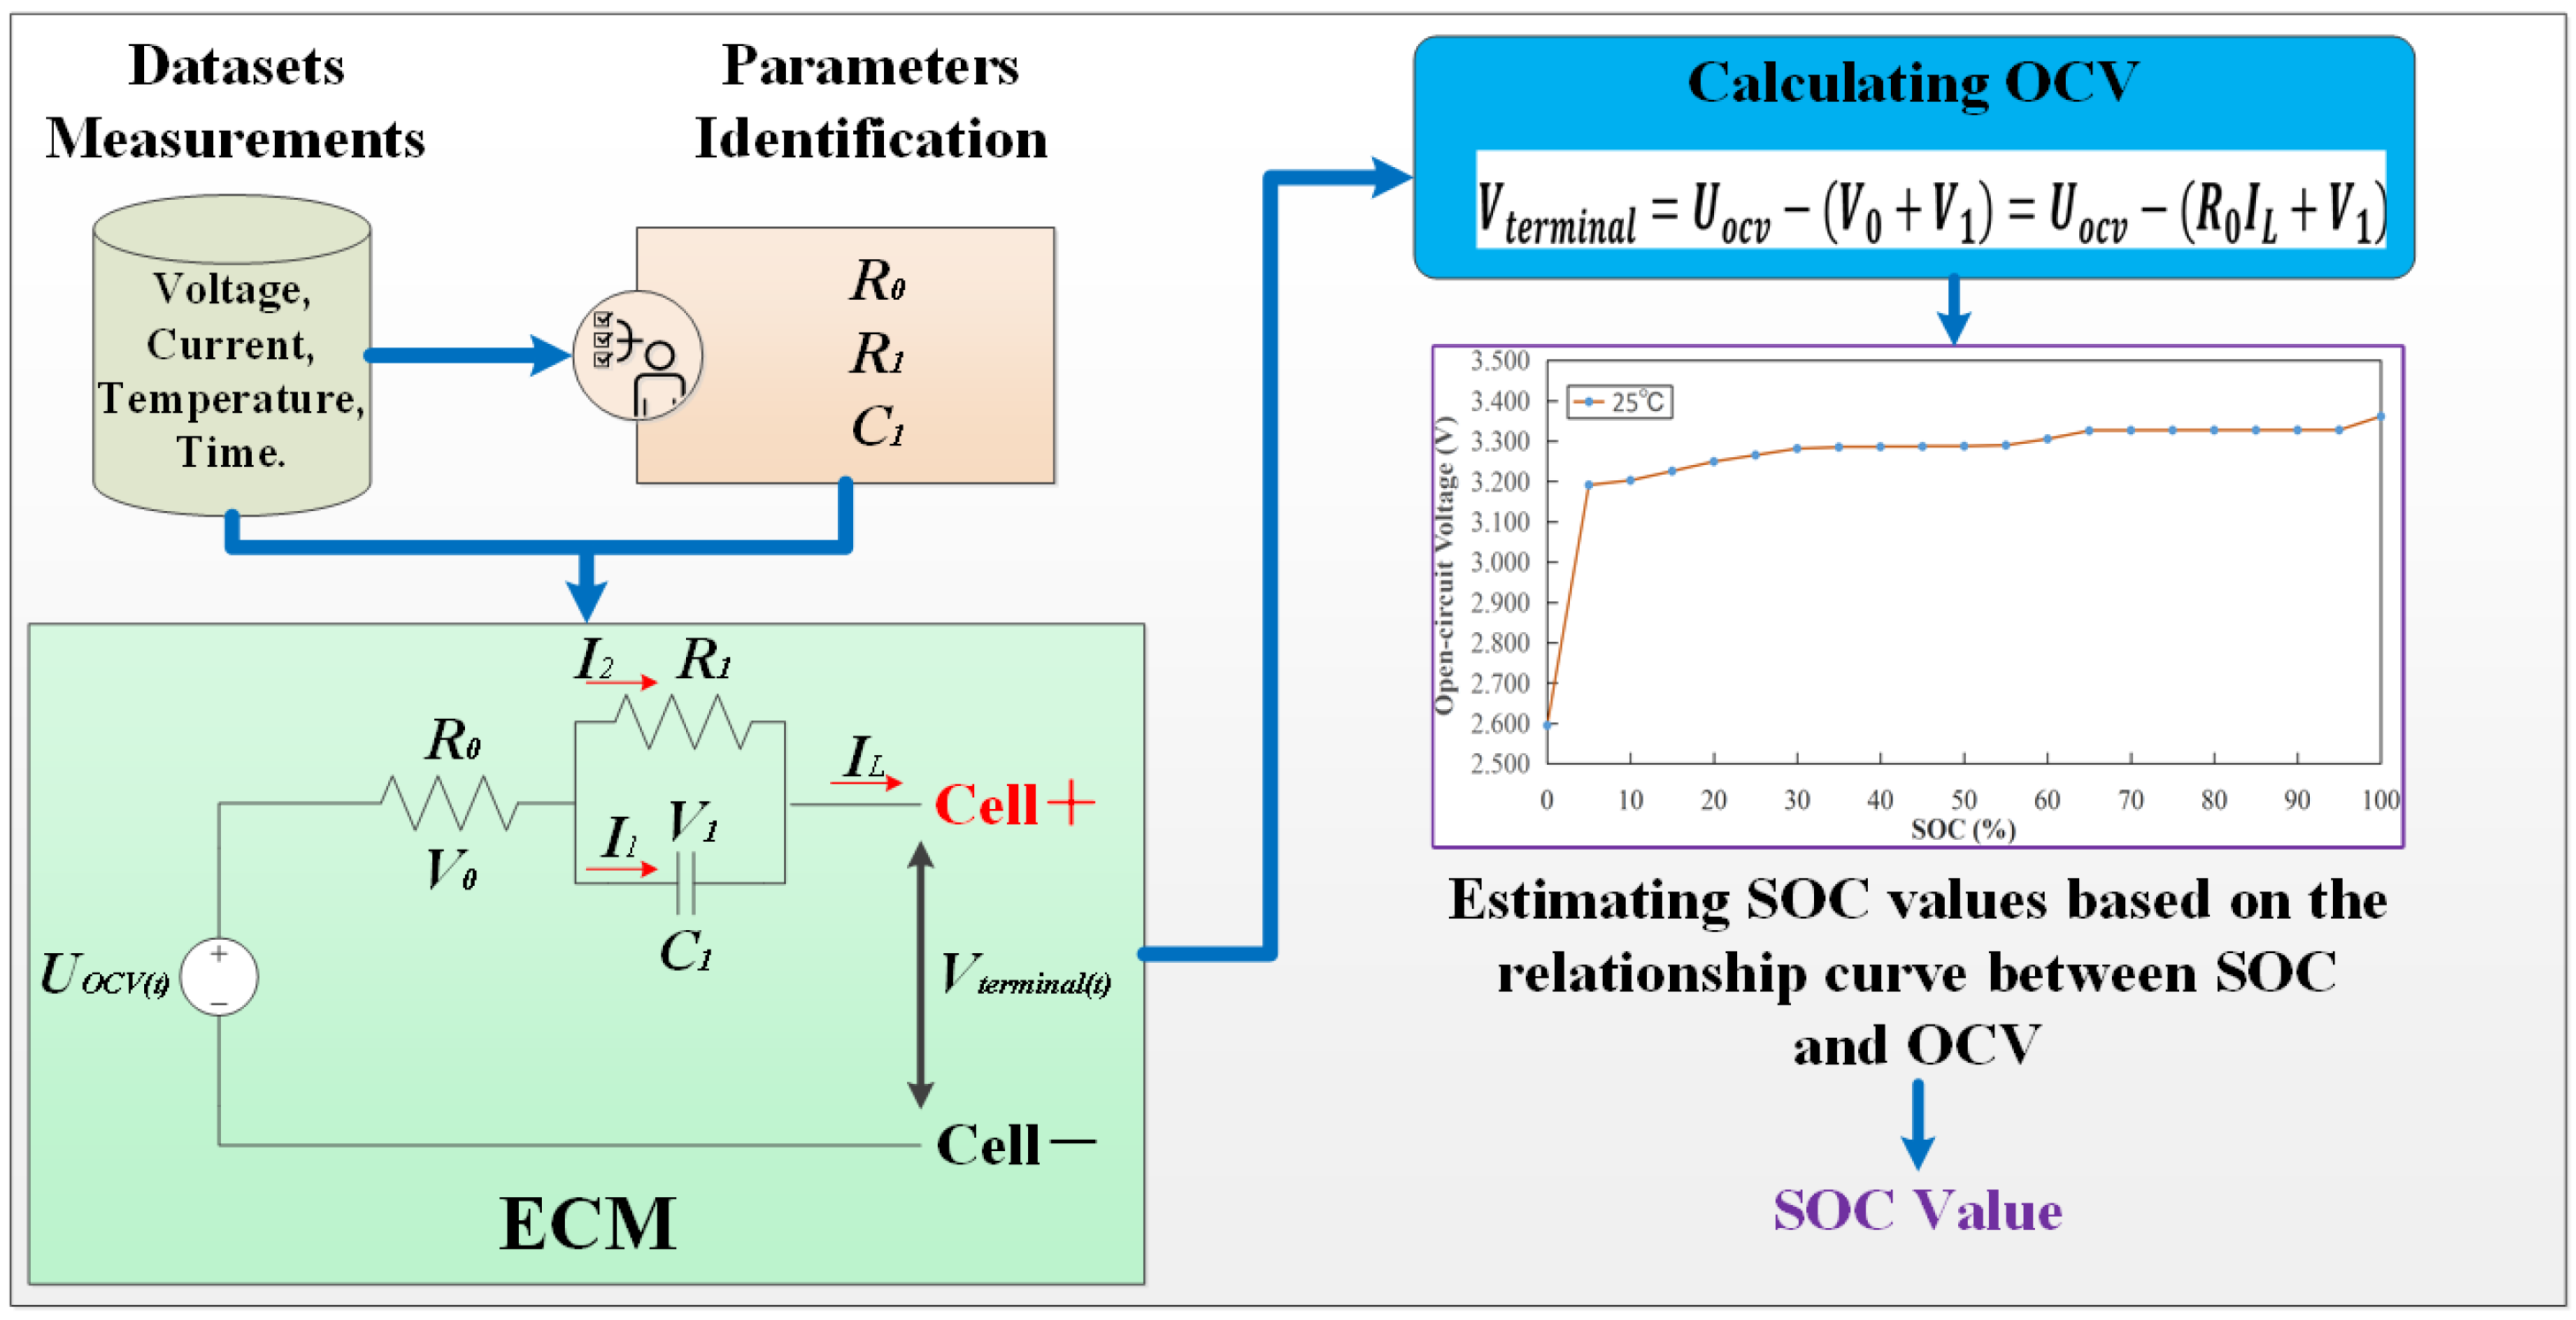
Figure 1. A common SOC estimation framework based on equivalent circuit models (ECMs).
Batteries 11 00272 g001
Figure 2. A common SOC estimation framework based on data-driven approaches.
Batteries 11 00272 g002
Figure 3. The mapping relationship between the EIS of lithium-ion batteries and fractional-order models, as well as electrochemical processes.
Batteries 11 00272 g003
Figure 4. The schematic diagram of the experimental environment setup.
Batteries 11 00272 g004
Figure 5. Experimental testing procedures for EIS data collection.
Batteries 11 00272 g005
Figure 6. Calculation process of Shapley values.
Batteries 11 00272 g006
Figure 7. The core conceptual framework of the proposed method.
Batteries 11 00272 g007
Figure 8. The working process of the ASO algorithm.
Batteries 11 00272 g008
Figure 9. The main principal framework of LightGBM.
Batteries 11 00272 g009
Figure 10. Nyquist plots of EIS results at different SOC states: (a) cell#01 at 0 °C, and (b) cell#02 at 0 °C.
Batteries 11 00272 g010
Figure 11. The plots show the real and imaginary parts versus SOC and frequency at 0 °C: (a) imaginary part of cell#01 at 0 °C, (b) Real part of cell#01 at 0 °C, (c) imaginary part of cell#02 at 0 °C, and (d) real part of cell#02 at 0 °C.
Batteries 11 00272 g011
Figure 12. The plots of phase between SOC and frequency at 0 °C: (a) cell#01 at 0 °C, (b) cell#02 at 0 °C.
Batteries 11 00272 g012
Figure 13. Feature extraction process of EIS datasets.
Batteries 11 00272 g013
Figure 14. The plot of contribution percentages of (a) imaginary part, (b) real part, and (c) phase.
Batteries 11 00272 g014
Figure 15. Comparison of SOC estimation results: (a) data trend visualization and (b) evaluation metrics.
Batteries 11 00272 g015
Table 1. Comparative results of the several feature extraction methods.
FEMsComputational
Efficiency
Numeric
Data
Time-Sequence
Data
Nonlinear
Data
Tolerance for Missing Values
SHAP [29]Medium√ (Good)√ (Good)√٭ (Best)Low
PCC [32]High√٭ (Best)Δ (Limited)×Low
Kendall’s Tau [33]Medium√ (Good)Δ (Limited)Δ (Limited)High
SRCC [34]High√ (Good)Δ (Limited)Δ (Limited)Medium
CST [35]High×××Medium
Table 2. Specification parameters of the LFP 3.2 V 104 Ah single battery cell.
CategoriesParameters
Shape of the cellRectangular aluminum shell
AnodeGraphite
CathodeLiFePO4 (LFP)
Rated Capacity104 Ah
Charge Cut-off Voltage3.65 V
Discharge Cut-off voltage2.0 V
AC Impedance≤5 mΩ (25 °C ± 2 °C, SOC 17 ± 3%)
Weight1909 ± 57 g
SizeThickness × Width × Height: 52.3 ± 0.3 mm × 148.6 ± 0.3 mm × 118.9 ± 0.3 mm
Table 3. Extracted EIS characteristic data (contributions above the mean).
Imaginary PartFrequency (Hz)Real PartFrequency (Hz)Phase AngleAngle (Degree)
f11000f11000p2 (794.33 Hz)78.76
f3630.96f2794.33p3 (630.96 Hz)75.12
f4501.19f4501.19p8 (199.53 Hz)33.19
f6316.23f6316.23p12 (79.43 Hz)−9.70
f10125.89f8199.53p14 (50.12 Hz)−22.25
f11100.00f9158.49p15 (39.81 Hz)−26.69
f1450.12f11100p16 (31.62 Hz)−29.76
f301.2589f1279.433p27 (2.5119 Hz)−16.51
f311f1363.10p28 (1.9953 Hz)−14.67
f320.7943f1631.62p29 (1.5849 Hz)−13.12
f340.5012f1725.12p32 (0.7943 Hz)−9.47
f360.3162f410.1 Hzp34 (0.5012 Hz)−7.92
f370.2512--p37 (0.2512 Hz)−6.90
f380.1995--p38 (0.1995 Hz)−6.76
f390.1585--p39 (0.1585 Hz)−6.78
f400.1259--p40 (0.1259 Hz)−6.83
f410.1----
Table 4. Comparative results of the several relevant methods without k-fold cross-validation.
Relevant MethodsLIBs’ TypeCap (Ah)FEMML AlgorithmsRMSEMAER2Scenarios
ASO–LightGBM with SHAPLFP104SHAPASO–LightGBM3.67%2.28%0.982Online
ASO–LightGBM with PCCLFP104PCC [25]ASO–LightGBM3.71%2.93%0.981Online
LightGBM without ASOLFP104SHAPLightGBM3.69%2.08%0.981Online
LSTM [26]NCM2.6WithoutLSTM25.12%17.94%0.159Offline
DNN [18]NCM4.8WithoutDNN13.95%10.37%0.740Offline
Table 5. Comparative results utilizing k-fold cross-validation between ASO–LightGBM with SHAP and ASO–LightGBM with PCC.
Relevant MethodsLIBs’ TypeCap (Ah)FEMML AlgorithmsRMSEMAER2Scenarios
ASO–LightGBM with SHAPLFP104SHAPASO–LightGBM3.30%1.86%0.99Online
ASO–LightGBM with PCCLFP104PCC [25]ASO–LightGBM3.59%2.53%0.98Online
Disclaimer/Publisher’s Note: The statements, opinions and data contained in all publications are solely those of the individual author(s) and contributor(s) and not of MDPI and/or the editor(s). MDPI and/or the editor(s) disclaim responsibility for any injury to people or property resulting from any ideas, methods, instructions or products referred to in the content.