Abstract
With the development and application of electric vehicles powered by lithium-ion batteries (LIBs) at high altitude, the lack of research on the aging laws and mechanisms of LIBs under a low-pressure aviation environment has become an important obstacle to their safe application. Herein, the influences and mechanisms of high-altitude and low-pressure environment (50 kPa) on the cycling performance of commercial pouch LIBs were systematically studied. The results showed that low air pressure caused a sharp decrease in battery capacity to 46.6% after 200 cycles, with a significant increase in charge transfer impedance by 70%, and the contribution rate of active lithium loss reached 74%. Low air pressure led to irreversible deformation of the battery, resulting in the expansion of the gap between the electrodes, poor electrolyte infiltration, and reduction of the effective lithium insertion area, which in turn induced multiple synergistic accelerated decay mechanisms, including obstructed lithium-ion transmission, reduced interfacial reaction efficiency, increased active lithium consumption, changes in heat generation structure, and a significant increase in heat generation. After applying external force, the deformation of the electrode was effectively suppressed, and the cycle capacity retention rate increased to 87.6%, which significantly alleviated the performance degradation of LIBs in low pressure environment. This work provides a key theoretical basis and engineering solutions for the design of power batteries in high-altitude areas.
1. Introduction
LIBs have been widely used in various fields, such as new energy electric vehicles, energy storage power stations, unmanned aerial vehicles, and aerospace, due to their remarkable advantages, including long charge–discharge life, light weight, and stable performance [1,2]. However, LIBs are extremely prone to trigger thermal runaway accidents, and safety issues are the critical bottleneck that restrict the further development and application of LIBs [3,4]. According to incomplete statistics from the U.S. Federal Aviation Administration (FAA), the number of LIB fire accidents on U.S. flights increased by 388% from 2015 to 2024, with an average of two accidents per week, and has surged by more than 42% in the past five years [5].
In response to the policies of energy conservation and emission reduction, the Civil Aviation Administration of China has implemented oil-to-electric and electrification measures for various special vehicles at civil aviation airports [6]. At present, the overall electrification rate at airports in China exceeds 60%. The comprehensive electrification rate of vehicles on the ground at Daxing International Airport has reached 72%. By the end of 2025, the electrification rate of Capital International Airport will reach 49.54% [7]. China has vast plateau areas that account for 26% of the total land area. There are 25 high-altitude airports (with altitude higher than 2438 m), of which 7 are over 4000 m. Airports in plateau areas are also facing the need to convert special vehicles from oil to electricity or electrification. The persistent low-pressure environment in these high-altitude areas is different from that in normal plain areas. Although the battery modules are usually sealed, the long-term use in low-pressure environments and sealing failure of the battery pack will cause the cycle characteristics of LIBs to be distinct from those in plain areas with normal-pressure environments. The performance of batteries, from appearance to remaining capacity, will change, which greatly increases the probability of thermal runaway in LIBs and potential thermal hazards during application [8]. This complicated situation simultaneously challenges the monitoring and management of battery health and safety status [9,10,11]. The high-altitude with low-pressure environment poses severe challenges to the performance and safety of LIBs [12].
Currently, research on the effect of external pressure on the charge–discharge performance of LIBs mainly focuses on applying positive force or pays attention to aerospace-related ultra-low pressure and vacuum environments [12]. Regarding the effect of positive extrusion pressure, generally, an appropriate positive pressure is conducive to improvement of the performance of LIBs by affecting the connection of the battery’s internal components, while excessive or insufficient pressure will exert negative impacts on the capacity, lifespan, charge–discharge cycle, and safety of LIBs [13]. For example, Canarella et al. [14] found that higher pressures can deteriorate cycling performance and reduce battery capacity, while proper pressures not only improve cycling stability but also facilitate the maintenance of battery capacity. Mussa et al. [15] studied the performance and aging characteristics of single-layer pouch LIBs under external pressure and found that there existed an optimal pressure (1.32 MPa) that could prolong the battery life, while both above and below optimal pressure resulted in accelerated aging of the batteries. As to aerospace-related low-pressure environments, for instance, Jeevarajan et al. [11] tested a commercial LIB at low pressures ranging from 0.69 kPa to 62.1 kPa and found that the battery capacity decreased significantly and the loss of irreversible capacity increased significantly in the vacuum environment of deep space. Xie and coworkers [5] investigated the effects of different air pressures (95 kPa, 60 kPa, and 30 kPa) on the aging behavior of LiCoO2 batteries, and pointed out that battery deformation and internal side reactions are mainly responsible for the degradation of cycling performance. Under an identical charge–discharge mode, when the air pressure dropped from 95 kPa to 30 kPa, the state of health (SOH) of the battery decreased from 99.75% to 82.61%. Overall, vacuum or low-pressure environments have a certain degree of negative impact on the performance of LIBs.
However, the aforementioned research did not involve plateau areas, and especially there is little research on the cycling characteristics of pouch LIBs in the low-pressure operating environment of civil airports with an altitude of more than 4000 m. Additionally, there is a lack of theoretical knowledge on the cyclic characteristics of LIBs under the influence of low-pressure environments in plateau areas. As a result, there is a dearth of technical solutions and measures to deal with the rapid aging and performance degradation of LIBs during cyclic charge–discharge in low-pressure environments. Accordingly, this work aims to explore the influences and related mechanisms of the low-pressure environment on the cyclic degradation of pouch LIBs in plateau areas with high-altitude, and to explore technical solutions to cope with the rapid aging and performance degradation of LIBs during cyclic charge and discharge under the above situations. Focusing on a commercial power pouch LIB, two typical pressures (i.e., 95 kPa represents the atmospheric pressure in Sichuan, China; 50 kPa, represents the air pressure of the airports located on plateaus with an altitude over 4000 m) were selected to explore the aging characteristics of LIBs, respectively. Qualitative and quantitative studies were performed to investigate the aging behavior of the battery and reveal the internal mechanisms by using non-destructive methods and subsequent analysis of the disassembled electrodes. Based on this study, we aim to provide theoretical basis and experimental references for the design, standard development, and operation and management of LIBs in high-altitude environments.
2. Experimental
2.1. Samples
Commercially available pouch LIBs with a Nominal Capacity of 5 Ah were adopted in this study. The positive and negative electrode materials of the battery are Li(Ni0.5Co0.2Mn0.3)O2 and graphite, respectively. The detailed parameters of the pouch LIB are shown in Table 1.

Table 1.
Battery basic information.
2.2. Testing Equipment
The charge–discharge tests of LIBs were conducted on a LANHE instrument (CT30001K, Wuhan Land Electronic Co. Ltd., Liaocheng, Wuhan, China) in a pressure chamber (inside dimension: 50 × 50 × 50 cm) with constant temperature and variable pressure. The chamber can realize constant control of internal pressure (0–101 kPa, ±2 kPa) and temperature, which consists of a cabin body, a pressure control system, and a temperature control system. The pressure and temperature inside the chamber were controlled separately through vacuum pumps and a constant temperature control system. The battery charging cable and temperature measurement signal cable enters the chamber through the aviation sealed plug at the bottom of the spherical chamber. Before the tests, the pouch LIB was fixed on the insulated fixing plate, and a K-type thermocouple with a diameter of 0.08 m was arranged in the middle of the battery to measure temperature. Then, the chamber door was closed, and the ambient pressure along with temperature inside the chamber were set through the master control panel. When the pressure and temperature reached the preset values, the battery was subjected to charge–discharge cycling experiments. The internal structure and components of the chamber, as well as the arrangement of the battery inside the chamber, are shown in Figure 1. During the tests, the ambient temperature was set to 25 °C, and two typical environmental pressures were selected (i.e., 95 kPa represents the atmospheric pressure in Guanghan, Sichuan, China, with an altitude of around 500 m; 50 kPa represents the air pressure at plateau airports with an altitude above 4000 m). Three operating modes were adopted for the charge–discharge cycling tests: (1) exposing the battery directly to a 95 kPa environment; (2) exposing the battery directly to a 50 kPa environment; (3) exposing the battery to a 50 kPa environment after imposing a certain positive pressure with a clamp. The specific parameters for the charge–discharge cycling experiments are shown in Table 2.
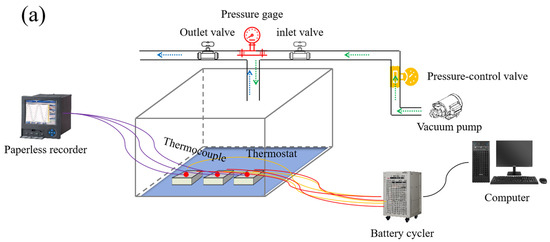
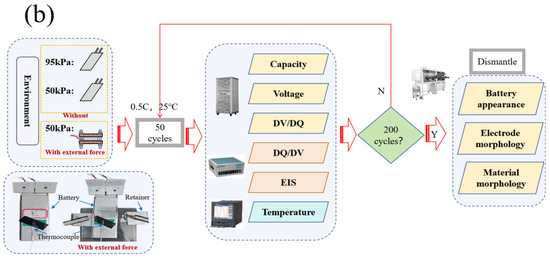
Figure 1.
Schematic illustration of the charge–discharge cycling experiments platform (a). Research technology roadmap of this study (b).
Table 2.
Specific experimental conditions.
2.3. Aging Test
The operating parameters for the battery were as follows. The battery was cycled within cut-off voltage ranging from 2.75 V to 4.2 V. The electric current for charging–discharging was 0.5 C (2500 mA), and the charging cut-off current in the constant voltage stage was set to 50 mA. During the cycling, the battery was left to stand for 30 min at each step, the environment temperature was constantly controlled at around 25 °C, and the charge–discharge parameters and temperature changes of the battery were recorded. Figure 1 presents the schematic illustration of the cycling platform (Figure 1a) as well as the detailed technology roadmap for the experiments (Figure 1b). After completing every 50 cycles, impedance analysis and a small current (0.05 C) for charge–discharge were performed on the battery. After completing 200 charge–discharge cycles, the battery was placed in a glove box for disassembly, and the appearance and disassembly morphology of the battery was photographed and recorded. The electrode materials of the disassembled battery were characterized by SEM analysis. Combined with characteristic parameters, such as the capacity, surface temperature, and internal resistance of the battery during cyclic charge–discharge under different operating conditions, the mechanism and electrochemical principles of LIB degradation during cycling were analyzed to explore the impact of low-pressure environment on the charge–discharge cycling performance of ternary LIBs.
3. Results
3.1. Electrochemical Performance
3.1.1. Cyclic Voltage and Capacity
Figure 2 shows the capacity-voltage curves of LIB under different conditions. As can be seen from Figure 2a, under 95 kPa, the discharge capacities of the battery after the1st, 50th, 100th, 50th, and 200th cycles were 5.165 Ah, 5.155 Ah, 5.178 Ah, 5.146 Ah, and 5.087 Ah, respectively. Under 50 kPa (Figure 2b), the corresponding discharge capacities were 4.89 Ah, 4.753 Ah, 4.356 Ah, 3.705 Ah and 3.145 Ah, respectively. Under a 50 kPa environment along with applying external force, the corresponding discharge capacities were 4.986 Ah, 4.970 Ah, 4.959 Ah, 4.833 Ah and 4.750 Ah, respectively (Figure 2c). The above results demonstrate that the battery capacity exhibited a downward trend with the increase of the number of cycles, and the capacity degradation of the battery under different pressures showed significant differences. As shown in Figure 2d, after being cycled for 200 times, the battery capacity under 95 kPa, 50 kPa, and 50 kPa along with the external force decreased by 0.078 Ah, 1.745 Ah, and 0.153 Ah, respectively. It is found that the cycle capacity restores when the environment pressure of the battery increases from 50 kPa to 95 kPa, as shown in Figure 2e. It can be seen that, after 200 cycles under 95 kPa, the capacity loss of the battery was relatively negligible. When the ambient pressure was reduced to 50 kPa, the battery showed a significant capacity loss rate. The results indicate that the impact of low pressure on battery capacity is significantly greater than that of normal pressure.
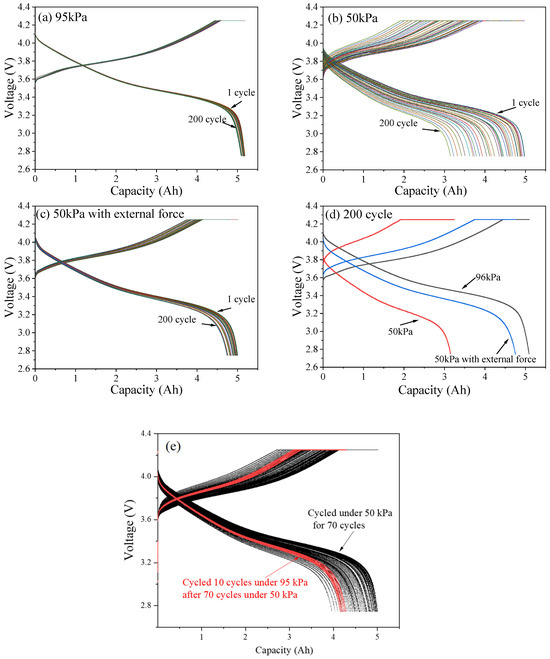
Figure 2.
Capacity-voltage curves of LIB under 95 kPa (a), 50 kPa (b) and 50 kPa along with external force (c). Capacity-voltage curves of LIB after 200 cycles under 3 typical conditions (d). Capacity-voltage curves of LIB when the environment pressure of the battery increases from 50 kPa to 95 kPa (e).
The percentage relationships between constant current charging (CCC) capacity and constant voltage charging (CVC) capacity of the LIB under different pressure environments are shown in Figure 3. Under 95 kPa, after 200 cycles of charge–discharge, the capacity percentage of the CCC stage of the battery maintained a value of 12–13%, with stable charge–discharge efficiency and good cycling performance (Figure 3a). Under 50 kPa, correspondingly, the capacity percentage of the CCC stage significantly decreased from 78% to 43%, and the chargeable capacity continued to decrease (Figure 3b). Under 50 kPa along with external force, the capacity percentage of the CCC stage decreased from 83.1% to 78.9%, but the decrease was much smaller than that of the battery not treated with external force under the same pressure (Figure 3c). This might be due to the reduced environmental pressure causing the battery to undergo severe irreversible deformation, which may reduce the contact area between the electrode and the electrolyte [16]. The internal Li+ underwent deintercalation at the electrode under the influence of the load current, and the shuttle channel between the electrodes was blocked, resulting in a decrease in the effective lithium insertion area, which led to a sharp decrease in the CCC ratio and the whole charge–discharge time of the battery [17].
Figure 3.
The percentage relationships between CCC capacity and CVC capacity of the LIB under 95 kPa (a), 50 kPa (b) and 50 kPa with external force (c).
3.1.2. SOH and CE of LIBs
The SOH of LIB quantitatively describes the performance of the current battery in terms of the ability to store electrical energy relative to a new battery (Equation (1)), based on the actual initially accessible capacity. Coulombic efficiency (CE) is the ratio of the battery’s discharge capacity to the charge capacity during the current cycle (Equation (2)). It changes with the number of cycles and is closely related to the loss of active lithium.
Figure 4a shows the SOH curves of the ternary LIB as a function of the number of battery cycles under different pressure environments. Under 95 kPa, the capacity of the battery gradually decreased during each cycle gradient period, and the SOH remained at around 98% at the end of the cycle period. Under 50 kPa, the battery SOH decreased relatively slowly to 95.1% after the first 50 cycles but sharply dropped to 46.6% in the following 150 cycles. Under the same pressure of 50 kPa, the SOH of the battery with external force after 200 cycles was 87.6%, and its decrease rate was relatively slow. The results demonstrate that a decrease in environmental pressure subjects LIBs to serious capacity loss and significant SOH deterioration.
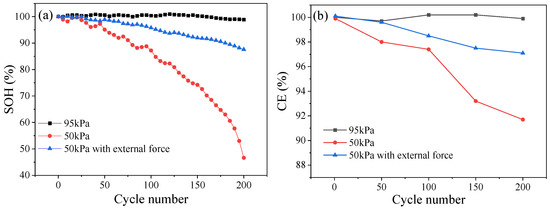
Figure 4.
SOH (a) and CE (b) of the battery under different pressure environments.
The CE of the ternary LIB under different pressure environments is presented in Figure 4b. As can be seen, the CE of the battery exhibited a continuous decreasing trend under a 50 kPa environment, with gradients of 99.9%, 98.2%, 97.4%, 93.2%, and 91.7% for each cycle, respectively, in combination with a decay of 8.2% throughout the whole process. Under normal pressure, the CE of the battery displayed a relatively stable trend, which might be related to the growth of the SEI film on the negative electrode of the battery. At the end of the cycle, the CE of the battery under normal pressure was 99.9%, and the decay rate was slower than that in low-pressure environments. Under 50 kPa along with the application of external force, the CE of the battery showed a higher degree of decay than that in the normal pressure environment, but this was much lower than that in the low-pressure environment without external force, with a value of 97.1% after 200 cycles, decaying by only 3% throughout the whole process.
Under low-pressure conditions, changes in gas pressure inside the battery may lead to slight deformation of the battery structure. Additionally, the overall internal structure of the battery would change, and the gap between the electrodes may increase without pressure constraints. The above results will lead to the following changes in the battery. Firstly, the local polarization of the battery will increase, and the electrolyte cannot be effectively infiltrated, so that the positive and negative electrodes will not be able to effectively contact to perform the charge–discharge reactions, and the lithium ions will be blocked from passing through the gap area. Secondly, the contact between the electrode material and the electrolyte will be affected, thereby reducing the performance of the battery [18,19]. Thirdly, local high charging rates will occur at local contact sites, and the SEI film will be continuously broken and rebuilt to consume active lithium ions, leading to the increase of multifarious side reactions and lithium deposition at these locations. Finally, the increase in the internal resistance of the battery under low-pressure will also lead to intensified polarization and more side reactions, further reducing the discharge capacity of the battery.
The fluctuating state of SOH in the early stage might be caused by such factors as the self-adjustment of the internal structure of the battery. The rate of capacity decline slowed down, but the irreversible damage caused by low pressure to the internal structure of the battery continued. Consequently, in the late stage of the cycle, the battery capacity decayed rapidly, and the SOH deteriorates more seriously. When external force was applied, on the one hand, it stabilized the battery structure [18,19], but on the other hand inhibited battery deformation to a certain extent and thus slowed down battery aging [20].
3.1.3. DV/DQ and DQ/DV
Figure 5b–d shows the DV/DQ curves of the battery after 200 repetitions of the charge–discharge cycle at 0.5 C under different pressure environments. With the increase in cycle number, the intensity and area of the characteristic peaks under 95 kPa and 50 kPa environments gradually decreased. The position of the characteristic peak under 50 kPa shifted significantly to the left compared with that under 95 kPa, and the corresponding battery capacity decayed, indicating that the loss of active materials and active lithium accelerated the decay of capacity [21]. Under 50 kPa along with the application of external force, the DV/DQ curve shifted, but the magnitude was between 95 kPa and 50 kPa, indicating that applying external force in low-pressure environments can suppress the loss of active lithium and alleviate the progress of battery aging.
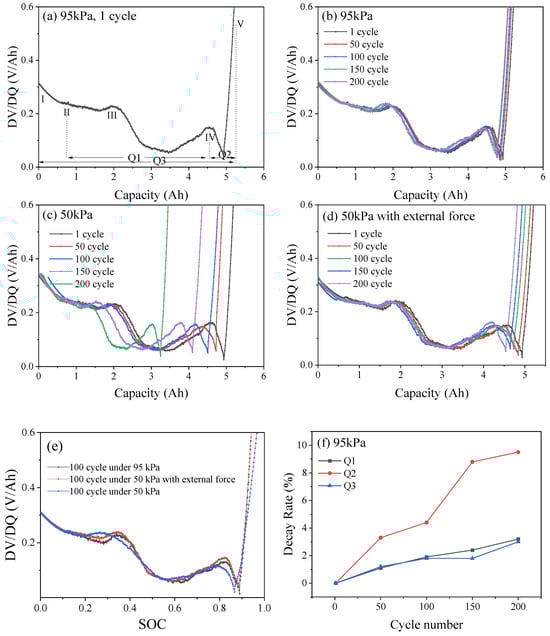
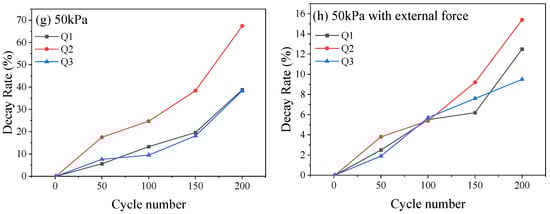
Figure 5.
Typical DV/DQ curve (a). DV/DQ curves of LIB under 95 kPa (b), 50 kPa (c) and 50 kPa with external force (d). DV/DQ curves of 100 cycles (e). The decay rates of Q1, Q2 and Q3 under 95 kPa (f), 50 kPa (g) and 50 kPa with external force (h).
To understand the damage caused by low-pressure environments to the internal structure of the battery, the change in the distance between the peaks was quantified for analysis [22]. As shown in Figure 5a, the increase in peak width (Q1, Q2 and Q3) of the graphite phase transition reflects the dynamic heterogeneity of lithium-ion insertion/extraction in graphite particles. Peak height reduction reflects a decrease in the intensity of phase transition reaction, which indicates a decrease in the utilization rate of some graphite active regions. The decay rates of Q1, Q2 and Q3 under different pressure conditions after different numbers of cycles are shown in Figure 5e–g. Under 95 kPa, at the end of 200 cycles, the decay rates of Q1, Q2 and Q3 were 3.2%, 9.5%, and 3.0%, respectively, with relatively minor decay changes (Figure 5e). Correspondingly, under 50 kPa, Q1, Q2 and Q3 were reduced by 1.25 Ah, 0.42 Ah, and 1.85 Ah, respectively, corresponding to decay rates of 38.8%, 67.4%, and 38.3%, respectively, which were approximately 12 times that of 95 kPa (Figure 5f). Additionally, under 50 kPa along with external force, Q1, Q2 and Q3 were reduced by 0.15 Ah, 0.11 Ah, and 0.34 Ah, respectively, corresponding to decay rates of 12.5%, 15.4%, and 9.5%, respectively, which were about 3.9 times, 1.6 times, and 3.1 times that of a 95 kPa normal pressure condition (Figure 5g). In low-pressure environments, the relevant characteristic peaks became sharp and shifted towards the upper left with high SOC, which is related to the irreversible loss of active materials that accelerated the loss of battery capacity and active lithium, especially exacerbating the loss of active lithium during the phase transition stage at the negative electrode. The DQ/DV curve of the battery (Figure 6a) contains three prominent peaks, which represent the situation of lithium extraction–insertion during the phase transition of the battery electrode material. Peaks I and II describe the aging of the cathode, and peak III describes the aging of the anode [23]. Under normal pressure (95 kPa, Figure 6b), the DQ/DV curve shifted slightly, the characteristic peaks overlapped after different cycles, and the area enclosed by the peak and the horizontal axis changed slightly. With the decrease in ambient pressure, at 50 kPa, as the number of cycles increased, the peak intensity of the cathode shifted significantly to the lower left, the intensity of the characteristic peak decayed, and the area widened. In the meantime, the intensity of the anode peak III decreased, indicating loss of the battery cathode and anode materials (Figure 6c). Under 50kPa along with external force (Figure 6d), as the number of cycles increased, the intensity decay and area change of characteristic peaks I, II, and III were weaker than those directly exposed to the 50 kPa low-pressure environment, but more pronounced than those under 95 kPa normal pressure, indicating that, after the external force was applied, the decay of the cathode and anode materials of the battery in the low-pressure environment and the loss of active materials were inhibited to a certain extent.
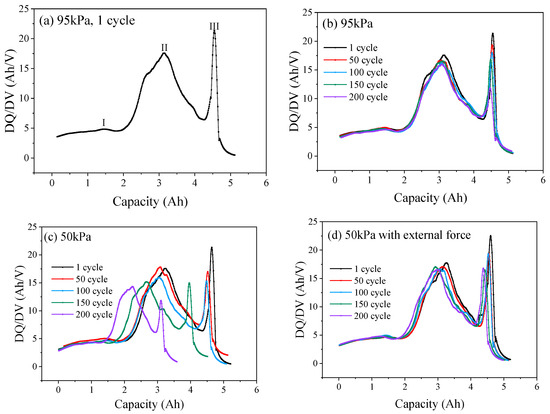
Figure 6.
Typical DQ/DV curve (a). DQ/DV curves of LIB under 95 kPa (b), 50 kPa (c) and 50 kPa with external force (d).
The gap between the low-pressure electrode plates increases, resulting in poor local electrolyte infiltration, which hinders the transmission of Li+ to some graphite particles and leads to uneven spatial distribution of phase transition reactions (peak broadening). Under low-pressure conditions, the effective lithium insertion area decreases, resulting in some graphite particles not participating in the reaction. As a result, the overall phase transition reaction intensity decreases (peak height decreases), as shown in Figure 5e. Low pressure accelerates the loss of active lithium and the capacity of the battery electrodes, especially the loss of active lithium in the negative electrode, which can be explained as follows. Under low pressures, the gap between battery electrodes will increase, and parts of electrodes cannot effectively contact each other for charging and discharging reactions due to the gap. On the other hand, the well contacted parts of the electrode sheet receive a high/extremely high rate of charging and discharging [24], and the lithium ions are not completely embedded in the graphite layers and are deposited on the negative electrode surface in the form of metallic lithium, forming “dead lithium”, resulting in permanent loss of active lithium and graphite on the surface of anode to be converted into LiC6 and free deposited lithium (Equation (4)) [25]. When the internal structure of the battery continues to suffer irreversible damage, decomposition of the electrolyte is prone to occur on the surface of the electrode, and the amount of active lithium that can be stored decreases continuously during the reaction, leading to metallic lithium continuing to deposit and a decline in battery performance (Equations (3) and (4)).
3.2. Battery Impedance
To investigate the impedance characteristics of the battery after charge–discharge cycling, electrochemical impedance spectroscopy (EIS) tests were performed. As demonstrated in Figure 7, as the cycle number increased, the intersection points with the horizontal axis under three operating conditions shifted to the right overall but not significantly. Under a 95 kPa environment (Figure 7a), the semi-circular arc of the battery slightly increased, and the length of the straight line with a slope of 45° did not change significantly. Under a 50 kPa environment (Figure 7b), the EIS spectra gradually separated from a semi-circular arc at the beginning of the cycle into two semi-circular arcs and, as the number of cycles increased, the radius of the arcs increased to varying degrees. Under 50 kPa along with external force (Figure 7c), the EIS spectrum began to separate from one semi-circular arc into two after 150 cycles, and the radius of the circular arc gradually increased, but the change amplitude was significantly weaker than that directly exposed to 50 kPa.
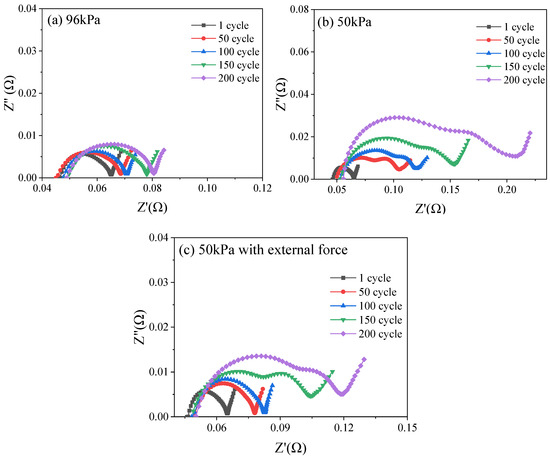
Figure 7.
Nyquist plots of LIB under 95 kPa (a), 50 kPa (b) and 50 kPa with external force (c).
By fitting the electrochemical impedance, an equivalent circuit model is obtained to quantitatively analyze the decay inside the battery corresponding to its cyclic aging state [26]. Ro represents the Ohmic impedance of the battery, RSEI represents the impedance of the SEI film, Rct represents the charge transfer impedance, Rw represents the Warburg impedance, and CPE is the constant phase element. The fitting results of Ro, RSEI, Rct and Rw under different pressure conditions are shown in Figure 8a–c. It can be seen that, under 95 kPa (Figure 8a), Ro, Rct, and Rw of the battery remained relatively stable throughout the entire cycle, with only a slight increase in the later stage. Under 50 kPa (Figure 8b), Ro remained relatively stable, while Rct increased exponentially with the largest increase. At the 200th cycle, Rct increased by 0.23 Ω compared to the initial value. RSEI increased from 0.02 Ω to 0.08 Ω, and Rw increased from 0.0042 Ω to 0.07 Ω. Under 50 kPa along with external force (Figure 8c), all impedance parameters increased compared to those at normal pressure of 95 kPa, but the increases were smaller compared to direct exposure to 50 kPa. Compared with these parameters of the new battery, under 50 kPa along with external force, the most significant increase was still in Rct, which increased from 0.03 Ω to 0.065 Ω. It can be seen from the aforementioned results that the increase in Rct was particularly obvious under the influence of low pressure. This can be explained as follows: under low pressure environments, the material deformation effect is amplified, the electrolyte infiltration is insufficient, and the mechanical stress increases, resulting in the deterioration of the contact between the diaphragm and the electrode, which seriously affects the interface ion transmission and reduces the effective double-layer capacitance [27]. This in turn leads to an increase in the interface impedance and a decrease in the battery charging and discharging efficiency. The reduction directly reduces the lithium insertion–extraction efficiency and the available capacity decreases [28].

Figure 8.
EIS fitting curves of LIB under 95 kPa (a), 50 kPa (b) and 50 kPa with external force (c); contribution rates of various impedances to battery aging under 95 kPa (d), 50 kPa (e) and 50 kPa with external force (f).
The aging mechanism of lithium-ion batteries is generally divided into three states: (1) conductivity loss (CL), (2) loss of lithium inventory (LLI), and (3) loss of active material (LAM) [29]. Based on the fitting values of the equivalent circuit diagram, three cycle degradation mechanisms of the LIB are quantitatively analyzed according to Equations (5)–(7), respectively [30].
Consequently, the values of impedance under different pressure conditions were calculated, and thereby the contribution rate of each mechanism to battery aging was achieved as shown in Figure 8d–f. Under 95 kPa (Figure 8d), in the early stage of the cycle, the proportion of CL in the total decay mechanism was relatively high while, in the later stage of the cycle, the proportion of LLI in the total decay mechanism gradually increased, and the proportion of LAM did not significantly change. Under a 50 kPa environment (Figure 8e), the proportion of CL in the total decay mechanism gradually decreased, accounting for 11.8% at the end of the cycle. The proportion of LAM increased first and then decreased, accounting for about 15.1% at the end. LLI accounted for the highest proportion, showing a significant increase during the cycle. At the end, LLI accounted for approximately 74% of the total decay mechanism. Under 50 kPa along with external force (Figure 8f), the proportion of CL gradually decreased, and LAM increased. LLI still accounted for a relatively large proportion, with around 53% at the end of the cycle. It can be concluded that the low-pressure environment significantly increased the proportion of LLI, due to the physical impact of low-pressure on the battery, which resulted in two results: (1) lithium deposition and (2) continuous and repeated growth of the SEI film. (1) Lithium deposition consists of irreversible active lithium and reversible active lithium. Reversible active lithium, due to gaps, insufficient contact, and consumption of electrolyte, can be restored when a well contact is made. It was found that the cycle capacity restored from 3.9 Ah (cycled under 50 kPa) to 4.3 Ah, when the environment pressure of the battery increases from 50 kPa to 95 kPa, as shown in Figure 2e. It is indicated that 0.4 Ah is restored post-pressurization. (2) Continuous and repeated growth the SEI film is due to excessive local current density, SEI film rupture, and exposure to fresh graphite. Furthermore, local lithium metal deposition is formed, leading to irreversible loss of active lithium accompanied by the proliferation of the SEI film [31]. Irreversible damage (wrinkles, deformations and bends) is caused by low air pressure to the internal structure of the battery [32]. The change in electrode structure morphology led to reversible/irreversible active lithium loss and the growth of SEI, physical damage yielded gaps and poor contact, and the battery underwent a localized high charge rate, resulting in a sudden increase in Warburg impedance [33].
3.3. Battery Temperature
Within an entire cycle, the battery undergoes CCC, CVC, and constant current discharge (CCD), with corresponding battery temperature changes (Figure 9a). Figure 9b–d shows the surface temperature rise curves of the battery during charge–discharge cycling under different pressure conditions. Under 95 kPa (Figure 9b), the temperature trends of the battery in different cycles were similar, the highest temperature was 41.5 °C, and the maximum temperature differences in the CCC and CCD stages were around 5.1 °C and 15.8 °C, respectively. Under 50 kPa (Figure 9c), as the number of cycles increased, the duration of CCC and CCD became shorter, and the slope of the temperature rise curve became larger, with the maximum temperature reaching 47.5 °C. The maximum temperature differences in the CCC and CCD stages were approximately 6.1 °C, and 22.5 °C, respectively. Under 50 kPa along with external force (Figure 9d), the surface temperature of the battery changed under different cycles compared with that under 95 kPa normal pressure, but the amplitude was smaller than that directly exposed to 50 kPa, with a maximum temperature of 43.5 °C. The maximum temperature differences in the CCC and CCD stages were approximately 6.0 °C, and 17.5 °C, respectively. Under low-pressure conditions, the temperature curve of the battery fluctuated more dramatically. As the number of cycles increases, the battery temperature curve becomes steeper, accompanied by a more severe temperature rise and a shorter charge–discharge time. A low pressure environment will accelerate the aging process of lithium batteries, and the temperature curve fluctuation will intensify. The changes in the heat generation structure during the charge and discharge process makes the heat generation behavior more complicated. Internal irreversible side reactions and increased polarization lead to a significant increase in heat release, resulting in an increase in battery temperature due to the excessive production of heat. Meanwhile, the stability of the battery’s internal structure and the relative safety of the cell body are lower.
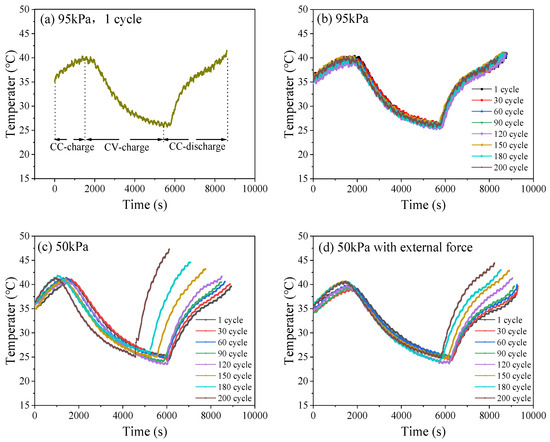
Figure 9.
Typical temperature curve (a); surface temperature curves of LIB during charge–discharge cycling under 95 kPa (b), 50 kPa (c) and 50 kPa with external force (d).
The change in battery surface temperature during charge–discharge cycle represents the alteration in heat generation structure system of the battery. Therefore, the total heat (Qtotal) generated by the LIB can be calculated according to the following formula (Equation (8)):
where Qr is the electrochemical reaction heat, Qj is the Joule heat caused by ohmic resistance, Qp is the polarization heat, and Qs is the side-reaction heat. Polarization internal resistance is mainly composed of Ohmic polarization resistance, electrochemical polarization internal resistance, and concentration difference polarization internal resistance. To further characterize the effect of environmental pressure on battery polarization, analyses of concentration difference polarization, electrochemical polarization, and Ohmic polarization were conducted as follows.
The changes in the duration of constant current and constant voltage charge–discharge represent the characteristics of concentration difference polarization and electrochemical polarization, respectively. As the pressure decreased, the constant current charging time became shorter, which means that the concentration polarization effect of the battery is significant, hindering the progress of electrode reactions and thus reducing the performance of the battery. The low-pressure environment accelerated this concentration difference, as shown in Figure 10d. Meanwhile, as the pressure decreased, the constant voltage charging time became longer. After 200 cycles, the constant voltage charging time increased by 136 s under 95 kPa and 1492 s under 50 kPa, respectively. This means that electrochemical polarization is significantly enhanced, resulting in a lag in the electrochemical reaction rate compared to the current demand, and a severe deterioration of the electrode reaction kinetics.
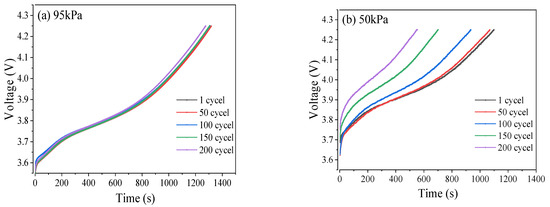
Figure 10.
Curves of voltage of CCC under 95 kPa (a), 50 kPa (b), and 50 kPa with external force (c). Time of CVC under different pressure conditions (d). Changes in ΔV under different pressure conditions (e).
Ohmic polarization can also be expressed as ΔV (Equation (9)). As shown in Figure 10e, under low pressure, Ohmic polarization increased significantly. After 200 cycles, ΔV increased by 0.01 V under 95 kPa and 0.11 V under 50 kPa, respectively. Under 50 kPa along with external force, ΔV only increases by 0.04 V. Low voltage accelerated the thickening of the solid electrolyte interface (SEI) film or the accumulation of electrolyte decomposition products, hindering the transport of lithium ions [34]. In addition, the contact resistance between electrode active material particles increased (such as powdering of the active materials and detachment of the conductive agents):
where V0 is open circuit voltage, and V1 represents the voltage when discharging begins.
Combined with EIS analysis, the changes in heat generation structure and temperature rise in low-pressure environments were mainly attributed to the substantial increase in polarization heat generation and side-reaction heat generation. Under low-pressure conditions, R0, RSEI, Rct, and Rw all increased, with Rct accounting for the largest increase of about 70%. The increase in Ohmic resistance led to an increase in Ohmic heat and Ohmic polarization heat, while the significant increase in charge transfer impedance Rct resulted in a sudden increase in electrochemical polarization heat. The increase in Warburg impedance Rw indicated concentration difference polarization [17]. Therefore, the increase in various impedances under low pressure led to an increase in Ohmic and polarization heat generation, especially a substantial increase in charge transfer impedance Rct, which resulted in a severe delay in the electrochemical reaction dynamics and a substantial increase in polarization heat generation [35]. At the same time, the poor contact between the electrode plates caused by low pressure, the partial ultrahigh-rate of discharge, and loss of active lithium accelerated the aging and deterioration of the battery, resulting in a significant increase in various irreversible side reactions inside the battery (as analyzed by SEM in detail) [36]. Consequently, in the heat generation system (where thermal energy is generated), the amount and proportion of heat generated by side reactions increased significantly.
3.4. Structural Characteristics of the Batteries
Figure 11 shows the appearance (Figure 11a) of LIBs after 200 cycles at 0.5 C under different pressure conditions, as well as the surface morphology of the electrodes and separators after battery disassembly (Figure 11b). Under 95 kPa, after multiple charge–discharge cycles, the appearance of the battery was relatively flat, and the color of the negative electrode plate and the separator were relatively uniform, without obvious visible side reaction products in such colors as dark brown or grayish white. Under 50 kPa, the appearance of the battery underwent distortion and deformation, with obvious concave and convex wrinkles appearing on the surface. The originally flat electrode plates exhibited obvious wavy squeeze wrinkles. After disassembly, the negative electrode plate and separator of the battery were no longer uniform, the color turned black, and a large amount of visible dark brown and powdery sediment particles as side reaction products were produced. Under 50 kPa along with external force, the electrode plate and separator did not bend significantly due to the offset of the external constraint force. However, the part without external force still showed obvious squeeze wrinkles, along with dark brown and grayish white side reaction products appearing on the electrode plate and separator.
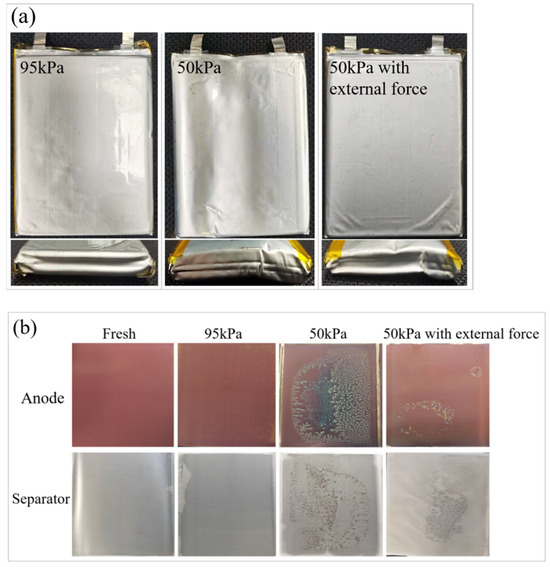
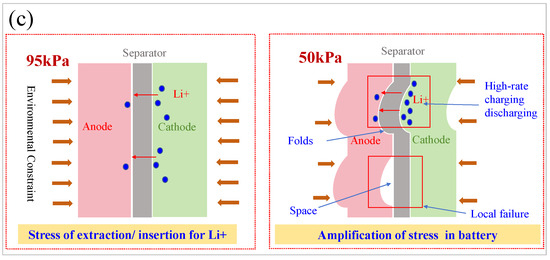
Figure 11.
The appearance of LIBs under different pressure conditions (a); the surface morphology of the electrode plates and separators after battery disassembly (b); schematic diagram of the impact mechanism of ambient pressure on battery (c).
The results demonstrate that, by applying an external constraining force, the effect of a low-pressure environment on the promotion of side reactions in LIBs can be counteracted to a certain extent. On the one hand, the low-pressure environment amplifies the deformation stress effect caused by charging and discharging inside the battery. On the other hand, the external restraining force on the battery decreases under a low-pressure environment, resulting in the formation of gaps between electrode plates inside the battery. These gaps and the amplified deformation mechanical stress will cause displacement between the electrode plates and separators over a long period of time. Consequently, on the one hand, it led to further physical irreversible damage such as cracks, breakage, and debonding of the electrode material, and formation of squeeze wrinkles in the battery electrode plate morphology. On the other hand, it caused the accumulation of visible side reaction products, such as metal lithium deposition and electrolyte consumption.
SEM images of the negative electrodes and separators of the batteries under different pressure conditions are shown in Figure 12. Under a 95 kPa environment, the graphite negative electrode structure was intact, relatively flat and smooth [32,37]. The pore size and pore size distribution of the separator were uniform, with only a small amount of side reaction products appearing in very small areas, resulting in diaphragm pore blockage. This might be related to the occurrence of side reactions during normal aging of the battery cycle [38]. Under a 50 kPa environment, at the end of battery cycle, there was a significant accumulation of gray-white and light-yellow deposition as side reaction products on the negative electrode surface, and the formation and growth of a dot-shaped SEI film was observed, with an increased coverage area and a morphology of dot-shaped white protrusion [39]. At the same time, the membrane surface became denser, with obvious deposits appearing in more areas. The large area of the separator pore was completely blocked and reduced, resulting in a decrease in the flow area of the entire separator. Lithium deposition and side reaction products continuously deposited at the electrode interface under a low-pressure environment, resulting in thickening of the SEI film and an increase in lithium-ion transport resistance [40]. In addition, side reaction products were deposited in the pores of the separator, and polarization promoted uneven deposition of lithium ions near the separator, forming local blockage [41]. Under 50 kPa along with external force, the number and area of the punctiform deposits on the surface of the negative electrode, as well as the area of the separator with more clogged and blocked pores, were significantly less than those directly exposed to the 50 kPa environment, but significantly more than those under normal pressure.
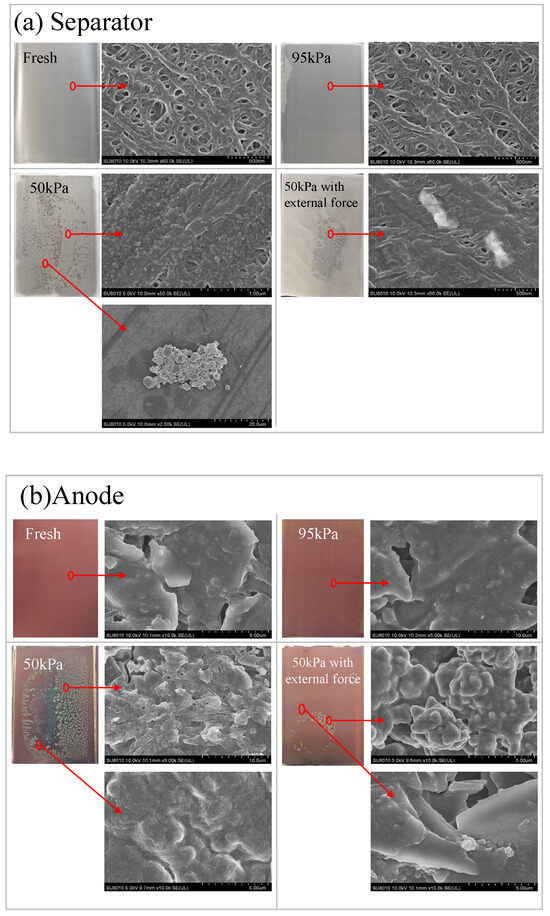
Figure 12.
SEM images of the battery separator (a) and negative electrode (b) under different conditions.
Under low-pressure environments, the gap between the separator and the electrode increased. On the one hand, high charging rate in local areas led to lithium deposition [42], and the series reaction consumed the electrolyte, increasing the amount of deposited lithium and mixing it with side reaction products [43], which adhered to the separator and electrode. On the other hand, the increase in various internal resistances and impedances led to polarization effects, such as concentration polarization, which would create uneven deposition of lithium ions near the diaphragm, forming local blockage points. By applying external force on the surface of the battery, the impact of low pressure on the battery charging and discharging process could be effectively counteracted.
4. Conclusions
This work systematically investigated the impacts and mechanisms of high-altitude and low-pressure environment (50 kPa) on the cycling performance of commercial pouch LIBs and revealed the underlying mechanism of their accelerated degradation. The main conclusions are as follows.
- (1)
- Compared with the normal plain condition (95 kPa), after 200 cycles, SOH of the battery in a low-pressure environment (50 kPa) dropped sharply to 46.6%, and the Rct increased significantly by 70%. The contribution rate of active lithium loss was as high as 74%, and active lithium loss is the dominant factor in capacity decay. Under low pressure, the heat generation increased significantly, and the heat generation structure changed, mainly due to the significant increase in generation of polarization heat and side-reaction heat, especially the increase of polarization heat caused by Rct.
- (2)
- The deformation of the battery structure is considered as an important causation of low-pressure-induced performance degradation. The expansion of a gap between the electrodes led to poor electrolyte infiltration and a reduction in the effective lithium insertion area. Structural changes triggered multiple synergistic degradation mechanisms. Local polarization and failure contact and SEI film dynamic rupture–regeneration, in collaboration with a local high rate, results in hindering the transport of Li+ and consumption of active lithium. Besides, the reversible/irreversible loss of active lithium, resulting from the gaps, insufficient contact and consumption of electrolyte, are the main reasons for the acceleration in degradation under lower ambient pressure.
- (3)
- Applying external force could effectively stabilize the electrode structure, leading to an effective shrinking of the gap between electrodes, which increased the battery cycle capacity retention rate to 87.6% and significantly improved the cycle performance of the battery in a high-altitude environment. For the first time, this work established the relationship between low-pressure environment, structural deformation and electrochemical decay, providing a theoretical basis for the design and application of energy storage batteries in high-altitude areas.
Author Contributions
Methodology, X.C.; Software, Y.L.; Validation, Y.L. and J.L.; Investigation, X.C.; Resources, J.L.; Data curation, X.C.; Writing—original draft, X.C.; Writing—review & editing, Z.W.; Visualization, J.W.; Supervision, J.W.; Project administration, Z.W. and J.W.; Funding acquisition, Z.W. All authors have read and agreed to the published version of the manuscript.
Funding
This research was funded by National Natural Science Foundation of China (No. 52204253), Civil Aviation Safety Capacity Building Project of China grant number (No. MHAQ2024035), Opening Foundation of Civil Aircraft Fire Science and Safety Engineering Key Laboratory of Sichuan Province (MZ2023KF06), the Basic Research Program of Jiangsu (BK20242088), the Opening Fund of the State Key Laboratory of Fire Science (No. HZ2024-KF03), Beijing Nova Program (No. 20220484050, No. 20230484417) and the Fundamental Research Funds of the China Academy of Safety Science and Technology (No. 2023JBKY03).
Data Availability Statement
The original contributions presented in this study are included in the article. Further inquiries can be directed to the corresponding authors.
Acknowledgments
The authors acknowledge the support of the Civil Aviation Safety Capacity Building Project of China (No. MHAQ2024035). Zhi Wang gives thanks for the support and funding of the National Natural Science Foundation of China (No. 52204253), the Opening Foundation of Civil Aircraft Fire Science and Safety Engineering Key Laboratory of Sichuan Province (MZ2023KF06), the Basic Research Program of Jiangsu (BK20242088), and the Opening Fund of the State Key Laboratory of Fire Science (SKLFS) under Grant No. HZ2024-KF03. We also offer thanks for the support and sponsorship of the Beijing Nova Program (No. 20220484050, No. 20230484417) and the Fundamental Research Funds of the China Academy of Safety Science and Technology (No. 2023JBKY03).
Conflicts of Interest
The authors declare no conflict of interest.
References
- Rodrigues, M.-T.F.; Babu, G.; Gullapalli, H.; Kalaga, K.; Sayed, F.N.; Kato, K.; Joyner, J.; Ajayan, P.M. A materials perspective on Li-ion batteries at extreme temperatures. Nat. Energy 2017, 2, 17108. [Google Scholar] [CrossRef]
- Hollinger, A.S.; McAnallen, D.R.; Brockett, M.T.; DeLaney, S.C.; Ma, J.; Rahn, C.D. Cylindrical lithium-ion structural batteries for drones. Int. J. Energy Res. 2019, 44, 560–566. [Google Scholar] [CrossRef]
- Li, H.; Liu, B.; Zhou, D.; Zhang, C. Coupled Mechanical–Electrochemical–Thermal Study on the Short-Circuit Mechanism of Lithium-Ion Batteries under Mechanical Abuse. J. Electrochem. Soc. 2020, 167, 20501–20511. [Google Scholar] [CrossRef]
- Xie, S.; Gong, Y.; Li, G.; Ping, X. Effect of low-pressure environment on thermal runaway behavior of NCM523/graphite pouch cells with different overcharge cycles. J. Energy Storage 2022, 55, 105444. [Google Scholar] [CrossRef]
- Wang, Z.; Yang, X.; Xie, S. Study on the thermal safety evolution characteristics and early warning strategies of lithium-ion batteries aged at high-altitude environments. Appl. Therm. Eng. 2025, 264, 125501. [Google Scholar] [CrossRef]
- Feng, X.; Ouyang, M.; Liu, X.; Lu, L.; Xia, Y.; He, X. Thermal runaway mechanism of lithium ion battery for electric vehicles: A review. Energy Storage Mater. 2018, 10, 246–267. [Google Scholar] [CrossRef]
- Zhi, M.; Liu, Q.; Xu, Q.; Pan, Z.; Sun, Q.; Su, B.; Zhao, H.; Cui, H.; He, Y. Review of prevention and mitigation technologies for thermal runaway in lithium-ion batteries. Aerosp. Traffic Saf. 2024, 1, 55–72. [Google Scholar] [CrossRef]
- Wang, Z.; Zhao, Q.; Wang, S.; Song, Y.; Shi, B.; He, J. Aging and post-aging thermal safety of lithium-ion batteries under complex operating conditions: A comprehensive review. J. Power Sources 2024, 623, 235453. [Google Scholar] [CrossRef]
- Palacín, M.R.; de Guibert, A. Why do batteries fail? Science 2016, 351, 1253292. [Google Scholar] [CrossRef]
- Tian, Y.; Lin, C.; Li, H.; Du, J.; Xiong, R. Detecting undesired lithium plating on anodes for lithium-ion batteries—A review on the in-situ methods. Appl. Energy 2021, 300, 117386. [Google Scholar] [CrossRef]
- Jeevarajan, J.A.; Duffield, B.E. Performance and Safety of Lithium-Ion Polymer Pouch Cells. J. Space Saf. Eng. 2014, 1, 10–16. [Google Scholar] [CrossRef]
- Wang, Z.; Song, Y.; Yin, B.; Shi, B.; Li, Z.; Yu, J. Effect of ambient pressure on the fire characteristics of lithium-ion battery energy storage container. J. Loss Prev. Process Ind. 2024, 92, 105459. [Google Scholar] [CrossRef]
- Yu, H.; Wang, L.; Zhang, Z.; Li, Y.; Yang, S.; He, X. Insight Understanding of External Pressure on Lithium Plating in Commercial Lithium-Ion Batteries. Adv. Funct. Mater. 2024, 34, 2406966. [Google Scholar] [CrossRef]
- Cannarella, J.; Arnold, C.B. Stress evolution and capacity fade in constrained lithium-ion pouch cells. J. Power Sources 2014, 245, 745–751. [Google Scholar] [CrossRef]
- Mussa, A.S.; Klett, M.; Lindbergh, G.; Lindström, R.W. Effects of external pressure on the performance and ageing of single-layer lithium-ion pouch cells. J. Power Sources 2018, 385, 18–26. [Google Scholar] [CrossRef]
- Chen, X.; Hu, Y.; Li, S.; Wang, Y.; Li, D.; Luo, C.; Xue, X.; Xu, F.; Zhang, Z.; Gong, Z.; et al. State of health (SoH) estimation and degradation modes analysis of pouch NMC532/graphite Li-ion battery. J. Power Sources 2021, 498, 229884. [Google Scholar] [CrossRef]
- Ding, S.; Wang, L.; Dai, H.; He, X. Prognosticating nonlinear degradation in lithium-ion batteries: Operando pressure as an early indicator preceding other signals of capacity fade and safety risks. Energy Storage Mater. 2025, 75, 103998. [Google Scholar] [CrossRef]
- Li, W.; Yang, F.; Wang, K.; Wu, X.; Ling, M.; Shen, X.; Yang, X.; Lin, Z.; Wu, K.; Liang, C. Clarifying the Effect of Pressure on Performance in Lithium-Ion Batteries. J. Electrochem. Soc. 2025, 172, 010512. [Google Scholar] [CrossRef]
- Hoenicke, P.; Khatri, R.; Bauer, C.; Osama, M.; Kallo, J.; Willich, C. Influence of Low Pressures on the Performance of Lithium Ion Batteries for Airplane Applications. J. Electrochem. Soc. 2023, 170, 060541. [Google Scholar] [CrossRef]
- Xiong, R.; Li, H.; Mei, B.-A.; He, H.; Shen, W. Revealing the effect of external pressure on solid-electrolyte interphase and lithium plating in lithium-ion batteries. J. Energy Chem. 2025, 102, 734–744. [Google Scholar] [CrossRef]
- Liu, S.; Winter, M.; Lewerenz, M.; Becker, J.; Sauer, D.U.; Ma, Z.; Jiang, J. Analysis of cyclic aging performance of commercial Li4Ti5O12-based batteries at room temperature. Energy 2019, 173, 1041–1053. [Google Scholar] [CrossRef]
- Zhu, J.; Darma, M.S.D.; Knapp, M.; Sørensen, D.R.; Heere, M.; Fang, Q.; Wang, X.; Dai, H.; Mereacre, L.; Senyshyn, A.; et al. Investigation of lithium-ion battery degradation mechanisms by combining differential voltage analysis and alternating current impedance. J. Power Sources 2020, 448, 227575. [Google Scholar] [CrossRef]
- Fath, J.P.; Dragicevic, D.; Bittel, L.; Nuhic, A.; Sieg, J.; Hahn, S.; Alsheimer, L.; Spier, B.; Wetzel, T. Quantification of aging mechanisms and inhomogeneity in cycled lithium-ion cells by differential voltage analysis. J. Energy Storage 2019, 25, 100813. [Google Scholar] [CrossRef]
- Yin, T.; Jia, L.; Li, X.; Zheng, L.; Dai, Z. Effect of High-Rate Cycle Aging and Over-Discharge on NCM811 (LiNi0.8Co0.1Mn0.1O2) Batteries. Energies 2022, 15, 2862. [Google Scholar] [CrossRef]
- Cai, Z.; Mendoza, S.; Goodman, J.; McGann, J.; Han, B.; Sanchez, H.; Spray, R. The Influence of Cycling, Temperature, and Electrode Gapping on the Safety of Prismatic Lithium-Ion Batteries. J. Electrochem. Soc. 2020, 167, 160515. [Google Scholar] [CrossRef]
- Barcellona, S.; Colnago, S.; Dotelli, G.; Latorrata, S.; Piegari, L. Aging effect on the variation of Li-ion battery resistance as function of temperature and state of charge. J. Energy Storage 2022, 50, 104658. [Google Scholar] [CrossRef]
- Cook, R.W.; Swan, L.G.; Plucknett, K.P. Failure mode analysis of lithium ion batteries operated for low Earth orbit CubeSat applications. J. Energy Storage 2020, 31, 101561. [Google Scholar] [CrossRef]
- Liu, S.; Su, J.; Zhao, J.; Chen, X.; Zhang, C.; Huang, T.; Wu, J.; Yu, A. Unraveling the capacity fading mechanisms of LiNi0.6Co0.2Mn0.2O2 at elevated temperatures. J. Power Sources 2018, 393, 92–98. [Google Scholar] [CrossRef]
- Dubarry, M.; Truchot, C.; Liaw, B.Y. Synthesize battery degradation modes via a diagnostic and prognostic model. J. Power Sources 2012, 219, 204–216. [Google Scholar] [CrossRef]
- Pastor-Fernández, C.; Uddin, K.; Chouchelamane, G.H.; Widanage, W.D.; Marco, J. A Comparison between Electrochemical Impedance Spectroscopy and Incremental Capacity-Differential Voltage as Li-ion Diagnostic Techniques to Identify and Quantify the Effects of Degradation Modes within Battery Management Systems. J. Power Sources 2017, 360, 301–318. [Google Scholar] [CrossRef]
- Liu, Y.; Mao, G.; Yang, M.; Jiang, J.; Jiang, J. Slight Overcharge Aging Behaviors and Thermal Runaway Characteristics of Li(Ni0.5Co0.2Mn0.3)O2/Graphite Batteries at Different Ambient Temperatures. ACS Appl. Energy Mater. 2023, 6, 6760–6772. [Google Scholar] [CrossRef]
- Liu, J.; Zhou, L.; Zhang, Y.; Wang, J.; Wang, Z. Aging behavior and mechanisms of lithium-ion battery under multi-aging path. J. Clean. Prod. 2023, 423, 138678. [Google Scholar] [CrossRef]
- Guo, J.; Jin, S.; Sui, X.; Huang, X.; Xu, Y.; Li, Y.; Kristensen, P.K.; Wang, D.; Pedersen, K.; Gurevich, L.; et al. Unravelling and quantifying the aging processes of commercial Li(Ni0.5Co0.2Mn0.3)O2/graphite lithium-ion batteries under constant current cycling. J. Mater. Chem. A 2023, 11, 41–52. [Google Scholar] [CrossRef]
- Guo, J.; Li, Y.; Meng, J.; Pedersen, K.; Gurevich, L.; Stroe, D.-I. Understanding the mechanism of capacity increase during early cycling of commercial NMC/graphite lithium-ion batteries. J. Energy Chem. 2022, 74, 34–44. [Google Scholar] [CrossRef]
- Cai, Q.; Ji, Q.; Chen, X.; Wang, T.; Li, L.; Yuan, Q.; Gao, S.; Cheng, Y.-j. Comprehensive study of high-temperature calendar aging on cylinder Li-ion battery. Chem. Eng. Sci. 2024, 298, 120355. [Google Scholar] [CrossRef]
- Schmidt, A.; Smith, A.; Ehrenberg, H. Power capability and cyclic aging of commercial, high power lithium ion battery cells with respect to different cell designs. J. Power Sources 2019, 425, 27–38. [Google Scholar] [CrossRef]
- Liu, J.; Duan, Q.; Ma, M.; Zhao, C.; Sun, J.; Wang, Q. Aging mechanisms and thermal stability of aged commercial 18650 lithium ion battery induced by slight overcharging cycling. J. Power Sources 2020, 445, 227263. [Google Scholar] [CrossRef]
- Barcellona, S.; Piegari, L. Effect of current on cycle aging of lithium ion batteries. J. Energy Storage 2020, 29, 101310. [Google Scholar] [CrossRef]
- Hosen, M.S.; Yadav, P.; Van Mierlo, J.; Berecibar, M. A Post-Mortem Study Case of a Dynamically Aged Commercial NMC Cell. Energies 2023, 16, 1046. [Google Scholar] [CrossRef]
- Atalay, S.; Sheikh, M.; Mariani, A.; Merla, Y.; Bower, E.; Widanage, W.D. Theory of battery ageing in a lithium-ion battery: Capacity fade, nonlinear ageing and lifetime prediction. J. Power Sources 2020, 478, 229026. [Google Scholar] [CrossRef]
- Zhu, X.; Revilla, R.I.; Jaguemont, J.; Van Mierlo, J.; Hubin, A. Insights into Cycling Aging of LiNi0.80Co0.15Al0.05O2 Cathode Induced by Surface Inhomogeneity: A Post-mortem Analysis. J. Phys. Chem. C 2019, 123, 30046–30058. [Google Scholar] [CrossRef]
- Zhu, H.; Ma, J.; Ding, H.; Wu, H.; Zhang, C.; Fang, X.; Xuan, H.; Lao, L.; Ni, L.; Wang, X. Experimental study of capacity fading mechanism in multiple overdischarge on LiNi0.5Co0.2Mn0.3O2&LiMn2O4/graphite lithium-ion batteries. Ceram. Int. 2024, 50, 35537–35548. [Google Scholar]
- Ouyang, D.; Weng, J.; Chen, M.; Wang, J. Impact of high-temperature environment on the optimal cycle rate of lithium-ion battery. J. Energy Storage 2020, 28, 101242. [Google Scholar] [CrossRef]
Disclaimer/Publisher’s Note: The statements, opinions and data contained in all publications are solely those of the individual author(s) and contributor(s) and not of MDPI and/or the editor(s). MDPI and/or the editor(s) disclaim responsibility for any injury to people or property resulting from any ideas, methods, instructions or products referred to in the content. |
© 2025 by the authors. Licensee MDPI, Basel, Switzerland. This article is an open access article distributed under the terms and conditions of the Creative Commons Attribution (CC BY) license (https://creativecommons.org/licenses/by/4.0/).