Article

Lithium Growth on Alloying Substrates and Effect on Volumetric Expansion

1
Nanoscale Sciences Department, Sandia National Laboratories, Albuquerque, NM 87123, USA
2
Materials Characterization and Performance, Sandia National Laboratories, Albuquerque, NM 87123, USA
*
Author to whom correspondence should be addressed.
Batteries 2025, 11(7), 249; https://doi.org/10.3390/batteries11070249 (registering DOI)
Submission received: 9 May 2025 / Revised: 12 June 2025 / Accepted: 23 June 2025 / Published: 29 June 2025
(This article belongs to the Special Issue Batteries: 10th Anniversary)

Abstract

The widespread implementation of next-generation Li metal anodes is limited, in part, due to the formation of dendritic and/or mossy electrodeposits during cycling. These morphologies can lead to battery failure due to the formation of short circuits and significant volumetric expansion at the anode. One strategy to control the electrodeposition of Li metal is to use lithiophilic materials at the anode. Here, we evaluate the impact of Ag and Au on the early stages of Li metal electrodeposition and cycling. The alloying substrates decrease the voltage for Li reduction and improve Li wetting/adhesion. We probe volumetric expansion directly through dilatometry measurements and find that the degree of volumetric expansion is less when lithium is cycled on an alloying substrate compared to a non-alloying substrate (Cu). Dilatometry experiments reveal that Au has the least amount of volumetric expansion and coin cell cycling experiments indicate that Ag yields more stable cycling compared to Au or Cu. The evaluation of in situ cross-sectional images of cycled coin cells shows that Ag has the lowest volumetric expansion in a coin cell format.

1. Introduction

Li metal is an ideal anode material for high-energy-density, next-generation batteries due to its high theoretical capacity (3800 mAh/g) and negative reduction potential (−3.04 V vs. the standard hydrogen electrode). Li metal anodes are hindered by their reactive nature and propensity to form high-surface-area deposits. The reactive nature of Li leads to poor cycling efficiencies, which requires excess active material, compromising energy density. High-surface-area deposits can also cause poor efficiency and lead to dendrite formation or electronically isolated (“dead”) Li. High-surface-area porous Li electrodeposits can also compromise the volumetric energy density, which negates some of the Li anode’s benefits [1,2]. Even with high-efficiency electrolytes, the practical volumetric capacities decrease from Li’s theoretical capacity of 2045 mAh/cm3 to values of less than 350 mAh/cm3, which is less than the volumetric capacity of a porous graphite electrode (558 mAh/cm3) [2].
Many strategies to control the growth of Li and prevent dendrite formation and/or the formation of dead Li have been implemented, including applied pressure, artificial solid electrolyte interphases (SEIs), lithiophilic substrates, 3D current collectors, and electrolyte design and/or additives [3,4,5,6,7,8,9,10,11,12,13,14,15,16]. Of the methods discussed, applied pressure is the only method that results in compact Li electrodeposits close to the theoretical volumetric capacity of Li (1–10 MPa). High pressures are difficult to achieve in typical cell formats (e.g., coin, pouch, and cylindrical cells) and can lead to short circuiting and pore closure in the separators, causing poor Li+ transport [3,4,16]. Artificial SEIs are layers that are electronically passivating and ionically conducting to simulate an ideal SEI. Artificial SEIs can break up and be dispersed throughout the deposit during cycling, which can lead to a decline in performance with cycling [17]. Lithiophilic materials are similar to artificial SEIs, however, rather than acting as an ideal SEI, these materials are incorporated to improve Li morphology [11,14]. In some cases, lithiophilic materials are used with 3D current collectors, like sponges or foams, to improve Li wetting to the substrate [18,19].
Lithiophilic materials typically undergo alloying/dealloying reactions and encompass several classes of materials, including metals, metal oxides, and carbon-based materials [8,12,13,20,21,22,23,24,25,26,27,28,29]. These alloying/dealloying reactions typically occur at voltages more positive than Li electrodepostion/dissolution, which can help to decrease the initial nucleation overpotential. In some cases, the initial alloying process is irreversible and can cause irreversible capacity losses. The alloyed phases can help to control Li electrodeposition morphology, subsequently leading to improved cyclability [27,30,31]. Lithiophilic materials also create an opportunity for increased energy density, since uncontrolled Li electrodeposition results in highly porous morphologies [32,33].
Alloying metals may be categorized into high-solubility and low-solubility materials [11,21,24,34,35]. High-solubility materials (e.g., Ag and Mg) can accommodate more Li atoms per alloying metal atom and exhibit solid solution alloying behavior. Low-solubility materials (e.g., Au and Al) accommodate fewer Li atoms per metal atom and exhibit intermetallic phase alloying behavior [11,36]. For example, Ag is known to form Li12Ag, with some reports implementing an Li20Ag alloy anode, whereas Au forms Li3Au [34,37,38,39,40]. High-solubility materials are reported to enable a longer cycle than low-solubility materials [11].
Here, we investigate Li growth on high-solubility (Ag), low-solubility (Au), and non-alloying (Cu) substrates in coin cells and dilatometer cells. Dilatometer cells allow for direct measurement of the volumetric expansion with each substrate and the measurement of Li electrodeposition growth patterns. We also evaluate the extent of volumetric expansion in cycled coin cells through cross-sectional imaging of the electrode/separator/electrode through localized laser ablation on a laser plasma focused ion beam (laser PFIB) instrument. The consequence of extensive Li volumetric expansion depends on the cell format. Uncontrolled volumetric expansion in pouch cells can cause the pouch cell to swell. For rigid cells (coin cells and cylindrical cells), uncontrolled volumetric expansion may lead to separator shredding and short circuiting of the cell [41].

2. Materials and Methods

2.1. Electrolyte Preparation

Electrolytes were prepared in an Ar-filled glovebox (O2 and H2O < 0.2 ppm). 1,2-Dimethoxyethane (DME) and 1,3-dioxolane (DOL) were purchased from Sigma Aldrich (Sigma-Aldrich, Burlington, MA, USA) and dried on activated alumina for 48 h prior to use. Lithium bis(trifluoromethylsulfonyl)imide (LiTFSI) was purchased from Ossilla (Ossilla Ltd, Sheffield, UK) and lithium nitrate (LiNO3) was purchased from Sigma Aldrich (Sigma-Aldrich, Burlington, MA, USA). Both salts were dried in a heated glovebox antechamber under vacuum at 100 °C (LiTFSI) and 60 °C (LiNO3) prior to use. The 1 M LiTFSI solution was prepared by measuring the desired amount of salt and adding the corresponding volume of a DOL:DME solvent mixture (50:50, v:v). LiNO3 was then added to the LiTFSI in DOL:DME solution at a concentration of 5 wt% (such that 5   wt % = m LiNO 3 m LiNO 3 + m LiTFSI   in   DOL : DME × 100 ).

2.2. Fabrication of Alloying Substrates

Alloying substrates were fabricated by depositing the material onto Cu foils using electron beam evaporation. The Cu foils (9 µm thick) were etched in 1.2 M HCl, rinsed with 18 MΩ water, rinsed with acetone, transferred into an Ar-filled glovebox, and then transferred into a home-built electron beam deposition system. The Cu substrates and a witness sample were taped to an Al-covered alumina plate and loaded into the deposition system. The chamber was pumped down to a base pressure of 10−7 torr. The deposition rate and total thickness of each layer were monitored by a quartz crystal microbalance. Ag (99.9%) and Au (99.99%) thin films were deposited at rates between 2 and 8 Å/s to a total thickness of 100 or 500 nm. The deposited thicknesses were verified by profilometry on the witness samples using a DektakXT stylus profilometer (Bruker, Hamburg, Germany) following IOS-4518.
After deposition, the system was allowed to cool under vacuum and was then brought back up to atmospheric pressure with N2. As soon as the system reached atmospheric pressure, the coated Cu foils were placed into a N2-filled glovebox and double bagged in nylon bags with silica desiccant and a humidity indicator. The samples were stored in a dry box until they could be transferred into an Ar-filled glovebox.

2.3. Electrochemical Characterization

CR2032 coin cells (SS316L Hohsen Corp, Osaka, Japan) were assembled in an Ar-filled glovebox (O2 and H2O < 0.2 ppm). The cells were built with a 16 mm diameter Li counter electrode (50 µm Li on 10 µm Cu, Albermarle, Charlotte, NC, USA), two 2325 Celgard separators with 80 µL of electrolyte, and a 12 mm diameter Cu working electrode (9 µm) or metal-coated Cu working electrode. Two separators were used to maintain consistency with prior work [2,17,42]. The Cu working electrodes were etched using the same procedure described in Section 2.2. All coin cells contained one wave spring, two 0.2 mm spacers, and one 1 mm spacer (total stack height of 2.8 mm: 1.4 mm spacers and 1.4 mm wave spring).
Dilatometer measurements were conducted using an ECD-3 electrochemical dilatometer (EL-CELL GmbH, Hamburg, Germany), which is a three-electrode cell with a height sensor at the working electrode. A 12 mm, 50 µm Li counter electrode was used, separated from the 10 mm Cu or metal-coated Cu working electrode by a glass t-frit (6.26 mm thick). The ECD-3 reference electrode pin was loaded with Li from Li foil (Alfa Aesar, Ward Hill, MA, USA, 99.9%). The same electrode materials were used in the dilatometer as the coin cells, with adjusted diameters to fit the dimensions of the dilatometer cell. Approximately 0.5 mL of electrolyte was added to the dilatometer cell.
Cell cycling and dilatometry measurements were conducted using a VMP3 multichannel potentiostat (Biologic, Seyssinet-Pariset, France). Cells were cycled at 1 mA/cm2 and 0.1 mA/cm2 to 1 mAh/cm2 with a cutoff voltage of +/− 1 V. Time was increased during the electrodissolution step to allow for observations of partial or hard short circuits.

2.4. Scanning Electron Microscopy/Energy-Dispersive X-Ray Spectroscopy (SEM/EDS)

Coin cells were disassembled at different points during the first Li electrodeposition step (0.05, 0.1, 0.3, and 1 mAh/cm2) using a commercial coin cell decrimping tool (Hohsen Corp, Osaka, Japan) in an Ar-filled glovebox. The working electrodes were extracted from the disassembled coin cells and then washed with dry DME. The samples were loaded onto an SEM stub, sealed in a mason jar, and transferred from the glovebox to an inert glovebag that was sealed around an SEM (Zeiss Supra 55VP, Carl Zeiss AG, Oberkochen, Germany). The glovebag was purged with Ar, the jar was opened, and the stub was loaded into the SEM, which was then pumped down. The samples were imaged between 2 and 5 keV at a working distance of 4 mm. An Oxford X-Max 80 EDS detector (Oxford Instruments, Abingdon, UK) provided elemental information for the samples. Each SEM image was from a different cell from which the working electrode was extracted and imaged.

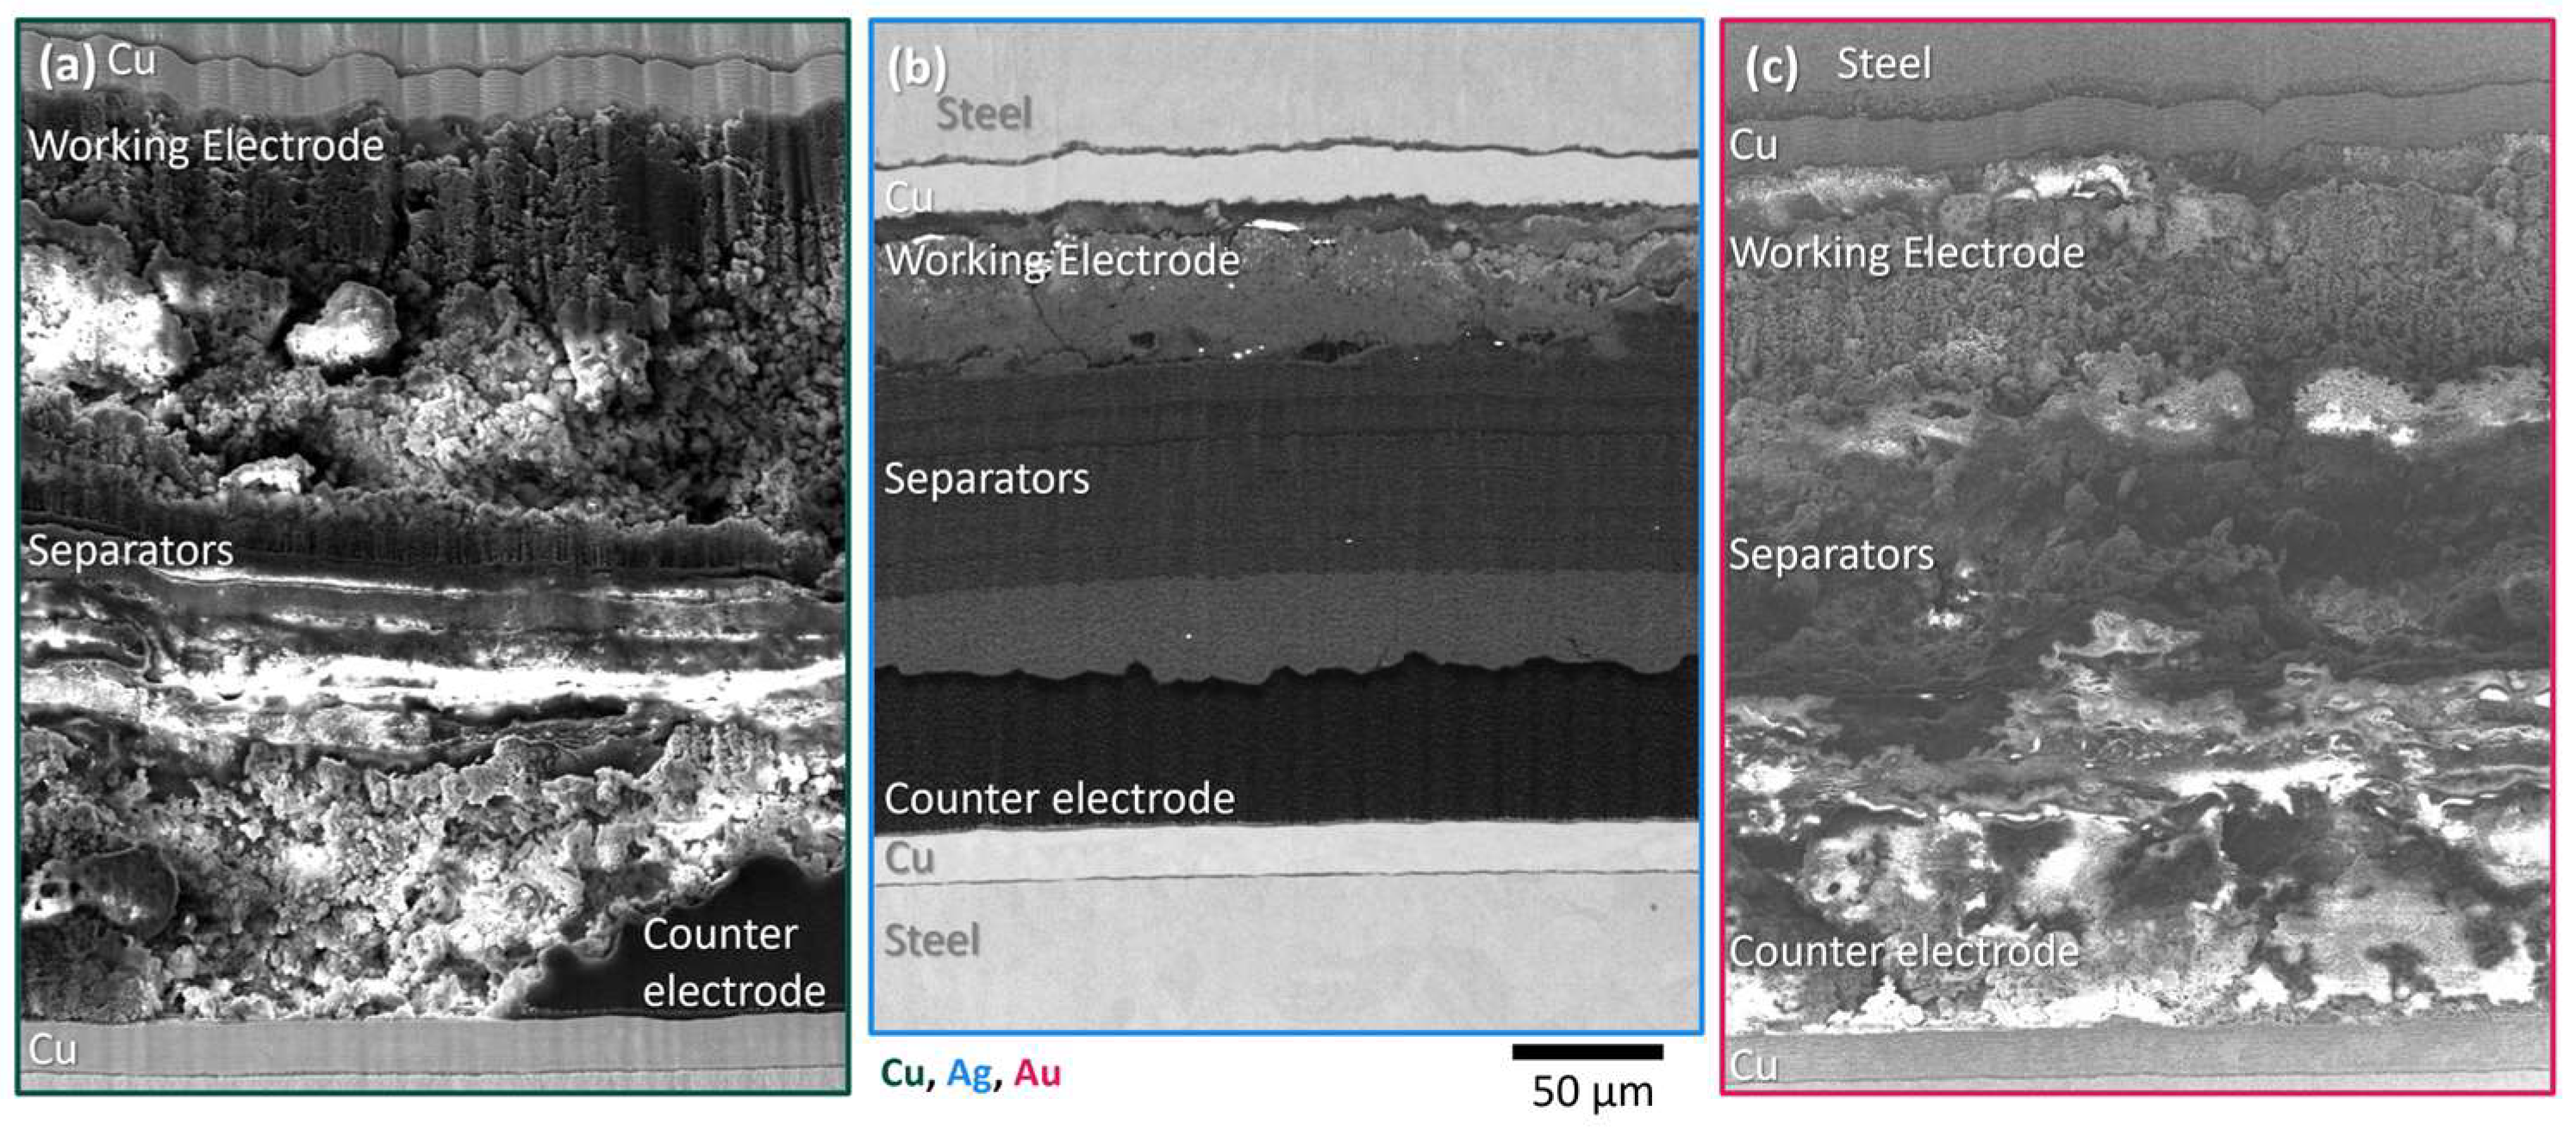
2.5. Laser Plasma Focused Ion Beam (Laser PFIB) Cross Sectional Imaging

A ThermoFisher Scientific Helios 5 Laser PFIB (ThermoFisher Scientific, Waltham, MA, USA) was used to cross-section the electrode stack without disassembling the coin cell. Laser PFIB sample preparation and laser ablation processes are elaborated upon in previous works; therefore, we limit the description here [2,4,41]. Each coin cell was placed in a custom coin cell holder and loaded into the Laser PFIB, which was then pumped down immediately and cryo cooled. Laser cross-sectioning was performed approximately one hour after the start of the cooling process to guarantee that the sample had completely come down to a temperature of approximately −190 °C. First, a coarse mill (with a 1030 nm fs-laser) removed approximately 1.2 mm by 1 mm of material near a region of interest. Then, a second mill ‘clean-up’ step was used to remove any artifacts from the initial cut on the cross-sectional surface of interest. A final polish (515 nm second harmonic beam) was used to remove as much laser damage as possible. The final polish step was repeated or altered depending on the individual cell. After cross-sectioning, the samples were imaged using backscatter and secondary electron detectors, with the chosen current and beam energy dependent on the charging behavior, image contrast, and resolution of each individual sample. EDS analysis via an Oxford EDS detector (Oxford Instruments, Abingdon, UK) provided elemental information for the electrode stack and chemical behavior of the cell.

3. Results and Discussion

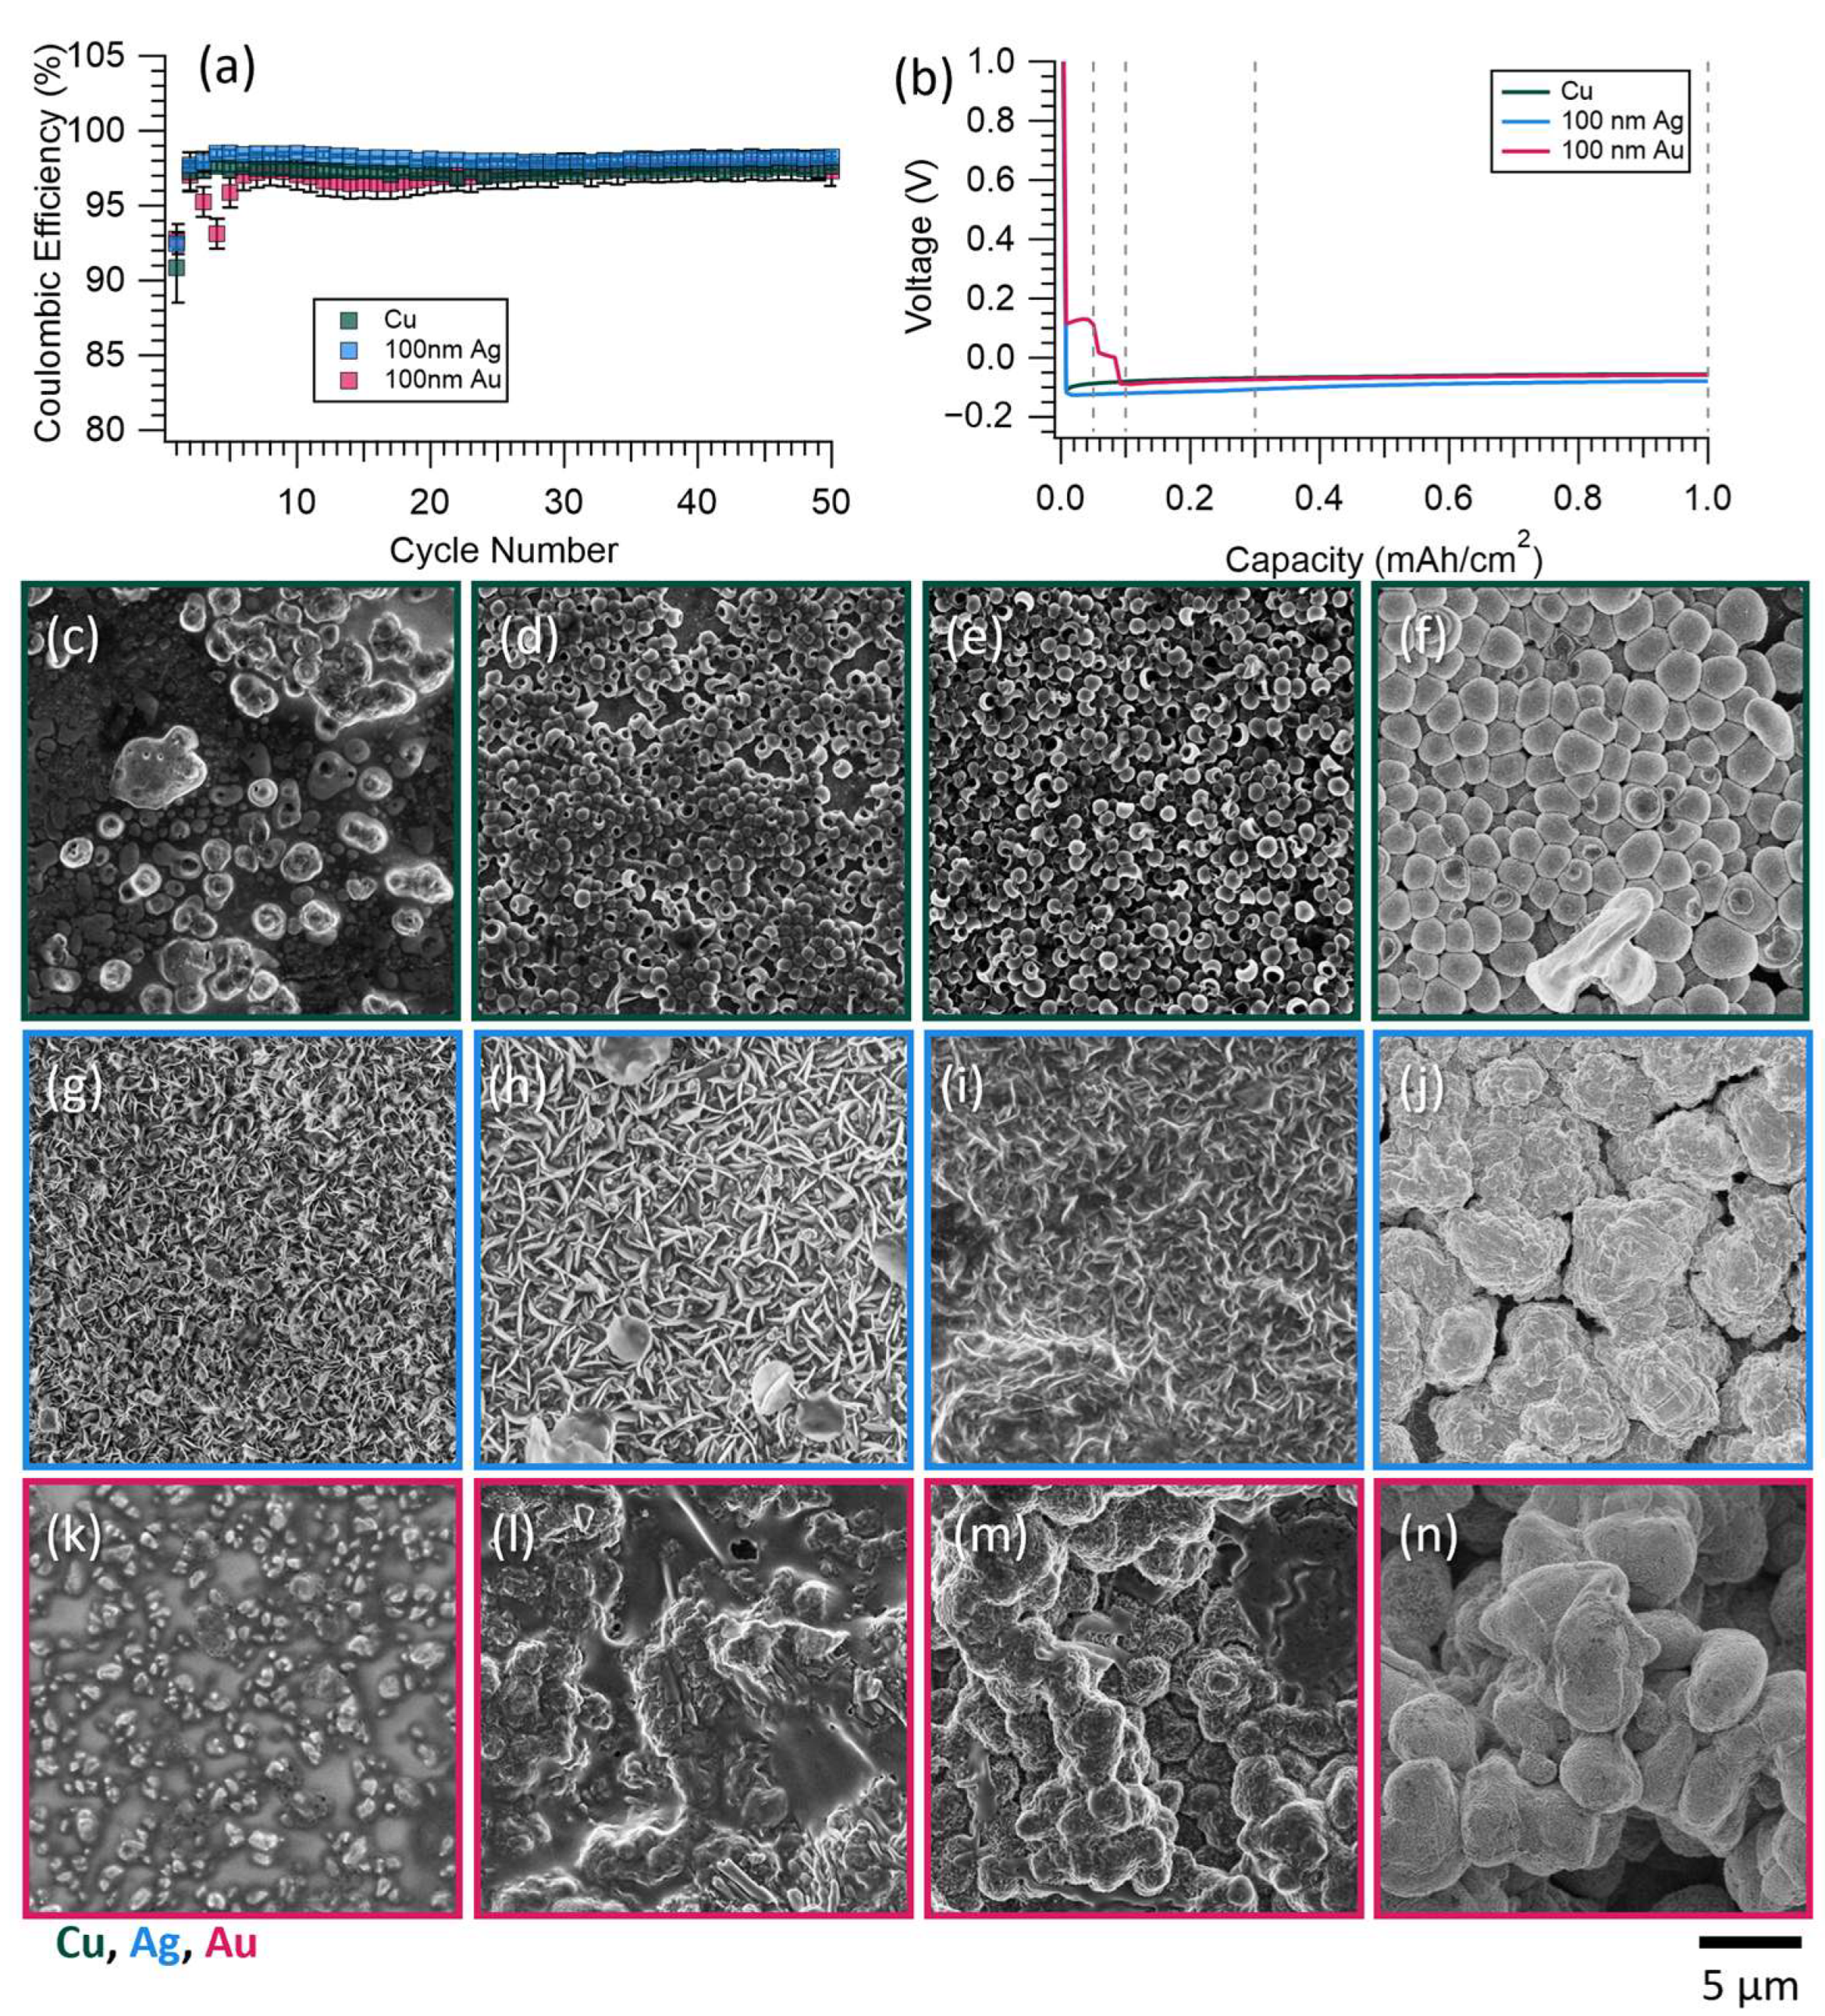
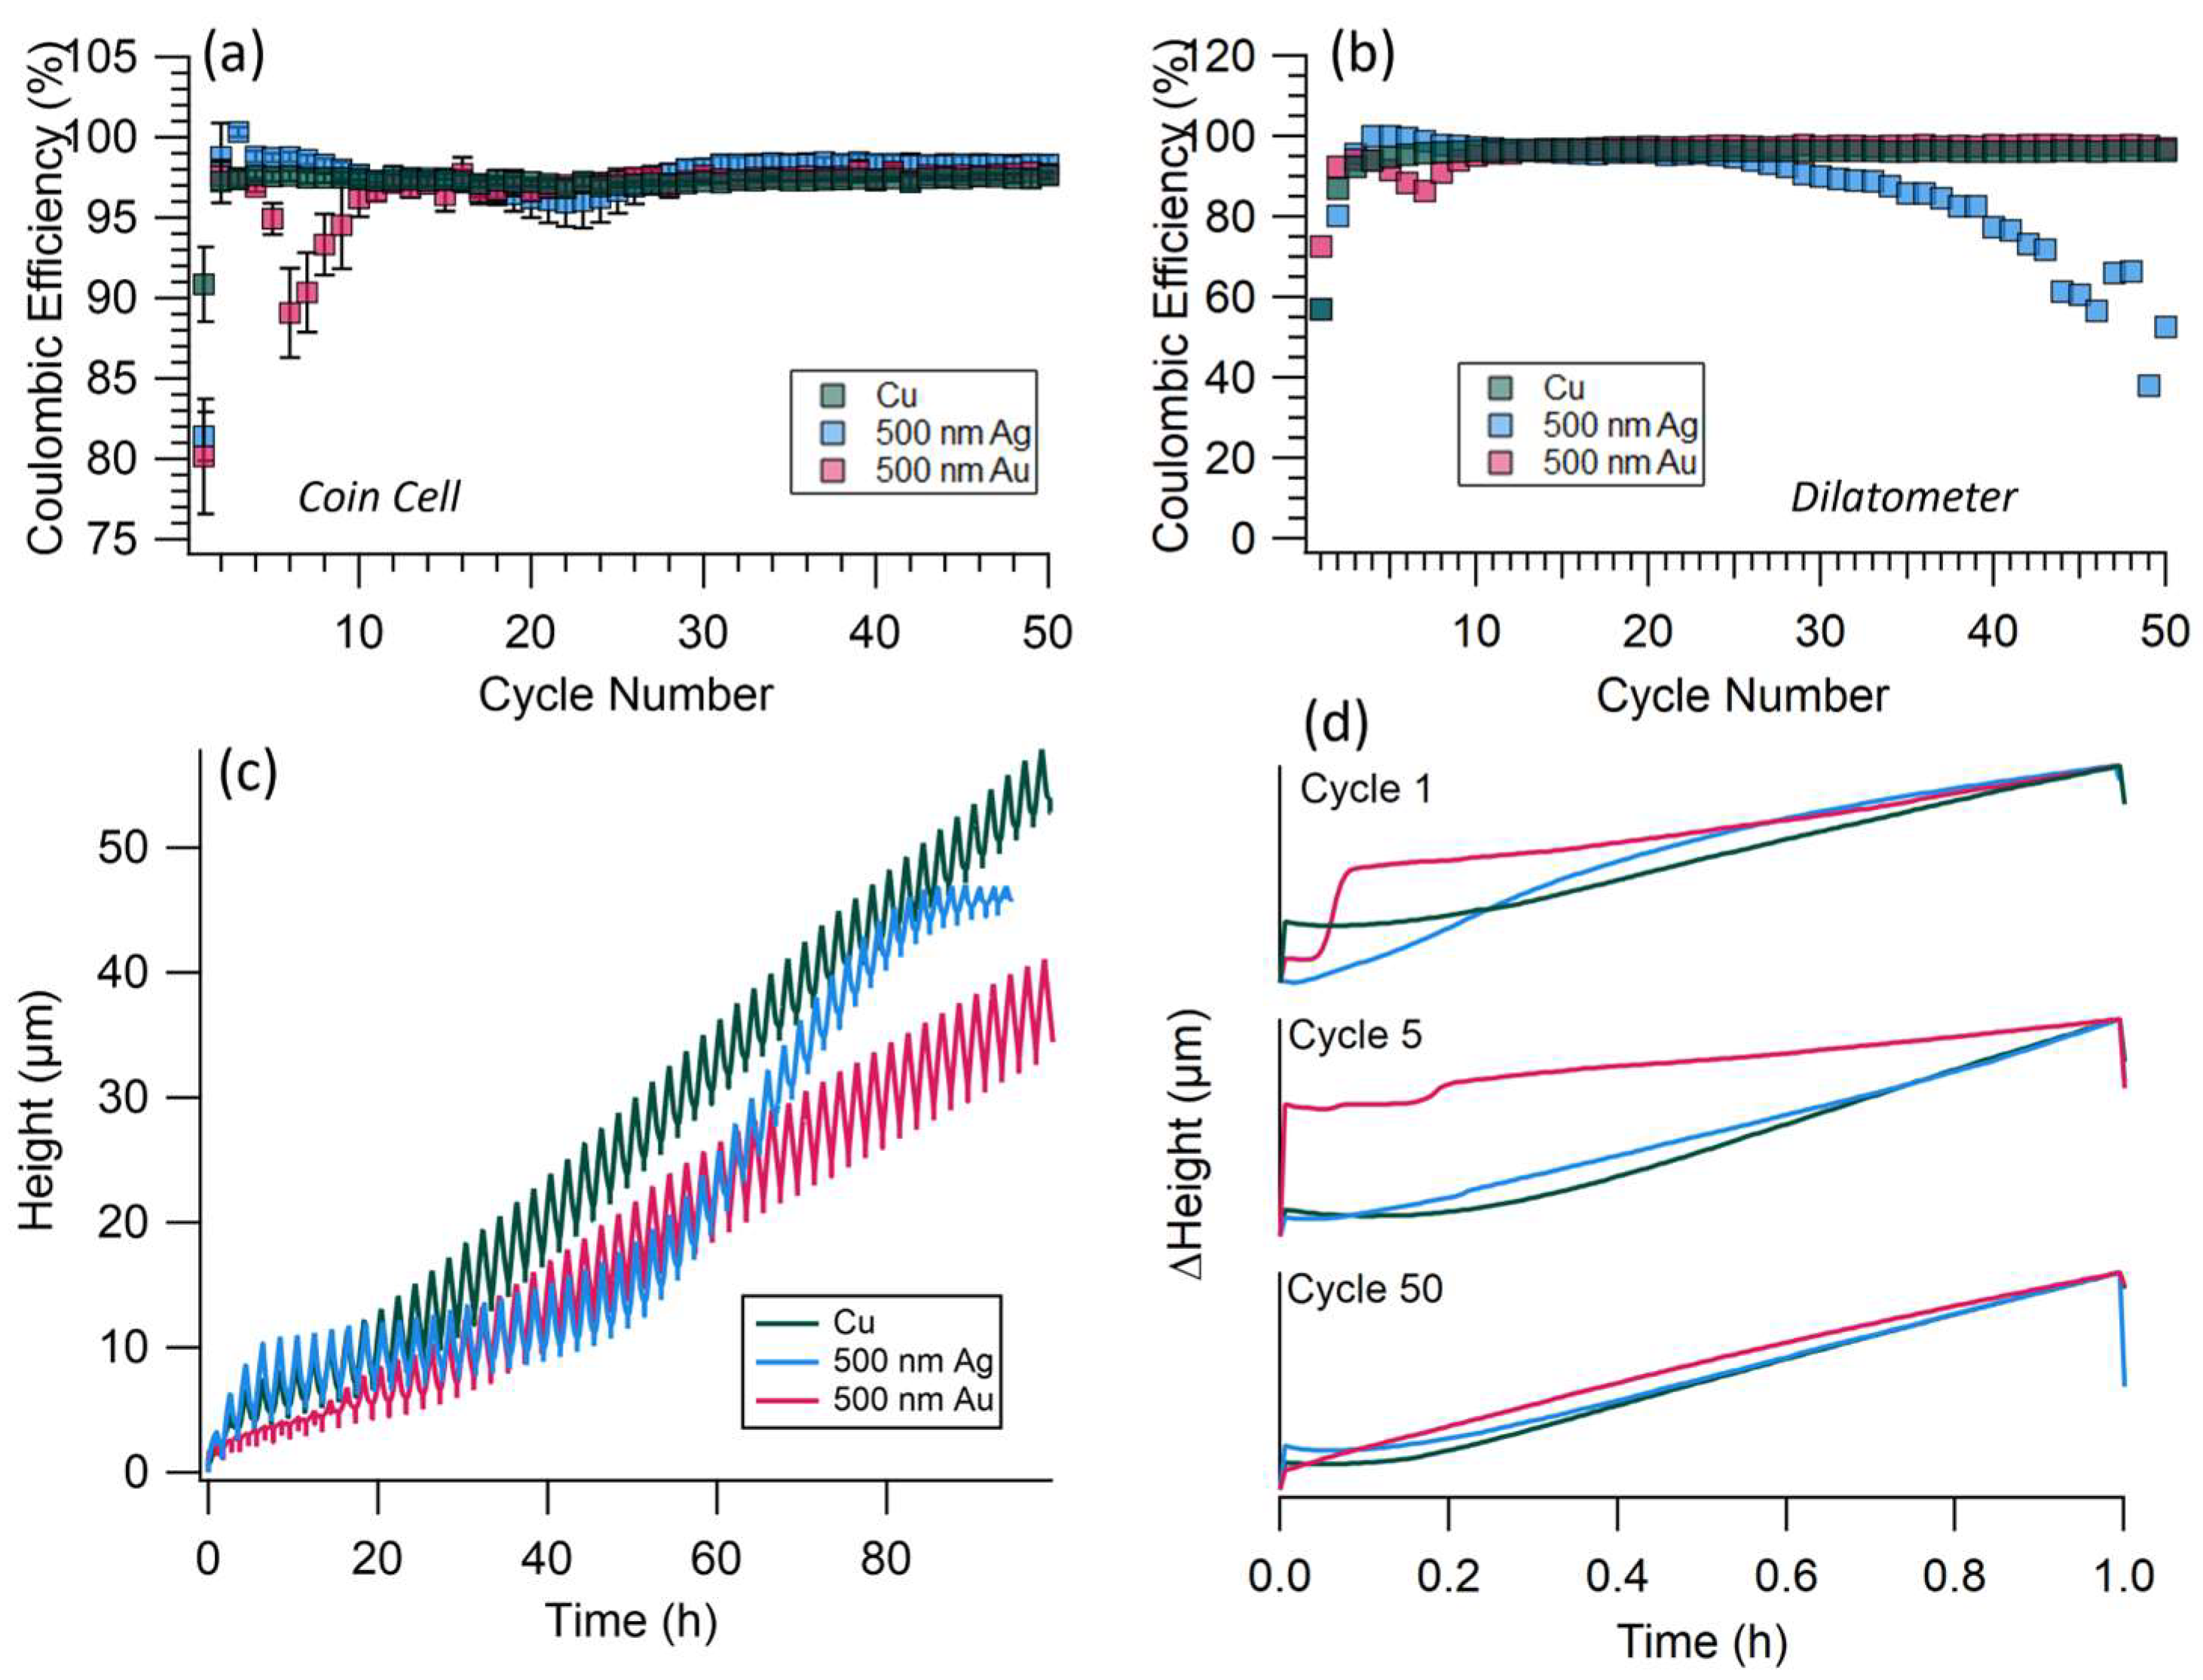
3.1. Coin Cell Results

Li cycling experiments were conducted on each substrate to establish their baseline performance. The Li cycling experiments measured the Li alloying/dealloying and the Li electrodeposition/dissolution processes simultaneously on Ag and Au. Effective cycling was demonstrated on each substrate for 50 cycles, as shown in Figure 1a, with average CEs of 97.2% with Cu, 97.0% with 100 nm Au, and 98.0% with 100 nm Ag. The same data with extended cycling up to 100 cycles is shown in Figure S1 (Supplementary Materials). The average CE with Au decreased slightly due to irreversible alloying that occurred within the first few cycles. The voltages associated with Li-Au alloying can be observed for the first four cycles, as shown in Figure S2, with voltage profiles for individual cycles shown in Figure S3. The voltage profiles with the Ag substrate for individual cycles are shown in Figure S4.
Li cycling efficiencies began to drop around cycle 60 with the Cu and Au substrates, as shown in Figure S1. The Ag substrate supported stable Li cycling for 90 cycles. Studies suggest that Li cycling on Au fails before Ag due to Au’s lower Li solubility [11,36]. The literature suggests that the influence of Au on the Li electrodeposit morphology and cycling performance becomes compromised once the Au becomes saturated with Li, whereas the Li-rich solid solution phases that form with Ag enable an extended cycle life [11]. Here, we observed Li cycling failure earlier than in other reports, likely due to slight changes in materials and/or methods (e.g., electrolyte source materials or method to deposit Ag). We note that increasing the LiNO3 concentration in the electrolyte improved the cycling efficiencies and extended the cycle life, as shown in Figure S5, and that cell failure may have been caused, in part, by LiNO3 consumption.
Figure 1b shows the voltage vs. time curves for the first Li electrodeposition. An obvious alloying plateau is not observed during the first electrodeposition step with the Ag substrate. An oxide formed on the Ag surface due to transfer between the electron beam evaporation system and the glovebox. The absence of this alloying plateau is likely due to the surface chemistry as a result of oxide formation. After the first electrodeposition step, a small alloying peak can be observed in the voltage vs. time curves and the magnitude of the electrodeposition overvoltage decreased in the coin cells, as shown in Figure S4. Figure S2 shows that the deposition overvoltage increased to values above 0 V vs. Li with cycling. While Li is predicted to undergo several alloying reactions with Ag, between 0 and 0.25 V vs. Li, as outlined in Table S1, distinct voltage plateaus are not frequently observed in the literature [11,34,40,43,44,45,46]. Cyclic voltammograms (CVs), as shown in Figure S6, show a decreased overvoltage for Li reduction on Ag compared to Cu substrates, as well as a dealloying peak around 0.5 V. A small peak associated with Li-Ag alloying is observed in the CV only when the scan rate is decreased to 0.1 mV/s (Figure S7), which suggests that the alloying process is transport limited. Similar CVs are reported in the literature for Ag substrates and coatings [43,47]. Li electrodeposition on the Au substrate exhibited two distinct plateaus due to the alloying process, as shown in Figure 1b. Two alloying peaks are also present in the CV shown in Figure S6. The two peaks/plateaus correspond with two alloying reactions between Li and Au ( Li + Au LiAu , 0.215 V, and LiAu + 2 Li Li 3 Au , 0.134 V), tabulated in Table S1 [37,38,39].
Figure 1c–n show SEM images of the Li electrodeposited to different capacities (0.05, 0.1, 0.3, and 1 mAh/cm2) on each substrate. At 0.05 mAh/cm2, the Li electrodeposit nucleation sites were very sparse and clustered on the Cu substrate, uniform and tightly packed on the Ag substrate, and sparse and uniform on the Au substrate. As electrodeposition on the Ag substrate progressed, the small, needle-like deposits began to coalesce, forming large Li electrodeposits. The electrodeposits on the Au substrate also coalesced as electrodeposition progressed, but were less homogeneous than the electrodeposits on the Ag substrate. These differences in Li electrodeposit morphology may be partly related to the differences in Li solubility within the Au vs. the Ag. Table S2 estimates how much capacity would theoretically go to Li3Au and Li9Ag intermetallic formation, assuming a dense/uniform film. The estimates indicate that all the Au and Ag would be converted to these species; however, we anticipate that not all the Au/Ag are initially accessed, and, therefore, less capacity likely goes to the initial alloying reactions than what is tabulated in Table S2. While the formation of Li3Au and Li9Ag has been referenced as complete lithiation, reports also suggest the formation of Li15Au4 and Li12Ag and the use of Li20Ag as an anode material. We include the highest lithiated alloys in our capacity estimations in Table S2 [11,34,37,38,39,40].
EDS maps of the electrodeposits are shown in Figures S8–S10. At 1 mAh/cm2, the EDS of the alloying substrates shows that the Au signal is pocketed, and the Ag signal is dispersed throughout the deposit. This reflects the respective the Li-alloying behaviors with each substrate [36]. Similar behavior is reported for high- and low-solubility alloying materials in the literature [11]. The Li electrodeposits on the lithiophilic substrates formed larger grains compared to the Li electrodeposits on the Cu substrate. Table S3 shows the average particle diameter/length with each substrate. The electrodeposits on Cu were spheres and were smaller on average, which suggests poor wetting of the Li electrodeposits to the substrate or unfavorable interfacial energies.

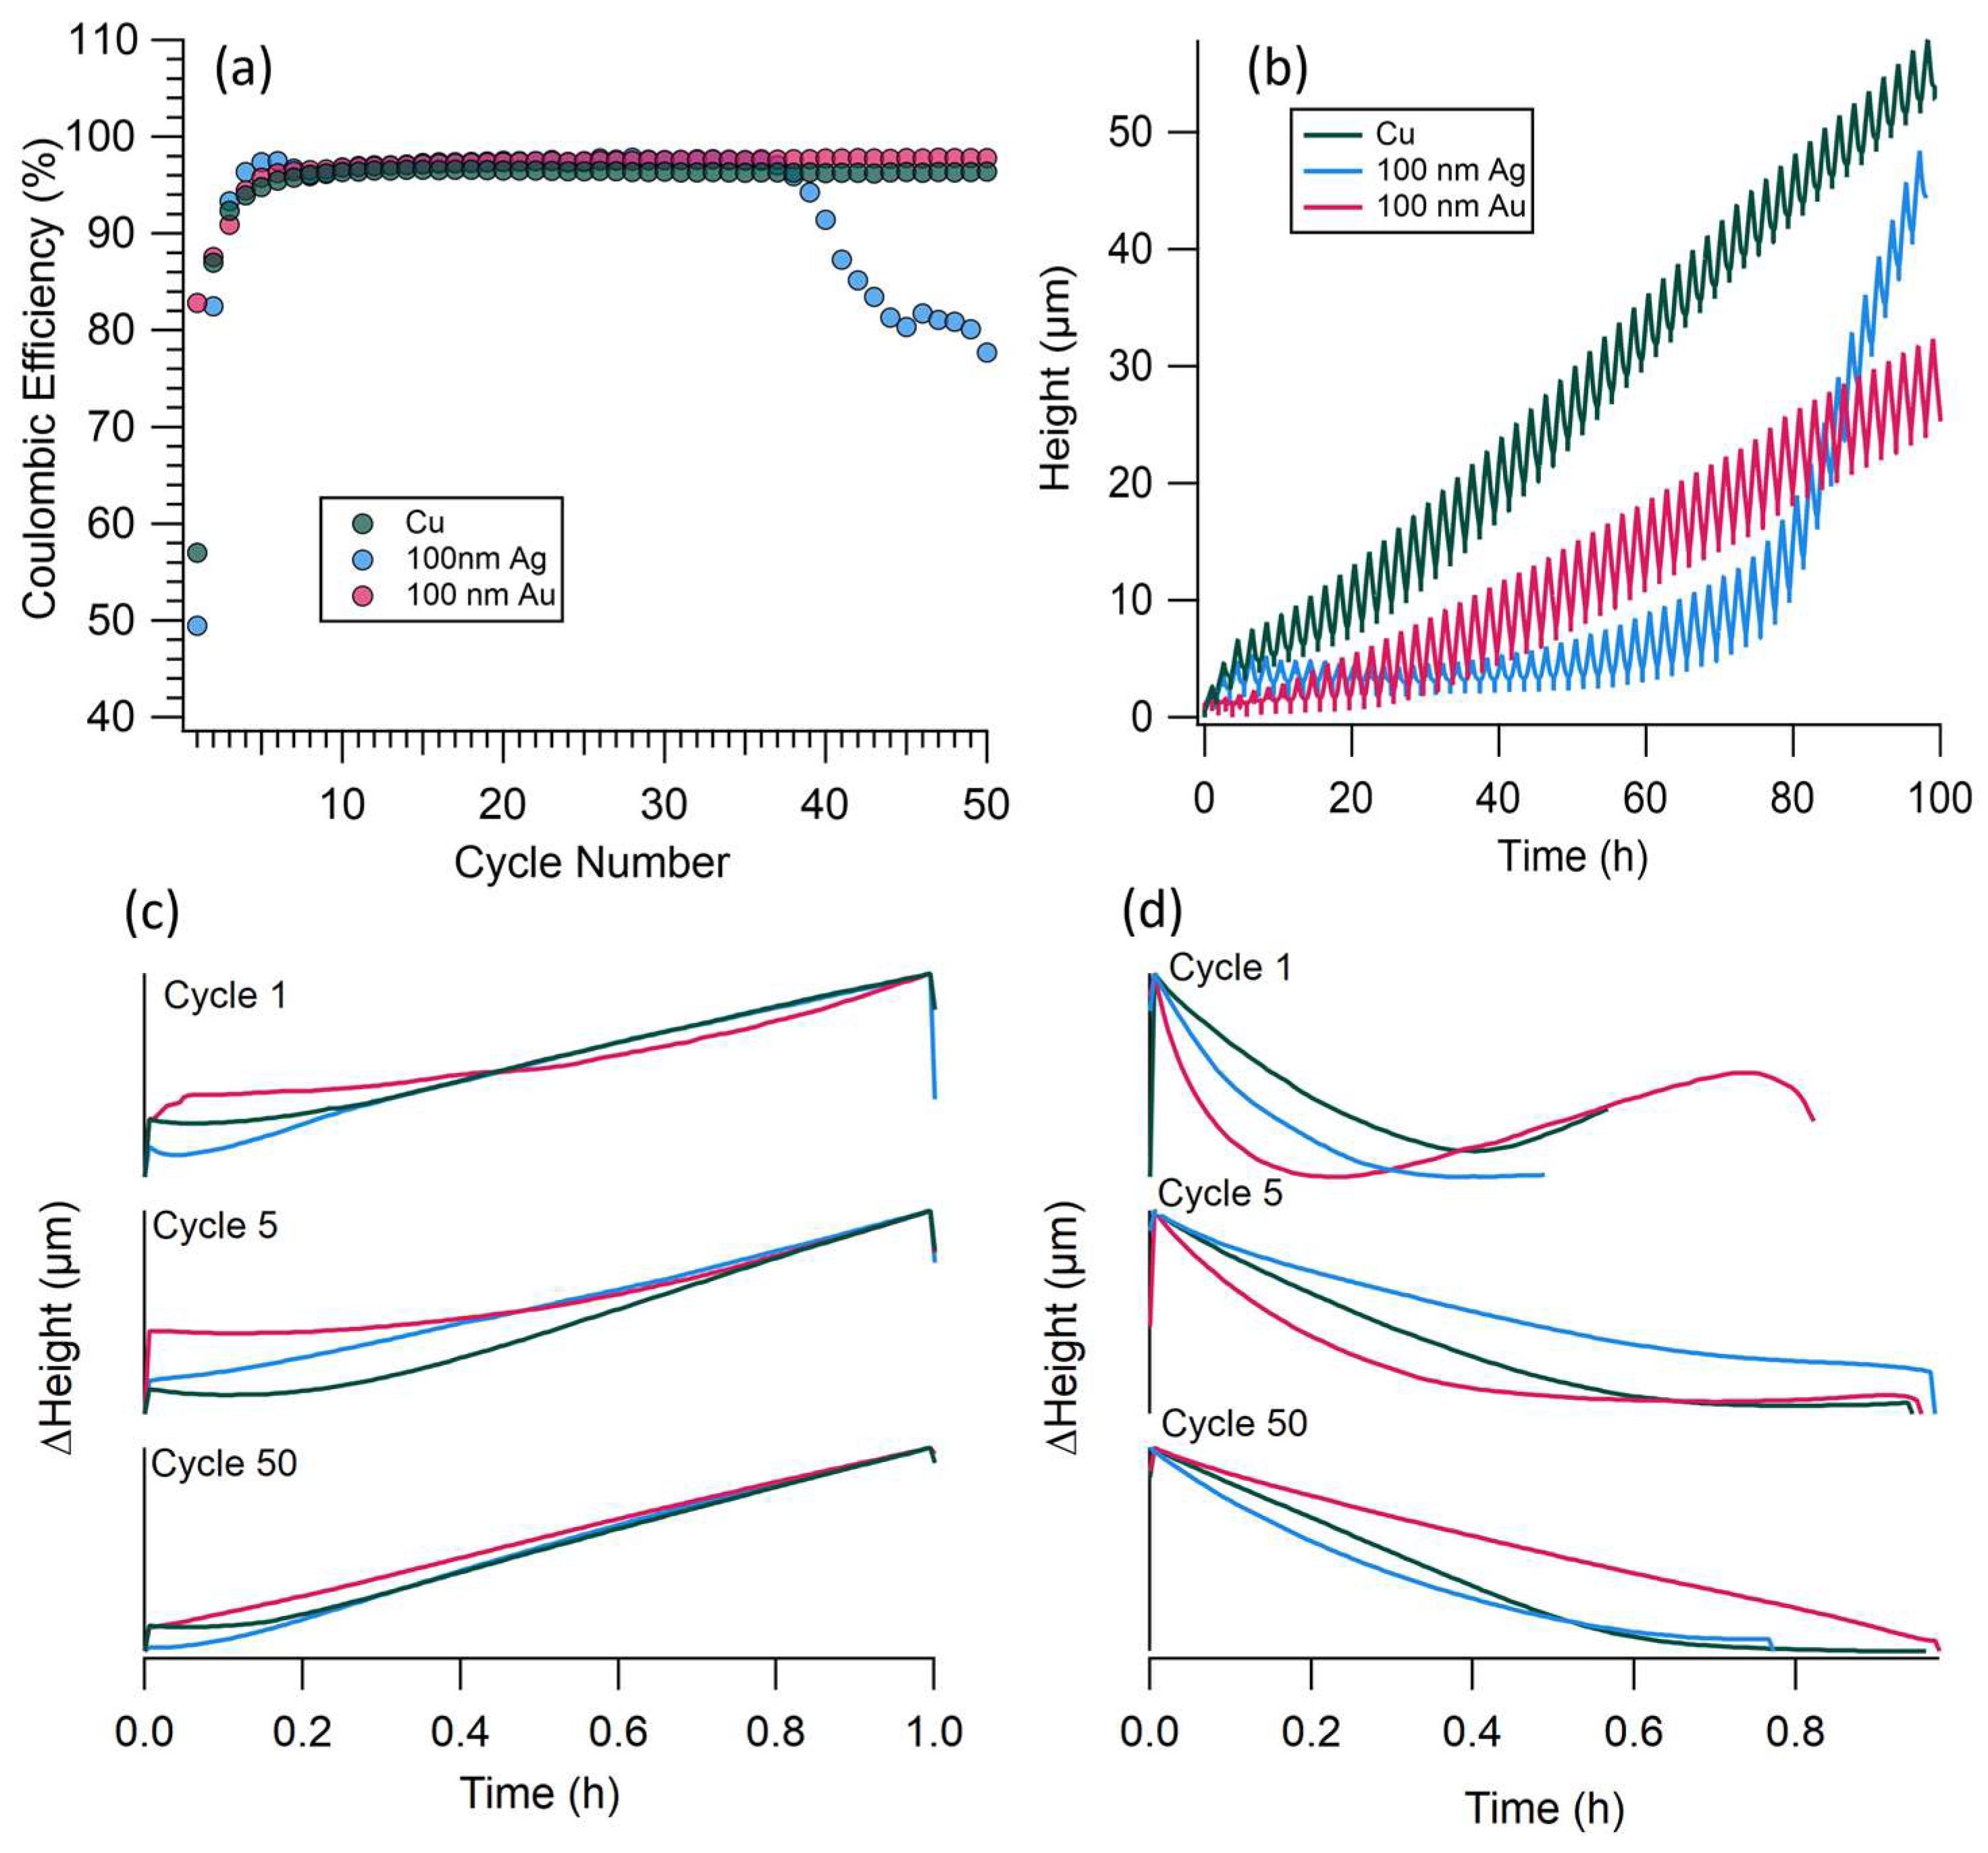
3.2. Dilatometer Results

In operando dilatometry was used to monitor the volumetric expansion of Li electrodeposits with cycling and the growth profiles of Li on each substrate. Here, we compare the effect of non-alloying substrates (Cu) with high-solubility alloying (Ag) and low-solubility alloying (Au) substrates. The dilatometer cell monitors the height at the working electrode using a sensor, and the counter and reference electrodes do not contribute to this measurement. The dilatometer cell is not an exact analog to a coin cell due to its decreased pressure (around 0.02 MPa vs. 0.2 MPa for a coin cell) and thick (6.26 mm) glass-frit separator [48,49].
Figure 2 shows the dilatometry and cycling results for 50 cycles at 1 mA/cm2 for 1 mAh/cm2. Figure S11 shows the corresponding voltage vs. time curves from the dilatometry measurements, and voltage profiles for individual cycles are shown in Figures S3 and S4. Li cycling with the Ag substrate in the dilatometer resulted in lower CEs and earlier failure compared to the coin cells. We hypothesize that this was due to differences in pressure and internal resistance between the dilatometer and the coin cell. Applied pressure has been reported to increase cycle efficiency and stability with Li metal anodes [3,4]. Dilatometry measurements were used to evaluate general growth trends to guide our understanding of Li electrodeposition on each of the substrates.
Figure 2b shows the measured height during cycling. Increases in height are representative of volumetric changes at the working electrode, since the working electrode area is constant (0.785 cm2). All cycling experiments resulted in a sawtooth pattern with cycling. An increase corresponded with Li electrodeposition and a decrease corresponded with Li electrodissolution. The Cu substrate exhibited a near-linear increase in height with cycling. In other words, there was continued volumetric expansion with Li cycling, which was likely caused by continued SEI growth and/or the incomplete electrodissolution of Li. The Au substrate was offset from the Cu substrate, with a decreased total change in height with cycling. This was due to the more controlled cycling observed in early cycles, where small volume changes were observed for about 10 h (or approximately 5 cycles). We hypothesize that during these early cycles, the lithiophilic nature of Au could better control the Li growth. As the Au was dispersed or saturated, its effect became limited with cycling. The voltage plateaus associated with Li-Au alloying went away after 2–3 cycles, as shown in Figure S3. Two height regimes were observed with the Ag substrate. For the first half of cycling, the measured height was nearly constant with cycling. Just before 80 h (or 40 cycles), the height increased significantly with cycling. This rapid increase in height coincided with a decrease in CE during cycling (shown in Figure 2a). The voltage profiles of the dilatometer cell, shown in Figure S4, indicated an increased nucleation overvoltage at later cycles in addition to decreased electrodissolution capacities. The accelerated increase in height was likely caused by a combination of incomplete Li electrodissolution and a buildup of SEI. Before the drop in CE, the Ag substrate showed the best control over Li growth during cycling.
The dilation profile for cycles 1, 5, and 50 are shown in Figure 2c (electrodeposition) and Figure 2d (electrodissolution). These dilation profiles can correspond with linear growth, accelerated growth, and decelerated growth [49]. If the change in height linear, then the Li growth is uniform, or linear. Accelerated growth begins with a slow change in height after the initial nucleation, followed by a more rapid change in height. The formation and growth of high-aspect-ratio Li electrodeposits, or dendrites, causes accelerated growth. This decelerated growth pattern results in an initially fast change in height that slows with time. The initial preferential growth of certain Li nucleation sites, followed by uniform Li growth as the gaps between nucleation sites become filled in, is characteristic of decelerated growth.
The first electrodeposition growth profile is slightly different for each substrate, as shown in Figure 2c. With Au, there is an initial rapid change that is then followed by an accelerated growth pattern. This follows the early electrodeposition behavior observed in Figure 1. First, Li alloys with Au, which causes an initial increase in height. The change in height then slows and increases, suggesting the uniform growth of the electrodeposits until the nucleation sites coalesce, and then certain sites grow preferentially. The dilation profile with Ag and Cu also results in an accelerated growth pattern, however, an initial dip initial dip in the dilation profile is observed with the Ag substrate. The cause of this initial dip is unclear, but may be related to the interactions between Li and Ag’s native oxide layer during early nucleation. Notably, the magnitude of the measured voltage is greater during the first electrodeposition with the Ag substrate for both coin cells and the dilatometer cell, as shown in Figure S4, which could be caused by increased resistance due to the native oxide layer.
The first cycle electrodissolution dilation profile for the Cu and Ag substrates shows a decelerated pattern, whereas the dilation profile for the Au substrate shows a different response. The Au’s dilation profile has an initial decrease in height, followed by a local minimum, then the height increases, and finally decreases. These varying changes in height may be related to the formation of different alloying phases as the Li-Au alloy is delithiated. However, Li dealloying peaks are not observed in the voltage profile in Figure S3. After several cycles, the alloying/dealloying process becomes stabilized and the dilation profile of the Au substrate begins to follow the same decelerated response as the Cu substrate. The decelerated growth profile begins with a linear decrease in height, followed by a plateau. This is characteristic of high-aspect-ratio deposits, or dendrites, preferentially electrodissolving from the tips first, mirroring an accelerated growth profile. During the first cycle, on the electrodissolution step, the Cu substrate shows a slight increase in height after the plateau. This height increase is attributed to additional SEI growth, since it can take several cycles for the SEI to become stabilized.
On cycle 5, the electrodeposition results in an accelerated dilation response with the Au and Cu substrates, while the dilation response with the Ag substrate is linear. The Cu shows the most dramatic accelerated response, likely due to the formation of dendritic deposits. On the following electrodissolution step, the Au and Cu substrates exhibit decelerated dissolution and the Ag substrate exhibits linear dissolution. This suggests that after the first cycle, once Li growth stabilizes, Ag supports uniform Li growth.
At cycle 50, both the Ag and Cu substrates show accelerated growth and decelerated dissolution, and the Au substrate shows linear growth. The Li cycling on Ag begins to drop in CE before reaching cycle 50, whereas the Li cycling on Cu is stable. We hypothesize that the Ag substrate is no longer controlling the growth of Li, which deviates from the coin cell results and is likely due to differences in pressure and internal resistance within the cells. The voltage profiles for the dilatometer cell, shown in Figure S4, show increased nucleation overvoltages at later cycles with the Ag substrate, suggesting SEI buildup, and the formation of dead Li may be contributing to the decreased CE. The gradual slope observed in both the electrodeposition and electrodissolution steps with the dilatometer cell indicates an increase in resistance with electrodeposition/dissolution, potentially due to SEI buildup or as Li grains become inaccessible. The linear growth observed with Au may be caused by the dispersion of the Au through the deposit with cycling. The dispersion of ex situ coatings with cycling has previously been reported with other materials [17,50].

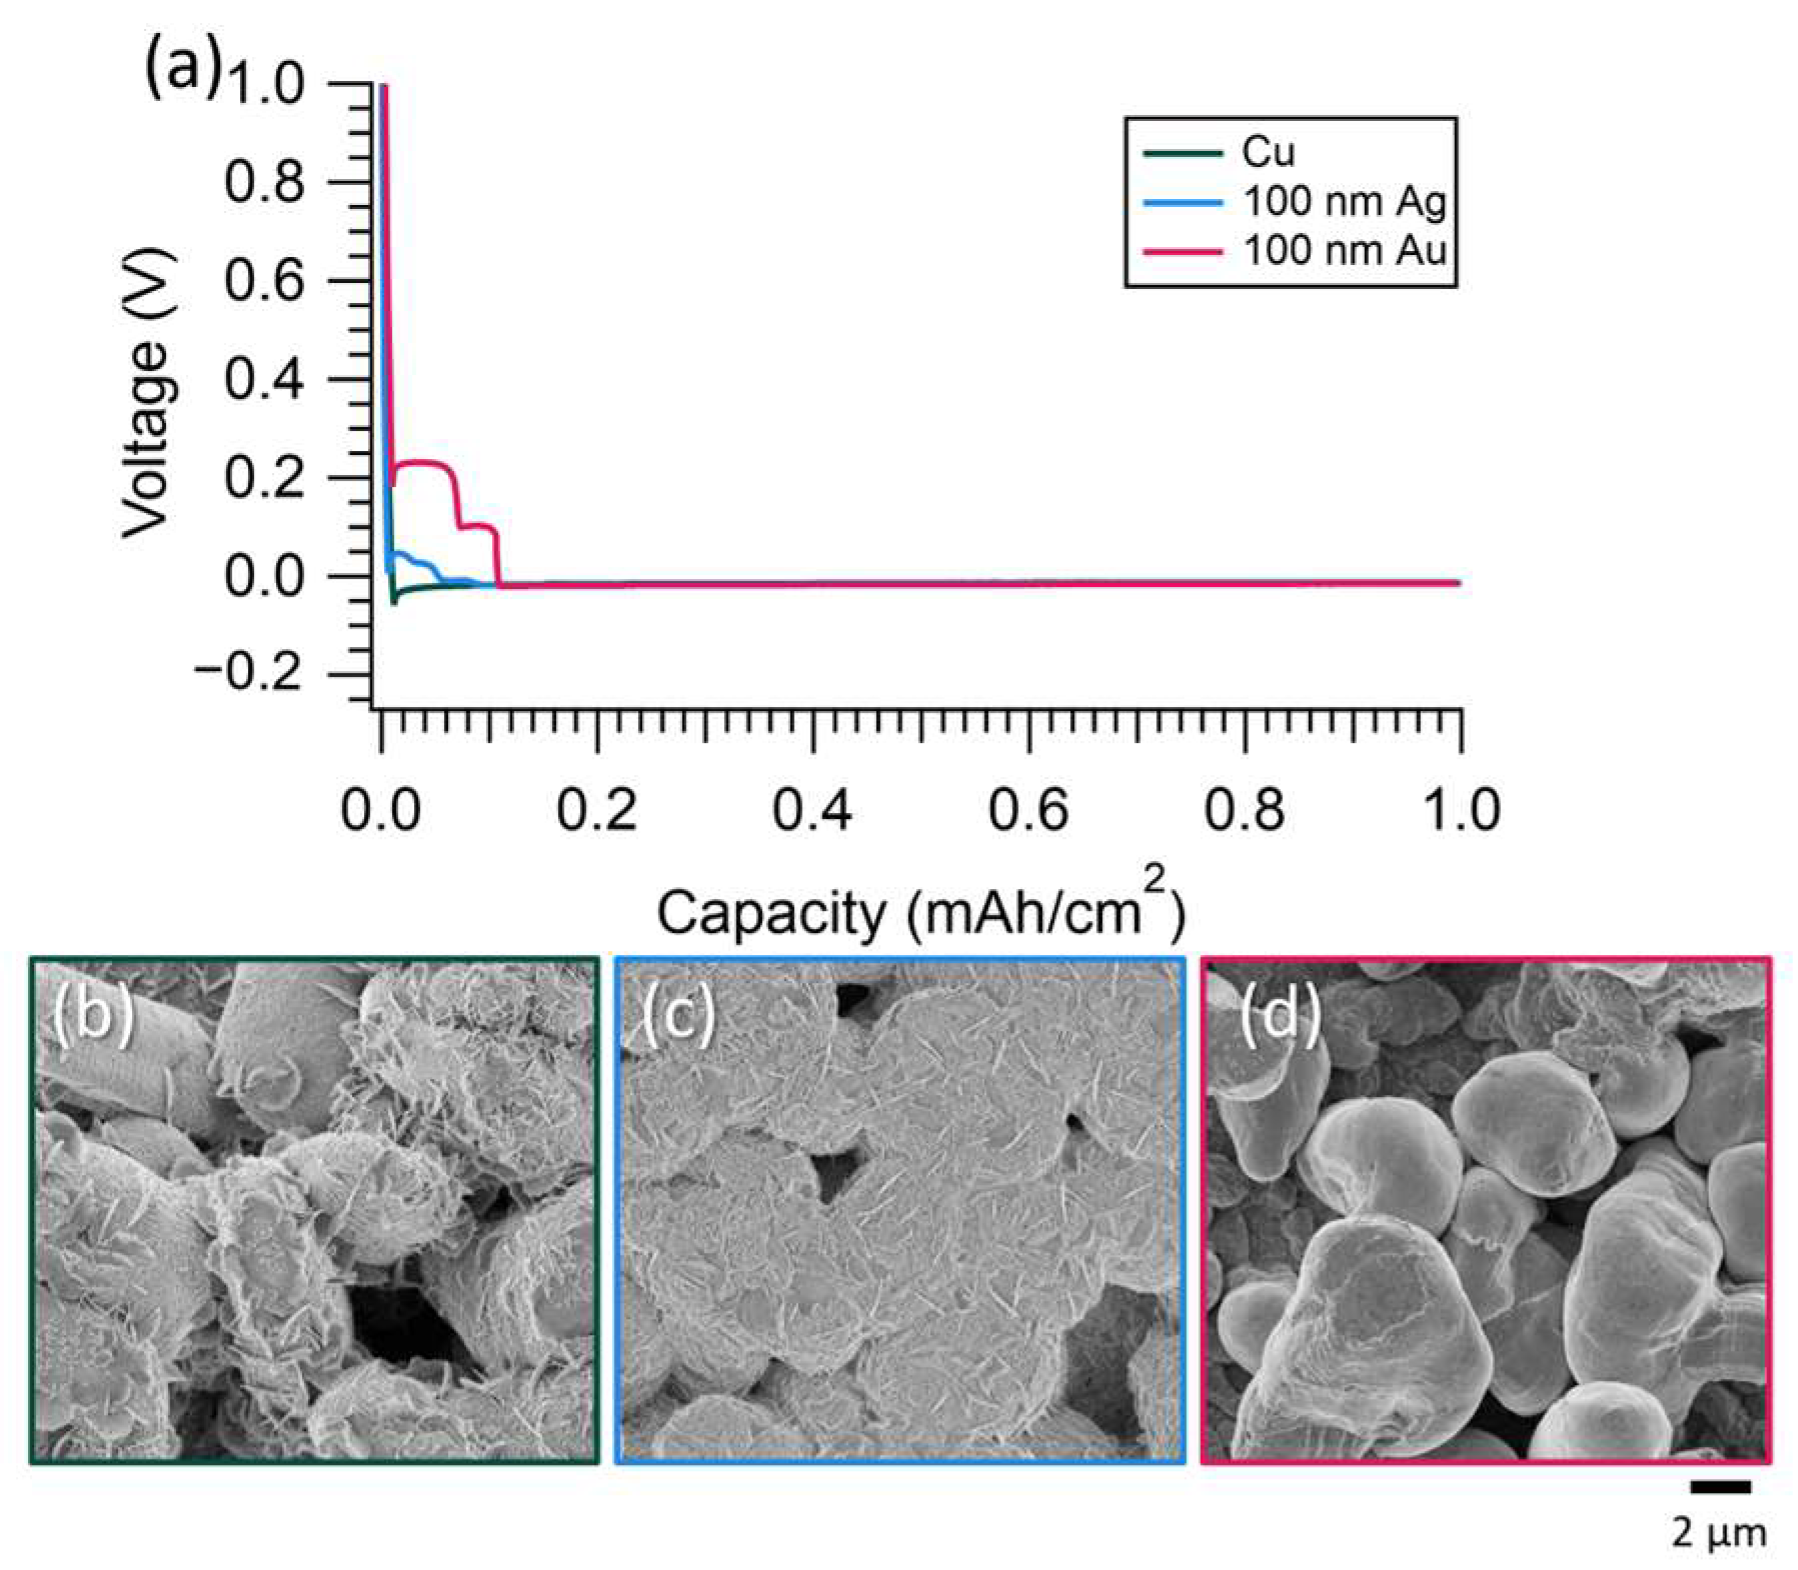
3.3. Decreased Current

The effect of Li transport on each substrate’s growth response was investigated by decreasing the current from 1 mA/cm2 to 0.1 mA/cm2 (to the same capacity, 1 mAh/cm2), as shown in Figure 3. At a low current, Li-Ag alloying peaks were present in the voltage profiles of the coin cells, indicated by the sloping voltage response. This is also observed in the dilatometer voltage profiles in Figure S12. Ag had a native oxide on it due to transfer between the electron beam evaporator and the glovebox, and the rate dependence of the Li-Ag alloying voltage plateau suggests that the Li diffusion through the native oxide was transport limited. This is corroborated by the scan rate dependence of the Li-Ag alloying peak in the CVs previously discussed.
Li electrodeposited at a low rate resulted in larger electrodeposits than Li electrodeposited at a high rate. The greatest difference in the deposit morphology was with the Cu substrate. The lower current allowed for the preferential growth of the Li electrodeposits, leaving areas of the Cu bare, whereas the higher current led to more uniform coverage of the Cu working electrode. Particle size analysis was completed for the Li deposited on each substrate at a high and low rate, tabulated in Table S3. At 1 mA/cm2, Li electrodeposited on Cu in small, regular spheres, but at 0.1 mA/cm2, the electrodeposits were larger with more decomposition products. The wire-like structures present on the deposits were likely some residual salt/electrolyte decomposition products. The low-rate Li electrodeposits on Cu easily sloughed off the Cu substrate and required a gentler rinsing than the other samples. The wire-like structures are not easily observed in the SEM image that corresponds with the EDS measurements due to differences in magnification and imaging conditions (changed to achieve adequate counts) between Figure S13 and Figure 3b. The Li electrodeposits were larger when deposited at a low rate (Table S3), and the EDS shows the same trends in Ag and Au signals as the high-rate EDS images. The electrodeposits were similar in size (around 5 µm), regardless of the substrate, at a low rate.
Figure 4 shows the dilation response of Li cycling at a low rate (0.1 mA/cm2). Only the first 10 cycles are shown because long-term measurements can lead to drift [48,49]. Au and Ag show comparable changes in height with cycling, whereas the Cu shows a significant increase in height and eventually maxes out the sensor. The system is not transport limited at the low rate, which allows for the preferred orientation of the deposit to form [51]. The dilation profiles with the Cu substrate for cycles 1 and 5 (10 is not included due to the sensor reaching its limit) indicate accelerated growth, which likely contributes to the large volumetric expansion observed here.
The dilation response for the first electrodeposition for the Ag and Au substrates showed an increase, then a decrease, and then an increase in height. This variation suggests that the Li ions were transported to favored sites and grew preferentially at a low rate. The volumetric changes that occurred may have been caused by the different Li-Ag phases that formed during the first electrodeposition. Both low- and high-rate dilation responses became more stable by cycle 5. The dilation response for cycle 5 and 10 was linear with the Ag substrate and accelerated with the Au substrate. Regardless of the observed Li growth profiles, both alloying substrates appeared to control Li growth during the first 10 cycles, which resulted in less volumetric expansion compared to the non-alloying substrate, Cu.

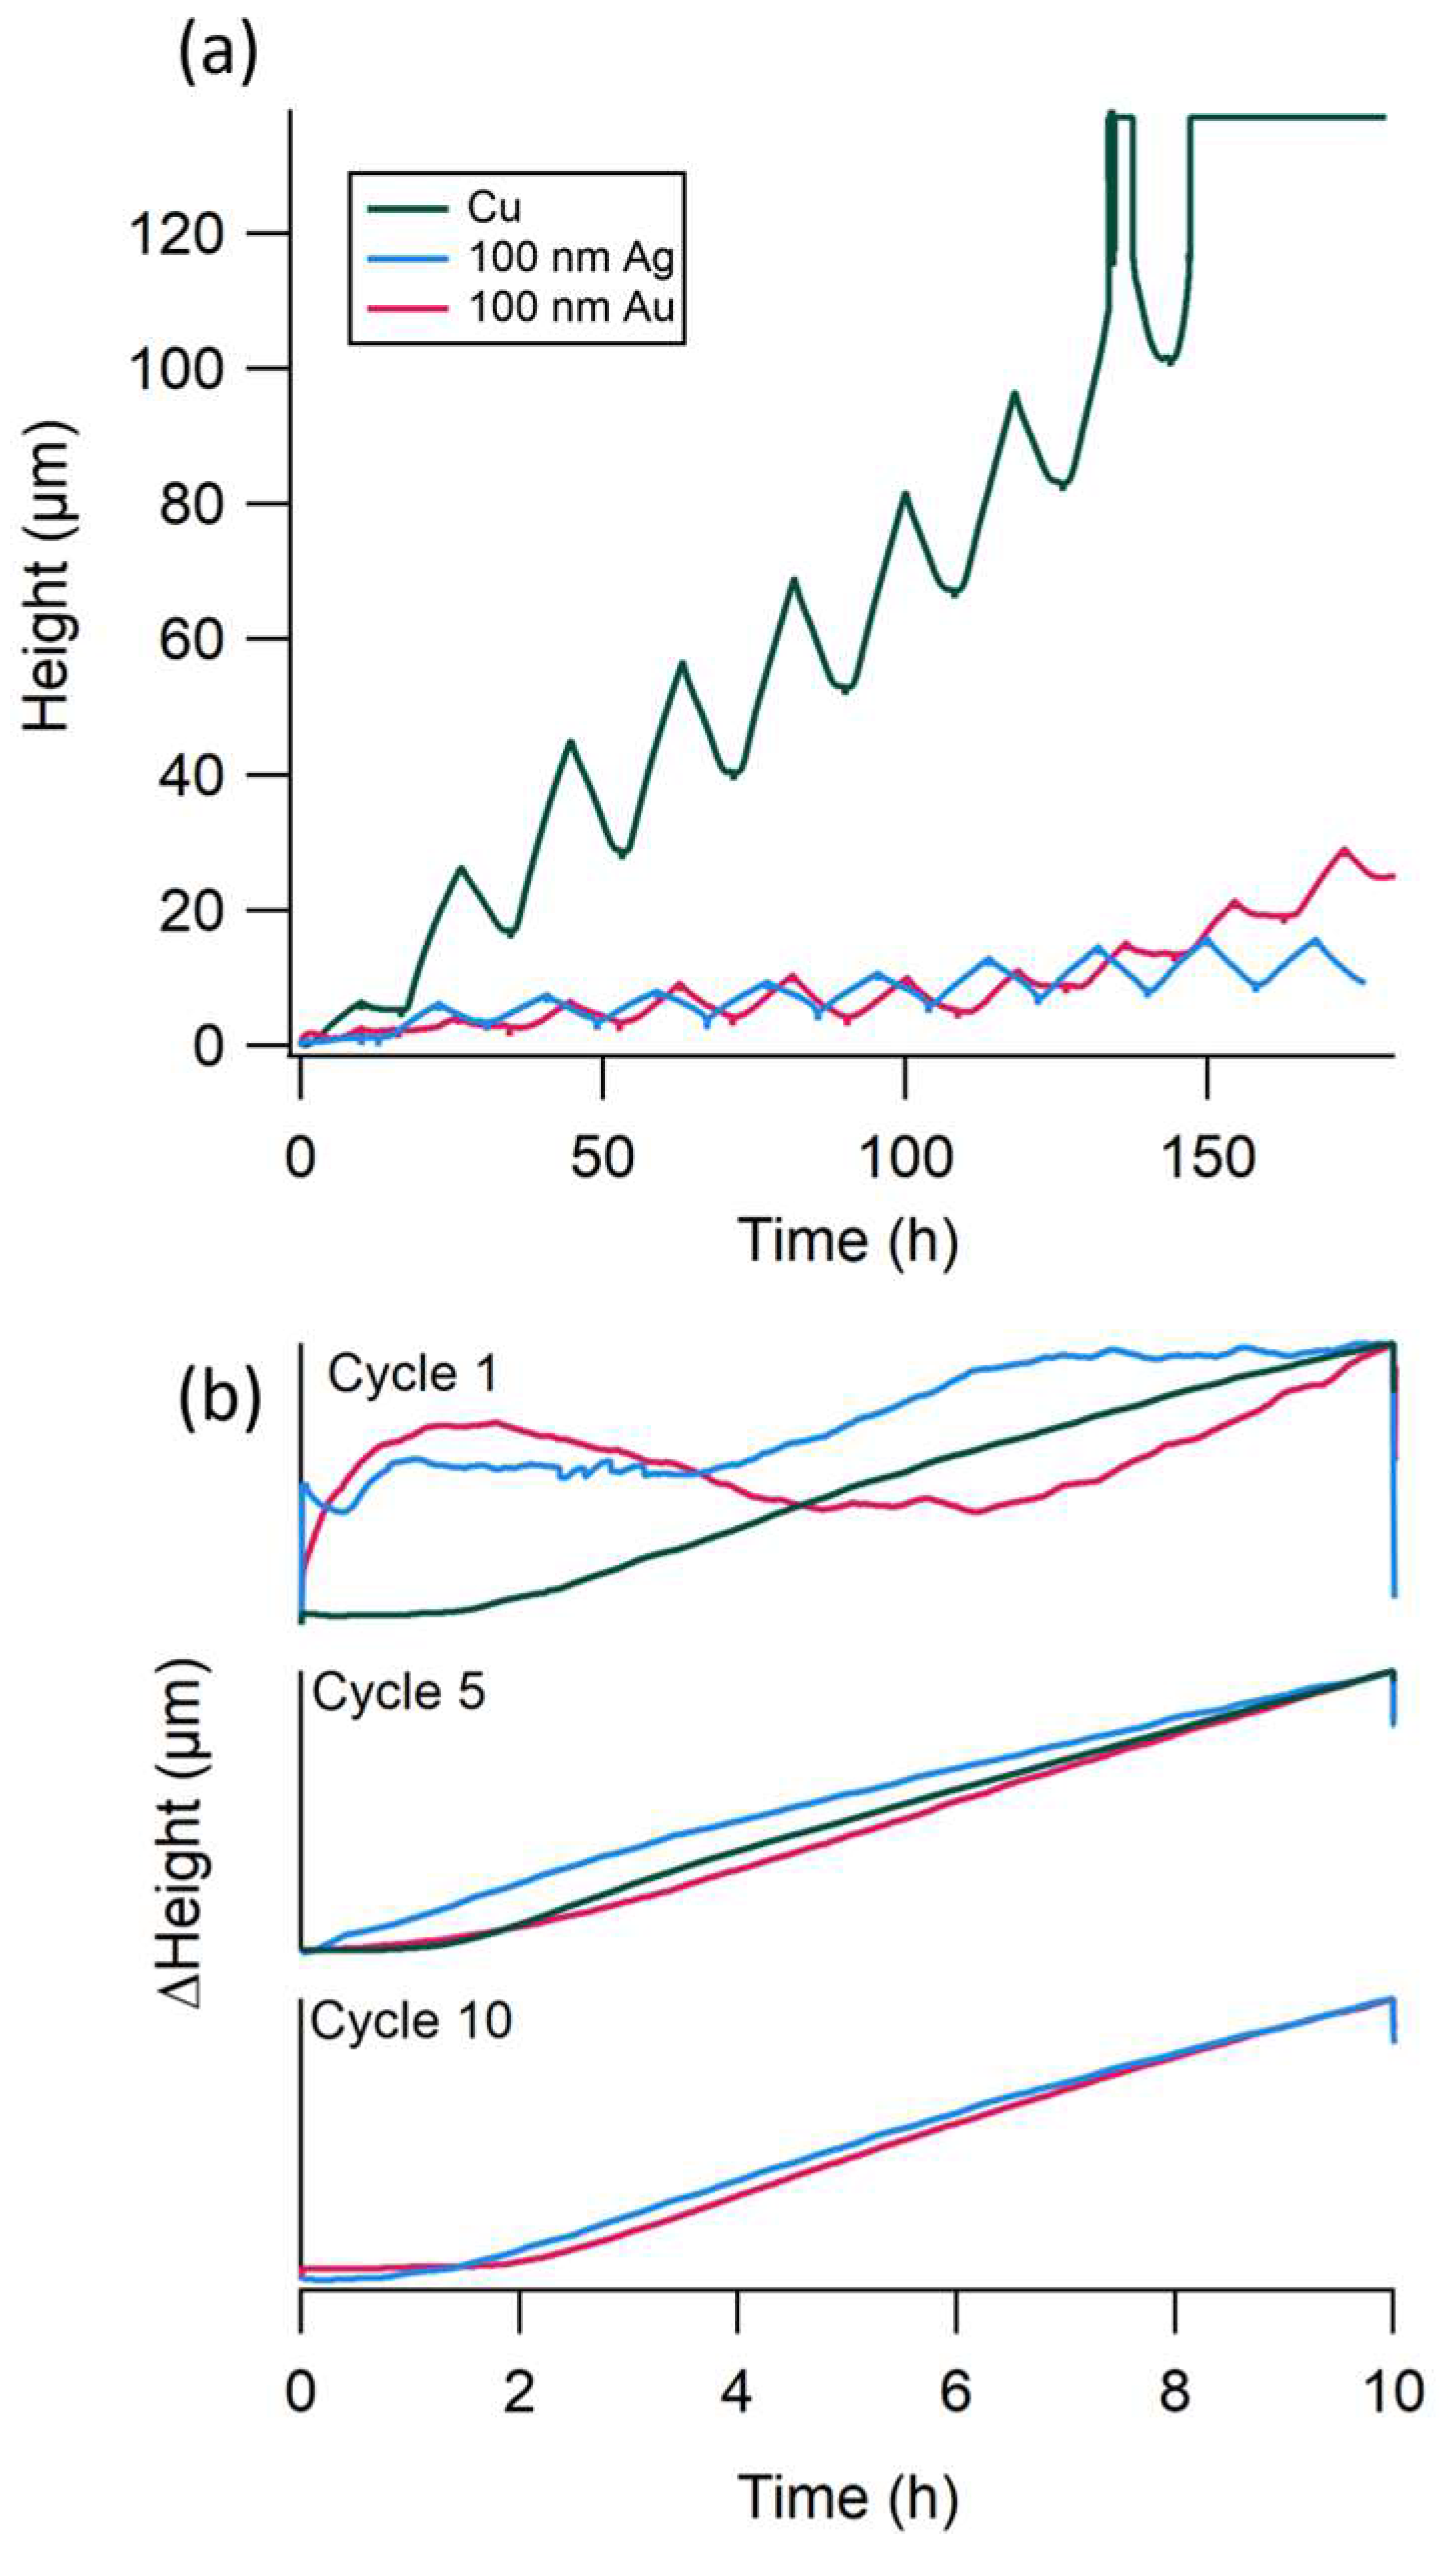
3.4. Increasing Substrate Thickness

Last, the effect of increasing the thickness of the alloying substrates from 100 nm to 500 nm was evaluated. Coin cell cycling and dilatometer results are shown in Figure 5. With an increased thickness of the alloying interlayers, the coin cells took longer to reach stable cycling due to the alloying/dealloying (lithiation/delithiation) processes. Extended cycling, shown in Figure S14, showed that the Ag substrate maintained stable cycling for longer than the other substrates. Like with the 100 nm samples, the initial voltage plateau associated with Li-Ag alloying was not observed in the first few cycles, but appeared later in cycling, as shown in Figures S15–S17. The voltage profiles of the 500 nm Au substrate showed plateaus associated with Li-Au alloying for nine cycles (Figure S18) as opposed to the five cycles observed with the 100 nm Au substrate (Figure S3). The increased thickness of Ag and Au resulted in decreased CEs early in cycling due to the alloying processes, which can be observed in Figure 5a. Evaluation of the average CEs, tabulated in Table S4, across all 100 cycles and during early, mid, and late coin cell cycling indicated that the 500 nm Ag substrate was the highest performing of the substrates investigated here.
Li cycling on the 500 nm alloying substrates exhibited similar dilation trends to the 100 nm alloying substrates, as shown in Figure 5. The corresponding voltage vs. time curves for the dilatometer measurements are shown in Figure S16. The Cu substrate had the greatest amount of volumetric expansion, followed by Ag, then Au. Li cycling on the Ag substrate again resulted in premature failure, suggesting that increased pressure and decreased internal resistance are required to enable the long-term cycling of Li on Ag substrates. Like with the 100 nm Ag substrate, two regimes of growth were observed, where the change in height was relatively flat, but then the growth accelerated around 50 h, or near cycle 25 (when the CE was high, each full cycle was just under 2 h), which corresponded with a drop in CE. The changes in height with the Au substrate were initially very small, but increased with cycling. The height changes with each half cycle were greater with the Au substrate than the Cu substrate. However, the Cu substrate resulted in the greatest increase in height among the three substrates.
The growth pattern on the Au substrate was more pronounced with the thicker coating. A step change in height was observed during the first electrodeposition, likely due to the Li-Au alloying. The step change was still present in cycle 5, as were the voltage plateaus associated with Li-Au alloying (Figure S18). In cycle 50, like the 100 nm Au sample, the dilation response indicated linear growth. The Ag substrate showed signs of accelerated growth in cycle 1, 5, and 50, and Li cycling began to fail earlier than with the 100 nm sample. This is the opposite of what was observed in the coin cells, as shown in Figures S1 and S14, where increasing the substrate thickness resulted in a longer cycle life. We assume that this deviation must be related to differences in cell format, where the pressure in the cell may not be sufficient to enable uniform Li electrodeposits on the Ag surface or the thick glass-frit separator may cause too high of an internal resistance. By cycle 50 (Figure S17), noise was observed in the voltage profile for 500 nm Ag in the dilatometer cell, suggesting either soft short circuiting or delamination. Studies of lithiophilic materials in pouch cells indicate that pressures greater than 0.01 MPa are sufficient to enable thin/compact Li electrodeposits [52]. Pressures in the order of 0.01 MPa may be sufficient with a Ag substrate if a standard separator is used to decrease the internal resistance. Future work may consider a direct investigation of the effect of pressure on Li electrodeposit morphology on Ag substrates. While pressure is difficult to control in practical cell designs, various fixturing strategies have been used to control pressure in cells [3,53,54,55].
To complement the dilatometry experiments, we cycled Li on Cu, 500 nm Au, and 500 nm Ag 50.5 times (51 electrodeposition cycles) in coin cells and then cross-sectioned the cells using laser PFIB, as shown in Figure 6. The cross-sectional SEM images are shown in Figure 6, and the corresponding EDS is shown in Figures S19–S21. This technique allowed for the cells to be probed without disrupting the electrode/separator interface. Cells built with the Au and Cu substrates had greater amounts of volumetric expansion and decomposition products compared to the cell built with the Ag substrate. The thickness of the electrode/separator/electrode stack (measured as the distance between the two Cu current collectors) was 176, 189, and 141 µm for Cu, Au, and Ag, respectively.
EDS is used to help identify the various components within a cell. For example, the C signal in the EDS helped to identify the separators. From the EDS, we found that there was some Li/SEI growth in the separators, which suggests that separator shredding may eventually lead to failure [41]. The EDS of the Au cell suggested that the Au migrated to the working electrode/separator interface with cycling. The Au at the working electrode/separator interface may have led to the linear growth observed in the dilatometer at later cycles. The Ag cell showed greater dispersion of the Ag signal in the EDS. We hypothesize that Au only locally controlled Li cycling, allowing for the buildup of SEI and dead Li with cycling, whereas the Ag controlled the Li growth more globally.
The cycling data, shown in Figure S22, showed evidence of cell failure for cells cycled with the Au and Cu substrates, indicated by an increasing initial deposition overvoltage with cycling in the coin cell configuration. An increase in overvoltage with cycling can be caused by the consumption of Li at the counter electrode, buildup of SEI, and formation of dead Li. The Ag substrate was able to cycle Li with consistent and low overvoltages in the coin cell configuration. The Cu and Au cells showed pocketed areas of Li metal on the counter electrode, which indicated that the Li likely electrodissolved unevenly from the counter electrode.
Since Ag cycled more stably in the coin cells compared to the dilatometer ones, we infer that there was a minimum amount of pressure or maximum internal resistance required for Li to cycle stably on the Ag substrate. When Li cycled without failure on the Ag substrate in the dilatometer cell, the least amount of volumetric expansion was observed. The cross-sectional images showed relatively uniform Li electrodissolution from the counter electrode, despite the large amounts of SEI present throughout the cell. The buildup of SEI indicated that cell would eventually fail due to resistance across the cell (from SEI growth/electrolyte consumption) or Li consumption at the counter electrode [2].

4. Conclusions

We investigated Li electrodeposition on a non-alloying substrate (Cu); a high-solubility, or solid solution alloying behavior, substrate (Ag); and a low-solubility, or intermetallic phase alloying behavior, substrate (Au). We found that the alloying substrates promoted the growth of larger Li grains that coalesced, whereas the non-alloying substrate formed many small Li grains at a high current (1 mA/cm2). The smaller Li grains were more susceptible to becoming electronically isolated from the electrode during cycling. We also evaluated the effect of each substrate on volumetric expansion through in operando dilatometry measurements and in situ cross-sectional imaging. From this, we found that the greatest amount of volumetric expansion was observed with the Cu electrode. Au and Ag were both able to control volumetric expansion in comparison. During early cycling, the volumetric expansion was minimal with the Ag substrate; however, cycling failure led to rapid volumetric expansion. The growth on the Au substrate was the most controlled in the dilatometry measurements. The Ag controlled Li growth the most out of the three substrates when in a coin cell, with the least amount of volumetric expansion across the cell.

Supplementary Materials

The following supporting information can be downloaded at: https://www.mdpi.com/article/10.3390/batteries11070249/s1, Figure S1: Extended cycling for Li on Cu (top), 100 nm Au (middle), and 100 nm Ag (bottom) substrates in 1 M LiTFSI in DOL:DME with 5 wt% LiNO3. Averages are representative of at least 3 cells with error bars representing the standard deviation. Cells were cycled at 1 mA/cm2 for 1 mAh/cm2. Figure S2: Deposition overvoltage vs. cycle number from representative coin cells from Figure 1 and Figure S1. Deposition overvoltage was taken from the voltage when current is first applied on each cycle. Figure S3: Voltage vs. capacity curves for the first 10 cycles of Li cycling on 100 nm Au at 1 mA/cm2 for 1 mAh/cm2 in (left) a coin cell and (right) a dilatometer cell. Figure S4: Voltage vs. capacity curves for (top) the first 10 cycles of Li cycling and (bottom) select cycles from 1 to 50 on 100 nm Ag at 1 mA/cm2 for 1 mAh/cm2 in (left) a coin cell and (right) a dilatometer cell. Figure S5: Cycle number vs. Coulombic efficiency for Li cycling on a Cu substrate at 1 mA/cm2 for 1 mAh/cm2 in 1 M LiTFSI in DOL:DME (50:50 v:v) with varying concentrations of LiNO3. Table S1: Alloying reactions and corresponding voltages reported for Ag and Au substrates. Figure S6: (a) CV of 1 M LiTFSI in DOL:DME with 5 wt% LiNO3 with Cu (green), 100 nm Ag (blue), and 100 nm Au (pink) working electrodes. (b) Enlarged portion of CV showing onset of reduction current for each substrate. Scan rate was 1 mV/s. Figure S7: (a) CV of 1 M LiTFSI in DOL:DME with 5 wt% LiNO3 with 100 nm Ag working electrode at scan rate of 0.1 mV/s. Inset shows enlarged portion of CV with asterisk (*) indicating peak associated with Li-Ag alloying. Figure S8: SEM image and corresponding element EDS maps for Li deposited on Cu at 1 mA/cm2 for 0.05, 0.1, 0.3, and 1 mAh/cm2. The EDS mapping was completed on the same samples as shown in Figure 1 but may be from different points on the sample. Figure S9: SEM image and corresponding element EDS maps for Li deposited on 100 nm Ag at 1 mA/cm2 for 0.05, 0.1, 0.3, and 1 mAh/cm2. The EDS mapping was completed on the same samples as shown in Figure 1 but may be from different points on the sample. Figure S10: SEM image and corresponding element EDS maps for Li deposited on 100 nm Au at 1 mA/cm2 for 0.05, 0.1, 0.3, and 1 mAh/cm2. The EDS mapping was completed on the same samples as shown in Figure 1 but may be from different points on the sample. Table S2: Alloying reactions and corresponding voltages reported for Ag and Au substrates. Table S3: Average particle size of Li electrodeposits measured from the SEM images shown in Figure 2 and Figure 3. Figure S11: Voltage vs. time graphs for dilatometer data from Figure 2. Li was cycled onto Cu (green), 100 nm Au (pink), and 100 nm Ag (blue) substrates at 1 mA/cm2 for 1 mAh/cm2. Figure S12: Voltage vs. time graphs for dilatometer data from Figure 4. Li was cycled onto Cu (green), 100 nm Au (pink), and 100 nm Ag (blue) substrates at 0.1 mA/cm2 for 1 mAh/cm2. Figure S13: SEM image and corresponding element EDS maps for Li deposited on 100 nm Ag (top), 100 nm Au (middle), and Cu (bottom) at 0.1 mA/cm2 for 1 mAh/cm2. The EDS mapping was completed on the same samples as shown in Figure 3 but may be from different points on the sample. Figure S14: Extended cycling for Li on Cu (top), 500 nm Au (middle), and 500 nm Ag (bottom) substrates in 1 M LiTFSI in DOL:DME with 5 wt% LiNO3. Averages are representative of at least 3 cells with error bars representing the standard deviation. Cells were cycled at 1 mA/cm2 for 1 mAh/cm2. Figure S15: Deposition overvoltage vs. cycle number from representative coin cells from Figure 5 and Figure S14. Deposition overvoltage was taken from the voltage when current was first applied on each cycle. Figure S16: Voltage vs. time graphs for dilatometer data from Figure 5. Li was cycled onto Cu (green), 500 nm Au (pink), and 500 nm Ag (blue) substrates at 1 mA/cm2 for 1 mAh/cm2. Figure S17: Voltage vs. capacity curves for (top) the first 10 cycles and (bottom) select cycles from 1 to 50 of Li cycling on 500 nm Ag at 1 mA/cm2 for 1 mAh/cm2 in (left) a coin cell and (right) a dilatometer cell. Figure S18: Voltage vs. capacity curves for the first 10 cycles of Li cycling on 500 nm Au at 1 mA/cm2 for 1 mAh/cm2 in (left) a coin cell and (right) a dilatometer cell. Table S4: Average Coulombic efficiencies calculated for different portions of cycling and throughout all 100 cycles for the different substrates evaluated in this study. Averages are calculated from a minimum of 3 replicate cells. Figure S19: EDS of cross-sectional image of 51st electrodeposition of Li on Cu with 1 M LiTFSI in DOL:DME with 5 wt% LiNO3. Li was cycled at 1 mA/cm2 for 1 mAh/cm2. Figure S20: EDS of cross-sectional image of 51st electrodeposition of Li on 500 nm Au with 1 M LiTFSI in DOL:DME with 5 wt% LiNO3. Li was cycled at 1 mA/cm2 for 1 mAh/cm2. Figure S21: EDS of cross-sectional image of 51st electrodeposition of Li on 500 nm Ag with 1 M LiTFSI in DOL:DME with 5 wt% LiNO3. Li was cycled at 1 mA/cm2 for 1 mAh/cm2. Figure S22: Voltage vs. time curves for 51 electrodeposition cycles for laser PFIB cross sectional images shown in Figure 6. Top (green) trace is Cu, middle (blue) trace is 500 nm Ag, and bottom (pink) trace is 500 nm Au.

Author Contributions

Conceptualization, L.C.M.; methodology, L.C.M., R.L.C., D.P.C., and J.I.D.; formal analysis, L.C.M., R.L.C., D.P.C., and J.I.D.; investigation, L.C.M.; data curation, L.C.M., R.L.C., D.P.C., and J.I.D.; writing—original draft preparation, L.C.M.; writing—review and editing, L.C.M., R.L.C., D.P.C., and J.I.D.; funding acquisition, L.C.M. All authors have read and agreed to the published version of the manuscript.

Funding

This work was supported by the Laboratory Directed Research and Development (LDRD# 227708) program at Sandia National Laboratories.

Data Availability Statement

The raw data supporting the conclusions of this article will be made available by the authors upon request.

Acknowledgments

We thank Bryan Wygant for useful discussions and feedback, Ben Warren for general laboratory support, and Ken Coombes and Steven Larson for assistance with the deposition of the metals. Sandia National Laboratories is a multimission laboratory managed and operated by National Technology & Engineering Solutions of Sandia, LLC, a wholly owned subsidiary of Honeywell International Inc., for the U.S. Department of Energy’s National Nuclear Security Administration under contract DE-NA0003525. This paper describes objective technical results and analysis. Any subjective views or opinions that might be expressed in the paper do not necessarily represent the views of the U.S. Department of Energy or the United States Government. This article has been authored by an employee of National Technology & Engineering Solutions of Sandia, LLC under Contract No. DE-NA0003525 with the U.S. Department of Energy (DOE). The employee owns all rights, titles, and interests in and to the article and is solely responsible for its contents. The United States Government retains and the publisher, by accepting the article for publication, acknowledges that the United States Government retains a non-exclusive, paid-up, irrevocable, worldwide license to publish or reproduce the published form of this article or allow others to do so, for United States Government purposes. The DOE will provide public access to these results of federally sponsored research in accordance with the DOE Public Access Plan https://www.energy.gov/downloads/doe-public-access-plan (accessed on 17 December 2024).

Conflicts of Interest

The authors declare no conflicts of interest.

Abbreviations

The following abbreviations are used in this manuscript:
CECoulombic efficiency
CVCyclic voltammogram/cyclic voltammetry
DME1,2-dimethoxyethane
DOL1,3-dioxolane
EDSenergy-dispersive X-ray spectroscopy
Laser PFIBlaser plasma focused ion beam
LiTFSIlithium bis(trifluoromethane)sulfonimide
SEIsolid electrolyte interphase
SEMscanning electron microscopy

References

  1. Wang, S.; Ren, D.; Xu, C.; Han, X.; Liu, X.; Lu, L.; Ouyang, M. Lithium plating induced volume expansion overshoot of lithium-ion batteries: Experimental analysis and modeling. J. Power Sources 2024, 593, 233946. [Google Scholar] [CrossRef]
  2. Merrill, L.C.; Gannon, R.N.; Jungjohann, K.L.; Randolph, S.J.; Goriparti, S.; Zavadil, K.R.; Johnson, D.C.; Harrison, K.L. Evaluation of Lithium Metal Anode Volumetric Expansion through Laser Plasma Focused Ion Beam Cross-Sectional Imaging. J. Electrochem. Soc. 2023, 170, 080527. [Google Scholar] [CrossRef]
  3. Harrison, K.L.; Goriparti, S.; Merrill, L.C.; Long, D.M.; Warren, B.; Roberts, S.A.; Perdue, B.R.; Casias, Z.; Cuillier, P.; Boyce, B.L.; et al. Effects of Applied Interfacial Pressure on Li-Metal Cycling Performance and Morphology in 4 M LiFSI in DME. ACS Appl. Mater. Interfaces 2021, 13, 31668–31679. [Google Scholar] [CrossRef] [PubMed]
  4. Harrison, K.L.; Merrill, L.C.; Long, D.M.; Randolph, S.J.; Goriparti, S.; Cristian, J.; Warren, B.; Roberts, S.A.; Harris, S.J.; Perry, D.L.; et al. Cryogenic electron microscopy reveals that applied pressure promotes short circuits in Li batteries. iScience 2021, 24, 103394. [Google Scholar] [CrossRef] [PubMed]
  5. Li, C.; Li, Y.; Yu, Y.; Shen, C.; Zhou, C.; Dong, C.; Zhao, T.; Xu, X. One-Pot Preparation of Lithium Compensation Layer, Lithiophilic Layer, and Artificial Solid Electrolyte Interphase for Lean-Lithium Metal Anode. ACS Appl. Mater. Interfaces 2022, 14, 19437–19447. [Google Scholar] [CrossRef]
  6. Liu, W.; Liu, P.; Mitlin, D. Review of Emerging Concepts in SEI Analysis and Artificial SEI Membranes for Lithium, Sodium, and Potassium Metal Battery Anodes. Adv. Energy Mater. 2020, 10, 2002297. [Google Scholar] [CrossRef]
  7. Kang, D.; Xiao, M.; Lemmon, J.P. Artificial Solid-Electrolyte Interphase for Lithium Metal Batteries. Batter. Supercaps 2020, 4, 445–455. [Google Scholar] [CrossRef]
  8. Zhang, D.; Dai, A.; Fan, B.; Li, Y.; Shen, K.; Xiao, T.; Hou, G.; Cao, H.; Tao, X.; Tang, Y. Three-Dimensional Ordered Macro/Mesoporous Cu/Zn as a Lithiophilic Current Collector for Dendrite-Free Lithium Metal Anode. ACS Appl. Mater. Interfaces 2020, 12, 31542–31551. [Google Scholar] [CrossRef]
  9. Stan, M.C.; Becking, J.; Kolesnikov, A.; Wankmiller, B.; Frerichs, J.E.; Hansen, M.R.; Bieker, P.; Kolek, M.; Winter, M. Sputter coating of lithium metal electrodes with lithiophilic metals for homogeneous and reversible lithium electrodeposition and electrodissolution. Mater. Today 2020, 39, 137–145. [Google Scholar] [CrossRef]
  10. Park, J.B.; Choi, C.; Yu, S.; Chung, K.Y.; Kim, D.-W. Porous Lithiophilic Li–Si Alloy-Type Interfacial Framework via Self-Discharge Mechanism for Stable Lithium Metal Anode with Superior Rate. Adv. Energy Mater. 2021, 11, 2101544. [Google Scholar] [CrossRef]
  11. Zhang, S.; Yang, G.; Liu, Z.; Weng, S.; Li, X.; Wang, X.; Gao, Y.; Wang, Z.; Chen, L. Phase Diagram Determined Lithium Plating/Stripping Behaviors on Lithiophilic Surfaces. ACS Energy Lett. 2021, 6, 4118–4126. [Google Scholar] [CrossRef]
  12. Huang, S.; Zhang, W.; Ming, H.; Cao, G.; Fan, L.Z.; Zhang, H. Chemical Energy Release Driven Lithiophilic Layer on 1 m2 Commercial Brass Mesh toward Highly Stable Lithium Metal Batteries. Nano Lett. 2019, 19, 1832–1837. [Google Scholar] [CrossRef]
  13. Zhao, F.; Zhou, X.; Deng, W.; Liu, Z. Entrapping lithium deposition in lithiophilic reservoir constructed by vertically aligned ZnO nanosheets for dendrite-free Li metal anodes. Nano Energy 2019, 62, 55–63. [Google Scholar] [CrossRef]
  14. Chen, X.-R.; Chen, X.; Yan, C.; Zhang, X.-Q.; Zhang, Q.; Huang, J.-Q. Role of Lithiophilic Metal Sites in Lithium Metal Anodes. Energy Fuels 2021, 35, 12746–12752. [Google Scholar] [CrossRef]
  15. Cao, X.; Ren, X.; Zou, L.; Engelhard, M.; Huang, W.; Wang, H.; Matthews, B.E.; Lee, H.; Niu, C.; Arey, B.W.; et al. Monolithic solid–electrolyte interphases formed in fluorinated orthoformate-based electrolytes minimize Li depletion and pulverization. Nat. Energy 2019, 4, 796–805. [Google Scholar] [CrossRef]
  16. Zheng, J.; Kim, M.S.; Tu, Z.; Choudhury, S.; Tang, T.; Archer, L.A. Regulating electrodeposition of lithium: Towards commercially relevant secondary Li metal batteries. Chem. Soc. Rev. 2020, 49, 2701–2750. [Google Scholar] [CrossRef]
  17. Merrill, L.C.; Long, D.M.; Small, K.A.; Jungjohann, K.L.; Leung, K.; Bassett, K.L.; Harrison, K.L. Role of Coatings as Artificial Solid Electrolyte Interphases on Lithium Metal Self-Discharge. J. Phys. Chem. C. 2022, 126, 17490–17501. [Google Scholar] [CrossRef]
  18. Meyerson, M.L.; Maraschky, A.M.; Watt, J.; Small, L.J. Fast cycling of “anode-less”, redox-mediated Li-S flow batteries. J. Energy Storage 2023, 72, 108767. [Google Scholar] [CrossRef]
  19. Kreissl, J.J.A.; Petit, J.; Oppermann, R.; Cop, P.; Gerber, T.; Joos, M.; Abert, M.; Tubke, J.; Miyazaki, K.; Abe, T.; et al. Electrochemical Lithiation/Delithiation of ZnO in 3D-Structured Electrodes: Elucidating the Mechanism and the Solid Electrolyte Interphase Formation. ACS Appl. Mater. Interfaces 2021, 13, 35625–35638. [Google Scholar] [CrossRef]
  20. Choudhury, S.; Tu, Z.; Stalin, S.; Vu, D.; Fawole, K.; Gunceler, D.; Sundararaman, R.; Archer, L.A. Electroless Formation of Hybrid Lithium Anodes for Fast Interfacial Ion Transport. Angew. Chem. Int. Ed. Engl. 2017, 56, 13070–13077. [Google Scholar] [CrossRef]
  21. Gu, X.; Dong, J.; Lai, C. Li-containing alloys beneficial for stabilizing lithium anode: A review. Eng. Rep. 2020, 3, e12339. [Google Scholar] [CrossRef]
  22. Lin, C.F.; Qi, Y.; Gregorczyk, K.; Lee, S.B.; Rubloff, G.W. Nanoscale Protection Layers To Mitigate Degradation in High-Energy Electrochemical Energy Storage Systems. Acc. Chem. Res. 2018, 51, 97–106. [Google Scholar] [CrossRef]
  23. Manandhar, K.; Ren, Y.; Stasak, D.; Hou, H.; Kirsch, D.; Sarker, S.; Mehta, A.; Sardar, S.; Xiao, M.; Weaver, J.L.; et al. High-Throughput Exploration of Lithium-Alloy Protection Layers for High-Performance Lithium-Metal Batteries. ACS Appl. Energy Mater. 2020, 3, 2547–2555. [Google Scholar] [CrossRef]
  24. Xu, Y.; Zhao, S.; Zhou, G.; Chen, W.; Zhou, F.; Rong, Z.; Wu, Y.; Li, J.; Guo, J.; Zhang, Y. Solubility-Dependent Protective Effects of Binary Alloys for Lithium Anode. ACS Appl. Energy Mater. 2020, 3, 2278–2284. [Google Scholar] [CrossRef]
  25. Zhou, Y.; Zhang, J.; Zhao, K.; Ma, Y.; Zhang, H.; Song, D.; Shi, X.; Zhang, L.; Ding, Y. A novel dual-protection interface based on gallium-lithium alloy enables dendrite-free lithium metal anodes. Energy Storage Mater. 2021, 39, 403–411. [Google Scholar] [CrossRef]
  26. Wang, D.; Zhang, W.; Zheng, W.; Cui, X.; Rojo, T.; Zhang, Q. Towards High-Safe Lithium Metal Anodes: Suppressing Lithium Dendrites via Tuning Surface Energy. Adv. Sci. 2017, 4, 1600168. [Google Scholar] [CrossRef] [PubMed]
  27. Yan, K.; Lu, Z.; Lee, H.-W.; Xiong, F.; Hsu, P.-C.; Li, Y.; Zhao, J.; Chu, S.; Cui, Y. Selective deposition and stable encapsulation of lithium through heterogeneous seeded growth. Nat. Energy 2016, 1, 16010. [Google Scholar] [CrossRef]
  28. Qiu, H.; Tang, T.; Asif, M.; Li, W.; Zhang, T.; Hou, Y. Stable lithium metal anode enabled by lithium metal partial alloying. Nano Energy 2019, 65, 103989. [Google Scholar] [CrossRef]
  29. Choi, S.H.; Lee, S.J.; Yoo, D.-J.; Park, J.H.; Park, J.-H.; Ko, Y.N.; Park, J.; Sung, Y.-E.; Chung, S.-Y.; Kim, H.; et al. Marginal Magnesium Doping for High-Performance Lithium Metal Batteries. Adv. Energy Mater. 2019, 9, 1902278. [Google Scholar] [CrossRef]
  30. Xu, T.; Gao, P.; Li, P.; Xia, K.; Han, N.; Deng, J.; Li, Y.; Lu, J. Fast-Charging and Ultrahigh-Capacity Lithium Metal Anode Enabled by Surface Alloying. Adv. Energy Mater. 2020, 10, 1902343. [Google Scholar] [CrossRef]
  31. Peng, Z.; Song, J.; Huai, L.; Jia, H.; Xiao, B.; Zou, L.; Zhu, G.; Martinez, A.; Roy, S.; Murugesan, V.; et al. Enhanced Stability of Li Metal Anodes by Synergetic Control of Nucleation and the Solid Electrolyte Interphase. Adv. Energy Mater. 2019, 9, 1901764. [Google Scholar] [CrossRef]
  32. Chen, Z.; Luo, Y.; Yang, D.; Hu, Y.; Hou, H.; Koratkar, N.; Zhou, G.; Liu, W. Intraparticle alloying-plating reaction for high-performing lithium metal batteries with low volume expansion. Mater. Today, 2025; in press. [Google Scholar] [CrossRef]
  33. Zhang, X.; Gong, Y.; Xu, C.; Qu, P.; Wang, G. Thickness dependence of high volumetric energy density lithium ion battery based on Sn–Zn eutectic alloy foil anode. Ionics 2022, 28, 2685–2692. [Google Scholar] [CrossRef]
  34. Jin, S.; Ye, Y.; Niu, Y.; Xu, Y.; Jin, H.; Wang, J.; Sun, Z.; Cao, A.; Wu, X.; Luo, Y.; et al. Solid-Solution-Based Metal Alloy Phase for Highly Reversible Lithium Metal Anode. J. Am. Chem. Soc. 2020, 142, 8818–8826. [Google Scholar] [CrossRef] [PubMed]
  35. Shi, Z.; Liu, M.; Naik, D.; Gole, J.L. Electrochemical properties of Li-Mg alloy electrodes for lithium batteries. J. Power Sources 2001, 92, 70–80. [Google Scholar] [CrossRef]
  36. Seo, J.; Lim, J.; Chang, H.; Lee, J.; Woo, J.; Jung, I.; Kim, Y.; Kim, B.; Moon, J.; Lee, H. Sustaining Surface Lithiophilicity of Ultrathin Li-Alloy Coating Layers on Current Collector for Zero-Excess Li-Metal Batteries. Small 2024, 20, 2402988. [Google Scholar] [CrossRef] [PubMed]
  37. Bach, P.; Stratmann, M.; Valencia-Jaime, I.; Romero, A.H.; Renner, F.U. Lithiation and Delithiation Mechanisms of Gold Thin Film Model Anodes for Lithium Ion Batteries: Electrochemical Characterization. Electrochim. Acta 2015, 164, 81–89. [Google Scholar] [CrossRef]
  38. Kulova, T.L.; Skundin, A.M.; Kozhevin, V.M.; Yavsin, D.A.; Gurevich, S.A. A Study of Lithium Insertion into Electrodes with Thin Gold Films. Russ. J. Electrochem. 2010, 46, 877–881. [Google Scholar] [CrossRef]
  39. Hertle, J.; Walther, F.; Mogwitz, B.; Schroder, S.; Richter, H.; Janek, J. Miniaturization of Reference Electrodes for Solid-State Lithium-Ion Batteries. J. Electrochem. Soc. 2023, 170, 040519. [Google Scholar] [CrossRef]
  40. Huang, Y.; Chen, S.; Yang, Y.; Sun, Z.-T.; Yu, X.; Guan, C.; Ouyang, R.; Guo, Y.; Bo, S.-H.; Zhu, H. Unlocking the Potential of Li-Ag Alloys: Phase Selection and Practical Application. Energy Mater. Adv. 2024, 5, 0108. [Google Scholar] [CrossRef]
  41. Jungjohann, K.L.; Gannon, R.N.; Goriparti, S.; Randolph, S.J.; Merrill, L.C.; Johnson, D.C.; Zavadil, K.R.; Harris, S.J.; Harrison, K.L. Cryogenic laser ablation reveals short-circuit mechanism in lithium metal batteries. ACS Energy Lett. 2021, 6, 2138–2144. [Google Scholar] [CrossRef]
  42. Merrill, L.C.; Rosenberg, S.G.; Jungjohann, K.L.; Harrison, K.L. Uncovering the Relationship between Aging and Cycling on Lithium Metal Battery Self-Discharge. ACS Appl. Energy Mater. 2021, 4, 7589–7598. [Google Scholar] [CrossRef]
  43. Kim, M.; Lee, S.; Park, D.; Kang, H.; Kam, D.; Park, J.-H.; Oh, S.H.; Jung, H.-G.; Choi, W. Tuning Lithiophilic Sites of Ag-Embedded N-Doped Carbon Hollow Spheres via Intentional Blocking Strategy for Ultrastable Li Metal Anode in Rechargeable Batteries. ACS Sustain. Chem. Eng. 2023, 11, 1785–1796. [Google Scholar] [CrossRef]
  44. Kim, H.; Choi, M.; Kang, H.; Choi, W. Accelerating Lithium Deposition Kinetics Via Lithiophilic Ag-Decorated Graphitic Carbon Nitride Spheres for Stable Lithium Metal Anode. Energy Environ. Sci. 2024, 8, e12830. [Google Scholar] [CrossRef]
  45. Taillades, G.; Sarradin, J. Silver: High perfromance anode for thin film lithium ion batteries. J. Power Sources 2004, 125, 199–205. [Google Scholar] [CrossRef]
  46. Thomas, J.; Behara, S.S.; Van der Ven, A. Thermodynamic and Kinetic Properties of the Lithium-Silver System. Chem. Mater. 2024, 36, 8936–8948. [Google Scholar] [CrossRef] [PubMed]
  47. Liu, H.-J.; Qu, J.; Chang, Y.; Yang, C.-Y.; Zhai, X.-Z.; Yu, Z.-Z.; Li, X. Engineering Lithiophilic Silver Sponge Integrated with Ion-Conductive PVDF/LiF Protective Layer for Dendrite-Free and High Performance Lithium Metal Batteries. ACS Appl. Energy Mater. 2023, 6, 519–529. [Google Scholar] [CrossRef]
  48. Fatahine, M.; Guay, D.; Roue, L. Study of lithium metal-based electrodes by electrochemical dilatometry. J. Appl. Electrochem. 2021, 52, 149–157. [Google Scholar] [CrossRef]
  49. Lohrberg, O.; Maletti, S.; Heubner, C.; Schneider, M.; Michaelis, A. Understanding Li Plating and Stripping Behavior in Zero-Excess Li Metal Batteries Using Operando Dilatometry. J. Electrochem. Soc. 2022, 169, 030543. [Google Scholar] [CrossRef]
  50. Gopinadh, S.V.; Phanendra, P.V.R.L.; V, A.; John, B.; TD, M. Progress, Challenges, and Perspectives on Alloy-Based Anode Materials for Lithium Ion Battery: A Mini-Review. Energy Fuels 2024, 38, 17253–17277. [Google Scholar] [CrossRef]
  51. Gireaud, L.; Grugeon, S.; Laruelle, S.; Yrieix, B.; Tarascon, J.M. Lithium metal stripping/plating mechanisms studies: A metallurgical approach. Electrochem. Commun. 2006, 8, 1639–1649. [Google Scholar] [CrossRef]
  52. Bassett, K.L.; Small, K.A.; Long, D.M.; Merrill, L.C.; Warren, B.; Harrison, K.L. Interfacial pressure improves calendar aging of lithium metal anodes. Front. Batter. Electrochem. 2023, 2, 1292639. [Google Scholar] [CrossRef]
  53. Lu, B.; Bao, W.; Yao, W.; Doux, J.-M.; Fang, C.; Meng, Y.S. Editors’ Choice—Methods—Pressure Control Apparatus for Lithium Metal Batteries. J. Electrochem. Soc. 2022, 169, 070537. [Google Scholar] [CrossRef]
  54. Cai, M.; Dai, F. Best practices in lithium battery cell preparation and evaluation. Commun. Mater. 2022, 3, 64. [Google Scholar] [CrossRef]
  55. Schommer, A.; Corzo, M.O.; Henshell, P.; Morrey, D.; Collier, G. Stack pressure on lithium-ion pouch cells: A comparative study of constant pressure and fixed displacement devices. J. Power Sources 2025, 629, 236019. [Google Scholar] [CrossRef]
Figure 1. Coin cell electrodeposition and cycling data for Li metal on a Cu, Ag-, or Au-coated Cu substrate in 1 M LiTFSI in DOL:DME with 5 wt % LiNO3. (a) Average CE vs. cycle number for Li cycling at 1 mA/cm2 for 1 mAh/cm2 in standard coin cells (averages are of at least 3 cells), extended cycling shown in Figure S1. (b) The first electrodeposition voltage vs. capacity data for each of the substrates, dashed lines indicate sampling points for SEM imaging. SEM images of Li electrodeposits on the Cu substrate at (c) 0.05 mAh/cm2, (d) 0.1 mAh/cm2, (e) 0.3 mAh/cm2, and (f) 1 mAh/cm2. SEM images of Li electrodeposits on the 100 nm Ag substrate at (g) 0.05 mAh/cm2, (h) 0.1 mAh/cm2, (i) 0.3 mAh/cm2, and (j) 1 mAh/cm2. SEM images of Li electrodeposits on the 100 nm Au substrate at (k) 0.05 mAh/cm2, (l) 0.1 mAh/cm2, (m) 0.3 mAh/cm2, and (n) 1 mAh/cm2. Corresponding EDS signal of the respective substrate materials (Ag, Au, and Cu) are in Figures S8–S10.
Batteries 11 00249 g001
Figure 2. Li cycling in 1 M LiTFSI in DOL:DME with 5 wt % LiNO3 in a dilatometer cell with Cu (green), 100 nm Ag (blue), and 100 nm Au substrates (pink). Li was cycled at 1 mAh/cm2 for 1 mAh/cm2. (a) CE vs. cycle number for Li cycling in dilatometer cell. (b) Measured dilation in height vs. time for Li cycling on each substrate. (c) Measured change in height during electrodeposition step for cycle 1, cycle 5, and cycle 50. (d) Measured change in height during electrodissolution step for cycle 1, cycle 5, and cycle 50. For panels (c,d), the change in height is only relative to the individual trace itself and is not scaled to the other samples/traces to allow for evaluation of the dilation shape. Corresponding voltage vs. time curves are in Figure S11.
Batteries 11 00249 g002
Figure 3. First electrodeposition in coin cells at 0.1 mA/cm2 for 1 mAh/cm2 in 1 M LiTFSI in DOL:DME with 5 wt% LiNO3. (a) Voltage vs. capacity curves for each substrate. Corresponding SEM images taken at 1 mAh/cm2 for (b) Cu substrate, (c) 100 nm Ag substrate, and (d) 100 nm Au substrate.
Batteries 11 00249 g003
Figure 4. (a) Measured dilation in height vs. time for Li cycling on each substrate in 1 M LiTFSI in DOL:DME with 5 wt% LiNO3 at 0.1 mA/cm2 for 1 mAh/cm2 for 10 cycles. (b) Measured change in height during electrodeposition step for cycle 1, cycle 5, and cycle 10. For panel (b) the change in height is only relative to the individual trace itself and is not scaled to the other samples/traces to allow for evaluation of the dilation shape. The sensor on the dilatometer maxed out during cycle 9 with the Cu substrate. Corresponding voltage vs. time curves and CE vs. cycle number curves are in Figure S12.
Batteries 11 00249 g004
Figure 5. Li cycling in 1 M LiTFSI in DOL:DME with 5 wt % LiNO3 on Cu (green), 500 nm Ag on Cu (blue), and 500 nm Au on Cu substrates (pink). Li was cycled at 1 mAh/cm2 for 1 mAh/cm2. CE vs. cycle number for cycling in (a) a coin cell and (b) a dilatometer cell. (c) Measured dilation in height vs. time for Li cycling on each substrate. (d) Measured change in height during electrodeposition step for cycle 1, cycle 5, and cycle 50. For panel (d) the change in height is only relative to the individual trace itself and is not scaled to the other samples/traces to allow for evaluation of the dilation shape. Corresponding CE vs. cycle number plots for coin cell experiments are shown in Figure S14. The voltage vs. time curves for the dilatometer experiments are shown in Figure S16.
Batteries 11 00249 g005
Figure 6. Laser PFIB images of coin cells cross sectioned after 51 electrodeposition cycles on (a) Cu, (b) 500 nm Ag, and (c) 500 nm Au at 1 mA/cm2 for 1 mAh/cm2. Corresponding EDS maps are shown in Figures S19–S21. Cycling curves are in Figure S22.
Batteries 11 00249 g006
Disclaimer/Publisher’s Note: The statements, opinions and data contained in all publications are solely those of the individual author(s) and contributor(s) and not of MDPI and/or the editor(s). MDPI and/or the editor(s) disclaim responsibility for any injury to people or property resulting from any ideas, methods, instructions or products referred to in the content.

