
Multiband Multisine Excitation Signal for Online Impedance Spectroscopy of Battery Cells


Abstract
1. Introduction
2. Multisine Excitation Signal for EIS
2.1. Linearity and Stationarity Criteria
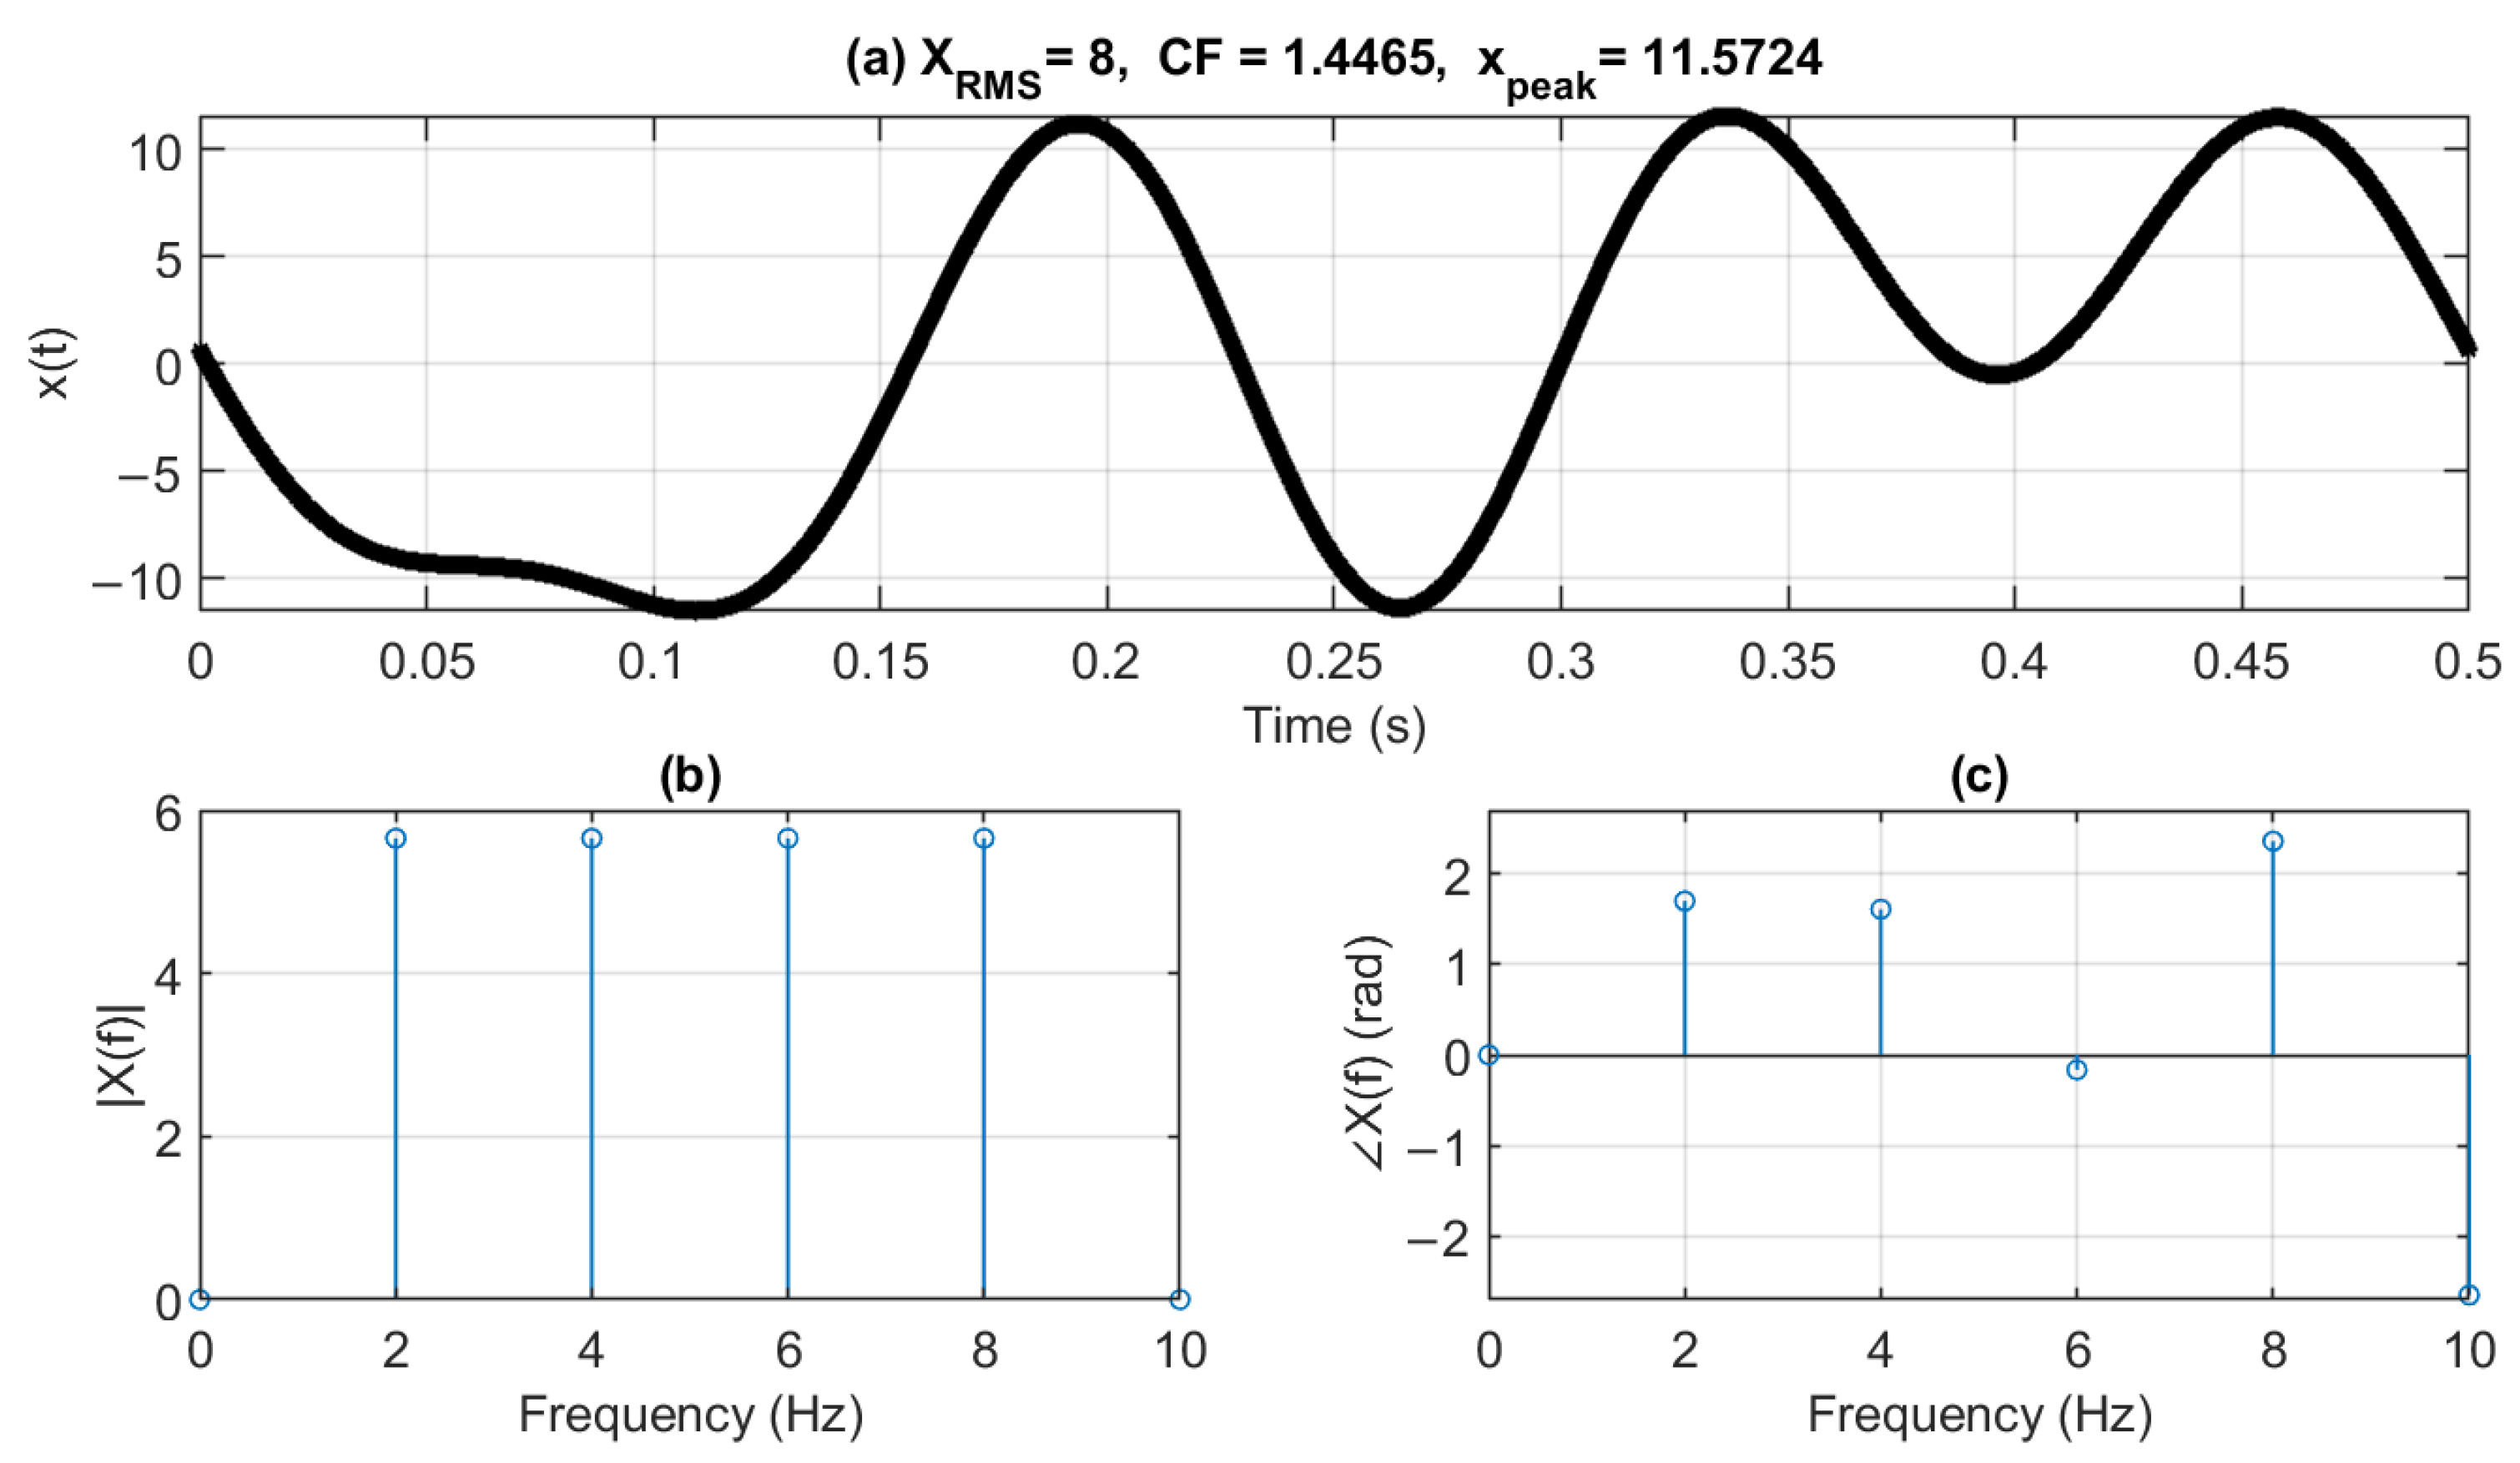
2.2. Crest Factor
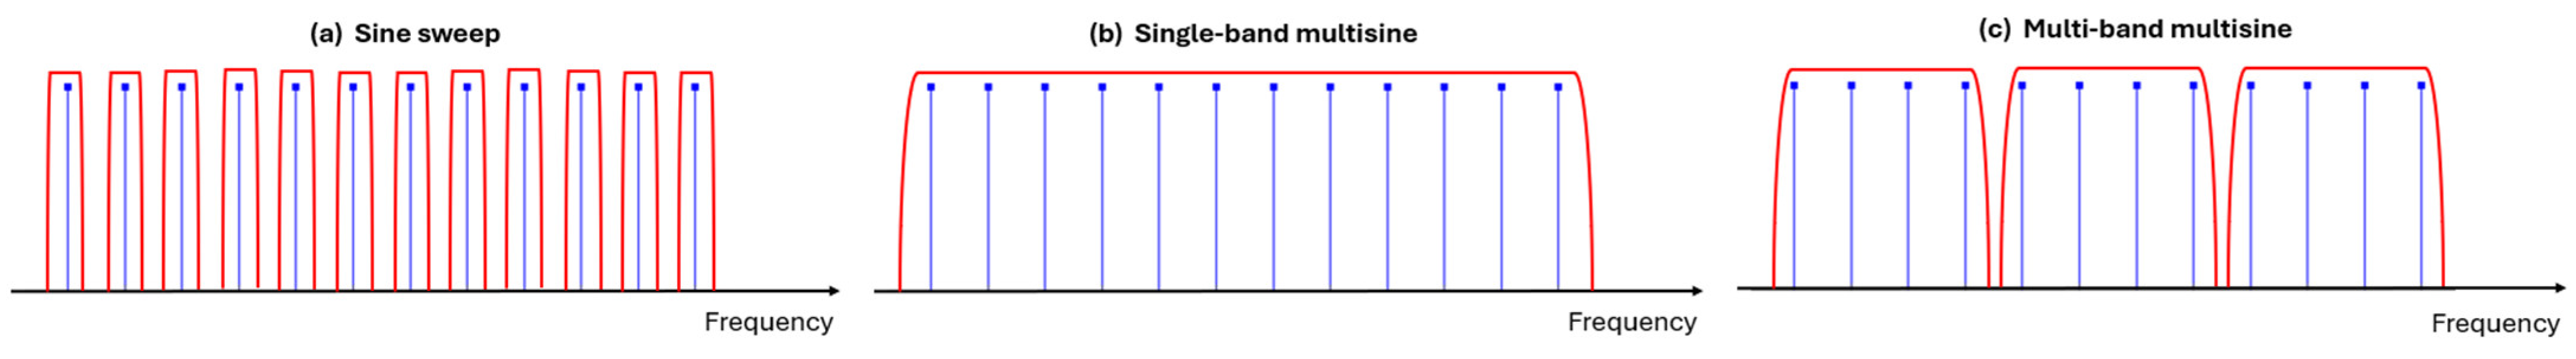
3. Multiband Multisine Excitation Strategy
3.1. Measurement Time
3.2. Energy-Efficiency
4. Design of Multiband Multisine Sequence
4.1. Frequency Components and Spacing
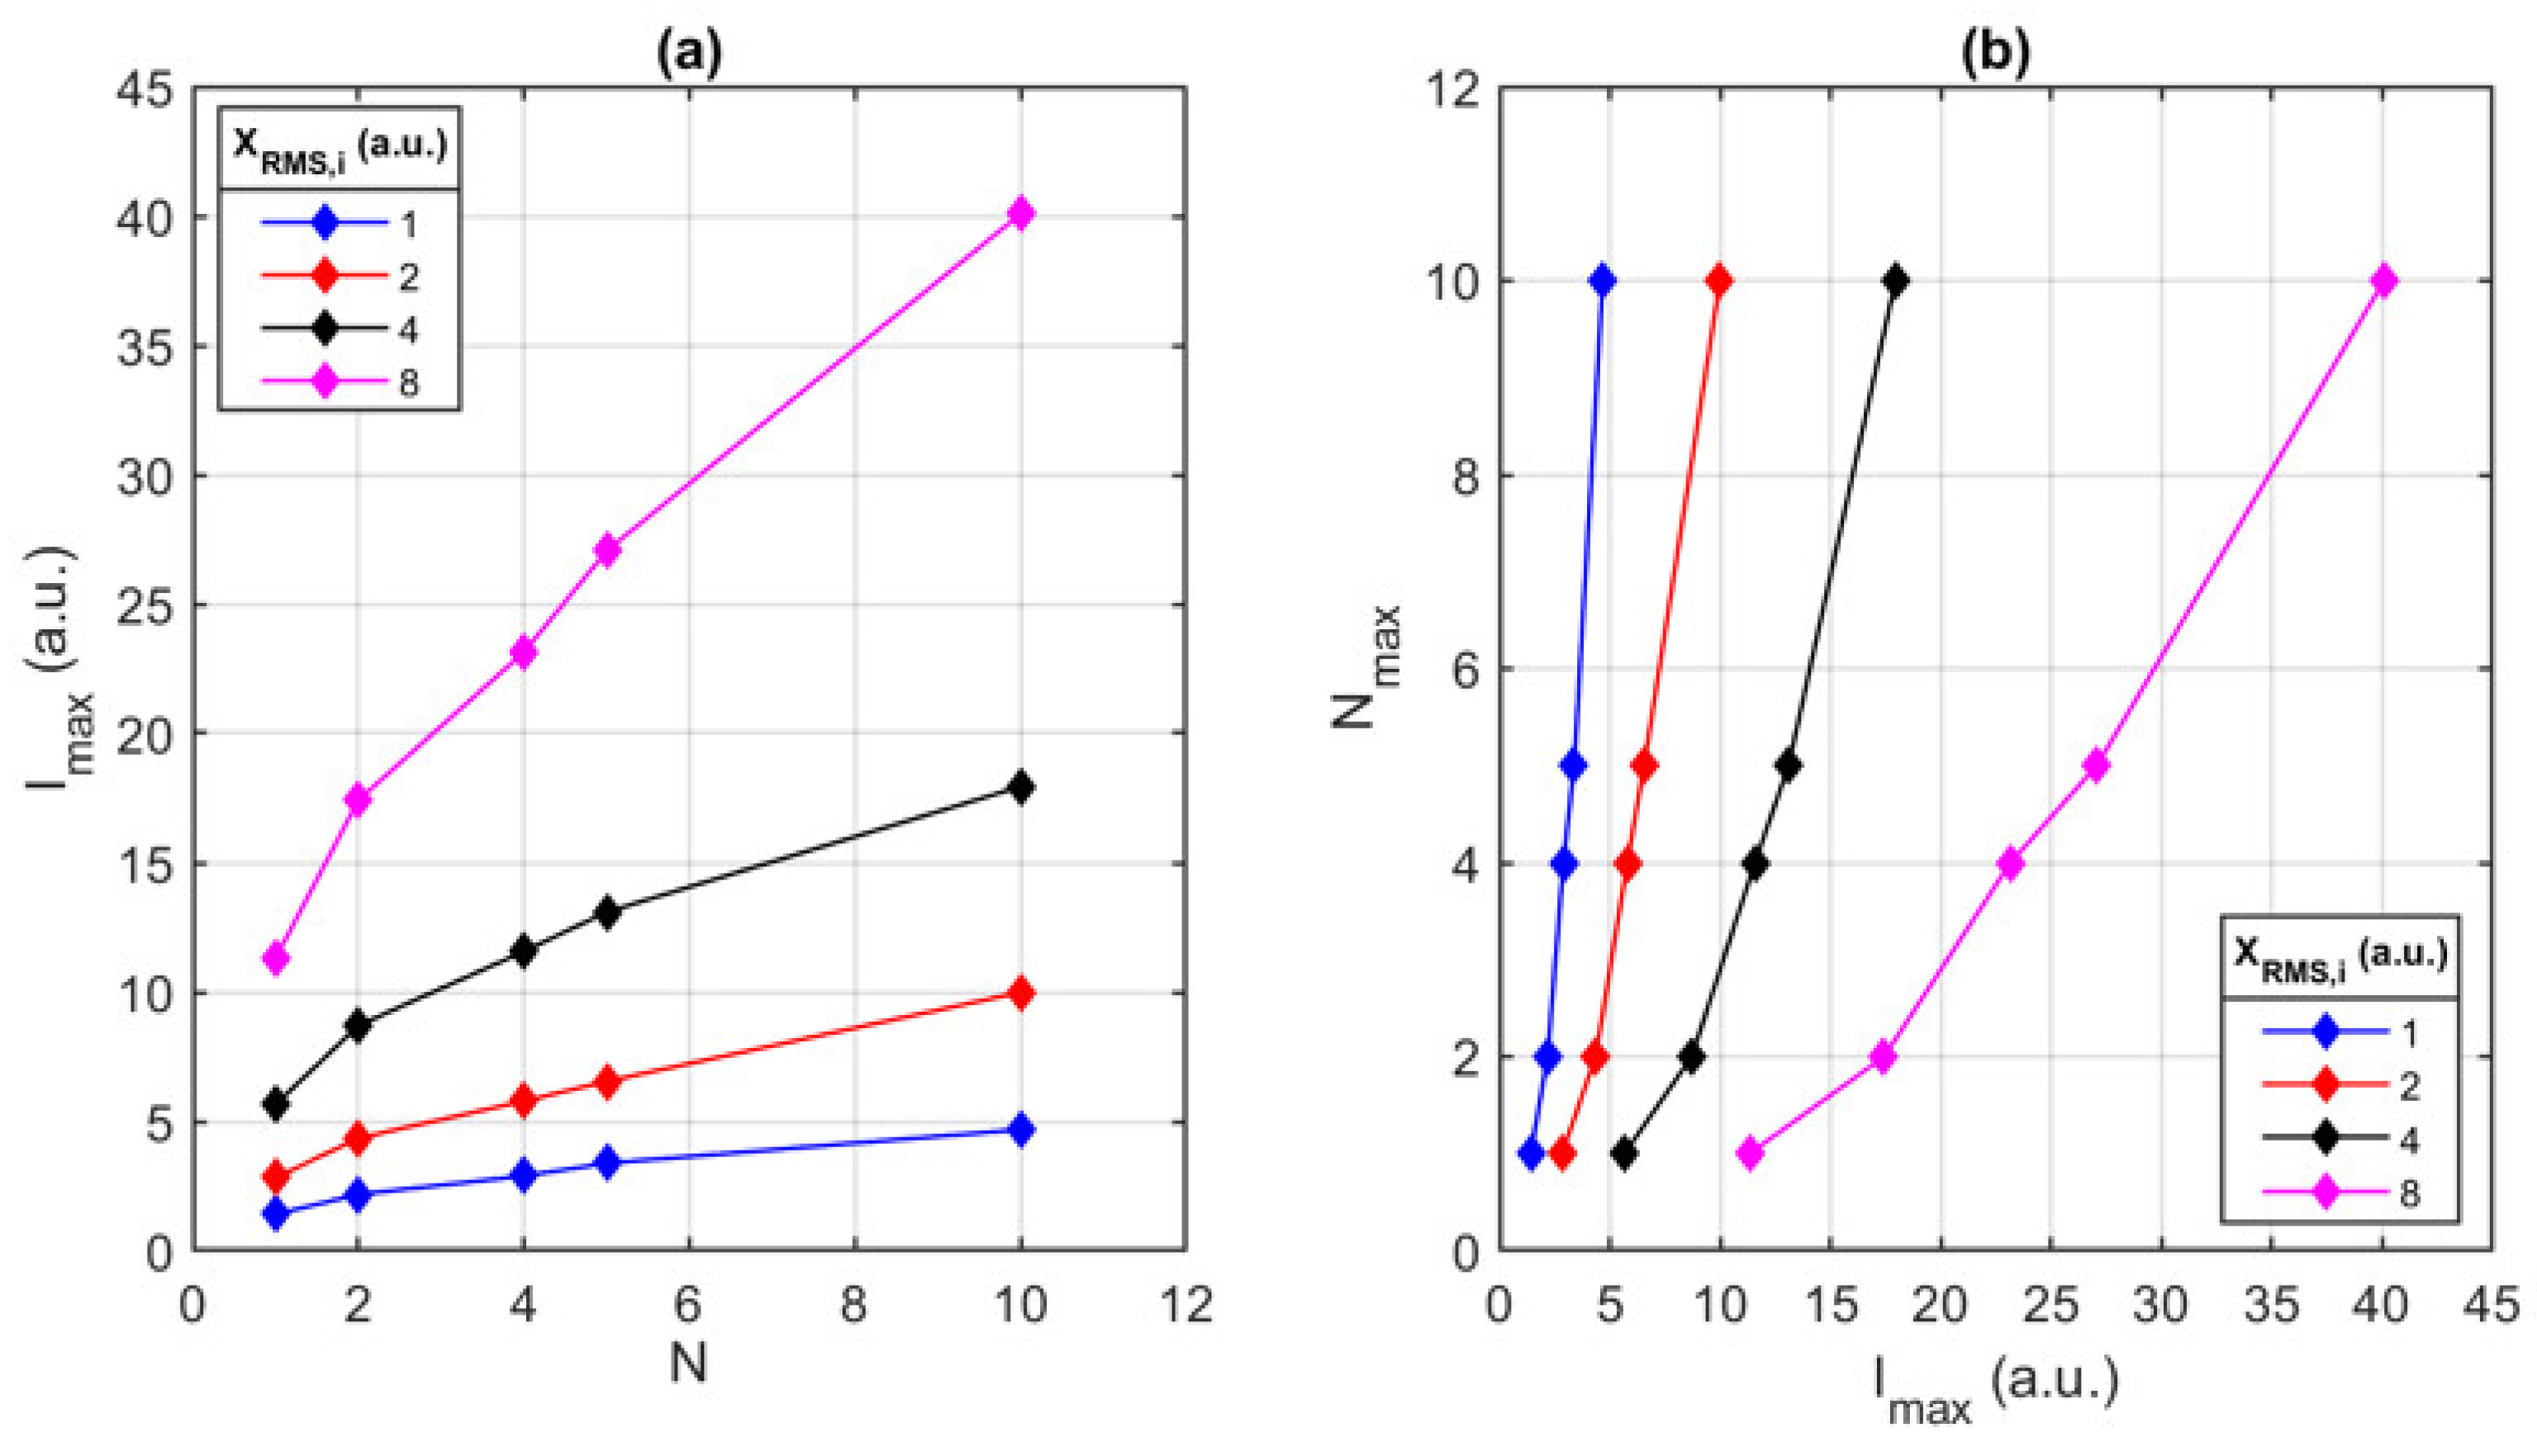
4.2. Amplitude and CF Optimization
4.3. Simulation Results
5. Numerical Tests and Experimental Examples
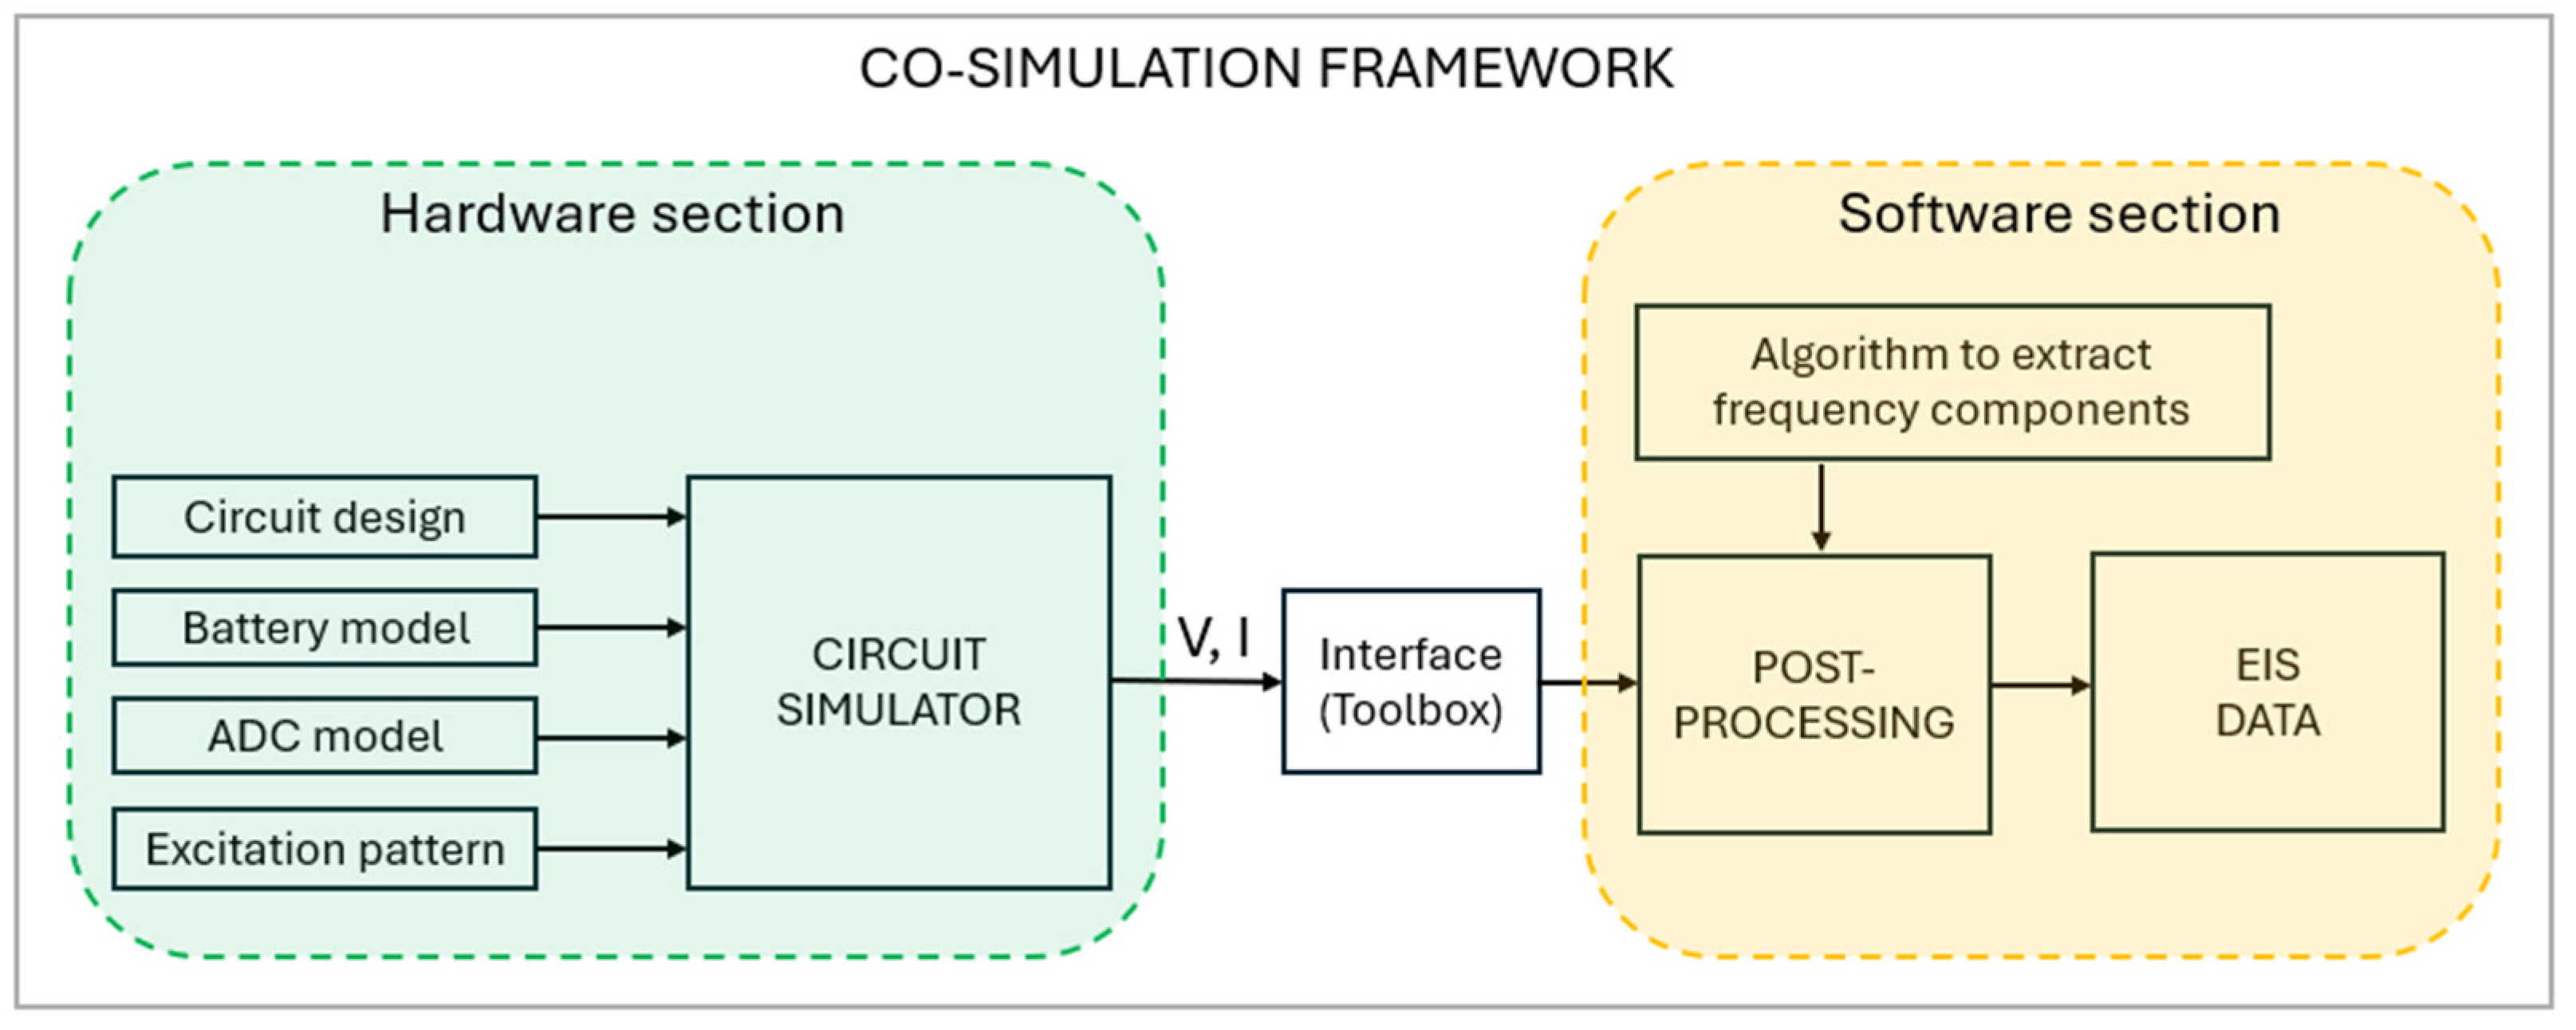
5.1. Co-Simulation Framework
5.2. Multiband Multisine Excitation Signal Design
5.3. Impedance Estimation
6. Conclusions
Author Contributions
Funding
Data Availability Statement
Conflicts of Interest
References
- Hu, X.; Li, S.; Peng, H. A comparative study of equivalent circuit models for Li-ion batteries. J. Power Sources 2012, 198, 359–367. [Google Scholar] [CrossRef]
- Van Haeverbeke, M.; Stock, M.; De Baets, B. Equivalent Electrical Circuits and Their Use Across Electrochemical Impedance Spectroscopy Application Domains. IEEE Access 2022, 10, 51363–51379. [Google Scholar] [CrossRef]
- Meddings, N.; Heinrich, M.; Overney, F.; Lee, J.S.; Ruiz, V.; Napolitano, E.; Seitz, S.; Hinds, G.; Raccichini, R.; Gaberšček, M.; et al. Application of electrochemical impedance spectroscopy to commercial Li-ion cells: A review. J. Power Sources 2020, 480, 228742. [Google Scholar] [CrossRef]
- Guha, A.; Patra, A. Online Estimation of the Electrochemical Impedance Spectrum and Remaining Useful Life of Lithium-Ion Batteries. IEEE Trans. Instrum. Meas. 2018, 67, 1836–1849. [Google Scholar] [CrossRef]
- Zhang, Y.; Tang, Q.; Zhang, Y.; Wang, J.; Stimming, U.; Lee, A.A. Identifying degradation patterns of lithium ion batteries from impedance spectroscopy using machine learning. Nat. Commun. 2020, 11, 1706. [Google Scholar] [CrossRef]
- Haussmann, P.; Melbert, J. Internal Cell Temperature Measurement and Thermal Modeling of Lithium Ion Cells for Automotive Applications by Means of Electrochemical Impedance Spectroscopy. SAE Int. J. Altern. Powertrains 2017, 6, 261–270. [Google Scholar] [CrossRef]
- Liu, K.; Orfanoudakis, G.I.; Sharkh, S.M.; Cruden, A.J. Online Battery Pack Electrochemical Impedance Spectroscopy Measurement Using a Three-Phase Neutral Point Clamped Converter. In Proceedings of the 2023 International Conference on Clean Electrical Power (ICCEP), Terrasini, Italy, 27–29 June 2023; pp. 63–69. [Google Scholar] [CrossRef]
- Koch, R.; Kuhn, R.; Zilberman, I.; Jossen, A. Electrochemical impedance spectroscopy for online battery monitoring—Power electronics control. In Proceedings of the 2014 16th European Conference on Power Electronics and Applications, Lappeenranta, Finland, 26–28 August 2014. [Google Scholar] [CrossRef]
- Din, E.; Schaef, C.; Moffat, K.; Stauth, J.T. Online spectroscopic diagnostics implemented in an efficient battery management system. In Proceedings of the 2015 IEEE 16th Workshop on Control and Modeling for Power Electronics (COMPEL), Vancouver, BC, Canada, 12–15 July 2015. [Google Scholar] [CrossRef]
- Crescentini, M.; De Angelis, A.; Ramilli, R.; De Angelis, G.; Tartagni, M.; Moschitta, A.; Andrea Traverso, P.; Carbone, P. Online EIS and Diagnostics on Lithium-Ion Batteries by Means of Low-Power Integrated Sensing and Parametric Modeling. IEEE Trans. Instrum. Meas. 2021, 70, 2001711. [Google Scholar] [CrossRef]
- Fabozzi, M.; Ramilli, R.; Crescentini, M.; Traverso, P.A. A low-cost Electrochemical Impedance Spectroscopy-based sensor node for online battery cell monitoring. In Proceedings of the 2024 IEEE International Workshop on Metrology for Automotive (MetroAutomotive), Bologna, Italy, 26–28 June 2024; pp. 112–117. [Google Scholar] [CrossRef]
- Teodorescu, R.; Sui, X.; Acharya, A.B.; Stroe, D.-I.; Huang, X. Smart Battery Concept: A Battery That Can Breathe; The Institution of Engineering and Technology: Stevenage, UK, 2022; pp. 214–220. [Google Scholar] [CrossRef]
- Wei, Z.; Zhao, J.; He, H.; Ding, G.; Cui, H.; Liu, L. Future smart battery and management: Advanced sensing from external to embedded multi-dimensional measurement. J. Power Sources 2021, 489, 229462. [Google Scholar] [CrossRef]
- Mattia, L.; Petrone, G.; Pirozzi, F.; Zamboni, W. A low-cost approach to on-board electrochemical impedance spectroscopy for a lithium-ion battery. J. Energy Storage 2024, 81, 110330. [Google Scholar] [CrossRef]
- Ria, A.; Manfredini, G.; Gagliardi, F.; Vitelli, M.; Bruschi, P.; Piotto, M. Online High-Resolution EIS of Lithium-Ion Batteries by Means of Compact and Low Power ASIC. Batteries 2023, 9, 239. [Google Scholar] [CrossRef]
- Locorotondo, E.; Cultrera, V.; Pugi, L.; Berzi, L.; Pierini, M.; Lutzemberger, G. Development of a battery real-time state of health diagnosis based on fast impedance measurements. J. Energy Storage 2021, 38, 102566. [Google Scholar] [CrossRef]
- De Angelis, A.; Bertei, A.; Carbone, P. Characterization of Uncertainty in EIS and DRT Analysis of Lithium Batteries. In Proceedings of the 2024 IEEE International Workshop on Metrology for Automotive (MetroAutomotive), Bologna, Italy, 26–28 June 2024; pp. 106–111. [Google Scholar] [CrossRef]
- Ramilli, R.; Santoni, F.; De Angelis, A.; Crescentini, M.; Carbone, P.; Traverso, P.A. Binary Sequences for Online Electrochemical Impedance Spectroscopy of Battery Cells. IEEE Trans. Instrum. Meas. 2022, 71, 2005208. [Google Scholar] [CrossRef]
- Zappen, H.; Ringbeck, F.; Sauer, D. Application of Time-Resolved Multi-Sine Impedance Spectroscopy for Lithium-Ion Battery Characterization. Batteries 2018, 4, 64. [Google Scholar] [CrossRef]
- Nian, H.; Li, M.; Hu, B.; Chen, L.; Xu, Y. Design Method of Multisine Signal for Broadband Impedance Measurement. IEEE J. Emerg. Sel. Top. Power Electron. 2022, 10, 2737–2747. [Google Scholar] [CrossRef]
- Kallel, A.Y.; Kanoun, O. On the design of multisine signals for maintaining stability condition in impedance spectroscopy measurements of batteries. J. Energy Storage 2023, 58, 106267. [Google Scholar] [CrossRef]
- Urquidi-Macdonald, M.; Real, S.; Macdonald, D.D. Applications of Kramers—Kronig transforms in the analysis of electrochemical impedance data—III. Stability and linearity. Electrochim. Acta 1990, 35, 1559–1566. [Google Scholar] [CrossRef]
- Stolz, L.; Gaberšček, M.; Winter, M.; Kasnatscheew, J. Different Efforts but Similar Insights in Battery R&D: Electrochemical Impedance Spectroscopy vs Galvanostatic (Constant Current) Technique. Chem. Mater. 2022, 34, 10272–10278. [Google Scholar] [CrossRef]
- Murbach, M.D.; Hu, V.W.; Schwartz, D.T. Nonlinear Electrochemical Impedance Spectroscopy of Lithium-Ion Batteries: Experimental Approach, Analysis, and Initial Findings. J. Electrochem. Soc. 2018, 165, A2758–A2765. [Google Scholar] [CrossRef]
- Macdonald, J.R. Some new directions in impedance spectroscopy data analysis. Electrochim. Acta 1993, 38, 1883–1890. [Google Scholar] [CrossRef]
- You, C.; Zabara, M.A.; Orazem, M.E.; Ulgut, B. Application of the Kramers–Kronig Relations to Multi-Sine Electrochemical Impedance Measurements. J. Electrochem. Soc. 2020, 167, 020515. [Google Scholar] [CrossRef]
- Zhu, X.; Hallemans, N.; Wouters, B.; Claessens, R.; Lataire, J.; Hubin, A. Operando odd random phase electrochemical impedance spectroscopy as a promising tool for monitoring lithium-ion batteries during fast charging. J. Power Sources 2022, 544, 231852. [Google Scholar] [CrossRef]
- Hallemans, N.; Widanage, W.D.; Zhu, X.; Moharana, S.; Rashid, M.; Hubin, A.; Lataire, J. Operando electrochemical impedance spectroscopy and its application to commercial Li-ion batteries. J. Power Sources 2022, 547, 232005. [Google Scholar] [CrossRef]
- Hallemans, N.; Howey, D.; Battistel, A.; Saniee, N.F.; Scarpioni, F.; Wouters, B.; La Mantia, F.; Hubin, A.; Widanage, W.D.; Lataire, J. Electrochemical impedance spectroscopy beyond linearity and stationarity—A critical review. Electrochim. Acta 2023, 466, 142939. [Google Scholar] [CrossRef]
- Schroeder, M.R. Synthesis of Low-Peak-Factor Signals and Binary Sequences with Low Autocorrelation. IEEE Trans. Inf. Theory 1970, 16, 85–89. [Google Scholar] [CrossRef]
- Van Der Ouderaa, E.; Schoukens, J.; Renneboog, J. Peak Factor Minimization of Input and Output Signals of Linear Systems. IEEE Trans. Instrum. Meas. 1988, 37, 207–212. [Google Scholar] [CrossRef]
- Yang, Y.; Zhang, F.; Tao, K.; Sanchez, B.; Wen, H.; Teng, Z. An improved crest factor minimization algorithm to synthesize multisines with arbitrary spectrum. Physiol. Meas. 2015, 36, 895. [Google Scholar] [CrossRef] [PubMed]
- Guillaume, P.; Schoukens, J.; Pintelon, R.; Kollar, I. Crest-Factor Minimization Using Nonlinear Cheby shev Approximation Methods. IEEE Trans. Instrum. Meas. 1991, 40, 982–989. [Google Scholar] [CrossRef]
- Retzler, A.; Cseppentő, B.; Swevers, J.; Gillis, J.; Leitold, L.; Kollár, Z. Improved crest factor minimization of multisine excitation signals using nonlinear optimization. Automatica 2022, 146, 110654. [Google Scholar] [CrossRef]
- Ojarand, J.; Min, M. Recent Advances in Crest Factor Minimization of Multisine. Elektron. Elektrotechnika 2017, 23, 59–62. [Google Scholar] [CrossRef]
- Horner, A.; Beauchamp, J. A genetic algorithm-based method for synthesis of low peak amplitude signals. J. Acoust. Soc. Am. 1996, 99, 433–443. [Google Scholar] [CrossRef]
- Hu, Y.; Ramos, P.M.; Janeiro, F.M. Artificial bee colony algorithm for peak-to-peak factor minimization in periodic signals. In Proceedings of the 22nd IMEKO TC4 International Symposium & 20th International Workshop on ADC Modelling and Testing Supporting World Development Through Electrical & Electronic Measurements, Iasi, Romania, 14–15 September 2017; pp. 271–274. [Google Scholar]
- Kallel, A.Y.; Kanoun, O. Crest Factor Optimization for Multisine Excitation Signals with Logarithmic Frequency Distribution Based on a Hybrid Stochastic-Deterministic Optimization Algorithm. Batteries 2022, 8, 176. [Google Scholar] [CrossRef]
- Kallel, A.Y.; Bouchaala, D.; Kanoun, O.; Kallel, A.Y.; Bouchaala, D.; Kanoun, O. Critical implementation issues of excitation signals for embedded wearable bioimpedance spectroscopy systems with limited resources. MeScT 2021, 32, 084011. [Google Scholar] [CrossRef]
- Luciani, G.; Ramilli, R.; Romani, A.; Tartagni, M.; Traverso, P.A.; Crescentini, M. A miniaturized low-power vector impedance analyser for accurate multi-parameter measurement. Measurement 2019, 144, 388–401. [Google Scholar] [CrossRef]
- Lowenthal, N.; Ramilli, R.; Crescentini, M.; Traverso, P.A. Development of a numerical framework for the analysis of a multi-tone EIS measurement system. In Proceedings of the 2023 IEEE International Workshop on Metrology for Automotive (MetroAutomotive), Modena, Italy, 28–30 June 2023; pp. 41–45. [Google Scholar] [CrossRef]
- De Angelis, A.; Ramilli, R.; Crescentini, M.; Moschitta, A.; Carbone, P.; Traverso, P.A. In-Situ Electrochemical Impedance Spectroscopy of Battery Cells by Means of Binary Sequences. In Proceedings of the 2021 IEEE International Instrumentation and Measurement Technology Conference (I2MTC), Glasgow, UK, 17–20 May 2021; pp. 1–5. [Google Scholar]
- Howey, D.A.; Mitcheson, P.D.; Yufit, V.; Offer, G.J.; Brandon, N.P. Online measurement of battery impedance using motor controller excitation. IEEE Trans. Veh. Technol. 2014, 63, 2557–2566. [Google Scholar] [CrossRef]
- Wikner, E.; Lesser, J. Accelerated lithium-ion battery cycle lifetime testing by condition-based reference performance tests. Meas. Energy 2024, 4, 100019. [Google Scholar] [CrossRef]
- Dubarry, M.; Baure, G. Perspective on Commercial Li-ion Battery Testing, Best Practices for Simple and Effective Protocols. Electronics 2020, 9, 152. [Google Scholar] [CrossRef]
- Marelli Unveils Latest Innovative Battery Management Systems Solution at CTI Symposium Berlin. 2024. Available online: https://www.marelli.com/en/news/marelli-unveils-latest-innovative-battery-management-systems-sol.html (accessed on 18 April 2025).
- Battery Cell Management Unit (CMU)—Sensichips—Learning MICROSENSORS. Available online: https://sensichips.com/battery-cell-management-unit/ (accessed on 18 April 2025).

| Excitation Technique | Measurement Time | Single Tone RMS |
|---|---|---|
| Sine sweep | ||
| Single-band multisine | ||
| Multiband multisine |
| No. of Tones (N) | Frequencies (Hz) | Fs (kHz) | No. of Samples (L) |
|---|---|---|---|
| 1 | [5] | 200 | 40,000 |
| 2 | [3, 9] | 200 | 66,666 |
| 4 | [2, 4, 6, 8] | 200 | 100,000 |
| 5 | [1, 3, 5, 7, 9] | 200 | 200,000 |
| 10 | [1, 2, 3, 4, 5, 6, 7, 8, 9, 10] | 200 | 200,000 |
| Frequencies (Hz) | Fs (kHz) | Nr. of Samples (L) | (a.u.) | CF | (a.u.) |
|---|---|---|---|---|---|
| [1, 6, 11, 17, 22, 27, 32, 37, 43, 48, 53, 58, 64, 69, 74, 79, 84, 90, 95, 100] | 200 | 200,000 | 4.47 | 1.7831 | 7.9703 |
| j-th Sub-Band | Frequencies (Hz) | (a.u.) | CF | (a.u.) |
|---|---|---|---|---|
| j = 0 | [1, 6, 11, 17, 22] | 1.79 | 1. 8971 | 7.9703 |
| j = 1 | [27, 32, 37, 43, 48] | 1.88 | 1.6926 | 7.9703 |
| j = 2 | [53, 58, 64, 69, 74] | 1.87 | 1.9179 | 7.9703 |
| j = 3 | [79, 84, 90, 95, 100] | 1.98 | 1.9976 | 7.9703 |
| Excitation Technique | Magnitude RMSE (mΩ) | Phase RMSE (mrad) |
|---|---|---|
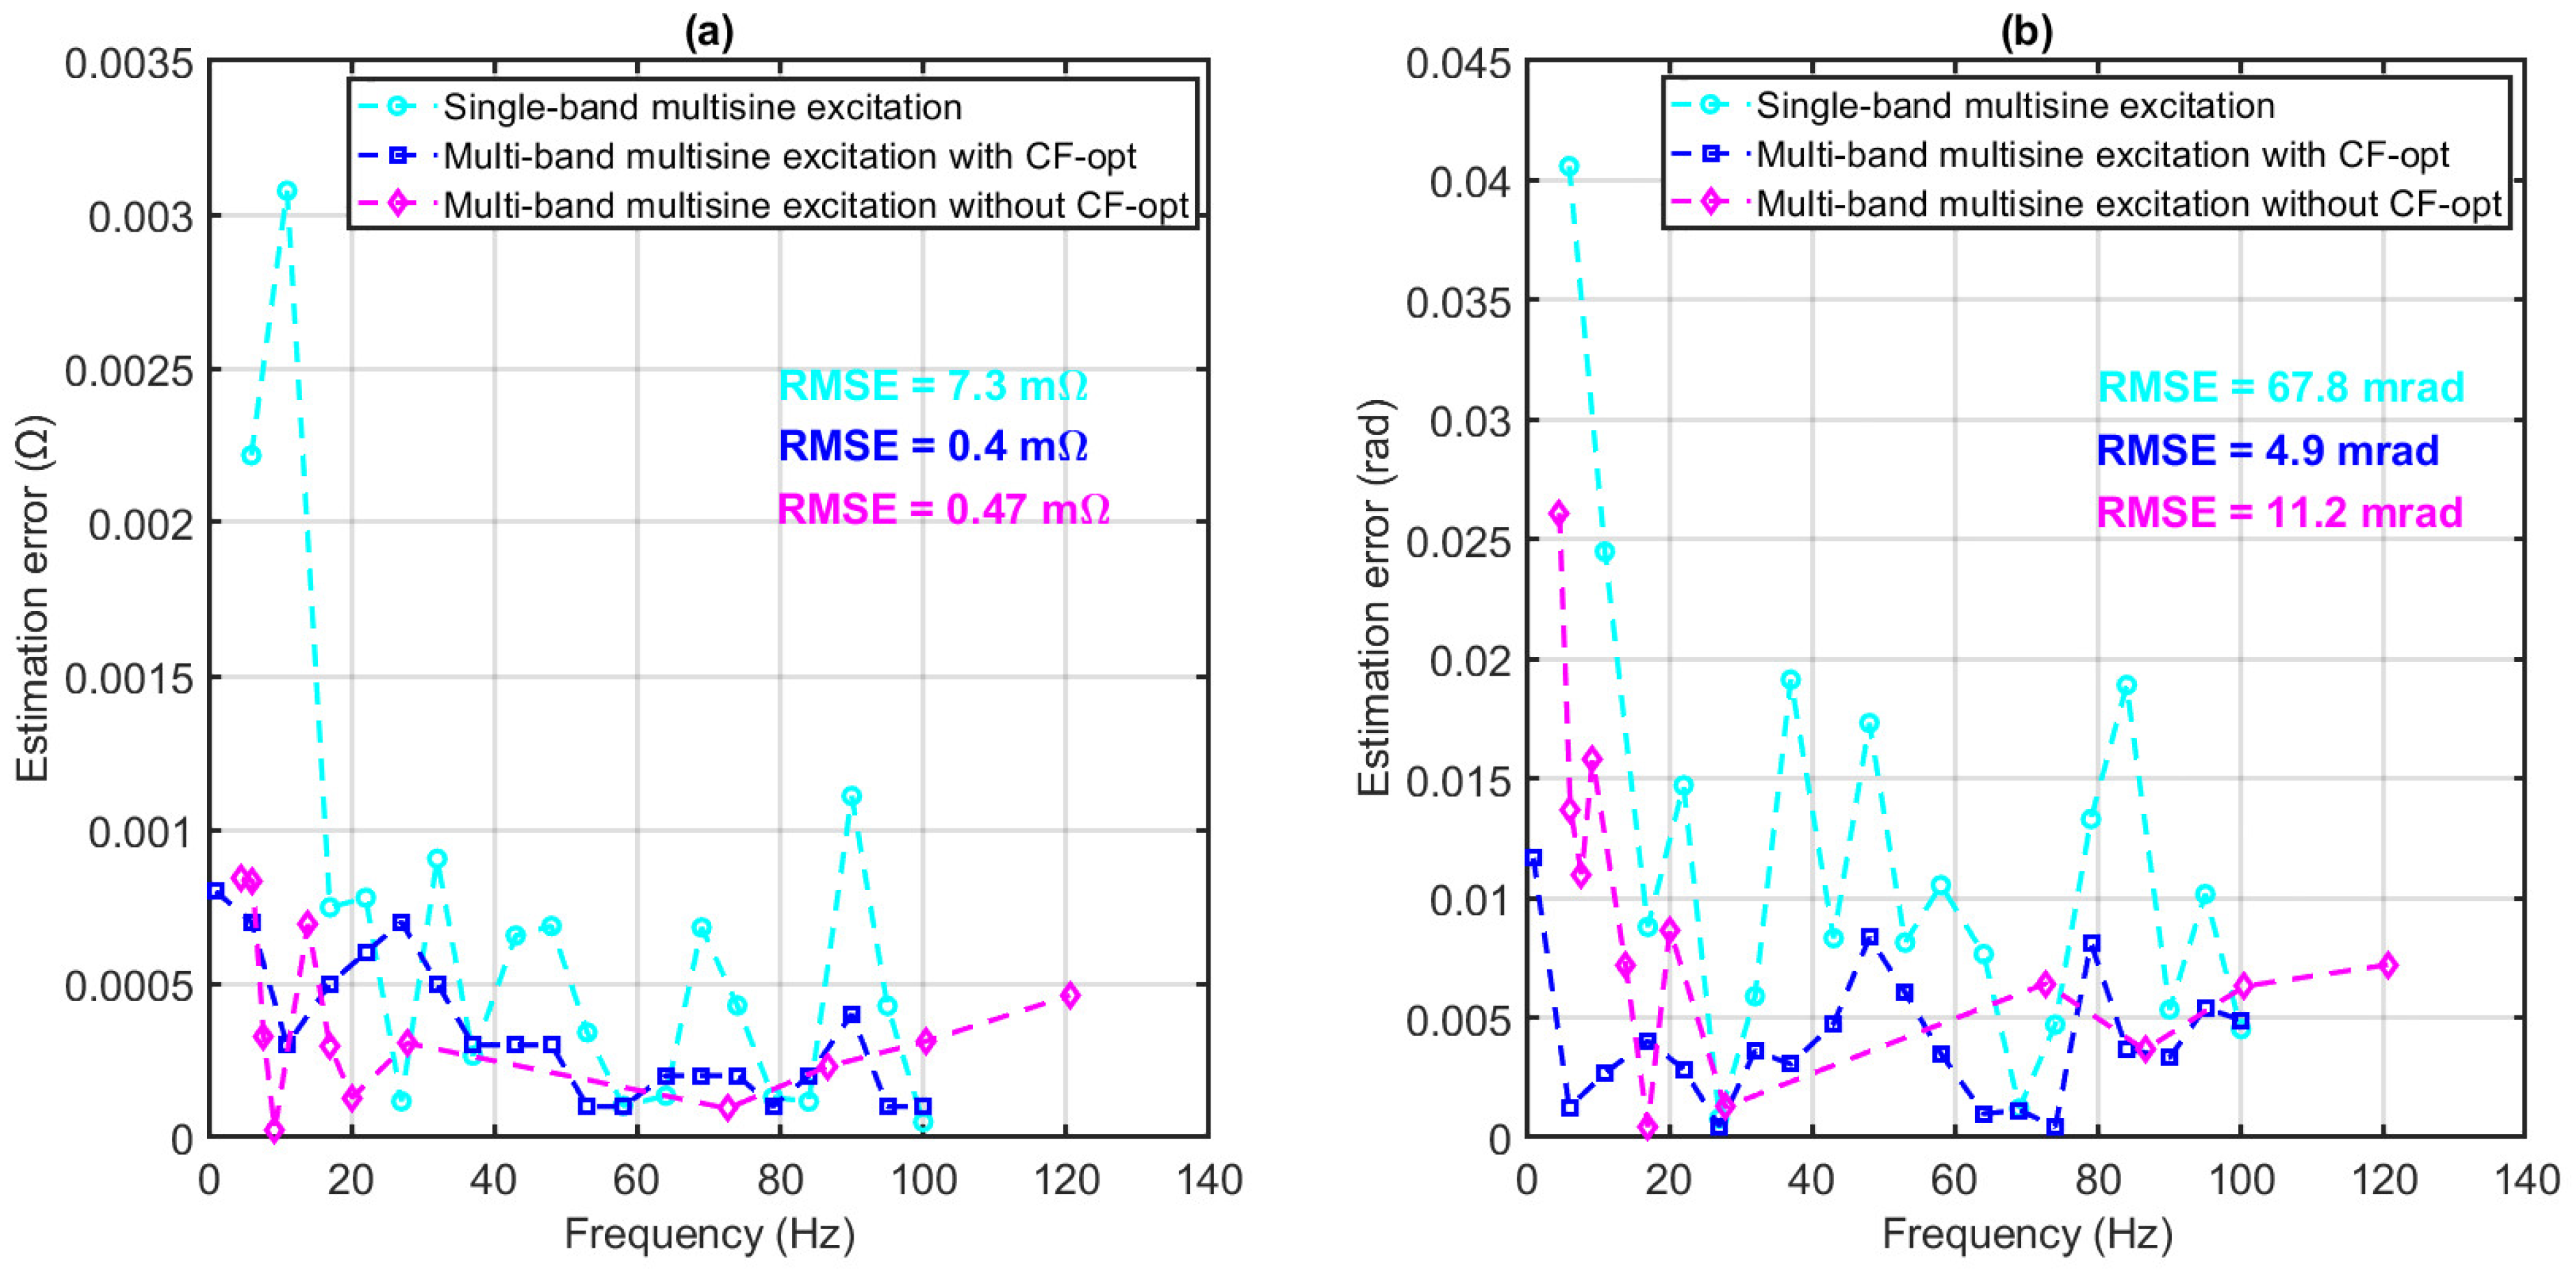
| Single-band multisine | 7.30 | 67.8 |
| Multiband multisine with CF optimization | 0.40 | 4.9 |
| Multiband multisine without CF optimization | 0.47 | 11.2 |
| Excitation Technique | Measurement Time (s) |
|---|---|
| Sine sweep | |
| Single-band multisine | |
| Multiband multisine |
Disclaimer/Publisher’s Note: The statements, opinions and data contained in all publications are solely those of the individual author(s) and contributor(s) and not of MDPI and/or the editor(s). MDPI and/or the editor(s) disclaim responsibility for any injury to people or property resulting from any ideas, methods, instructions or products referred to in the content. |
© 2025 by the authors. Licensee MDPI, Basel, Switzerland. This article is an open access article distributed under the terms and conditions of the Creative Commons Attribution (CC BY) license (https://creativecommons.org/licenses/by/4.0/).
Share and Cite
Ramilli, R.; Lowenthal, N.; Crescentini, M.; Traverso, P.A. Multiband Multisine Excitation Signal for Online Impedance Spectroscopy of Battery Cells. Batteries 2025, 11, 188. https://doi.org/10.3390/batteries11050188
Ramilli R, Lowenthal N, Crescentini M, Traverso PA. Multiband Multisine Excitation Signal for Online Impedance Spectroscopy of Battery Cells. Batteries. 2025; 11(5):188. https://doi.org/10.3390/batteries11050188
Chicago/Turabian StyleRamilli, Roberta, Nicola Lowenthal, Marco Crescentini, and Pier Andrea Traverso. 2025. "Multiband Multisine Excitation Signal for Online Impedance Spectroscopy of Battery Cells" Batteries 11, no. 5: 188. https://doi.org/10.3390/batteries11050188
APA StyleRamilli, R., Lowenthal, N., Crescentini, M., & Traverso, P. A. (2025). Multiband Multisine Excitation Signal for Online Impedance Spectroscopy of Battery Cells. Batteries, 11(5), 188. https://doi.org/10.3390/batteries11050188