1. Introduction
Electric and hybrid electric vehicles (EV and HEV) emerge as a promising near-term solution in the transportation sector to diminish the reliance on fossil fuels and mitigate the emissions of greenhouse gases and pollutants. The suitability of a rechargeable Li-ion battery (LIB) for these vehicles is evident, given their high specific energy density compared to other battery chemistries, among other advantageous features [
1,
2].
In the pursuit of enhancing LIB technology, a critical aspect lies in comprehending the intricate interplay between environmental factors and LIB performance. The electrical performances and degradation rate of an LIB are influenced by the applied mechanical pressure, the operating temperature and the discharge rates. Previous studies analysed the influence of either the pressure or the temperature, but left one of the two parameters uncontrolled [
3,
4,
5,
6,
7].
The influence of temperature during LIB operation cannot be neglected and it has been evaluated and extensively researched [
2,
8,
9]. In fact, temperature changes can significantly influence the electrochemical processes occurring inside an LIB [
9]. These in turn affect its capacity, internal impedance, maximum charge-discharge rates, overall efficiency and operational life-span [
3,
10,
11,
12,
13].
As temperature affects the performance of the LIB [
14], temperature fluctuations during operation may result in altered electrical measurement outcome. Furthermore, even thermal gradients on the LIB surface have been measured to have detrimental effects [
15,
16].
As example, Panchal et al. [
17] demonstrated that a pouch LIB discharged at 4 C-rate, with only natural air convection, increased its temperature from 22 °C to 58 °C. Therefore, the resulting data cannot be attributed to a specific temperature and cannot be used for modelling or performance evaluation.
Wang et al. [
18] measured the discharge curves of a prismatic LIB placed in a climatic chamber at different temperatures and C-rates. The data show that the voltage difference between the curves is significant at the beginning of the discharge process, since the LIB temperature is initially equal to the room temperature. As the discharge proceeds, the voltage difference between the curves at different room temperatures decreases, especially at higher C-rates (0.75 C and 1 C). This decrease is due to the self-heating of the LIB, which causes its temperature to rise above the room temperature. However, the mentioned studies analyse the impact of the temperature on the electrical measurements without considering any applied pressure on the LIB.
Likewise, pressure fluctuations can impact the electrical performance and aging speed. Previous studies have investigated the effect of external pressure, but have only controlled pressure at the expense of the temperature [
3,
4,
5,
6]. The external mechanical pressure has an influence on the electrical performances, and the reason for this has been have been identified in the alteration of separator porosity and the electrodes’ wettability [
6,
19]. The variation of capacity-fading behaviour during the lifetime of an LIB with respect to external pressure has also been the subject of extensive research [
3,
10,
20,
21]. Furthermore, the complexity of the system introduces non-linearities between temperature, pressure and discharge rates when compared to LIB performances [
6,
22].
Thus, both temperature and external mechanical pressure have an impact on the performance and ageing of LIB. Therefore, their combined effects need to be considered during the analysis of the their performances. The typical thermal conditioning technology found in the literature consisted in climatic chambers. These systems use a working fluid, usually air or a non-electrically conductive liquid, that is first brought to the desired temperature and then is put into contact with the surface of the cell. However, this technique has limitations, as sudden variations in the temperature of the fluid can be difficult to achieve. This prevents the reactive temperature control of the system and precise thermal conditioning of the cell. Furthermore, in case a pressure rig is used within the chamber, this would add an additional thermal impedance between the LIB and the conditioning fluid, reducing the capability of the system to force the target temperature on the LIB. Thus, a new test bench has been developed and presented in this study. This novel test rig facilitates the accurate control of surface temperatures in pouch, prismatic and cylindrical LIBs, even at elevated current C-rates, coupled with the imposition of mechanical pressure. The test rig facilitates an extensive examination of the mechanical, thermal and electrical parameters, thereby assisting in the decoupling of the influence of the thermal and mechanical state on the LIB performances during electrical operations.
2. Materials and Methods
2.1. Specimen
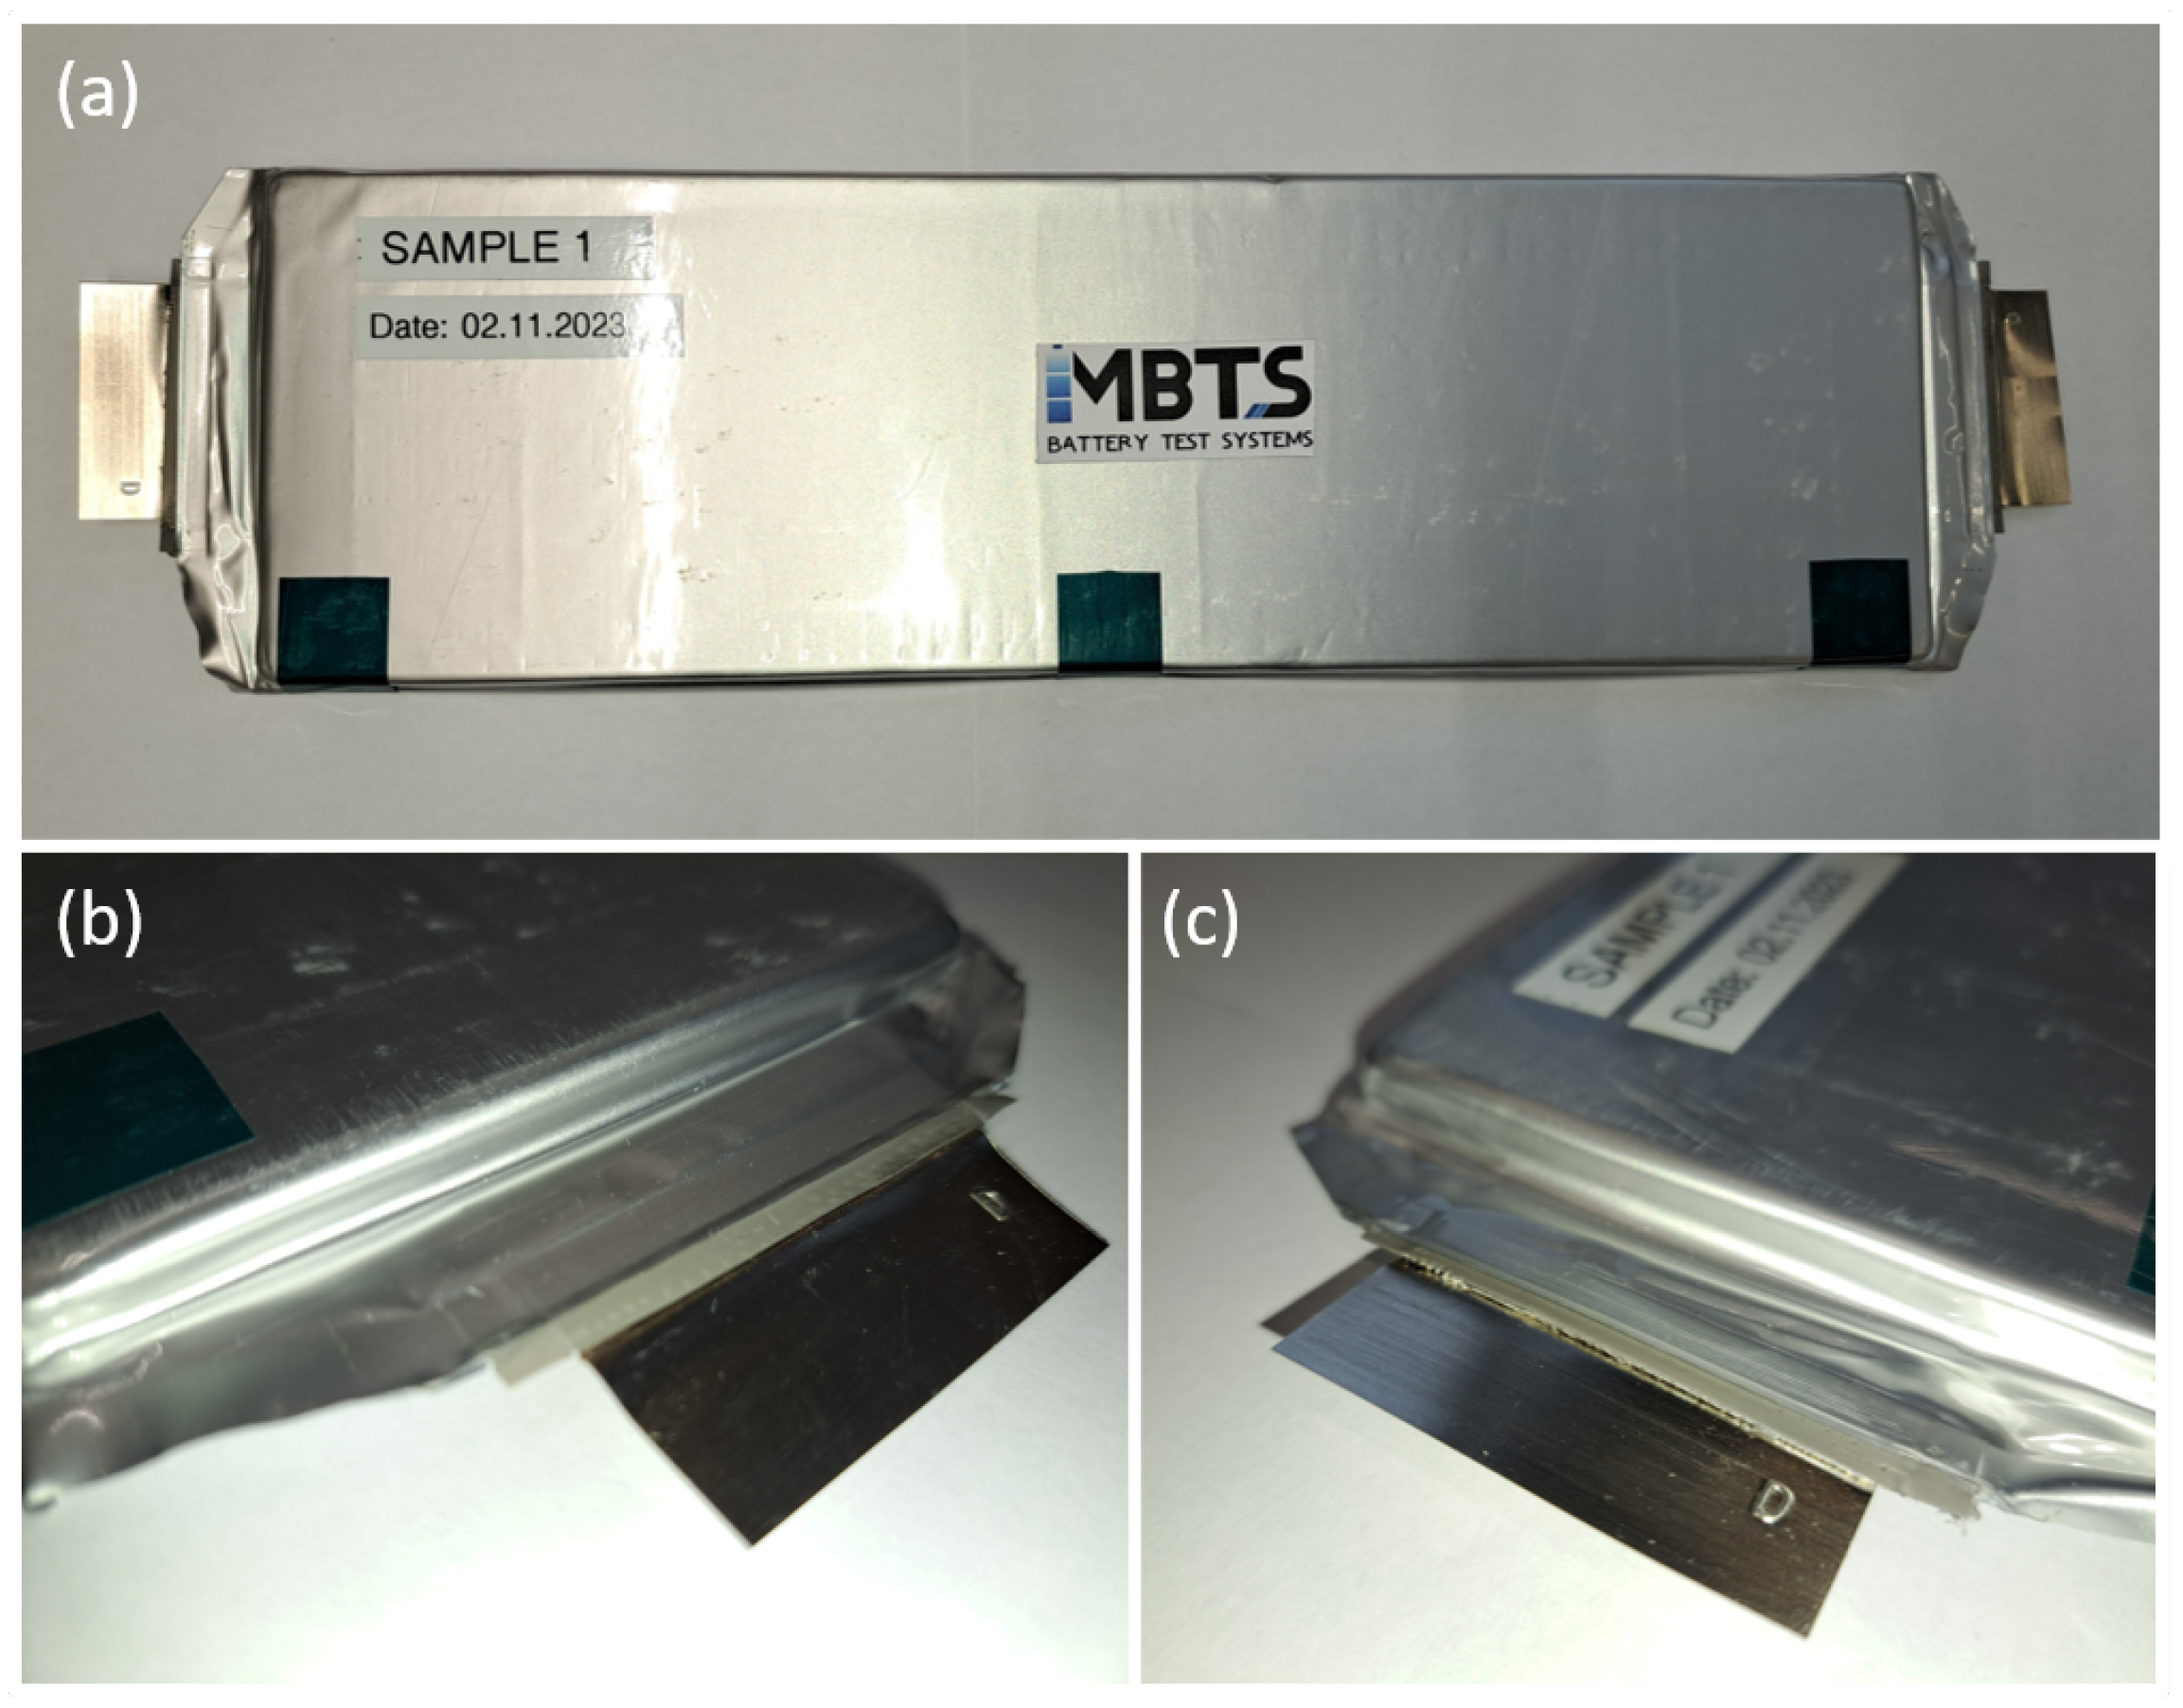
The battery analysed in this work is a commercial laminate-pouch LIB with a rated capacity of 65 Ah and a nominal voltage of 3.7 V. Its dimensions are 350 mm × 104 mm × 11.7 mm with an energy density declared by the manufacturer of 259 Wh/Kg. The cathode material is NMC 712, with graphite as the anode. The LIB was obtained from an electrical system demonstrator, therefore minor surface scratches are present on the pouch bag due to the disassembly process. Details of the tabs, surface conditions and overall appearance are shown in
Figure 1.
2.2. Testbench
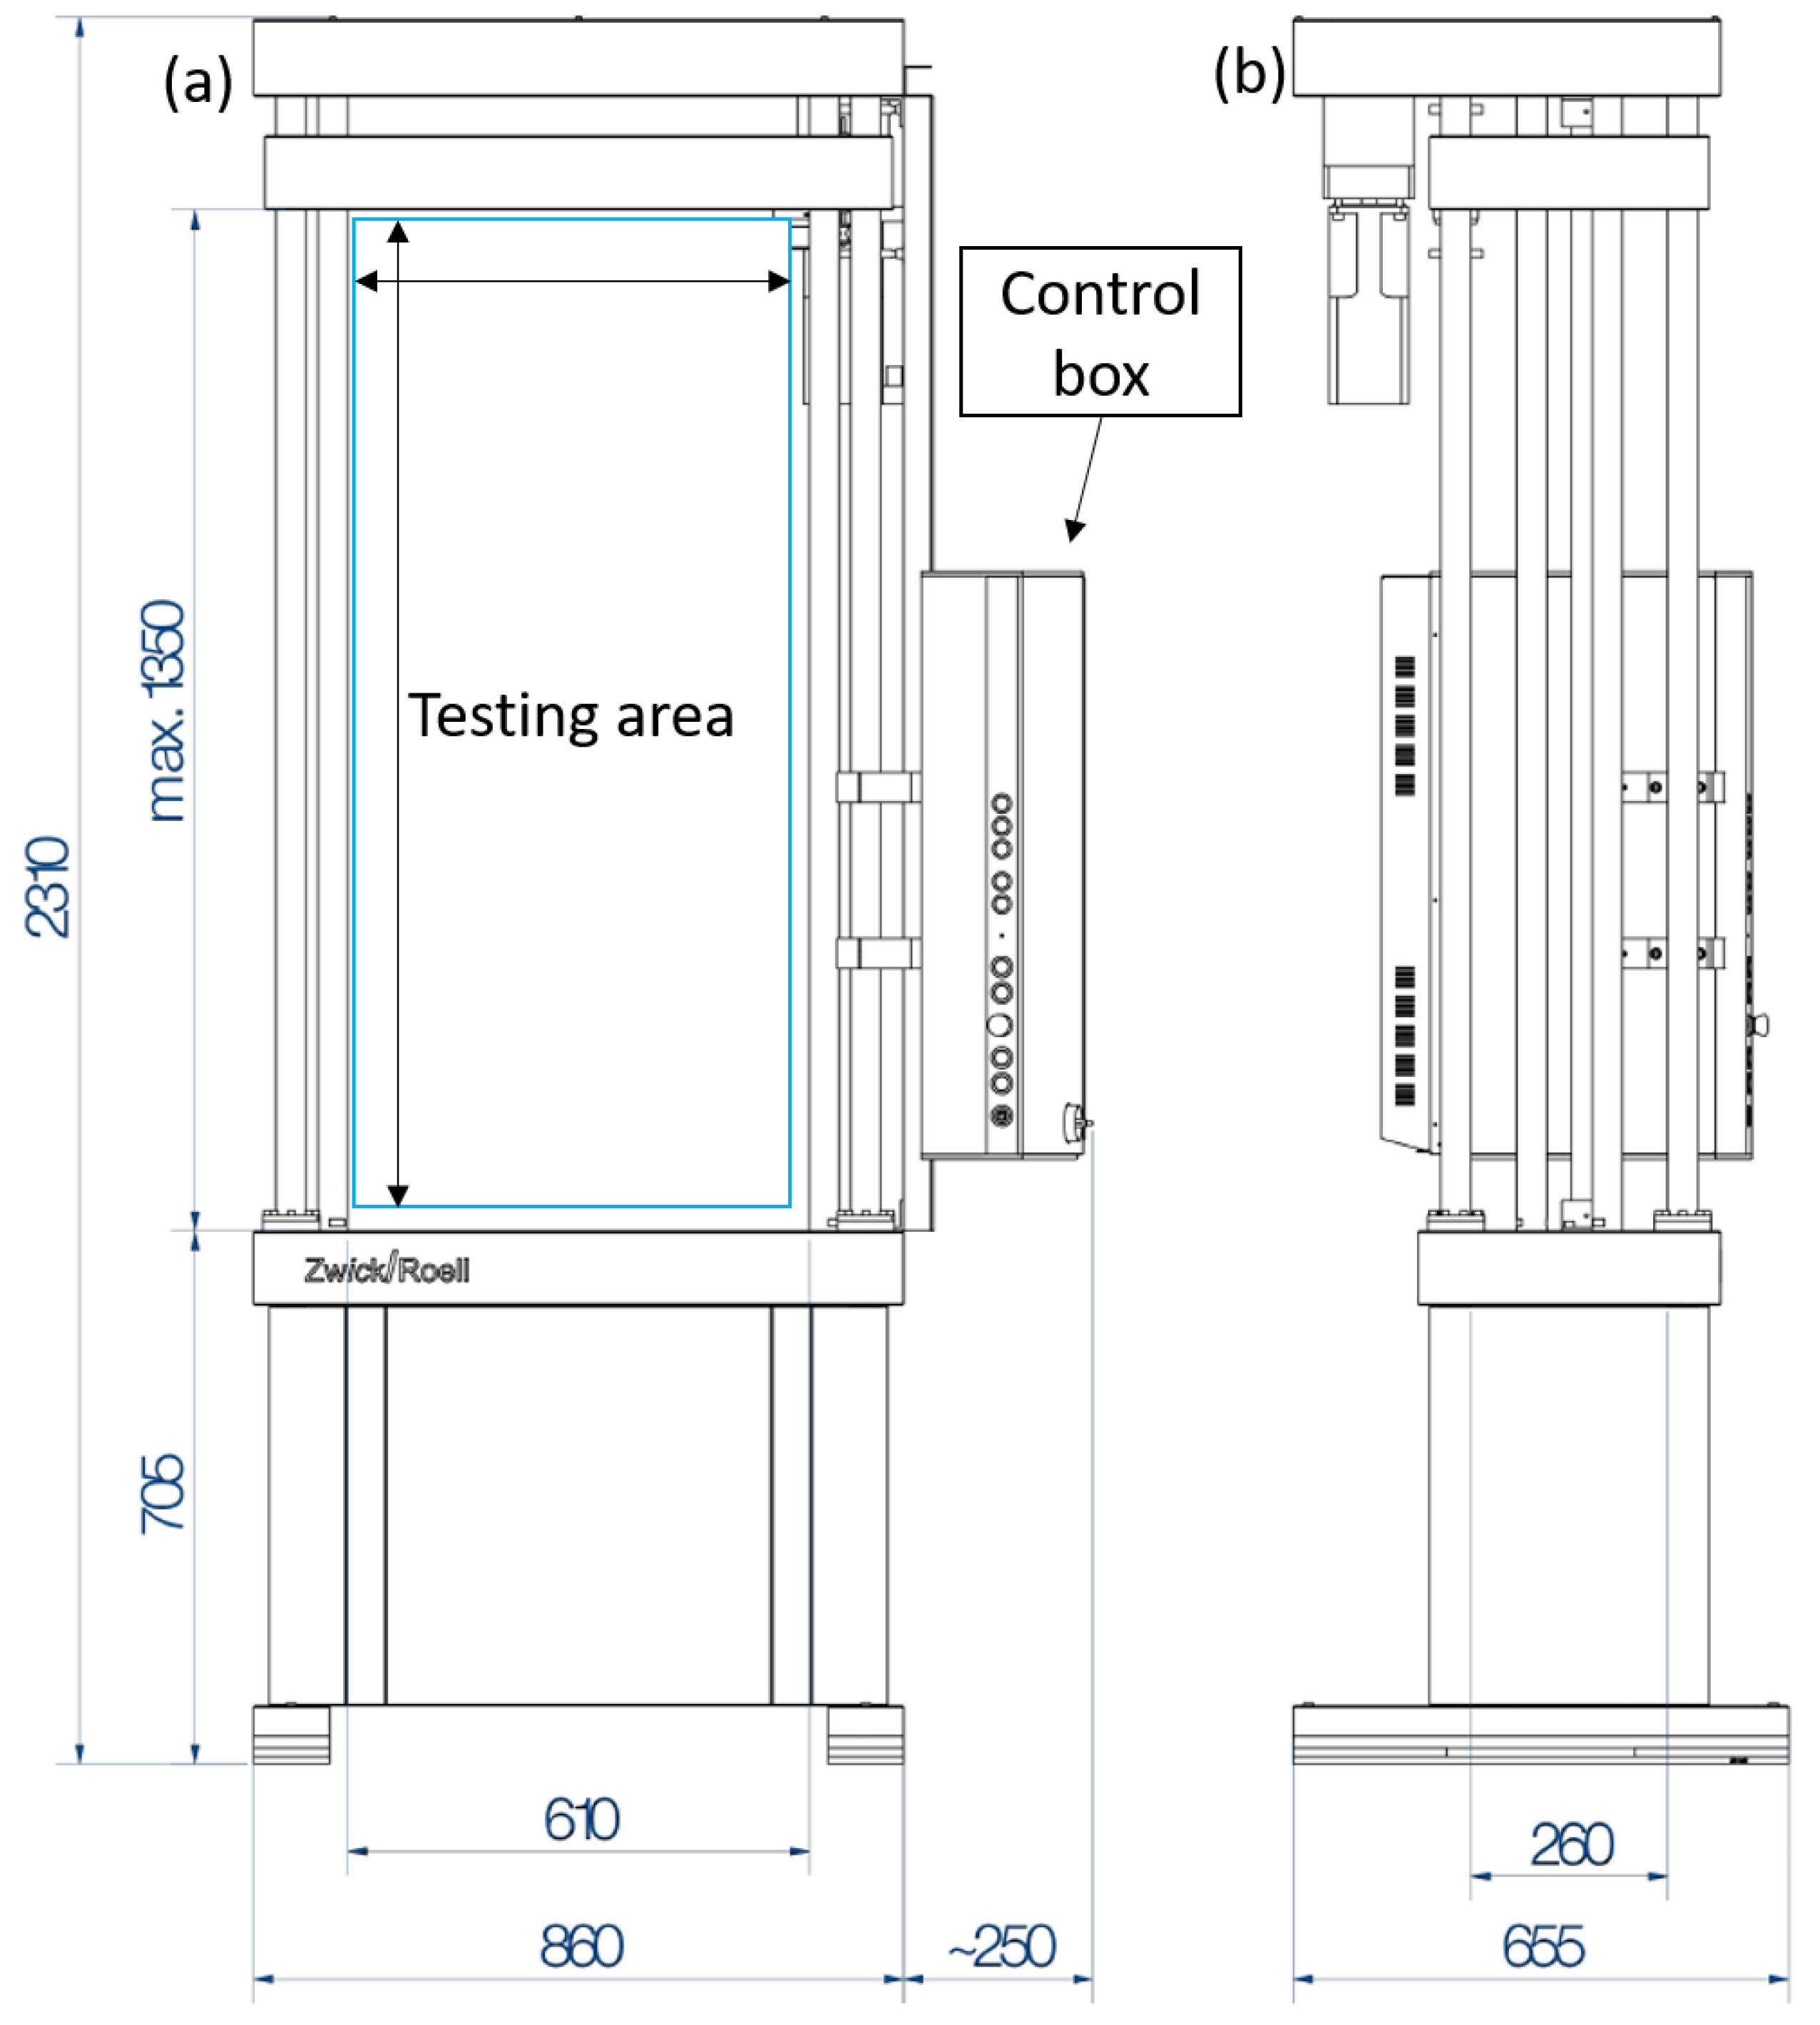
The testbench employed is a multi-physics testing device that comprises three main parts: a mechanical creep testing machine, a thermal unit and an electrical cycler. The creep testing machine is an off-the-shelf product built by ZwickRoell Testing Systems GmbH. It can reach a maximum force of 100 kN and can be controlled by either force or displacement mode. The testing volume is 1350 mm × 610 mm × 655 mm as shown in
Figure 2. Precision bearings guide four hard-chromed guide columns that allow the cross-head to move with a test speed ranging from 0.001 mm/h to 100 mm/min. The position transducer has a travel resolution of 0.068 nm. This press is suited for long testing times. The creep testing machine provides the force and displacement as analog outputs.
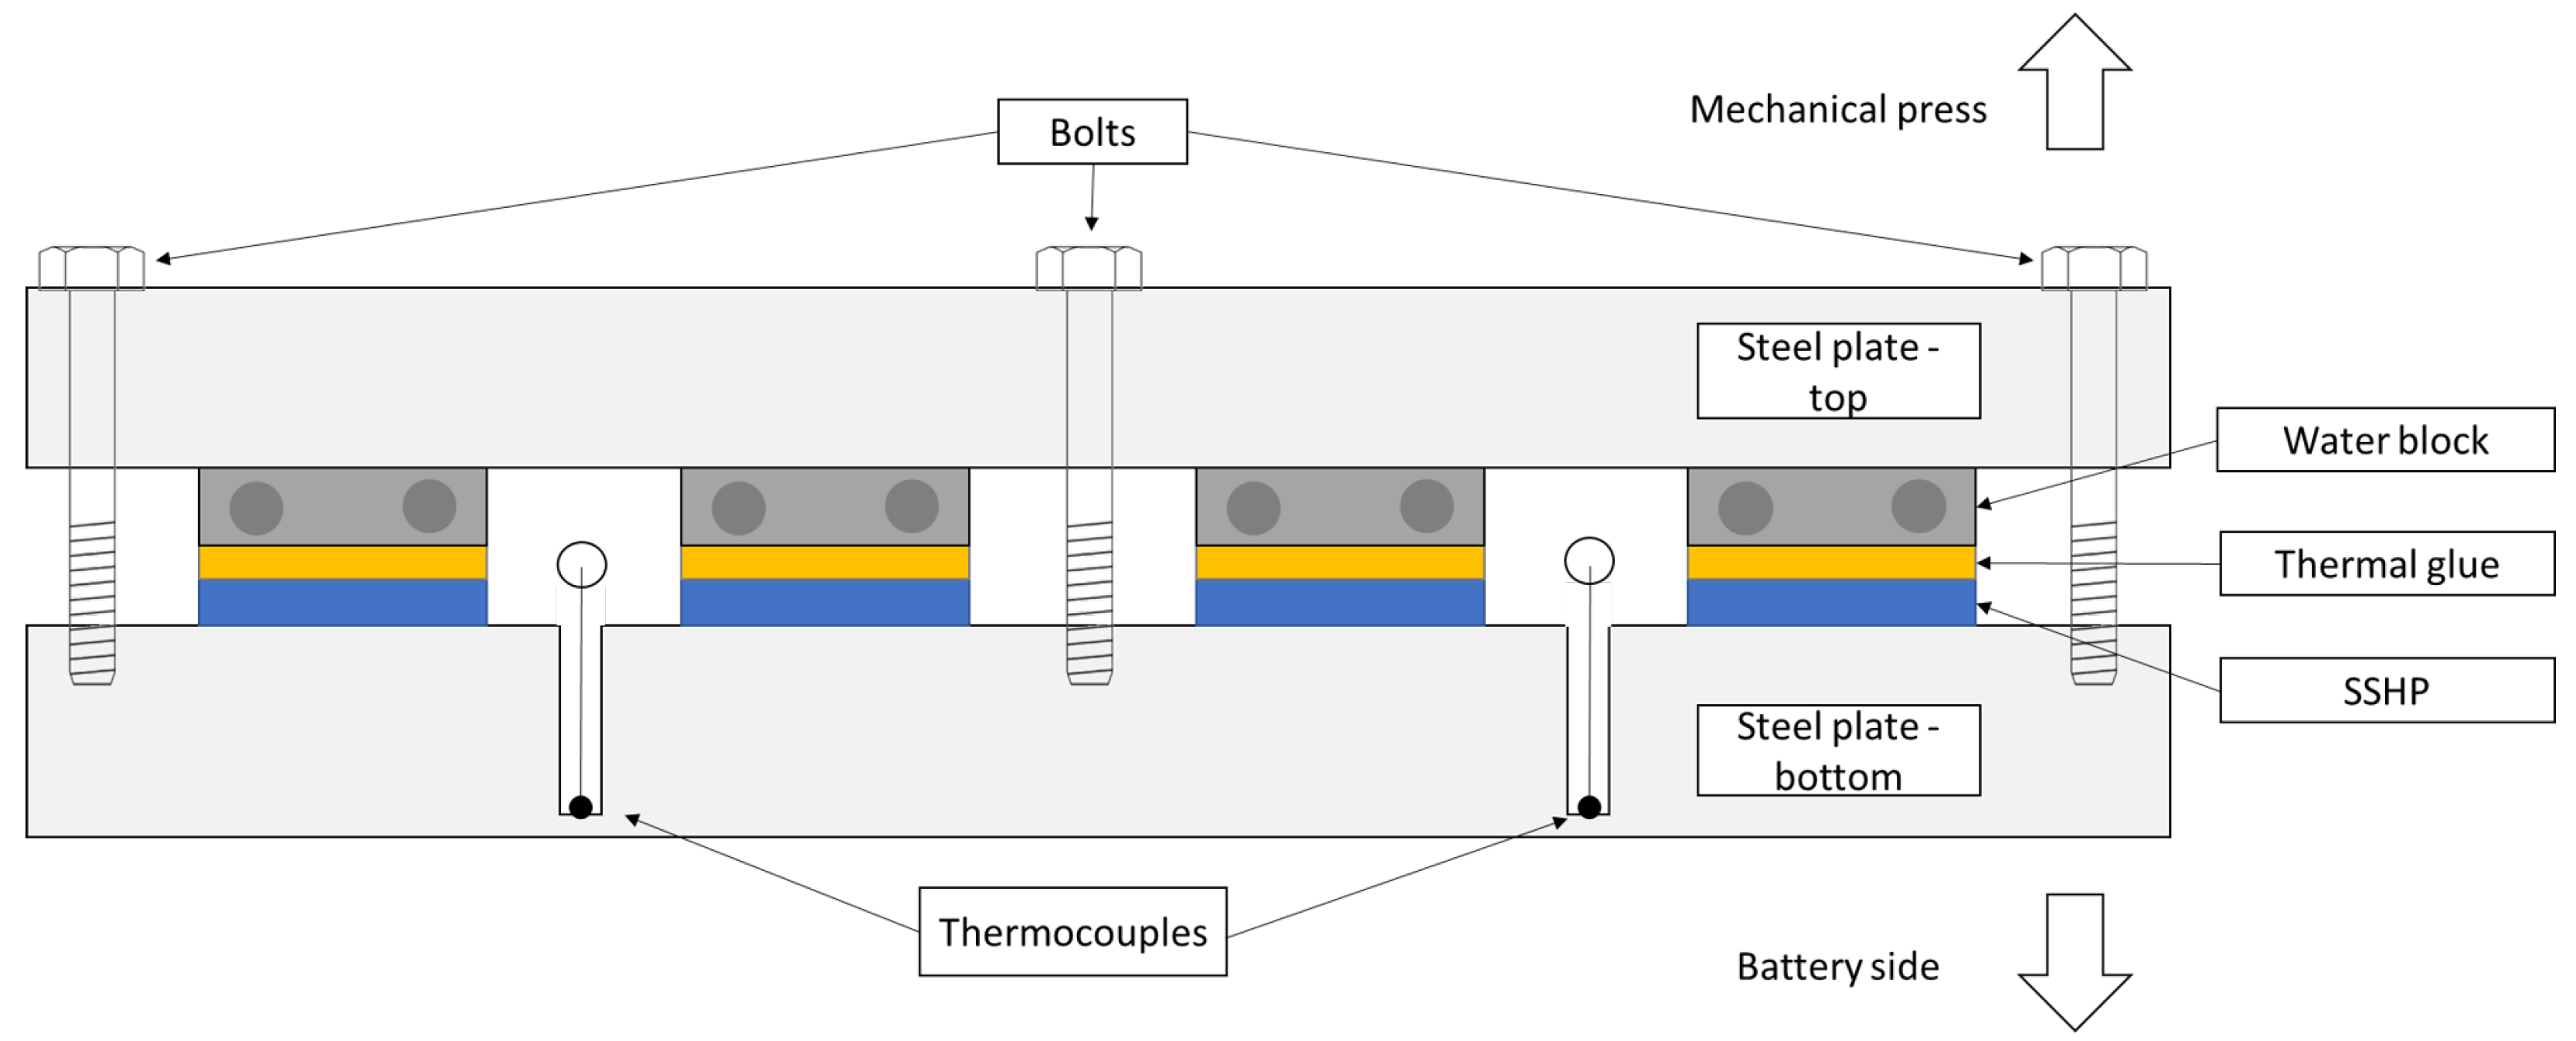
The thermal part consists of two identical units. Each unit contains a matrix of 10 solid state heat pumps (SSHP), 8 type K thermocouples and 5 water blocks. All the components are enclosed between two steel plates, with one plate subjected to thermal control. The plate temperature is measured with thermocouples, which are welded at the base holes with a depth of 18 mm and diameter of 4 mm as shown in
Figure 3. The matrix of SSHP is sandwiched between the steel plate and the water blocks. These in turn, have all their inputs connected to a chiller. A layer of thermal glue is used to enhance the thermal conductivity between the water blocks and the SSHPs. Furthermore, a set of dual programmable switching power supplies is employed to regulate the voltage provided to the SSHPs. The thermal unit is under patenting process [
23].
A control loop using the temperatures as inputs, varies the voltages on the SSHP to achieve the desired target temperature.
The system has been validated with stress tests, reaching temperatures between −15 °C and +80 °C.
The battery cycler consists of a programmable electronic load (EL 9080-340 3U) and a programmable power supply (EA-PSI 3000 3U) both manufactured by ’EA ELEKTRO-AUTOMATIK GMBH & CO. KG’, Viersen, Germany. The system operates in voltage or current control mode and can handle up to 340 A in both directions and up to 80 V. In order to compensate for the voltage drop on the power cables, the LIB voltage is measured directly at its tabs through sensing cables. This signal is provided to the sensing input of the power supply and electronic load. In order to have the possibility to acquire the electrical current data with a sampling frequency of up to 10kHz and synchronised with the rest of the signals, an external current sensor is used (manufacturer: CAEN ELS s.r.l., Viareggio, Italy; Model: CT-1000).
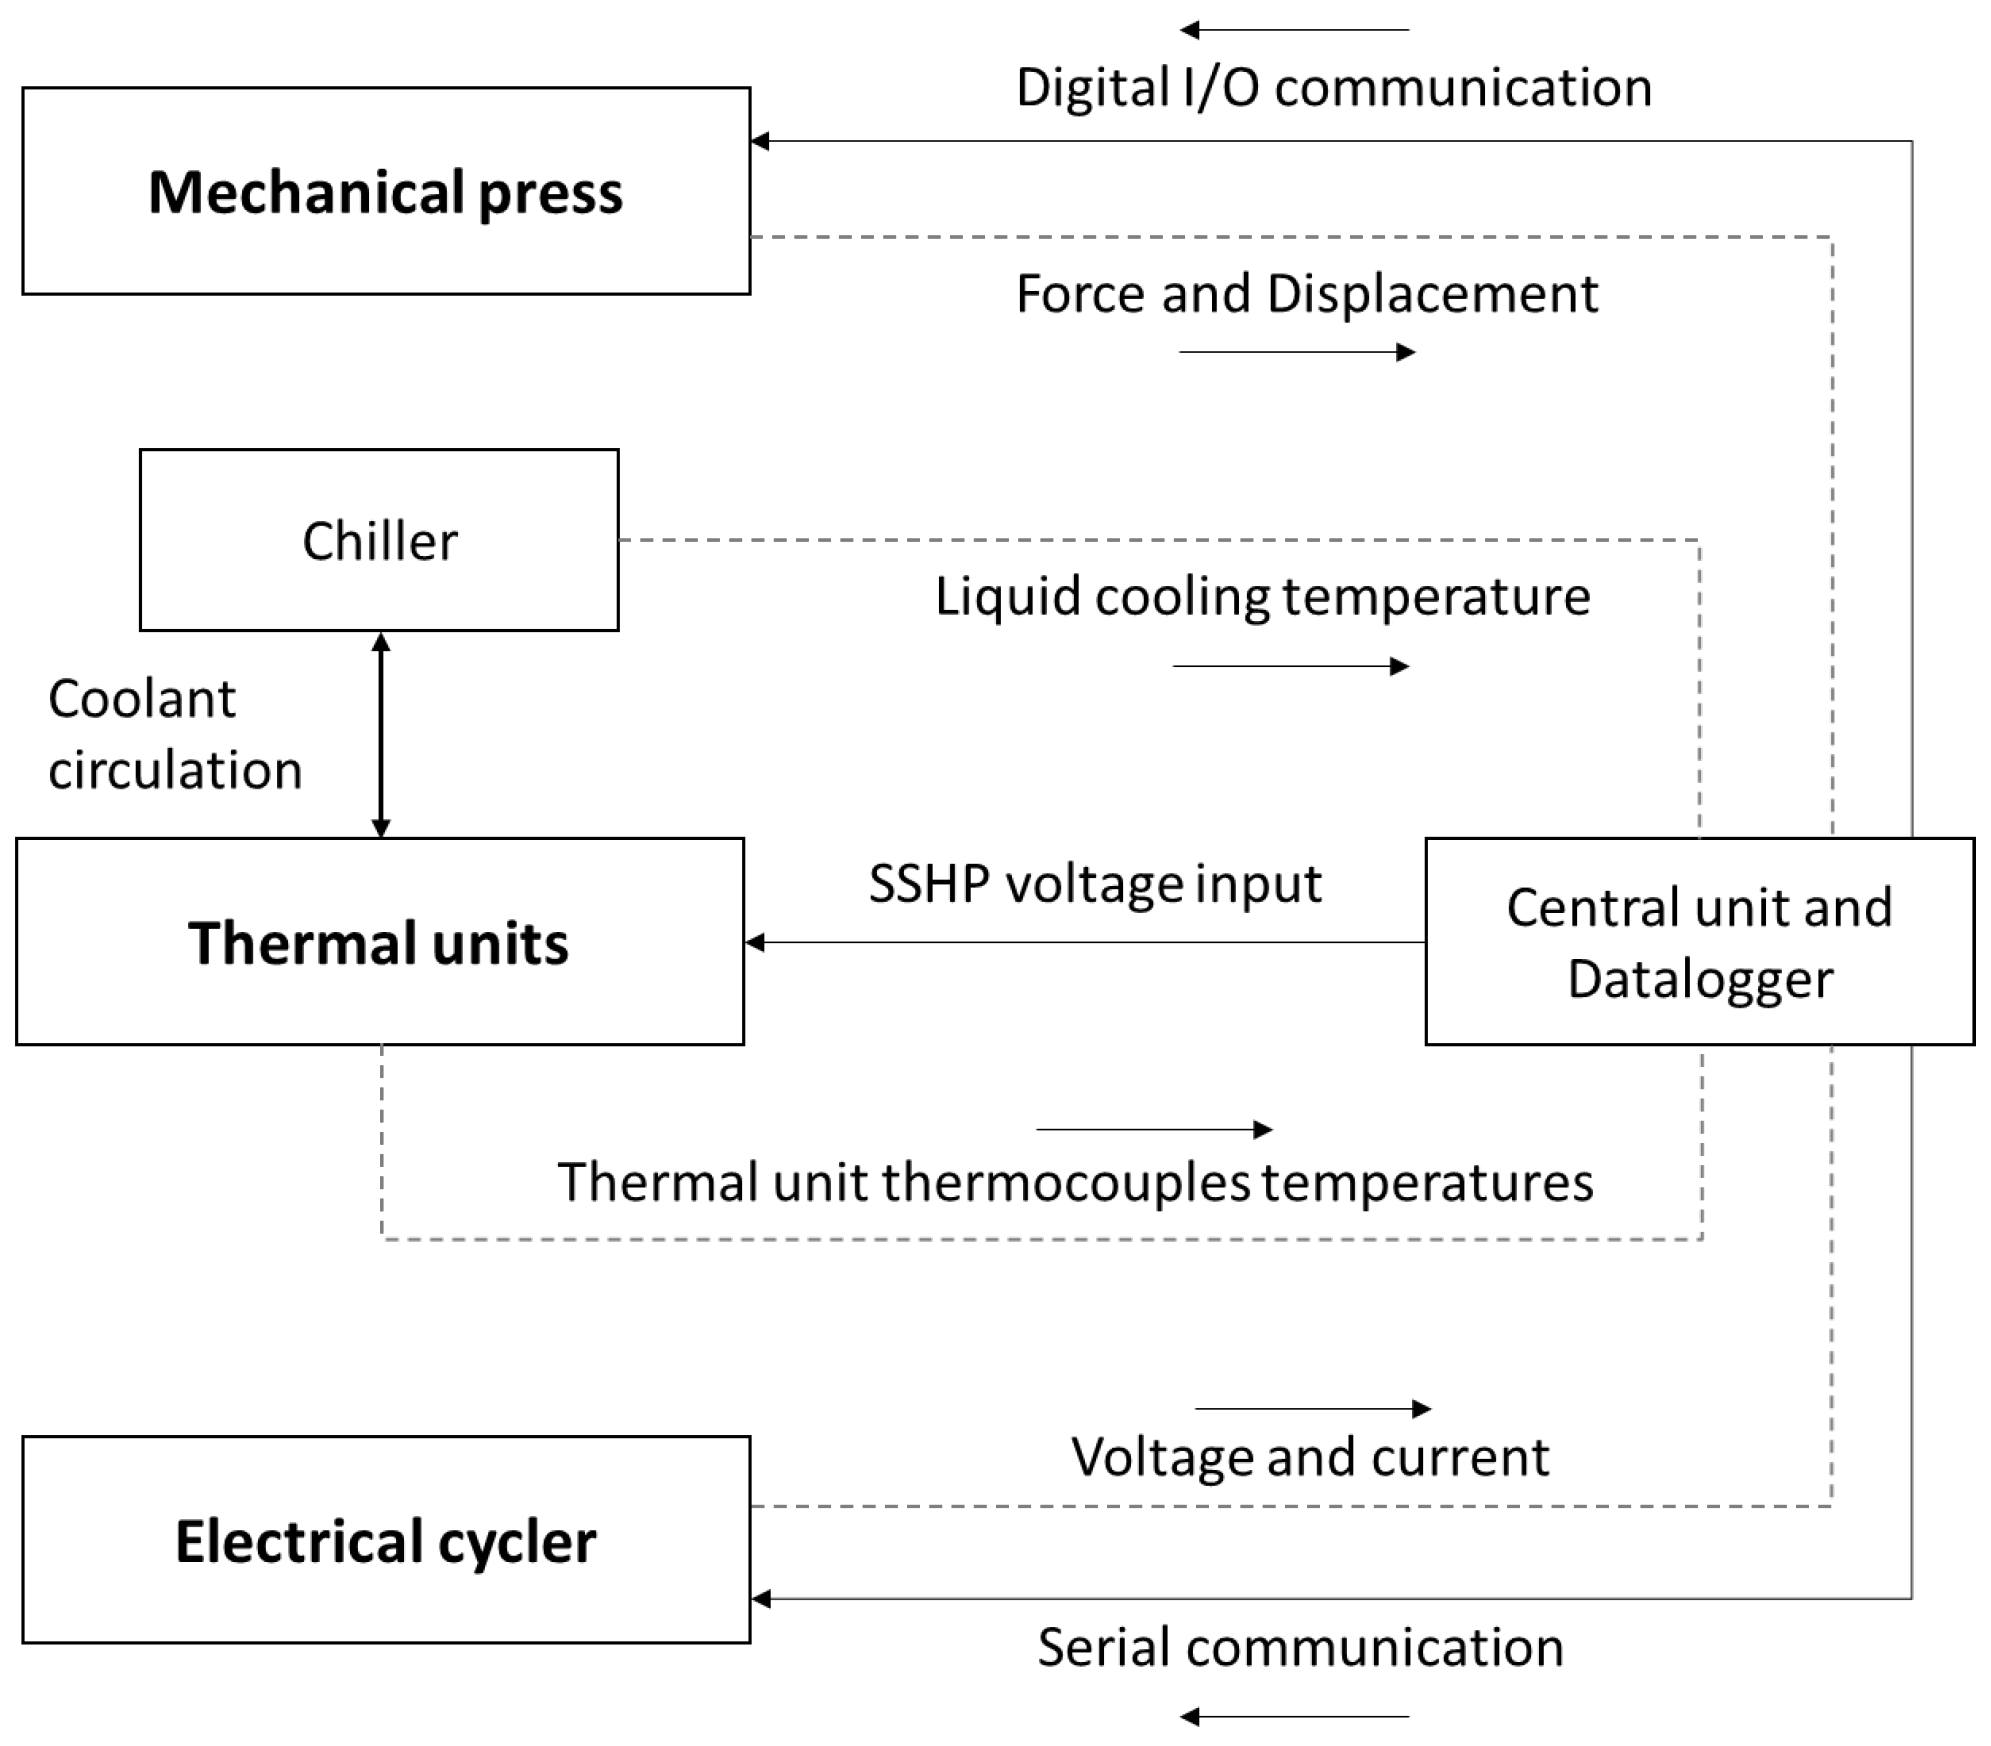
The three described sub-systems communicate with a central unit equipped with a data acquisition system. The data-logger is an expandable chassis motherboard with 8 slots, manufactured by “National Instruments Corp.”, Austin, TX, USA, (model: cDAQ-NI 9178). Depending on the required measurement or data generation, each slot can be filled with various module types. The system utilises an analog voltage input (NI 9202) and a thermocouple input module (NI 9213). The control signals to regulate the SSHP voltages are generated by the analog current output module (NI 9266). Additionally, the creep testing machine communicates with the central unit via the digital I/O module (NI 9403). A schematic of the communication principle between each component and the control unit is shown in
Figure 4.
The concept of communication between parts described above makes this system suitable for a high level of automation. The user can provide instructions for executing programs with distinct temperatures, pressure, and electrical cycles using proprietary software. The software integrates safety features, and can autonomously operate safety procedures in case one of the parameters of the LIB or of the testing system should get out of the safe operating range.
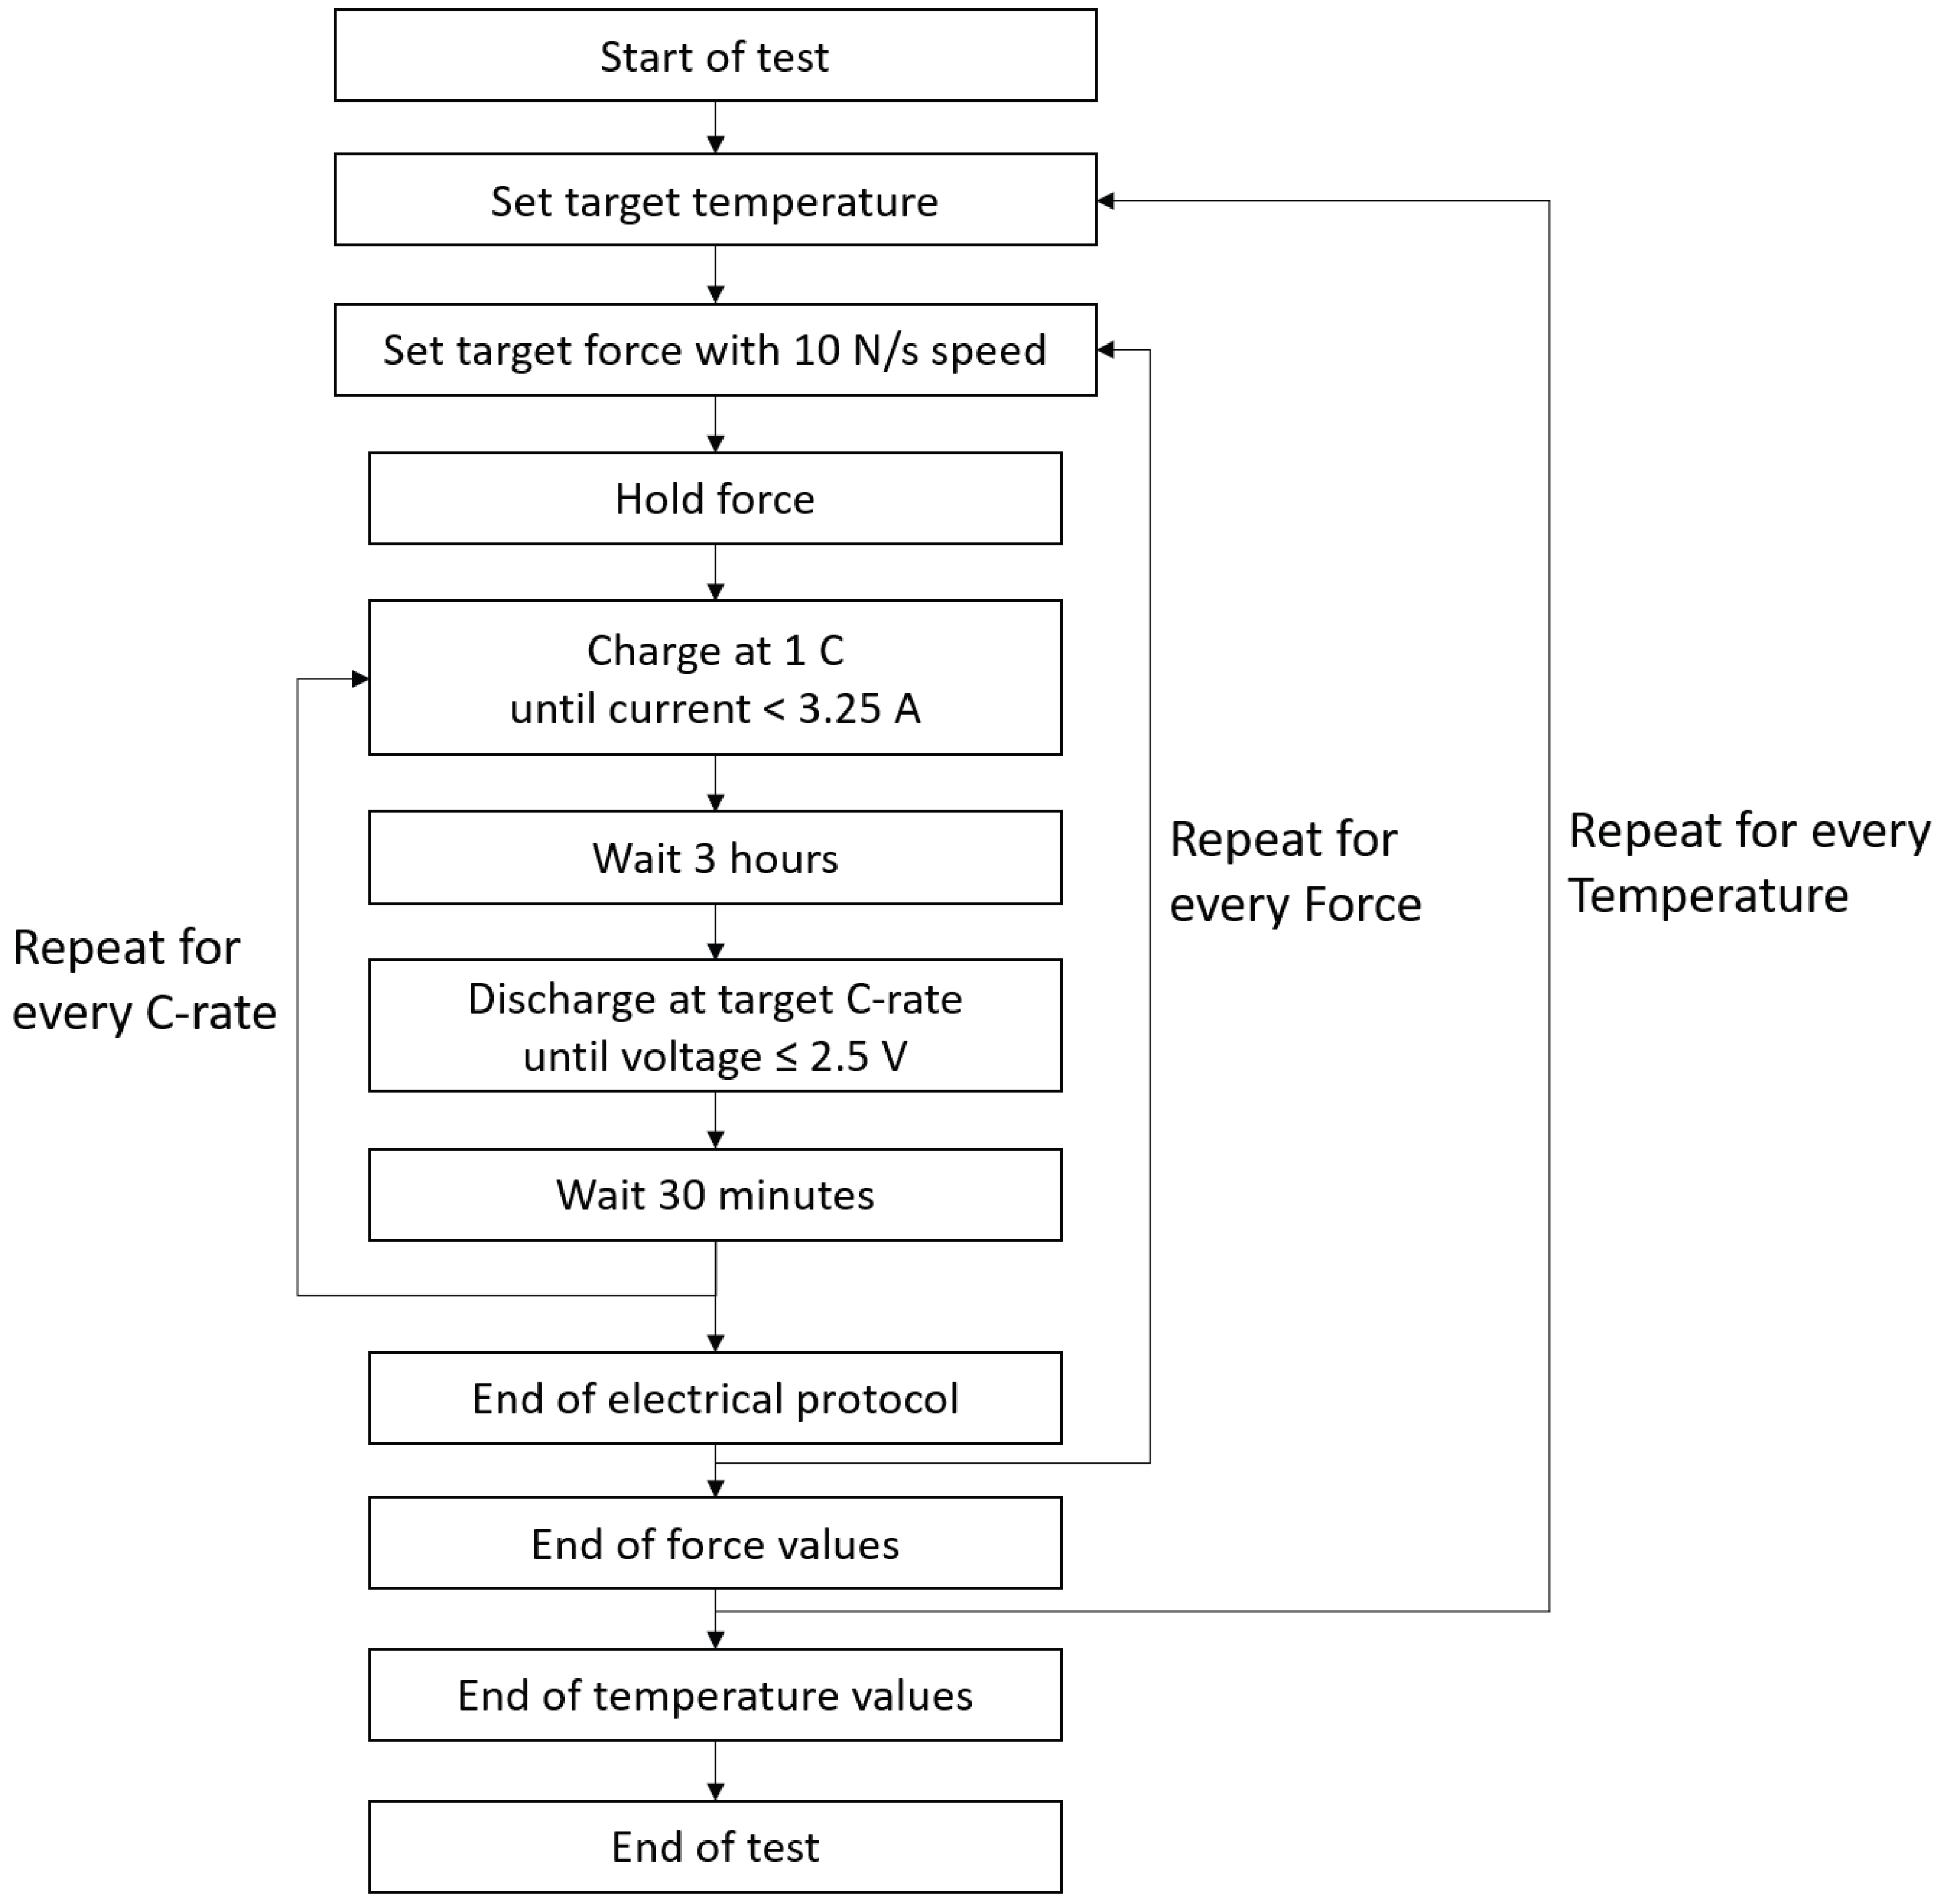
2.3. Electrical Protocol
In this work, the 100% SOC (state of charge) is defined by the following protocol: an initial charging in current-control-mode at 1 C (65 A) is followed by a charging in voltage-control-mode after reaching the maximum voltage of 4.2 V. The charging is then interrupted when the charging current falls below C/20 (3.25 A).
For performing a discharge test, the LIB is first charged to 100% SOC and then left at the target pressure and temperature for three hours. The LIB is then discharged at the target C-rate until its voltage falls below 2.5 V. After 30 min of relaxation time, the LIB is again charged to 100% SOC and the whole process is then repeated.
2.4. Testing Conditions
The performances of the battery are evaluated by measuring various discharging curves under different ambient and electrical conditions. The study investigates three temperatures, 5 °C, 25 °C, and 45 °C, four compression forces, 7280 N (0.2 MPa), 18.2 kN (0.5 MPa), 29.12 kN (0.8 MPa) and 43.68 kN (1.2 MPa), as well as three electric discharge currents rates: 0.5 C (32.5 A), 1.5 C (97.5) and 3 C (195 A). These values were selected based on the pressures and temperatures commonly studied in the literature [
2,
19,
20]. The load cases were executed sequentially, following the schematic protocol described in
Figure 5.
Throughout the test, the LIB is subjected to 36 electrical cycles. It is assumed that this number of cycles does not cause significant ageing of the LIB.
3. Results
The discharge curves are compared under different temperature, pressure, and discharge-rate conditions. The discharged capacity serves as a performance measure for the specified conditions: a greater charge extraction indicates superior performance.
In order to navigate the results more effectively across various conditions, the curves have been grouped by constant temperature and constant pressure conditions. The first group highlights the dependency of the performance from the external pressure and discharging C-rate. The latter group, instead, highlights the variations of the performance resulting from changes in temperature and discharge C-rate.
3.1. Grouped by Temperature
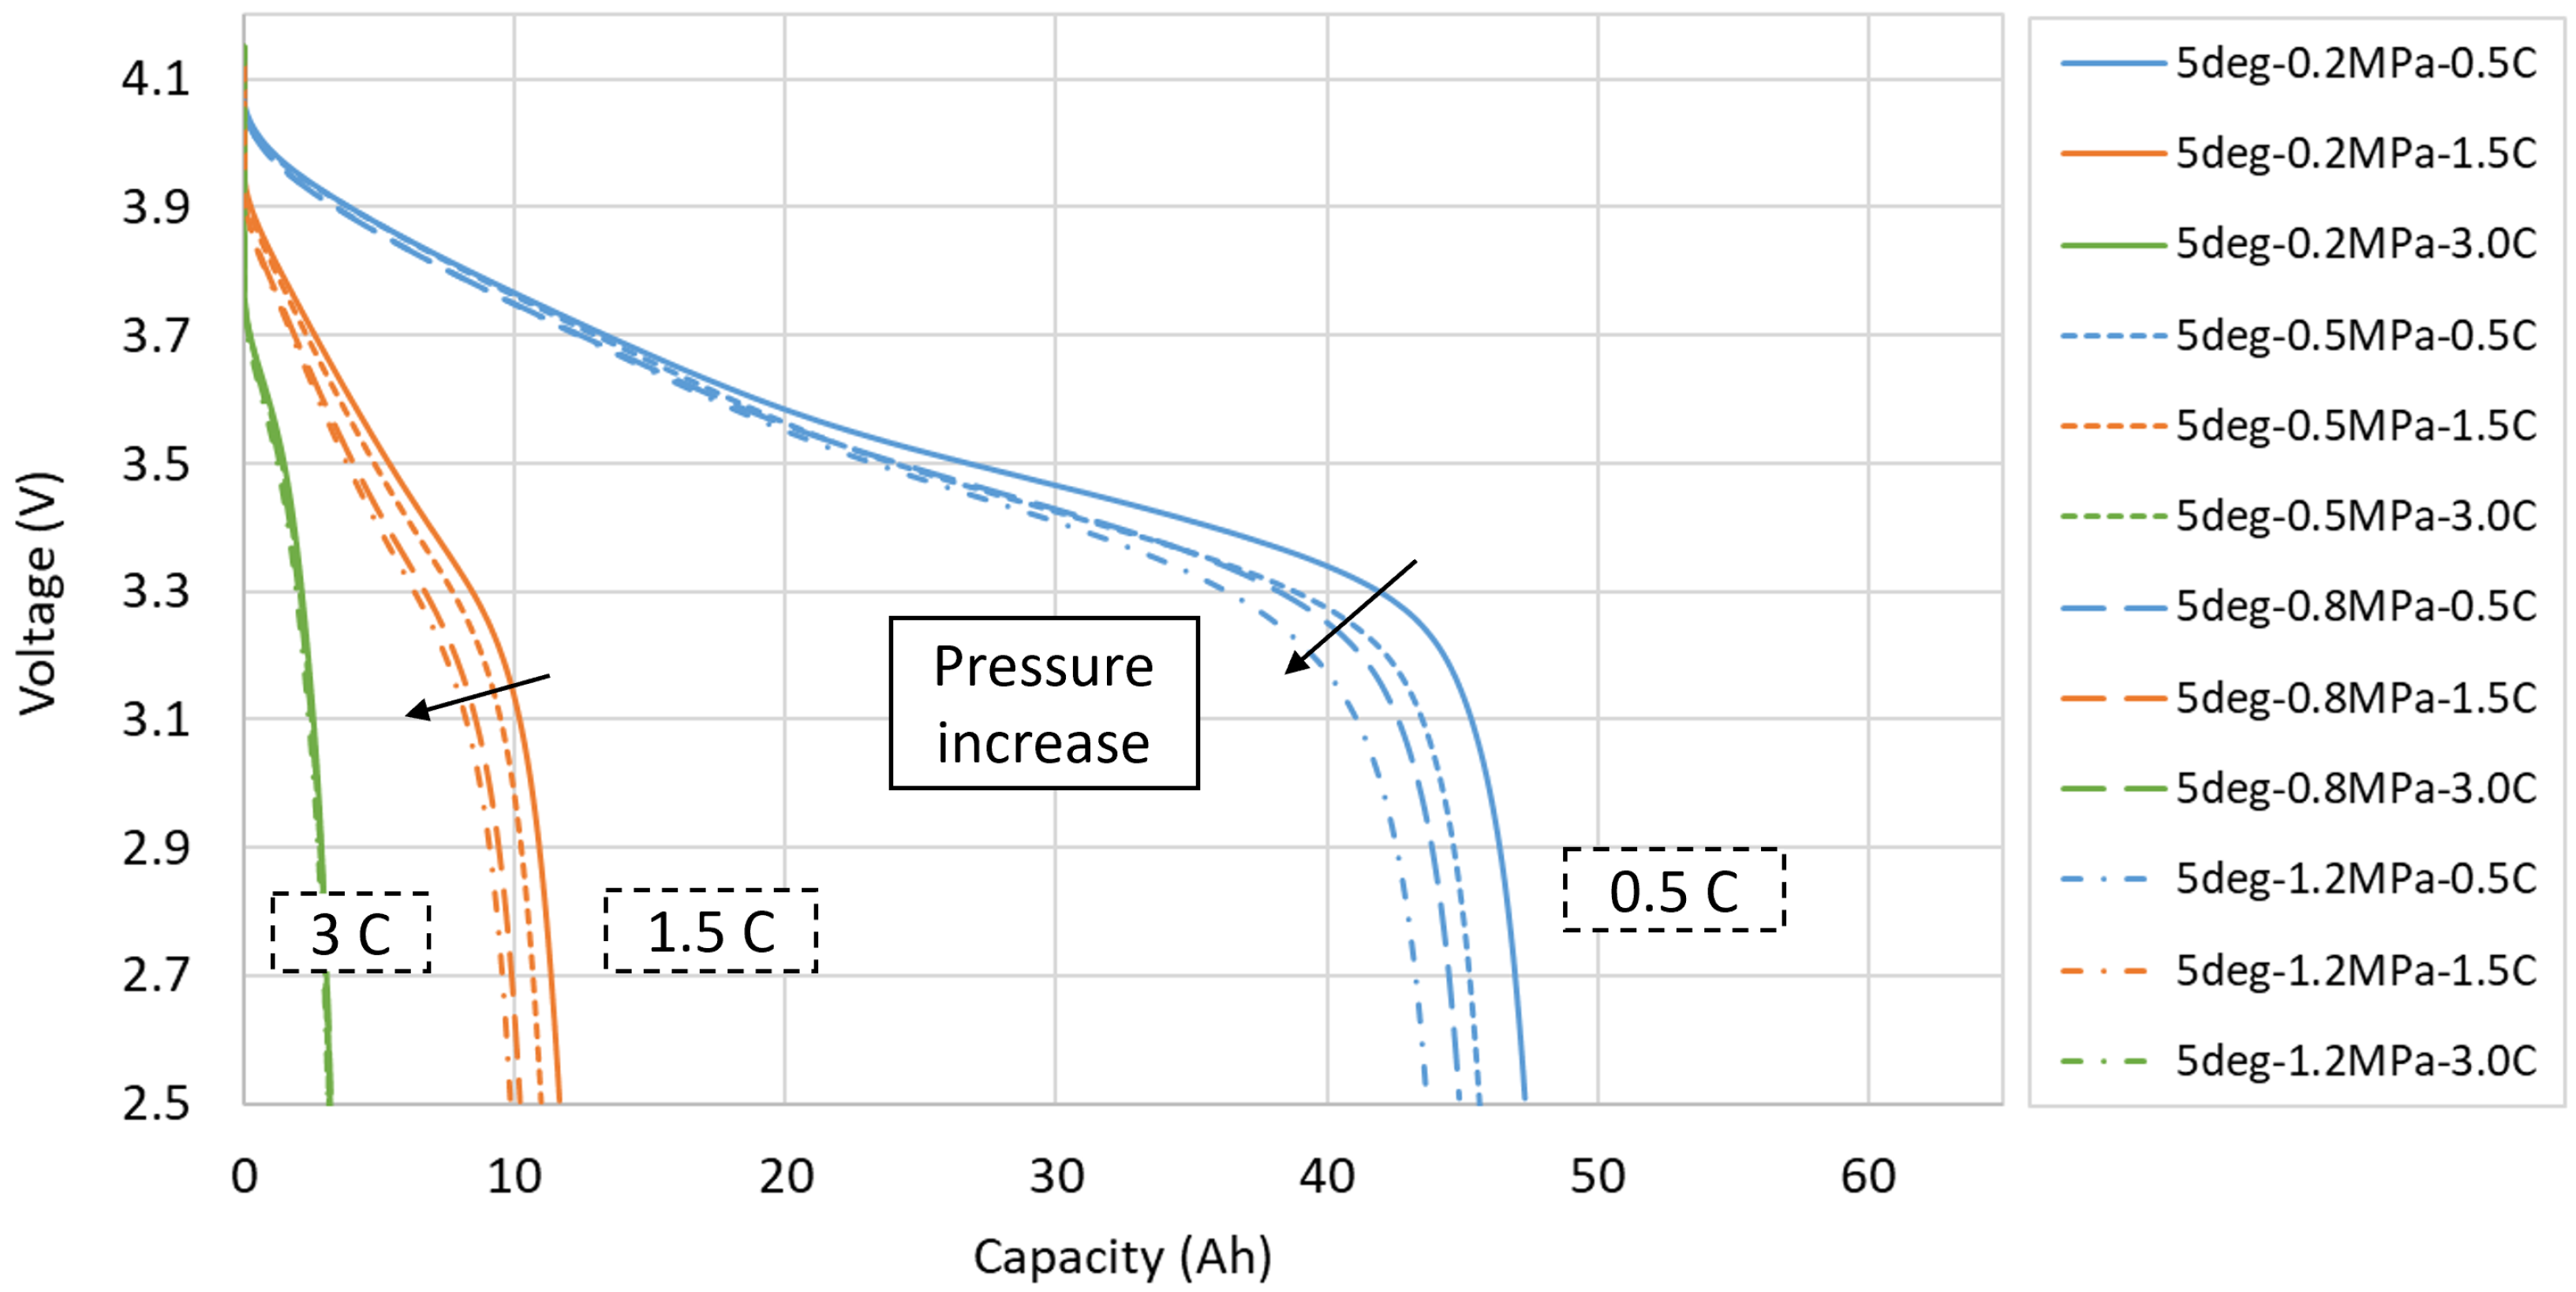
A general trend can be identified from the results: the extracted energy decreases with the increase in the external pressure. The impact of the pressure varies based on the temperature and applied C-rate. Conversely, an increase in temperature results in to an increase in the discharged capacity. As shown in
Figure 6, at a temperature of 5 °C the impact of pressure is more relevant at lower C-rate. As the C-rate increases, the impact of pressure decreases, while at 3 C, the difference between the curves is barely visible from the graph.
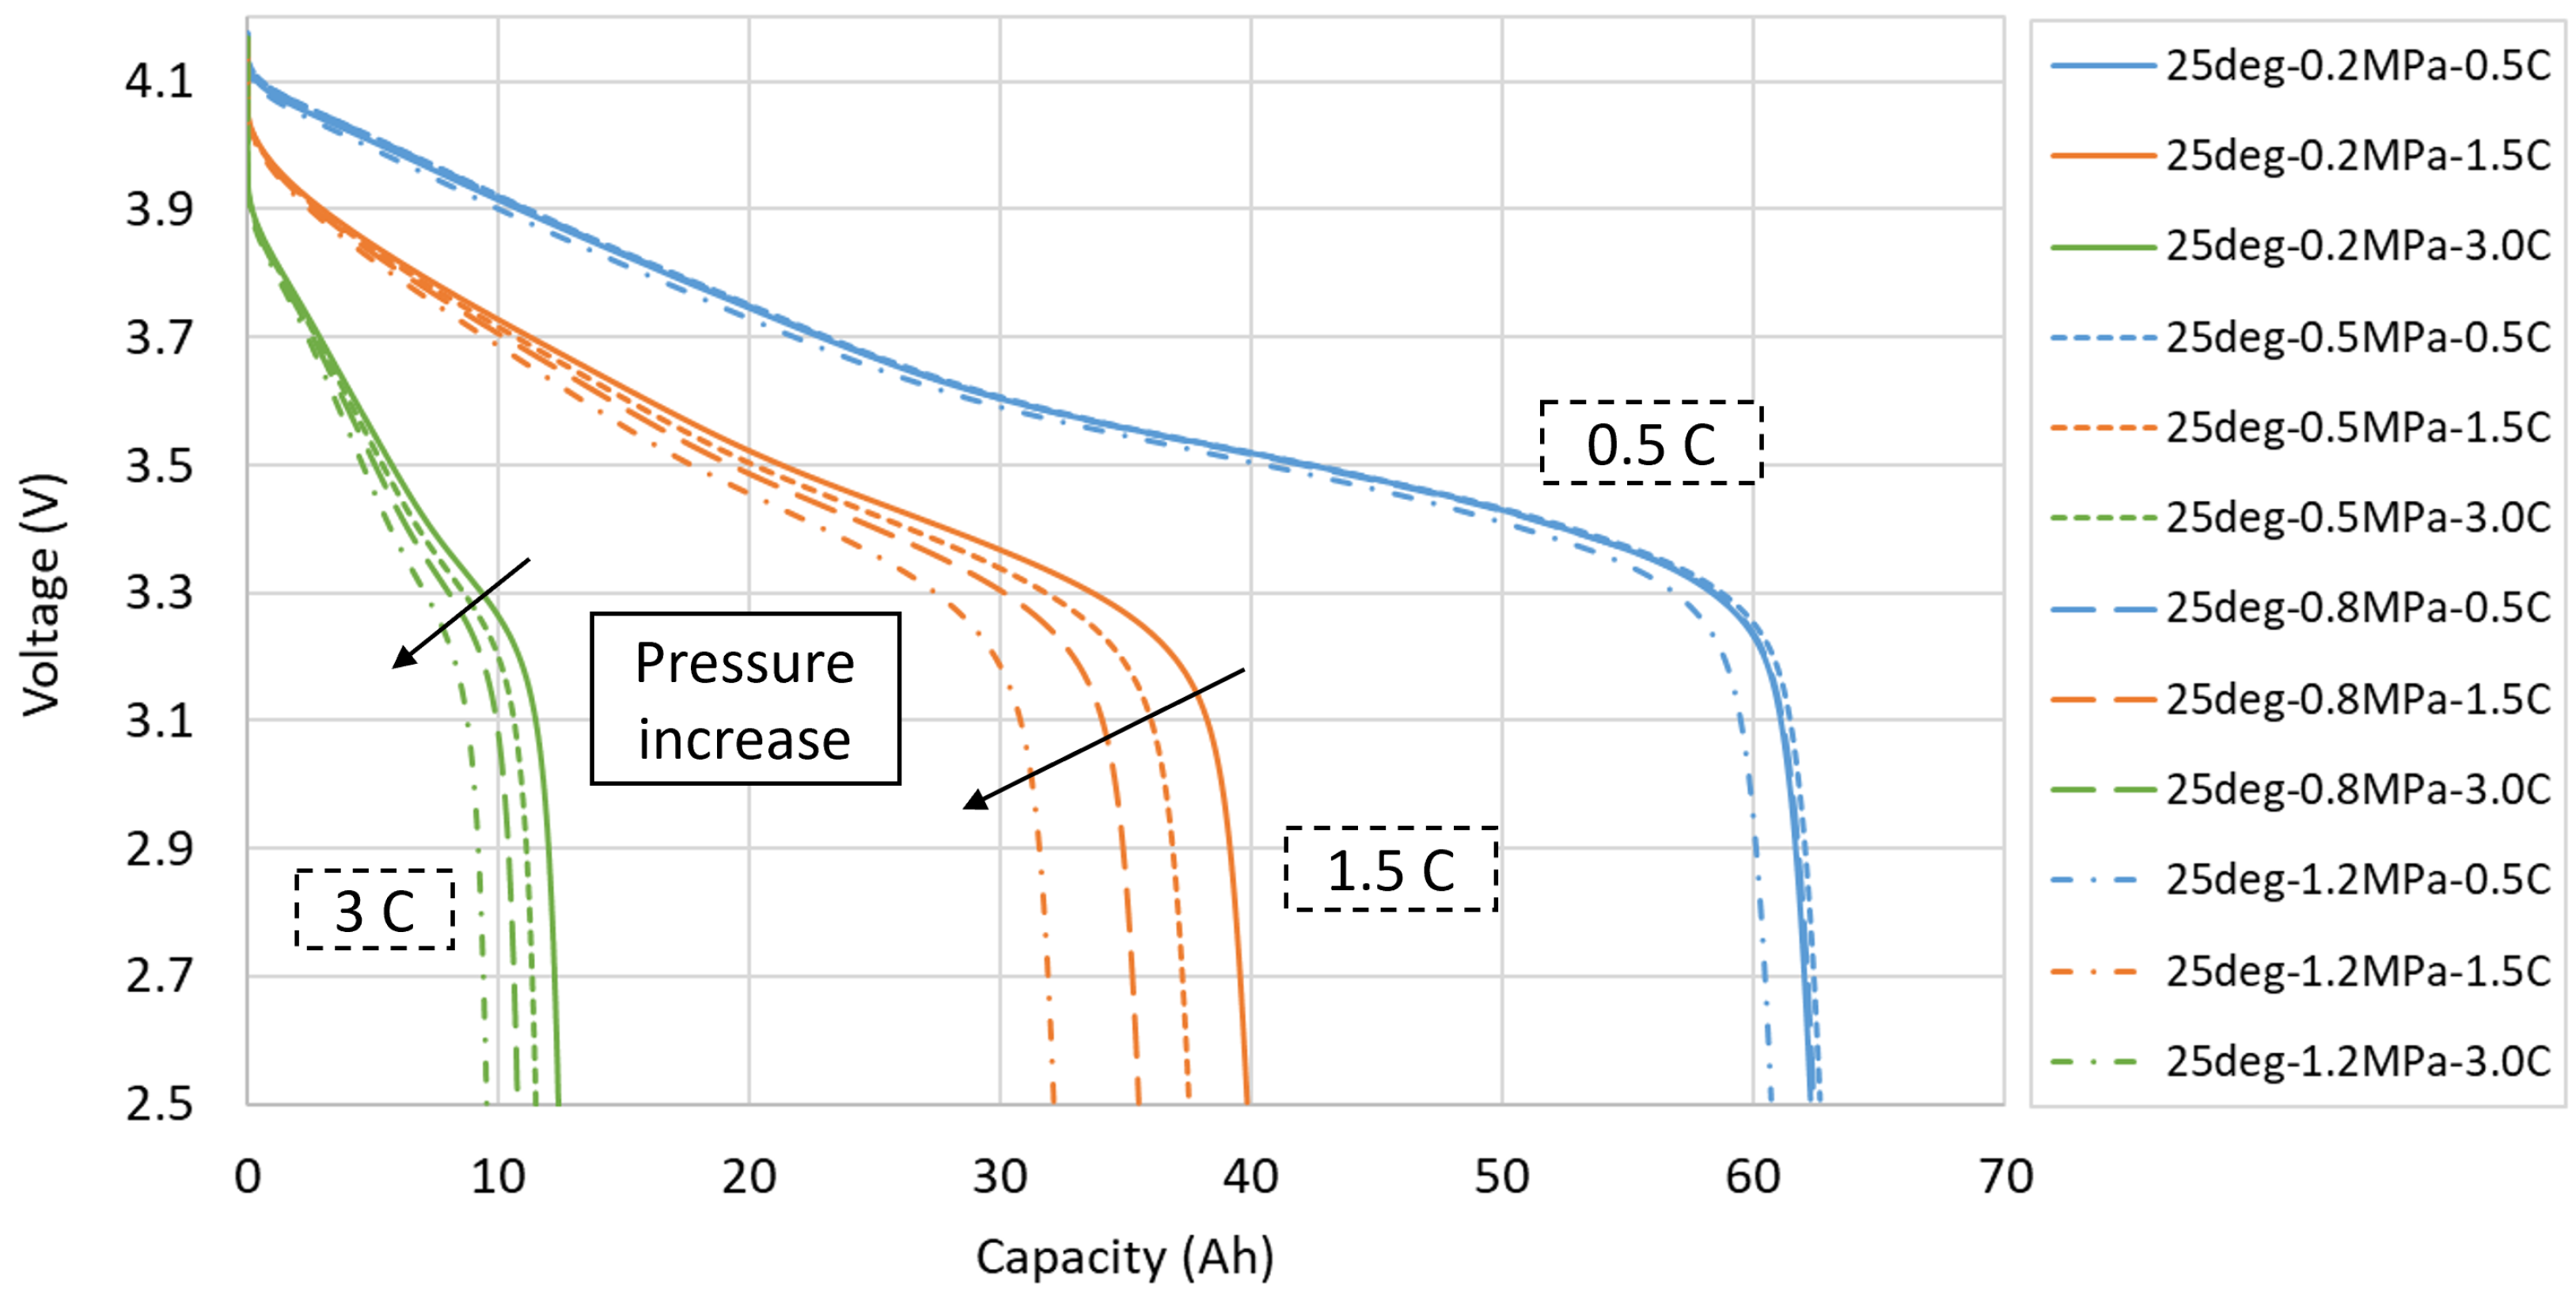
At 25 °C, with respect to the load case at 5 °C, the effect of pressure is more pronounced at 1.5 C-rate and is clearly observable at 3 C-rate. As can be seen in
Figure 7, at this temperature the pressure does not significantly affect the performance at 0.5 C-rate.
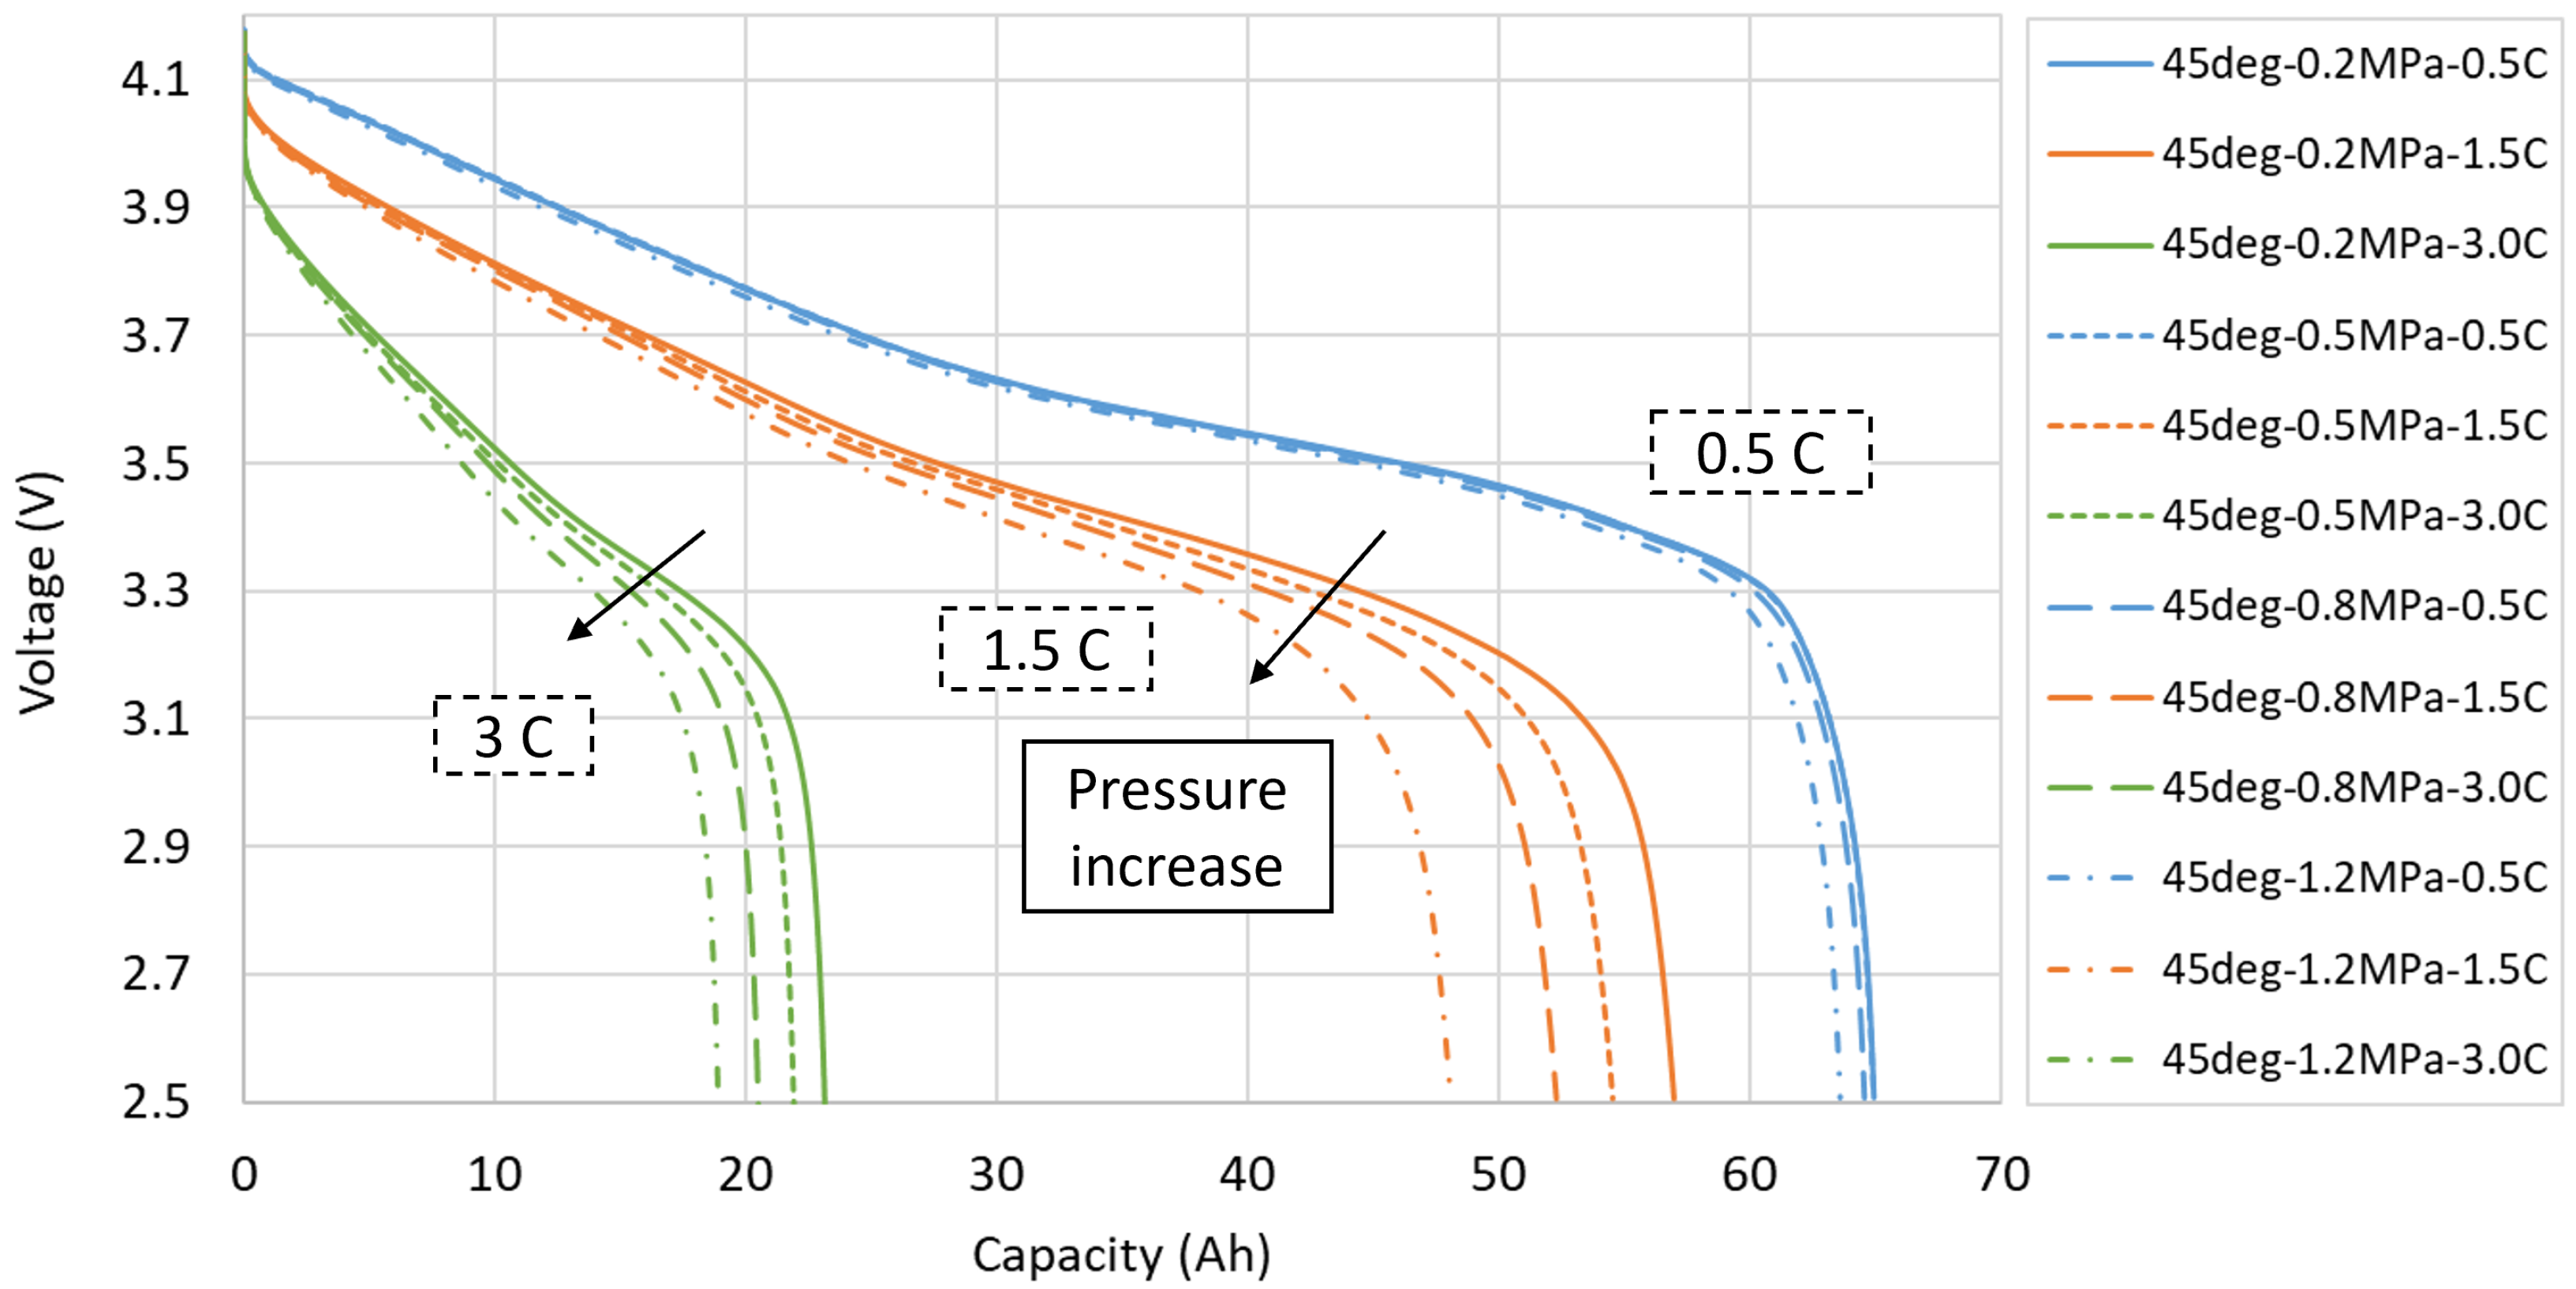
At 45 °C, the trend seen at 25 °C is confirmed: the effect of pressure at 0.5 C-rate is not significant, while the effect of pressure at 1.5 and 3 C-rate is remarkable, as can be seen in
Figure 8.
The observed performance at different environmental conditions shows the expected negative correlation between discharge rate and available energy. In particular, it is possible to identify a common trend for all load cases: decreasing pressure and increasing temperature lead to better performance. However, the effect of pressure on performance varies non-linearly with discharge rate and temperature. This non-linearity is clearly visible for the load case at 25 °C: the effect on the performance at 1.5 C-rate is more pronounced than for the cases at 0.5 and 3 C-rate.
3.2. Grouped by Pressure
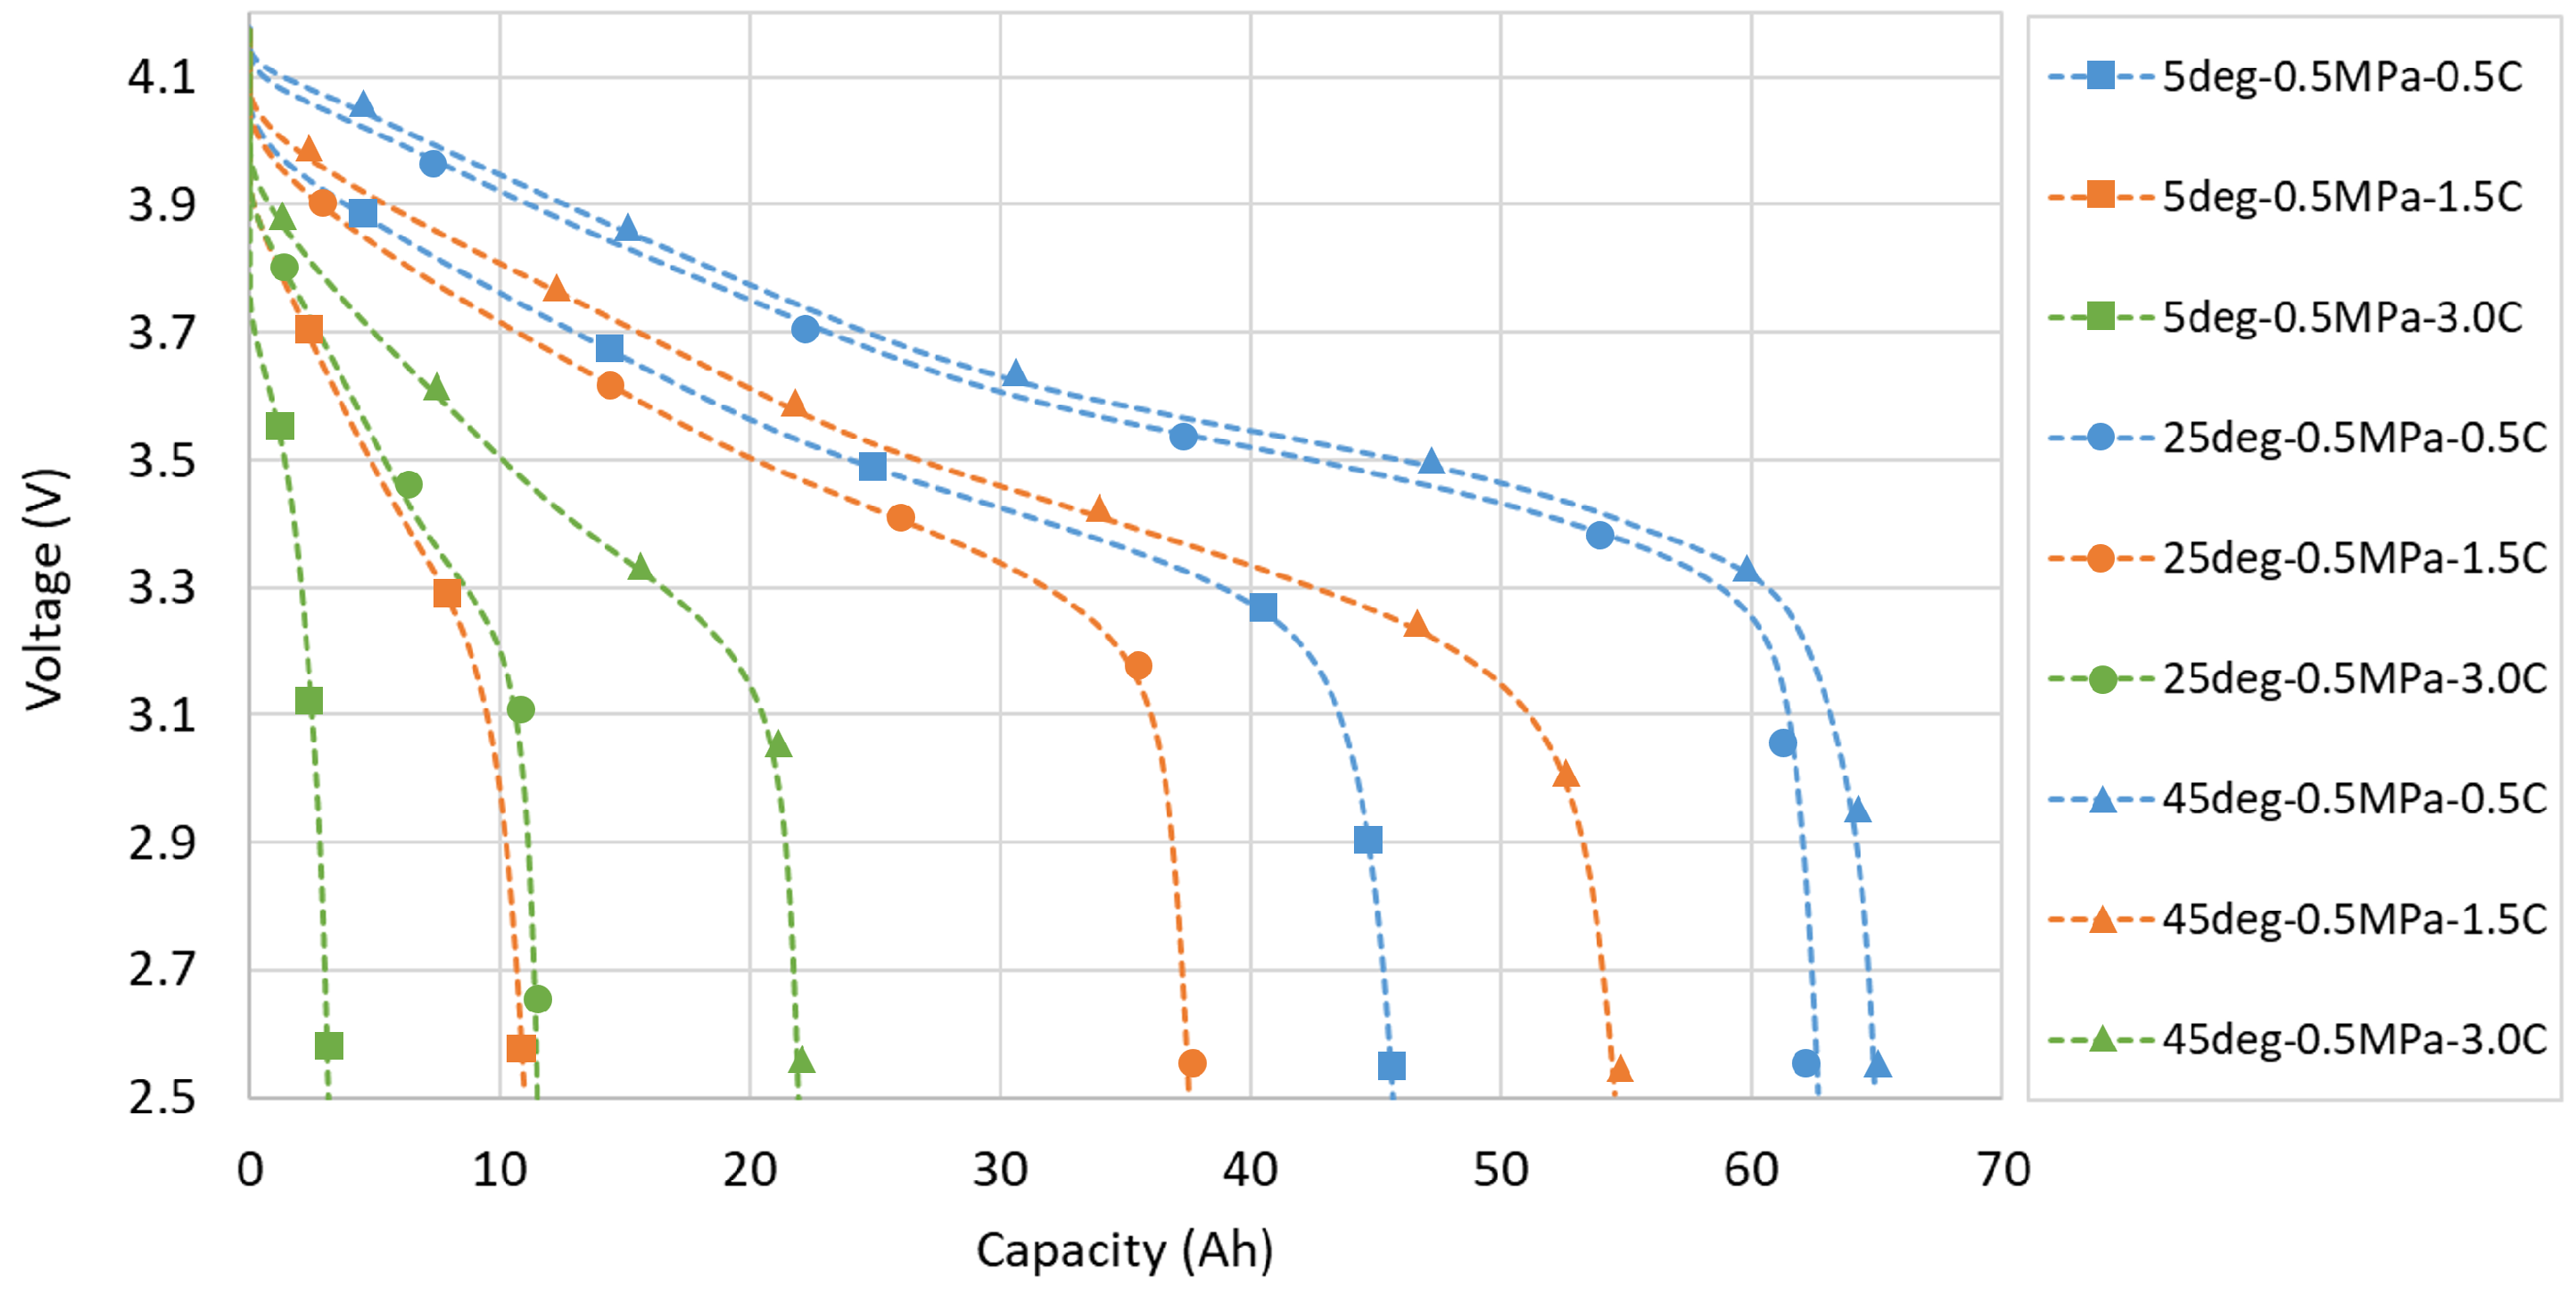
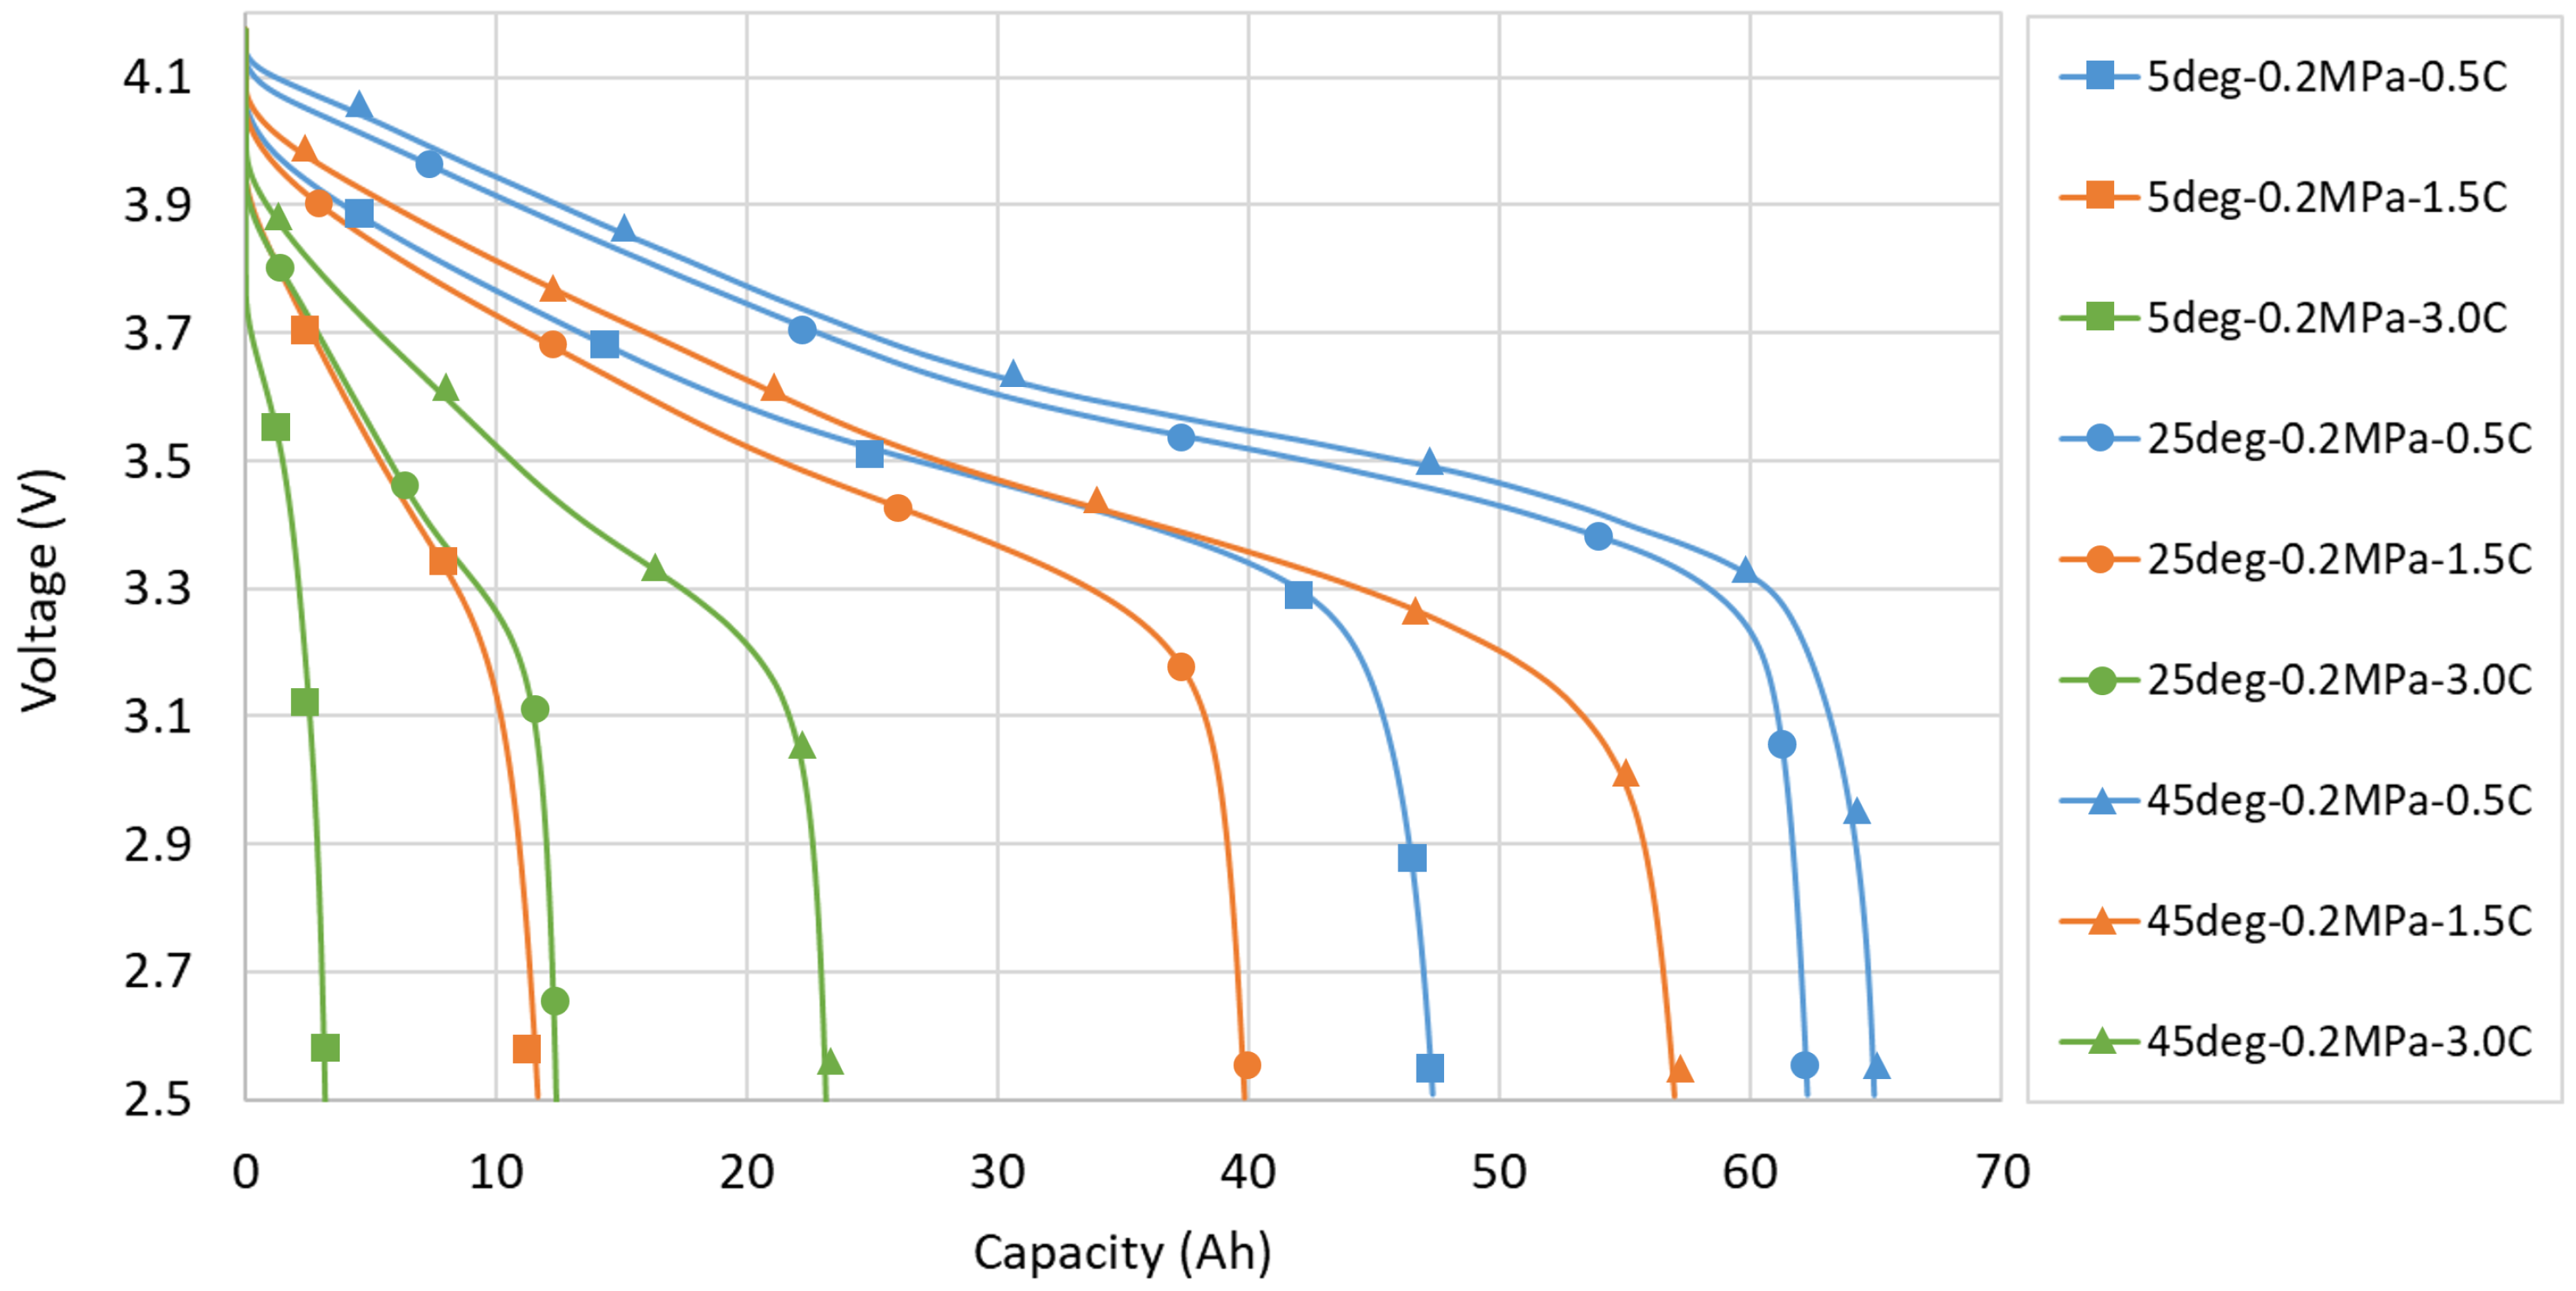
In this section the same results are regrouped by showing the curves at the same pressure. This allows to highlight the effect of temperature and C-rate on LIB performance. In the following plots, the marks on the curves indicate the temperature, while the colour indicates the C-rate. As shown in
Figure 9, considering the C-rate of 0.5 C, a temperature increase from 25 °C to 45 °C would not bring a significant increase in performance. However, for the 1.5 C rate load case, the same temperature increase would give a remarkable benefit. A similar evaluation can be made for the 5 °C and 3 C-rate load cases. Since the temperature of the LIB affects its aging rate, this information can be used to design the thermal management and mechanical precompression of a battery pack to consciously evaluate the trade-off between performance and aging rate.
At 0.5 MPa, the proportion between discharged capacity follows the same trend as 0.2 MPa. The highest capacity is still reached by the load case at 0.5 C-rate and 45 °C, the amount of discharged capacity is still following the order of the load cases as for the 0.2 MPa pressure. However, with except of the load cases at 0.5 C-rate, 25 °C and 45 °C, the absolute values of discharge capacity follow a general decreasing trend as can be seen from the comparison of
Figure 9 and
Figure 10.
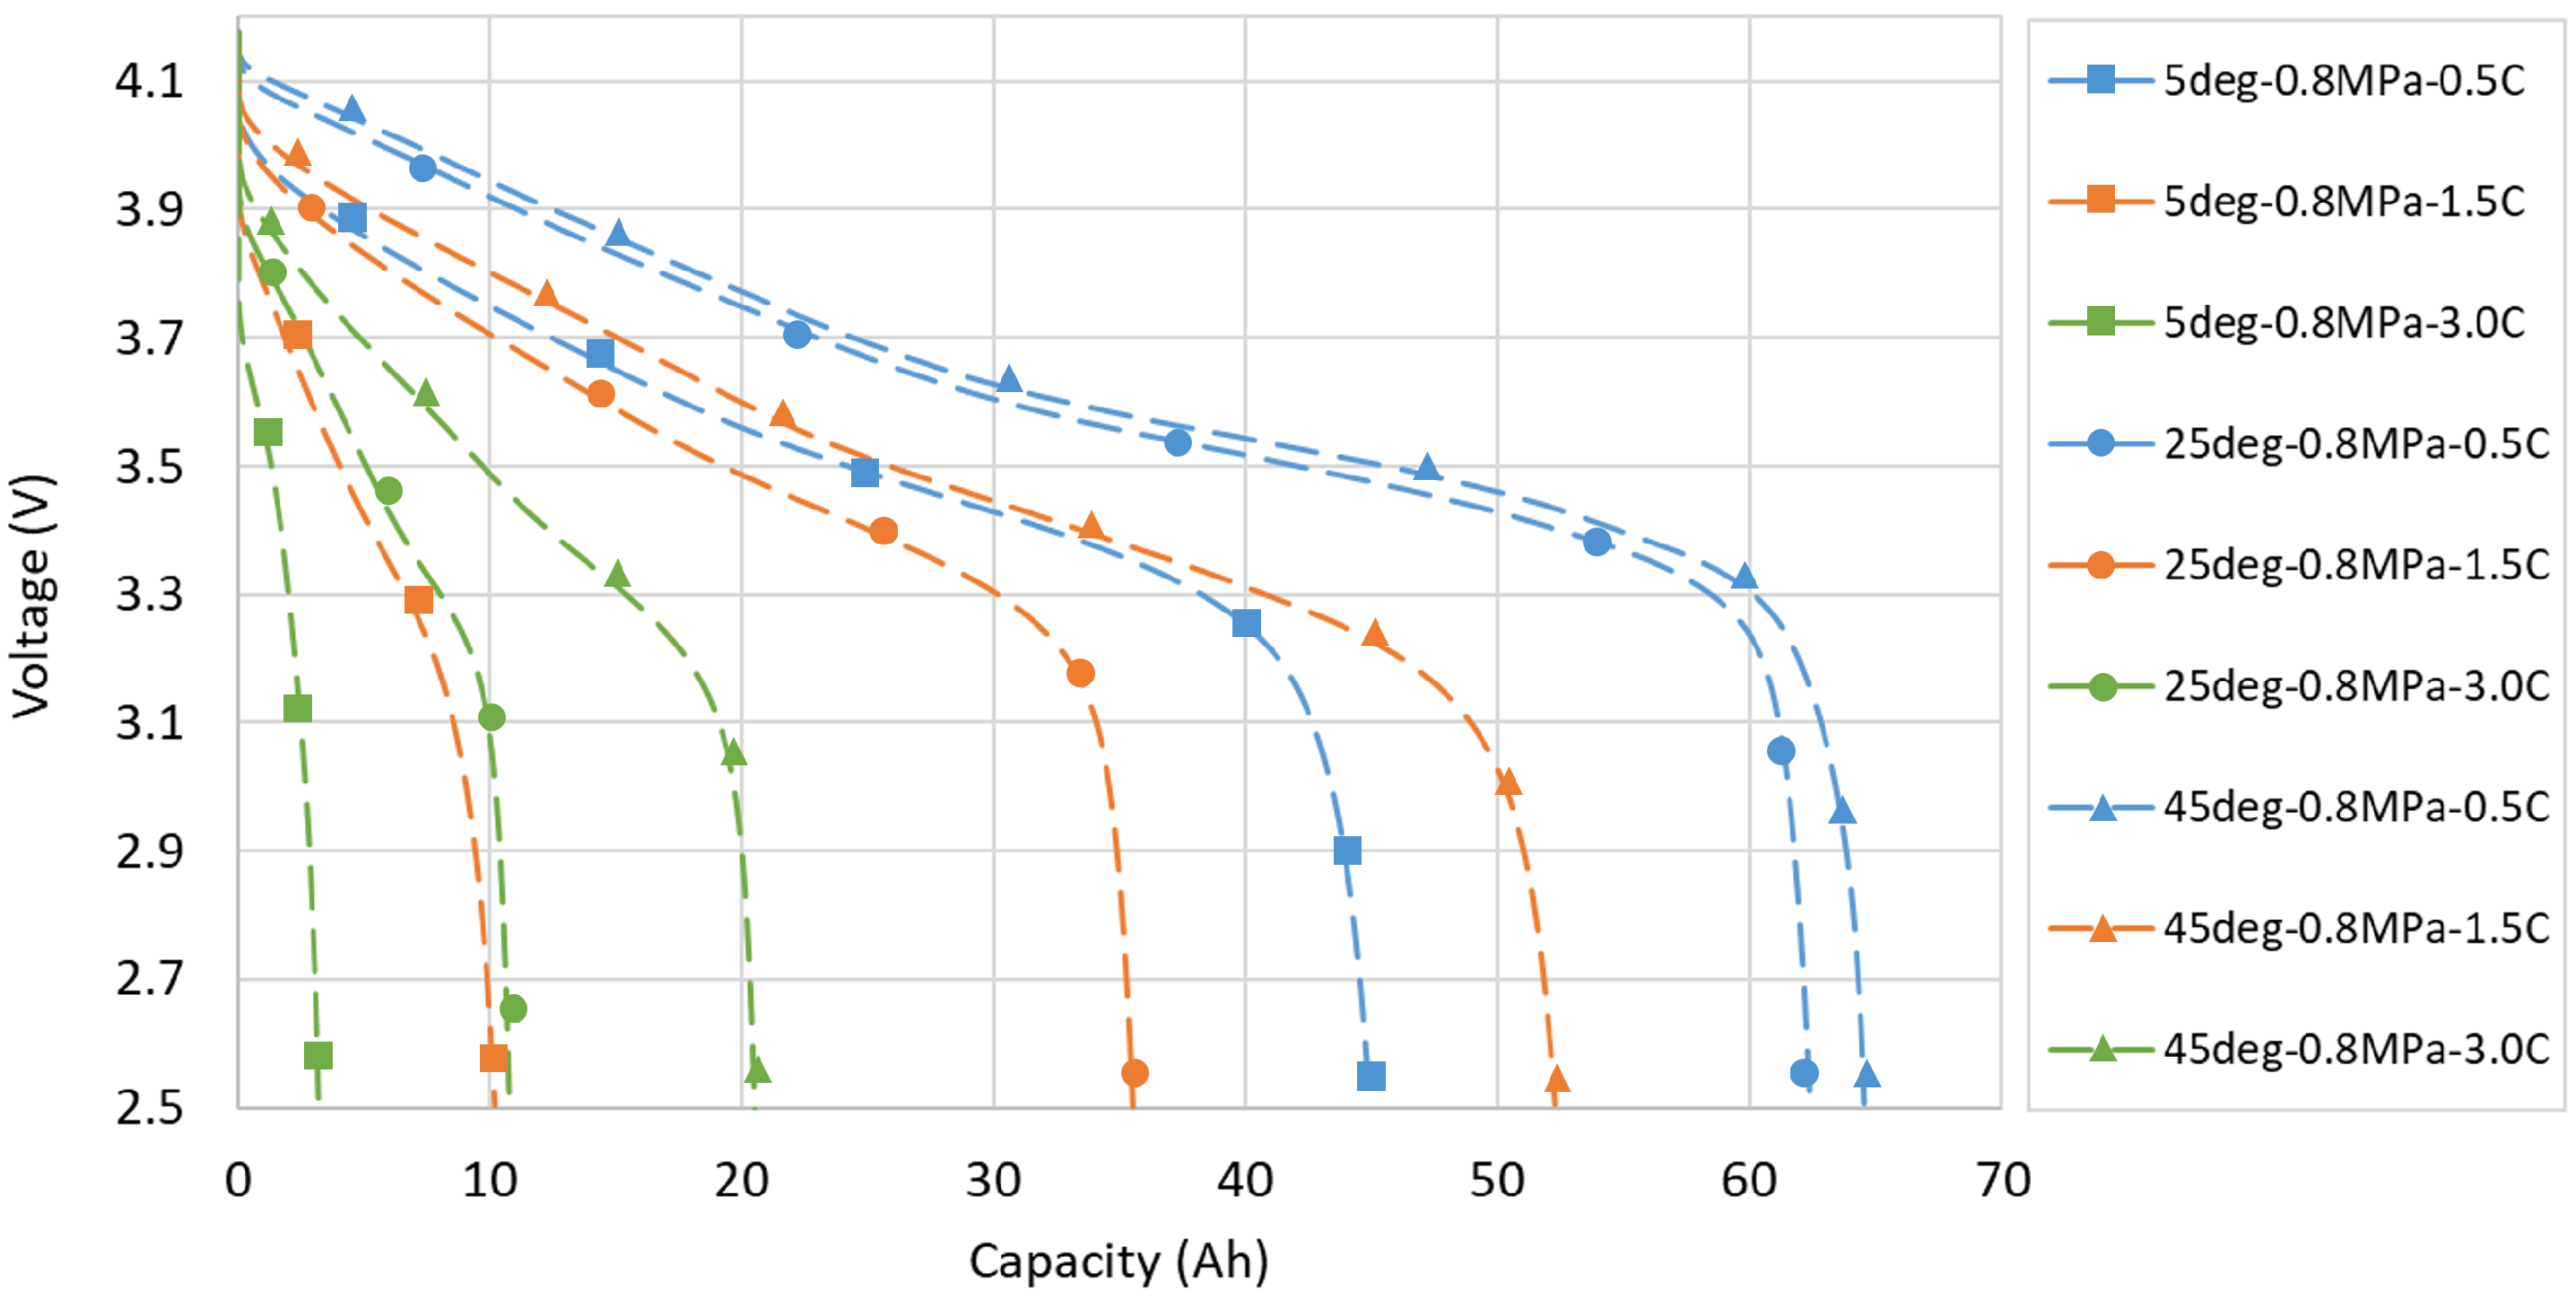
For the load cases at 0.8 MPa, the amount of discharged capacity follows the same order of load cases as for the previous pressure levels as shown in
Figure 11.
There is no significant difference in the performance trend with respect to the previous pressure condition. A general decrease in the absolute values of the discharged capacity can be seen by comparing the
Figure 12 with the previous pressure levels.
3.3. Performance Analysis
A summary table of the amount of energy extracted under all the considered conditions is shown in
Table 1.
Regarding the effect of the sole C-rate, the variation of discharged capacity is more marked for lower temperatures, reaching a x15 factor for the temperature condition at 5 °C.
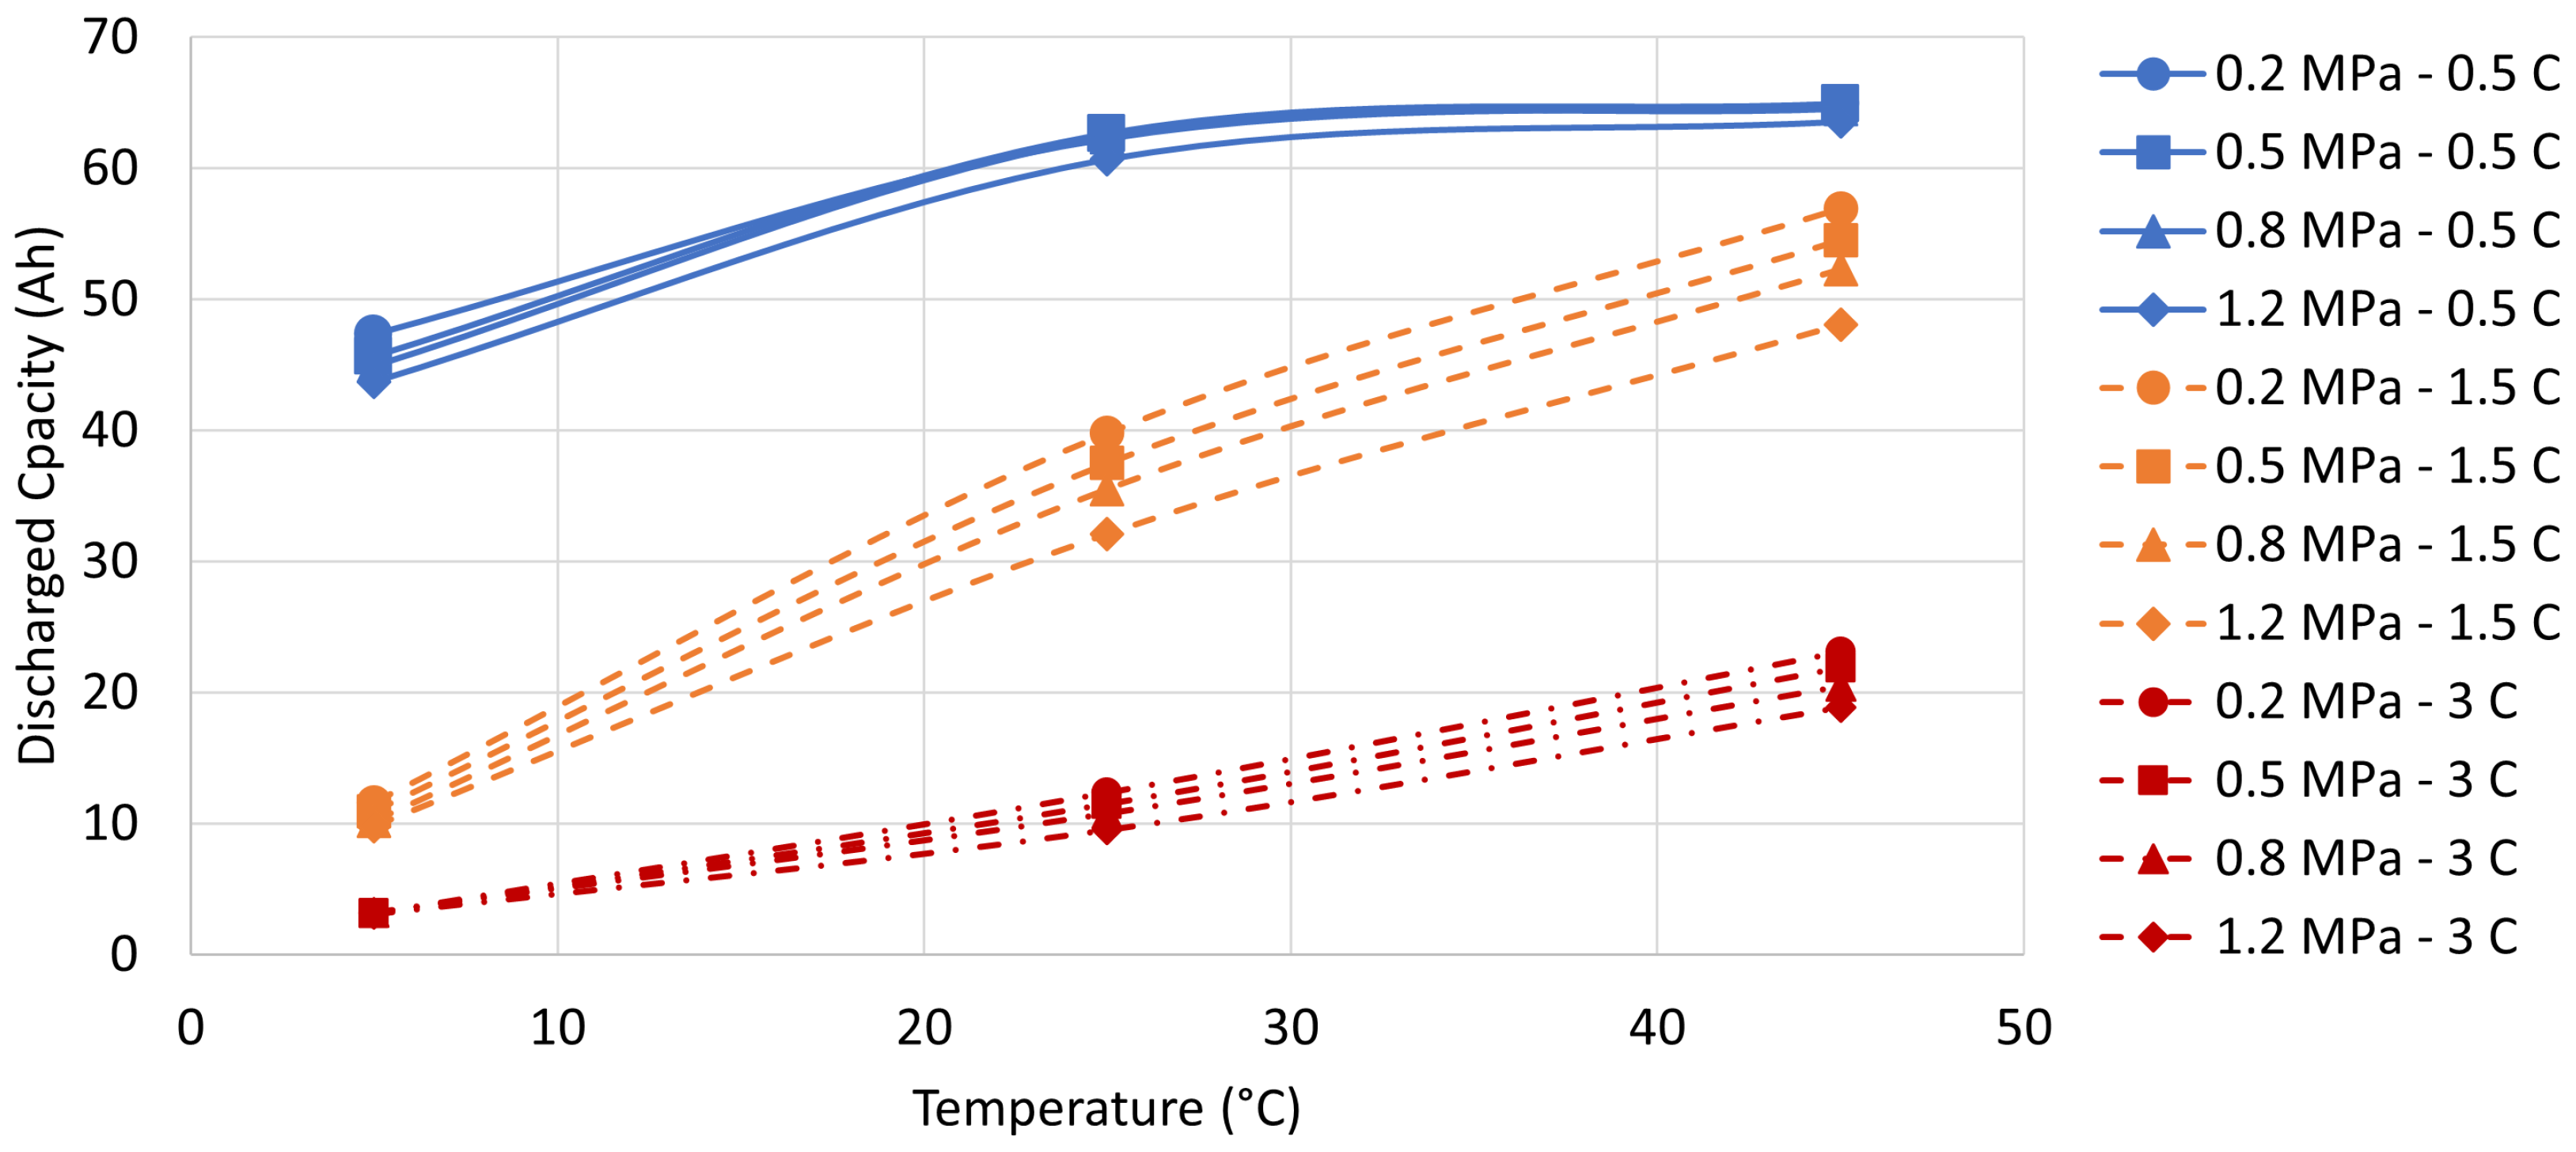
To illustrate performance trends, the discharged capacity values are plotted against either the applied temperature or pressure, as illustrated in
Figure 13 and
Figure 14.
Figure 13 shows that the performance trend varies with different C-rates as the temperature changes. Regarding the load cases at 0.5 C-rate, the trend is not linear, the performance reaches saturation around 25 °C before slighly increasing at 45 °C. The impact of the pressure is not remarkable when compared to the impact of the other two C-rates. The greatest variation in performance is observed for the load cases at 1.5 C-rate. A quasi-linear trend is observable and the pressure has a more significant impact compared to the other two C-rates, especially at 45 °C. The impact of temperature on the load cases at 3 C-rate is lower compared to 1.5 C-rate. Furthemore, at 3 C-rate, the impact of pressure at 5 °C is not appreciable and slightly increases with the temperature.
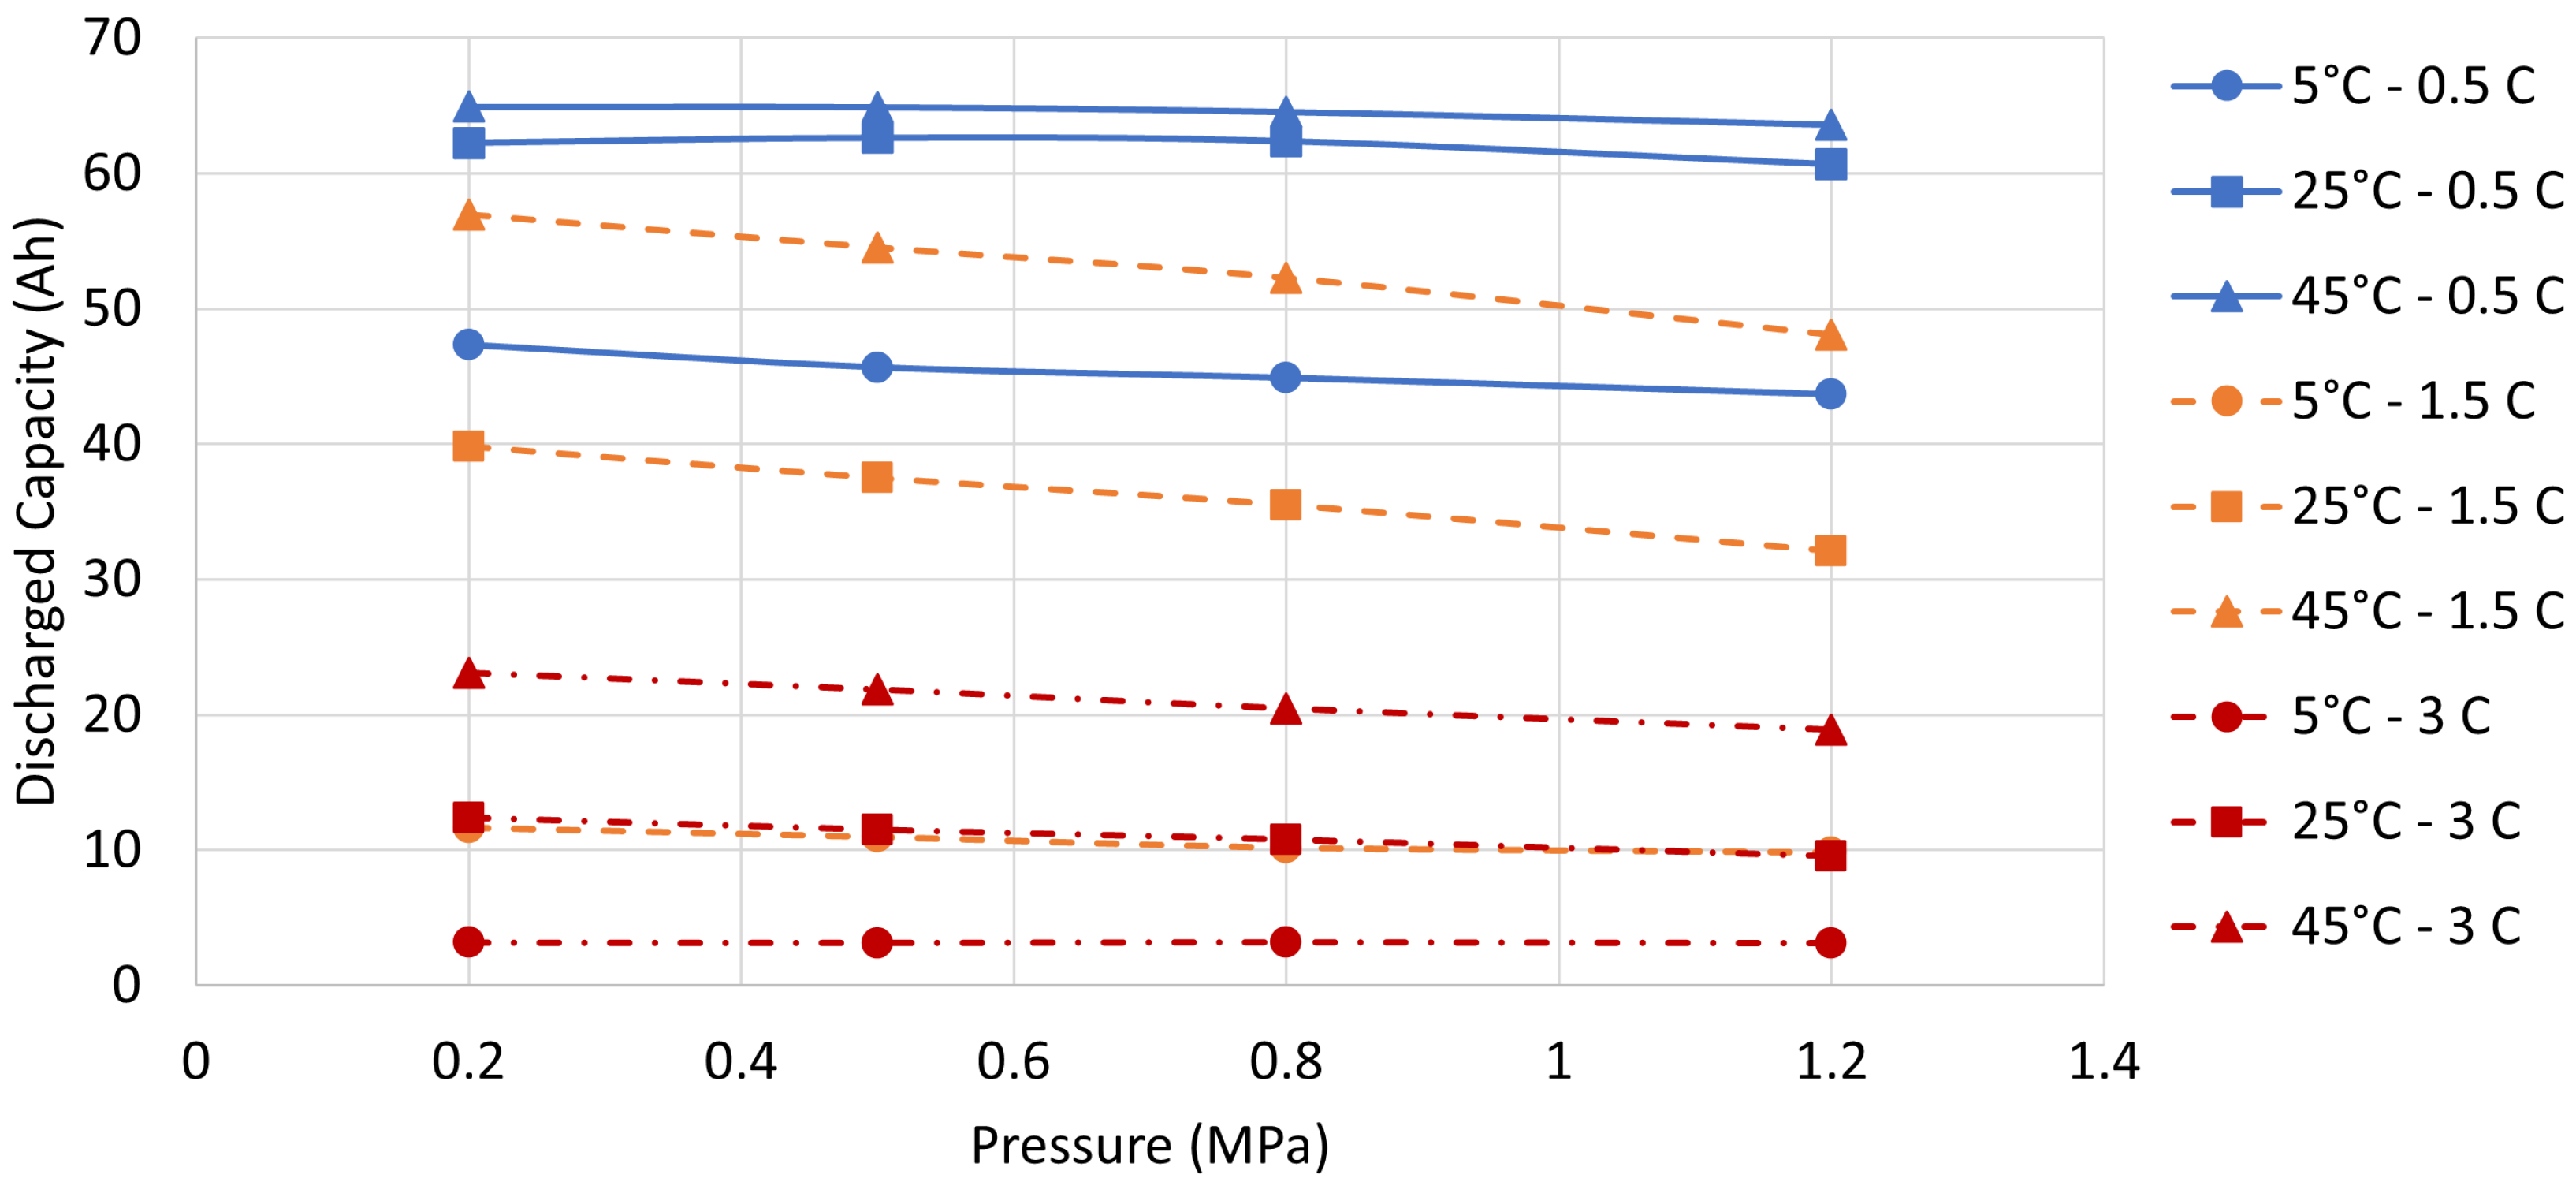
When examining the results in relation to the applied pressure, it is evident that temperature had a greater impact on performance than pressure, as can be seen by comparing
Figure 13 and
Figure 14.
In order to numerically evaluate the impact of the applied pressure and temperature on the LIB, it has been calculated the percentage variation, due to the pressure and temperature, of the discharged capacity. The load cases at 0.2 MPa and 25 °C have been used as reference and the results are shown in
Table 2.
The load cases at 0.5 C-rate and 25 °C show a slight increase in performances at 0.5 MPa, decreasing again when moving to an higher pressure. For all other load cases, the increase in pressure always determines a decrease in performances while an increase in temperature leads to an increase in performances. However, in which measure the temperature and pressure impact on the LIB performance is strongly determined by the utilised C-rate.
4. Discussion
The presented data shows that the performance of the LIB varies non-linearly when exposed to different combinations of pressure, temperature, and discharge rate. The analysis of the results suggests that the best performance of the LIB can be achieved at higher temperatures and lower pressures. However, a higher temperature accelerates the aging of the LIB, hence the trade-off between working temperature and performance must be carefully considered.
The non-linear behaviour of the LIB can be attributed to the interplay of multiple phenomena occurring within it. Regarding the increase in the mechanical pressure, as reported in Cannarella et al. [
19], it has mainly three effects: reduction of delamination, compression of the separator and increase in electrodes wettability. The reduction of delamination and the increase in electrodes wettability are expected to lead to an increase in the LIB performances. However, an excessive compression of the separator can lead to occlusion of the pores and to an increase in its tortuosity, hence to a degradation of performances. The technology and material of the separator determine the pressure range at which this phenomenon occurs.
It is important to acknowledge that temperature also affects phenomena primarily related to mechanical compression. For instance, the stiffness of the separator varies with temperature [
24], which may shift the pressure range that triggers the pores occlusion. Furthermore, an increase in the separator tortuosity, due to an external compression, certainly affects the mass transport of particles in the electrolyte. This may explain why, at 5 °C and 0.5 C-rate, the influence of the external compression seems more pronounced than at higher temperatures, as shown in
Figure 6. The temperature has an impact on the reaction rate at the electrode interfaces and, therefore, inevitably affects the performance of the LIB. Additionally, a rise in temperature results in increased Lithium ions’ mobility in the anode volume and causes the polarisation resistance to change [
25]. Therefore, the temperature increase leads to a decrease in the LIB internal resistance and an enhancement of its performance. A temperature decrease, instead, causes a reduced mobility of Lithium ions and an increase in the polarisation resistance. In this case, an external mechanical compression and the consequent increase in the LIB inner resistance, due to the separator pores occlusion, may result in a less remarkable increase in the inner impedance. This effect can be observed by the discharging curves at 3 C-rate and 5 °C of
Figure 6.
Due to the complexity and interplay between mechanical and thermal phenomena occurring in a LIB, selective studies considering only temperature or mechanical conditioning may lead to incomplete or misleading results. This study highlights the importance of investigating both factors to determine the optimal conditions for the LIB to operate at its best performance.
5. Conclusions
This study shows the importance of considering mechanical and thermal conditioning on LIBs during testing for the evaluation of various performance factors. Specifically, it has shown that performing the same electrical protocol on an LIB can lead to significantly different electrical results under varying temperature and pressure conditions.
By varying pressure and temperature and considering the load cases at 3 C-rate discharge current, the performance of the LIB can drop down to −74.88% or get boosted to a +86.83%. The impact of temperature and pressure on the performance of the LIB changes with respect to the electrical discharging rate. This outcome can serve as a guide for battery pack designers to determine the optimal mechanical pre-compression of the cells stack and thermal management power for achieving optimal performance. The interplay of a multitude of electro–chemical–physical phenomena that are, among other things, influenced by temperature and pressure, generates a highly non-linear LIB behaviour. Given the sheer complexity of describing the physical LIB behaviour, phenomenological or empirical models should be used. These in turn should be calibrated with sensitivity studies that can provide a complete thermal, electrical and mechanical data set.
The presented measurement system can perform isothermal and isobaric tests producing high-quality data that could be used for the calibration of such multi-physic models. The high precision and the possibility to automate the control of the operations, renders this testing set-up suitable for complex electro–thermo–mechanical characterisation of the LIB. The data measured can bring significant additional cell knowledge that allows us to understand the best environmental and utilisation parameters for a specific LIB. This knowledge, in turn, can easily be translated into a significant engineering advantage, allowing battery engineers to design more efficient systems with higher performance.
Author Contributions
Conceptualisation, L.A. and F.C.; methodology, L.A.; software, L.A.; validation, L.A. and F.C.; formal analysis, L.A. and F.C.; investigation, L.A. and F.C.; resources, L.A., F.C., S.V. and P.R.; data curation, L.A. and F.C.; writing—original draft preparation, L.A.; writing—review and editing, F.C. and L.A.; visualisation, L.A.; supervision, F.C.; project administration, F.C. and P.R.; funding acquisition, F.C. and P.R. All authors have read and agreed to the published version of the manuscript.
Funding
This research was funded by Austria Wirtschaftsservice Preseed Deep Tech program (Grant number: P2393454) and ZwickRoell Testing Systems GmbH.
Data Availability Statement
The data that support the findings of this study are available on request from the corresponding author, L.A.
Acknowledgments
The authors associated with MBTS GmbH would like to thank Sven Kuzinna for his mentoring and support prior to the formation of the company.
Conflicts of Interest
The author Luigi Aiello is a shareholder of the company MBTS GmbH. The author Federico Coren is a shareholder of the company MBTS GmbH.
Abbreviations
The following abbreviations are used in this manuscript:
| C | Discharge rate |
| Li-ion battery | LIB |
| SOC | State of charge |
| SSHP | Solid State Heat Pump (Peltier Elements) |
References
- Rostad Sæther, S. Mobility at the crossroads—Electric mobility policy and charging infrastructure lessons from across Europe. Transp. Res. Part A Policy Pract. 2022, 157, 144–159. [Google Scholar] [CrossRef]
- Bandhauer, T.M.; Garimella, S.; Fullerb, T.F. A Critical Review of Thermal Issues in Lithium-Ion Batteries. J. Electrochem. Soc. 2011, 158, 60. [Google Scholar] [CrossRef]
- Li, R.; Li, W.; Singh, A.; Ren, D.; Hou, Z.; Ouyang, M. Effect of external pressure and internal stress on battery performance and lifespan. Energy Storage Mater. 2022, 52, 395–429. [Google Scholar] [CrossRef]
- Barai, A.; Tangirala, R.; Uddin, K.; Chevalier, J.; Guo, Y.; McGordon, A.; Jennings, P. The effect of external compressive loads on the cycle lifetime of lithium-ion pouch cells. J. Energy Storage 2017, 13, 211–219. [Google Scholar] [CrossRef]
- Mussa, A.S.; Klett, M.; Lindbergh, G.; Lindström, R.W. Effects of external pressure on the performance and ageing of single-layer lithium-ion pouch cells. J. Power Sources 2018, 385, 18–26. [Google Scholar] [CrossRef]
- Müller, V.; Scurtu, R.G.; Memm, M.; Danzer, M.A.; Wohlfahrt-Mehrens, M. Study of the influence of mechanical pressure on the performance and aging of Lithium-ion battery cells. J. Power Sources 2019, 440, 227148. [Google Scholar] [CrossRef]
- Zhang, X.; Liu, C.; Rao, Z. Experimental investigation on thermal management performance of electric vehicle power battery using composite phase change material. J. Clean. Prod. 2018, 201, 916–924. [Google Scholar] [CrossRef]
- Bandhauer, T.M.; Garimella, S.; Fuller, T.F. Temperature-dependent electrochemical heat generation in a commercial lithium-ion battery. J. Power Sources 2014, 247, 618–628. [Google Scholar] [CrossRef]
- Lv, S.; Wang, X.; Lu, W.; Zhang, J.; Ni, H. The Influence of Temperature on the Capacity of Lithium Ion Batteries with Different Anodes. Energies 2021, 15, 60. [Google Scholar] [CrossRef]
- Waldmann, T.; Wilka, M.; Kasper, M.; Fleischhammer, M.; Wohlfahrt-Mehrens, M. Temperature dependent ageing mechanisms in Lithium-ion batteries—A Post-Mortem study. J. Power Sources 2014, 262, 129–135. [Google Scholar] [CrossRef]
- Lindgren, J.; Lund, P.D. Effect of extreme temperatures on battery charging and performance of electric vehicles. J. Power Sources 2016, 328, 37–45. [Google Scholar] [CrossRef]
- Petzl, M.; Kasper, M.; Danzer, M.A. Lithium plating in a commercial lithium-ion battery—A low-temperature aging study. J. Power Sources 2015, 275, 799–807. [Google Scholar] [CrossRef]
- Jaguemont, J.; Boulon, L.; Dubé, Y. A comprehensive review of lithium-ion batteries used in hybrid and electric vehicles at cold temperatures. Appl. Energy 2016, 164, 99–114. [Google Scholar] [CrossRef]
- Liao, L.; Zuo, P.; Ma, Y.; Chen, X.; An, Y.; Gao, Y.; Yin, G. Effects of temperature on charge/discharge behaviors of LiFePO4 cathode for Li-ion batteries. Electrochim. Acta 2012, 60, 269–273. [Google Scholar] [CrossRef]
- Hunt, I.A.; Zhao, Y.; Patel, Y.; Offer, J. Surface Cooling Causes Accelerated Degradation Compared to Tab Cooling for Lithium-Ion Pouch Cells. J. Electrochem. Soc. 2016, 163, A1846–A1852. [Google Scholar] [CrossRef]
- Troxler, Y.; Wu, B.; Marinescu, M.; Yufit, V.; Patel, Y.; Marquis, A.J.; Brandon, N.P.; Offer, G.J. The effect of thermal gradients on the performance of lithium-ion batteries. J. Power Sources 2014, 247, 1018–1025. [Google Scholar] [CrossRef]
- Panchal, S.; Dincer, I.; Agelin-Chaab, M.; Fraser, R.; Fowler, M. Experimental and theoretical investigations of heat generation rates for a water cooled LiFePO4 battery. Int. J. Heat Mass Transf. 2016, 101, 1093–1102. [Google Scholar] [CrossRef]
- Wang, X.; Zhang, Y.; Ni, H.; Lv, S.; Zhang, F.; Zhu, Y.; Yuan, Y.; Deng, Y. Influence of Different Ambient Temperatures on the Discharge Performance of Square Ternary Lithium-Ion Batteries. Energies 2022, 15, 5348. [Google Scholar] [CrossRef]
- Cannarella, J.; Arnold, C.B. Ion transport restriction in mechanically strained separator membranes. J. Power Sources 2013, 226, 149–155. [Google Scholar] [CrossRef]
- Cannarella, J.; Arnold, C.B. Stress evolution and capacity fade in constrained lithium-ion pouch cells. J. Power Sources 2014, 245, 745–751. [Google Scholar] [CrossRef]
- Zhang, X.; Wang, Q.J.; Harrison, K.L.; Jungjohann, K.; Boyce, B.L.; Roberts, S.A.; Attia, P.M.; Harris, S.J. Rethinking How External Pressure Can Suppress Dendrites in Lithium Metal Batteries. J. Electrochem. Soc. 2019, 166, A3639–A3652. [Google Scholar] [CrossRef]
- Wu, Y.; Keil, P.; Schuster, S.F.; Jossen, A. Impact of Temperature and Discharge Rate on the Aging of a LiCoO2/LiNi0.8Co0.15Al0.05O2 Lithium-Ion Pouch Cell. J. Electrochem. Soc. 2017, 164, A1438–A1445. [Google Scholar] [CrossRef]
- Coren, F. Testvorrichtung zur Ermittlung elektrischer Eigenschaften einer Batterie sowie Verfahren hierzu. PCT/AT2022/060364, 21 October 2022. [Google Scholar]
- Li, J.; Zhu, Z.; Li, T.; Peng, X.; Jiang, S.; Turng, L. Quantification of the Young’s modulus for polypropylene: Influence of initial crystallinity and service temperature. J. Appl. Polym. Sci. 2019, 137, 48581. [Google Scholar] [CrossRef]
- Ma, S.; Jiang, M.; Tao, P.; Song, C.; Wu, J.; Wang, J.; Deng, T.; Shang, W. Temperature effect and thermal impact in lithium-ion batteries: A review. Prog. Nat. Sci. Mater. Int. 2018, 28, 653–666. [Google Scholar] [CrossRef]
Figure 1.
(a) Commercial laminate-pouch LIB used in the tests. Scratch marks are present due to the disassembly process. (b,c) Close-up of the tabs and sealing.
Figure 1.
(a) Commercial laminate-pouch LIB used in the tests. Scratch marks are present due to the disassembly process. (b,c) Close-up of the tabs and sealing.
Figure 2.
Sketch of the creep testing machine, front (a) and side (b) view. A computational unit is present in the control box to regulate the force and displacement.
Figure 2.
Sketch of the creep testing machine, front (a) and side (b) view. A computational unit is present in the control box to regulate the force and displacement.
Figure 3.
Section view of the constructed thermal unit utilised for the thermal conditioning of the LIB.
Figure 3.
Section view of the constructed thermal unit utilised for the thermal conditioning of the LIB.
Figure 4.
Block diagram of the communicating subsystems in the test set-up. Dashed lines represent information signals while solid lines refer to control and power signals.
Figure 4.
Block diagram of the communicating subsystems in the test set-up. Dashed lines represent information signals while solid lines refer to control and power signals.
Figure 5.
Description of the test protocol utilised for this study.
Figure 5.
Description of the test protocol utilised for this study.
Figure 6.
Discharge curves at 5 °C under different pressures and discharge rates. The arrows indicate the trend of the curves due to an increase in the external pressure.
Figure 6.
Discharge curves at 5 °C under different pressures and discharge rates. The arrows indicate the trend of the curves due to an increase in the external pressure.
Figure 7.
Discharge curves at 25 °C under different pressures and discharge rates. The arrows indicate the trend of the curves due to an increase in the external pressure.
Figure 7.
Discharge curves at 25 °C under different pressures and discharge rates. The arrows indicate the trend of the curves due to an increase in the external pressure.
Figure 8.
Discharge curves at 45 °C under different pressures and discharge rates. The arrows indicate the trend of the curves due to an increase in the external pressure.
Figure 8.
Discharge curves at 45 °C under different pressures and discharge rates. The arrows indicate the trend of the curves due to an increase in the external pressure.
Figure 9.
Discharge curves at 0.2 MPa under different temperatures and discharge rates.
Figure 9.
Discharge curves at 0.2 MPa under different temperatures and discharge rates.
Figure 10.
Discharge curves at 0.5 MPa under different temperatures and discharge rates.
Figure 10.
Discharge curves at 0.5 MPa under different temperatures and discharge rates.
Figure 11.
Discharge curves at 0.8 MPa under different temperatures and discharge rates.
Figure 11.
Discharge curves at 0.8 MPa under different temperatures and discharge rates.
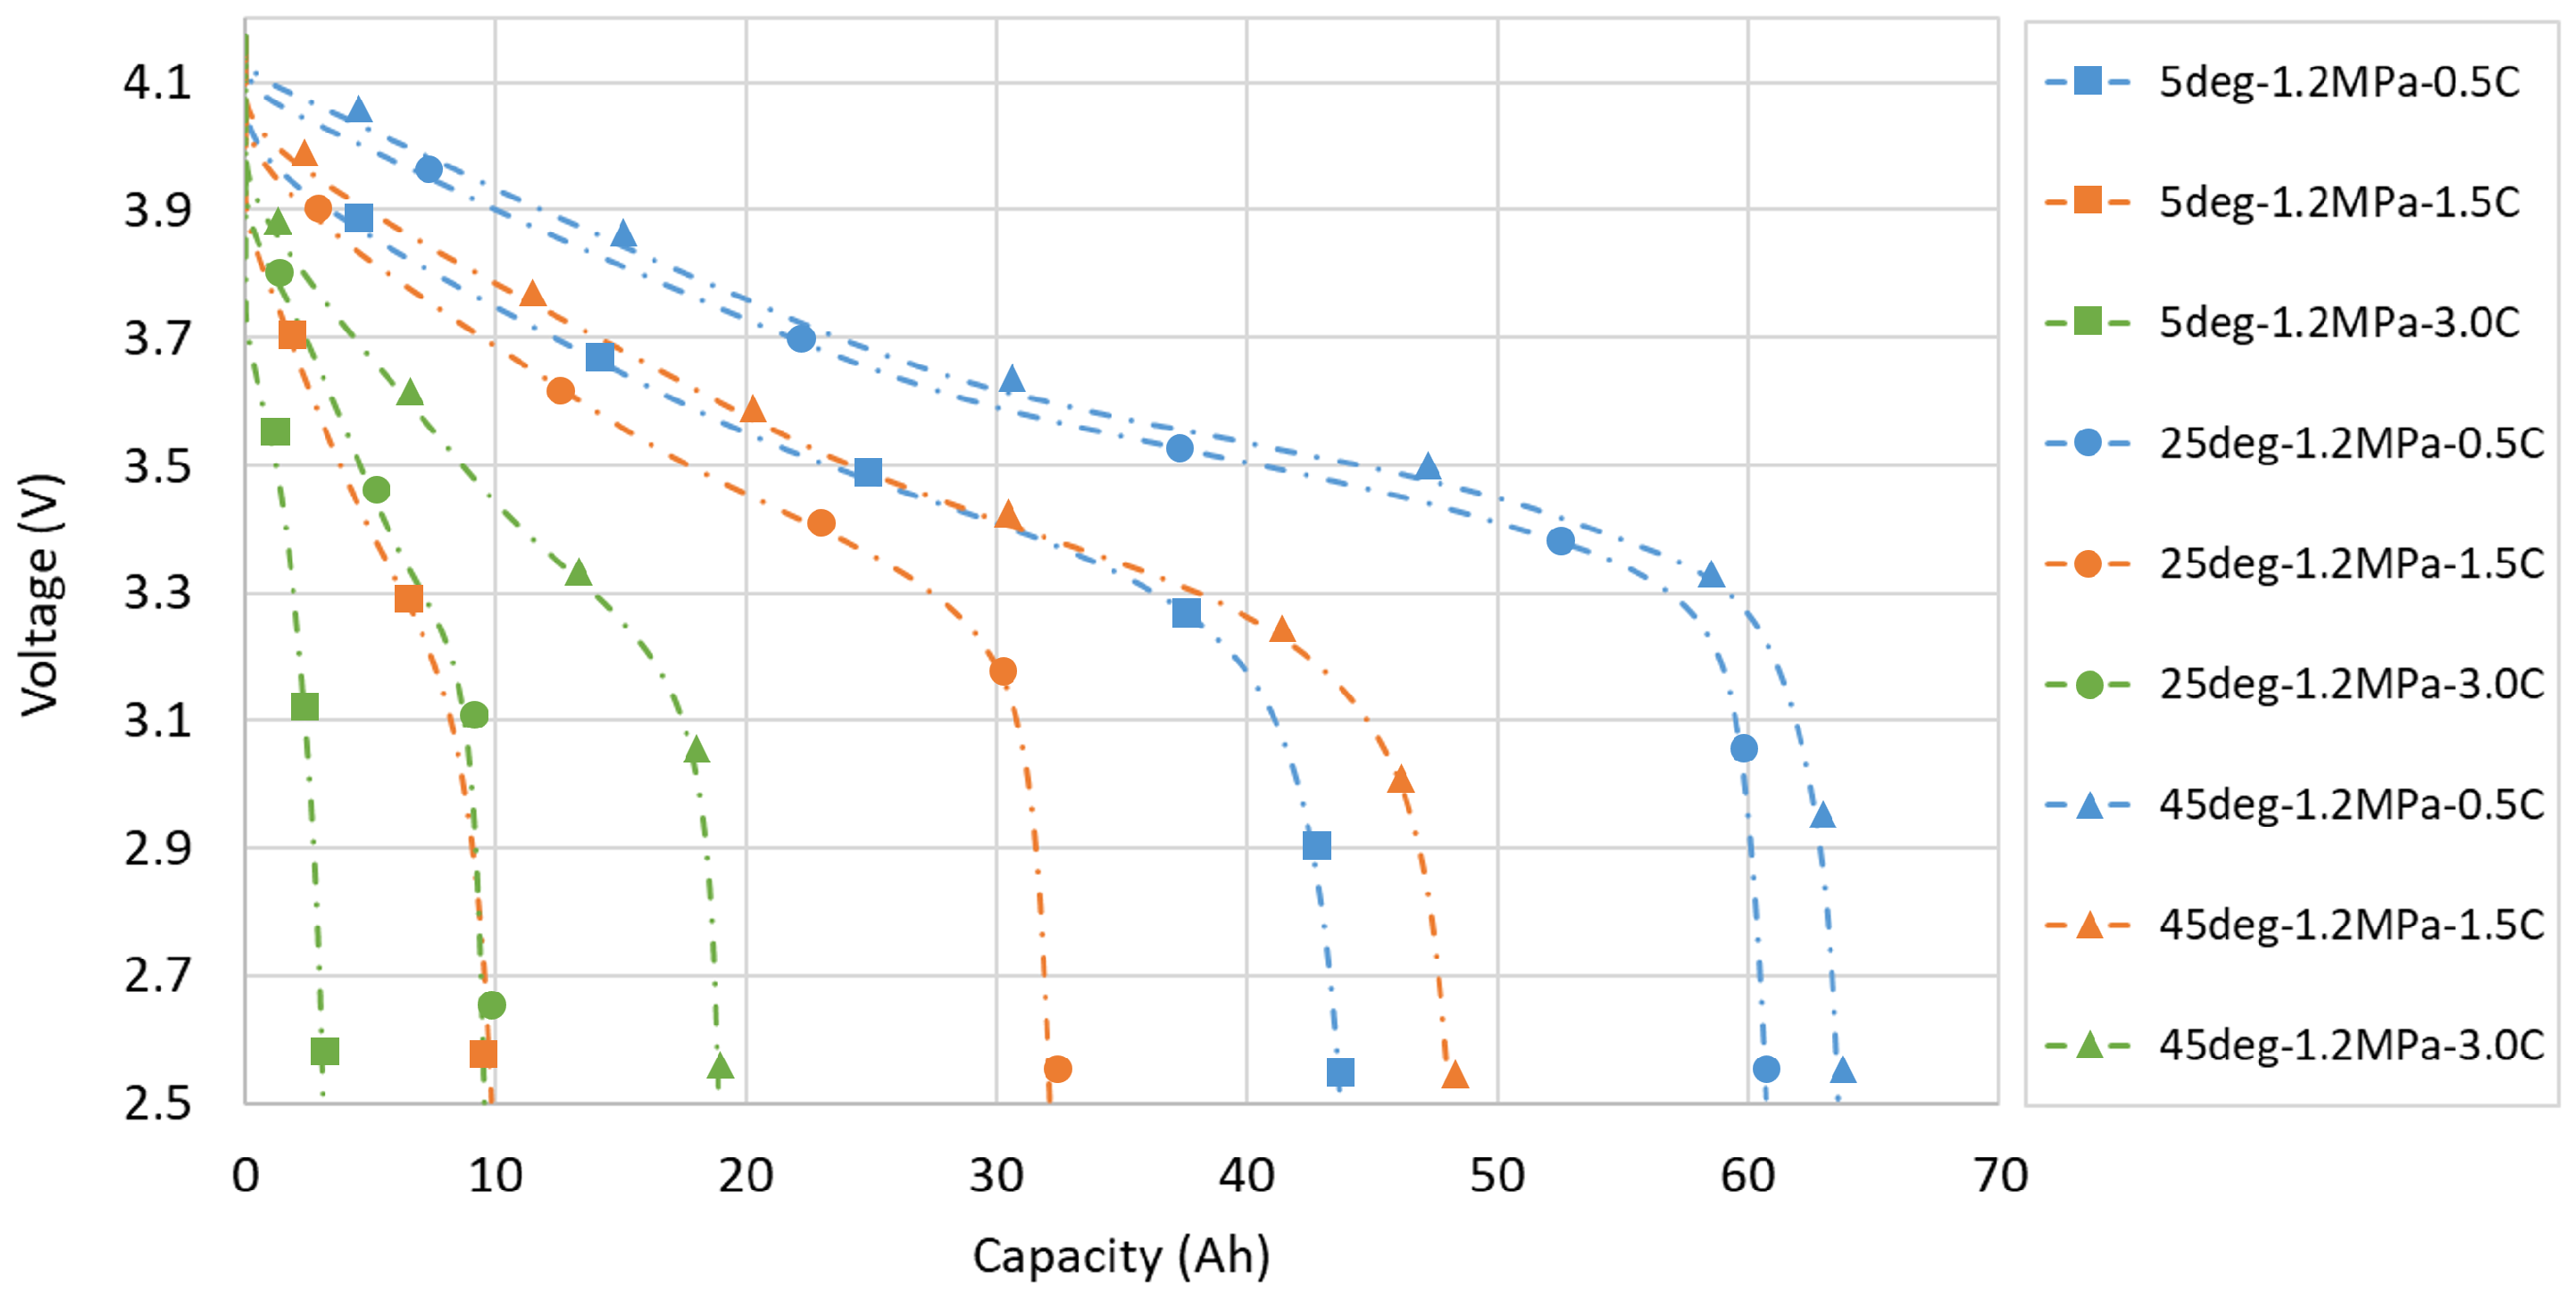
Figure 12.
Discharge curves at 1.2 MPa under different temperatures and discharge rates.
Figure 12.
Discharge curves at 1.2 MPa under different temperatures and discharge rates.
Figure 13.
Overview of the discharged capacity versus the applied temperature.
Figure 13.
Overview of the discharged capacity versus the applied temperature.
Figure 14.
Overview of the discharged capacity versus the applied pressure.
Figure 14.
Overview of the discharged capacity versus the applied pressure.
Table 1.
Overview of the extracted charge under different conditions.
Table 1.
Overview of the extracted charge under different conditions.
| C-Rate | Pressure (MPa) | 5 °C | 25 °C | 45 °C |
|---|
| 0.5 | 0.2 | 47.32 (Ah) | 62.26 (Ah) | 64.92 (Ah) |
| 0.5 | 45.67 (Ah) | 62.63 (Ah) | 64.90 (Ah) |
| 0.8 | 44.89 (Ah) | 62.38 (Ah) | 64.54 (Ah) |
| 1.2 | 43.68 (Ah) | 60.69 (Ah) | 63.57 (Ah) |
| 1.5 | 0.2 | 11.65 (Ah) | 39.82 (Ah) | 56.96 (Ah) |
| 0.5 | 10.97 (Ah) | 37.50 (Ah) | 54.52 (Ah) |
| 0.8 | 10.19 (Ah) | 35.50 (Ah) | 52.27 (Ah) |
| 1.2 | 9.83 (Ah) | 32.11 (Ah) | 48.06 (Ah) |
| 3 | 0.2 | 3.17 (Ah) | 12.38 (Ah) | 23.13 (Ah) |
| 0.5 | 3.14 (Ah) | 11.49 (Ah) | 21.89 (Ah) |
| 0.8 | 3.21 (Ah) | 10.76 (Ah) | 20.48 (Ah) |
| 1.2 | 3.11 (Ah) | 9.53 (Ah) | 18.89 (Ah) |
Table 2.
Percentage variation of performances due to the pressure and temperature variation. The reference discharged capacity is considered at 0.2 MPa and 25 °C for each C-rate.
Table 2.
Percentage variation of performances due to the pressure and temperature variation. The reference discharged capacity is considered at 0.2 MPa and 25 °C for each C-rate.
| C-Rate | Pressure (MPa) | 5 °C | 25 °C | 45 °C |
|---|
| 0.5 | 0.2 | −24.00% | 0% | 4.27% |
| 0.5 | −26.65% | 0.59% | 4.24% |
| 0.8 | −27.90% | 0.19% | 3.66% |
| 1.2 | −29.84% | −2.52% | 2.10% |
| 1.5 | 0.2 | −70.74% | 0% | 43.04% |
| 0.5 | −72.45% | −5.83% | 36.92% |
| 0.8 | −74.41% | −10.85% | 31.27% |
| 1.2 | −75.31% | −19.36% | 20.69% |
| 3 | 0.2 | −74.39% | 0% | 86.83% |
| 0.5 | −74.64% | −7.19% | 76.82% |
| 0.8 | −74.07% | −13.09% | 65.43% |
| 1.2 | −74.88% | −23.02% | 52.58% |
| Disclaimer/Publisher’s Note: The statements, opinions and data contained in all publications are solely those of the individual author(s) and contributor(s) and not of MDPI and/or the editor(s). MDPI and/or the editor(s) disclaim responsibility for any injury to people or property resulting from any ideas, methods, instructions or products referred to in the content. |
© 2024 by the authors. Licensee MDPI, Basel, Switzerland. This article is an open access article distributed under the terms and conditions of the Creative Commons Attribution (CC BY) license (https://creativecommons.org/licenses/by/4.0/).


