Article

Air-Outlet and Step-Number Effects on a Step-like Plenum Battery’s Thermal Management System

by
Olanrewaju M. Oyewola
1,*,
Emmanuel T. Idowu
1,
Morakinyo J. Labiran
1,
Michael C. Hatfield
2 and
Mebougna L. Drabo
3
1
Department of Mechanical Engineering, University of Alaska Fairbanks, Fairbanks, AK 99775, USA
2
Department of Electrical and Computer Engineering, University of Alaska Fairbanks, Fairbanks, AK 99775, USA
3
Department of Mechanical & Civil Engineering and Construction Management, Alabama A&M University, Huntsville, AL 35811, USA
*
Author to whom correspondence should be addressed.
Batteries 2025, 11(3), 87; https://doi.org/10.3390/batteries11030087
Submission received: 26 January 2025 / Revised: 14 February 2025 / Accepted: 19 February 2025 / Published: 21 February 2025

Abstract

:
Optimizing the control of the battery temperature ( T b ), while minimizing the pressure drop ( P ) in air-cooled thermal management systems (TMSs), is an indispensable target for researchers. The Z-type battery thermal management system’s (BTMS’s) structure is one of the widely investigated air-cooled TMSs. Several designs of air-cooled BTMSs are often associated with the drawback of a rise in P , consequently resulting in an increase in pumping costs. In this study, the investigation of a Step-like plenum design was extended by exploring one and two outlets to determine possible decreases in the maximum battery temperature ( T m a x ), maximum battery temperature difference ( T m a x ), and pressure drop ( P ). The computational fluid dynamics (CFD) method was employed to predict the performances of different designs. The designs combine Step-like plenum and two outlets, with the outlets located at different points on the BTMS. The results from the study revealed that using a one-outlet design, combined with a Step-like plenum design, reduced T m a x by 3.52 K when compared with that of the original Z-type system. For another design with two outlets and the same Step-like plenum design, a reduction in T m a x by 3.45 K was achieved. For T m a x , the use of a two-outlet design and a Step-like plenum design achieved a reduction of 6.34 K. Considering the P performance, the best- and poorest-performing designs with two outlets reduced P by 5.91 Pa and 3.66 Pa, respectively, when compared with that of the original Z-type design. The performances of the designs in this study clearly show the potential of two-outlet designs in reducing P in systems. This study, therefore, concludes that the operational cost of the Step-like plenum Z-type BTMS can be reduced through the careful positioning of the two-outlet section, which will promote the design and development of current and future electric vehicle (EV) technologies.

1. Introduction

The performance enhancement of battery thermal management systems (BTMSs) has been a vital research focus in recent times because of their roles in advancing the design and development of novel highly efficient electric vehicles (EVs). Over the years, EVs have proven to be reliable in the bid to minimize environmental pollution and fossil fuel consumption [1] because of the choice of batteries as an energy source as an alternative to conventional fossil fuels. Different types of batteries have been used to power EVs; however, the most common type is the lithium-ion battery. The power consumption, mileage, and cost of electric vehicles generally depend on the health and capacity of batteries [2]. Interestingly, despite their wide acceptance, lithium-ion batteries generate too much heat during charging and discharging, which poses severe threats to the health and service life of the batteries. In order to overcome this challenge, novel BTMSs that are highly efficient and effective must be developed. Generally, BTMSs are required to maintain the working temperature of battery packs between 25   ° C and 40   ° C , while the maximum temperature difference ( T m a x ) between any two batteries in a pack remains below 5   ° C [3,4]. This is necessary because a T m a x value higher than the recommended value and temperatures outside the recommended range will negatively impact the performance of batteries [5]. Several cooling methods for BTMSs have been developed over the years and can be categorized as passive and active cooling methods. For active cooling, batteries are cooled by passing air across the batteries [6,7], by the direct contact of liquid on the batteries, by passing the liquid through cooling plates or mini channels [8,9], or by placing heat pipes between and around batteries [10,11]. Passive cooling utilizes phase-change materials (PCMs), which will be in direct contact with batteries to maintain the batteries’ operational temperature [12,13]. The combination of two methods has also been explored, such as passive/passive, active/active, or passive/active methods [14,15,16]. Despite the progress recorded in the design of BTMSs, the air-cooling BTMS still remains one of the most preferred choices because of its numerous benefits of design affordability, simplicity, stability, light weight, and longevity [17]. It has been employed by many companies, such as Nissan, Toyota, Volkswagen, and Chevrolet [17,18].
The research on the air-cooling technique is being explored, with new designs supplementing the air-cooling techniques by adding other enhancement techniques, to form hybrid thermal management systems (HTMSs). Focusing HTMSs, Mo et al. [1] combined phase-change materials (PCMs) and air-cooling techniques for managing the performance of batteries under all climate conditions. In a study by Qin et al. [19], PCMs and air-cooling techniques were integrated together to form a hybrid BTMS, which was investigated experimentally and numerically. Behi et al. [20] proposed a novel concept that combines heat pipes and air-cooling for managing battery temperatures in electric vehicles. Zhang et al. [21] carried out a performance analysis of another hybrid BTMS, which combines PCMs and air-cooling, by leveraging the potential of machine-learning algorithms to optimize the choice of the operational and structural parameters of the design. Zhou et al. [22] utilized liquid cooling while designing the channel for the liquid flow in the form of steps. A new concept has also emerged for PCMs, as reported by Song et al. [23], where a dual-layer PCM was designed, while air provided additional cooling. A recent concept proposed by Zhu et al. [24] combined two different outlet positions employed in the Z-type BTMS. The PCM-based hybrid design has been further investigated using nano-PCM, fins, and metal foam [25,26]. The modification of the structural orientations of battery packs to optimize their performance has also been widely employed. Argade and De [27] optimized the design of the Z-type BTMS by adopting a tapered air inlet and secondary vents. Oyewola and Idowu [28] investigated the waved and straight structures of the divergence plenum of the Z-type BTMS to alter the flow of the air to improve the thermal uniformity. Suo et al. [29] also investigated the effects of different plenum shapes, such as slanted, convex, concave, and stepped, and different plenum positions on the heat dissipation performances of batteries. Chen et al. [30] explored a control strategy based on the temperature difference among batteries for a J-type-structured BTMS. Alzwayi and Paul [31] considered the control of flow patterns while introducing vertical and spiral fins to enhance the cooling performance of the system. The installation of baffles, spoilers, and fins along the airflow path has been widely adopted. For instance, Qin et al. [32] carried out experimental and numerical simulation studies for a design with a combination of internal fin structures and air cooling to enhance the thermal performance of a system. Wang et al. [33] installed spoilers along the airflow path to enhance the thermal performance of the Z-type BTMS. Wang et al. [34] introduced parallel plates to the airflow of the same Z-type BTMS to enhance the performance of the system. Oyewola et al. [35] investigated the use of straight and inclined baffles in enhancing the performance of the Z-type BTMS. Alzwayi and Paul [36] examined the heat transfer enhancement of batteries using vertical and spiral cooling fins. Each of these studies provides distinct performances and demonstrates huge potential in enhancing the performance of Z-type BTMSs.
The findings from a few of the aforementioned studies are further presented to demonstrate how they impact the thermal performances of batteries. A study by Wang et al. [34] added parallel plates to the Z-type BTMS to enhance its performance. It was revealed that this technique reduced T m a x and T m a x by 3.37 K (6.17%) and 5.5 K (71.9%), respectively, in comparison with those of the original Z-type design. In a study by Oyewola et al. [35], where straight and inclined baffles were installed to understand how they influence the performance of the system, the results showed that the baffle thickness can either decrease or increase the T m a x values of the batteries, while inclined baffles generally produce better T m a x and P performances. In a study by Alzwayi and Paul [36], the heat transfer enhancement in a Z-type BTMS with cylindrical lithium-ion batteries having vertical and spiral fins installed on them was investigated. It was observed that spiral fins reduced the battery temperature by 3.2% when compared with longitudinal fins, which also resulted in a 65.6% reduction in the amount of material used. Other studies that explore the hybrid approach have also reported enhancements in performance. For instance, Moaveni et al. [26] investigated passive and hybrid BTMSs by employing fins, nano-PCMs, and metal foam, which served as flow control mechanisms. From the study, using 9% nanoparticles and four fins in the hybrid system, T m a x reduced by 5.18 K and 10.36 K, when compared with that of the system without fins and nanoparticles, respectively. Song et al. [23] considered a hybrid BTMS having a double-layer PCM and air-cooling techniques. The T m a x value of the hybrid BTMS achieved a reduction of 21.5% in comparison with that of the PCM BTMS at an ambient temperature of 40   ° C . The aforementioned studies reported improvements in the thermal performance of the BTMS, with most of the techniques requiring the addition of materials, which, consequently, implies an increase in the overall weight of the system. This is not favorable in applications where weight reduction is crucial to achieve the optimal operation. Hence, more studies have been carried out to improve thermal performance without necessarily adding more materials. One such approach can be seen in a study by Oyewola et al. [28], where different wave-like and straight configurations were investigated. The study reported that T m a x and T m a x reduced by 8 K and 4.61 K, respectively, using a wave-inclined plenum configuration. Targeting improvement in thermal performance without adding materials, Argade and De [27] created outlet vents on the convergence plenum while further redesigning the divergence plenum to have an inclined configuration. The study revealed that T m a x and T m a x were reduced by 2.18% and 72.84% when compared to those of the system without vents.
From the literature presented in this study, it is evident that Z-type BTMSs have been extensively investigated through different structural modifications. One of these designs that has shown huge thermal enhancement potential is the Step-like plenum BTMS, with a significant reduction in T m a x . A lot of investigations have also been conducted on the Z-type BTMS with a Step-like plenum design to gain detailed insight into the performance of the design. Zhou et al. [22] proposed stepped channels to achieve a lightweight design, using liquid as a cooling fluid. Zhu et al. [24] combined the Step-like design with two outlet positions. Oyewola et al. [37] also investigated the Step-like design, focusing on four different numbers of steps, with each design having the same step height. In order to better understand the Step-like design, Oyewola et al. [38] investigated each number of steps with variable step heights. A further study by Oyewola et al. [39] leveraged machine learning’s benefits to investigate additional numbers of steps and various inlet air velocities and temperatures. Each of these studies demonstrates different performances in terms of T m a x , T m a x , and P . By installing steps on the divergent plenum and changing the positions of the outlets, the performances of the designs varied. However, increases in the pressure drop were recorded for all the Step-like plenum designs. This work differs from the previous works by investigating the performance of Step-like plenum BTMSs through the introduction of two outlets, positioned at different locations on the convergent plenum, with the aim of maintaining a reduction in T m a x while reasonably reducing P . Considering the potential of increasing the number of steps while adopting and repositioning two outlet channels, more investigations can be carried out for the Step-like plenum configuration. In view of these, the current study explored additional possibilities not covered by Oyewola et al. [37] and Oyewola et al. [39] by investigating seven different numbers of steps, combined with one or two outlets, placed at different flow pattern positions. The numerical simulation method was employed to investigate different structural designs, thereby proposing the best structure in terms of reductions in T m a x , T m a x , and P . It should be noted that the performances of these designs will be presented based on each of the aforementioned parameters and not based on a combined effect of the three parameters. A future study is underway to optimize the designs and select the performance metric that balances the tradeoffs between the parameters.

2. Simulation Method

A computational fluid dynamics (CFD) approach was adopted, with the reference Z-type BTMS as the primary design. From the literature, it can be seen that several modifications of Z-type BTMs have been developed and investigated, with the aim of minimizing heat accumulation and pressure loss during cooling. The studies have revealed that parameters such as the maximum temperature ( T m a x ), maximum temperature difference ( T m a x ), and pressure drop ( P ) are significant in evaluating the performance of the system [30,31,40]. Air-cooled BTMSs aim to prevent excess temperature accumulation through reductions in T m a x , promote thermal homogeneity through reductions in T m a x , and minimize pumping costs through reductions in P . These are general performance metrics extensively reported in air-cooled battery thermal management system studies. Furthermore, a reduction in T m a x indicates improvement in thermal homogeneity (uniform temperature distribution) among the batteries in a pack. Improvement in thermal homogeneity decreases the possibility of irregular heating, which could cause the overheating of a battery at the expense of the other batteries in the same pack, maintaining significantly lower temperatures. Such overheating affects the lifespan of batteries and could lead to explosions [5,37,40]. The CFD tool used for this study is the well-known ANSYS software 2024 R1 package. This software was used for developing physical geometries, meshing and independence tests, and computing the appropriate governing equations to predict the airflow and temperature profiles of BTMSs.

2.1. Physical Geometries

2.1.1. Z-Type Geometry

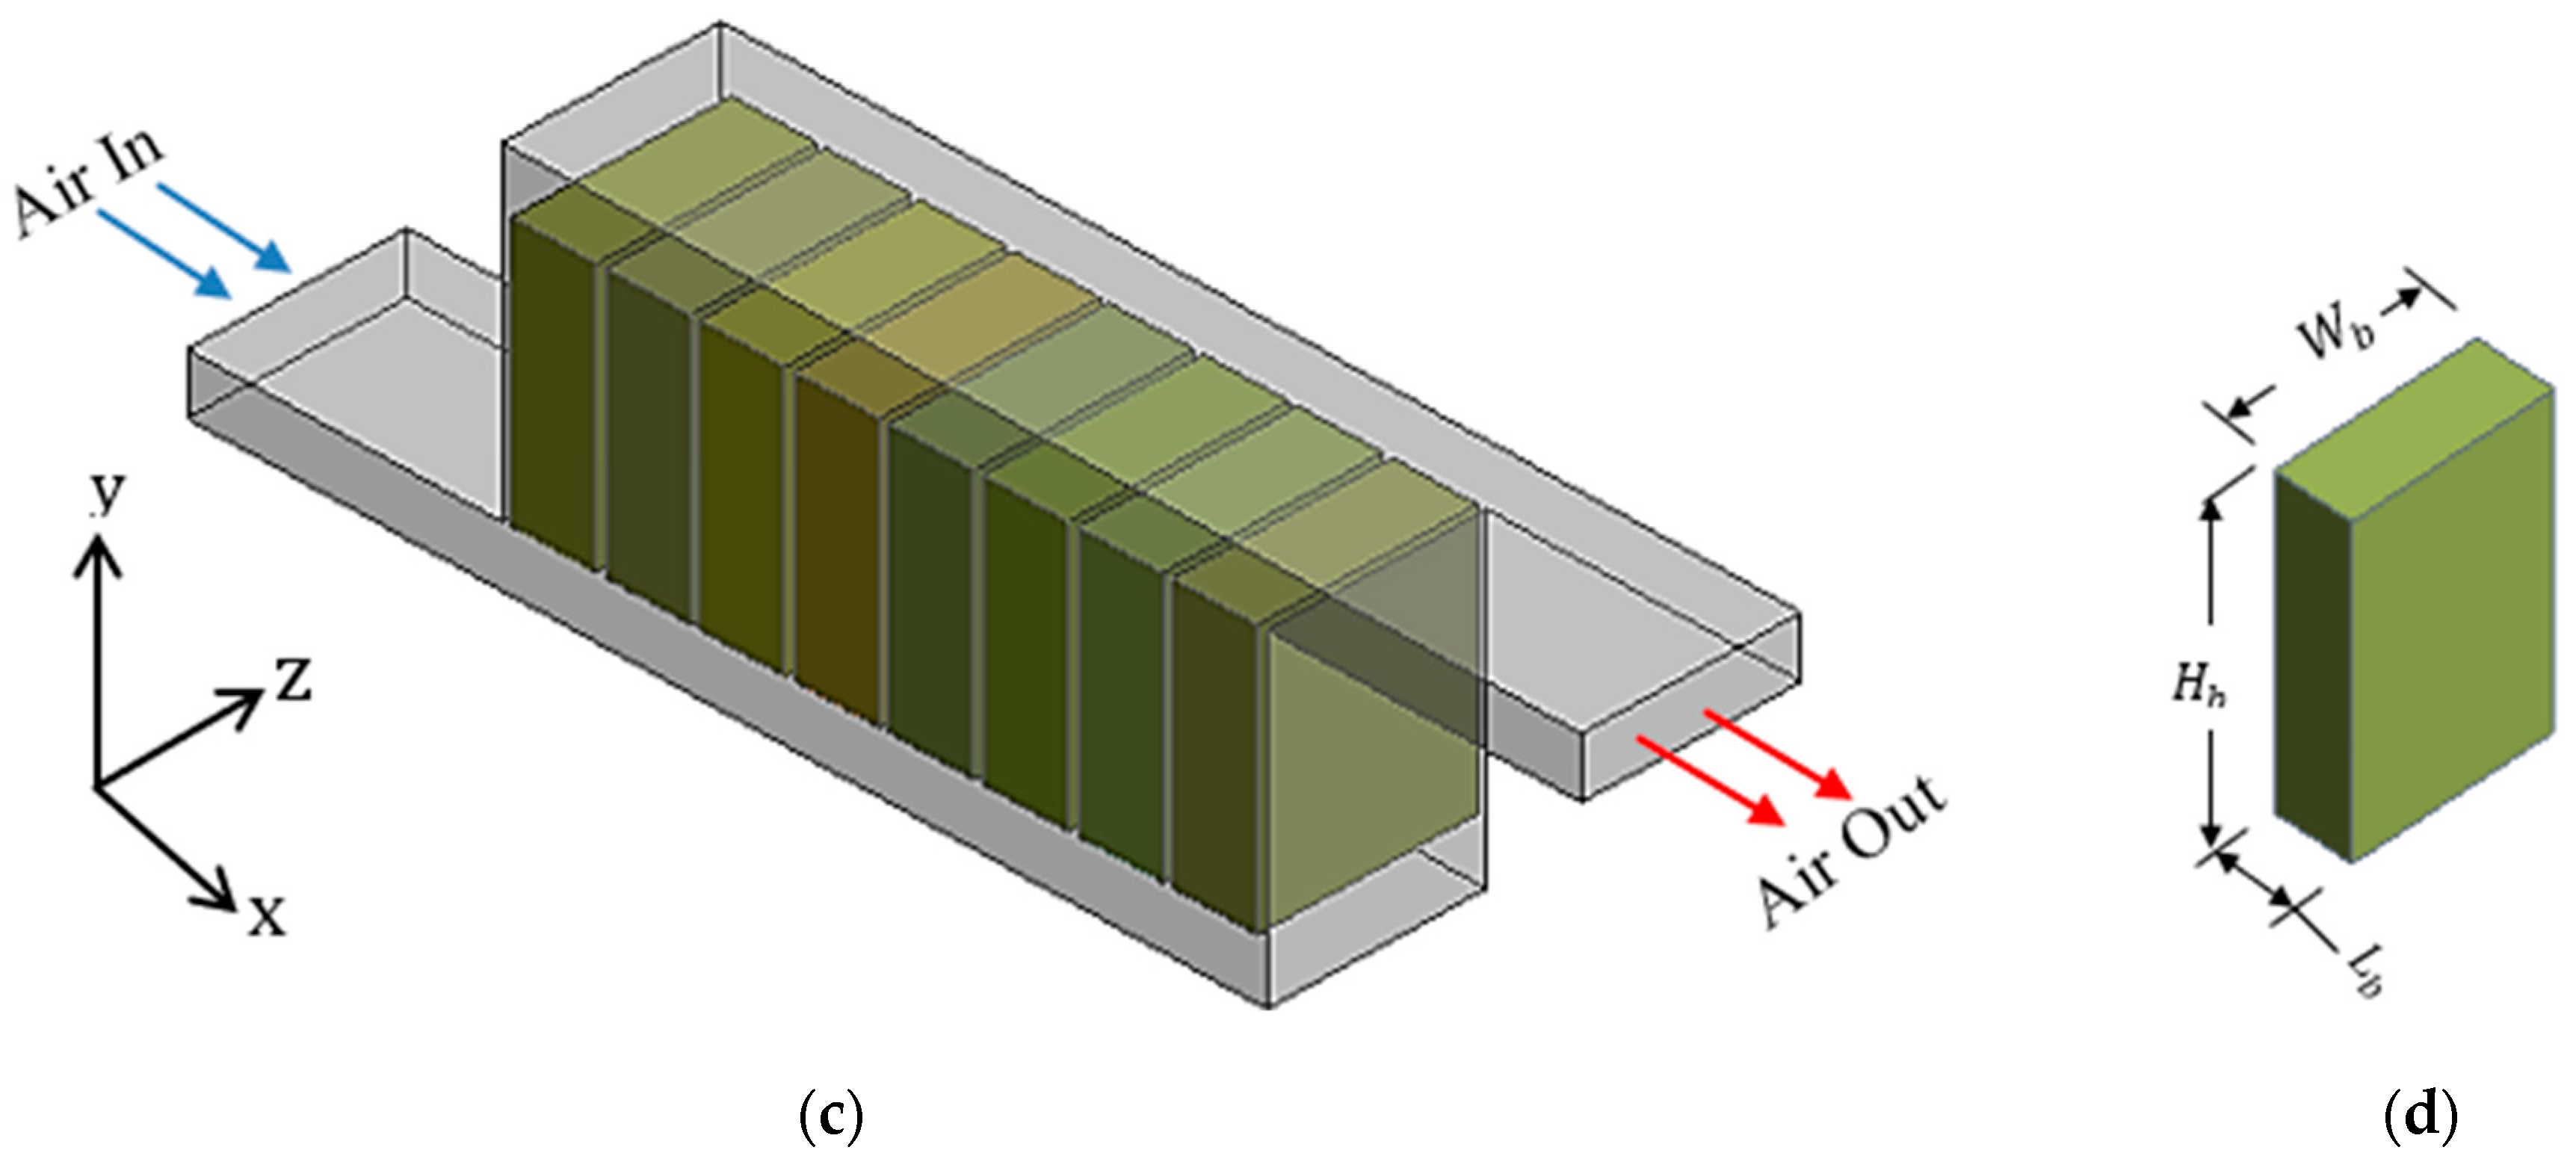
The widely investigated Z-type BTMS (denoted as Z-1) structure was considered in this study because of its simplistic shape, configuration, and arrangement of batteries. An experimental study has been carried out for this structure to establish and evaluate its reliability for real-life applications. Additionally, 3D and 2D geometries of the BTMS have been investigated, with the results showing very good comparative performances [40]. A numerical simulation by Chen et al. [40] compared the performances of conventional Z-type BTMSs using 2D and 3D geometries. The results showed a negligible difference between the two geometries, with estimated average errors of 1% and 0.1% for the airflow and temperature of the batteries, respectively. Moreso, simulations with 2D geometries were faster than those with 3D geometries. Based on this assertion, 2D geometries were considered for all the numerical simulations in this study. Figure 1a–d shows a 2D Z-type BTMS, a 2D battery, a 3D Z-type BTMS, and a 3D battery, respectively. The BTMS consists of an inlet section and an outlet section for passing in air and rejecting air, respectively, while eight batteries in a series arrangement are cooled down. The air passes through cooling channels ( C C s) during the cooling process. A cooling channel has fixed length ( C C l ) at 3 mm, while the velocity ( V i ) and temperature ( T i ) of the air at the inlet are taken as 3 m/s and 299.15 K, respectively, with a heat power of 11.8 W. The heat generation rate of the battery can be estimated using Equation (1), for the 5-current constant discharge rate of the battery (12 Ah LiFePO4) estimated at 69,370 W/m3 [40,41,42]. The properties of the battery and air are presented in Table 1 [34,37]. The description of the original Z-type BTMS is presented in Table 2.
Q b = I 2 R b I T b d u d T / V b
R b = 0.00705 0.01853 × S O C + 0.05894 × S O C 2 0.09151 × S O C 3 + 0.06579 × S O C 4 0.01707 × S O C 5
where I is the discharge current, R b is the battery’s equivalent resistance, T b is the battery temperature, V b is the volume of the battery, and d u d T = 0.22   m V / K is a coefficient obtained from electrochemical–calorimetric techniques.

2.1.2. Step-like Plenum Geometry

The Step-like plenum geometry (Z-2) considered in this study was initially proposed by Oyewola et al. [37]. This geometry has further been studied by exploring some modifications to the step characteristics, such as increasing the number of steps ( N s ) and varying the step height ( H s ) [38,39]. Figure 2 shows a 2D schematic view of the Step-like plenum geometry and its characteristics, viz., the step number ( N s ), height of the step ( H s ), and length of the step ( L s ). In the initial design by Oyewola et al. [37], it was reported that the step number is obtained by setting the step length to hover under each battery and C C along the length of the cooling section ( L c ). Also, in order to ensure the heights of the steps are identical, the height must be an integer. The height of a step is calculated using Equation (3), while its corresponding length is calculated using Equation (4). The N s values designed are 1, 3, 4, 7, 9, 15, and 19, denoted as Z-2-1, Z-2-3, Z-2-4, Z-2-7, Z-2-9, Z-2-15, and Z-2-19, respectively.
H s = H i N s + 1
L s = L c C C l N s + 1

2.1.3. One-Outlet Geometry

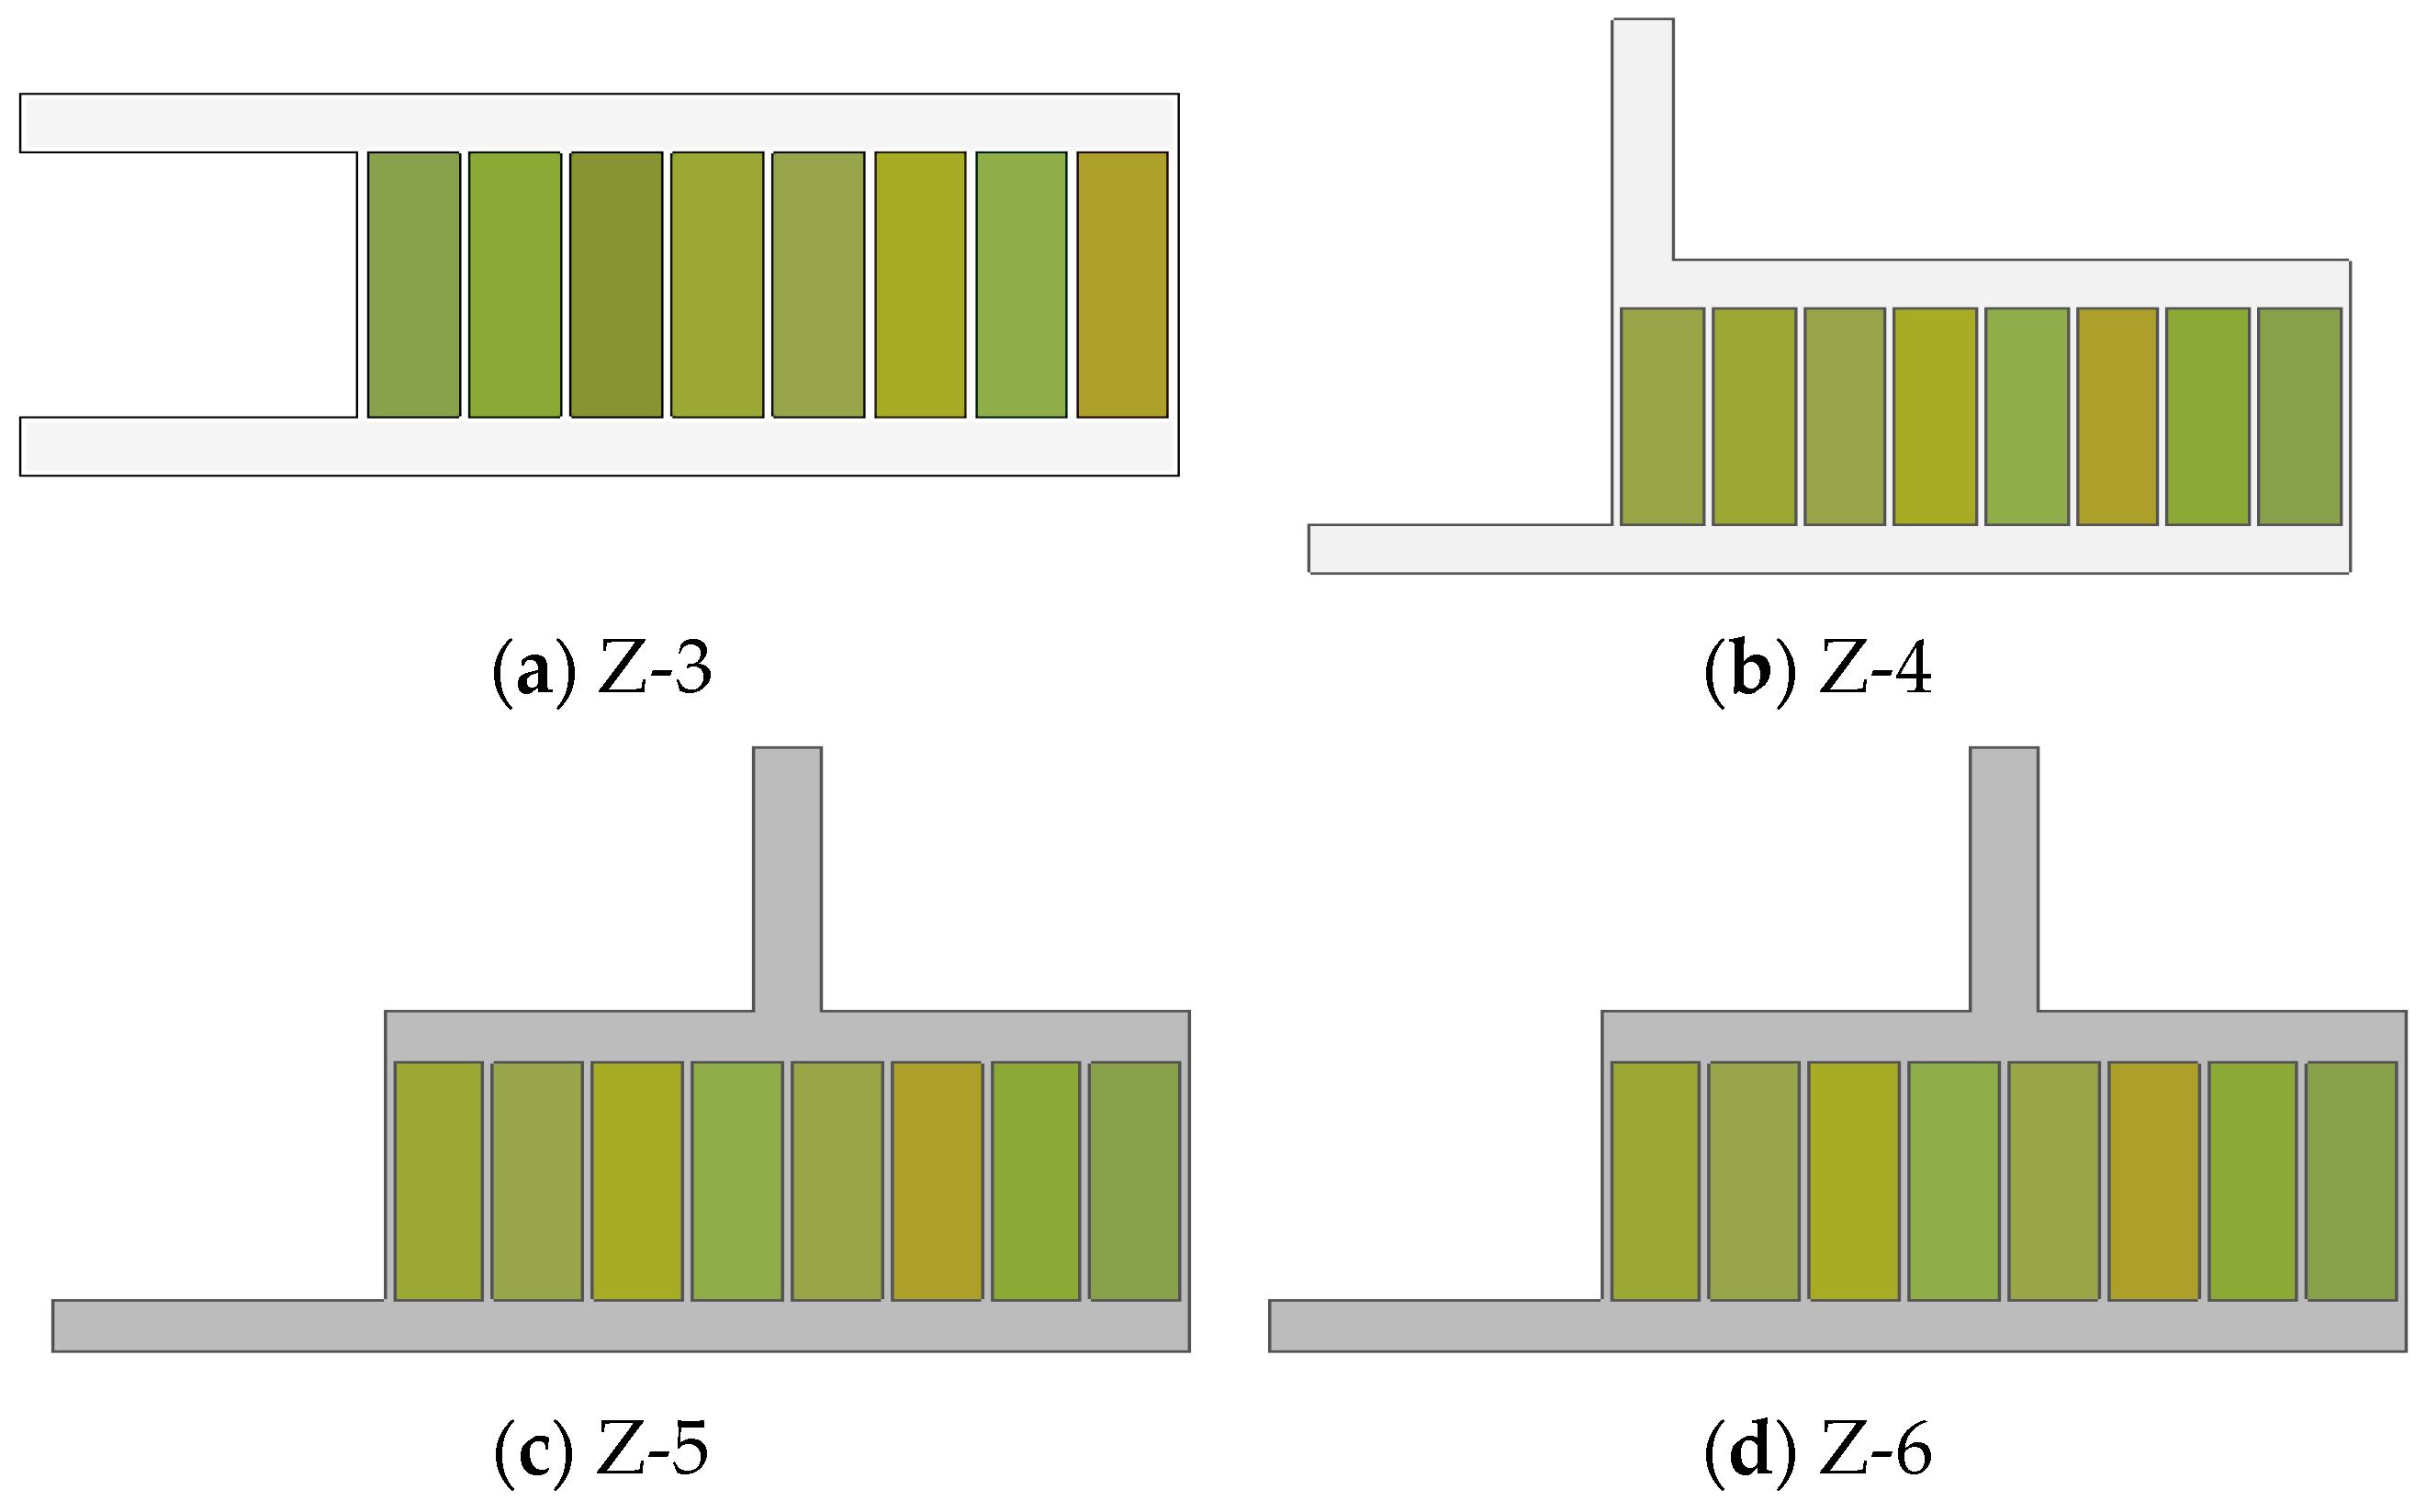
A one-outlet geometry Z-type design simply refers to a design with only one outlet section. In order to enhance the BTMSs’ performances, some researchers have explored novel strategies to offset heat by introducing an extra outlet or creating vents [27,43]. For the one-outlet design, the location of the outlet section was varied, and four different locations, which have been investigated, were selected, whereby the cooling air in the outlet direction becomes perpendicular, parallel, and/or opposite to the cooling air’s direction in the inlet section. These outlet directions have been investigated by researchers [17,31,44] with smooth and modified divergence plenums. The selected four outlet section directions in this study are shown in Figure 3, while their descriptions are presented in Table 3. In addition, each one-outlet geometry is installed with a Step-like design for each of the seven step numbers (1, 3, 4, 7, 9, 15, and 19).

2.1.4. Two-Outlet Geometry

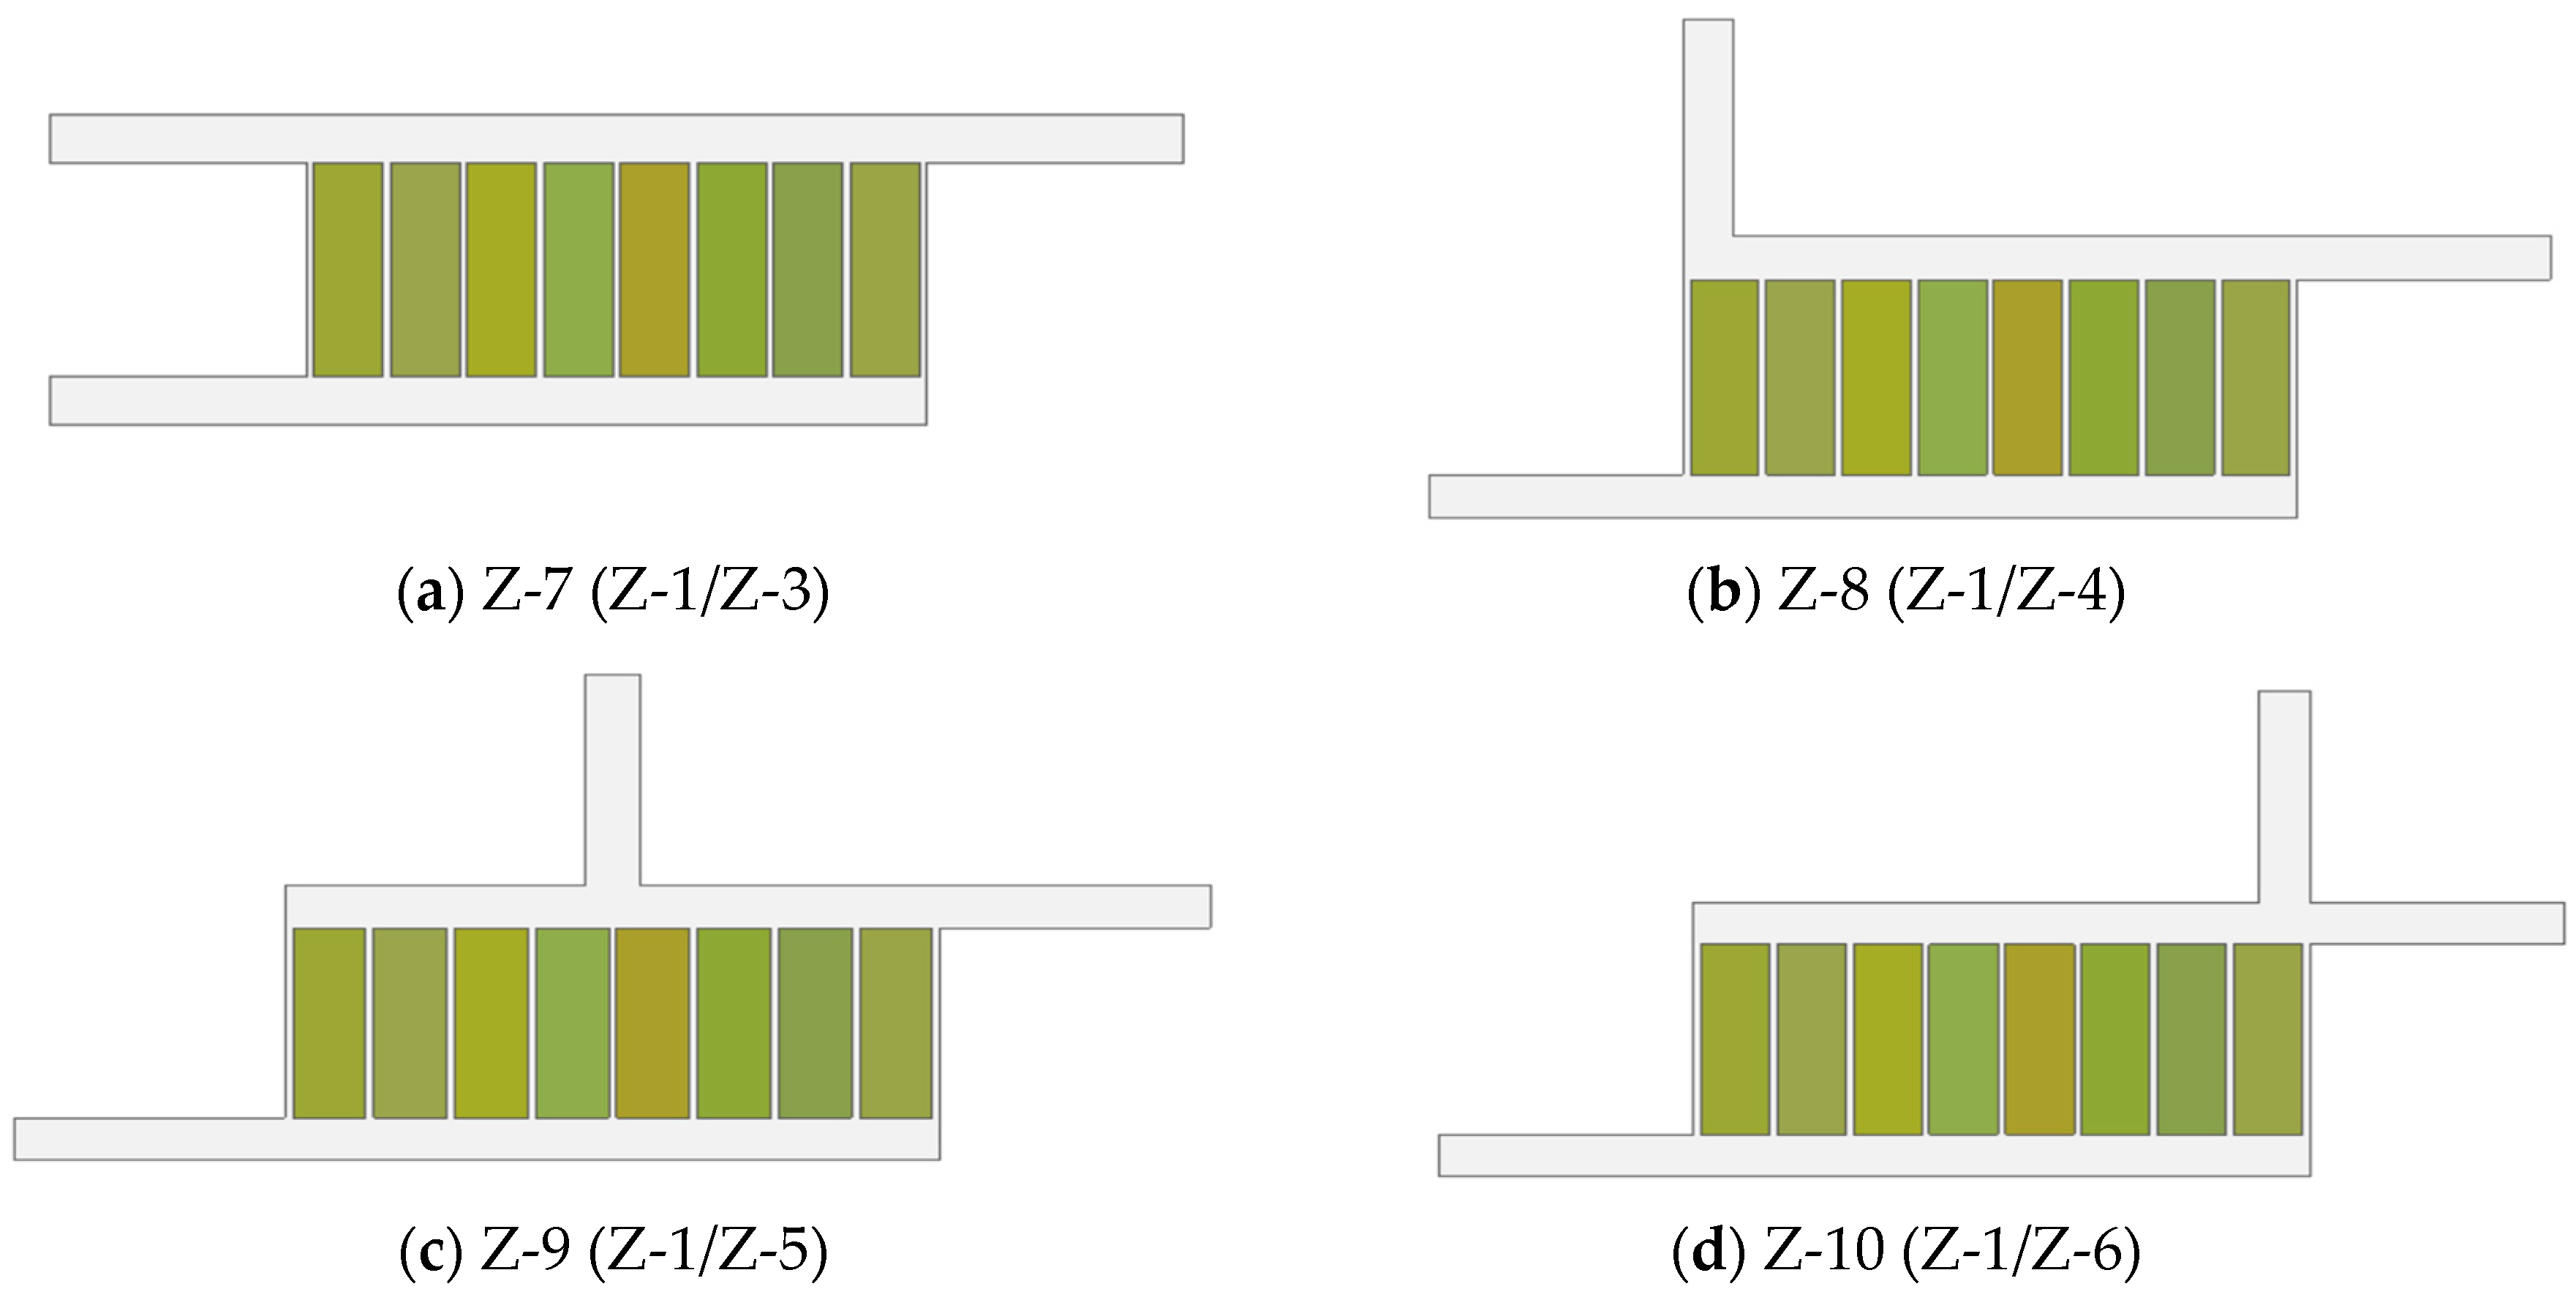
The two-outlet geometry is an approach with two outlet sections, which has attracted attention in the enhancement of the BTMS performance. From previous studies, the position of one outlet has been investigated on almost the entire perimeter of the geometry. However, researchers in recent times have been exploring adding one more outlet, to have two outlets, while interchanging their positions. This method has been explored, and the results have shown that it provides improvement in thermal and hydraulic performances [24,31]. Leveraging the potential of this method, this study investigated introducing two outlets to the Step-like design for each of the seven step numbers (1, 3, 4, 7, 9, 15, and 19). Table 4 presents the descriptions of the two-outlet designs, while Figure 4a–g shows the 2D geometries of the designs.

2.1.5. Combined-Strategy Geometries

The idea of combining different strategies to develop a new BTMS design is an interesting design concept with promising benefits, especially when seeking to enhance thermal performance without significant increases in the overall weights of the systems. In this category, each of the one-outlet and two-outlet geometries is combined with each of the seven Step-like plenum geometries. Figure 5a,b shows typical combined-strategy geometries with one outlet and two outlets, respectively, and four steps.

2.2. Numerical Simulations

In this study, the numerical simulations were based on the 2D geometries of the BTMSs. These simulations can be carried out for either steady-state or unsteady (transient)-state conditions, depending on the results targeted. When modeling Z-type BTMSs in a transient state, the thermal analysis will reach an equilibrium state (stable state) after a period of a continuous cooling time such that further increases in the cooling time will result in no change in the temperature of the batteries at a constant heat generation rate. This phenomenon was illustrated graphically during the transient cooling process of BTMSs in previous studies [33,45]. In cases where the numerical simulation results in the equilibrium state are of interest, a steady-state simulations is employed because a transient simulations takes a longer time to complete. An experimental study by Chen et al. [40] considered transient thermal analysis for both experimental and numerical simulation studies. Similar geometric and operational conditions utilized by Chen et al. [40] were successfully modeled in the steady state by Wang et al. [34] and Oyewola et al. [35]. Hence, all the solutions in this study were set in the steady state to minimize the computation time and cost. This study also employed governing equations, found in most commercial CFD tools, which have been adopted in modeling Z-type BTMSs [35,40], such as the continuity Equation (5) and the momentum Equation (6), for solving the flow problem, and the energy conservation Equation (7), for solving the thermal problem.
·   v   = 0
ρ a d v d t = p + μ a 2   v  
ρ a c p a T a t + · ρ a c p a   v   T a = · k a T a
The Reynolds number, Re, is expressed using the equation:
R e = ρ a V i D h μ a
The hydraulic diameter is expressed using the equation:
D h = 2 W i H i W i + H i
The Reynolds number, Re, expressed using Equation (8), was estimated when the air’s inlet velocity, V i , was 3   m / s , which results in Re = 5825. Because the minimum estimated Re is greater than 3000, the flow is considered to be turbulent. Hence, the turbulence model (a standard k ε model) was selected, expressed as Equations (10) and (11), for the turbulent kinetic energy and kinetic energy dissipation, respectively, while employing an enhanced wall treatment [35,40].
Turbulent kinetic energy equation, k :
t ρ k + x i ρ k u i = x j μ + μ t σ k k x j + G k + G b ρ ε Y M + S k
Turbulent energy dissipation equation, ε :
t ρ ε + x i ρ ε u i = x j μ + μ t σ ε ε x j + C 1 ε ε k G k + C 3 ε G b C 2 ε ρ ε 2 k + S ϵ
The turbulent viscosity is given as follows:
μ t = ρ C μ k 2 ε
The values of the model constants used in Equations (10)–(12) are C 1 ε = 1.44 ,     C 2 ε = 1.92 ,     C μ = 0.09 , σ k = 1.0 , and σ ϵ = 1.3 .
The SIMPLE algorithm was selected for solving the governing equations. Additionally, convective and diffusive terms were discretized using central differencing and second-order terms, respectively. Convergence iteration residuals were set at 10−7 and 10−8 for flow terms and energy terms, respectively. The solution generally considered the following assumptions [33,35]:
  • The properties of the batteries and air are constant;
  • The air inlet flow is stable and incompressible;
  • The effect of the radiation is negligible;
  • The inlet air’s velocity and temperature are constant.
The battery energy conservation Equation (13) [40,42] is
ρ b c p b T t = · k b T + Q b
In this study, the BTMSs’ performances were generally evaluated by comparing the average temperature of each battery in the pack. Previous studies on Z-type BTMSs have measured the maximum temperature of the second battery ( T 2 ), denoted as “ T m a x ”, while the minimum temperature was at the eighth battery ( T 8 ) , denoted as T m i n [34,35,37,40]. The difference between T m a x and T m i n , also known as the maximum temperature difference of the batteries, T m a x , is expressed as in Equation (14).
The battery’s maximum temperature difference is expressed as follows:
T m a x = T m a x T m i n
The pressure drops ( P ) across the BTMSs were also estimated using Equation (15). It is the difference between the average pressures at the inlet and outlet(s).
P = P i P o
The P value of the BTMS is associated with the pumping power, which, consequently, may result in increasing the pumping cost.

2.3. Boundary Conditions

For the inlet section, the air velocity (3 m/s) and temperature (299.15 K) boundary conditions were initially assigned to be constant [34,37]. Additional solutions were carried out at inlet velocities of 3.5 m/s and 4 m/s, while the other settings remained the same. In general, the following assumptions were considered for the simulations [34,35,37]:
  • The heat generation rate assigned to the battery’s surface was constant;
  • The zero (0)-gauge outlet pressure condition was assigned;
  • On the battery walls and inner walls of the systems, the no-slip condition was assigned;
  • An adiabatic wall was assigned to the entire surrounding wall of the systems;
  • The surrounding temperature and pressure were constant;
  • The contacting surfaces were set as coupled.

2.4. Meshing and Independence Study

All the geometries considered in this study were meshed on the ANSYS meshing platform. When setting up the meshing, five inflation layers were assigned at the boundary walls of the batteries, air domain, and system, while a height of 0.1 mm was set for the first layer ( y + ) [33,34,37].
The mesh size can be improved by varying the element size and selecting several other options available in ANSYS to produce coarse or fine meshes, which can significantly influence the result obtained. However, by taking into consideration the available computation resources and time availability, a mesh independence study was carried out. This ensures that the solution is accurate at the minimum computational time possible. This targets the minimum possible number of elements from a meshed design, which results will have a negligible difference when results with a high number of elements are used [33,34,37]. Meshes were compared for seven element sizes ranging from 0.00065 to 0.00035 at 0.00005 intervals, and the corresponding numbers of elements for these element sizes are 121,383; 140,625; 166,368; 198,584; 244,027; 308,204; and 400,154, respectively. The independence study performances are further presented graphically in Figure 6a,b. As the number of elements increases from 308,204 to 400,154, the variation in the parameters was negligible, with differences of 0.02 K, 0.01 K, 0.03 K, and 0 Pa for T m a x , T m i n , T m a x   , and P , respectively. Therefore, the mesh setup that produced a mesh size of 400,154 was used for simulating other models.

2.5. CFD Method Validation

The results obtained from the simulations were compared with the experimental results, which has also been performed in previous studies for the original Z-type BTMS [28,33,34,37], by comparing the simulation results with the experimental results of Chen et al. [40]. The primary parameters used for the comparison are the average battery temperatures measured for the air’s inlet velocities of 3, 3.5, and 4 m/s. In this study, the average battery temperatures were measured, which also show very good agreement with the experimental results of Chen et al. [40]. Figure 7a,b presents the comparison for the maximum ( T m a x ) and minimum ( T m i n ) values, which were also measured for the second and eighth batteries, respectively. Figure 8a–d illustrates the 2D physical geometry, selected mesh, temperature contour, and air-velocity contour of the reference Z-type BTMS. From the comparison, maximum differences of 1.6 K (0.5%) and 0.65 K (0.2%) were obtained for T m a x and T m i n , respectively. Zhang et al. [46], reported that differences of up to 2% can be considered as negligible. Interestingly, the estimated values obtained in this study are below 2%. Therefore, the CFD method is considered as acceptable.

3. Results and Discussion

In the development of BTMSs where air is the cooling fluid, it is important to minimize P while maintaining the battery temperature or possibly minimizing the temperature. P minimization is necessary because it corresponds to a reduction in the pumping cost. When focusing on minimizing the battery temperature, it is also important to ensure that it does not go below the recommended temperature. Hence, T m a x   among the batteries is evaluated, which compares the thermal uniformity or homogeneity of the batteries in a BTMS. Based on these criteria, the designs will be compared based on T m a x , T m a x   , and P . In general, a total of 95 geometries were developed, and the simulation results for each geometry were obtained at the air’s inlet velocity and a temperature of 3 m/s and 299.15 K, respectively.

3.1. Evaluation of T m a x Performances

One of the parameters considered for the thermal performances of BTMSs is T m a x . In order to avoid the overheating of batteries and thermal runaway, it is imperative to design a BTMS such that T m a x is minimized and maintained below the maximum recommended working temperature. In this section, the T m a x values of the different designs are compared.

3.1.1. Tmax Performances of Step-like Plenum, One-Outlet, and Two-Outlet Geometries

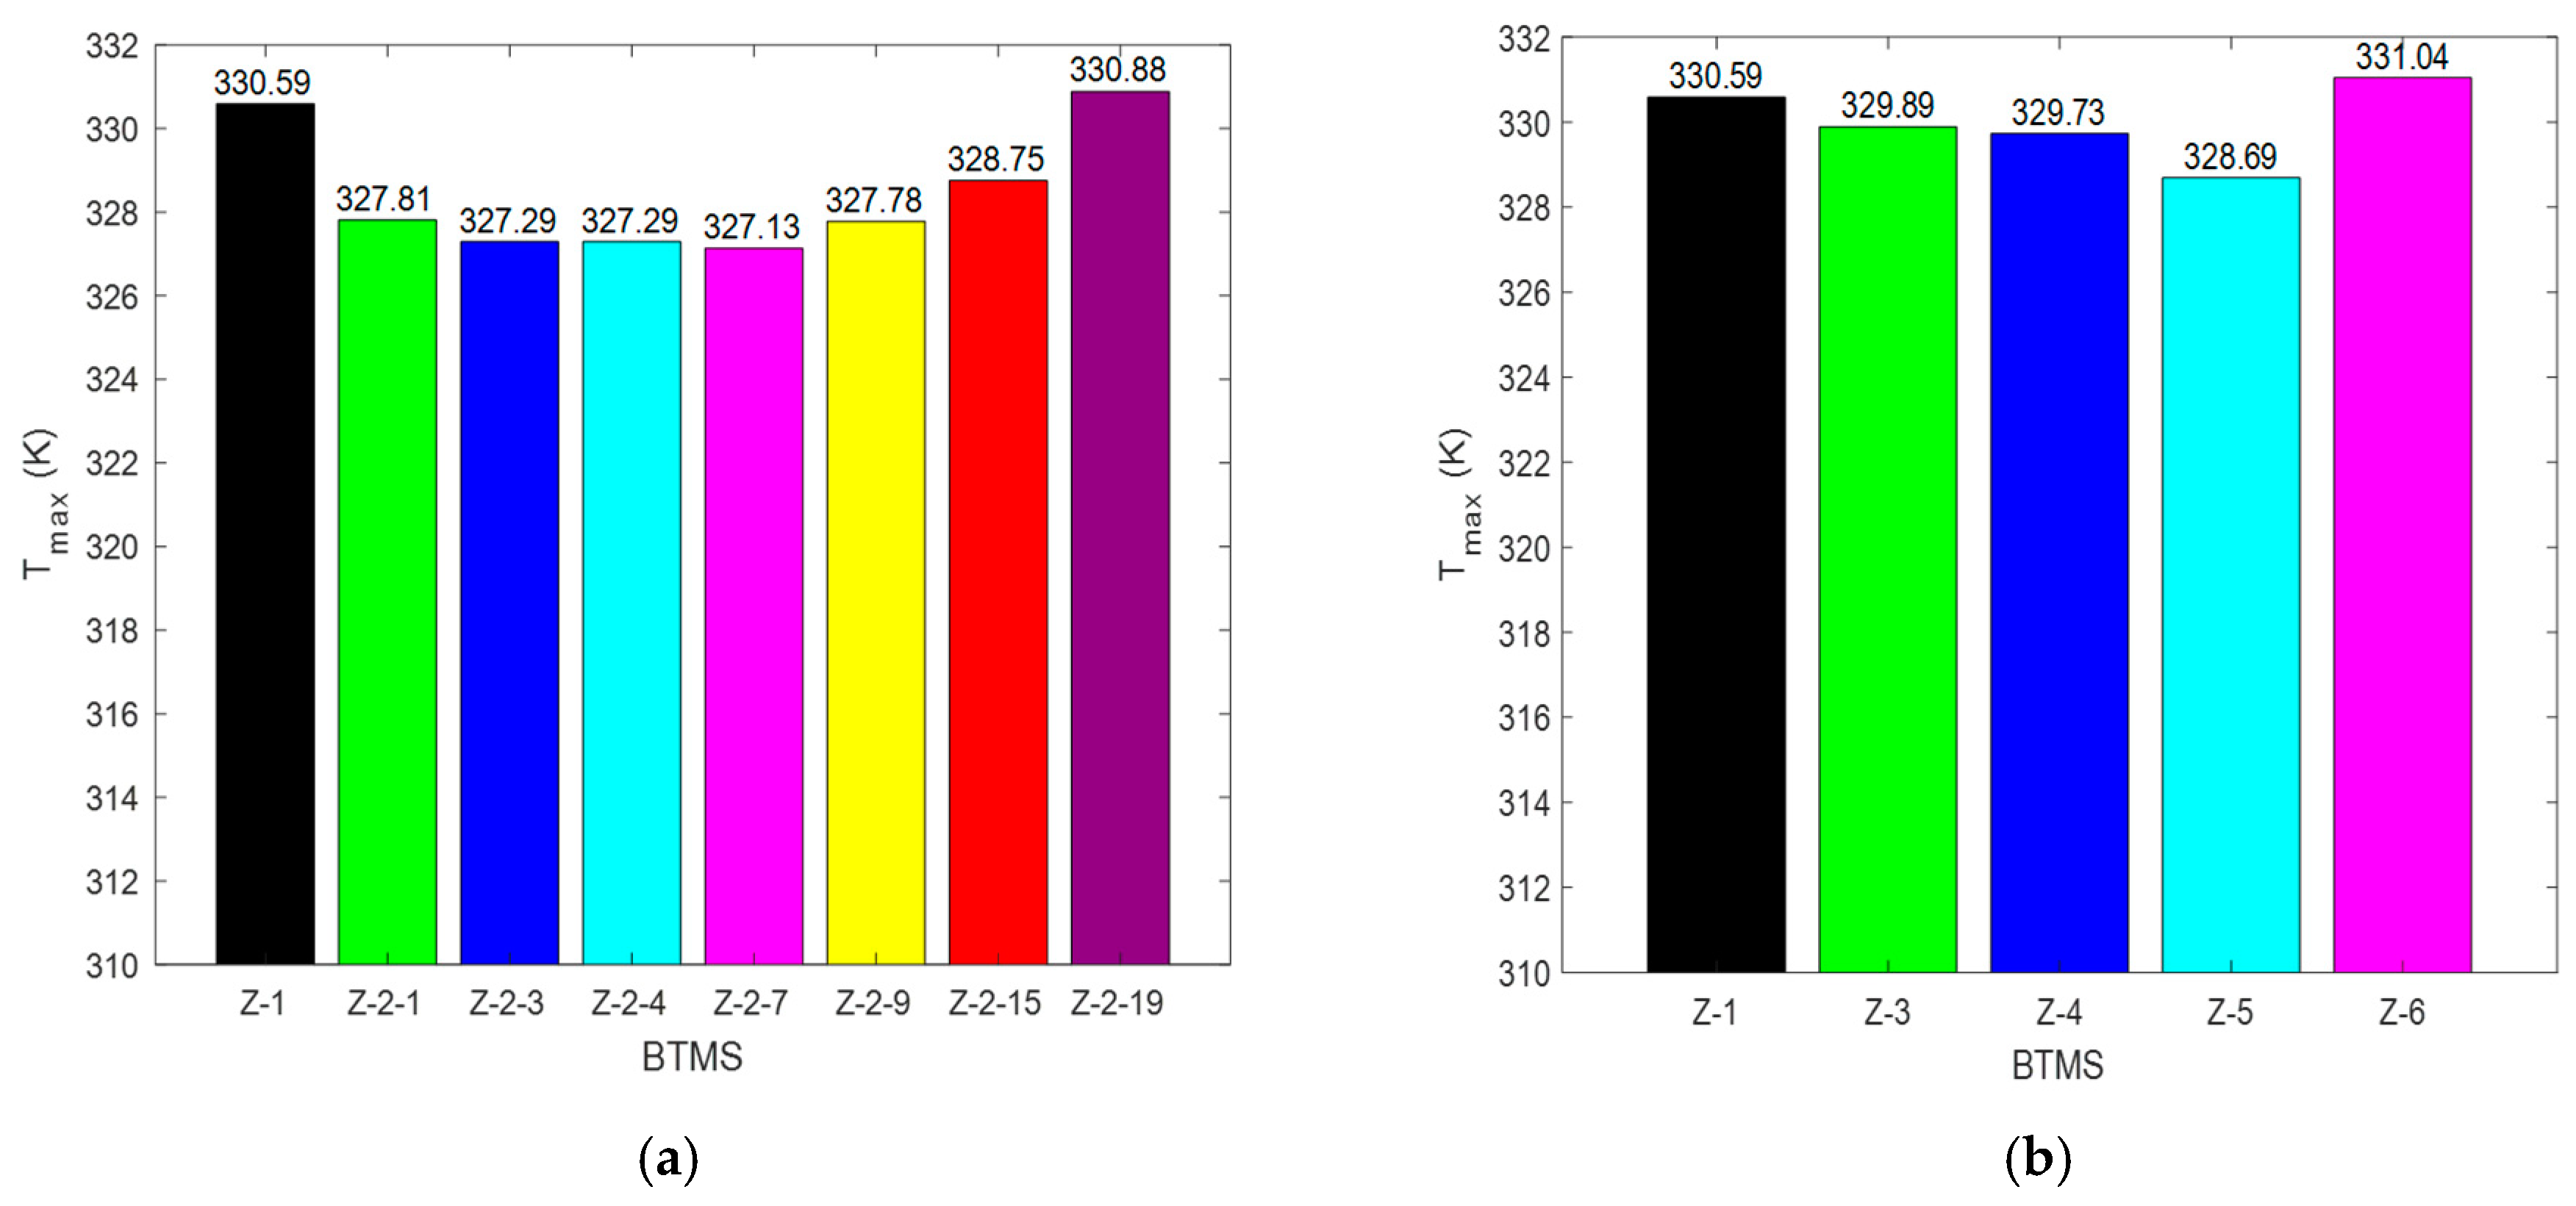
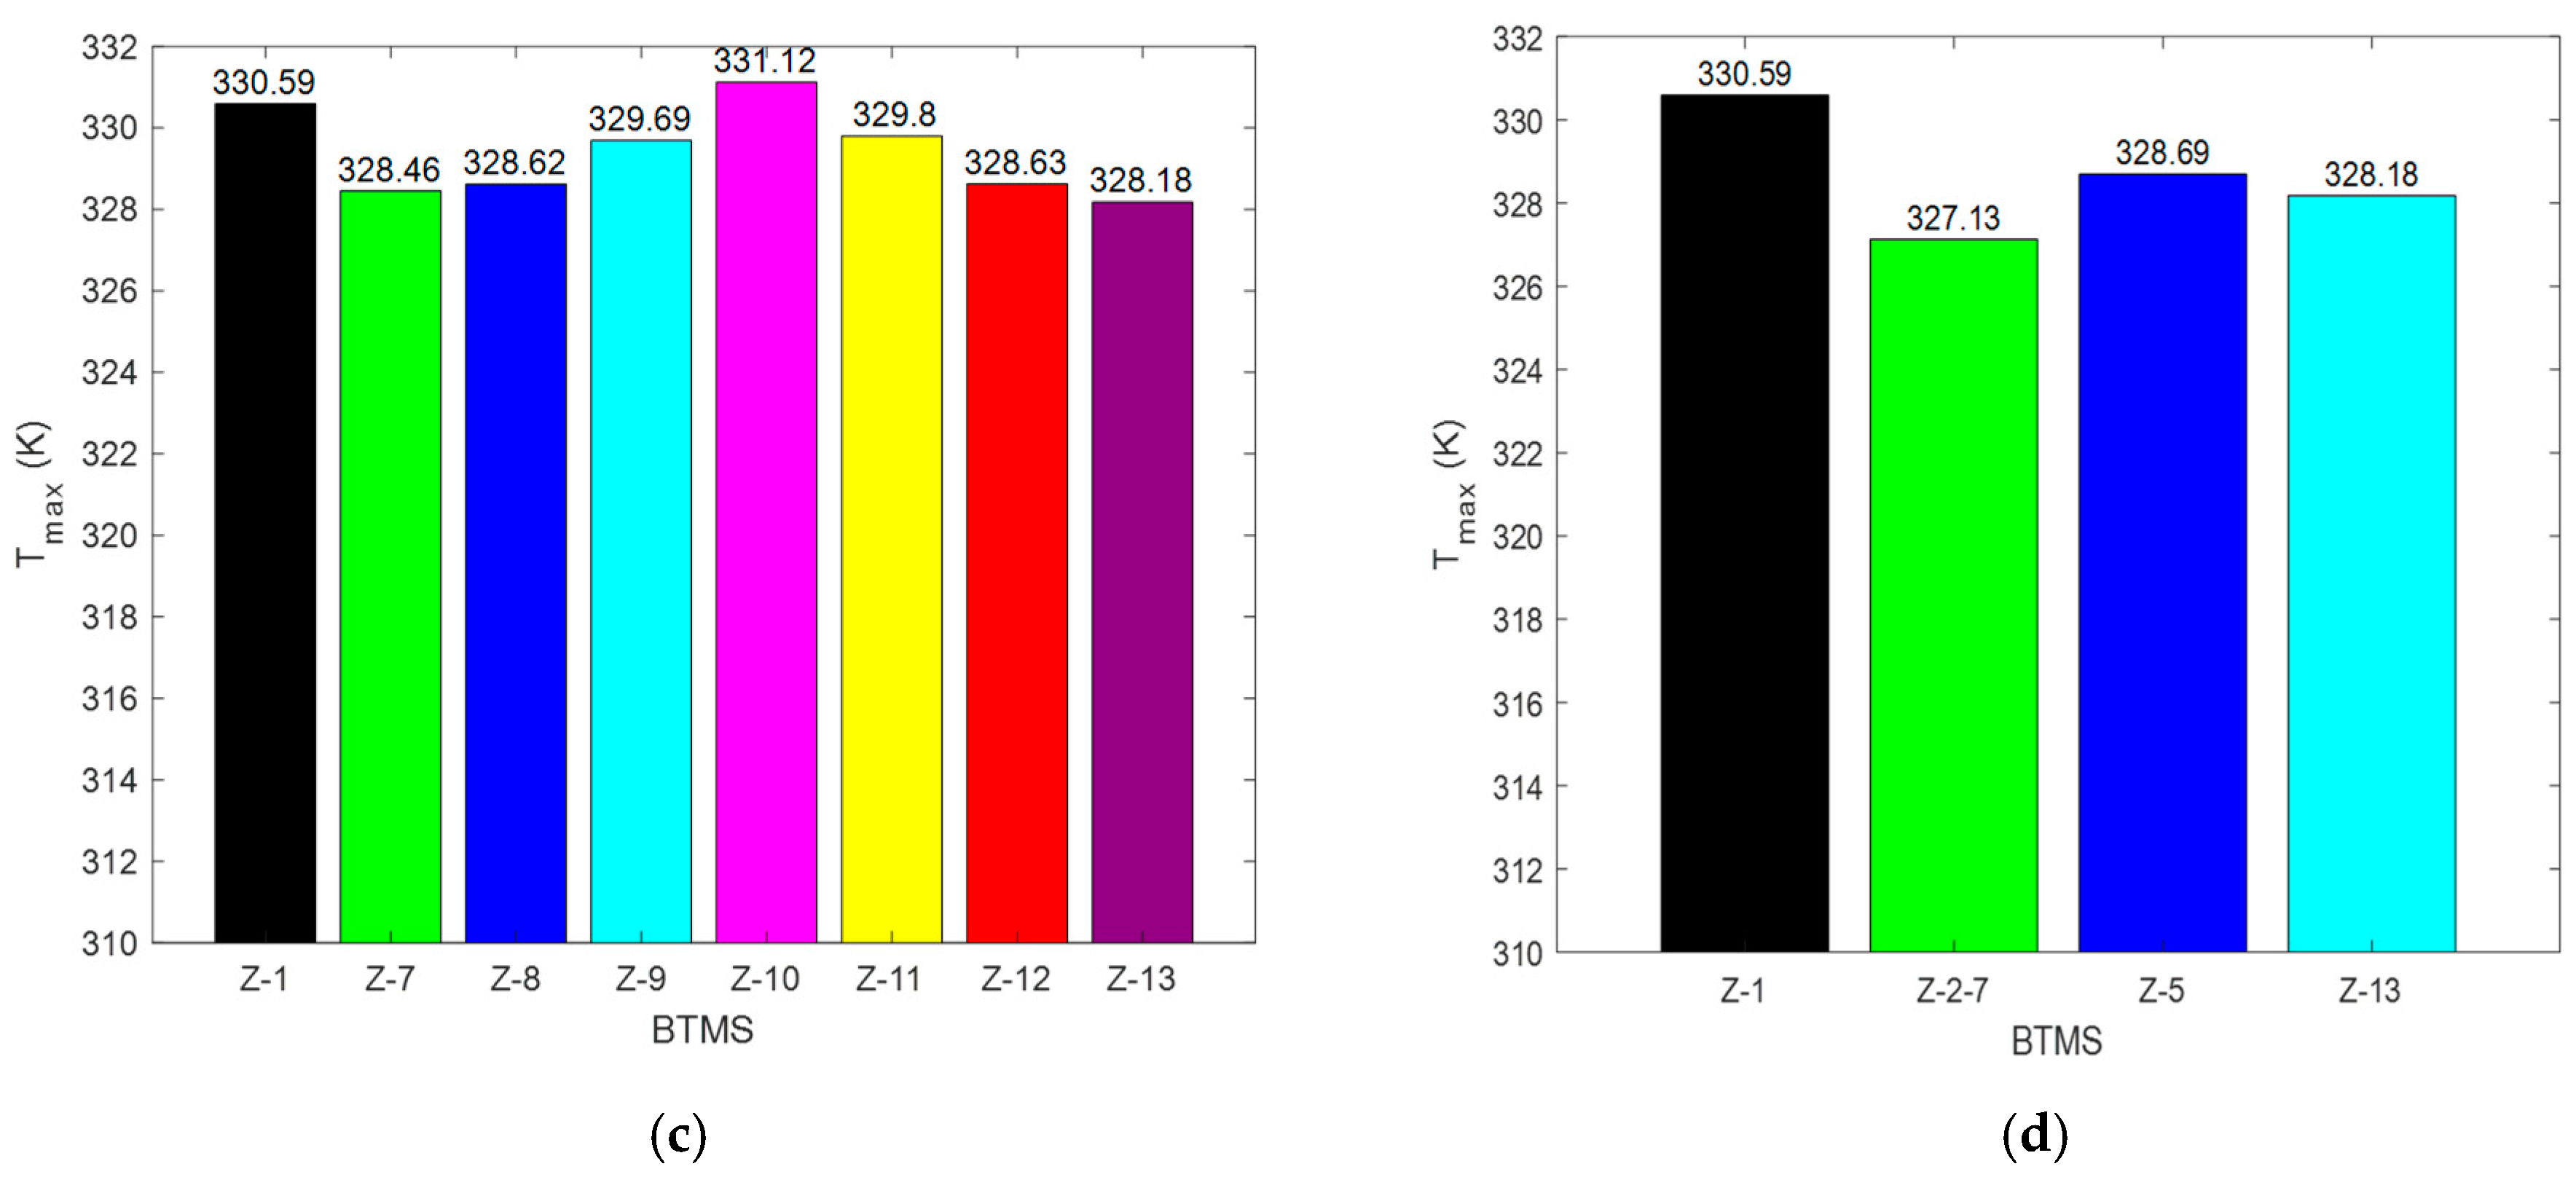
In this subsection, the T m a x values for the Step-like plenum, one-outlet, and two-outlet designs are compared. Afterward, the best-performing designs (with the minimum T m a x values) from each group are also compared. Figure 9a–c shows the variations in T m a x for the Step-like plenum, one-outlet, and two-outlet designs, respectively, while Figure 9d shows the variation in T m a x among the best-performing designs in the three aforementioned groups. Furthermore, Figure 10a–d shows the temperature contours of the Z-1, best Step-like plenum, best one-outlet, and best two-outlet designs, respectively. The contours show the temperature variation of the cooling air and the batteries in the systems. For instance, in Figure 10a, the inlet section is dominated by cold air, and in its legend, the “blue” color corresponds to the lower-temperature section. However, the most important temperature distributions are those observed among the batteries. Based on the legend’s color, is it obvious that the highest temperature in the system was recorded for the batteries, and this was observed for only four batteries. This performance implies that there will be a significant difference in temperature between the first battery and the eighth battery, a phenomenon that indicates poor thermal homogeneity and excess heat accumulation among the four batteries. In order to better understand why Figure 10a shows this poor performance, the distribution of the temperature on the BTMS’s contour in Figure 10b is described. In this case, the temperature spreads across the eight batteries, indicating very good thermal homogeneity and the eventual reduction in the maximum temperature, as shown in the two legends. Similar performance distribution trends are used for other designs, and by comparing the contours in Figure 10 with the results in Figure 9d, it can be seen that the contours provide good insight into the performance of this system. First, in the Step-like plenum category in Figure 9a, where seven different numbers of steps (1, 3, 4, 7, 9, 15, and 19) were investigated, the seven-step design denoted as “Z-2-7” produced the best T m a x = 327.13     K , with a reduction by 3.46 K compared with that of the original Z-type design, denoted as “Z-1”, in this study. Designs Z-2-3 (three steps) and Z-2-4 (four steps) also produced good performances, both with reductions in T m a x by 3.30 K. The poorest of the Step-like plenum designs is Z-2-19 (nineteen steps), which happens to be the only Step-like plenum design that increased T m a x , with an increase of 0.29 K compared to that of the original Z-type (Z-1) design. For a step design, any modification to another part of the structure, aside from the step, will affect the performance of the BTMS for the same number of steps. Previous studies on the step design have revealed that increasing the number of steps serially does not always result in corresponding increases or decreases in the temperature or pressure drop. However, higher numbers of steps, e.g., 15 and 19, have shown poor performances, which has been reported in previous studies [37,39]. An explanation for this is the fact that the concept of the step design for one and two steps produced poor thermal homogeneity, while for fifteen and nineteen steps, the plenum’s area decreases; hence, the air becomes insufficient to cool down the batteries at that end of the plenum. Figure 9b presents the comparison between the one-outlet designs. From the figure, it can be seen that design Z-5 performed better than the other designs, with a reduction in T m a x by 1.9 K compared with that of the Z-1 design.
Furthermore, compared to the Z-1 design, the Z-3 and Z-4 designs also produced better performances, with reductions in T m a x by 0.7 K and 0.86 K, respectively, while design Z-6 produced a poor performance, with an increase in T m a x by 0.45 K. Figure 9c presents the comparison of the T m a x performances for the two-outlet designs. Out of the seven designs considered in this category, only Z-10 (Z-1/Z-6) failed to produce a better performance than that of the Z-1 design, increasing T m a x by 0.53 K. The other six designs produced reductions in T m a x , with the Z-13 (Z-3/Z-6) design having the best performance, with a reduction in T m a x by 2.41 K compared to that of the Z-1 design. The best-performing designs from the three categories were compared and are presented graphically in Figure 9d. From the figure, it can be seen that Z-2-7 produced the best T m a x performance. Interestingly, in the Z-13 design, a combination of two different outlets (Z-3/Z-6) performed better than the Z-5 design, which happens to be the best-performing design among the one-outlet designs, with a reduction in T m a x by 0.51 K.

3.1.2. Tmax Performances of the Combined-Strategy Geometries

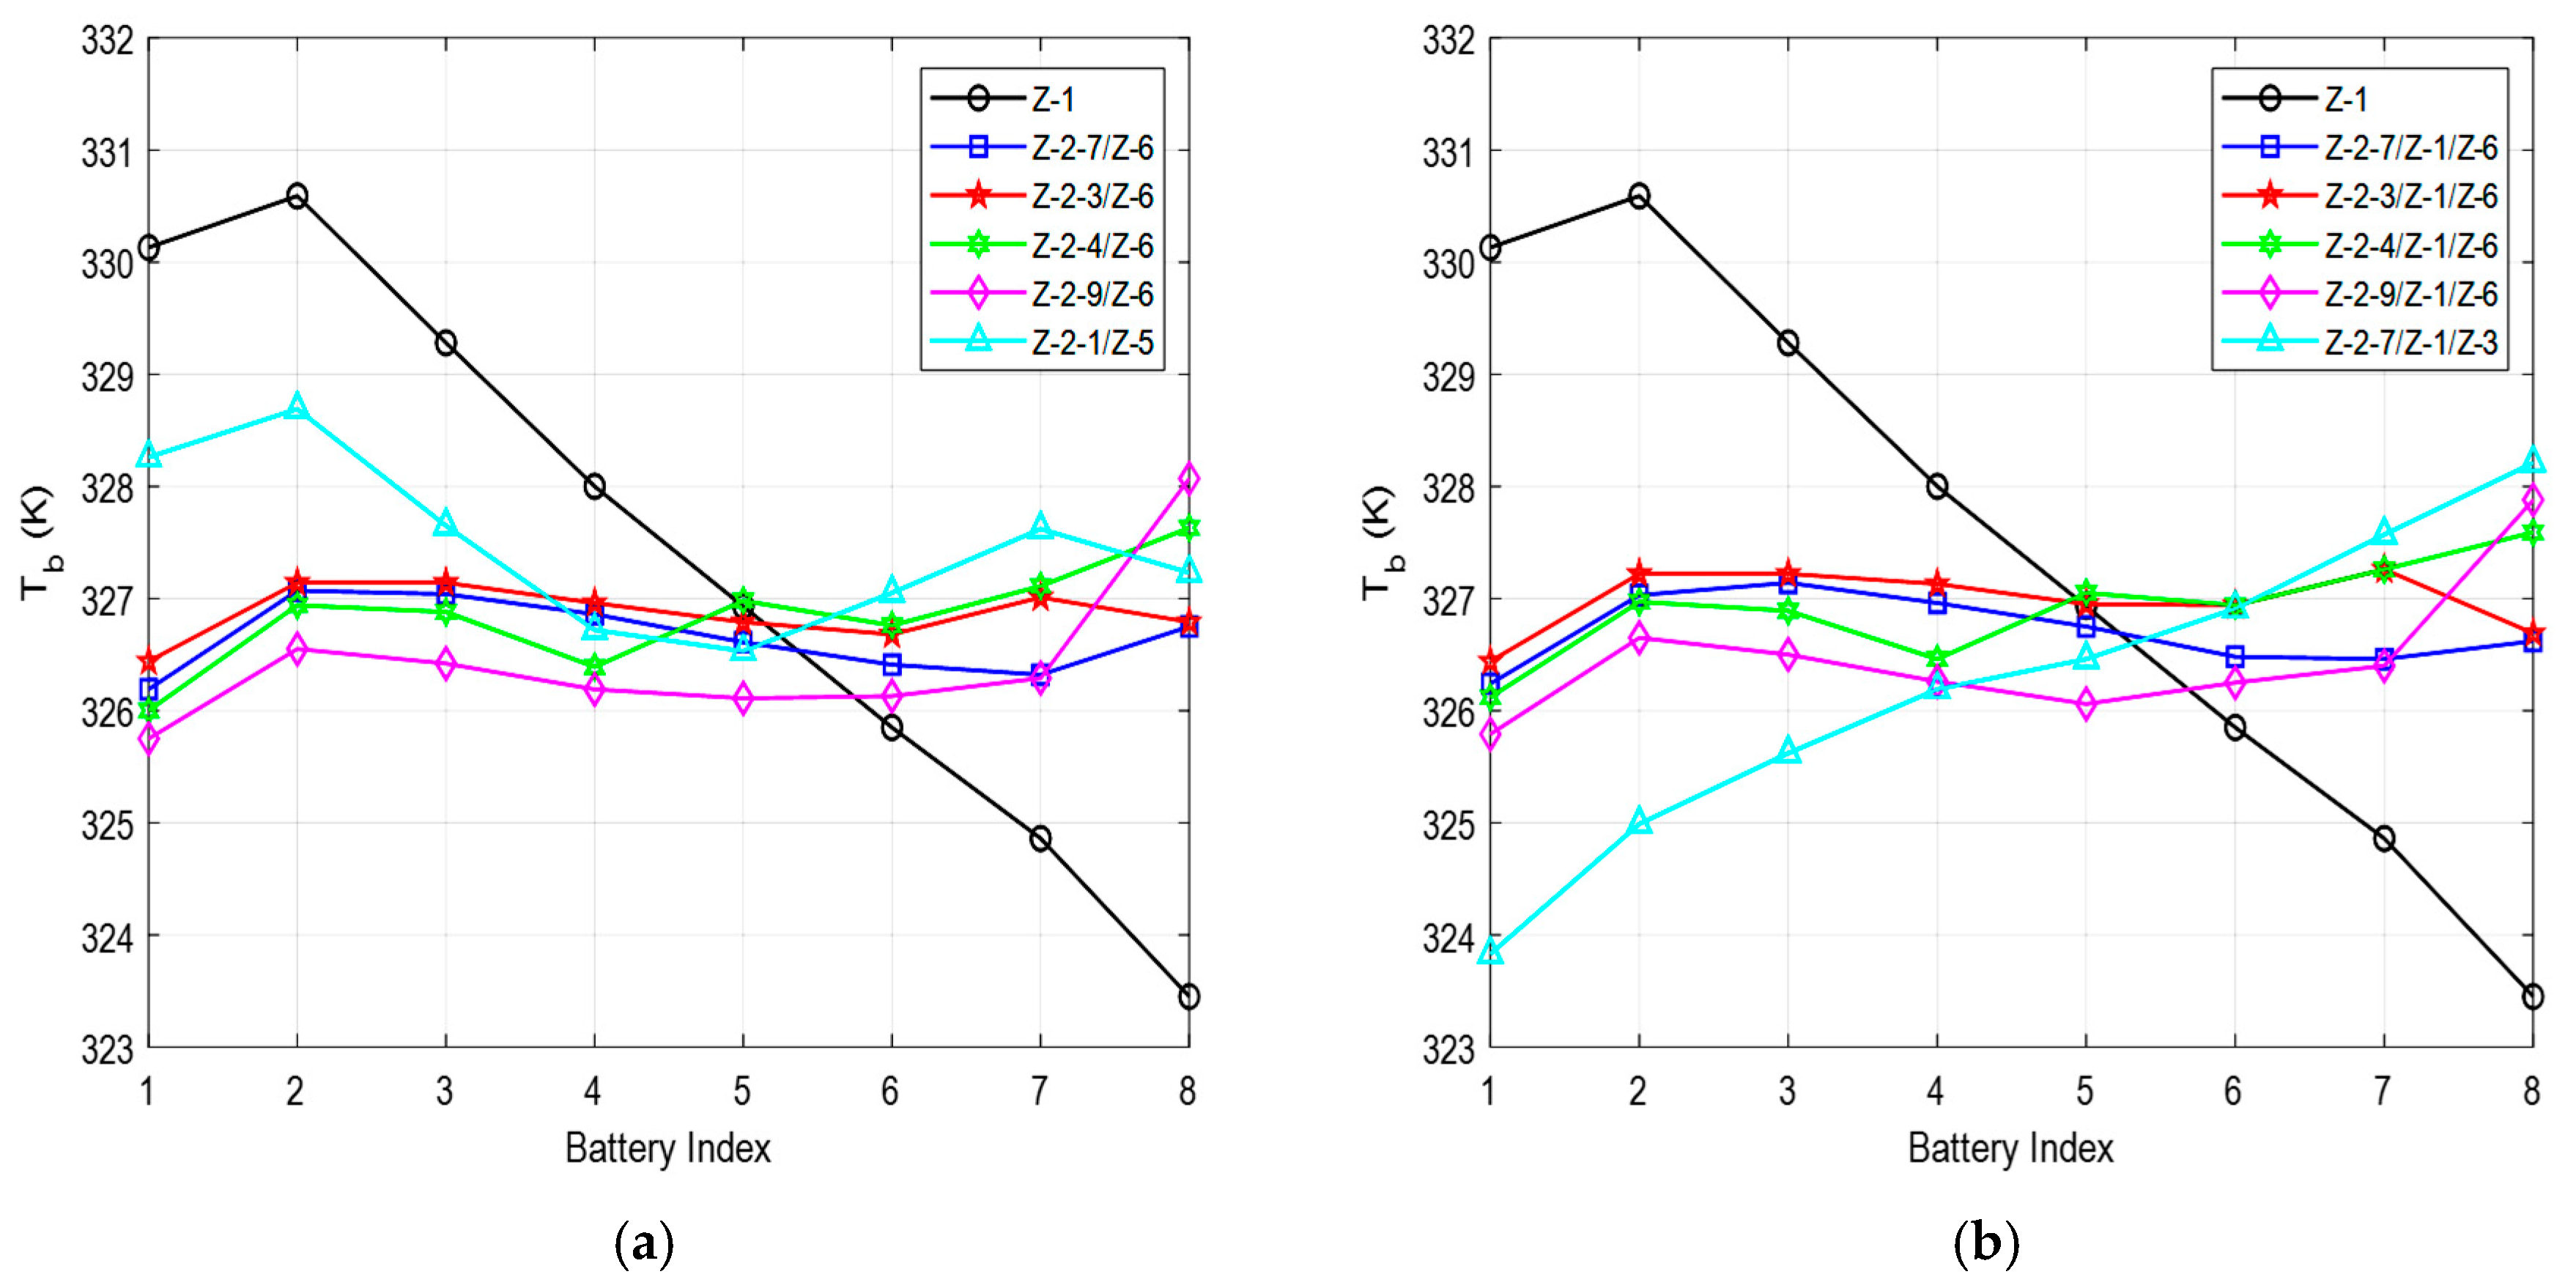
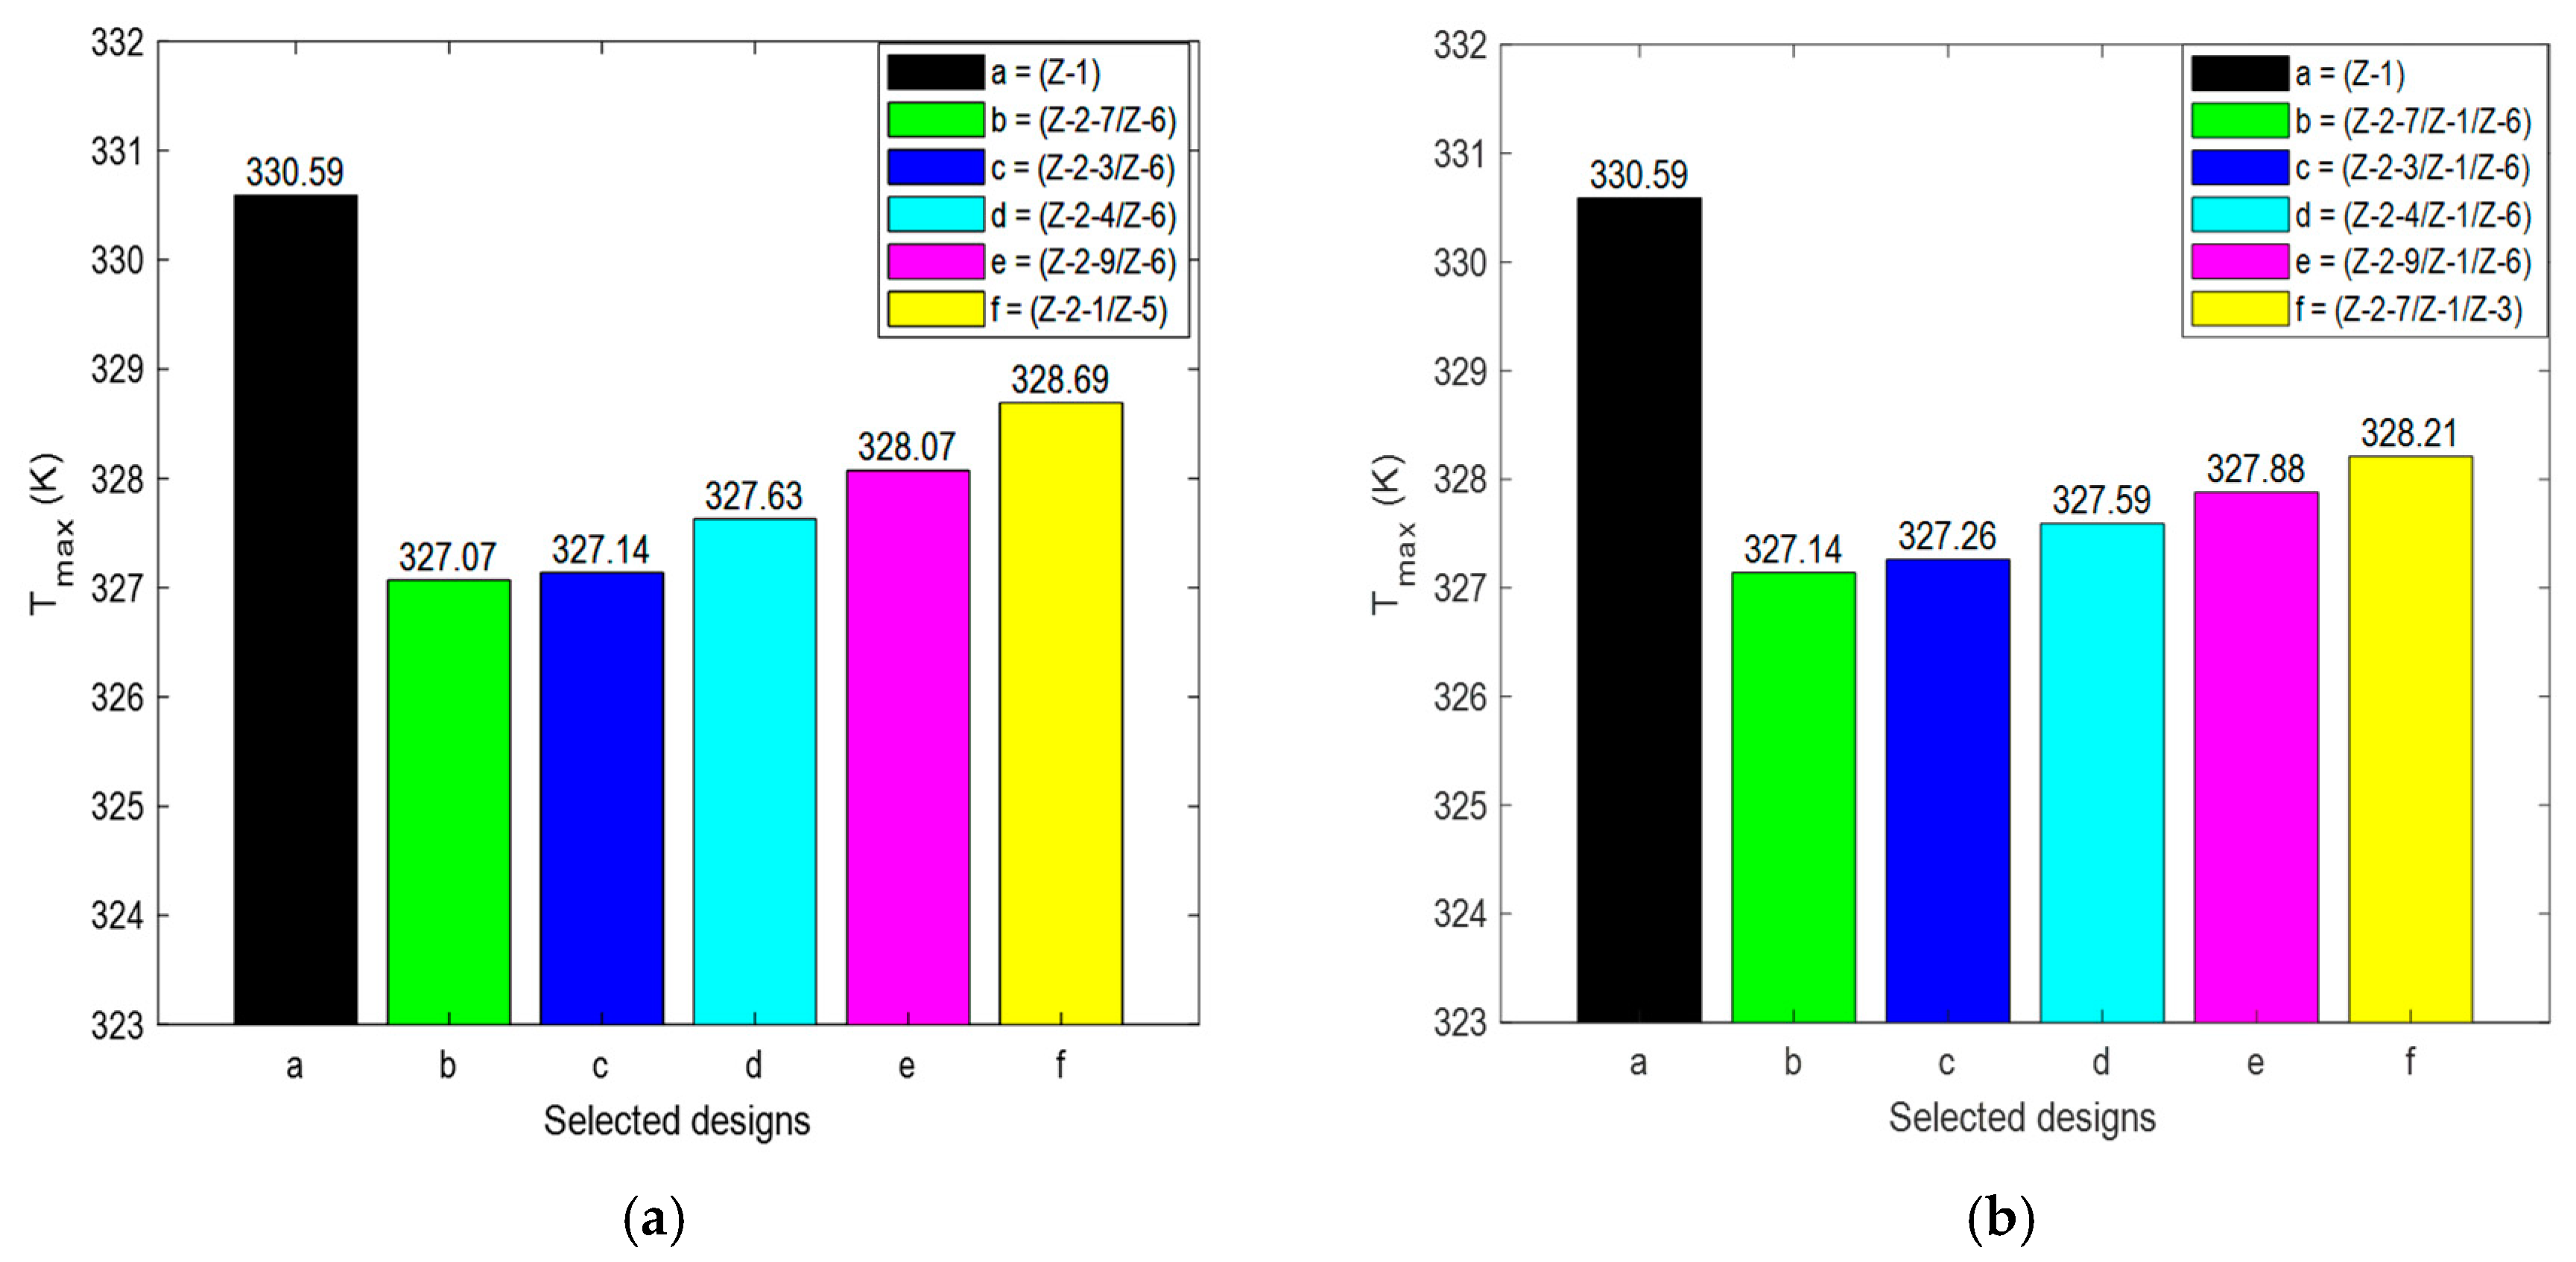
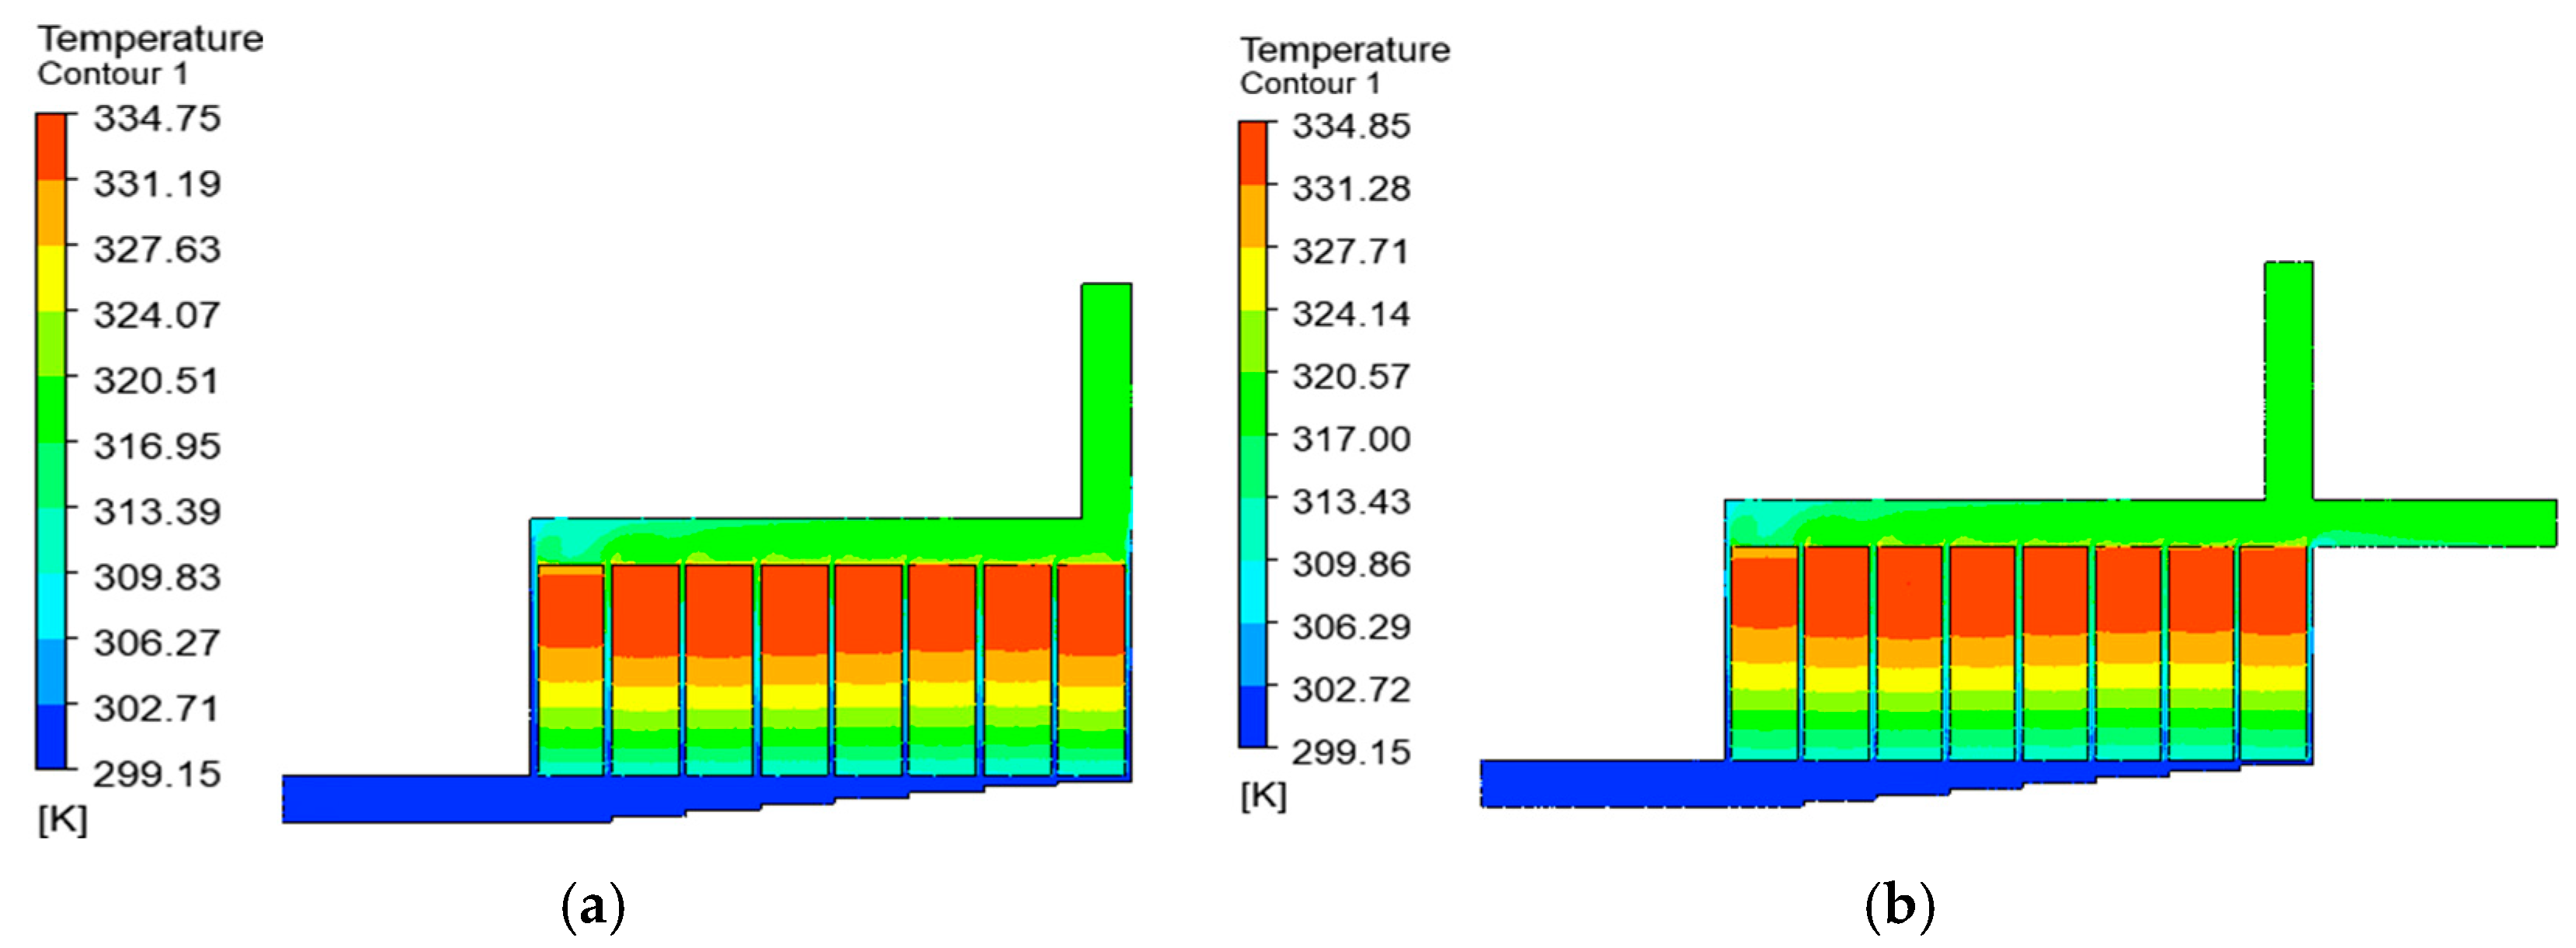
The combined-strategy geometries explore the combination of Step-like plenum designs for the considered numbers of steps with the one-outlet designs and two-outlet designs. This implies that each of the four one-outlet designs was investigated when 1, 3, 4, 7, 9, 15, and 19 steps were installed, summing up to twenty-eight designs. Similarly, each of the seven two-outlet designs was investigated for the seven different numbers of steps, summing up to forty-nine designs. These designs were compared, and the best five designs in the two combination groups were selected and are presented in Table 5. Figure 11a,b shows the temperature distribution of the batteries for the combined-strategy geometries with one outlet and two outlets, respectively. The comparison of T m a x values for the best five performing designs for one outlet and two outlets is presented in Figure 12a,b, respectively. Lastly, the temperature contours of the optimal designs in the one-outlet and two-outlet groups are presented in Figure 13a,b. In Figure 11a,b, the reference Z-type design, denoted as Z-1, is compared with the designs in the two combination groups. The temperature distribution reveals the temperature uniformity of the best-performing design when compared with those of the reference Z-1 designs.
Figure 12a,b further presents the comparison between the designs in terms of their T m a x values. Comparing the one-outlet designs, shown in Figure 12a, the best-performing design is Z-2-7/Z-6, with a minimum T m a x value of 327.07 K. When compared with the Z-1 designs, it produced a reduction in T m a x by 3.52 K. Considering the two-outlet designs, presented in Figure 12b, Z-2-7/Z-1/Z-6 produced a minimum T m a x value of 327.14 K, and when compared with the reference Z-1 designs, it produced a reduction in T m a x by 3.45 K. These performances show that both one outlet and two outlets can be combined with a Step-like plenum design to achieve a good reduction in T m a x . Another intriguing performance shows that Z-2-7/Z-6 also performed better than the initial best Step-like plenum design, which was earlier reported to have performed better than the reference Z-type design without steps. The Z-2-7/Z-6 design reduced the T m a x of the best reference Step-like plenum design by 0.06 K.

3.2. Evaluation of T m a x Performances

T m a x is also an important parameter used in evaluating the performance of a BTMS with more than one battery in a pack. This parameter shows the ability of a design to uniformly distribute heat generation in the battery pack, thereby avoiding the overheating of one battery, while the other batteries are at a significantly lower temperature. Such a phenomenon is often regarded as thermal homogeneity. Previous studies in the literature have shown that designs with low T m a x values produce thermal performances with low T m a x values. However, one design can produce a lower T m a x value compared to that of another design under the same operating conditions while still having a higher T m a x value, although the difference between the T m a x values may not be significant [28,34,35,44,47]. A better T m a x value is, however, very important in designs where the cooling air enters the system at extremely low temperatures because any small irregularity of a battery can affect the chemical reaction through a sharp decline in its operating temperature.

3.2.1. T m a x Performances of Step-like Plenum, One-Outlet, and Two-Outlet Geometries

This subsection focuses on the comparison of the T m a x values for the Step-like plenum, one-outlet, and two-outlet designs. The optimal designs (with the minimum T m a x values) in all the design groups are then considered for further comparison. Variations in T m a x for the Step-like plenum, one outlet, and two outlets, are shown in Figure 14a–c, respectively, while Figure 14d presents the variation of T m a x between the best-performing designs in the earlier-mentioned groups. In addition, the temperature contours of the Z-1, best Step-like plenum, best one-outlet, and best two-outlet designs are shown in Figure 15a–d, respectively.
For the Step-like plenum designs in Figure 14a, the three-step design, denoted as “Z-2-3”, produced the best T m a x performance, with a recorded value of 0.74 K. When compared with the T m a x value of the Z-1 design, the T m a x value of Z-2-3 reduced by 6.4 K. In general, as shown in Figure 14a, every Step-like plenum design produced a good T m a x performance, with Z-2-4 (four steps) and Z-2-7 (seven steps) producing reductions by 5.84 K and 6.22 K, respectively, compared with that of the Z-1 design. Figure 14b shows the performances of the one-outlet designs. Design Z-5 has the minimum T m a x value, recorded at 2.16 K, and compared with the T m a x value of the reference Z-1 design, produced a reduction by 4.98 K. The remaining one-outlet flow designs also produced T m a x reductions by 2.45 K, 1.85 K, and 0.46 K for Z-3, Z-4, and Z-6, respectively. Figure 14c shows the performance comparison of the two-outlet designs. The results revealed that design Z-10 produced the poorest performance, while design Z-13 produced the best, with T m a x values of 6.93 K and 1.37 K, respectively, and reductions by 0.21 K and 5.77 K, respectively, compared with that of the reference Z-1 design. The best-performing designs selected from Figure 14a–c were also compared and are presented in Figure 14d. The results revealed that design Z-2-3 has the best performance, with a T m a x value of 0.74 K, and when compared with the performances of the Z-5 and Z-13 designs, produced reductions by 1.42 K and 0.63 K, respectively.

3.2.2. T m a x Performances of the Combined-Strategy Geometries

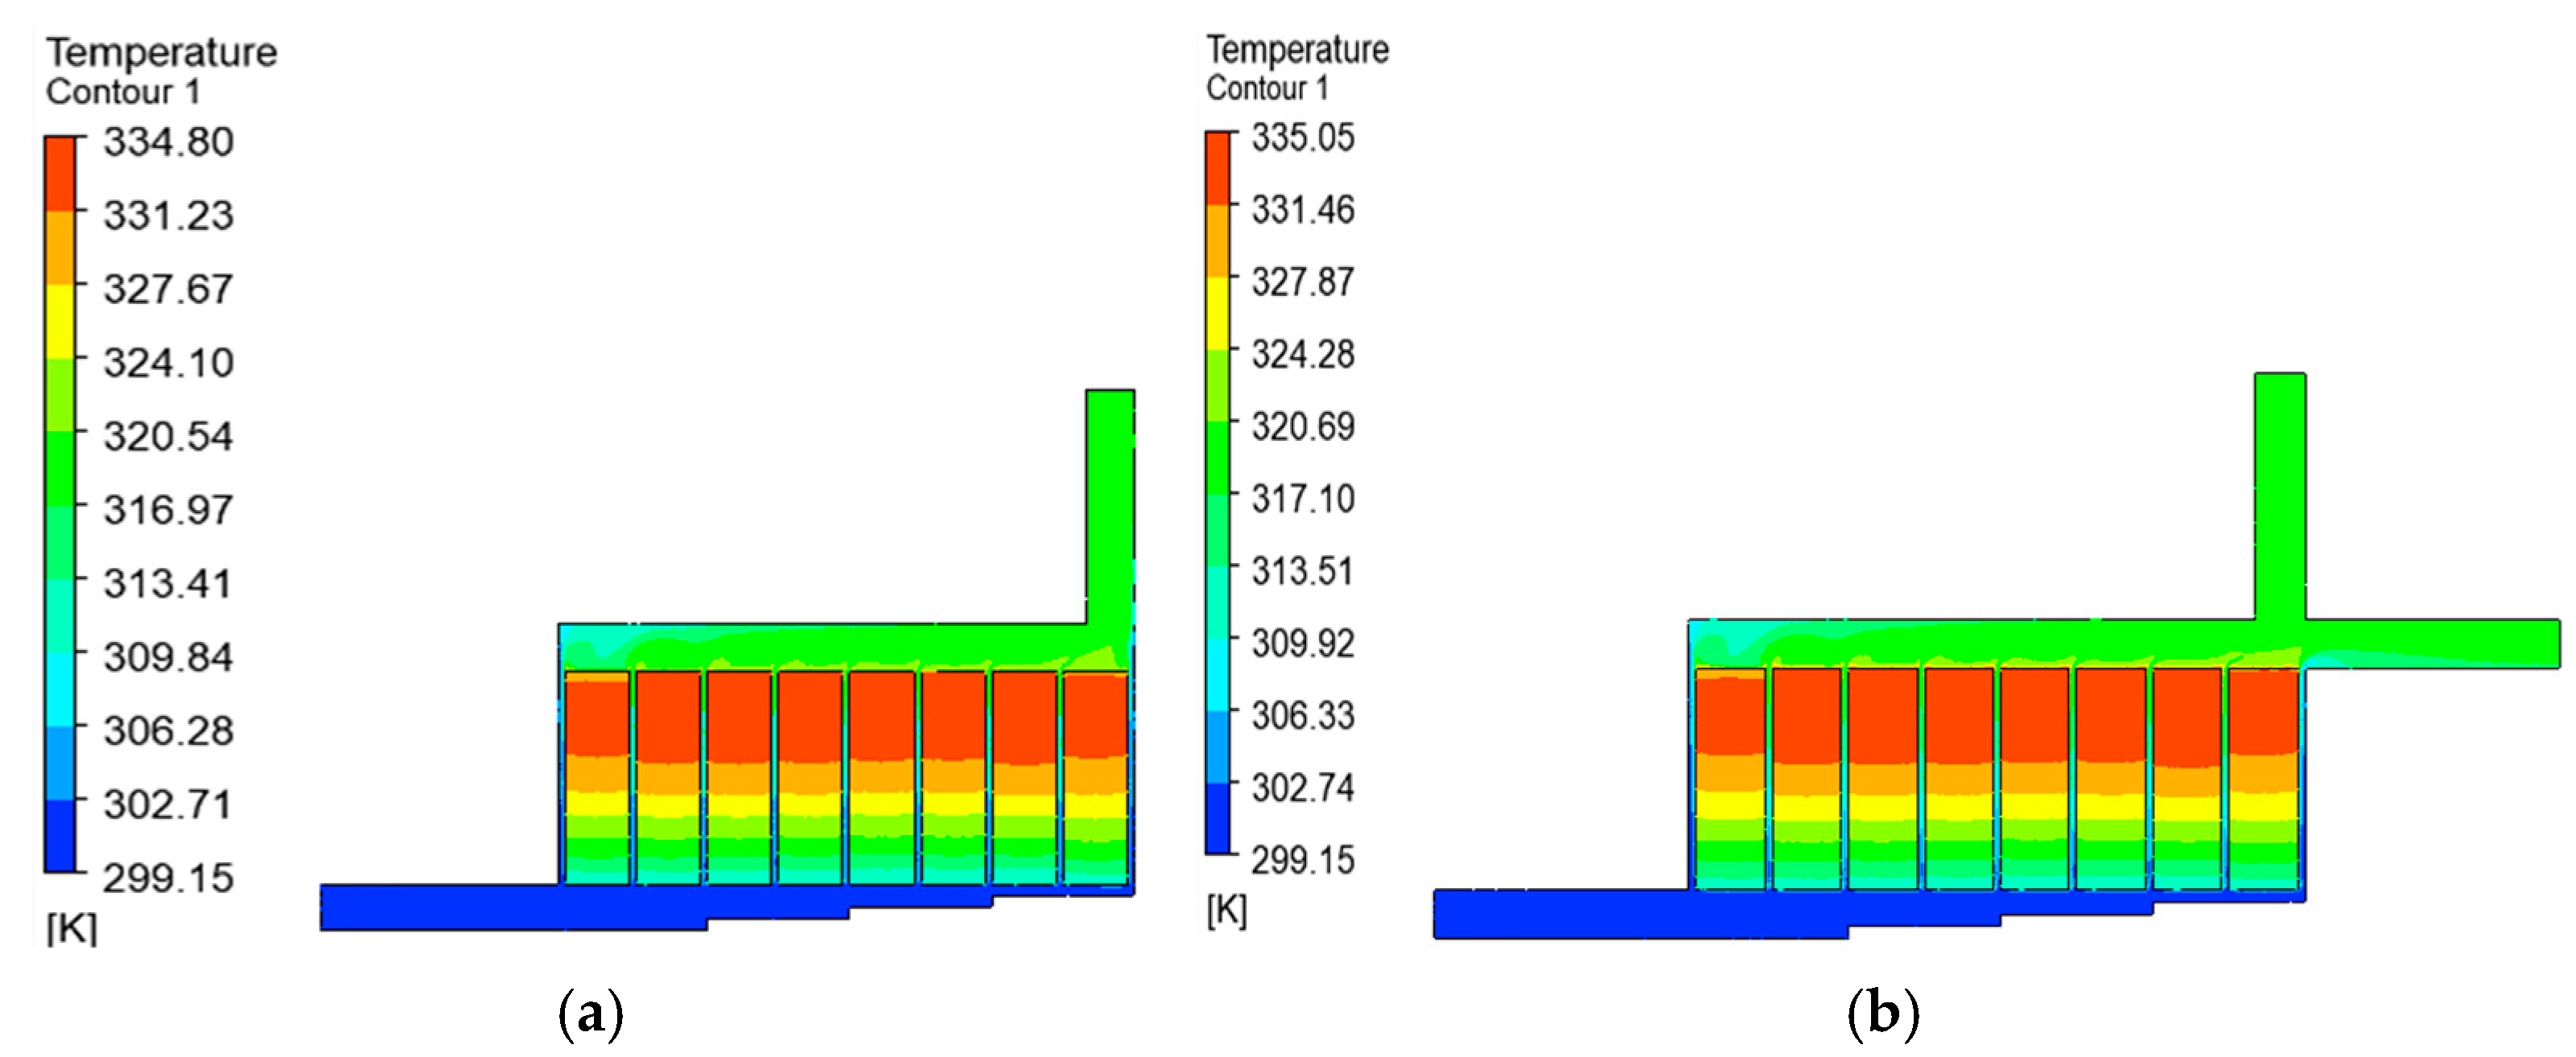
The T m a x performances in this section also consider the same geometries for comparison as those in the case of T m a x . The designs were compared, and the best five in the two groups of combinations are presented in Table 6. Figure 16a,b shows the comparison of the best-performing designs in terms of T m a x for the one-outlet and two-outlet designs, respectively. Additionally, the temperature contours of the best-performing designs in the one-outlet and two-outlet groups are presented in Figure 17a,b. Figure 16a,b presents the comparison of the reference Z-1 designs with the designs in the two combination groups.
Comparing the one-outlet designs presented in Figure 16a, design Z-2-3/Z-6 produced the best performance, with a T m a x value of 0.7 K, while the poorest was produced by design Z-2-9/Z-6, with a T m a x value of 2.32 K. Both the best- and poorest-performing designs performed significantly better than the reference Z-1 design, with reductions by 6.44 K and 4.82 K, respectively. In Figure 16b, the performances of the best five two-outlet designs show that these five designs also performed significantly better than the reference Z-1 design. Furthermore, the Z-2-3/Z-1/Z-6 design produced the best performance, while design Z-2-9/Z-1/Z-6 produced the poorest. Additionally, it was observed that the T m a x values were reduced by 6.34 K and 5.05 K, when compared with those of Z-2-3/Z-1/Z-6 and Z-2-9/Z-1/Z-6, respectively.

3.3. Evaluation of P Performances

In air-cooled BTMSs, especially where external devices are used to pump the cooling air, it is necessary to take into consideration the pumping cost, which is related to the pressure drop. Previous studies have shown that the structural redesign of BTMSs and increases in the cooling air’s velocity can minimize both T m a x   and T m a x . However, this comes with the drawback of an increase in P . With continuous research in the redesign of BTMSs, both T m a x   and T m a x are being enhanced, with minimal P increases and without the need to increase the air’s velocity.

3.3.1. ∆P Performances of the Step-like Plenum, One-Outlet, and Two-Outlet Geometries

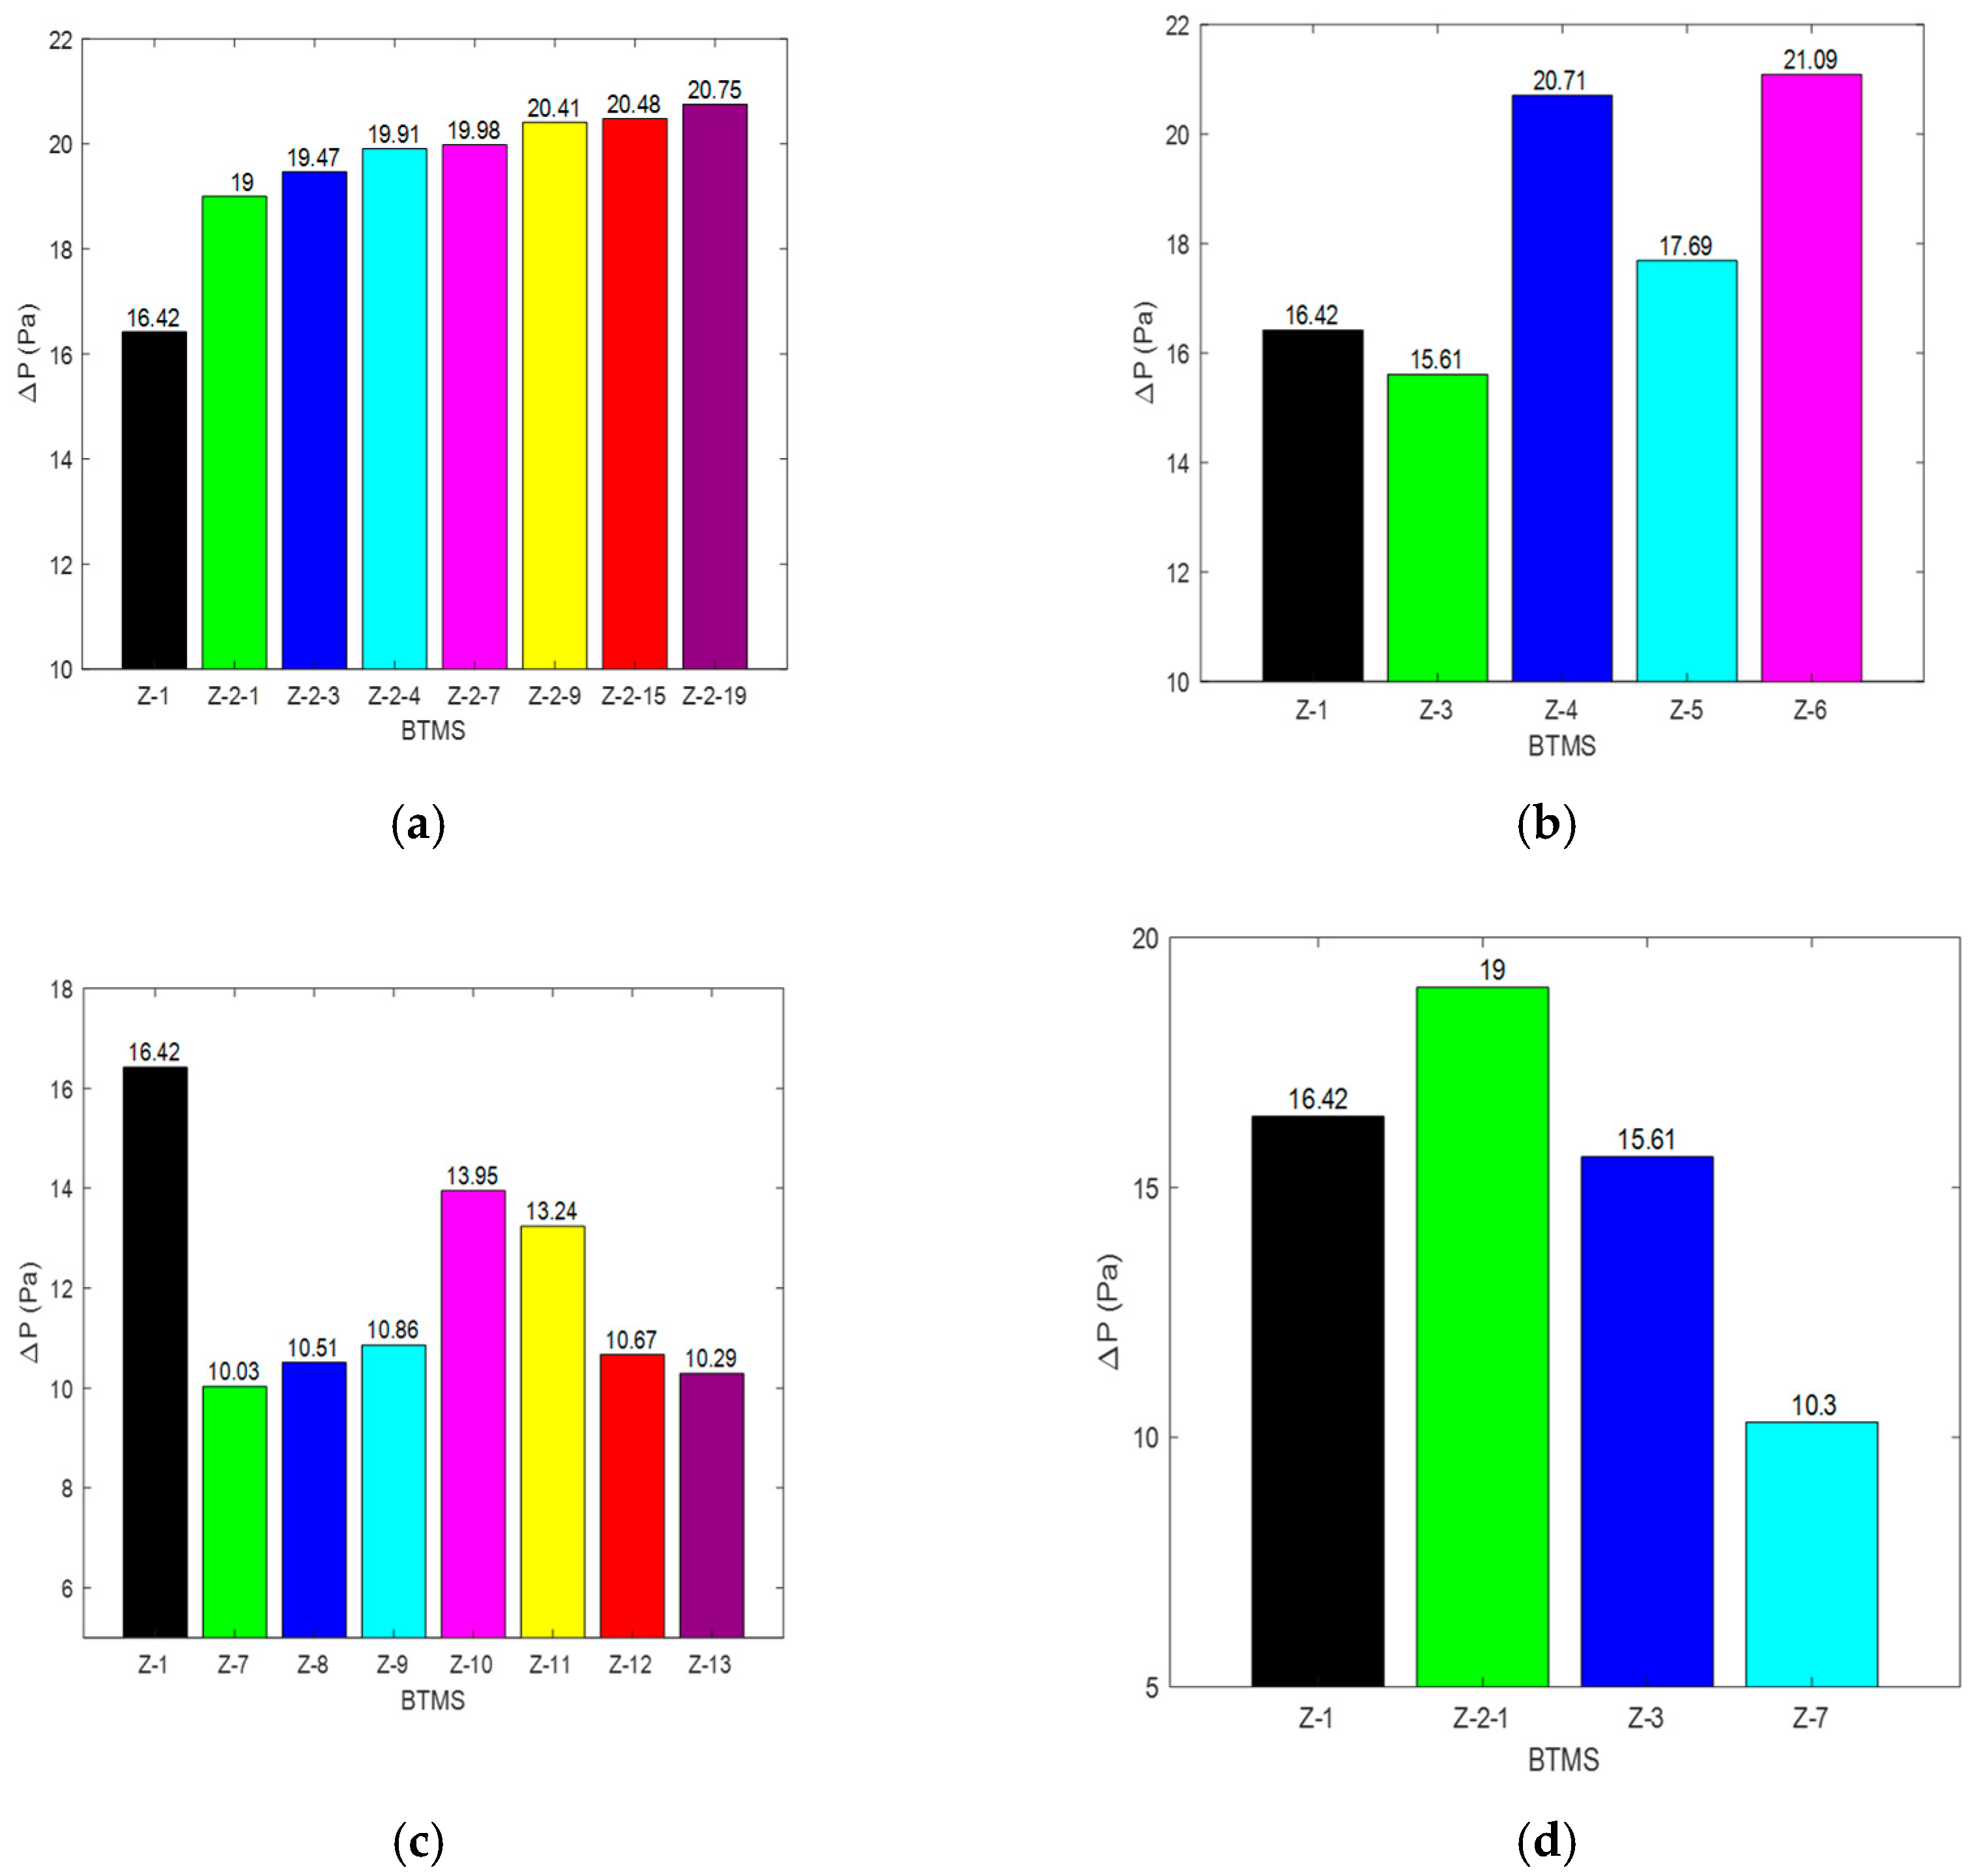
This section considered the P performances of the designs with Step-like plenums, one outlet, and two outlets for comparison. The best-performing designs (with the minimum   P values) in each group were then compared. Figure 18a–c presents the variations in P for the Step-like plenum, one-outlet, and two-outlet designs, respectively, while Figure 18d shows the variation in P between the best-performing designs in each of the three groups. Lastly, Figure 19a–d shows the pressure contours of the Z-1, best Step-like plenum, best one-outlet, and best two-outlet designs, respectively.
The Step-like plenum designs are first considered and presented in Figure 18a. From the figure, it can be seen that the Z-1 design performed better than all the other designs, while the Z-2-1 design produced the minimum P value among the Step-like plenum designs. The P performances of the Step-like plenum designs also show increases in P with increases in the number of steps. Z-2-1, being the best-performing design, produced an increase in P by 2.58 Pa, when compared with that of the Z-1 design. The poorest performance was observed for design Z-2-19, which produced an increase in P by 4.33 Pa. Next, are the performances of the one-outlet designs presented in Figure 18b. The results reveal that design Z-3 produced the best performance, with a reduction in P by 0.81 Pa when compared with that of the reference Z-1 design. However, the remaining one-outlet designs did not perform better than the Z-1 design, recording increases in P by 4.29 Pa, 1.27 Pa, and 4.67 Pa for Z-4, Z-5, and Z-6, respectively. The performances of the two-outlet designs were also considered and are presented in Figure 18c. First, the performances show that all the two-outlet designs produced lower P values compared with that of the reference Z-1 design. Second, Z-7 produced the minimum value, and compared with the Z-1 design, yielded a reduction in P by 6.39 Pa. Figure 18d further presents the performances of the best-performing designs in each of the three groups, and design Z-7 clearly produced the best performance.

3.3.2. ∆P Performances of the Combined-Strategy Geometries

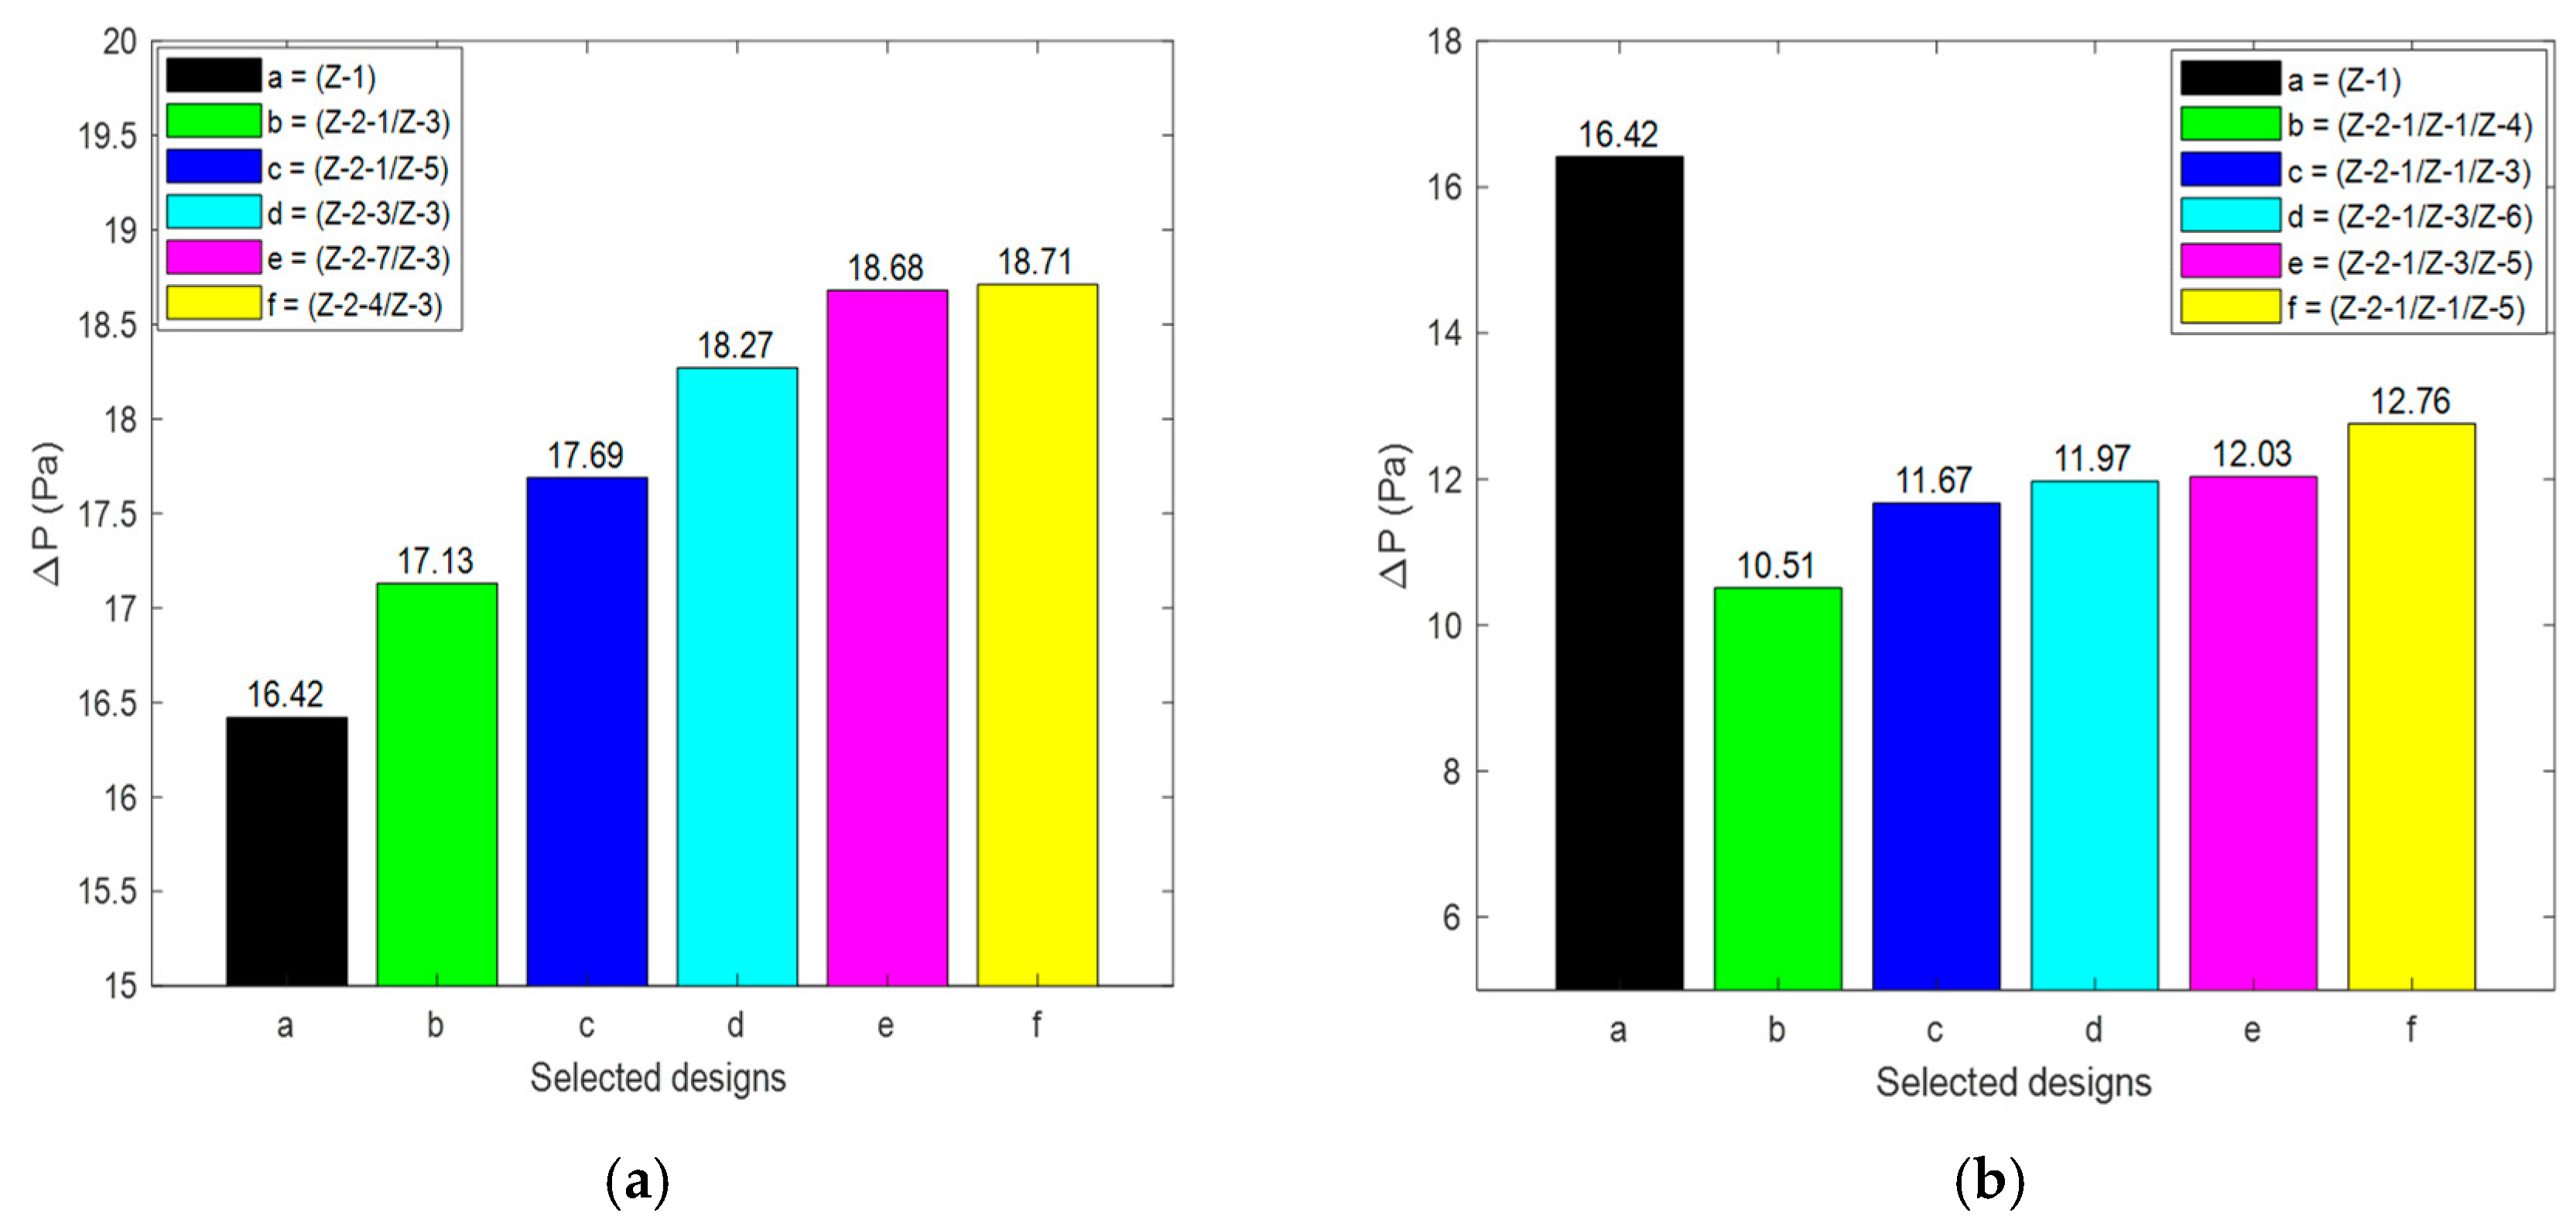
This section explores the performances of the combined-strategy designs with respect to P . The designs were compared, and the best five in the two groups of combinations are presented in Table 7. Figure 20a,b shows the comparison of the best-performing designs in terms of P for one outlet and two outlets, respectively. Additionally, the pressure contours of the best-performing designs with one outlet and two outlets are presented in Figure 21a,b Figure 20a presents the comparison among the one-outlet designs. From the figure, the Z-1 design performed better than all the best five one-outlet designs. When focusing on the one-outlet combinations only, design Z-2-1/Z-3 produced the best performance, with a P value of 17.13 Pa, while the poorest-performing design, Z-2-4/Z-3, produced a P value of 18.71 Pa. Figure 20b further presents the performances of the two-outlet designs. From the figure, all the five best-performing designs performed better than the Z-1 design. Among the two-outlet designs, Z-2-1/Z-1/Z-4 and Z-2-1/Z-1/Z-5 produced the best and poorest performances, respectively, reducing P by 5.91 Pa and 3.66 Pa, respectively, when compared with the P value of the reference Z-1 design.

4. Conclusions

The redesign of the Z-type BTMS has brought about a drop in T m a x , though with a significant increase in P , hence requiring studies to focus on means of decreasing the pressure drop by exploring new designs. In this study, the Step-like plenum design was further investigated by observing the effects of two outlets on the performances of the systems with the aim of reducing or maintaining T m a x and minimizing P . The CFD approach was used to compute the performances of the designs. The designs explore combinations of Step-like plenum designs having different numbers of steps ( N s ) = 1, 3, 4, 7, 9, 15, and 19 with one and two air outlets. From the results obtained, the following conclusions were drawn:
  • The initial Step-like plenum design with seven steps (Z-2-7) produced the best T m a x (327.13 K) among the Step-like plenum categories of the reference Z-type BTMSs, with a reduction by 3.46 K compared to that of the original Z-type design without any steps installed. For the one-outlet designs, the best-performing design is Z-2-7/Z-6, with a minimum T m a x value of 327.07 K, and compared with the original Z-type designs, it produced a reduction in T m a x by 3.52 K. For the two-outlet designs, design Z-2-7/Z-1/Z-6 produced a minimum T m a x value of 327.14 K, and when compared to the original Z-1 designs, it produced a reduction in T m a x by 3.45 K. The Z-2-7/Z-6 design reduced the T m a x value of the best Step-like plenum design by 0.06 K;
  • By comparing the Step-like plenum, one-outlet, and two-outlet designs, the Z-2-3 design has the best performance, with a T m a x value of 0.74 K, and compared with the Z-5 and Z-13 designs, it produced reductions in T m a x by 1.42 K and 0.63 K, respectively. Considering the best five two-outlet designs, with respect to the T m a x performance, significant performance improvements were observed when compared with that of the reference Z-type design. The Z-2-3/Z-1/Z-6 design produced the best performance, while design Z-2-9/Z-1/Z-6 produced the poorest. It was observed that the T m a x value reduced by 6.34 K and 5.05 K when compared with those of Z-2-3/Z-1/Z-6 and Z-2-9/Z-1/Z-6, respectively;
  • For the designs in the three groups, Z-7 produced the minimum value, and compared with the Z-1 design, it yielded a reduction in P by 6.39 Pa. In terms of P , the Step-like plenum and one-outlet combination designs produced good performances. The Z-2-1/Z-3 design produced the best performance, with a P value of 17.13 Pa, while the poorest-performing design, Z-2-4/Z-3, produced a P value of 18.71 Pa. Among the best five two-outlet designs with and without a Step-like plenum structure, Z-2-1/Z-1/Z-4 and Z-2-1/Z-1/Z-5 produced the best and poorest performances, reducing P by 5.91 Pa and 3.66 Pa, respectively.

Author Contributions

Conceptualization, O.M.O.; Methodology, O.M.O., E.T.I., M.J.L., M.C.H. and M.L.D.; Software, O.M.O., E.T.I., M.J.L., M.C.H. and M.L.D.; Validation, O.M.O., E.T.I., M.J.L., M.C.H. and M.L.D.; Formal analysis, O.M.O., E.T.I., M.J.L., M.C.H. and M.L.D.; Investigation, O.M.O., E.T.I., M.J.L., M.C.H. and M.L.D.; Resources, O.M.O.; Data curation, O.M.O.; Writing—original draft, O.M.O., E.T.I., M.J.L., M.C.H. and M.L.D.; Writing—review & editing, O.M.O., E.T.I., M.J.L., M.C.H. and M.L.D.; Visualization, O.M.O.; Supervision, O.M.O.; Project administration, O.M.O. All authors have read and agreed to the published version of the manuscript.

Funding

This research received no external funding.

Data Availability Statement

The original contributions presented in the study are included in the article, further inquiries can be directed to the corresponding author.

Conflicts of Interest

The authors declare no conflict of interest.

Nomenclature

Acronym Unit
SOCState of charge-
TMSThermal management system-
BTMSBattery thermal management system-
CFDComputational fluid dynamics-
HTMSHybrid thermal management system-
PCMPhase-change material-
EVElectric vehicle-
Symbol(s)
L s Step length mm
H s Step height mm
L n s Non-stepped length mm
L t s Stepped length mm
L i n s Initial non-stepped length mm
P i and P o Average pressures of cooling air at the inlet and outlet(s) Pa
T m a x The maximum temperature of the batteriesK
T m i n The minimum temperature of the batteriesK
T m a x The maximum temperature difference of the batteriesK
P Pressure dropPa
A i Inlet sections’ cross-sectional area m 2
V ˙ Volume flow rate of the air m 3 / s
u i Velocity vector’s ith component -
x , y , and z x-, y-, and z-coordinates, respectively-
ReReynolds number-
T b Temperature of the batteryK
I Discharge current A
R b Battery’s equivalent resistance
Q b Battery’s heat generation rate W / m 3
V b Volume of the battery m 3
k a Thermal conductivity (air) W / m . K
k b Thermal conductivity (battery) W / m . K
c a Specific heat capacity (air) J / k g . K
c b Specific heat capacity (battery) J / k g . K
D h Inlet’s hydraulic diameter mm
G k   and   G b Average velocity gradients and buoyancy effects, respectively, for turbulence kinetic energy generation -
Y M Contribution of the fluctuating dilatation in compressible turbulence to the overall dissipation rate-
C 1 ε ,   C 2 ε ,   C 3 ε Model constants-
S k   and   S ϵ Source terms-
Greek letter(s)
ρ a Density (air) kg/m3
ρ b Density (battery) kg/m3
μ a Dynamic viscosity (air) kg/m.s
μ t Turbulent dynamic viscosity kg/m.s
σ k   and   σ ϵ k - and ε -turbulences’ Prandtl numbers-

References

  1. Mo, C.; Xie, J.; Zhang, G.; Zou, Z.; Yang, X. All-climate battery thermal management system integrating units-assembled phase change material module with forced air convection. Energy 2024, 294, 130642. [Google Scholar] [CrossRef]
  2. Na, X.; Kang, H.; Wang, T.; Wang, Y. Reverse layered air flow for Li-ion battery thermal management. Appl. Therm. Eng. 2018, 143, 257–262. [Google Scholar] [CrossRef]
  3. Zhong, G.; Zhang, G.; Yang, X.; Li, X.; Wang, Z.; Yang, C.; Yang, C.; Gao, G. Researches of composite phase change material cooling/resistance wire preheating coupling system of a designed 18650-type battery module. Appl. Therm. Eng. 2017, 127, 176–183. [Google Scholar] [CrossRef]
  4. Dan, D.; Yao, C.; Zhang, Y.; Zhang, H.; Zeng, Z.; Xu, X. Dynamic thermal behavior of micro heat pipe array-air cooling battery thermal management system based on thermal network model. Appl. Therm. Eng. 2019, 162, 114183. [Google Scholar] [CrossRef]
  5. Rao, Z.; Wang, S. A review of power battery thermal energy management. Renew. Sustain. Energy Rev. 2011, 15, 4554–4571. [Google Scholar] [CrossRef]
  6. Yong, S.C.; Mo, K.D. Prediction of thermal behaviors of an air-cooled lithium-ion battery system for hybrid electric vehicles. J. Power Sources 2014, 270, 273–280. [Google Scholar] [CrossRef]
  7. Mohammadian, S.K.; Zhang, Y. Thermal management optimization of an air-cooled Li-ion battery module using pin fin heat sinks for hybrid electric vehicles. J. Power Sources 2015, 273, 431–439. [Google Scholar] [CrossRef]
  8. Yang, X.; Tan, S.; Liu, J. Thermal management of li-ion battery with liquid metal. Energy Convers. Manag. 2016, 117, 577–585. [Google Scholar] [CrossRef]
  9. Wang, C.; Zhang, G.; Meng, L.; Li, X.; Situ, W.; Lv, Y.; Rao, M. Liquid cooling based on thermal silica plate for battery thermal management system. Int. J. Energy Res. 2017, 41, 2468–2479. [Google Scholar] [CrossRef]
  10. Liang, J.; Gan, Y.; Li, Y. Investigation on the thermal performance of a battery thermal management system using heat pipe under different ambient temperatures. Energy Convers. Manag. 2018, 155, 1–9. [Google Scholar] [CrossRef]
  11. Liang, Z.; Wang, R.; Malt, A.H.; Souri, M.; Esfahani, M.; Jabbari, M. Systematic evaluation of a flat-heat-pipe-based thermal management: Cell-to-cell variations and battery ageing. Appl. Therm. Eng. 2021, 192, 116934. [Google Scholar] [CrossRef]
  12. Rao, Z.; Wang, Q.; Huang, C. Investigation of the thermal performance of phase change material/mini-channel coupled battery thermal management system. Appl. Energy 2016, 164, 659–669. [Google Scholar] [CrossRef]
  13. Samimi, F.; Babapoor, A.; Azizi, M.; Karimi, G. Thermal management analysis of a li-ion battery cell using phase change material loaded with carbon fibers. Energy 2016, 96, 355–371. [Google Scholar] [CrossRef]
  14. Zhao, Y.; Li, Q.; Zou, B.; Zhang, T.; Jin, L.; Qiao, G.; Nie, B.; Huang, Y.; Ding, Y. Performance of a liquid cooling-based battery thermal management system with a composite phase change material. Int. J. Energy Res. 2020, 44, 4727–4742. [Google Scholar] [CrossRef]
  15. Mashayekhi, M.; Houshfar, E.; Ashjaee, M. Development of hybrid cooling method with PCM and Al2O3 nanofluid in aluminium minichannels using heat source model of Li-ion batteries. Appl. Therm. Eng. 2020, 178, 115543. [Google Scholar] [CrossRef]
  16. El Idi, M.M.; Karkri, M.; Tankari, M.A.; Vincent, S. Hybrid cooling based battery thermal management using composite phase change materials and forced convection. J. Energy Storage 2021, 41, 102946. [Google Scholar] [CrossRef]
  17. Li, Y.; Kong, B.; Qiu, C.; Li, Y.; Jiang, Y. Numerical study on air-cooled battery thermal management system considering the sheer altitude effect. Appl. Therm. Eng. 2025, 258, 124707. [Google Scholar] [CrossRef]
  18. Fan, Y.; Zuo, X.; Zhan, D.; Zhao, J.; Zhang, G.; Wang, H.; Wang, K.; Yang, S.; Tan, X. A novel control strategy for active battery thermal management systems based on dynamic programming and a genetic algorithm. Appl. Therm. Eng. 2023, 233, 121113. [Google Scholar] [CrossRef]
  19. Qin, P.; Liao, M.; Zhang, D.; Liu, Y.; Sun, J.; Wang, Q. Experimental and numerical study on a novel hybrid battery thermal management system integrated forced-air convection and phase change material. Energy Convers. Manag. 2019, 195, 1371–1381. [Google Scholar] [CrossRef]
  20. Behi, H.; Karimi, D.; Behi, M.; Ghanbarpour, M.; Jaguemont, J.; Sokkeh, M.A.; Gandoman, F.H.; Berecibar, M.; Mierlo, J.V. A new concept of thermal management system in Li ion battery using air cooling and heat pipe for electric vehicles. Appl. Therm. Eng. 2020, 174, 115280. [Google Scholar] [CrossRef]
  21. Zhang, N.; Zhang, Z.; Li, J.; Cao, X. Performance analysis and prediction of hybrid battery thermal management system integrating PCM with air cooling based on machine learning algorithm. Appl. Therm. Eng. 2024, 257, 124474. [Google Scholar] [CrossRef]
  22. Zhou, L.; Li, S.; Jain, A.; Chen, G.; Guo, D.; Kang, J.; Zhao, Y. Lithium Battery Thermal Management Based on Liightweight Stepped-Channel Liquid Cooling. ASME J. Electrochem. Energy Convers. Storage 2024, 21, 031012-1. [Google Scholar] [CrossRef]
  23. Song, K.; He, R.; Gao, C.; Pea, H.J.M.; He, A.; Zhang, Q.; Zhang, K.; An, Z. Performance of a combined battery thermal management system with dual-layer phase change materials and air cooling technologies. Appl. Therm. Eng. 2024, 254, 123865. [Google Scholar] [CrossRef]
  24. Zhu, X.; Liao, X.; Kang, S.; Sun, L.; Zhao, Y. Optimization design of lithium battery management system based on Z-F composite air cooling structure. J. Energy Storage 2024, 102 Pt A, 114068. [Google Scholar] [CrossRef]
  25. Lamba, R.; Montero, F.J.; Rehman, T.; Singh, S.; Manikandan, S. PCM-based hybrid thermal management system for photovoltaic modules: A comparative analysis. Environ. Sci. Pollut. Res. 2024, 31, 46397–46416. [Google Scholar] [CrossRef] [PubMed]
  26. Moaveni, A.; Siavashi, M.; Mousavi, S. Passive and hybrid battery thermal management system by cooling flow control, employing nano-PCM, fins, and metal foam. Energy 2024, 288, 129809. [Google Scholar] [CrossRef]
  27. Argade, S.; De, A. Optimization study of a Z-type airflow cooling system of a lithium-ion battery pack. Phys. Fluids 2024, 36, 067119. [Google Scholar] [CrossRef]
  28. Oyewola, O.M.; Idowu, E.T. Wave and straight plenum effects on thermal management system performance. Int. J. Thermofluids 2024, 22, 100678. [Google Scholar] [CrossRef]
  29. Suo, Y.; Tang, C.; Han, E.; Chen, Z. Comparative assessment and optimization among several plenum shapes and positions for the forced air-cooled battery thermal management system. J. Energy Storage 2024, 99 Pt B, 113319. [Google Scholar] [CrossRef]
  30. Chen, K.; Zhang, Z.; Wu, B.; Song, M.; Wu, X. An air-cooled system with a control strategy for efficient battery thermal management. Appl. Therm. Eng. 2024, 236 Pt B, 121578. [Google Scholar] [CrossRef]
  31. Alzwayi, A.; Paul, M.C. Effective battery pack cooling by controlling flow patterns with vertical and spiral fins. Therm. Sci. Eng. Prog. 2024, 55, 102907. [Google Scholar] [CrossRef]
  32. Qin, P.; Liao, M.; Mei, W.; Sun, J.; Wang, Q. The experimental and numerical investigation on a hybrid battery thermal management system based on forced-air convection and internal finned structure. Appl. Therm. Eng. 2021, 195, 117212. [Google Scholar] [CrossRef]
  33. Wang, N.; Li, C.; Huang, M.; Qi, D. Effect analysis on performance enhancement of a novel air cooling battery thermal management system with spoilers. Appl. Therm. Eng. 2021, 192, 116932. [Google Scholar] [CrossRef]
  34. Wang, M.; Hung, C.; Xi, H. Numerical Study on Performance Enhancement of the Air Cooled Battery Thermal Management System by Adding Parallel Plates. Energies 2021, 14, 3096. [Google Scholar] [CrossRef]
  35. Oyewola, O.M.; Idowu, E.T.; Drabo, M.L. Influence of straight and inclined baffles on enhancement of battery thermal management system performance. Heliyon 2024, 10, e38585. [Google Scholar] [CrossRef] [PubMed]
  36. Alzwayi, A.; Paul, M.C. Heat transfer enhancement of a lithium-ion battery cell using vertical and spiral cooling fins. Therm. Sci. Eng. Prog. 2024, 47, 102304. [Google Scholar] [CrossRef]
  37. Oyewola, O.M.; Awonusi, A.A.; Ismail, O.S. Design optimization of Air-Cooled Li-ion battery thermal management system with Step-like divergence plenum for electric vehicles. Alex. Eng. J. 2023, 71, 631–644. [Google Scholar] [CrossRef]
  38. Oyewola, O.M.; Awonusi, A.A.; Ismail, O.S. Performance Optimization of Step-like Divergence Plenum Air-Cooled Li-Ion Battery Thermal Management System Using Variable-Step-Height Configuration. Emerg. Sci. J. 2024, 8, 795–814. [Google Scholar] [CrossRef]
  39. Oyewola, O.M.; Idowu, E.T. Numerical and artificial neural network inspired study on Step-like-plenum battery thermal management system. Int. J. Thermofluids 2024, 24, 100897. [Google Scholar] [CrossRef]
  40. Chen, K.; Wu, W.; Yuan, F.; Chen, L.; Wang, S. Cooling efficiency improvement of air-cooled battery thermal management system through designing the flow pattern. Energies 2019, 167, 781–790. [Google Scholar] [CrossRef]
  41. Chen, K.; Hou, J.; Wu, X.; Chen, Y.; Song, M.; Wang, S. Design of flow pattern in air-cooled battery thermal management system. Int. J. Energy Res. 2021, 45, 9541–9554. [Google Scholar] [CrossRef]
  42. Wang, C.; Xi, H.; Wang, M. Investigation of forced air-cooling strategy of battery thermal management system considering the inconsistency of battery cells. Appl. Therm. Eng. 2022, 214, 118841. [Google Scholar] [CrossRef]
  43. Hong, S.; Zhang, X.; Chen, K.; Wang, S. Design of flow configuration for parallel air-cooled battery thermal management system with secondary vent. Int. J. Heat Mass Transf. 2018, 116, 1204–1212. [Google Scholar] [CrossRef]
  44. Oyewola, O.M.; Idowu, E.T. Effects of Step-like plenum, flow pattern and inlet flow regime on thermal management system. Appl. Therm. Eng. 2024, 243, 122637. [Google Scholar] [CrossRef]
  45. Yan, H.; Ma, X.; Chen, Y.; Tao, Q.; Song, M. Performance analysis of a wet pad assisted air cooled battery thermal management system with varying number of battery cells. Appl. Therm. Eng. 2024, 259, 124747. [Google Scholar] [CrossRef]
  46. Zhang, F.; Lin, A.; Wang, P.; Liu, P. Optimization design of a parallel air-cooled battery thermal management system with spoilers. Appl. Therm. Eng. 2021, 182, 116062. [Google Scholar] [CrossRef]
  47. Wang, M.; Teng, S.; Xi, H.; Li, Y. Cooling performance optimization of air-cooled battery thermal management system. Appl. Therm. Eng. 2021, 195, 117242. [Google Scholar] [CrossRef]
Figure 1. Z-type (a) 2D BTMS, (b) 2D battery, (c) 3D BTMS, and (d) 3D battery [34,40].
Batteries 11 00087 g001aBatteries 11 00087 g001b
Figure 2. Two-dimensional schematic view of the Step-like plenum geometry.
Batteries 11 00087 g002
Figure 3. Schematics of one-outlet flow pattern designs.
Batteries 11 00087 g003
Figure 4. Schematics of two-outlet flow pattern geometric designs.
Batteries 11 00087 g004aBatteries 11 00087 g004b
Figure 5. Selected combined-strategy geometries: (a) one outlet and (b) two outlets.
Batteries 11 00087 g005
Figure 6. Mesh independence tests: (a) T m a x and T m i n and (b) T m a x   and P .
Batteries 11 00087 g006
Figure 7. Comparison between experiments [40] and the CFD method (the current study) for (a) T m a x and (b) T m i n .
Batteries 11 00087 g007
Figure 8. The reference Z-type BTMS’s (a) 2D geometry, (b) selected mesh, (c) temperature contour, and (d) air-velocity contour.
Batteries 11 00087 g008aBatteries 11 00087 g008b
Figure 9. Tmax performances of BTMSs: (a) Step-like plenum, (b) one outlet, (c) two outlets, and (d) the best in groups (ac).
Batteries 11 00087 g009aBatteries 11 00087 g009b
Figure 10. Temperature contours of (a) Z-1, (b) Z-2-7, (c) Z-5, and (d) Z-13 BTMSs.
Batteries 11 00087 g010
Figure 11. Tb values of combined-strategy designs with (a) one outlet and (b) two outlets.
Batteries 11 00087 g011
Figure 12. Tmax values of the batteries for the best five designs with (a) one outlet and (b) two outlets.
Batteries 11 00087 g012
Figure 13. Temperature contours of T m a x   for the best-performing designs with (a) one outlet and (b) two outlets.
Batteries 11 00087 g013
Figure 14. T m a x performances of BTMSs: (a) Step-like plenum, (b) one outlet, (c) two outlets, and (d) the best in groups (ac).
Batteries 11 00087 g014
Figure 15. Temperature contours of (a) Z-1, (b) Z-2-3, (c) Z-5, and (d) Z-13 BTMSs.
Batteries 11 00087 g015
Figure 16. T m a x values of the batteries for the best five designs with (a) one outlet and (b) two outlets.
Batteries 11 00087 g016
Figure 17. Temperature contours of T m a x   for the best-performing designs with (a) one outlet and (b) two outlets.
Batteries 11 00087 g017
Figure 18. P performances of BTMSs: (a) Step-like plenum, (b) one outlet, (c) two outlets, and (d) the best in groups (ac).
Batteries 11 00087 g018
Figure 19. Temperature contours of (a) Z-1, (b) Z-2-1, (c) Z-3, and (d) Z-7 BTMSs.
Batteries 11 00087 g019
Figure 20. P values of the batteries for the best five designs with (a) one outlet and (b) two outlets.
Batteries 11 00087 g020
Figure 21. Pressure contours of P for the best-performing designs with (a) one outlet and (b) two outlets.
Batteries 11 00087 g021
Table 1. Properties of the air and battery [34,37].
Property Battery Air Unit
Specific heat ( c p ) 13371005 J / k g K
Density ( ρ ) 1542.91.165 k g / m 3
Dynamic viscosity ( μ ) - 1.86 × 10 5 k g / m s
Thermal conductivity ( k ) 1.05 ( x ); 21.1 ( y ); 21.1 ( z ) 0.0267 W / m K
Table 2. Geometric and flow properties of the Z-type and Step-like BTMSs [34,37].
DescriptionSymbolValue (mm)
Length of the cooling channel C C l 3
Length of the inlet/outlet section L i / L o 100
Length of the cooling section L c 243
Length of the battery L b 27
Height of the inlet/outlet section H i / H o 20
Height of the battery H b 90
Width of the inlet/outlet section W i / W o 70
Width of the battery W b 70
Convergence plenum C P 343
Divergence plenum D P 343
Table 3. Descriptions of the one-outlet designs [28].
BTMSDetails
Z-3Both the inlet and outlet sections are positioned perpendicular to C C on the same side.
Z-4The outlet section is at the extreme edge of the plenum, perpendicular and close to the inlet section.
Z-5The outlet section is at the midpoint of the plenum and perpendicular to the inlet section.
Z-6The outlet section is at the extreme edge of the plenum, perpendicular to and farthest from the inlet section.
Table 4. Descriptions of the two-outlet geometries.
BTMSCombinationDetails
Z-7Z-1/Z-3This design basically has two outlets by adopting and combining the Z-1 and Z-3 outlet positions.
Z-8Z-1/Z-4Similar to the Z-7 design, this design adopts and combines the Z-1 and Z-4 outlet positions.
Z-9Z-1/Z-5Similarly, this design adopts and combines the Z-1 and Z-5 outlet positions.
Z-10Z-1/Z-6Similarly, this design adopts and combines the Z-1 and Z-6 outlet positions.
Z-11Z-3/Z-4This design adopts and combines the Z-3 and Z-4 outlet positions.
Z-12Z-3/Z-5Similarly, this design adopts and combines the Z-3 and Z-5 outlet positions.
Z-13Z-3/Z-6Similarly, this design adopts and combines the Z-3 and Z-6 outlet positions.
Table 5. The best five designs of the combined-strategy geometries in terms of T m a x .
S/NStep-like Plenum and One-Outlet CombinationStep-like Plenum and Two-Outlet Combination
StepOutlet T m a x (K)StepOutlet T m a x (K)
1.Z-2-7Z-6327.07Z-2-7Z-1/Z-6327.14
2.Z-2-3Z-6327.14Z-2-3Z-1/Z-6327.26
3.Z-2-4Z-6327.63Z-2-4Z-1/Z-6327.59
4.Z-2-9Z-6328.07Z-2-9Z-1/Z-6327.88
5.Z-2-1Z-5328.69Z-2-7Z-1/Z-3328.21
Table 6. The best five designs of combined-strategy geometries in terms of T m a x .
S/NStep-like Plenum and One-Outlet CombinationStep-like Plenum and Two-Outlet Combination
StepOutlet T m a x (K)StepOutlet T m a x (K)
1.Z-2-3Z-60.70Z-2-3Z-1/Z-60.82
2.Z-2-7Z-60.88Z-2-7Z-1/Z-60.90
3.Z-2-4Z-61.63Z-2-4Z-1/Z-61.47
4.Z-2-1Z-52.16Z-2-1Z-1/Z-51.94
5.Z-2-9Z-62.32Z-2-9Z-1/Z-62.09
Table 7. The best five designs of the combined-strategy geometries in terms of P .
S/NStep-like Plenum and One-Outlet CombinationStep-like Plenum and Two-Outlet Combination
StepOutlet P (Pa)StepOutlet P (Pa)
1.Z-2-1Z-317.13Z-2-1Z-1/Z-410.51
2.Z-2-1Z-517.69Z-2-1Z-1/Z-311.67
3.Z-2-3Z-318.27Z-2-1Z-3/Z-611.97
4.Z-2-7Z-318.68Z-2-1Z-3/Z-512.03
5.Z-2-4Z-318.71Z-2-1Z-1/Z-512.76
Disclaimer/Publisher’s Note: The statements, opinions and data contained in all publications are solely those of the individual author(s) and contributor(s) and not of MDPI and/or the editor(s). MDPI and/or the editor(s) disclaim responsibility for any injury to people or property resulting from any ideas, methods, instructions or products referred to in the content.