Abstract
This study investigates a hybrid-battery thermal management system (BTMS) integrating air-cooling, a cold plate, and porous materials to optimize heat dissipation in a 20-cell battery pack during charging and discharging cycles of up to 5C. A computational fluid dynamics (CFD) model based on the equivalent circuit model (ECM) is developed to simulate battery pack behavior under various cooling configurations, including different porous media and vortex generators placed between cells. The impact of battery pack configurations on heat generation is analyzed, and five different porous materials are tested for their cooling performance. The results reveal that, among the examined materials, graphite is the most effective in maintaining the battery temperature within an acceptable range, particularly during high C-rate charging. Graphite integration significantly reduces the thermal stabilization time from over an hour to approximately 600 s. Additionally, our parametric experiment evaluates the influence of ambient temperature, airflow velocity, and cold-plate temperature on the system’s cooling efficiency. The findings demonstrate that maintaining the cold-plate temperature between 300 K and 305 K minimizes the temperature gradient, ensuring uniform thermal distribution. This research highlights the potential of hybrid BTMS designs incorporating porous media and cold plates to enhance battery performance, safety, and lifespan under various operational conditions.
1. Introduction
The rise in electric vehicles (EVs) has significantly transformed the automotive industry, playing a crucial role in reducing carbon emissions and promoting sustainability [1]. However, thermal runaway in lithium-ion batteries remains a major safety concern due to factors like rapid charging, extreme temperatures, and manufacturing defects [2,3]. This phenomenon, which can lead to overheating, fires, and explosions, highlights the importance of effective thermal management systems [4]. Advanced cooling technologies, thermal insulation, and monitoring systems are essential to ensuring the safety and reliability of EVs, ultimately supporting their widespread adoption.
To enhance EV efficiency and safety, battery packs require proper cooling through active and passive methods [5]. Active cooling systems, such as liquid cooling and air conditioning, use external technologies to dissipate heat, while passive systems rely on natural mechanisms like heat sinks and phase change materials [6,7,8]. Among these, air-cooling is widely used due to its affordability, reliability, and ease of implementation [9]. By using fans or blowers to regulate battery temperature, air-cooling systems improve heat dissipation efficiently, making them a preferred choice in the automotive industry [10,11].
Incorporating air-cooling techniques into commercial hybrid electric vehicles indicates a noteworthy advancement in battery thermal management systems. Both vehicles, recognized as pioneering innovations in the industry, employed air-cooling for their battery packs [12]. They accomplished this by utilizing cabinet-heated air to facilitate the cooling of the modules, eventually releasing the heat they had absorbed into the atmosphere. This approach has been accepted as the standard for future electric car models. The widespread adoption of air conditioning in commercial electric vehicles serves as proof of its effectiveness as a reliable and cost-effective solution, ensuring optimal battery temperatures and facilitating a wider acceptance of electric mobility in the interest of sustainable transportation alternatives [13]. Air-cooling battery thermal management systems (BTMSs) are divided into three different aspects, including the investigation of design parameters, flow parameters, and operational parameters [14]. Channel size and inlet/outlet position [15], cell arrangement [16], and cell spacing [17] are paramount design factors in air-cooling battery pack design.
Recent advancements in air-cooling battery thermal management systems (BTMS) have led to innovative designs aimed at improving cooling efficiency. Early models, such as the Z-type [18] and U-type [19] configurations, provided the foundation for further developments. Wang et al. [20] explored nine BTMS designs with different inlet and outlet placements, demonstrating that optimizing airflow direction could lower the maximum battery temperature by up to 4.9 K. Building on these models, Zhang et al. [21] introduced the parallel T-type BTMS, which significantly reduced Tmax, ΔTmax, and power consumption by 3.5%, 67.7%, and 19.0%, respectively, compared to Z-type and U-type configurations.
Further improvements include the use of baffles in cooling channels, as investigated by Furen et al. [22], who reported reductions of 12.7 K in Tmax and 4.49 K in ΔTmax with a 1.1 mm baffle. Additionally, Kang et al. [23] studied different cell arrangements in battery modules, highlighting that, even with the same number of cells, the temperature distribution can vary significantly based on module design. These findings underscore the importance of optimizing airflow pathways and structural configurations in BTMS to enhance cooling performance.
Recent advancements in forced-air BTMS have focused on enhancing cooling performance through innovative airflow modifications. Shahid et al. [24] demonstrated that introducing a secondary inlet to alter airflow direction improved maximum cell temperature by 4% and temperature differential by 39%. Oyewola et al. [25] optimized a Z-type BTMS using a step-like divergence plenum, reducing maximum temperature by 3.94 K and temperature difference by 5.93 K. Jiang et al. [26] explored a reciprocating mist cooling system for 18650 lithium-ion battery packs, identifying ideal operating parameters. Verma and Saraswati [27] analyzed different inlet flow characteristics in air-cooling BTMS, reducing the maximum temperature difference from 22.14 K to 0.21 K.
To overcome the limitations of air-cooling systems, hybrid BTMS integrating liquid cooling [28], passive cooling [29], PCM, and porous mini-channels have been proposed. Kavasogullari et al. [30] found that a 9 mm PCM layer effectively maintains ideal battery temperatures. Jiang et al. [31] used porous mini-channels, reducing maximum temperature by 5 K at varying inlet velocities. Sharma et al. [32] tested PCM–heat-pipe hybrid designs for high ambient temperatures, keeping battery temperatures within safe limits. Majid et al. [33] introduced a thermoelectric–air-cooling hybrid BTMS that lowered temperature by 7 K, while Moaveni et al. [34] showed that metal foam and fins reduced peak temperatures by 10.36 K and 9 K, respectively. Other hybrid BTMS solutions include magnetohydrodynamics [35], thermoelectric cooling [36], mini-channel heat sinks [37], evaporative cooling [38], and fin-based systems [39]. Bargal et al. [40] reviewed liquid-cooling techniques for PEMFC stacks, emphasizing nanofluids and coolant channel optimization for improved thermal management.
Heat generation modeling is essential in battery simulations, with various methods developed to balance accuracy and complexity. The conjugate heat transport (CHT) model provides a basic approach by assuming a constant heat source, while the NTGK model [41,42] estimates heat generation using voltage–current response curves but struggles with sudden load variations.
The equivalent circuit model (ECM) offers a more accurate and adaptable solution by simulating electrical behavior, making it suitable for both single cells and battery packs. While it effectively captures battery property evolution, its complexity limits its practicality in engineering applications.
Research on the role of busbars in battery packs is limited, but studies highlight their impact on thermal behavior. Yetik and Karakok [43] emphasized busbars’ significance, noting temperature challenges in series-connected prismatic batteries. Further investigations [44,45] analyzed material and design effects, with Chen et al. [46] demonstrated that optimized busbars can reduce maximum battery temperature by 10.06 K and temperature differential by 9.75 K at a 3C discharge rate.
This study simulates a hybrid battery pack with 20 cells, addressing the gap in the literature on the impact of different configurations (1P20S to 20P1S) on heat generation. A virtual connection is implemented to account for busbar effects. Given that excessive heat generation can lead to thermal runaway, effective cooling strategies are essential for maintaining battery safety. To enhance air-cooling efficiency, this study introduces modified inlet and outlet channels, cold plates, and porous media between cells. Additionally, aluminum vortex generators are used to optimize airflow. Simulations are conducted under various charge–discharge rates and ambient conditions to assess the cooling system’s performance. The results demonstrate that the proposed system effectively regulates temperature and reduces thermal risks, making it suitable for different environmental conditions. The simulations were performed using ANSYS Fluent 2023 R1.
2. Problem Description
Figure 1 shows the battery pack geometrical model of hybrid BTMS using 18650 cylindrical Li-ion batteries. In this configuration, air enters the battery pack from the top and exits through the side walls. The optimal gap between batteries is 2 mm, which is considered in this study [47]. Porous materials create a porous medium in the spaces between cells. Twenty 18650 cylindrical cells are in the battery pack, and the battery properties are presented in Table 1. To circulate air in the battery pack in a more efficient way, some aluminum vortex generators are inserted inside the battery pack. A 10 mm distance is considered between batteries and cold plate.
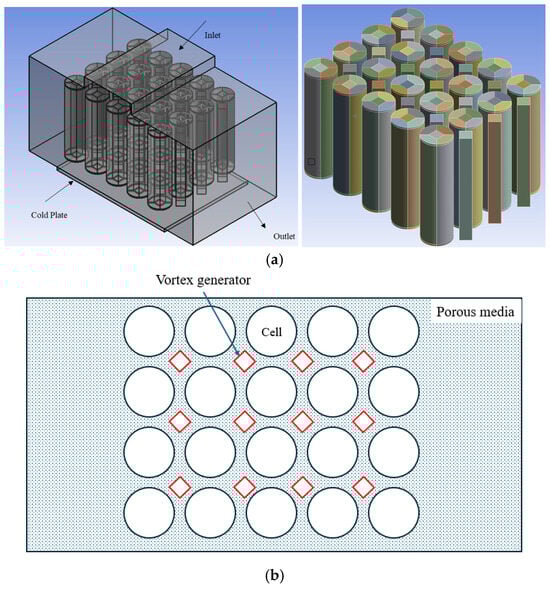
Figure 1.
(a) Three-dimensional geometry of the Li-ion battery pack with a cold plate and airflow pathways. (b) Top-view schematic of the battery pack with porous media and vortex generators.

Table 1.
Properties of the battery used in this study [8,48].
Four zones are described in the geometry: batteries, porous domain, positive and negative tabs, and cold plates. The lithium-ion battery’s anode is made of graphite, while the cathode is made of LiFePO4. The battery material is isotropic, so the thermal conductivity and specific heat transfer are considered constant. Lithium-ion batteries are made of several materials. The thermophysical properties of a Li-ion battery can be calculated using Equation (1). For instance, for thermal conductivity, the following applies:
where is the thickness of the ith layer, and is thermal conductivity.
3. Governing Equations
3.1. Porous Domain
This study employs the computational fluid dynamics (CFD) technique to determine the distribution of temperature and investigate the impact of various components that influence it. The objective is to assess the impact of various porous materials on the air-cooling battery thermal management system. The fluid flow in the porous domain is characterized using mass, momentum, and energy conservation equations. The conversion of the mass equation is shown as follows [20]:
The momentum equation is expressed as follows:
, which is defined as the external force, can also contain source terms such as porous media. is the gravitational body force, and is the stress tensor. and are defined as follows:
and are the viscous resistance term and internal resistance term, which can be defined as follows:
where is porosity and K is defined as a function of porosity [20].
, where PPI is the number of pores per inch, and is the pore diameter. Equation (8) primarily considers pore diameter as a key parameter in characterizing the structural effects on thermal transport. Although permeability is not explicitly included in the equation, it is inherently linked to porosity ε and pore size. Since permeability is a function of these parameters, its influence is indirectly captured within the formulation. For highly porous materials, empirical correlations such as this provide a reasonable estimation of thermal transport characteristics without requiring permeability as a direct input.
The energy equation is defined as follows:
is defined as , where h is the enthalpy of the fluid. is the heat generation in the porous domain which can be neglected. is the effective thermal conductivity, and represents energy transfer from thermal conduction. Other variables are defined in the nomenclature section.
3.2. Battery
Modeling a lithium-ion (Li-ion) battery is challenging due to its complex multi-domain, multi-physics nature, with significant variations in length scales. In thermal analysis, the objective is to ascertain the temperature distribution at the overall battery length scale. The multi-scale multi-domain (MSMD) approach is employed to address these challenges by managing different physics in separate solution domains. Heat is generated within the battery during the charge/discharge process. If a thermal management system exists, most of the heat will be transmitted from the interior part to the surface, where it will be dispersed by ambient air or another coolant. The battery contains the remaining energy.
As batteries are considered solid, there is no need to solve momentum equations for batteries. So, only thermal and electrical fields will be solved in the CFD domain using the following equations [49]:
In Equation (10), and can be neglected as the battery pack operates under controlled conditions without internal short circuits or external abuse scenarios, such as overcharging or mechanical damage, which would otherwise contribute to these heat generation sources. But is the main source of heat generation in the battery where numerous electrochemical models, spanning from simplistic empirically derived to those grounded in fundamental physics, are accessible in the open literature. In this study, the equivalent circuit model is used as the electrochemical model.
In the case that thermal abuse condition is considered, should be considered as follows:
where , A, E, R, T, m, and n are the degree of conversion, pre-exponential factor of the reaction, activation energy of the reaction, universal gas constant, temperature, and reaction order parameters. The values for these parameters are presented in Table 2.
Table 2.
Values for heat generation in thermal abuse conditions.
3.3. Equivalent Circuit Model (ECM)
The equivalent circuit model (ECM) emulates the electrical behavior of a battery through the representation of an electrical circuit. This model incorporates a circuit configuration comprising an open-circuit voltage (OCV), an internal resistance (), and some resistor–capacitor pairs. A battery can be precisely modeled using an infinite number of resistor–capacitor pairs, but a battery can also be highly accurately modeled with the assumption of two R-C pairs. This assumption leads to a model called the ‘Thévenin’ model. Figure 2 illustrates the specific electrical circuit employed in the ECM.
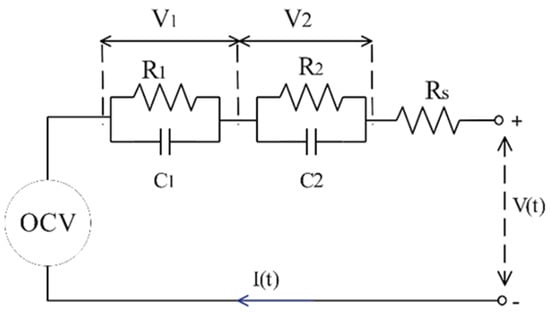
Figure 2.
Schematic of double R-C pair equivalent circuit model (ECM).
Running some static and dynamic experiments, the values of OCV, , , , , and can be found as a function of state of charge (SOC) and battery’s temperature.
Electrochemical heat generation () in Equation (10) can be computed as follows [50]:
It is notable that in the battery’s active zone, Equations (10)–(12) should be solved, whereas, in passive zones, only the potential equation is solved, and the second equation is excluded by setting the electrical conductivity to zero.
To simulate a battery pack, it is necessary to consider the effect of busbars. Busbars are usually very thin and difficult to mesh. So, to solve this problem, a virtual connection between batteries is considered, and Joule heating is neglected in these areas.
3.4. Assumptions
Some assumptions are considered in these simulations which are presented as follows:
- All batteries are identical and have the same initial state of charge at the start of the simulations.
- The porous media between batteries is assumed to be homogeneous.
- The boundary condition in outlets is ‘pressure outlet’ and in inlets is ‘velocity inlet’.
- Natural convection is considered on the battery box, and the heat transfer coefficient is 5 W/m·K.
4. Grid Study
The time-step independence of the solution is essential to validate the accuracy of numerical studies, especially when a transient solution is carried out. Figure 3 displays a graph illustrating the effect of time step on cell heat generation, specifically for the started time steps. Based on the data, during the first 50 s, the results for heat generation exhibit a maximum 3% variations when using time steps of 1, 5, and 10. However, after 60 s, these differences become negligible. Therefore, to optimize computational efficiency while maintaining accuracy, a time step of 10 is chosen for studying heat generation beyond 60 s, while, in the first 60 s, the time step is considered as 1.
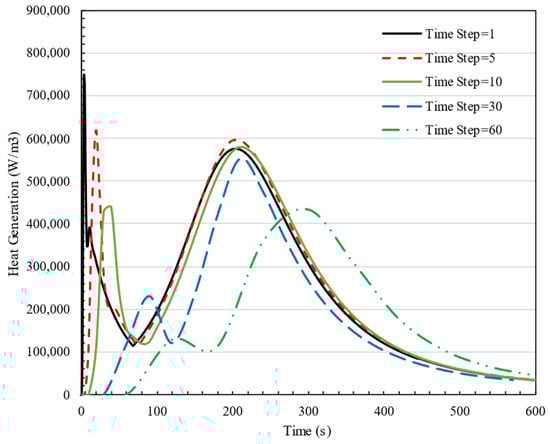
Figure 3.
Time step study on heat generation of a cell in charge rate 3C for different time steps from 1 s to 60 s.
Prior to commencing problem-solving, it is essential to verify that the solution outcomes are unaffected by the mesh size. Enhancing the quantity of meshes enhances solution accuracy but also escalates computational expenses. Hence, the assessment of independence from the system needs to be conducted. Ansys Meshing 2023 software is utilized in this section to create a mesh for the specified geometry. The battery compartment is partitioned into five sections to enhance the quality of the meshes. The inflation method has been utilized to accurately represent the boundary layer along the walls around the solid area. Five distinct computer grids were tested in this part, which demonstrated that, once the number of meshes exceeded 2,753,472 elements, the variations in battery temperature during BTMS charging mode were negligible. Throughout this paper, 2,753,472 represents the number of meshes for BTMS gradient. Table 3 shows the number of mesh structures which are used in the grid study. The factors that affect the number of meshes in this study are fluid domain mesh size, inflation mesh size rate near battery walls, and mesh sizes on solid bodies including batteries. Figure 4 displays the grid utilized.
Table 3.
Grid study.
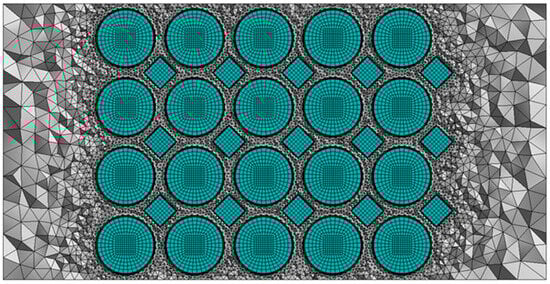
Figure 4.
Mesh used in this study.
5. Validation
The performance of the equivalent circuit model for a cell is verified against the results of Li et al. [50] at different discharge rates (1C and 2C). Figure 5 shows that the simulation results agree well with the experimental data for an 18650 cylindrical battery with a nominal capacity of 2.5 Ah. The ambient temperature in this study is 298.15 K. To evaluate the accuracy of the numerical model, error metrics were computed between the simulation results and experimental data at different discharge rates. The Mean Absolute Error (MAE) was found to be 1.92 for C1 and 0.28 for C2. Additionally, the Mean Absolute Percentage Error (MAPE) remained below 1% in both cases, confirming the reliability of the numerical predictions.
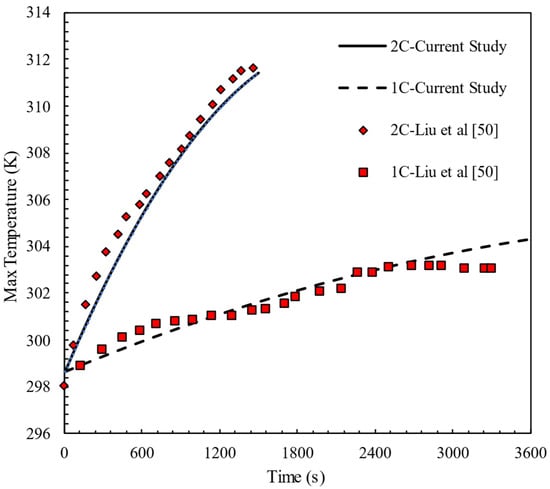
Figure 5.
Model validation at single cell with experimental results of Li et al. [50].
The heat generation in a lithium-ion battery during operation can be mathematically described as , where Q is the total heat generated, I is the current, is the internal resistance, and represents the polarization losses. The current I is proportional to the C-rate, defined as , where C is the battery’s capacity. The first term, , accounts for Joule heating due to internal resistance, while the second term, , reflects the heat generated from polarization effects, which become more pronounced at higher C-rates. In many cases, especially at moderate C-rates, the term can often be small compared to the Joule heating term and may be neglected in thermal calculations.
Figure 6 illustrates the effect of charging and discharging rates on battery heat generation in a steady-state condition. The graph presents heat generation as a function of C-rate (ranging from 1C to 5C) for both charging and discharging phases, showing a quadratic relationship for each case. Furthermore, the graph shows the amount of heat generation at t = 1000 s at different C-rates. By fitting a quadratic equation to this graph, it is obvious that the amount of heat generation in both charging and discharging stages is directly proportional to the square of the C-rate. Equation (20). shows the relationship between heat generation and C-rate.
where is heat generated in a cell at 1C when charging and discharging the battery pack. Also, Figure 6 shows that heat generation during charging is 7% higher when discharging the battery pack on average. The yellow and blue dotted lines represent the fitted curves corresponding to the charge and discharge data, respectively, illustrating the relationship between heat generation and C-rate.
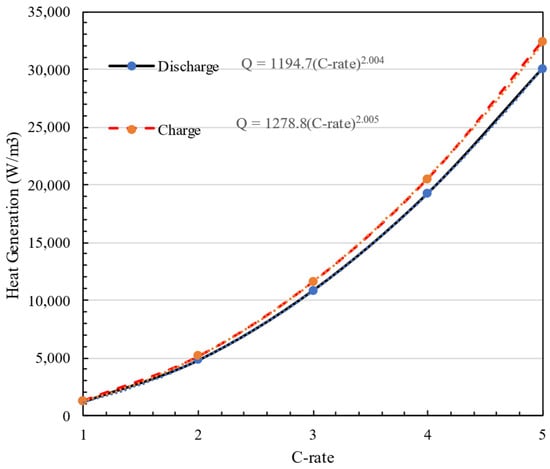
Figure 6.
Heat generation amount at different C-rate = 1C–5C in charge and discharge modes.
The figure shows a clear relationship between heat generation and C-rate for both charge and discharge phases, and it quantitatively represents the heat generated at various C-rates using fitted power laws.
6. Results
6.1. Heat Generation in Battery Pack
In this section, the heat generation of a cell in a battery pack set at different C-rates and different configurations of 20 batteries in parallel and series in two charging and discharging modes has been investigated. It is expected that the rate of heat generation in the battery will increase with the increase in charge rate because the current passing through the battery will increase with the increase in charge rate. Figure 7 shows how heat generation changes at different charge and discharge rates (C-rate = 1C–5C) over time in a 4S5P battery pack.
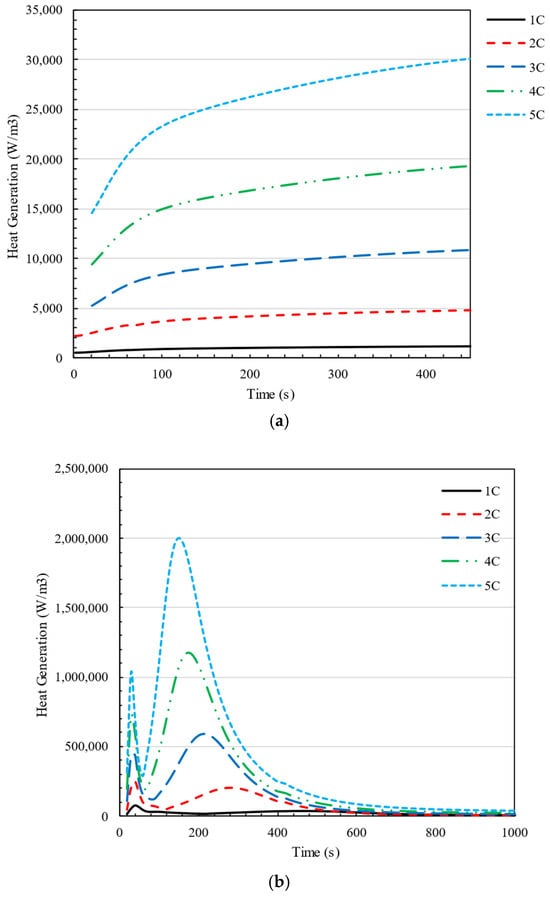
Figure 7.
Changes in heat generation in a cell at C-rate = 1C–5C over time in 4S5P configuration in (a) discharging and (b) charging of the battery pack.
During the discharging mode, it is evident that heat generation steadily increases after the battery discharge begins. However, as time passes, the rate of heat generation decreases, eventually reaching a point where the changes in heat generation become negligible. On the other hand, during the charging phase, there are two periods of maximum heat generation within the first ten minutes, followed by a consistent level of heat generation. The two peaks in the heat generation rate during charging are attributed to different thermal effects within the battery: the first peak occurs due to the internal resistance (IR drop) at the start of charging, while the second peak appears near the end of charging due to concentration polarization and slower lithium-ion diffusion, leading to increased energy dissipation Figure 8 compares the cell voltage during both the discharge and charge processes with a 3C rate. As can be seen, the voltage increases dramatically as soon as the charging process starts, which causes high heat generation in the cell. This phenomenon justifies the peak heat generation in charging cells. The initial voltage jump observed during charging is attributed to the internal resistance (IR drop), which causes a sudden increase when current is applied, whereas during discharge, the voltage drop is smaller due to the absence of charge accumulation, a more gradual electron flow, and different reaction kinetics. This behavior aligns with expected lithium-ion battery characteristics and has been validated against experimental data.
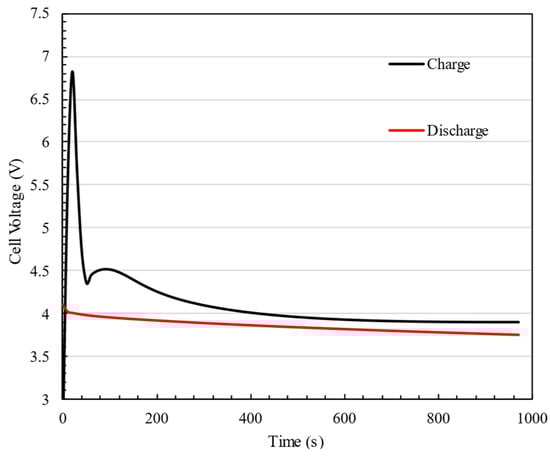
Figure 8.
Cell voltage during the discharge and charge processes at a 3C rate.
As is shown in Figure 7a, a rapid rise in heat generation occurs during the initial few minutes of charging the battery. The introduced relationship in Equation (20). is not followed in this section of the figure. Additionally, the peak time at which the battery’s generated heat reaches its maximum varies depending on the charging rate (C-rate). As C-rate increases, the heat generates more and sooner, where at C-rate = 1, is ; and at C-rate = 5, .
Battery pack designers have many considerations when selecting the number of batteries in series or parallel. The energy and power of a battery pack can be calculated by the following equations [51]:
where is the number of batteries in series, and is the number of batteries in parallel. So different battery pack configurations will not affect the energy and power of the battery pack, but economic and safety factors should be considered as the overall battery pack voltage should be less than 100 V, and the power electronics required for higher voltages will become more expensive. The generated heat by a battery is completely affected by the current and voltage on a specific battery. Thus, in this section, the amount of heat generated heat in a battery pack with different battery configurations at various charge and discharge rates is presented. The findings demonstrate that Equation (20) operates independently of battery design, including 2S10P, 4S5P, 5S4P, and 10S2P connections. Figure 9 depicts the effect of the number of batteries in series in a battery pack () on the heat generation of each cell. This figure also shows that heat generation in the battery pack is completely related to the square of the number of series lines in the battery pack. The trends highlight that, as more cells are added in series, the cumulative heat generation escalates rapidly. This quadratic relationship emphasizes the importance of thermal management strategies in large-scale battery packs, where increasing the number of cells in series can lead to excessive heat buildup, potentially impacting performance and safety. The yellow, grey, and blue dotted lines represent the corresponding fitted curves for each dataset, illustrating the trend of heat generation as a function of n
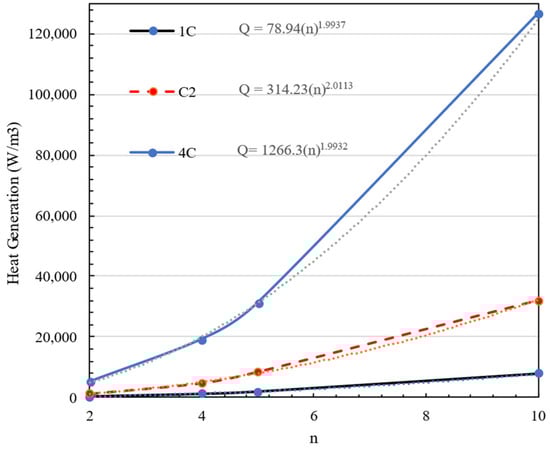
Figure 9.
The effect of number of batteries in series () in a battery pack on heat generation.
6.2. Effectiveness of Incorporating Porous Materials
This study uses a hybrid BTMS to control temperature and temperature difference through a battery pack using air and a cold plate. In this system, air enters the battery pack from the upside, passes through the gaps between batteries, and exits from the side walls. The gaps between batteries define a porous medium. Porous materials provide a great passive cooling option for BTMS due to their availability, different properties, and cheap production costs [52]. In this section, the effect of porous material on the maximum temperature and temperature difference in a battery pack is investigated. In this section, five different porous materials, such as aluminum foam, copper foam, silicon carbide, aluminum oxide, and graphite, are considered. The properties of these materials are presented in Table 4. In this section, in all cases, the ambient temperature and cold plate temperature are 300 K.
Table 4.
Properties of different porous materials [52].
Figure 10 compares and illustrates the maximum temperature and temperature difference in the battery pack for various porous materials when the battery charges and discharges at 5C. It can be seen from the obtained results in Figure 10a that graphite performs better in maintaining the battery pack’s maximum temperature. The results show that using graphite improves the battery pack’s temperature distribution when comparing temperature difference values. In discharge, all porous materials show good performance where the temperature difference in all cases is under 1 K and the maximum temperature is about 302.61 K for aluminum oxide and 300.17 K for graphite.
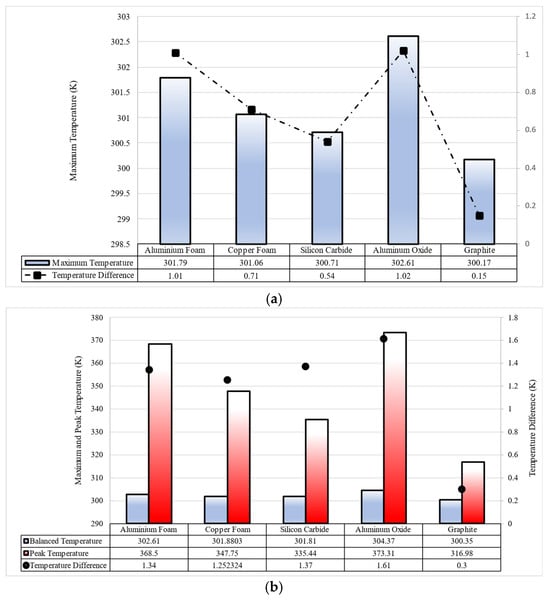
Figure 10.
The performance of aluminum foam, copper foam, silicon carbide, aluminum oxide, and graphite in 5C (a) discharging and (b) charging of the battery pack.
As shown in Figure 10b, in charging, heat generation increases to a peak amount, and after that, it decreases to a stabilized amount. This heat generation trend affects the battery temperature, so, in battery charging, cells experience a peak temperature, and then the temperature stabilizes when the cooling system acts in the system. The battery used in this study has an upper working temperature of 318 K, as shown in Figure 10b. Also, it shows that the only material that can keep the battery pack’s peak temperature below 318 K in 5C charging is graphite, where the peak temperature is 316.98 K. Graphite is the only porous material that can keep cells’ temperatures in the safety range (273 K < T < 318 K) in 5C charging.
Figure 11 demonstrates that charging the battery pack using graphite between the batteries results in the battery temperature remaining below 318 K, which is within the acceptable limit, while charging at a rate of 1C. The battery temperature exceeds the permissible range significantly when charging for 3C and 5C batteries. On the other hand, if graphite fills the gap between the batteries, the battery temperature remains below 318 K, demonstrating graphite’s effectiveness in regulating the battery pack temperature when charging at a rate of 5C. Comparing the two plots shows that when the graphite is placed between the batteries, the temperature stabilizes more quickly. The battery pack reaches a steady temperature after 10 min of charging at 5C. Without using graphite, the time is over one hour. In the nonporous media configuration, there is no additional material between the battery cells, meaning that only air occupies the gaps, and cooling relies solely on natural or forced convection rather than enhanced heat dissipation through porous structures.
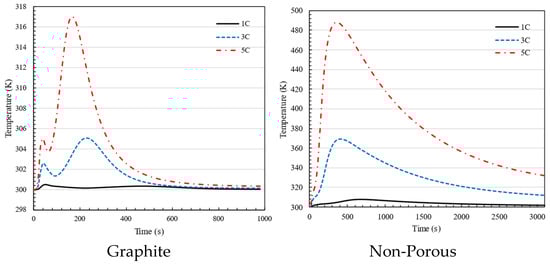
Figure 11.
Maximum temperature in 1C, 3C and 5C charging of battery for the battery pack using graphite and non-porous media.
Figure 12 illustrates temperature contours on the surface of a battery pack cell, comparing the utilization of pure medium, aluminum foam, and graphite in the space between cells. Graphite has enhanced thermal performance by substantially reducing both the maximum temperature and temperature differences over the surface of the cell in comparison to aluminum foam. This indicates the efficacy of graphite in dissipating heat, which is essential for preventing overheating and ensuring equitable distribution of heat within the battery pack. The results highlight the potential of graphite as a preferable material for improving the dependability, safety, and lifespan of battery systems by boosting thermal control.
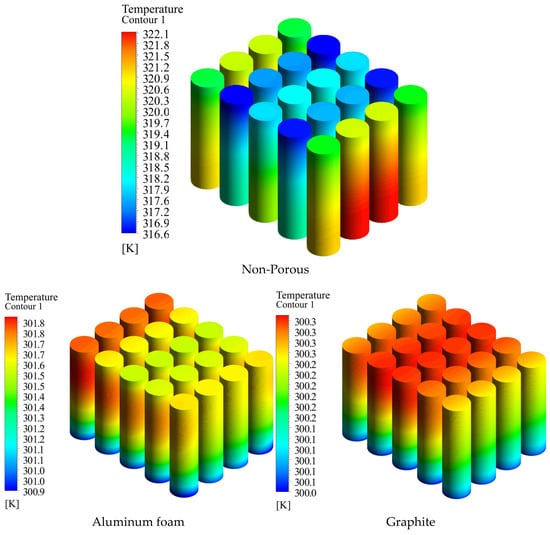
Figure 12.
Temperature contour on the surface of the battery when pure medium, aluminum foam, and graphite are utilized in the gap between the batteries.
Figure 13 displays the temperature variation in the battery during charging with and without porous material. The allowable temperature variation in the battery is 5 K. The method described in this study exceeds the limit only in 5C mode, when the temperature differential between the two batteries drops below 5 K after 6 min. Without porous material, while charging at rates of 3C and 5C for one hour, the battery’s temperature exceeds the acceptable limit, highlighting the improved performance of the developed system compared to the porous condition.
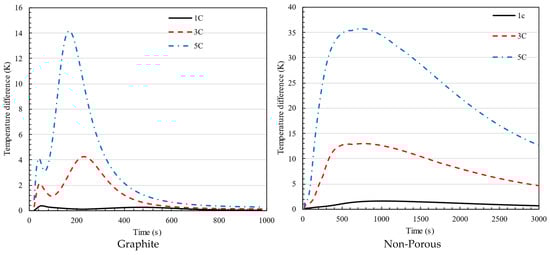
Figure 13.
Temperature difference in 1C, 3C, and 5C charging of battery for the battery pack using graphite and non-porous media.
The absence of the first peak in the non-porous plot compared to the graphite plot is due to differences in heat dissipation mechanisms. In the graphite configuration, the high thermal conductivity of the graphite plate allows for rapid heat spreading, resulting in an initial peak as the system quickly redistributes heat before stabilizing. Conversely, in the non-porous case, heat dissipation relies primarily on natural convection, which is significantly slower and less effective at distributing heat. This leads to a more gradual temperature rise without a distinct initial peak, as heat accumulates more uniformly over time.
Figure 14 and Figure 15 show the highest temperature and temperature variation for the discharge mode, respectively. Even if the temperature and temperature difference are within the acceptable range in all scenarios during discharge, the presence of a graphite causes the temperature to stabilize at a lower value compared to when there is no porous medium. Furthermore, comparing the highest temperature values reveals that the temperature stabilizes rapidly when using graphite, while the maximum temperature remains constant in the battery. Comparing temperature differences allows us to highlight graphite’s outstanding ability to achieve an appropriate temperature distribution.
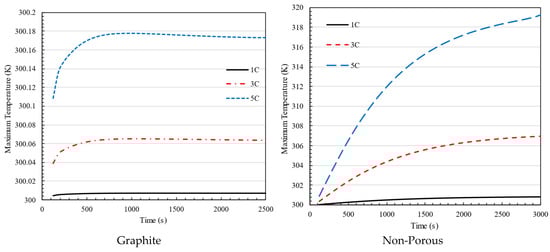
Figure 14.
Maximum temperature in 1C, 3C, and 5C discharging of battery for the battery pack using graphite and non-porous media.
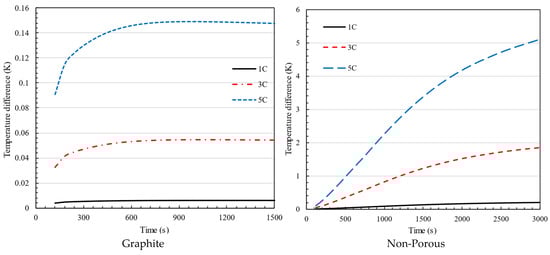
Figure 15.
Temperature difference in 1C, 3C, and 5C discharging of battery for the battery pack using graphite and non-porous media.
Temperature variations inside battery packs have a substantial effect on their performance, safety, durability, and effectiveness. Uniform temperature across cells promotes peak performance and effectiveness, minimizing the chances of thermal runaway and other safety concerns. It also prolongs the battery’s lifetime by minimizing damage from severe temperatures.
Figure 16 shows the temperature distribution on a horizontal wall (y = 35 mm) for batteries with and without the presence of graphite at 5C charging and discharging of the battery pack. As shown in both the charging and discharging of the battery pack, using graphite can help to distribute heat more uniformly throughout the battery pack. For non-porous battery packs, a temperature difference of about 5 K and 7 K for discharging and charging, respectively, is observed between cells in the side lines and central lines. This difference is less than 0.5 K for a battery pack containing graphite. Furthermore, Figure 16 shows that, when graphite is used in the battery pack, the thermal concentration will not be on cells, and the gap between them will be in a uniform thermal condition.
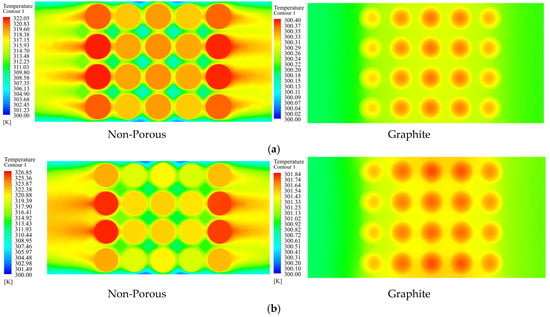
Figure 16.
Temperature distribution in horizontal plan (y = 35 mm) for graphite and non-porous battery packs at 5C charging and discharging process. (a) Discharge. (b) Charge.
Figure 17 illustrates the impact of graphite integration on the thermal behavior of the battery pack under 5C charging conditions, comparing thermal abuse and normal conditions for both graphite and non-porous cases. The non-porous case under thermal abuse (black line) shows a rapid temperature rise, exceeding 700 K, indicating a high risk of thermal runaway and insufficient heat dissipation. In contrast, the porous configuration with graphite limits the maximum temperature to approximately 350 K, demonstrating superior thermal management by effectively spreading and dissipating heat. Additionally, under normal conditions with graphite, the temperature remains stable near 300 K, confirming that the designed cooling system effectively manages heat generation during standard operation.
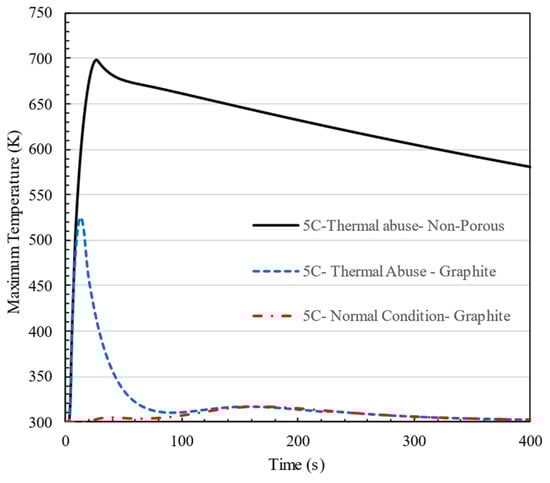
Figure 17.
Effect of graphite on the thermal stability of the designed battery pack under 5C charging conditions, comparing thermal abuse and normal conditions.
This comparison highlights the effectiveness of the porous graphite cooling strategy in preventing extreme temperature rises and enhancing the safety of the battery pack under high C-rate and thermal abuse scenarios.
6.3. Battery Pack Performance at Different Conditions
ANSYS Fluent software (Release 2023 R1) was employed in this study to evaluate the thermal equilibrium of battery temperatures under varying system design parameters. These parameters include ambient temperature, air velocity entering the battery pack, and the cold plate surface temperature. A parametric study was conducted to analyze the influence of these factors on the maximum temperature of the battery pack and the temperature differential between its maximum and minimum values. The results demonstrate the proposed system’s capability to regulate the maximum temperature and minimize temperature variation across different operating conditions. In this configuration, aluminum foam is used as filler material between the batteries, and all simulations were conducted at a discharge rate of 5C.
Figure 18a illustrates the effect of air inlet velocity on the maximum battery pack temperature at various ambient temperatures, with the cold plate temperature fixed at 280 K. The trend shows that the maximum temperature increases with the rise in ambient temperature. Even with a temperature difference of up to 40 K between the cold plate and the ambient temperature, the battery thermal management system (BTMS) successfully maintains the maximum temperature within acceptable limits.
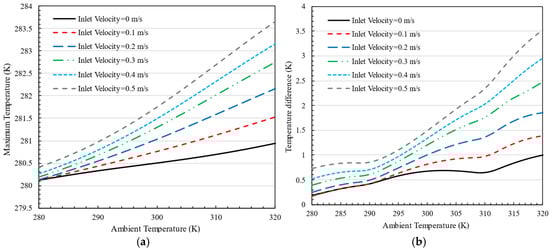
Figure 18.
The effect of air inlet velocity on the (a) maximum temperature and (b) temperature difference in the battery pack at different ambient temperatures for K.
Similarly, Figure 18b depicts the temperature difference within the battery pack as a function of air inlet velocity. As the air inlet velocity increases, so does the temperature differential. However, even at higher ambient temperatures, the system keeps this difference below 3.5 K, indicating the system’s ability to maintain a temperature difference of less than 3 K in most cases. Notably, as the ambient temperature exceeds the cold plate temperature, increasing the air velocity results in higher overall battery temperatures and a greater temperature difference within the pack.
Figure 19a illustrates the impact of air inlet velocity on the maximum battery pack temperature at different ambient temperatures, with the cold plate temperature set to 300 K. The graph indicates that as the ambient temperature rises, the maximum battery temperature also increases. Notably, as the air inlet velocity increases, the rate of temperature increase becomes more pronounced. However, in all scenarios, the designed battery thermal management system (BTMS) successfully maintains the battery pack’s temperature within an acceptable range. Additionally, the graph shows that the temperature difference between the battery pack and the cold plate remains under 2 K in all conditions.
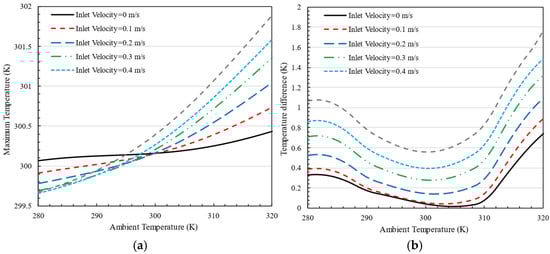
Figure 19.
The effect of air inlet velocity on the (a) maximum temperature and (b) temperature difference in the battery pack at different ambient temperatures for K.
Figure 19b highlights the temperature difference within the battery pack when the cold plate is set to 300 K. The temperature difference is minimal when the ambient temperature is between 300 K and 310 K, with a differential of less than 2 K in all cases. This indicates improved thermal performance compared to the scenario with a cold plate temperature of 280 K, ensuring better temperature uniformity within the battery pack. As shown in Figure 19, the temperature rise is more rapid as the inlet velocity increases due to enhanced convective heat transfer. Higher air velocities facilitate greater heat dissipation from the battery surface, but they also increase heat transfer rates within the battery pack, causing a sharper initial temperature to rise before stabilization. At a room temperature of 320 K, the zero-inlet velocity condition exhibits a lower maximum temperature compared to others because, in the absence of forced convection, the dominant heat transfer mechanism is natural convection, which leads to slower but more uniform heat dissipation, preventing localized overheating.
7. Conclusions
A hybrid thermal management system was developed in the study, incorporating an air-cooling system, a cold plate, and porous materials. An extensive investigation was carried out to study heat generation in the battery pack during charging and discharging. A model was developed to forecast heat transfer in the battery pack with varying forms and charging rates. A study was conducted to examine the impact of five different types of porous materials on the maximum temperature and temperature difference in a battery pack. This study evaluated these factors with and without the presence of porous materials. The battery pack design was subjected to testing in various weather conditions. The main points of the present study are as follows:
- The heat produced during charging and discharging is directly proportional to the square of the C-rate, applicable to all battery pack configurations.
- The heat produced in a battery pack increases in direct proportion to the square of the number of batteries connected in series.
- Five distinct porous materials, including aluminum foam, copper foam, silicon carbide, aluminum oxide, and graphite, are analyzed. The results indicate that graphite demonstrates superior performance in maintaining the maximum cell temperature and temperature difference within an acceptable range throughout both the charging and discharging of the battery pack.
- The suggested battery pack can maintain cells within the permissible range during charging and discharging at rates up to 5C.
- Porous materials help maintain a stable temperature in the battery pack within 10 min of the battery beginning to charge or discharge. In the scenario where a porous material is not utilized, the temperature stabilizes after one hour.
- Analyzing temperature contours of a battery pack reveal improved temperature dispersion during both the charging and draining processes.
- The suggested BTMS is evaluated under various conditions. BTMS performance is consistently satisfactory in all scenarios during the 5C charging of the battery pack.
These findings state that using graphite can obviously increase the efficiency of a hybrid battery pack while decreasing energy costs in active cooling systems such as air-cooling and liquid-cooling thermal management systems.
Author Contributions
Conceptualization, A.R.; investigation, A.R.; writing—original draft preparation, A.R.; writing—review and editing, M.A.; visualization, A.R., supervision, M.A. and M.D.; project administration, A.R. All authors have read and agreed to the published version of the manuscript.
Funding
This research received no external funding.
Data Availability Statement
The original contributions presented in this study are included in the article. Further inquiries can be directed to the corresponding author.
Conflicts of Interest
The authors declare no conflict of interest.
Nomenclature
| Unit | Description | |
| A | m2 | Area |
| F | Capacitor | |
| j/kg·K | Specific heat capacity | |
| m | Pore diameter | |
| ampere | Current | |
| Volumetric current transfer rate | ||
| W/m·K | PCM thermal conductivity | |
| W/m·K | TEC material thermal conductivity | |
| J/kg | Latent heat | |
| W | Heat generation | |
| Qc | W | Heat absorption |
| QH | W | Heat release |
| ohm | Resistor | |
| ohm | Internal resistance | |
| Electrical resistance | ||
| t | s | Time |
| K | Temperature | |
| K | Cold temperature | |
| K | Hot temperature | |
| v | m/s | Velocity |
| V | volt | Voltage |
| volt | Open-circuit voltage | |
| Seebeck coefficient | ||
| - | Fluid fraction | |
| - | Porosity | |
| Ohm·m | Effective electric conductivity for positive electrode | |
| Ohm·m | Effective electric conductivity for negative electrode | |
| Joule/kg | Phase potential for positive electrode | |
| Joule/kg | Phase potential for negative electrode | |
| density | ||
| Battery thermal management system | ||
| CFD | Computational fluid dynamics | |
| COP | Coefficient of performance | |
| SOC | State of charge | |
References
- Ravi, S.S.; Brace, C.; Larkin, C.; Aziz, M.; Leach, F.; Turner, J.W. On the pursuit of emissions-free clean mobility—Electric vehicles versus e-fuels. Sci. Total Environ. 2023, 875, 162688. [Google Scholar] [CrossRef] [PubMed]
- Hu, H.; Xu, X.; Sun, X.; Li, R.; Zhang, Y.; Fu, J. Numerical study on the inhibition control of lithium-ion battery thermal runaway. ACS Omega 2020, 5, 18254–18261. [Google Scholar] [CrossRef]
- Zhao, J.; Song, C.; Li, G. Fast-charging strategies for lithium-ion batteries: Advances and perspectives. ChemPlusChem 2022, 87, e202200155. [Google Scholar] [CrossRef] [PubMed]
- Su, Y.D.; Preger, Y.; Burroughs, H.; Sun, C.; Ohodnicki, P.R. Fiber optic sensing technologies for battery management systems and energy storage applications. Sensors 2021, 21, 1397. [Google Scholar] [CrossRef]
- Rahmani, A.; Dibaj, M.; Akrami, M. Recent advancements in battery thermal management systems for enhanced performance of Li-ion batteries: A comprehensive review. Batteries 2024, 10, 265. [Google Scholar] [CrossRef]
- Saavedra, J.; Gonzalez Cuadrado, D. Thermal Sensor Allocation for Effective and Efficient Heat Transfer Measurements in Transportation Systems. Sensors 2023, 23, 2803. [Google Scholar] [CrossRef] [PubMed]
- Afzal, A.; Abdul Razak, R.K.; Mohammed Samee, A.D.; Kumar, R.; Ağbulut, Ü.; Park, S.G. A critical review on renewable battery thermal management system using heat pipes. J. Therm. Anal. Calorim. 2023, 148, 8403–8442. [Google Scholar] [CrossRef]
- Rahmani, A.; Dibaj, M.; Akrami, M. A study on a battery pack in a hybrid battery thermal management system integrating with thermoelectric cooling. Case Stud. Therm. Eng. 2024, 61, 104856. [Google Scholar] [CrossRef]
- Mariam, E.; Ramasubramanian, B.; Reddy, V.S.; Dalapati, G.K.; Ghosh, S.; Sherin, T.; Chakrabortty, S.; Motapothula, M.R.; Kumar, A.; Ramakrishna, S.; et al. Emerging trends in cooling technologies for photovoltaic systems. Renew. Sustain. Energy Rev. 2024, 192, 114203. [Google Scholar] [CrossRef]
- Sharif, M.; Seker, H. Smart EV charging with context-awareness: Enhancing resource utilization via deep reinforcement learning. IEEE Access 2024, 12, 7009–7027. [Google Scholar] [CrossRef]
- Wu, Y.; Huang, Z.; Li, D.; Li, H.; Peng, J.; Stroe, D.; Song, Z. Optimal battery thermal management for electric vehicles with battery degradation minimization. Appl. Energy 2024, 353, 122090. [Google Scholar] [CrossRef]
- Lin, X.W.; Li, Y.B.; Wu, W.T.; Zhou, Z.F.; Chen, B. Advances on two-phase heat transfer for lithium-ion battery thermal management. Renew. Sustain. Energy Rev. 2024, 189, 114052. [Google Scholar] [CrossRef]
- Shahzad, K.; Cheema, I.I. Low-carbon technologies in automotive industry and decarbonizing transport. J. Power Sources 2024, 591, 233888. [Google Scholar] [CrossRef]
- Zhang, S.B.; Nie, F.; Cheng, J.P.; Yang, H.; Gao, Q. Optimizing the air flow pattern to improve the performance of the air-cooling lithium-ion battery pack. Appl. Therm. Eng. 2024, 236, 121486. [Google Scholar] [CrossRef]
- Kumar, R.; Singh, L.K.; Gupta, A.K. Evaluating air-cooling performance of lithium-ion-battery module with various cell arrangements. Energy Technol. 2024, 12, 2301061. [Google Scholar] [CrossRef]
- Chen, K.; Zhang, Z.; Wu, B.; Song, M.; Wu, X. An air-cooled system with a control strategy for efficient battery thermal management. Appl. Therm. Eng. 2024, 236, 121578. [Google Scholar] [CrossRef]
- Moosavi, A.; Ljung, A.L.; Lundström, T.S. A study on the effect of cell spacing in large-scale air-cooled battery thermal management systems using a novel modeling approach. J. Energy Storage 2023, 72, 108418. [Google Scholar] [CrossRef]
- Oyewola, O.M.; Idowu, E.T. Effects of step-like plenum, flow pattern and inlet flow regime on thermal management system. Appl. Therm. Eng. 2024, 243, 122637. [Google Scholar] [CrossRef]
- Lan, X.; Li, X.; Ji, S.; Gao, C.; He, Z. Design and optimization of a novel reverse layered air-cooling battery management system using U and Z type flow patterns. Int. J. Energy Res. 2022, 46, 14206–14226. [Google Scholar] [CrossRef]
- Wang, Y.; Yu, Y.; Jing, Z.; Wang, C.; Zhou, G.; Zhao, W. Thermal performance of lithium-ion batteries applying forced air cooling with an improved aluminium foam heat sink design. Int. J. Heat Mass Transf. 2021, 167, 120827. [Google Scholar] [CrossRef]
- Zhang, S.B.; He, X.; Long, N.C.; Shen, Y.J.; Gao, Q. Improving the air-cooling performance for lithium-ion battery packs by changing the air flow pattern. Appl. Therm. Eng. 2023, 221, 119825. [Google Scholar] [CrossRef]
- Zhang, F.; Liu, P.; He, Y.; Li, S. Cooling performance optimization of air cooling lithium-ion battery thermal management system based on multiple secondary outlets and baffle. J. Energy Storage 2022, 52, 104678. [Google Scholar] [CrossRef]
- Kang, D.; Lee, P.Y.; Yoo, K.; Kim, J. Internal thermal network model-based inner temperature distribution of high-power lithium-ion battery packs with different shapes for thermal management. J. Energy Storage 2020, 27, 101017. [Google Scholar] [CrossRef]
- Shahid, S.; Agelin-Chaab, M. Development and analysis of a technique to improve air-cooling and temperature uniformity in a battery pack for cylindrical batteries. Therm. Sci. Eng. Prog. 2018, 5, 351–363. [Google Scholar] [CrossRef]
- Oyewola, O.M.; Awonusi, A.A.; Ismail, O.S. Design optimization of Air-Cooled Li-ion battery thermal management system with Step-like divergence plenum for electric vehicles. Alex. Eng. J. 2023, 71, 631–644. [Google Scholar] [CrossRef]
- Jiang, W.; Feng, G.; Wang, H.; Chang, Z.; Tan, X.; Ji, J.; Zhang, Y.; Zhou, J. Analysis of hybrid active-passive prismatic Li-ion battery thermal management system using phase change materials with porous-filled mini-channels. J. Energy Storage 2024, 80, 110144. [Google Scholar] [CrossRef]
- Verma, S.P.; Saraswati, S. Numerical and experimental analysis of air-cooled Lithium-ion battery pack for the evaluation of the thermal performance enhancement. J. Energy Storage 2023, 73, 108983. [Google Scholar] [CrossRef]
- Zhao, G.; Wang, X.; Negnevitsky, M.; Li, C. An up-to-date review on the design improvement and optimization of the liquid-cooling battery thermal management system for electric vehicles. Appl. Therm. Eng. 2023, 219, 119626. [Google Scholar] [CrossRef]
- Maknikar, S.K.; Pawar, A.M. Application of phase change material (PCM) in battery thermal management system (BTMS): A critical review. Mater. Today Proc. 2023; in press. [Google Scholar] [CrossRef]
- Kavasoğullari, B.; Karagöz, M.E.; Yildiz, A.S.; Biçer, E. Numerical investigation of the performance of a hybrid battery thermal management system at high discharge rates. J. Energy Storage 2023, 73, 108982. [Google Scholar] [CrossRef]
- Jiang, Z.; Li, H.; Sun, Z.; Qu, Z. Experimental study on 18650 lithium-ion battery-pack cooling system composed of heat pipe and reciprocating air flow with water mist. Int. J. Heat Mass Transf. 2024, 222, 125171. [Google Scholar] [CrossRef]
- Sharma, D.K.; Agarwal, P.; Prabhakar, A. Effect of fin design and continuous cycling on thermal performance of PCM-HP hybrid BTMS for high ambient temperature applications. J. Energy Storage 2023, 74, 109360. [Google Scholar] [CrossRef]
- Asli, M.; König, P.; Sharma, D.; Pontika, E.; Huete, J.; Konda, K.R.; Mathiazhagan, A.; Xie, T.; Höschler, K.; Laskaridis, P. Thermal management challenges in hybrid-electric propulsion aircraft. Prog. Aerosp. Sci. 2024, 144, 100967. [Google Scholar] [CrossRef]
- Moaveni, A.; Siavashi, M.; Mousavi, S. Passive and hybrid battery thermal management system by cooling flow control, employing nano-PCM, fins, and metal foam. Energy 2024, 288, 129809. [Google Scholar] [CrossRef]
- Rahmani, A.; Dibaj, M.; Akrami, M. Computational investigation of magnetohydrodynamic flow and melting process of phase change material in a battery pack using the lattice Boltzmann method. J. Energy Storage 2024, 78, 110046. [Google Scholar] [CrossRef]
- Pakrouh, R.; Hosseini, M.J.; Ranjbar, A.A.; Rahimi, M. A novel liquid-based battery thermal management system coupling with phase change material and thermoelectric cooling. J. Energy Storage 2023, 64, 107098. [Google Scholar] [CrossRef]
- Yang, M.; Mathew, G.; Nemati, H.; Moghimi, M.A. A novel approach for active cooling of a battery at cell level: Air-cooled mini-channel heat sink, enhanced with intermittent metal foam. J. Energy Storage 2024, 81, 110374. [Google Scholar] [CrossRef]
- Sutheesh, P.M.; Atul, A.P.; Rohinikumar, B. Numerical and experimental investigations of thermal performance of lithium-ion battery with hybrid cooling system under dry-out condition. J. Energy Storage 2024, 84, 110889. [Google Scholar] [CrossRef]
- Rahmani, A.; Dibaj, M.; Akrami, M. Enhancing Heat Storage Cooling Systems via the Implementation of Honeycomb-Inspired Design: Investigating Efficiency and Performance. Energies 2024, 17, 351. [Google Scholar] [CrossRef]
- Bargal, M.H.; Abdelkareem, M.A.; Tao, Q.; Li, J.; Shi, J.; Wang, Y. Liquid cooling techniques in proton exchange membrane fuel cell stacks: A detailed survey. Alex. Eng. J. 2020, 59, 635–655. [Google Scholar] [CrossRef]
- Kwon, K.H.; Shin, C.B.; Kang, T.H.; Kim, C.S. A two-dimensional modeling of a lithium-polymer battery. J. Power Sources 2006, 163, 151–157. [Google Scholar] [CrossRef]
- Vanaclocha Hervas, C. Comparative Study of Three Electrochemical Cell Models for the CFD Simulation of a Battery Module. Ph.D. Thesis, Universitat Politècnica de València, Valencia, Spain, 2021. [Google Scholar]
- Yetik, O.; Karakoc, T.H. A numerical study on the thermal performance of prismatic Li-ion batteries for hibrid electric aircraft. Energy 2020, 195, 117009. [Google Scholar] [CrossRef]
- Yetik, O.; Karakoc, T.H. Estimation of thermal effect of different busbars materials on prismatic Li-ion batteries based on artificial neural networks. J. Energy Storage 2021, 38, 102543. [Google Scholar] [CrossRef]
- Yetik, O.; Karakoc, T.H. Thermal and electrical analysis of batteries in electric aircraft using nanofluids. J. Energy Storage 2022, 52, 104853. [Google Scholar] [CrossRef]
- Chen, H.; Zhang, T.; Hua, Y.; Gao, Q.; Han, Z.; Yang, K.; Xu, Y.; Liu, X.; Xu, X.; Wang, S. Simulation study on the interaction between the battery module and busbar under typical driving conditions of electric vehicles. Case Stud. Therm. Eng. 2023, 45, 103006. [Google Scholar] [CrossRef]
- He, H.; Zhang, X.; Xiong, R.; Xu, Y.; Guo, H. Online model-based estimation of state-of-charge and open-circuit voltage of lithium-ion batteries in electric vehicles. Energy 2012, 39, 310–318. [Google Scholar] [CrossRef]
- Hossein Bashiri, A.; Sangtarash, A.; Zamani, M. The effect of the porous media on thermal management of lithium-ion battery pack; a comparative and numerical study. Therm. Sci. Eng. Prog. 2022, 34, 101427. [Google Scholar] [CrossRef]
- ANSYS Inc. ANSYS Fluent Theory Guide, Release 2023 R1; ANSYS Inc.: Canonsburg, PA, USA, 2023; Available online: https://www.ansys.com (accessed on 20 December 2024).
- Li, C.; Cui, N.; Chang, L.; Cui, Z.; Yuan, H.; Zhang, C. Effect of parallel connection topology on air-cooled lithium-ion battery module: Inconsistency analysis and comprehensive evaluation. Appl. Energy 2022, 313, 118758. [Google Scholar] [CrossRef]
- Plett, G.L. Battery Management Systems, Volume II: Equivalent-Circuit Methods; Artech House: London, UK, 2015. [Google Scholar]
- Rashidi, S.; Esfahani, J.A.; Karimi, N. Porous materials in building energy technologies—A review of the applications, modelling and experiments. Renew. Sustain. Energy Rev. 2018, 91, 229–247. [Google Scholar] [CrossRef]
Disclaimer/Publisher’s Note: The statements, opinions and data contained in all publications are solely those of the individual author(s) and contributor(s) and not of MDPI and/or the editor(s). MDPI and/or the editor(s) disclaim responsibility for any injury to people or property resulting from any ideas, methods, instructions or products referred to in the content. |
© 2025 by the authors. Licensee MDPI, Basel, Switzerland. This article is an open access article distributed under the terms and conditions of the Creative Commons Attribution (CC BY) license (https://creativecommons.org/licenses/by/4.0/).