Abstract
Thermal runaway characteristics and hazards of lithium-ion batteries under low ambient pressure in-flight conditions are studied in a dynamic pressure chamber. The influence of ambient pressures (95 kPa and 20 kPa) and packaging forms (cylindrical and pouch commercial batteries) were especially investigated. The results show that the values of heat release, temperature, and concentration decrease with the reduction in pressure from 95 kPa to 20 kPa, while the total hydrocarbon and increase. Without violent fire, explosion, and huge jet flames, the thermal hazards of TR fire under 20 kPa are lower, but the amount of toxic/flammable gas emissions increases greatly. The amount of and hydrocarbons varies inversely with the thermal hazards of fire. Under low-pressure environments of cruise altitude, the thermal hazards of TR fire for pouch cells and the toxic/potentially explosive hazards of gas emissions of cylindrical cells need more attention. The performance of TR hazards for two packaging types of battery is also different. Pouch cells have higher thermal hazards of fire and lower combustible/toxic emitted gases than cylindrical cells. The thermal runaway intensity of individual cells decreases under lower ambient pressure, but the burning intensity increases dramatically when thermal runaway occurs in a battery pack. The open time of a safety valve (rupture of the bag) is shortened, but the trigger time for a thermal runaway varies for different formats of batteries under 20 kPa. Those results may be helpful for the safety warning and hazard protection design of Li batteries under low-pressure conditions.
1. Introduction
Lithium-ion batteries (LIBs) have been widely applied in electronic products, vehicles, and aerospace. It is also seen as a promising power source for multi-electric aircraft, all-electric aircraft, and unmanned aerial vehicles, due to the excellent features of lower weight, high energy density, and less frequent maintenance [1,2]. Compared with the cruise altitude flight, when civil aviation aircraft climb to the stratosphere and the landing time is shorter, the aircraft will spend a long period of time at a high altitude of more than 10,000 m; at this time, the atmospheric pressure can be reduced to 20 kPa. Although almost all of the current passenger cabins are equipped with a pressurization system, the majority of the cargo transport aircraft are still exposed to low-pressure environments. However, when the LIBs are misused or encounter the conditions of high temperature [3], overcharging, short-circuit [4], extrusion, or collision [5,6], the thermal runaway (TR) of LIBs occurs occasionally, which is accompanied by heat release, flammable and toxic gas emissions [7], fire, and explosions [8,9]. As functional, auxiliary power or under transportation conditions, the LIB fire incidents of Boeing 787 in 2013–2014, with LIBs as the auxiliary power, as well as the freighter, encompassed crash accidents involving LIBs in the cargo hold, and similar incidents occurred in an Asiana Airlines 747 near South Korea on 28 July 2011, a UPS 747 in Dubai, and UAE on 3 September 2010 [10]. According to the Federal Aviation Administration (FAA), from January 2006 to January 2022, there were more than 375 aviation incidents raised from LIBs. As shown in Figure 1, some of the FAA’s incomplete statistics on lithium-ion battery safety incidents in the aviation field were obtained over the past 16 years. The TR hazards of LIB have become the main obstacle for further development in the aviation field, it is particularly necessary to study the characteristics of TR behavior of Li-ion batteries under low-pressure environments.
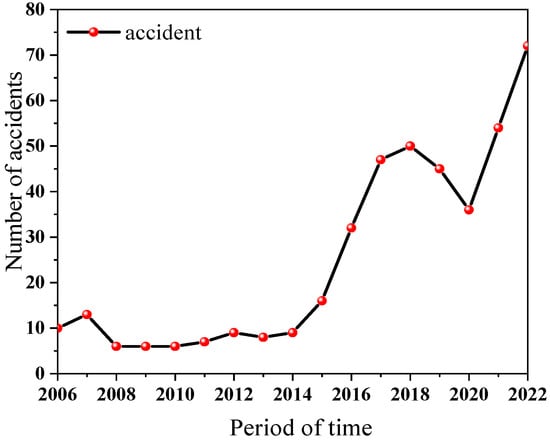
Figure 1.
Lithium-ion battery safety incidents in the global aviation sector.
Considerable research has been carried out to illustrate the TR characteristics of LIBs, under thermal and mechanical abuse [5]. Most works focus on revealing the mechanism of chain reactions inside the batteries and the features of TR propagation [11,12]. During the TR, a series of exothermic reactions and massive internal short circuits release a large amount of heat and gases [13]. As the temperature increases, the battery experiences the thermal decomposition and reactions of the SEI film (60–120 °C), separator (>130 °C), electrolyte (>200 °C), binder, and electrode materials [14]. The TR would be triggered by electric energy released by a massive internal short circuit once the separator collapses [15]. The evolution mechanisms of gas emissions under different temperatures during the TR process are established [16,17,18]. There are more than 100 gaseous products that are identified during the TR, and most of them are hazardous [19]. Seven gas species are confirmed to be the most common within emitted gas products, e.g., , , , , , , and [20,21]. As the most critical and toxic gases, fluoride and F-containing batteries are studied, and the quantity of HF is about 15~120 mg/Wh [22]. Besides these toxic gases, the toxic/potentially explosive gases, i.e., and hydrocarbon, and the asphyxiant gas of also need more attention, which generally accounts for 27.5%, 17.5%, and 24.9% of the total released gas per unit volume, respectively [23]. The combustible and toxic emitted gases are tightly related to the battery materials, capacity, state of charge (SOC), and the TR environments. Higher capacity and a higher SOC lead to an increase in flammable gas composition [24,25]. During the process of TR, visible and audible sparks, jet flame, and deflagration fire can cause huge hazards to human beings [26]. The risks of intense fire and heat associated with toxic/flammable gases and smoke emissions may pose a significant threat to life and property, especially in confined environments, e.g., aircraft, mine shafts, and spacecraft. In a case where the emitted gases are ignited, this can result in an explosion. In addition to the cylindrical LIBs with a hard can, numerous efforts have also been devoted to the TR research of pouch LIBs recently [27]. With a soft aluminum–polymer bag and higher capacity, the TR process of pouch cells is distinct from the cells with hard shells. Yang et al. [28] conducted thermally induced failure tests with 68 Ah pouch LIBs in a 1/2 ISO full test room to investigate the thermal and toxic hazards systematically and observed that the TR process for different stages of charge underwent five burning stages. Akos et al. [29] investigated the initiation of TR for formats of hard-case cells and soft-pouch cells, and revealed the propagation of the initial internal short circuit to the TR. It was determined that only 1% of the battery’s electric energy could initiate the TR in different formats of LIBs. The differences between the pouch and hard-case cell formats in solid to gaseous mass loss proportion were discovered and analyzed, and a new method to calculate the volume of released gas was proposed by Sascha et al. [20].
Previous studies have found that ambient pressure can change the TR characteristics of LIBs. According to the literature, environmental pressure has a significant impact on combustion [30]. With the decrease in atmospheric pressure, the combustion efficiency and mass burning rate reduce for common fuel fire; in addition, the characteristics of fire behaviors and temperature are affected by the pressure [31]. The mass loss, HRR, THR, and combustion efficiency decrease, under low pressure, while increases, and the ignition time is shortened for cylindrical LIBs, through the TR fire tests in Lhasa (64.3 kPa) and Hefei (100.8 kPa), conducted by Chen et al. [32,33]. Fu et al. [34] concluded that the combustion intensity and the battery surface temperature, as well as flame temperature, decrease under a low-pressure environment of 30 kPa. Xie et al. [35,36,37] found that as the ambient pressure decreases, the increase in the number of cycles and the expansion of the charge/discharge multiplicity all lead to a decrease in temperature, HRR, THR, and first venting, while the increase in the overcharge cutoff voltage results in a decrease in the thermal stability of Li-ion batteries, by comparing the tests under 20 kPa and 95 kPa. Su et al. [38] established the thermal contribution of decomposition energy and oxidation combustion energy to peak battery temperature in the TR. Other authors found that the decomposition energy released in the TR is decided by the SOC and almost not affected by ambient pressure, and oxidation combustion energy increases in direct proportion to the ambient pressure [39]. Under the ambient pressures of 95 kPa and 20 kPa, the TR characteristics of lithium-ion batteries with different airflow rates are experimented with, and it was found that the lower the ambient pressure at the same airflow rate, the lower the HRR and THR values; while at the same pressure environment, the HRR and THR values increase with the increase in airflow rate. Regarding the effect of low pressures, the Federal Aviation Administration (FAA) has conducted a series of experiments to study the TR fire hazards, vent gas ignition in cargo compartments, and extinguishment and packaging methods to improve the knowledge of LIB safety issues under various application scenarios, especially, the installed Li batteries on transport aircraft [40]. The National Aeronautics and Space Administration (NASA) observed that the vented electrolyte cannot be ignited, while the TR time is shortened under a vacuum environment, through a series of safety tests of 18650 cells used in the spacesuit [41].
The occurrence and development of LIB TR fire in some low-pressure situations, such as the flight phase at high altitudes, are totally different from the ground conditions. The variations in atmospheric pressure and temperature in a flight are quite different from the standard conditions of the land. Especially, in the cruise phase, with an altitude of 9000–13,000 m, the pressure can reach lower than 20 kPa. Most of the time, a flight is at a cruising altitude for the aircraft. Nevertheless, a comprehensive understanding of TR hazards such as fire behaviors, thermal and electric features, and flammable and asphyxiant gas emissions, for different formats of LIBs under low-pressure environments of 20 kPa (the flight cruise phase of civil aviation aircraft), is still not readily available, even though there are some published studies in the literature that have investigated the impact of low ambient pressure (the lowest pressure is 30 kPa) on the TR of LIBs. Typically, the issues of safety and TR hazards for pouch LIBs with high energy density during the cruise phase of aircraft need to be solved. Therefore, it is necessary to gain more insight into the TR process and combustible/toxic emitted gases (especially and hydrocarbons from the TR) of hard-case and soft-packing batteries, which is of vital importance for further applications in the aviation field under a low ambient pressure during the cruise phase. This is also significant for the selection of installed Li batteries on aircraft, the preventive measures, and the protection design.
In this work, the TR characteristics and flammable/toxic gas products of the pouch and cylindrical cells were investigated, in a dynamic pressure cabin. Two different pressure environments of 95 kPa (the atmospheric pressure of ground) and 20 kPa (the pressure of cruise altitude) were selected. The parameters of HRR, THR, smoke/fire/battery surface temperatures, and the light transmittance of smoke were obtained to evaluate the fire hazards. The real-time concentrations of , , and THC were also measured. Furthermore, several important parameters were analyzed in detail, such as peak concentration values of emitted gases, values per capacity, and igniting time.
2. Experimental
2.1. Sample
In this study, commercial cylindrical cells, as well as pouch cells from the same batch, were tested. The 18650 cylindrical LIBs have spirally wound layers inside an outer metal cylinder. The anode material is LiNi0.5Co0.2Mn0.3O2 (NCM), and the cathode material is graphite. In the pouch cell, the layers are stacked on top of each other and sealed by the aluminum–polymer bag. The anode and cathode materials are LiNi0.5Co0.2Mn0.3O2 (NCM) and graphite, respectively. The capacity of cylindrical and pouch cells is 2.6 Ah, 10 Ah, and 15 Ah. Figure 2 and Table 1 show the cells and their specifications.
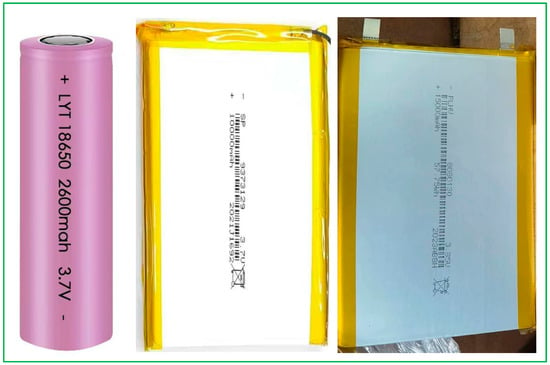
Figure 2.
Fresh battery sample diagram.

Table 1.
Specifications of the cylindrical and pouch LIBs used in the tests.
2.2. Apparatus
The cells were charged and discharged using a LANHE instrument (CT2016D, Wuhan Land Electronic Co. Ltd., Wuhan, China). The charge and discharge rates were kept at 0.5 C. According to the product manual, the LIBs used in the tests were all cycled 10 times and then kept at an SOC of 100%. The charge and discharge of all the cells were conducted at the atmospheric pressure and temperature (25 °C). The TR safety experiments were conducted in a dynamic pressure combustion chamber (size: 2 m × 2 m × 2 m) with variable pressure from 10 kPa to 101 kPa. The pressure accuracy is 0.1 kPa. The experimental equipment mainly consists of a combustion chamber, a pressure control system, an HRR and gas tester (AO2020, Asea Brown Boveri Co., Ltd., Zurich, Switzerland), and an analysis system, as shown in Figure 3a in detail. The chamber pressure was stabilized by controlling the outlet and inlet airflow dynamically. And the airflow rate was set as 120 L/s in all experiments.
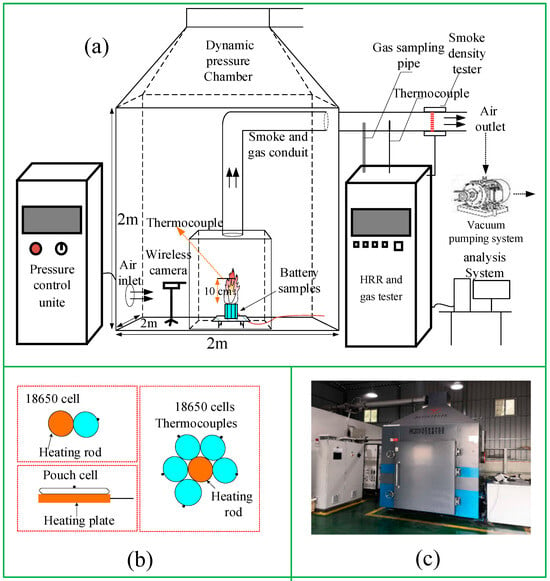
Figure 3.
Diagrammatic diagram of experimental platform and setup: (a) experimental platform, (b) experimental setup in dynamic cabin, and (c) dynamic pressure cabin and test systems.
The dynamic pressure cabin and test systems were calibrated and carried out according to the procedures in the ISO 9705 standard [42]. Combustion emission products of LIBs were collected by the exhaust hood and transported out in the conduit through the air outlet system (vacuum pump). Smoke and gas product samples were extracted to the HRR and gas tester by a vacuum pump through the gas sampling pipe. , , , and THC were measured and recorded by the tester, with a detection limit of 1%. A smoke density tester was used to detect the density of emissions by laser transmittance. The temperature of smoke and gas emissions was obtained by the thermocouple placed in the conduit. A digital camera was placed in front of the LIB samples to record the TR fire behaviors.
Four groups of experiments were designed and conducted at the pressures of 95 kPa (the atmospheric pressure of Guanghan, Deyang, China) and 20 kPa (the pressure of the cruise altitude of civil aviation aircraft).
Group A: Single 18650 LIB of 100% SOC.
Group B: Multiple 18650 LIBs at 100% SOC. The number of LIBs is 5.
Group C: Single 10 Ah pouch cell with 100% SOC.
Group D: Single 15 Ah pouch cell with 100% SOC.
As shown in Figure 3b, in the single-cell test, the heating rod with 18 mm in diameter and 65 mm in length is next to a battery with a heating power of 240 W. And the arrangement of multiple cylindrical cells with a heating rod is shown. In the pouch cell TR tests, a heating aluminum plate (200 mm × 100 mm × 20 mm), with a heating power of 400 W, was placed under the pouch cell. All LIB TR experiments were performed in the reaction chamber, with the ambient temperature around 25 °C. In order to reduce the experimental error, each test was repeated at least 3 times, and the average values were taken. The temperature of the TR fire and battery surface temperature were recorded.
2.3. Procedures
The dynamic pressure cabin and test systems are shown in Figure 3c. When the expected values of pressure and airflow rate inside the dynamic chamber were set by the touch screen of the pressure control system, the air inside was extracted to reduce the pressure to the target value by the vacuum pump, while the electromagnetic valve was used for dynamical control. After the chamber pressure was kept constant, the heating source was started, and the experiment began. Meanwhile, the data were recorded. The air inside flows with a certain value controlled and stabilized by the inlet and outlet systems to keep the pressure inside the chamber stable at the target value, even if certain amounts of gases are released from batteries to the chamber nonlinearly during the TR process of batteries.
3. Results and Discussion
3.1. Thermal Runaway Behaviors
3.1.1. Cylindrical Cells
As shown in Figure 4, the typical TR processes of cylindrical single-cell and multiple-cell experiments under the pressures of 95 kPa and 20 kPa are presented, respectively.
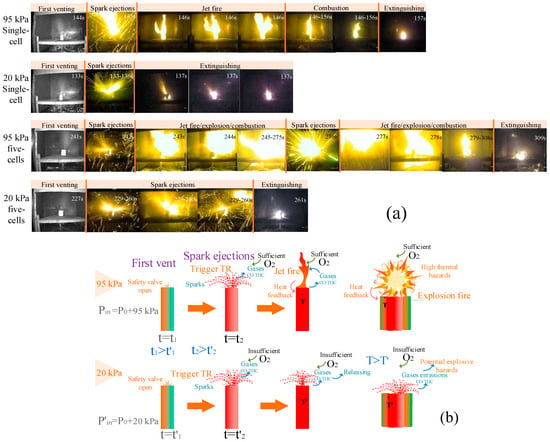
Figure 4.
(a) Thermal runaway phenomenon of cylindrical LIBs under 95 kPa and 20 kPa, (b) Schematic diagram of Thermal runaway processes of cylindrical LIBs under 95 kPa and 20 kPa.
When the heating rate of the battery surface exceeds 10 °C/s, the occurrence of TR is determined. At this time, the spark injection time is almost the same as the trigger time of the TR. Because of the phenomenon of triggering the TR, the heating plate is closed. As shown in Figure 4a, during the TR process of 95 kPa, a single cylindrical cell of 18650 went through five stages, including (1) first venting (the opening of the safety valve), (2) spark ejections (the trigger of the TR), (3) jet fire/explosion, (4) combustion, and (5) extinguishment. However, at a pressure of 20 kPa, there are no combustion flames in the whole TR process. This is probably because large amounts of combustible gases and ejections, released rapidly after the sparks (safety valve opened completely), are not ignited under 20 kPa for the reason that oxygen mass concentration per volume is less than the stoichiometric ratio. Oxygen mass concentration has a functional relationship with pressure. And the ambient pressure would change the oxygen mass concentration and combustion reaction rates, as shown in Equation (10). As shown in Figure 4b, the early behaviors of the battery before the TR play a crucial role in the early detection and warning of TR hazards, e.g., the gases and volatiles are emitted out and can be detected after the first vent. Therefore, the first vent time is defined as, and the first vent time is earlier than that of low AP. The parameter of is the average trigger time of spark ejections, i.e., bright solid sparks with gas products, indicating the activation of the TR. The criterion for the TR is the temperature rise rate in this work. It indicates that the TR of the battery was triggered when the battery temperature rise rate was over 10 °C/s, as presented in Equation (1), where k indicates the time index of the data, which was recorded with a sampling time of 1 s (Figure S1). Since the spark injection time and the TR trigger time are almost the same, this is regarded as the phenomenon of triggering the TR, and it is found that the trigger time of the TR is earlier at low AP.
It is obvious that the jet fire and the combustion process, with large flames, are more vigorous for multiple cells than a single cell in 95 kPa. The visible explosion fire and audible bang are more common, asynchronous, and violent. It can be attributed to the mutual interference and the variation in ignition time, which can accelerate the nearby cells and ignite the gases released swiftly from the cell. The increasing number of batteries leads to significantly larger-scale fires and fiercer ejection. Comparing Figure 5a,b, it can be found that the battery structure after combustion almost remains intact in the single-cylindrical cell experiments of 95 kPa. However, for multiple-cell tests under 95 kPa, the shell and safety valve were broken severely, and this can be seen in Figure 6c The TR process for multiple cells has a relatively higher risk of fire and explosion than for single cells, and this risk also increases with the number of batteries.
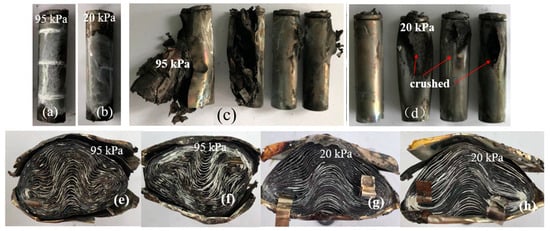
Figure 5.
Typical phenomena of LIBs after thermal runaway: (a) group A—single cell in 95 kPa, (b) group A—single cell in 20 kPa, (c) group B—multiple cells in 95 kPa, (d) group B—multiple cells in 20 kPa, (e) 10 Ah pouch cell under 95 kPa, (f) 15 Ah pouch cell under 95 kPa, (g) 10 Ah pouch cell under 20 kPa, and (h) 15 Ah pouch cell under 20 kPa.
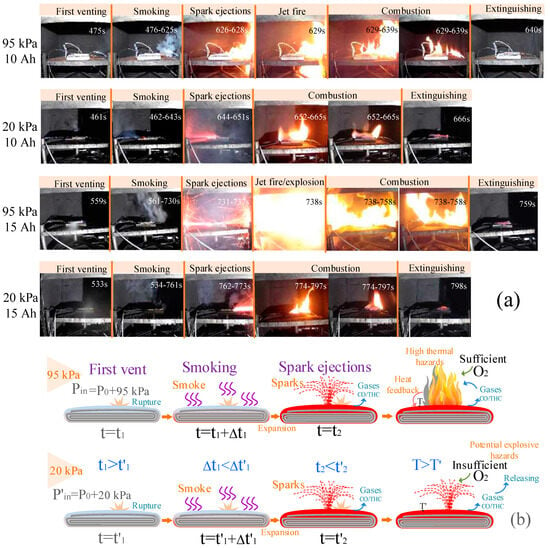
Figure 6.
(a) Thermal runaway phenomenon of pouch LIBs under 95 kPa and 20 kPa, (b) Schematic diagram of Typical thermal runaway process of pouch LIBs under 95 kPa and 20 kPa.
It can be seen that the sparks and combustion flames are also obviously weaker for multiple cylindrical cells at 20 kPa than for the tests under 95 kPa. In addition, there is no fierce gas explosion and intense flame ejection, except for the ejections and sparks. As can be seen from the carbonized batteries after tests, the batteries after tests under 20 kPa are also broken or crushed, which is different from the single-cell tests under 20 kPa, as seen in Figure 5d. Those phenomena indicate that mutual interference still exists under 20 kPa, but this process is not as vigorous as the multiple cells under 95 kPa, without the violent fire behaviors of explosion and jet flames. This mutual interference may be ascribed to the heat transfer through the pathway of direct contact among the cells, which is not affected by the variation in pressure. The number of LIBs that were broken or crushed after the TR in each test was about three-fourths of all the batteries both under 95 kPa and 20 kPa. It can be seen that as the ambient pressure rises, the rate of heat propagation between battery cells may accelerate, and the whole system produces more energy per unit time, which is more destructive to the surrounding environment. Under different pressures, the battery pack should consider a reasonable space design.
3.1.2. Pouch Cells
It can be observed that the pouch cell under 95 kPa undergoes six stages during the TR process: (1) first venting (the rupture of the aluminum–polymer bag), (2) smoking (gas releasing), (3) sparks (huge irritant gases and products jet out, and the TR is triggered), (4) jet fire with flames and sparks, (5) combustion, and (6) extinguishing. The pouch cell firstly expands slowly in volume with the temperature increasing, indicating the beginning of the thermal decomposition reactions. Then, the space between the layers increases and is filled with gas products, as can be seen in Figure 5e. As the accumulation of gases, the pressure in the battery increases, and the bag is ruptured. Irritant gases and smoke gradually release from the side of the battery’s external terminal, and the decomposition reactions are further accelerated. Subsequently, huge flammable gases along with solids and liquid droplets are ejected out swiftly and ignited, forming intense jet flames and white sparks. Lastly, the combustion fire gradually becomes weak and stable, and finally extinct.
As shown in Figure 6a, the typical TR phenomenon of pouch cells with 10 Ah and 15 Ah under 95 kPa and 20 kPa are presented, respectively. Under 95 kPa, with thick smoke and large flames, the TR of 10 Ah is particularly fiercer than 20 kPa. With the increase in cell capacity, the intensity of the TR increases. Fiercer explosions and larger fire flames occurred under 95 kPa for 15 Ah. Under the effects of hypobaric hypoxia in 20 kPa, there are no jet fire flames, and the sparks are not typical white but dark red for 10 Ah and 15 Ah. Only small fire flames were observed after the ejection of sparks for 15 Ah under 20 kPa. As shown in Figure 6b, represents the average duration of smoking after the first venting. The results show that the time is shortened at low AP, while is prolonged and the TR trigger time is delayed.
The typical pouch cells after the tests are shown in Figure 5e–h. The aluminum–polymer bag burned and melted into pieces, and the whole battery was severely carbonized, both under 95 kPa and 20 kPa. Obviously, there is an increase in thickness, while the gaps between the layers are expanded, especially for the batteries after a TR under 20 kPa. Compared with cylindrical batteries, pouch cells are less bound and show an overall fluffy enlargement after a TR. And the size of deformation under different environmental pressures may be related to the intensity of the whole combustion process.
3.2. First Venting and Trigger of TR
Figure 7 depicts the time values during the TR processes under two ambient pressures of 95 kPa and 20 kPa. As the pressure decreases from 95 kPa to 20 kPa, the average values of (the average open time of the safety valve or the rupture time of the bag, which was counted by the video recorded in the tests) decrease from 144 s to 133 s, 475 s to 461 s, and 559 s to 533 s, for 18650 cylindrical cells, 10 Ah pouch cells, and 15 Ah pouch cells, respectively (Table S1). A low-pressure atmosphere shortens the time of first venting (rupture of the safety valve/bag). It is mainly due to the competition between the internal pressure and atmospheric pressure, as shown in Equation (2) [33].
Here, (kPa) is the rupture pressure of the safety valve/aluminum–polymer bag, which is a fixed value. (kPa) refers to the internal pressure of the battery due to the accumulation of gases and heat released from the thermal decomposition reactions, and (kPa) is the external pressure (atmospheric pressure). The first venting occurred in a case where internal pressure exceeds the sum of the atmospheric pressure and rupture pressure of the safety valve/bag. decreases as from 95 kPa to 20 kPa; therefore, the time for the rupture of the safety valve/bag is shortened. The earlier behaviors of the safety valve opening/rupturing of the bag are probably helpful for the safety warning of LIBs, especially under low-pressure environments.
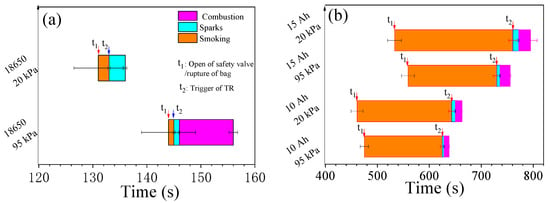
Figure 7.
The average values of time for different stages during the TR process: (a) cylindrical cells and (b) pouch cells.
The average trigger time () of spark ejections for cylindrical cells is 145 s in 95 kPa and 133 s in 20 kPa. However, increases from 625 s to 643 s, and from 730 s to 761 s for 10 Ah and 15 Ah pouch cells, when the pressure decreases from 95 kPa to 20 kPa. The average trigger time of spark ejections is delayed for pouch cells and shortened for cylindrical cells, under a low-pressure environment of 20 kPa. This is attributed to the difference in smoking duration between the cylindrical and pouch cells. It can be seen from the smoking duration () between the first venting and the TR. increases from 1 s to 2 s, when the pressure decreases from 95 kPa to 20 kPa, for cylindrical cells. The influence of low pressure on smoking duration is minimal for cylindrical cells, which can be neglected. However, this average smoking duration is greatly extended, from 150 s to 182 s and from 171 s to 228 s for 10 Ah and 15 Ah pouch cells, as the pressure varies from 95 kPa to 20 kPa, leading to a delay of the average trigger time of the TR at 20 kPa. These phenomena for pouch cells can be explained by the acceleration effect of exothermal reactions with the oxygen from the environment in 20 kPa which is not as obvious as 95 kPa, after the rupture of the bag. In addition, the timely release of gases under low ambient pressure is not beneficial for the accumulation of heat, during the exothermal reactions in cells. Thus, it takes more time for the battery to reach the threshold of the TR under 20 kPa. However, this effect for cylindrical cells is not significant because of the structural characteristics of steel shells.
3.3. Heat Release Rates and Temperatures
As the most critical factor, HRR is used to evaluate thermal hazards and determine whether the neighbor cells will be ignited in the battery pack. Generally, the values of HRR and THR were calculated by the oxygen consumption principle based on Thornton [43]. According to previous studies [44], HRR, based on the oxygen consumption principle, cannot reflect the heat that does not consume any oxygen from the atmosphere, but it can better present the heat released from the oxidation with oxygen in the air, considering that the decomposition energy in a TR is determined by stored electric energy in LIBs [45]. Therefore, HRR and THR are better used in thermal hazard assessments to reflect the heat from the oxidation or combustion of TR product emissions with the oxygen from the atmosphere, e.g., flammable gases, combustible battery materials, and electrolytes.
Here, represents the HRR (kW), and are the flow rates of oxygen from the incoming and outgoing air (Kg·s−1), and is the energy release per mass unit of consumed for a given fuel (); the mass flow rate () can be calculated by the formula in Equation (4), where A represents the cross-sectional area (m2), kc represents the wind velocity distribution coefficient, f(Re) represents the Reynolds number correction function, △P represents the pitot tube centerline pressure difference (Pa), and T represents the catheter centerline temperature (K). q is calculated by changes in , , and because it is actually an incomplete combustion, where and are the initial and final oxygen volume percentage concentrations (%), and are the initial and final carbon dioxide volume percentage concentrations (%), and is the final volume percentage concentration (%). Q is the THR (kJ).
Figure 8a depicts the HRR curves at two different atmospheric pressures. The peak HRR decreases from 1.2 kW to 0.65 kW, 14.2 kW to 1.2 kW, 26.3 kW to 6.1 kW, and 41.1 kW to 8.7 kW for 1 cylindrical cell, 5 cylindrical cells, a 10 Ah pouch cell, and a 15 Ah pouch cell, respectively. It can be seen that the peak HRR values under 95 kPa are higher than the values under 20 kPa for the external heating tests. These results indicated that the heat from the oxidation combustion reactions in the atmosphere outside the cell decreases greatly for low oxygen mass concentration per volume under 20 kPa. It ought to be mainly ascribed to the reason that the fierce fire behaviors are not formed, e.g., visible explosion fire flames and jet fires, for the insufficient oxygen in 20 kPa.
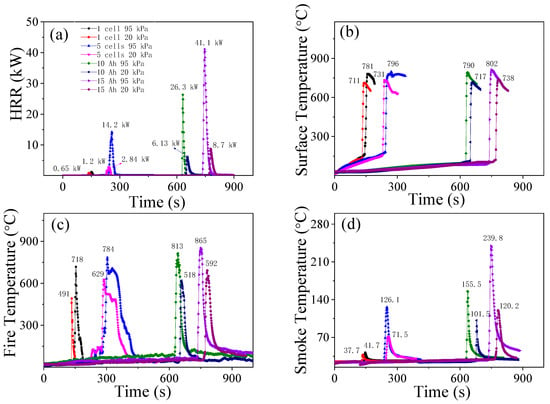
Figure 8.
Typical curves and average values: (a) HRR; (b) battery surface temperatures; (c) thermal runaway fire temperatures; and (d) thermal runaway smoke temperatures.
Moreover, it was confirmed that fire developed slowly as the ambient pressure declined for LIBs and common fuel. The empirical formula [30] of burning rate () on ambient pressure () can be expressed as follows:
The mass burning rate slows as the atmospheric pressure decreases. As presented in this empirical formula, the burning rate reduces with the drop in ambient pressure. It can be derived that the combustion accompanied by a TR would be inhibited by ambient low pressure. The burning rate of ejected combustible products reduces when the pressure reduces from 95 kPa to 20 kPa. Consequently, the values of HRR and THR decrease with the reduction in atmospheric pressure, and the thermal hazards of TR fire for both cylindrical and pouch cells are lower than the tests under 95 kPa, as shown in Figure 8a.
It also can be seen from Figure 9 that the THR increases with atmospheric pressure and the number of cylindrical batteries in a power function. The data are fitted with regression lines of the following form:
where represents the total heat release measured through the oxygen consumption principle, and a and b are the coefficients. The coefficients a and b decrease with the ambient pressure from 95 kPa to 20 kPa.
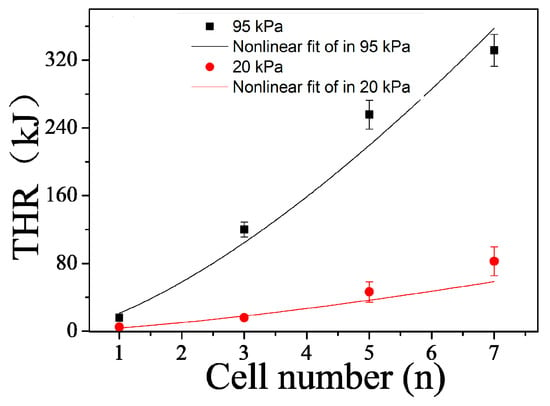
Figure 9.
The average values of THR versus the number of cylindrical cells.
Figure 10a shows the data graph of THR and peak HHR, the variation in THR and HRR may account for the variations in fire temperature and smoke temperature, in Figure 9c,d. The peak fire temperature decreased from 718 °C to 491 °C, 784 °C to 629 °C, 813 °C to 518 °C, and 865 °C to 592 °C, for four groups of tests, when the pressure declined from 95 kPa to 20 kPa. The peak smoke temperatures of 41.7 °C, 126.1 °C, 155.5 °C, and 239.8 °C under 95 kPa are higher than 37.7 °C, 71.5 °C, 101.5 °C, and 120.5 °C under 20 kPa, for four groups of tests, independently. The curves of battery surface temperature can be seen in Figure 9b and Figure 10b. The average initial temperature of the TR decreases from 161 °C to 139 °C for cylindrical cells and increases from 104 °C to 118 °C, and 112 °C to 124 °C, for two types of pouch cells, when the pressure decreases from 95 kPa to 20 kPa. This is consistent with the change in the average trigger time () of spark ejections discussed before. Due to the difference between the locally measured surface temperature and the actual TR temperature, the low pressure has different effects on the cylindrical and soft-pack batteries, and the structure of the soft-pack battery is greatly expanded by heat and produces a large amount of smoke and is released, which is not conducive to the accumulation of heat, resulting in inconsistent times to reach a TR, thus affecting the value of the initial TR temperature. The results show consistent patterns in different quantities and capacity states; the cell average peak surface temperature declines with the decrease in pressure from 95 kPa to 20 kPa, e.g., from 781 °C to 711 °C, from 796 °C to 731 °C, from 790 °C to 717 °C, and from 802 °C to 738 °C. It can be better understood that the heat feedback to the battery reduces greatly under 20 kPa, for the absence of fire flames, e.g., jet fire, explosion, and fierce combustion. The low combustion efficiency and burning rate under low-pressure environments also prevent the generation of heat, leading to a decrease in heat feedback from combustion to the battery. It has been proved that the combustion energy released in a TR is as high as 2–~6 times its electric capacity [46]. This is probably the dominant factor for the decline in surface temperature. In addition, the early release of gas products is in contrast to the accumulation of heat, for a certain amount of gas before releasing out of the battery, as shown in Equation (11).
Here, is the temperature (°C), is the number of moles of gas, is the ideal gas constant, is the mass concentration of in volume, and is the molar mass of . In theory, the temperature () of gases decreases with the decrease in atmospheric pressure ) from 95 kPa to 20 kPa, at the moment of gas release. Therefore, the cells’ peak surface temperatures are lower at 20 kPa than those under 95 kPa.
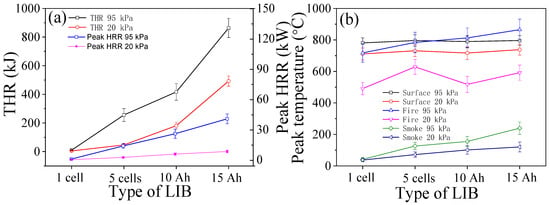
Figure 10.
(a) The average values of THR and peak HRR, and (b) the average peak values of temperature.
3.4. Vent Gas Density and O2
As presented in Figure 11b, the valley values of cylindrical cells and pouch cells increase from 20.71 vol.% to 20.83 vol.%, 19.28 vol.% to 20.42 vol.%, 17.57 vol.% to 20.18 vol.%, and 14.19 vol.% to 19.69 vol.%, with the decrease in pressure from 95 kPa to 20 kPa, respectively. It indicates that the consumption of oxygen under 20 kPa decreases during the TR. These consequences are due to the difficulty of ignition for emitted combustible substances, as well as the decrease in further thermal decomposition and combustion during a TR under 20 kPa. This also can be seen from the smoke light transmittance curves in Figure 11a,c, which represents the smoke density during the TR. It is obvious that the values of light transmittance under 20 kPa are higher than the values of 95 kPa, corresponding to the fierce TR fire behaviors, e.g., jet fire and explosion under 95 kPa. Under the effect of fire plume and violent behaviors in 95 kPa, more ejections flow with the smoke, and the smoke density is higher than that under 20 kPa.
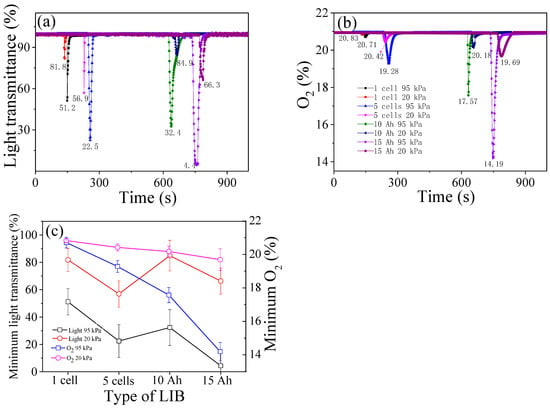
Figure 11.
(a) The typical curves of light transmittance, (b) the mass concentration of oxygen in volume, (c) the average peak values of minimum light transmittance and .
3.5. CO2 and CO/CO2
Figure 12a shows the curves of concentration in volume. It is well known that the generation is tightly related to the combustion efficiency in fire reactions. As the external pressure increases from 20 kPa to 95 kPa, the peak values of for groups A, B, C, and D increase from 0.11 vol.%, 0.52 vol.%, 0.69 vol.%, and 1.81 vol.% to 0.25 vol.%, 1.10 vol.%, 2.02 vol.%, and 5.34 vol.%, respectively. One reason for the huge proportion of is believed to be due to the decomposition of LiPF6 and electrolyte solvents, and the further reduction in hydrocarbons inside the cell. Another source is the external combustion reaction products, which are affected by the oxygen mass concentration per volume in the atmosphere, combustion efficiency, and TR fire behaviors. The ratio can present fire hazards. The ratios of are 1.55, 0.96, 0.45, and 0.21, for the four groups of tests under 95 kPa, respectively, and are lower than the ratios of 2.05, 1.99, 1.87, and 2.55 under 20 kPa, as can be seen in Figure 12c,d. This indicates that the combustion efficiency of combustible ejections decreases with the reduction in the external pressure from 95 kPa to 20 kPa.
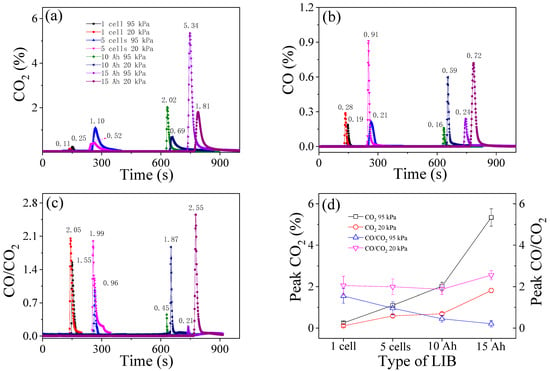
Figure 12.
(a) The percentage volume concentration of , (b) , and (c) , and (d) the average peak values of and .
For cylindrical cells, huge gases are released instantaneously with high velocity after the opening of the pressure valve. Thus, most parts of combustible gases are not oxidized sufficiently during the TR. But for the pouch cell, with the melting of the aluminum–polymer bag and thermal decomposition inside, the layers inside are exposed to air, and the gas products are released in time, and then oxidized with oxygen. Therefore, the oxidation efficiency of emissions released from pouch cells is higher than the cylindrical cells, resulting in more combustible emissions being oxidized into . Hence, the TR behaviors of various formats of batteries seem to have a distinct difference in the gas emission characteristics.
3.6. THC and CO
Figure 13a displays the typical concentration curves of hydrocarbon under two ambient pressures. The average peak THC values in 20 kPa are about 1275 ppm, 3474 ppm, 819 ppm, and 1641 ppm for four groups of tests, which can be seen in Figure 13b, which are higher than 1019 ppm, 256 ppm, 127 ppm, and 559 ppm under 95 kPa, respectively. From the curves in Figure 12b, the average peak values of increase from 0.19 vol.% to 0.28 vol.%, 0.21 vol.% to 0.91 vol.%, 0.16 vol.% to 0.59 vol.%, and 0.24 vol.% to 0.72 vol.%, with the pressure drop from 95 kPa to 20 kPa. The intensity of under 95 kPa is lower than that of 20 kPa. This phenomenon is consistent with the flammable emission gas of THC, demonstrating a great decrease in oxidation between the combustible emitted gas products and oxygen in air under the pressure of 20 kPa. In other words, the proportion of flammable gas in total emitted gases increases because of the difficulty of ignition and insufficient oxidation.
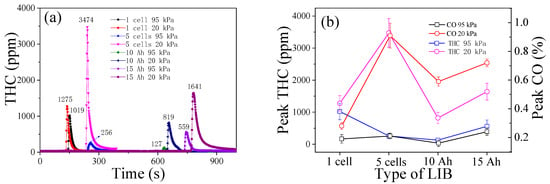
Figure 13.
(a) The typical curves of THC, and (b) the average peak values of THC and CO.
Huge products, e.g., battery materials, series of intermediates and small molecule products, release the battery out in the form of solid particles, liquids, and gases. Those products undergo complex chemical reactions, such as degradation and oxidation. As the main reactions during the TR process, the reactions of degradation can be summarized as in Equations (12)–(16), and the reactions of oxidation are presented by Equations (17)–(22).
The oxidation of products is affected by the density of oxygen in the atmosphere, as well as the degradation, which can be accelerated by high temperatures. Under a low-pressure environment of 20 kPa, the low density of oxygen does not contribute to the oxidation of the TR emissions, leading to higher values of combustible gases.
It can also be better understood from the theory of the carbon triangle. More carbon, hydrocarbon, carbon monoxide, and other organic products are oxidized with oxygen to carbon dioxide under 95 kPa. However, the combustible gas emissions released from the cell could not be ignited easily under a low-pressure environment of 20 kPa, with thin air and low oxidizer density, as can be seen from the TR behaviors above. Therefore, the incomplete oxidation/combustion and the difficulty of ignition under the anoxia environment of 20 kPa lead to higher values of and THC and lower values of , compared with the tests of 95 kPa. It can be concluded that the hazards of toxic/potentially explosive gases are higher than the tests under 95 kPa, during the TR process of LIBs. Hence, it is crucial to maintain good ventilation or take feasible measures to suppress gas explosions.
3.7. Hazards Analysis
Figure 14 illustrates the regional distribution of the peak values of HRR, THC, and during the TR tests of two types of LIBs with 100% SOC under the ambient pressures of 95 kPa and 20 kPa. Obviously, the thermal parameter of peak HRR varies inversely with the inflammable and potentially explosive gas emissions of THC and in the TR process. More combustion energy is released due to the oxidation combustion reactions of combustible gas products with oxygen in the air, resulting in the decrease in flammable/potentially explosive gases. On the contrary, the concentration of combustible/toxic gases would be high in the TR tests when the TR behaviors of fierce combustion are not formed for low oxygen mass concentration under 20 kPa. Although the energy released is reduced, with the rising concentration of combustible gases per unit volume, once supplemented by the entry of oxygen, and pre-mixed to reach the explosion limit, it will have a potential risk of thermal hazards.
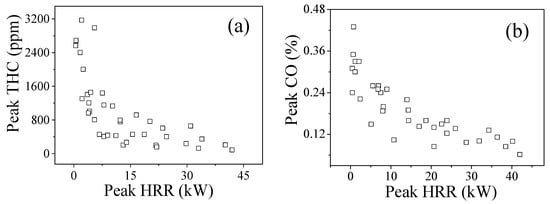
Figure 14.
Average peak values of THC (a) and (b) versus average peak HRR for different LIBs under 95 kPa and 20 kPa.
As the pressure decreases from 95 kPa to 20 kPa, the average peak values of the parameters of HRR, THR, and decrease, while the peak values of THC and increase, indicating a lower thermal hazard of TR fire and a higher concentration of toxic/flammable gas emission in the tests of 20 kPa, compared with the tests under 95 kPa. These results can also be characterized by the distribution of average values per unit capacity under two atmospheric pressures, as shown in Figure 15a,b. The average peak values per capacity of THR, HRR, and in 20 kPa are lower, while the gas peak concentration values per capacity of , , and are higher, compared with the tests under 95 kPa. It can be found that the low atmospheric pressure has a significant influence on the LIB parameters of TR hazards. In other words, the thermal hazards of TR fire, e.g., fierce jet fire, deflagration, or explosion, under 95 kPa are more severe than the TR in 20 kPa, but the hazards of potentially explosive and toxic gas emissions, e.g., the THC and , need be paid more attention in 20 kPa, particularly in a confined space with life, such as the cabin or cargo compartment of aircraft.
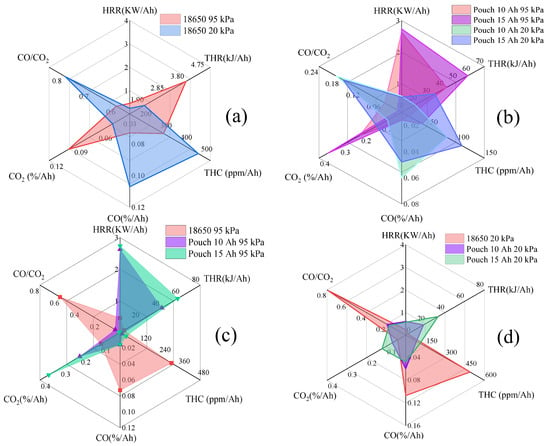
Figure 15.
The distribution of average peak value per capacity for the TR tests of 18650 and pouch LIBs under 95 kPa and 20 kPa: (a) 18650 LIBs under 95 kPa and 20 kPa, (b) 10 Ah and 15 Ah pouch LIBs under 95 kPa and 20 kPa, (c) 18650 and pouch LIBs under 95 kPa, and (d) 18650 and pouch LIBs under 20 kPa.
With high values of peak HRR and THR, the pouch cell with a soft can has a higher thermal risk of fire than the hard-can cell of 18650, both at 95 kPa and 20 kPa. Meanwhile, the cylindrical cells have a higher concentration of THC and at two ambient pressures than the pouch cells. Also, as seen in Figure 15c,d, the values of peak HRR, THR, and peak per unit capacity for the pouch cell are higher than the values of the cylindrical cell, but the peak values of , THC and per capacity are lower than in cylindrical cells. It indicates that the pouch cell with a soft aluminum–polymer bag has higher thermal hazards of TR fire, but a lower concentration of toxic/combustible gases than cylindrical cells with hard cans. The cylindrical cell has a higher risk of toxicity and potential explosion than the pouch cell in the TR process. In addition to a high concentration of toxic/potentially explosive gases, the TR fire behaviors are more aggressive for cylindrical cells, due to the structure of the steel shell. It can be concluded that the type of cell packaging also has an obvious impact on the characteristics of the TR.
4. Conclusions
In this study, two types of LIBs of cylindrical cells (18650 with 2.6 Ah) and pouch cells (10 Ah and 15 Ah) were tested under the pressures of 95 kPa and 20 kPa, in a dynamic pressure cabin. The major conclusions can be summarized as follows:
- (1)
- With the pressure drop from 95 kPa to 20 kPa, the average open time of the safety valve (the rupture of the bag for pouch cells) is shortened. The average trigger time of the TR is shortened for cylindrical cells, but delayed for pouch cells under 20 kPa. The average peak values of HRR, THR, surface/fire/smoke temperature, smoke density, and decrease, but the values of THC and increase.
- (2)
- The proportion of and THC varies inversely with the thermal hazards of TR fire. TR behaviors under 20 kPa are not as vigorous as the tests in 95 kPa, without violent fire, explosion, and huge jet flames. The thermal hazards of TR fire under 20 kPa are lower than that in 95 kPa, but the proportion of flammable/potentially explosive gas emissions increases greatly which poses a huge risk, especially in a confined space.
- (3)
- The number of batteries and type of packaging also have an obvious effect on the performance of the TR. Pouch cells have a higher thermal hazard of fire, but lower combustible/toxic emitted gases, than the cylindrical cells both under 95 kPa and 20 kPa. With fierce TR behaviors, the combustible gas products are released at high speeds, leading to a higher risk of toxicity and potential explosion of cylindrical cells than pouch cells in the TR process.
Under low-pressure environments of cruise altitude, the thermal hazards of TR fire for pouch cells and the toxic/potentially explosive hazards of gas emissions of cylindrical cells need more attention, especially in the cabin or compartments of aircraft. The measures of ventilation or gas explosion suppression and the feasible design of extinguishing and fire protection systems should be considered, for the use of cylindrical and pouch LIBs. This discovery may be helpful to the safety design and protection of LIBs used in low-pressure environments, such as the installed Li battery on aircraft.
Supplementary Materials
The following supporting information can be downloaded at: https://www.mdpi.com/article/10.3390/batteries10090298/s1, Figure S1: A dT-T curve of the ARC test; Table S1: The average values of time for different stages during the TR process: (a) a cylindrical cell and (b) a pouch cell.
Author Contributions
Conceptualization, Q.S. and H.L.; methodology, Q.S.; software, Q.S.; validation, Q.S., H.L. and Z.W.; formal analysis, Y.M.; investigation, Q.S.; resources, Z.W.; data curation, Q.S.; writing—original draft preparation, Q.S. and H.L.; writing—review and editing, Q.S., H.L. and Z.W.; visualization, Y.W.; supervision, C.X.; project administration, Q.W.; funding acquisition, Q.S. and H.L. All authors have read and agreed to the published version of the manuscript.
Funding
This work was financially supported by the Opening Foundation of Civil Aircraft Fire Science and Safety Engineering Key Laboratory of Sichuan Province (MZ2023KF06), the General Program of Civil Aviation Flight University of China (QJ2022-171), and the General Program of Sichuan Vocational College of Chemical Technology (SCHYB-2024-08).
Data Availability Statement
The data presented in this study.
Conflicts of Interest
The authors declare no conflict of interest.
Correction Statement
This article has been republished with a minor correction to the existing affiliation information. This change does not affect the scientific content of the article.
References
- Sripad, S.; Viswanathan, V. Performance Metrics Required of Next-Generation Batteries to Make a Practical Electric Semi Truck. ACS Energy Lett. 2017, 2, 1669–1673. [Google Scholar] [CrossRef]
- Bills, A.; Sripad, S.; Fredericks, W.L.; Singh, M.; Viswanathan, V. Performance Metrics Required of Next-Generation Batteries to Electrify Commercial Aircraft. ACS Energy Lett. 2020, 5, 663–668. [Google Scholar] [CrossRef]
- Feng, X.; Sun, J.; Ouyang, M.; He, X.; Lu, L.; Han, X.; Fang, M.; Peng, H. Characterization of large format lithium ion battery exposed to extremely high temperature. J. Power Sources 2014, 272, 457–467. [Google Scholar] [CrossRef]
- Zhu, X.; Wang, H.; Wang, X.; Gao, Y.; Allu, S.; Cakmak, E.; Wang, Z. Internal short circuit and failure mechanisms of lithium-ion pouch cells under mechanical indentation abuse conditions: An experimental study. J. Power Sources 2020, 455, 227939. [Google Scholar] [CrossRef]
- Xu, J.; Wang, L.; Guan, J.; Yin, S. Coupled effect of strain rate and solvent on dynamic mechanical behaviors of separators in lithium ion batteries. Mater. Des. 2016, 95, 319–328. [Google Scholar] [CrossRef]
- Wang, Q.; Ping, P.; Zhao, X.; Chu, G.; Sun, J.; Chen, C. Thermal runaway caused fire and explosion of lithium ion battery. J. Power Sources 2012, 208, 210–224. [Google Scholar] [CrossRef]
- Li, W.; Wang, H.; Zhang, Y.; Ouyang, M. Flammability characteristics of the battery vent gas: A case of NCA and LFP lithium-ion batteries during external heating abuse. J. Energy Storage 2019, 24, 10077–10086. [Google Scholar] [CrossRef]
- Larsson, F.; Andersson, P.; Blomqvist, P.; Lorén, A.; Mellander, B.-E. Characteristics of lithium-ion batteries during fire tests. J. Power Sources 2014, 271, 414–420. [Google Scholar] [CrossRef]
- Ping, P.; Wang, Q.; Huang, P.; Sun, J.; Chen, C. Thermal behaviour analysis of lithium-ion battery at elevated temperature using deconvolution method. Appl. Energy 2014, 129, 261–273. [Google Scholar] [CrossRef]
- Fredericks, W.L.; Sripad, S.; Bower, G.C.; Viswanathan, V. Performance Metrics Required of Next Generation Batteries to Electrify Vertical Takeoff and Landing (VTOL) Aircraft. ACS Energy Lett. 2018, 3, 2989–2994. [Google Scholar] [CrossRef]
- Feng, X.; Sun, J.; Ouyang, M.; Wang, F.; He, X.; Lu, L.; Peng, H. Characterization of penetration induced thermal runaway propagation process within a large format lithium ion battery module. J. Power Sources 2015, 275, 261–273. [Google Scholar] [CrossRef]
- Lamb, J.; Orendorff, C.J.; Steele, L.A.M.; Spangler, S.W. Failure propagation in multi-cell lithium ion batteries. J. Power Sources 2015, 283, 517–523. [Google Scholar] [CrossRef]
- Ping, P.; Kong, D.; Zhang, J.; Wen, R.; Wen, J. Characterization of behaviour and hazards of fire and deflagration for high-energy Li-ion cells by over-heating. J. Power Sources 2018, 398, 55–66. [Google Scholar] [CrossRef]
- Feng, X.; Ouyang, M.; Liu, X.; Lu, L.; Xia, Y.; He, X. Thermal runaway mechanism of lithium ion battery for electric vehicles: A review. Energy Storage Mater. 2018, 10, 246–267. [Google Scholar] [CrossRef]
- Xu, C.; Feng, X.; Huang, W.; Duan, Y.; Chen, T.; Gao, S.; Lu, L.; Jiang, F.; Ouyang, M. Internal temperature detection of thermal runaway in lithium-ion cells tested by extended-volume accelerating rate calorimetry. J. Energy Storage 2020, 31, 101670. [Google Scholar] [CrossRef]
- Chen, Y.; Liu, N.; Jie, Y.; Hu, F.; Li, Y.; Wilson, B.P.; Xi, Y.; Lai, Y.; Yang, S. Toxicity Identification and Evolution Mechanism of Thermolysis-Driven Gas Emissions from Cathodes of Spent Lithium-Ion Batteries. ACS Sustain. Chem. Eng. 2019, 7, 18228–18235. [Google Scholar] [CrossRef]
- Ouyang, D.; Weng, J.; Chen, M.; Wang, J. Impact of high-temperature environment on the optimal cycle rate of lithium-ion battery. J. Energy Storage 2020, 28, 101242. [Google Scholar] [CrossRef]
- Guo, L.S.; Wang, Z.R.; Wang, J.H.; Luo, Q.K.; Liu, J.J. Effects of the environmental temperature and heat dissipation condition on the thermal runaway of lithium ion batteries during the charge-discharge process. J. Loss Prev. Process Ind. 2017, 49, 953–960. [Google Scholar] [CrossRef]
- Sun, J.; Li, J.; Zhou, T.; Yang, K.; Wei, S.; Tang, N.; Dang, N.; Li, H.; Qiu, X.; Chen, L. Toxicity, a serious concern of thermal runaway from commercial Li-ion battery. Nano Energy 2016, 27, 313–319. [Google Scholar] [CrossRef]
- Koch, S.; Fill, A.; Birke, K.P. Comprehensive gas analysis on large scale automotive lithium-ion cells in thermal runaway. J. Power Sources 2018, 398, 106–112. [Google Scholar] [CrossRef]
- Golubkov, A.W.; Fuchs, D.; Wagner, J.; Wiltsche, H.; Stangl, C.; Fauler, G.; Voitic, G.; Thaler, A.; Hacker, V. Thermal-runaway experiments on consumer Li-ion batteries with metal-oxide and olivin-type cathodes. RSC Adv. 2014, 4, 3633–3642. [Google Scholar] [CrossRef]
- Larsson, F.; Andersson, P.; Blomqvist, P.; Mellander, B.E. Toxic fluoride gas emissions from lithium-ion battery fires. Sci. Rep. 2017, 7, 10018. [Google Scholar] [CrossRef]
- Baird, A.R.; Archibald, E.J.; Marr, K.C.; Ezekoye, O.A. Explosion hazards from lithium-ion battery vent gas. J. Power Sources 2020, 446, 227257. [Google Scholar] [CrossRef]
- Zhang, C.; Santhanagopalan, S.; Sprague, M.A.; Pesaran, A.A. Coupled mechanical-electrical-thermal modeling for short-circuit prediction in a lithium-ion cell under mechanical abuse. J. Power Sources 2015, 290, 102–113. [Google Scholar] [CrossRef]
- Larsson, F.; Bertilsson, S.; Furlani, M.; Albinsson, I.; Mellander, B.-E. Gas explosions and thermal runaways during external heating abuse of commercial lithium-ion graphite-LiCoO2 cells at different levels of ageing. J. Power Sources 2018, 373, 220–231. [Google Scholar] [CrossRef]
- Gao, T.; Wang, Z.; Chen, S.; Guo, L. Hazardous characteristics of charge and discharge of lithium-ion batteries under adiabatic environment and hot environment. Int. J. Heat Mass Transf. 2019, 141, 419–431. [Google Scholar] [CrossRef]
- Zhu, J.; Koch, M.M.; Lian, J.; Li, W.; Wierzbicki, T. Mechanical Deformation of Lithium-Ion Pouch Cells under In-Plane Loads—Part I: Experimental Investigation. J. Electrochem. Soc. 2020, 167, 090533. [Google Scholar] [CrossRef]
- Peng, Y.; Yang, L.; Ju, X.; Liao, B.; Ye, K.; Li, L.; Cao, B.; Ni, Y. A comprehensive investigation on the thermal and toxic hazards of large format lithium-ion batteries with LiFePO4 cathode. J. Hazard. Mater. 2020, 381, 120916. [Google Scholar] [CrossRef]
- Kriston, A.; Kersys, A.; Antonelli, A.; Ripplinger, S.; Holmstrom, S.; Trischler, S.; Döring, H.; Pfrang, A. Initiation of thermal runaway in Lithium-ion cells by inductive heating. J. Power Sources 2020, 454, 227914. [Google Scholar] [CrossRef]
- Ma, Q.; Liu, Q.; Zhang, H.; Tian, R.; Ye, J.; Yang, R. Experimental study of the mass burning rate in n-Heptane pool fire under dynamic pressure. Appl. Therm. Eng. 2017, 113, 1004–1010. [Google Scholar] [CrossRef]
- Li, C.; Yang, R.; Yao, Y.; Tao, Z.; Liu, Q. Factors affecting the burning rate of pool fire in a depressurization aircraft cargo compartment. Appl. Therm. Eng. 2018, 135, 350–355. [Google Scholar] [CrossRef]
- Chen, M.; Liu, J.; He, Y.; Yuen, R.; Wang, J. Study of the fire hazards of lithium-ion batteries at different pressures. Appl. Therm. Eng. 2017, 125, 1061–1074. [Google Scholar] [CrossRef]
- Chen, M.; Ouyang, D.; Weng, J.; Liu, J.; Wang, J. Environmental pressure effects on thermal runaway and fire behaviors of lithium-ion battery with different cathodes and state of charge. Process Saf. Environ. Prot. 2019, 130, 250–256. [Google Scholar] [CrossRef]
- Fu, Y.; Lu, S.; Shi, L.; Cheng, X.; Zhang, H. Ignition and combustion characteristics of lithium ion batteries under low atmospheric pressure. Energy 2018, 161, 38–45. [Google Scholar] [CrossRef]
- Xie, S.; Ren, L.; Yang, X.; Wang, H.; Sun, Q.; Chen, X.; He, Y. Influence of cycling aging and ambient pressure on the thermal safety features of lithium-ion battery. J. Power Sources 2020, 448, 1181–1189. [Google Scholar] [CrossRef]
- Xie, S.; Ren, L.; Gong, Y.; Li, M.; Chen, X. Effect of charging/discharging rate on the thermal runaway characteristics of lithium-ion batteries in low pressure. J. Electrochem. Soc. 2020, 167, 140503. [Google Scholar] [CrossRef]
- Xie, S.; Gong, Y.; Li, G.; Ping, X. Effect of low-pressure environment on thermal runaway behavior of NCM523/graphite pouch cells with different overcharge cycles. J. Energy Storage 2022, 55, 105444. [Google Scholar] [CrossRef]
- Sun, Q.; Liu, H.; Zhi, M.; Chen, X.; Lv, P.; He, Y. Thermal characteristics of thermal runaway for pouch lithium-ion battery with different state of charges under various ambient pressures. J. Power Sources 2022, 527, 231175. [Google Scholar] [CrossRef]
- Sun, Q.; Liu, H.; Zhi, M.; Zhao, C.; Jia, J.; Lv, P.; Xie, S.; He, Y.; Chen, X. Lithium-ion battery thermal runaway propagation characteristics under 20 kPa with different airflow rates. Fire Technol. 2023, 59, 1157–1179. [Google Scholar] [CrossRef]
- Pandian, G.; Pecht, M.; Zio, E.; Hodkiewicz, M. Data-driven reliability analysis of Boeing 787 Dreamliner. Chin. J. Aeronaut. 2020, 33, 1969–1979. [Google Scholar] [CrossRef]
- Yayathi, S.; Walker, W.; Doughty, D.; Ardebili, H. Energy distributions exhibited during thermal runaway of commercial lithium ion batteries used for human spaceflight applications. J. Power Sources 2016, 329, 197–206. [Google Scholar] [CrossRef]
- ISO 9705:1993; Fire Test-Full-Scale Room Fire Test for Surface Products. International Standards Organization: Geneva, Switzerland, 1993.
- Chow, W.K.; Han, S.S. Heat release rate calculation in oxygen consumption calorimetry. Appl. Therm. Eng. 2011, 31, 304–310. [Google Scholar] [CrossRef]
- Lyon, R.E.; Walters, R.N. Energetics of lithium ion battery failure. J Hazard Mater 2016, 318, 164–172. [Google Scholar] [CrossRef] [PubMed]
- Fu, Y.; Lu, S.; Li, K.; Liu, C.; Cheng, X.; Zhang, H. An experimental study on burning behaviors of 18650 lithium ion batteries using a cone calorimeter. J. Power Sources 2015, 273, 216–222. [Google Scholar] [CrossRef]
- Quintiere, J.G. More on methods to measure the energetics of lithium ion batteries in thermal runaway. Fire Saf. J. 2021, 124, 103382. [Google Scholar] [CrossRef]
Disclaimer/Publisher’s Note: The statements, opinions and data contained in all publications are solely those of the individual author(s) and contributor(s) and not of MDPI and/or the editor(s). MDPI and/or the editor(s) disclaim responsibility for any injury to people or property resulting from any ideas, methods, instructions or products referred to in the content. |
© 2024 by the authors. Licensee MDPI, Basel, Switzerland. This article is an open access article distributed under the terms and conditions of the Creative Commons Attribution (CC BY) license (https://creativecommons.org/licenses/by/4.0/).