Article

Single-Use Vape Batteries: Investigating Their Potential as Ignition Sources in Waste and Recycling Streams

School of Water, Energy and Environment, Cranfield University, Bedford MK43 0AL, UK
*
Author to whom correspondence should be addressed.
Batteries 2024, 10(7), 236; https://doi.org/10.3390/batteries10070236
Submission received: 5 June 2024 / Revised: 27 June 2024 / Accepted: 28 June 2024 / Published: 1 July 2024
(This article belongs to the Section Battery Processing, Manufacturing and Recycling)

Abstract

:
This study investigates the potential link between the increasing prevalence of single-use vapes (SUVs) and the rising frequency of waste and recycling fires in the UK. Incorrectly discarded Li-ion cells from SUVs can suffer mechanical damage, potentially leading to thermal runaway (TR) depending on the cells’ state of charge (SOC). Industry-standard abuse tests (short-circuit and nail test) and novel impact and crush tests, simulating damage during waste management processes, were conducted on Li-ion cells from two market-leading SUVs. The novel tests created internal short circuits, generating higher temperatures than the short-circuit test required for product safety. The cells in used SUVs had an average SOC ≤ 50% and reached a maximum temperature of 131 °C, below the minimum ignition temperature of common waste materials. The high temperatures were short-lived and had limited heat transfer to adjacent materials. The study concludes that Li-ion cells in used SUVs at ≤50% SOC cannot generate sufficient heat and temperature to ignite common waste and recycling materials. These findings have implications for understanding the fire risk associated with discarded SUVs in waste management facilities.

1. Introduction

The rapid growth of the e-cigarette market, particularly the increasing popularity of single-use vapes (SUVs), has led to concerns about their potential environmental impact and fire risks when discarded in waste and recycling materials [1,2]. SUVs, designed for single use and discarded once the battery or e-liquid is depleted, contain lithium-ion (Li-ion) batteries that have been identified as a potential ignition source in waste and recycling facilities, leading to an increased frequency of fires in the UK [3,4].
Li-ion batteries, widely used in portable electronic devices due to their high energy density, long cycle life, and low self-discharge rate [5], pose safety risks when damaged or exposed to high temperatures. Thermal runaway (TR), a process in which an increase in temperature leads to further temperature increase, can occur in Li-ion batteries, resulting in the release of toxic gases and potentially causing fires or explosions [6,7].
Previous studies have investigated the hazards associated with Li-ion batteries and their potential to cause fires in various scenarios, including abuse testing standards and regulations [8], hazardous scenarios identification [9], and fire risk assessment in waste treatment processes [10]. Experimental studies have focused on the behaviour of Li-ion cells under various abuse conditions, such as nail penetration [11,12,13,14,15], mechanical abuse [16], and the effects of the state of charge on thermal runaway characteristics [17,18,19]. Quintiere [20] proposed a method to mitigate thermal runaway and propagation in packages of lithium-ion batteries, contributing to the development of fire prevention strategies. Wang et al. [21] provided a comprehensive review of lithium-ion battery failure mechanisms and fire prevention strategies, offering a foundation for understanding the risks associated with these devices.
Despite the growing body of research on Li-ion battery safety, there is limited information specifically addressing the fire risks posed by SUVs in waste and recycling materials. Post-incident fire investigations at waste management facilities have confirmed that physical damage and undamaged batteries are the most frequent causes of fires initiated through the TR of Li-ion batteries [3]. The challenges of post-incident fire investigation at waste management facilities are significant, with a high percentage of waste fires recorded as ‘unknown’ due to the lack of conclusive evidence [22].
This study aims to bridge the gap in knowledge by investigating the potential for SUVs to provide a competent ignition source within waste and recycling materials. By subjecting the Li-ion cells contained in SUVs to industry-standard [8,23] and novel abuse methods, this research seeks to quantify the fire risks associated with these devices and inform waste management practices to mitigate potential hazards. The objectives are to confirm the probability of a TR event due to mechanical and electrical abuse and to quantify the resulting potential ignition of waste and recycling materials. The unique contribution of this study lies in its focus on the specific fire risks posed by SUVs in waste and recycling materials, an area that has not been extensively investigated in previous research. The findings of this study have the potential to inform waste management practices and guide policy development to mitigate the environmental impact and fire risks associated with the increasing use of SUVs.

2. Materials and Methods

2.1. Preliminaries

Thermal Runaway (TR) is defined as the exothermic chain reaction within a Li-ion cell that results in a rapid increase in internal temperature. The temperature rise destabilises the cell structure, initiating an electrochemical chain reaction that releases high energy. This ultimately causes the decomposition and combustion of the cell materials, generating high-pressure, flammable gases within the cell.
The gases released during TR are derived from the decomposition of the cells’ materials. C O , C O 2 , H 2 , and C H 4 evolve from the volatile organic electrolyte [7], with C O and C O 2 released from the oxidation of the cathode material [24]. Additionally, further H 2 is released through the oxidation of the anode [25,26]. This explosive gas release, subject to reaching the lower flammable limit (LFL), can result in violent ignition and flame propagation [24,27].
The severity of TR is linked to the energy stored in the cell, which is determined by the state of charge (SOC) [14,28]. Li-ion cells with an SOC below 50% are unlikely to experience energetic failure, even when subjected to substantial mechanical abuse. Although self-heating may occur during abuse below 50% SOC, the reduced stored energy results in a temperature rise to approximately 130 °C, followed by cooling as the Li-ion cell can dissipate the lower heat flux generated by the internal short-circuit (ISC) [14,28].
TR is initiated in the cell through an ISC, which, according to Joule’s Law, generates Joule heat that is released into the cell and its surrounding environment [7,29]. The ISC can be created by various factors categorised as ’abuse’, which can be mechanical, electrical, or thermal [7,28]. Mechanical abuse includes manufacturing defects, deformation of the cell casing, and breach of the cell casing. Electrical abuse involves excessive energy discharge or charging, while thermal abuse refers to excessively high or low temperatures [7,28].
The SOC is a differential ratio between the fully charged cell and the power discharged in relation to the fully charged cell [30]. It can be expressed as shown in Equation (1):
S O C = C N Q b C N ,
where C N is the capacity of the fully charged cell (Ah), and Q b is the energy discharged from the cell (Ah).
Although Li-ion cells have a stable cell voltage over an expansive SOC, which provides excellent properties during use, translating the open circuit voltage (OCV) to SOC is impractical [31,32]. Nigl et al. [32] analysed the SOC of 980 cells recovered from a battery sorting and recycling facility and concluded that cells with an O C V < 3.0 V have an SOC close to zero, cells with an O C V < 3.5 V are unlikely to experience TR when subjected to abuse, and cells with an O C V > 3.5 V have a high variation in SOC, making translation between OCV and SOC impractical.
Coulomb counting (ampere-hour) is proposed as a more accurate method of establishing the SOC of Li-ion cells [31]. The working capacity of a cell is the total amount of energy released when it is fully discharged (discharge rate of 0.1 Q r a t e d at minimum cut-off voltage). The SOC is represented as the available capacity against the cell manufacturer’s rated capacity ( Q r a t e d ) expressed as a percentage as in the following equation:
S O C = Q r e l e a s a b l e Q r a t e d × 100 % ,
where Q r e l e a s a b l e is the cell working capacity.

2.2. Target SUVs

SUVs were collected from various sources, including vape users, suppliers, and recycling collection points. Two dominant manufacturers and SUV designs were identified, ‘Pod’ and ‘Pen’. Therefore, 100 of each design were randomly selected for testing, with the SUVs disassembled and the Li-ion cell removed. The remaining contents were reassembled and recycled in line with current best practice. The SUVs included Lithium Polymer (Li-Po) cells identified as 13300–360 mAh or 13400–550 mAh (i.e., two different types of cells), shown in Figure 1 and Figure 2. The batteries used in this study are Li-Po cells, which are a type of lithium-ion battery that uses a polymer electrolyte instead of a liquid electrolyte. These are commonly used in single-use vapes due to their thin, lightweight design and high energy density. SUVs exclusively use cylindrical cells as they are well suited to the SUV design and power requirements, while it was not possible to confirm the exact cell composition, typical Li-Po batteries used in single-use vapes generally consist of a cathode often made of a lithium transition metal oxide such as L i C o O 2 (LCO) or L i N i M n C o O 2 (NMC), an anode usually made of graphite, a gel polymer electrolyte often composed of a lithium salt in a polymer matrix, and a separator typically made of a polymer membrane such as polyethylene or polypropylene [24,33].
The OCV and internal resistance of the 200n cells were measured, and the results were recorded before the initial assessment to establish the cell SOC and validate the nameplate-rated capacity using the Coulomb counting process. The internal resistance of all cells was ≤100 mΩ; however, cells with an OCV < 3.0 V were discounted from the testing process due to readings outside the cell specification and the associated risk of premature ageing, including dendrite growth [34].
The 13300 and 13400 cells were initially discharged using constant current (CC) at 0.5 C (cell-rated capacity), 180 mAh and 275 mAh, respectively. The cells were then provided a rest period before commencing the charging cycle. During the rest period, the cell voltage recovered; however, when a test second discharge cycle was performed, the voltage dropped back to 3.0 V immediately, confirming the cells were at 100% depth of discharge (DOD). Figure 3 shows a sample charge–discharge curve.
The 13300 and 13400 cells were charged at 0.5 C using constant current and constant voltage (CC-CV). According to [35], manufacturers often specify very low final charging currents to achieve a cell’s rated capacity. The cell specifications follow this trend, with the final charge cut-off current listed as ≤0.02 C (7.2 mAh and 11 mAh). The use of 100 mAh in this research reflects real-world charging protocols.

2.3. Testing Rationale

The testing undertaken is designed to replicate the range of abuse SUVs are likely to suffer when incorrectly discarded within general waste. The study undertaken by Nigl et al. [10] identifies the hazards and risks portable batteries are exposed to during the domestic waste management processes, with the results shown in Table 1.
Therefore, cell abuse testing methods include the industry-standard short-circuit and nail penetration tests. These benchmark tests were followed by novel impact and crush tests representative of the mechanical damage likely suffered during waste and recycling material management processes following incorrect disposal of SUVs within general household waste.

2.4. Test Rig Design

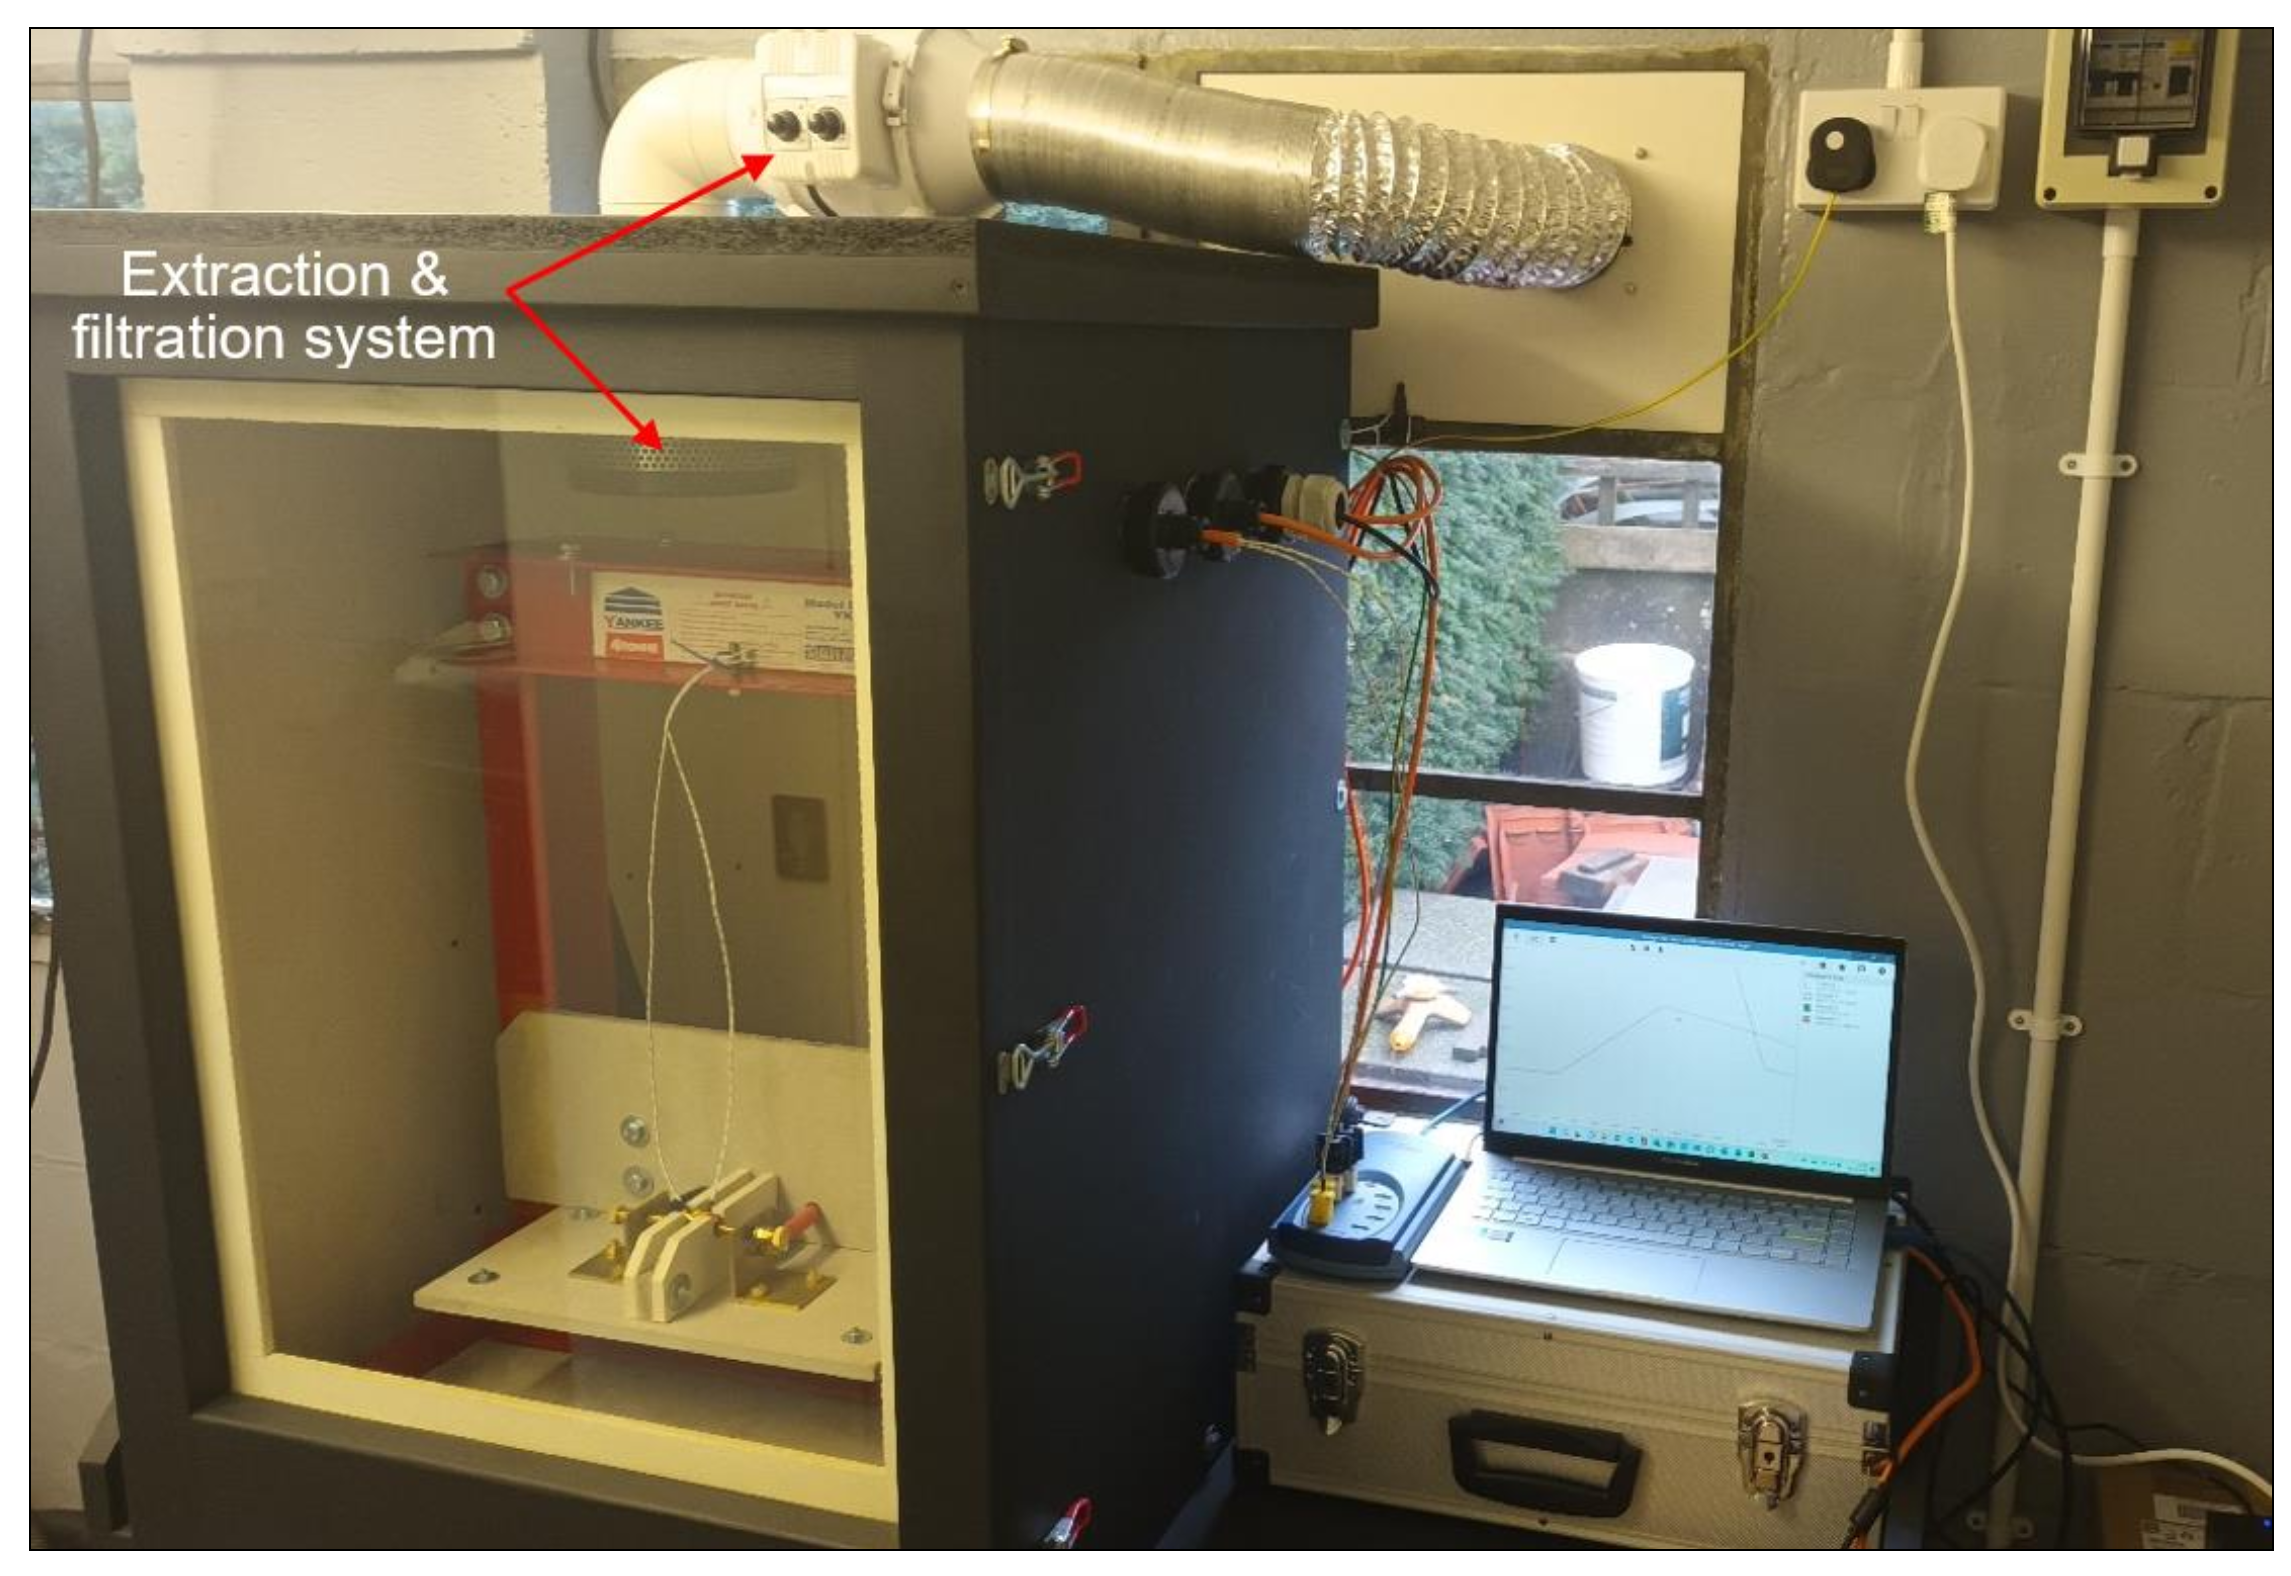
The mechanical test rig and short-circuit test apparatus are installed within a bespoke testing enclosure lined with Euro Class A1 non-combustible material, fitted with a protected vision panel and proprietary fume filtration and extraction system, as shown in Figure 4.
The enclosure has an internal volume of 0.3 m3, providing 300 L of air sufficient for complete cell combustion during the transition to TR. This meets the findings in [35], where they identify that a larger capacity 18650 Li-ion cell requires a minimum of 20 L of air to support complete combustion. The enclosure is fully vented after each test, with the enclosure temperature monitored between tests, ensuring the enclosure’s ambient temperature is maintained to provide a consistent test environment.
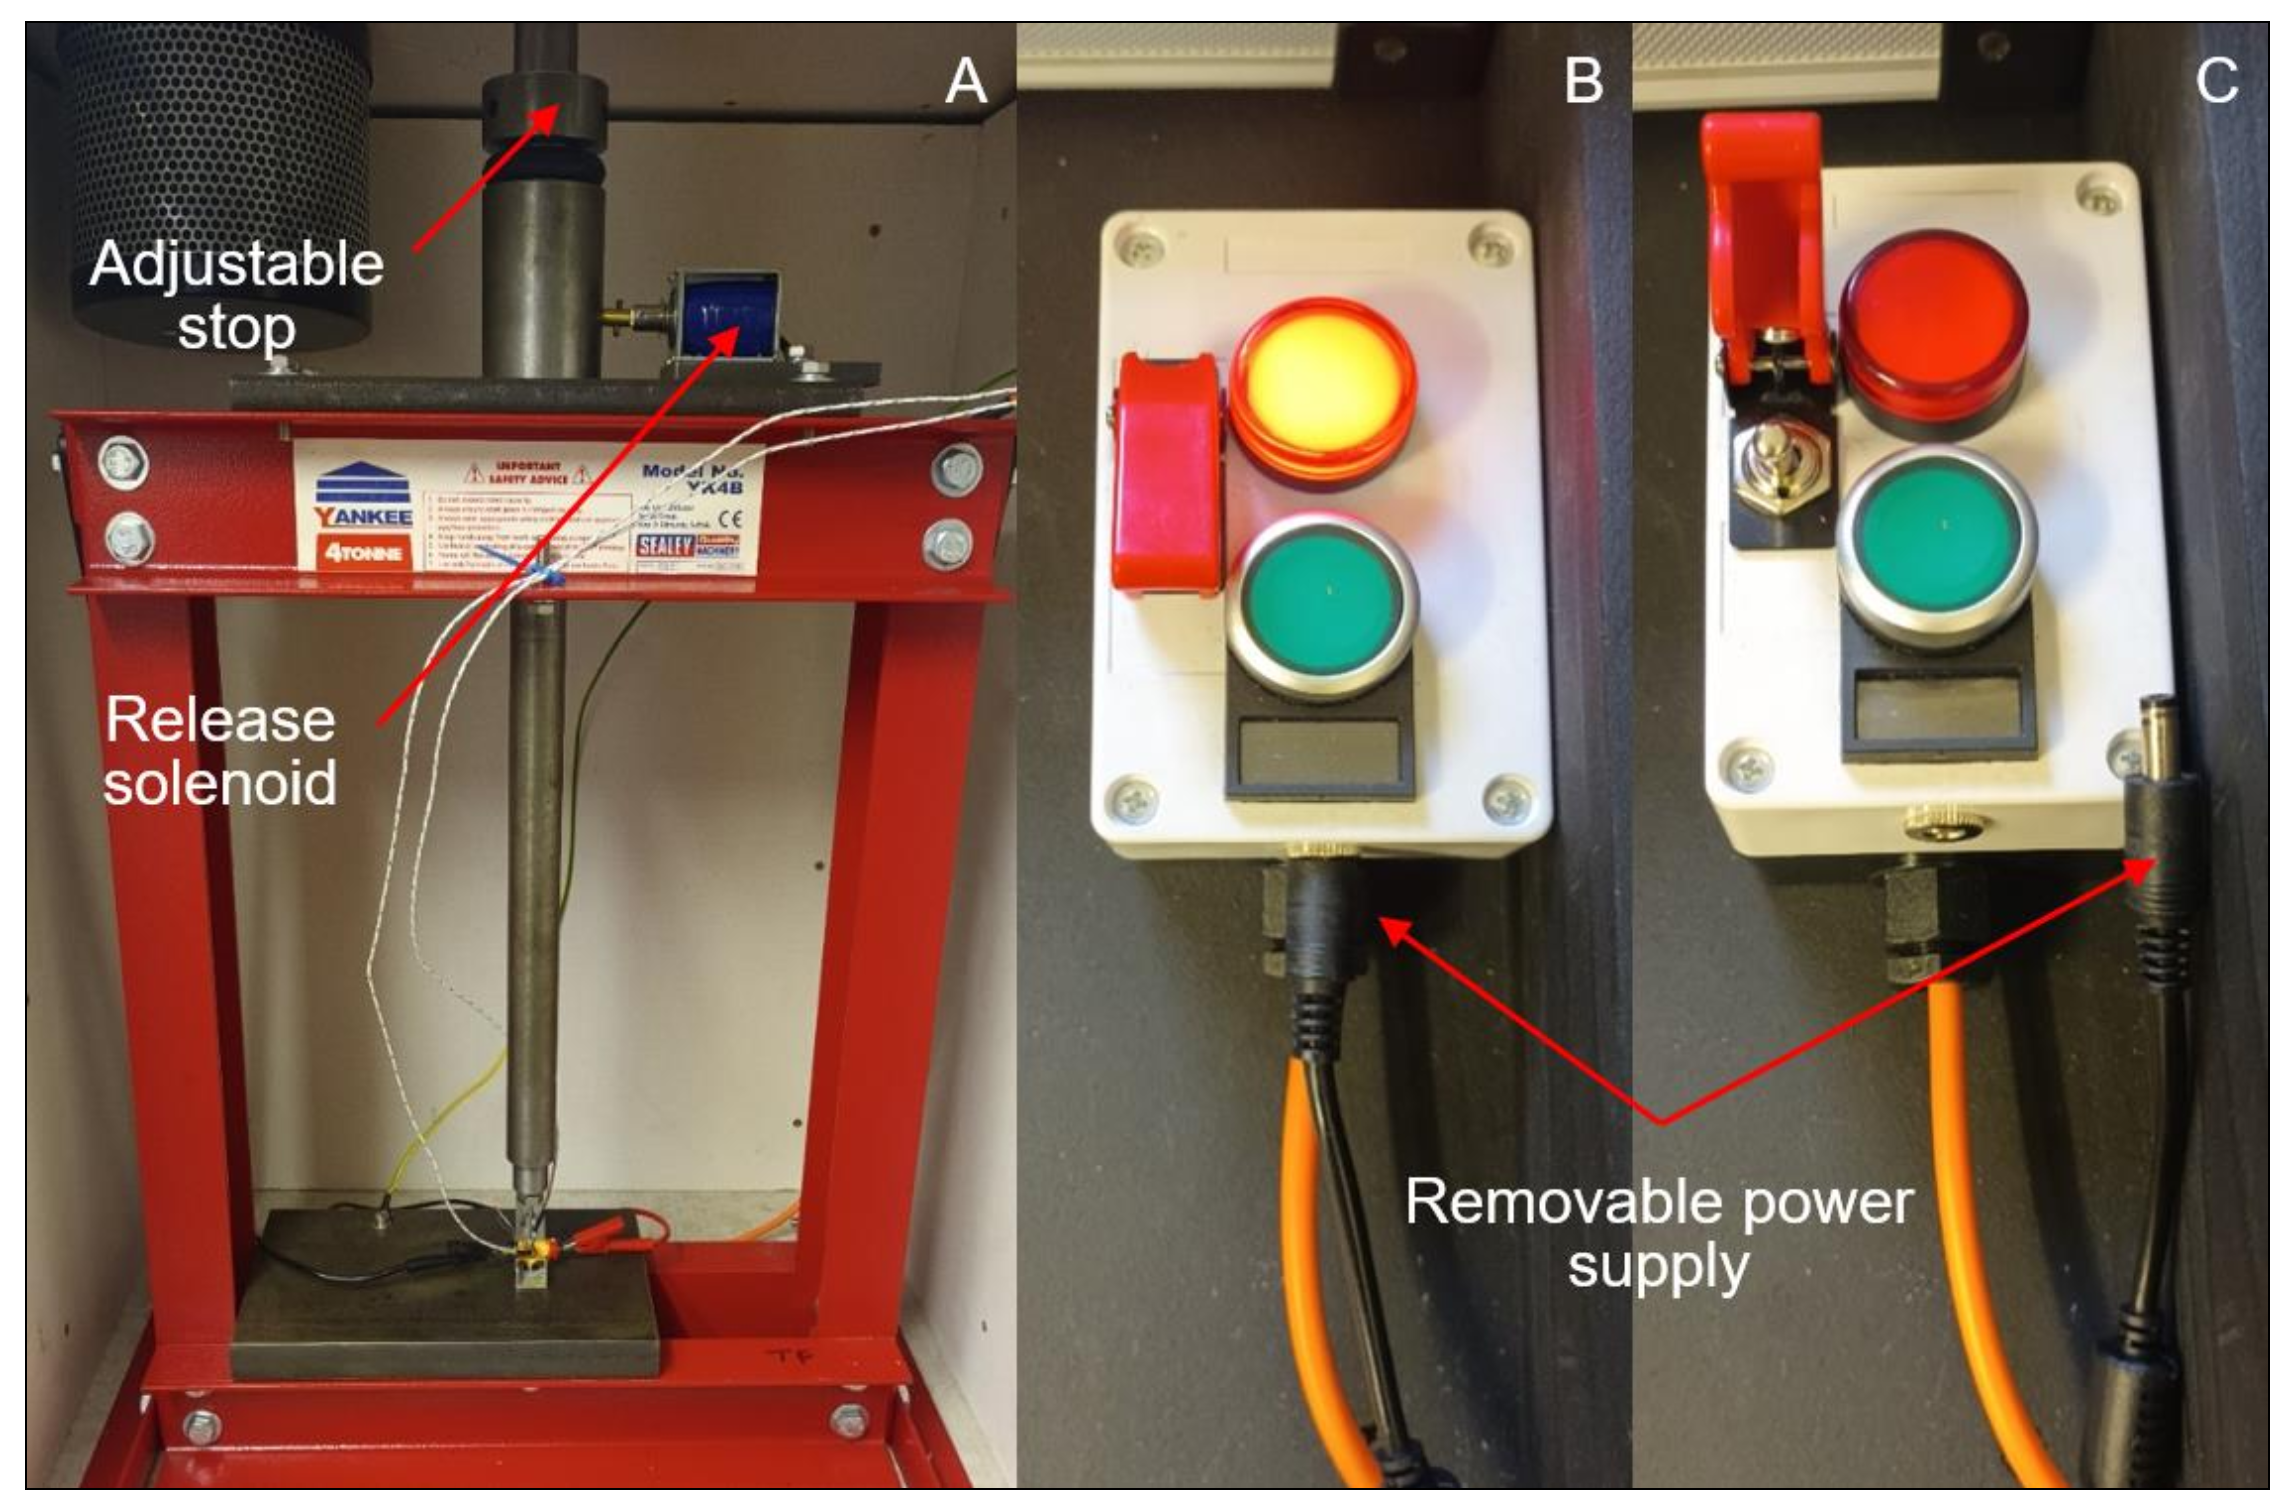
The test rig has a low voltage control system (12 VDC), which operates either the spring-loaded release solenoid for the mechanical abuse tests or the contactor, which completes the short-circuit test circuit, as shown in Figure 5. To maintain a safe system of work, the control system power supply is disconnected from the test rig control module to prevent inadvertent operation of the test rig during the test set-up process. The control module has a power indicator lamp to confirm that the power supply is connected, the test rig is operational or disconnected, and the test rig is safe. The control module is fitted with a push-to-make switch to operate the solenoid release for mechanical abuse testing and a mechanical switch with a safety override for the short-circuit contactor operation.

2.5. Testing Approach

To identify the baseline for cells transitioning to TR, the tests were initially undertaken at 100% SOC, followed by cells at 50% SOC, representing the maximum SOC for the cell in a discarded SUV, established during the initial cell discharge assessment. The cells tested were fully discharged and then charged to 50% and 100% SOC, respectively, prior to testing to ensure consistent and comparable test results. The 13300 and 13400 cells were subjected to four abuse scenarios, with each test repeated in triplicate to validate the consistency of the results; a total of 48 abuse tests were completed as part of the research. The cell surface temperature was monitored during all tests using two Type-K thermocouples placed on opposing sides of the cell, staggered ~10 mm from the cell ends, providing maximum coverage and resilience during the test, with the thermocouples attached using Kapton tape, as shown in Figure 6.
To avoid electrical interference or damage to the sensitive electronic monitoring equipment, all electronic equipment and the test rig were earth-bonded to a common ground, protecting against the risk of a cell short-circuiting to the test rig during abuse testing. All test measurements are recorded via a data logger at 10 Hz, with visual recordings captured using an HD camera at 240 FPS.

2.5.1. Short-Circuit Tests

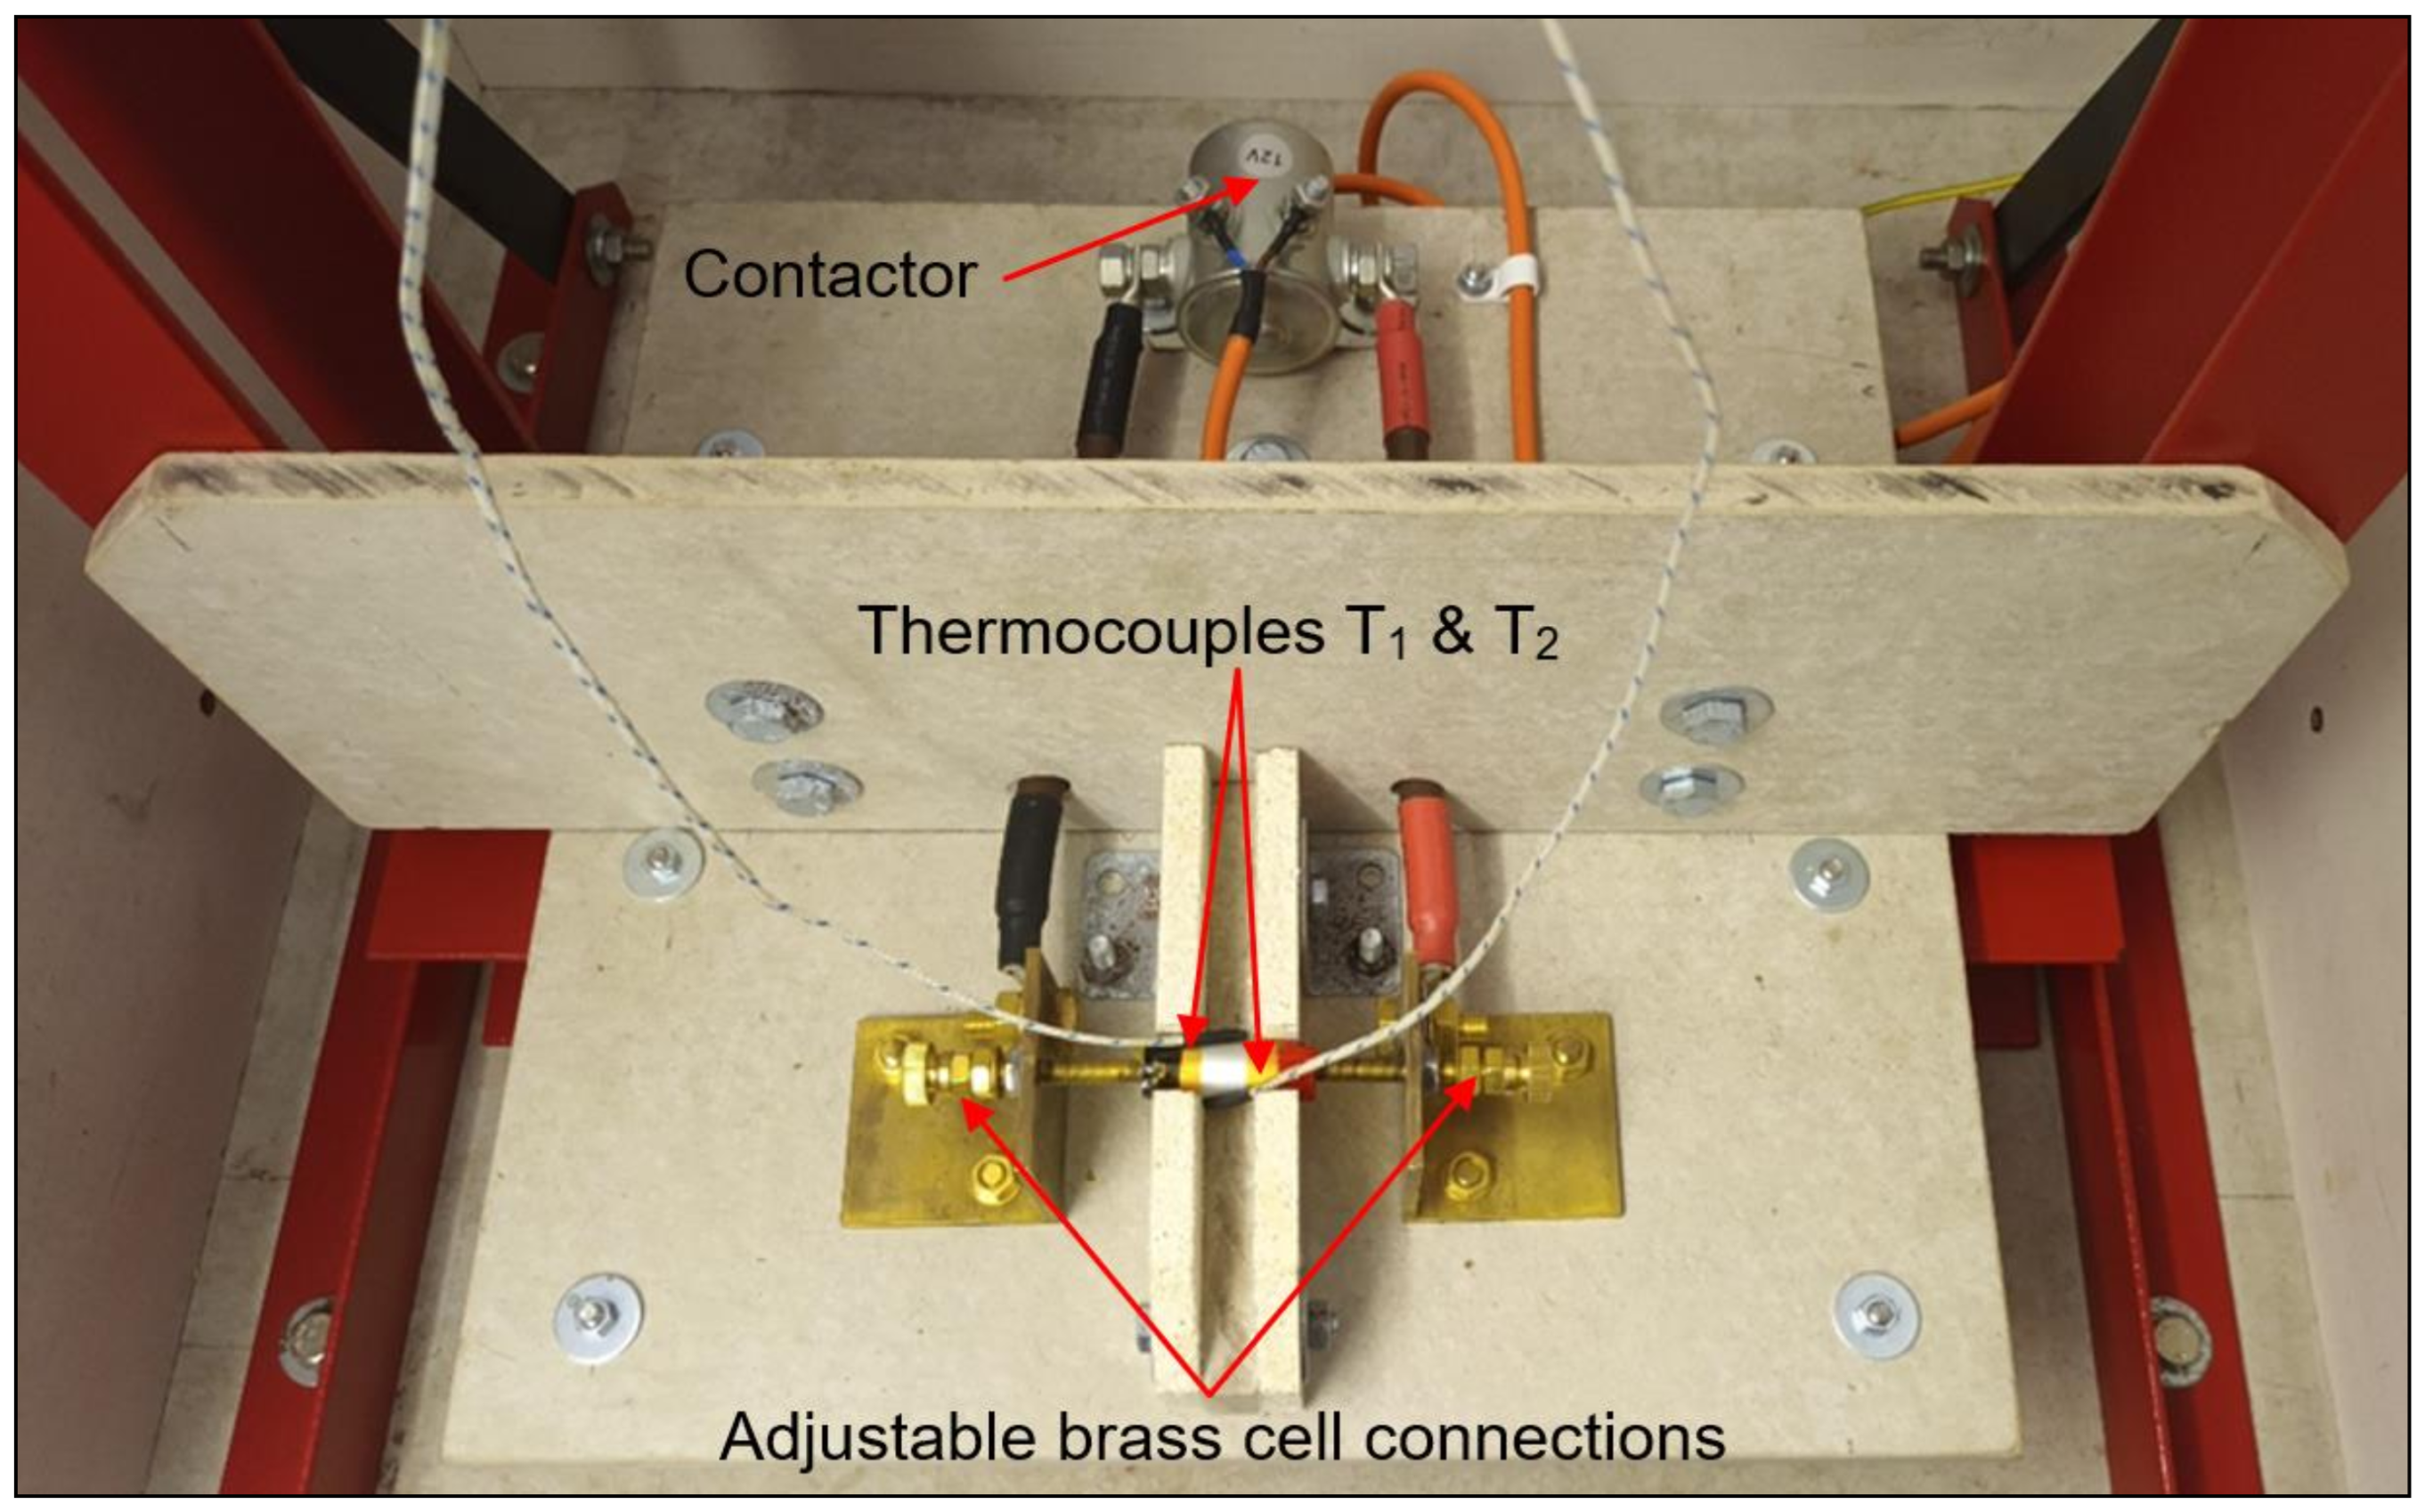
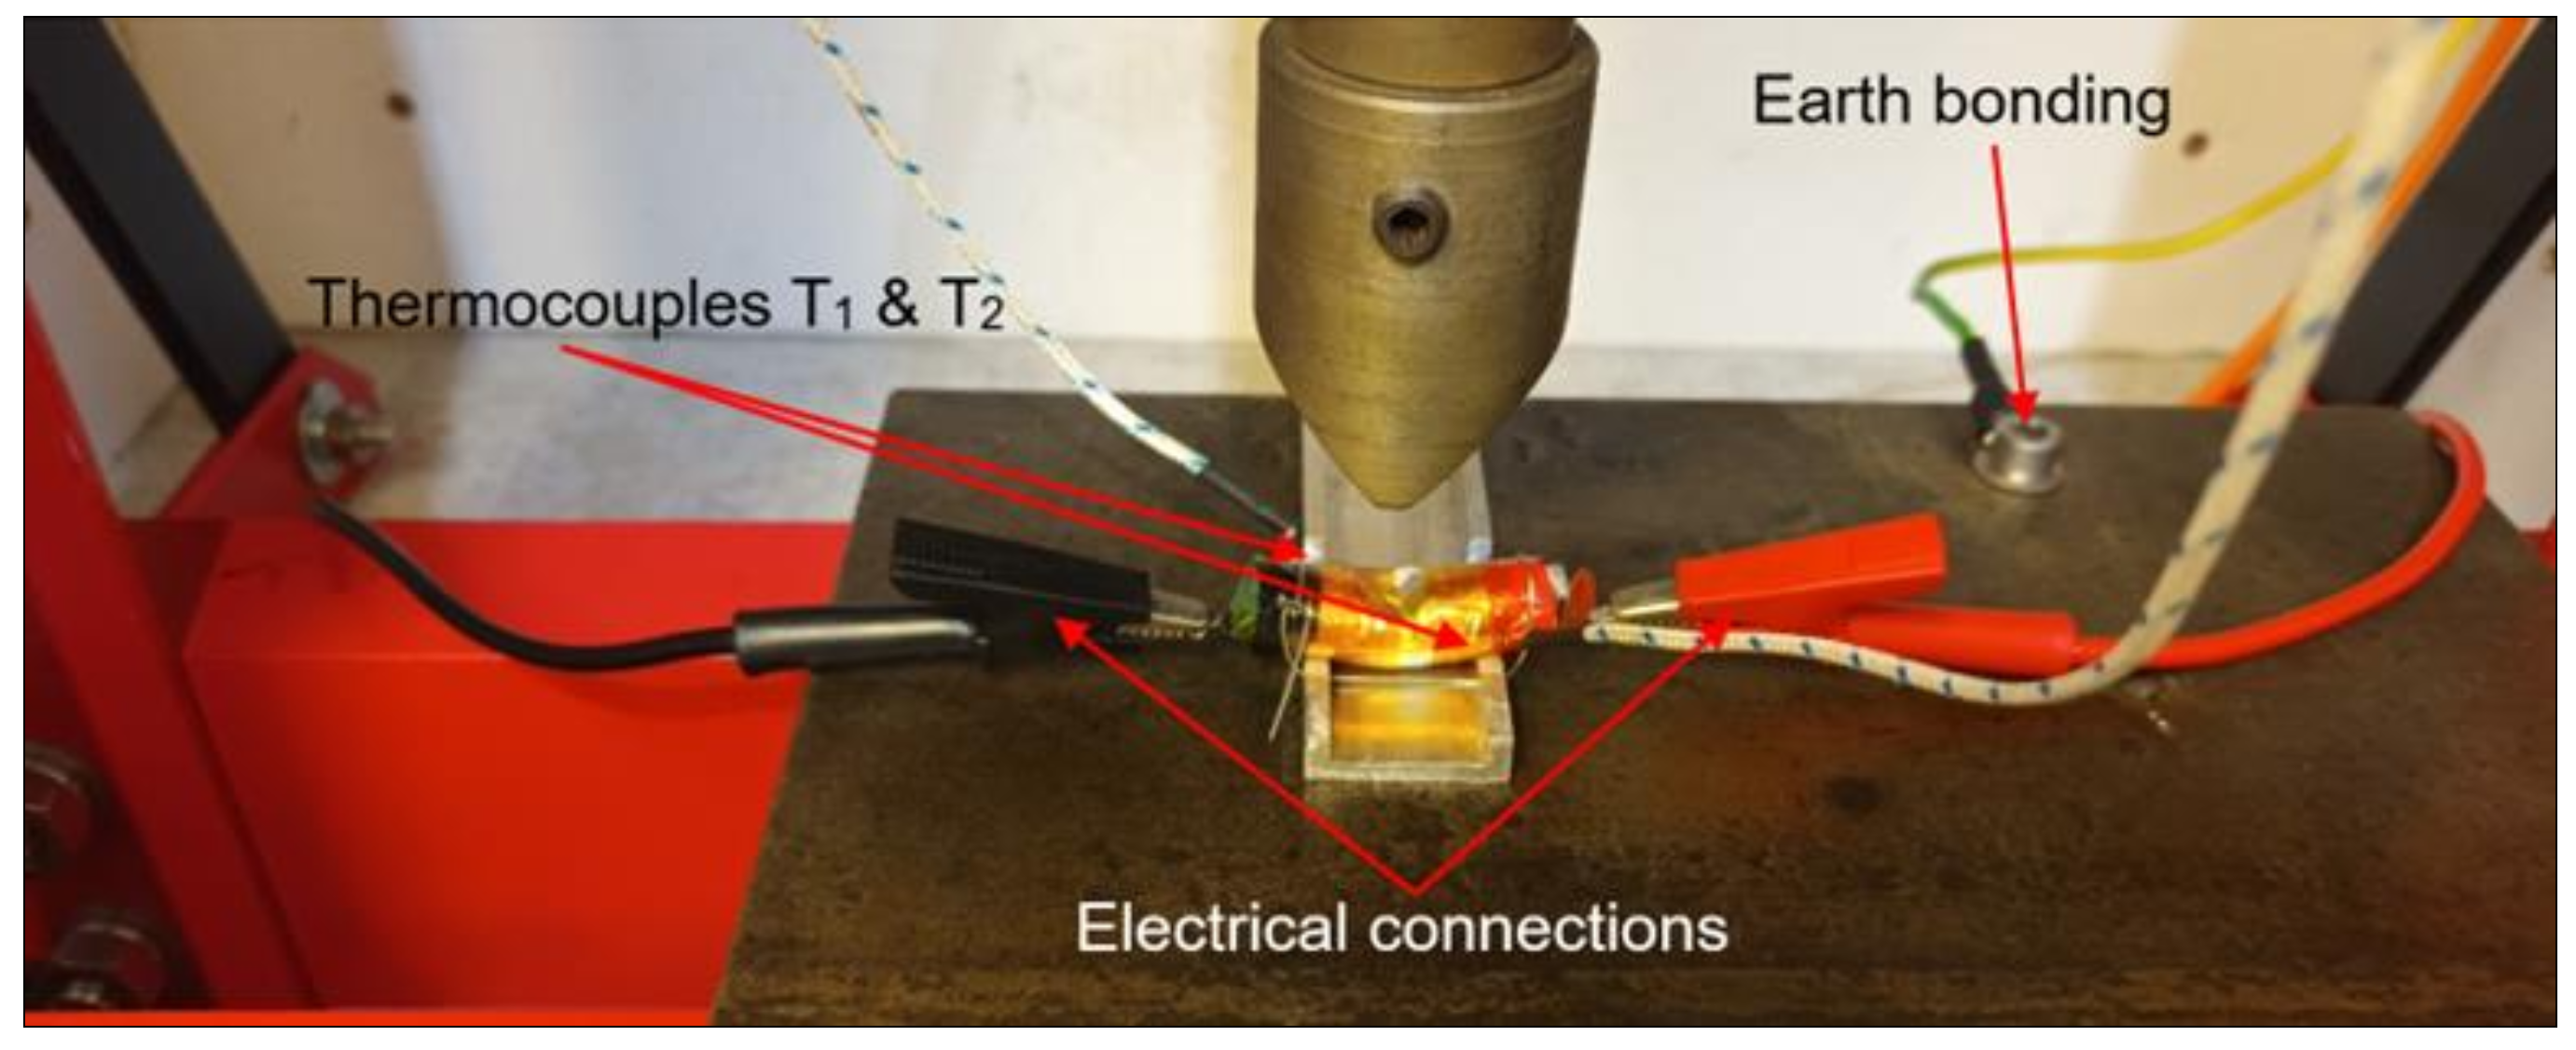
The short-circuit tests were undertaken within the test rig, with the cells held horizontally in a cell holder and the electrical connection made under compression using brass screw fittings. as shown in Figure 7.
A continuous-duty contactor completes the circuit, keeping the cables as short as possible to minimise circuit resistance (2.65 mΩ). The circuit remained closed until the cell current remained at zero and the cell temperature stabilised. The cell current flow is measured via a transducer, and the cell voltage is measured through a direct connection to the cell holder.

2.5.2. Nail Tests

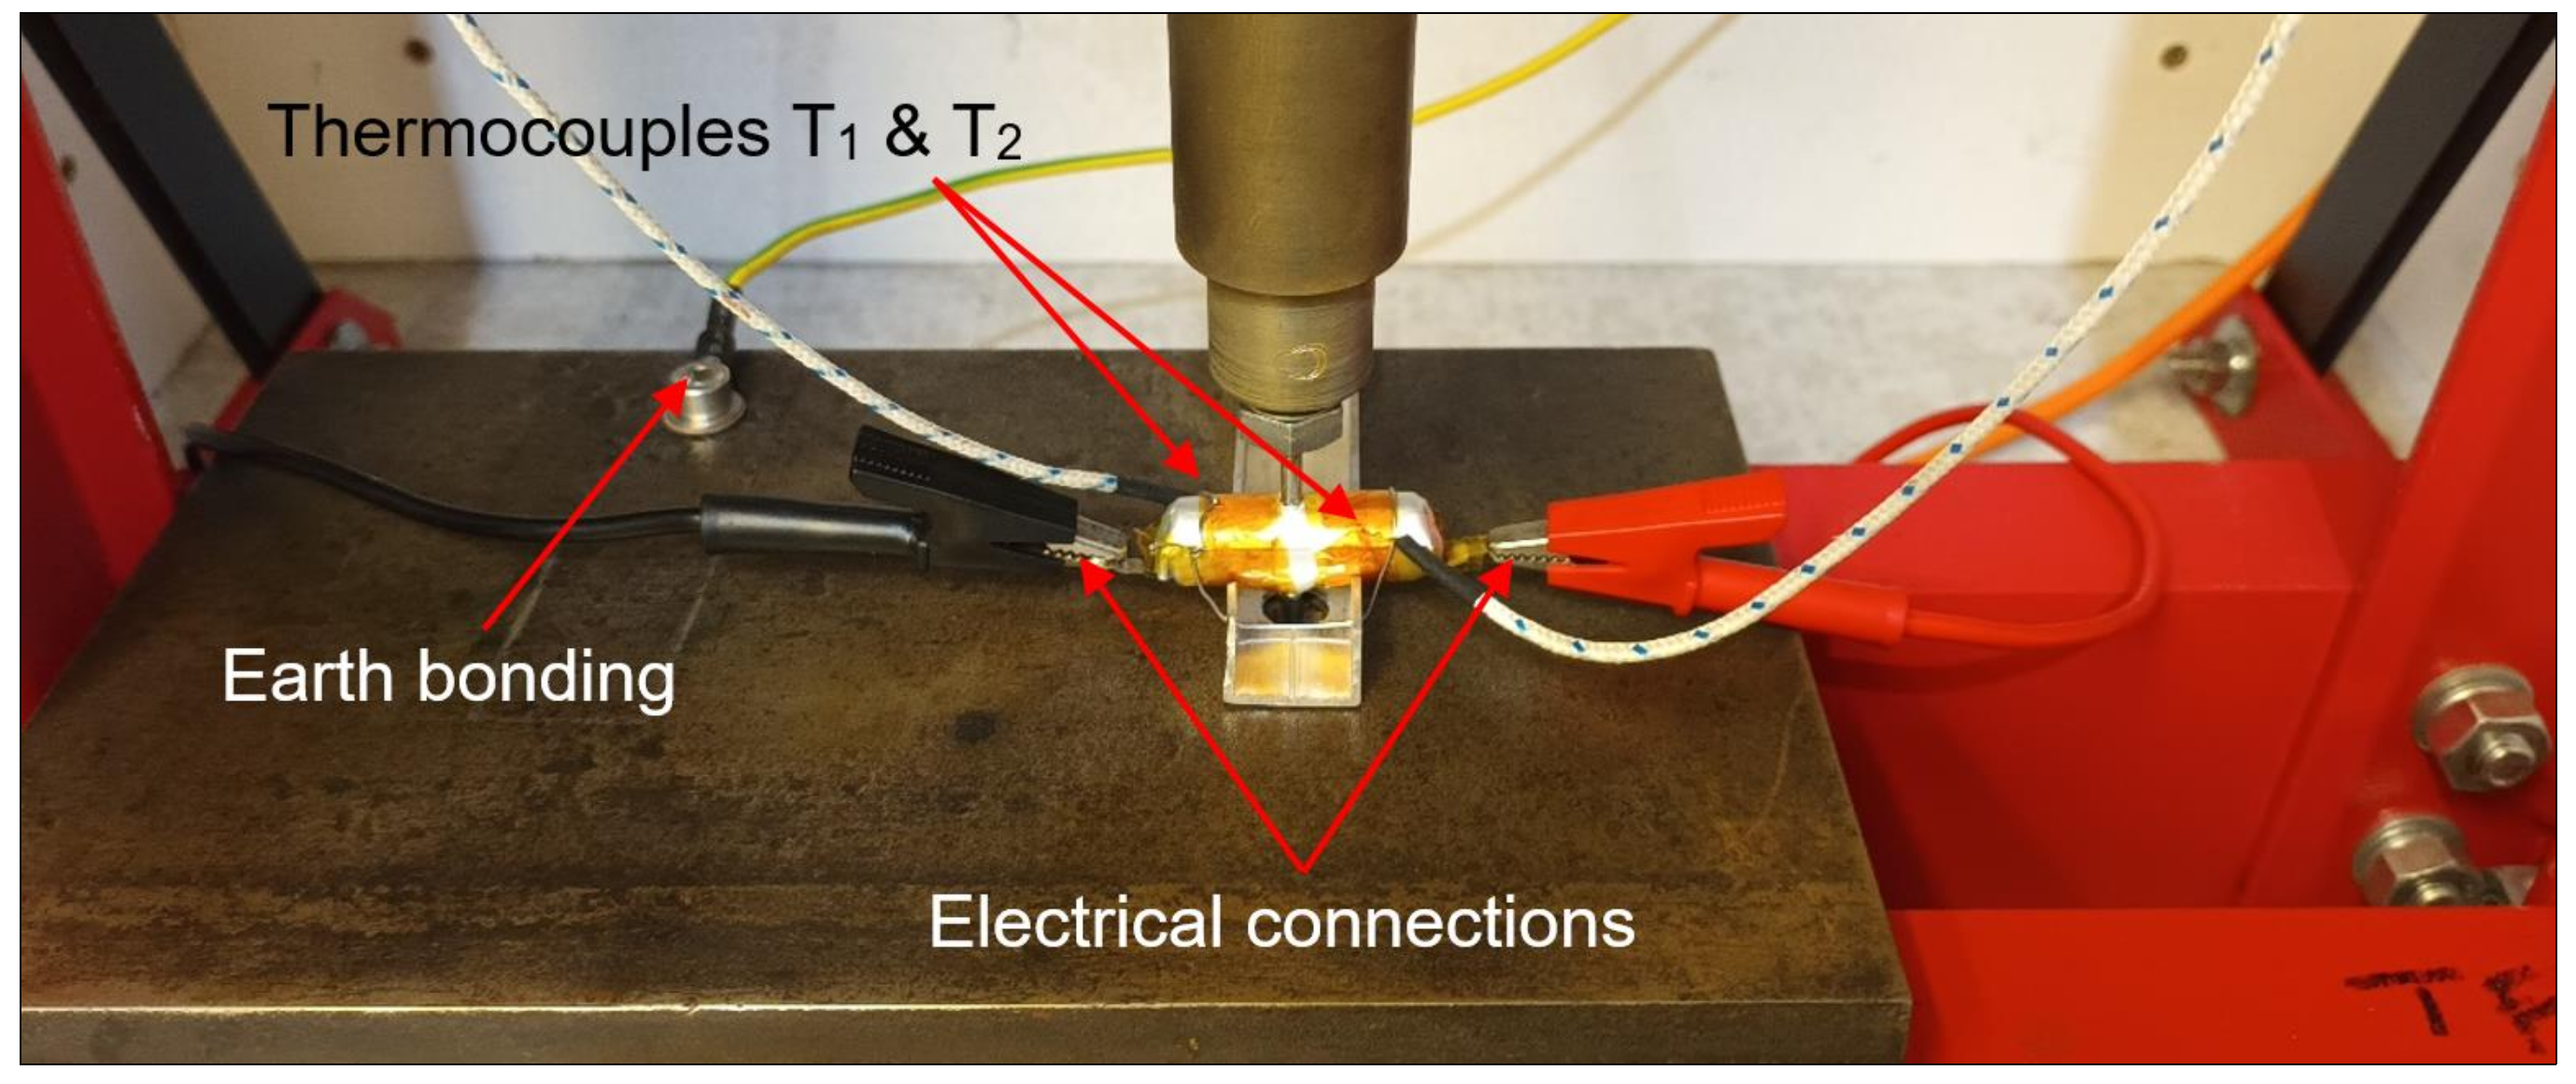
The nail tests were undertaken using the mechanical test rig fitted with a replaceable 3 mm diameter hardened steel nail with a 4 mm point angled at 30°. The nail penetrates the cell centrally and travels entirely through the cell with an impact velocity of 2.8 m/s, as shown in Figure 8.
The cells are fastened to the test-bed horizontally using a bespoke cell holder, holding the cell clear of the test bed to avoid the rig providing a short-circuit route. The cells are secured using 0.6 mm diameter stainless steel locking wire, with the electrical connection measuring test cell voltage made using insulated crocodile clips.

2.5.3. Impact Tests

The impact tests are undertaken using the test rig fitted with a bespoke 36 mm diameter steel vee-shaped mandrel; it has a 3 mm flat point with the flanks angled at 45° to limit the cell damage to impact forces without rupturing the cell casing. The impact velocity is 2.8 m/s, and the maximum impact force is 7.5 kN, with all cells crushed to a depth of ~50% (6 mm) cell diameter, as shown in Figure 9.
The test cells are fastened to the testbed horizontally using a bespoke cell holder, providing complete surface contact to the base of the cells. Again, the cells are secured using stainless steel locking wire, with the electrical connection measuring test cell voltage made using insulated crocodile clips.

2.5.4. Crush Tests

The crush tests are undertaken using the test rig fitted with a bespoke 36 mm diameter steel flat mandrel. The impact velocity is 2.8 m/s, and the maximum impact force 7.5 kN. All cells crushed by ~20% (6 mm—13300 cell & 8 mm—13400 cell) of their length, requiring the test rig to be recalibrated for each 13400 cell test, due to the wide variation in cell length, as shown in Figure 10.
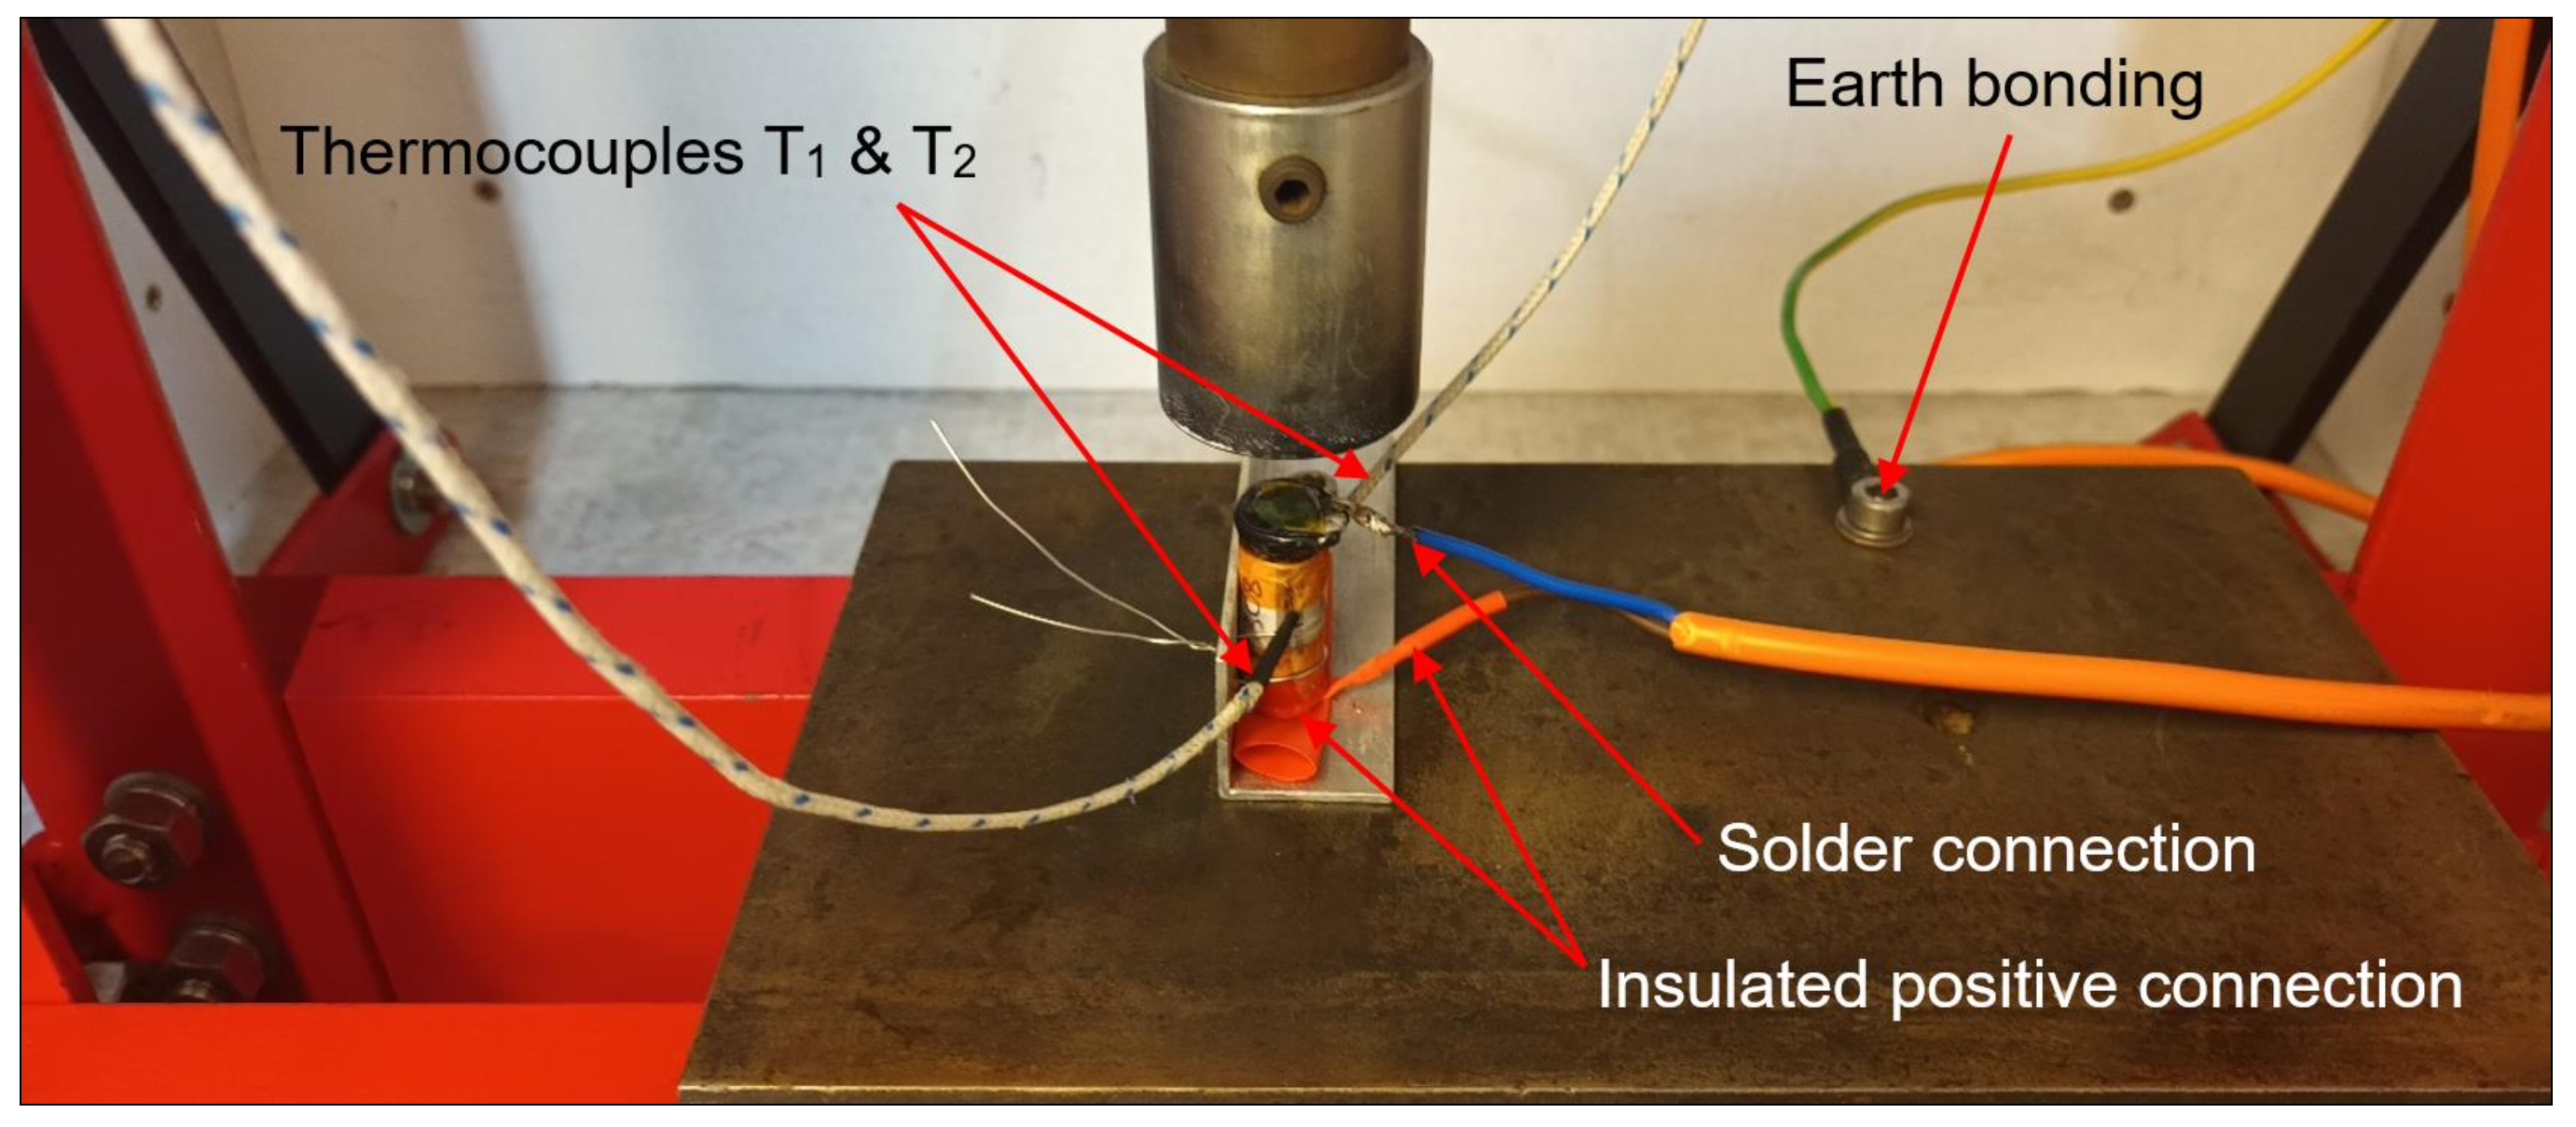
The test cells are fastened to the testbed vertically using a bespoke cell holder and again secured using stainless steel locking wire. The cell is positioned with the positive connection at the base but electrically isolated from the test rig using heat-resistant insulation. This minimises the risk that the test rig forms an external short-circuit rather than from the cell structure being crushed to create an ISC. The electrical connections to the cell are made through soldered connections to ensure resilience during the test.

3. Results and Discussion

3.1. Initial Cell Assessment

A range of cell types was identified, indicating the SUV producers’ use of multiple manufacturers and supplies, as shown in Figure 10. Whilst all cells were within ±0.65 mm (±5%) of the cell 13 mm diameter, with the 13300 cells also within ±1.5 mm (±5%) of the cell 30 mm length, there were more apparent variations in the 13400 cell 40 mm length (Figure 11), which ranged from 35 to 45 mm (±12.5%).
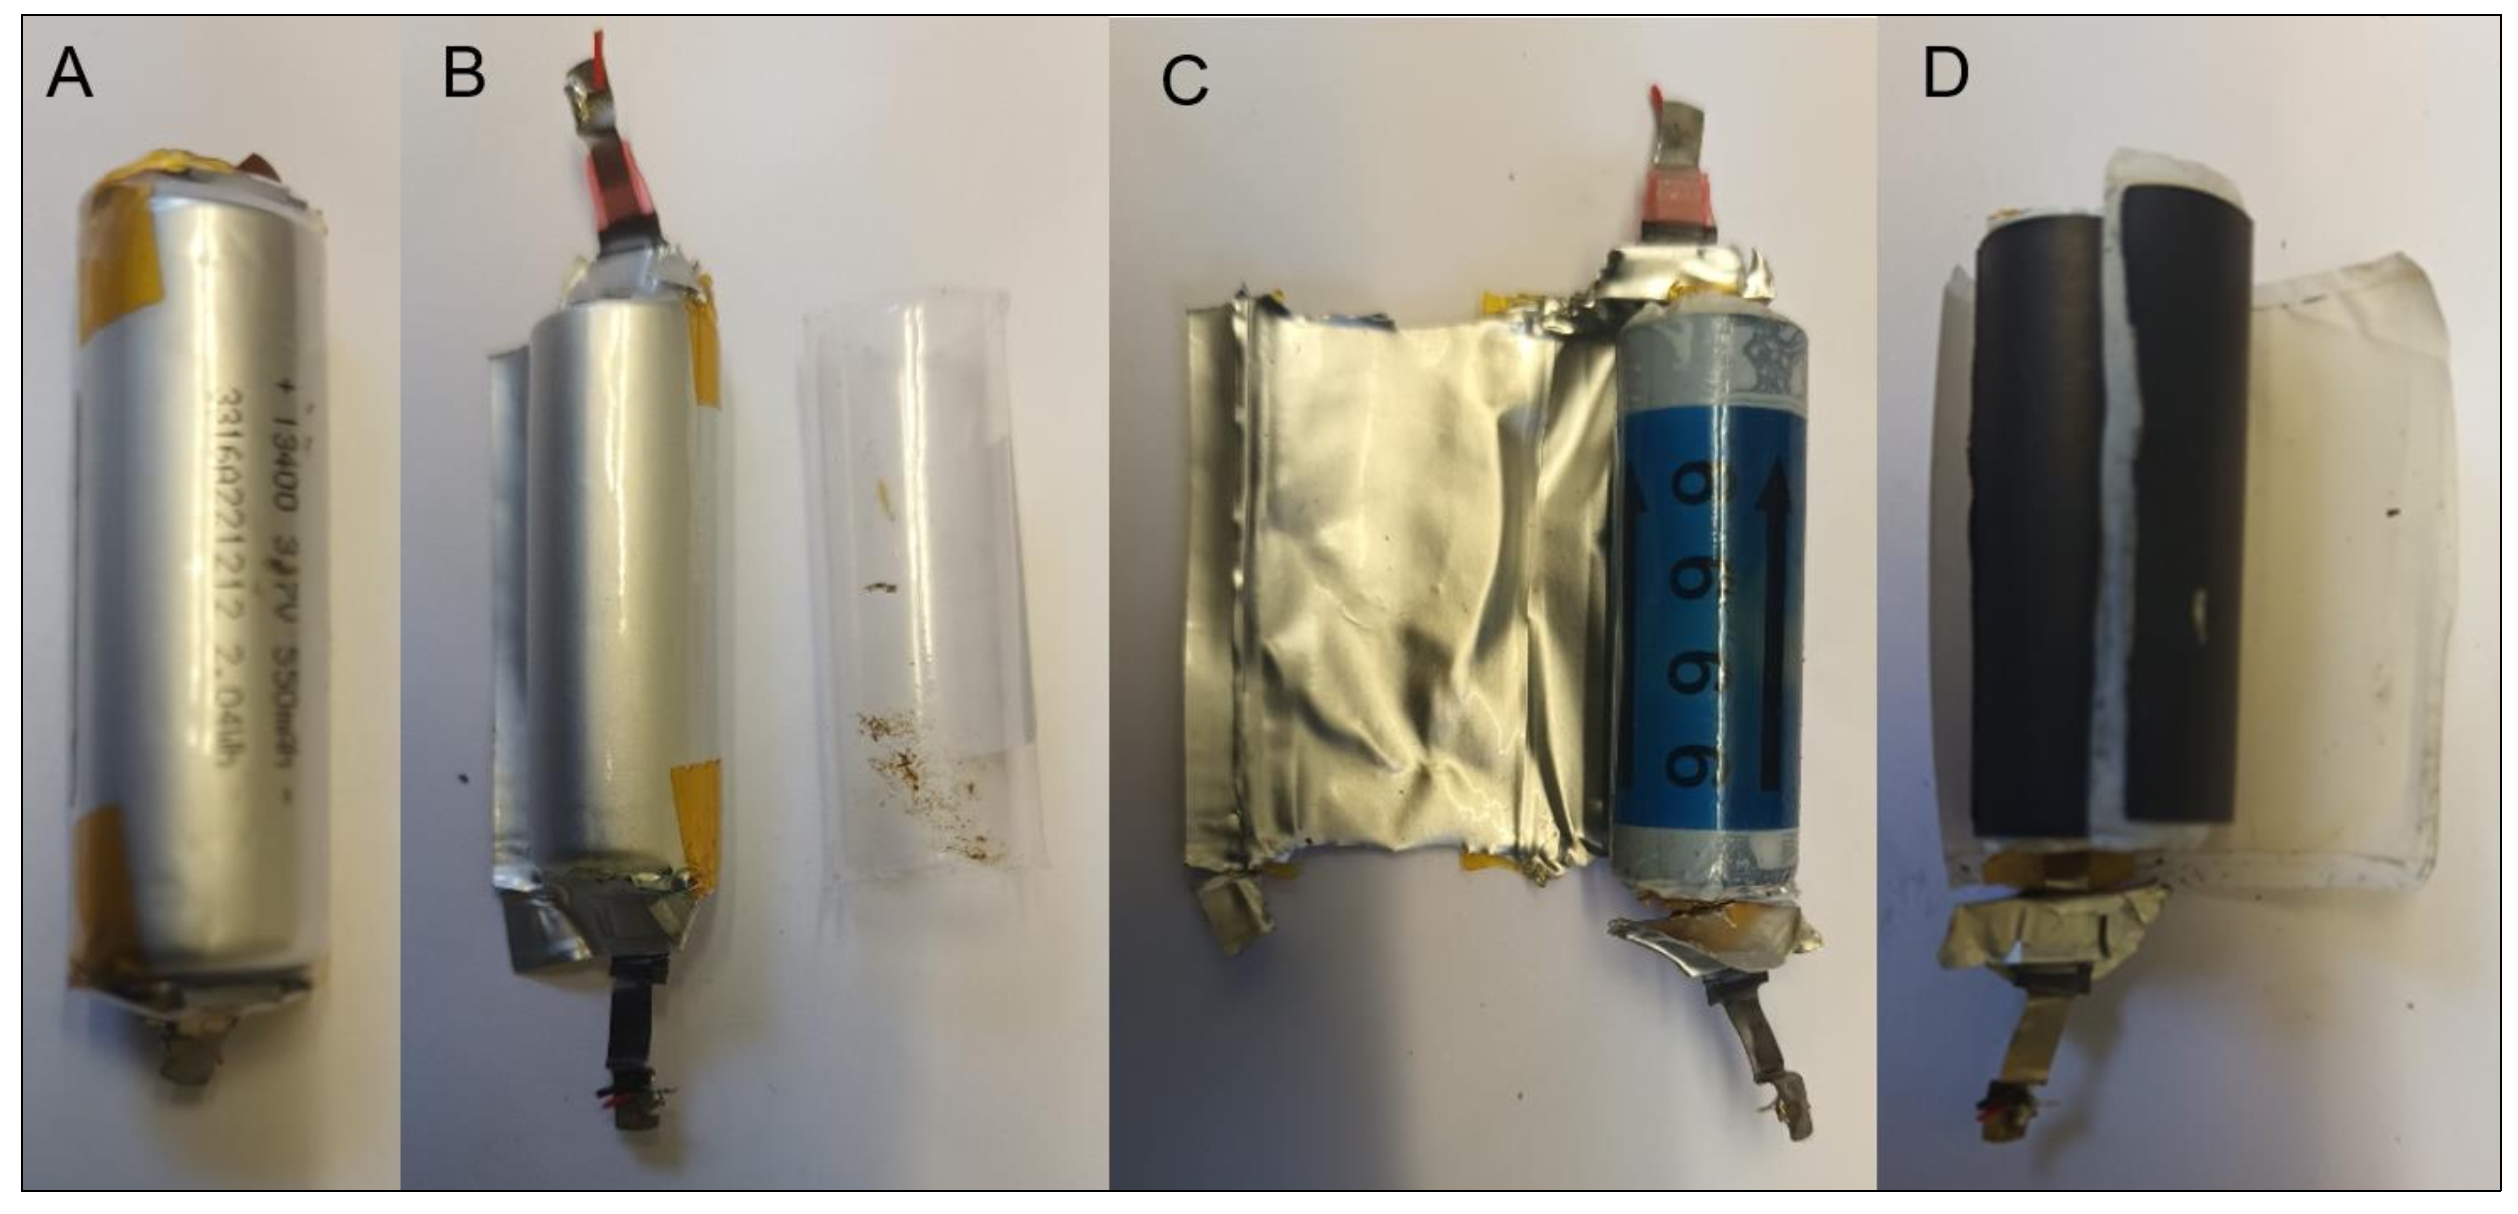
A cell discharged to 0 V was disassembled, and the cell construction was examined, providing valuable insight into the cell design, as shown in Figure 12 below.
The cell is provided with an external plastic shrink wrap, which, once removed, exposed a foil wrapper comparable to a pouch cell construction. When the protective foil was opened, it exposed a thin plastic tube containing the jellyroll construction of the cylindrical cell. The anode and cathode were then exposed, producing the pungent smell associated with the volatile organic solvent electrolyte. There was no evidence of the cell safety strategies found within 18650 cells [36], which routinely include current interruption devices (CID), positive temperature coefficient devices (PTC), and gas vents combined with central vent tubes. This is likely due to the single-use design of the vapes and the absence of a metal casing often found on 18650 cells, which include these safety devices as part of the positive terminal cap design.

3.1.1. Open Circuit Voltage

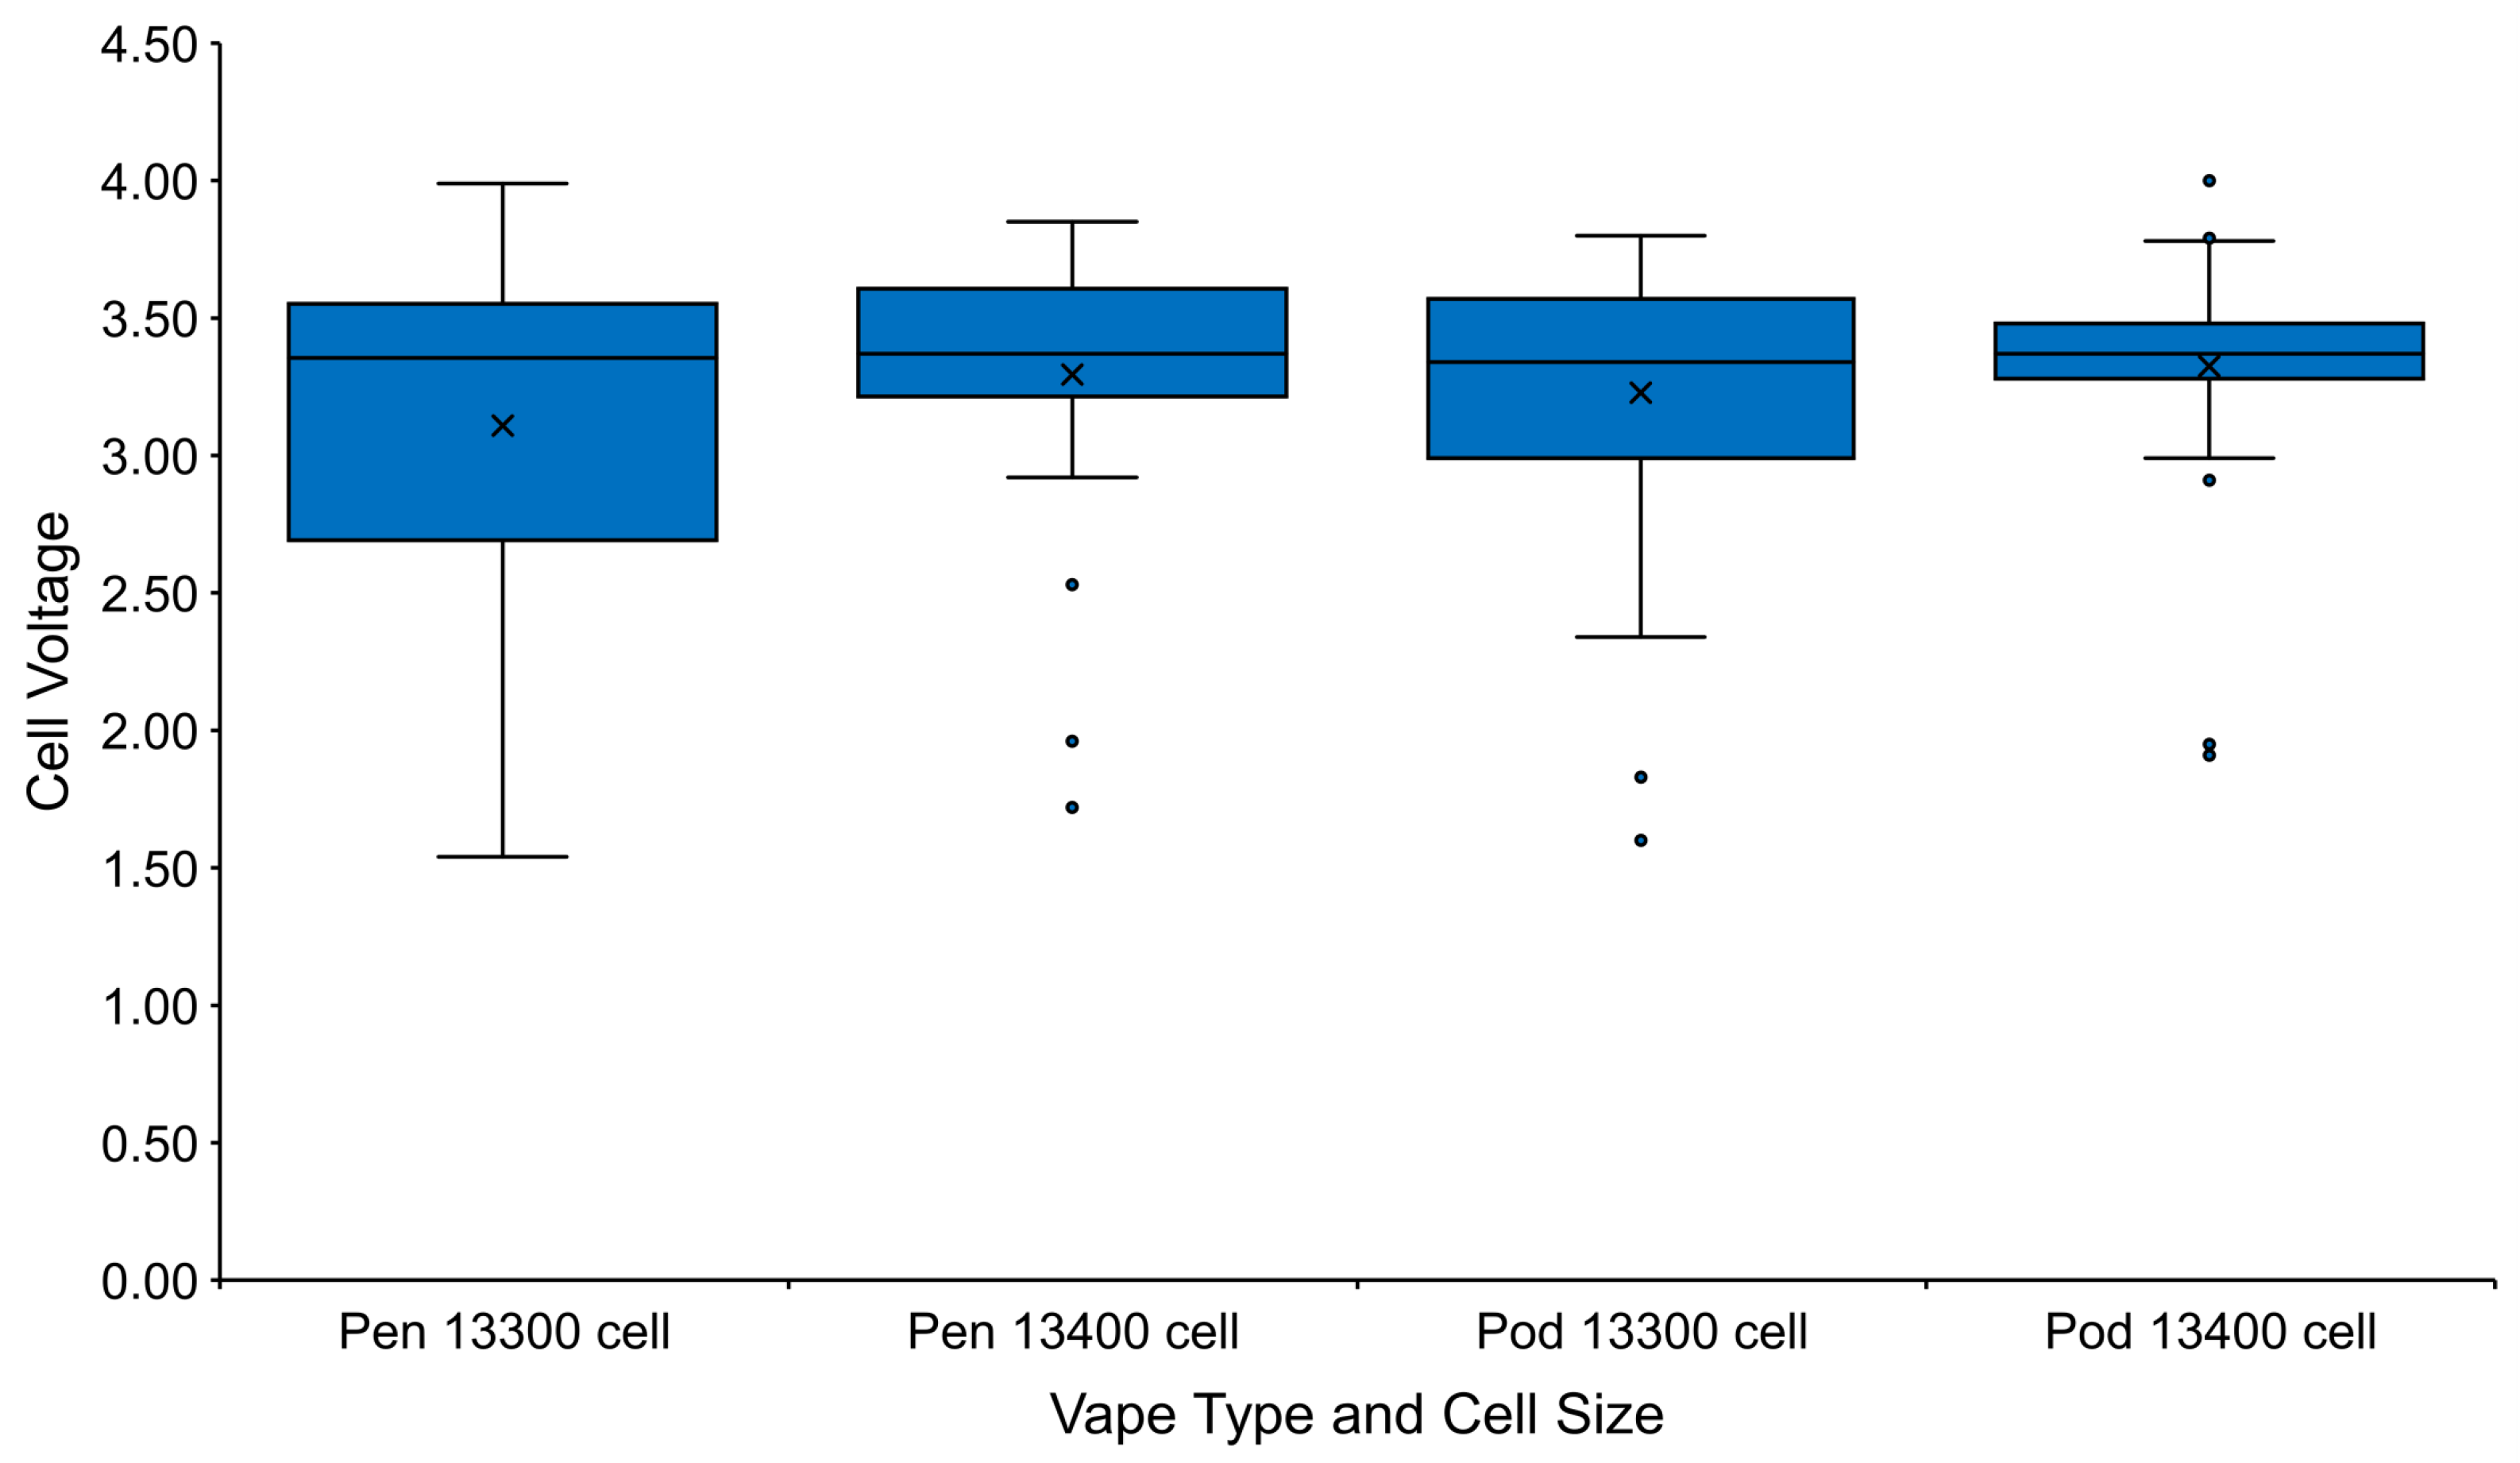
There was wide variation in the initial OCV of the cells, ranging from a maximum of 4.0 V to a minimum of 1.54 V, with 42 cells (21%) below the 3.0 V cut-off. The pod SUVs contained 57% 13300 cells and 43% 13400 cells, whilst the pen SUVs contained a higher proportion—74% 13300 cells and 26% 13400 cells. The chart in Figure 13 shows the distribution of the initial OCV across the two SUV types and corresponding 13300 and 13400 cells.
The initial assessment of the cells identified that the 13300 cells had an average OCV of 3.16 V with a standard deviation of 0.57, compared to the 13400 cells, with a higher average OCV of 3.31 V and a lower standard deviation of 0.44 V. The narrow cluster of the OCV of the 13400 cells shown in Figure 12 reflects the higher cell capacity at 550 mAh and residual SOC. No reason was identified for using the larger capacity of 550 mAh cells, considering the SUVs were identical and required the same power to operate and deliver the nameplate 600 puff capacity.

3.1.2. Initial State of Charge

The five cells with the highest OCV were selected from each SUV type and the corresponding 13300 and 13400 cells to establish the maximum SOC for the SUV cells. The 20 cells were then cycled through a discharge and charge cycle. The results reflect the initial findings, with the 13300 cell average initial SOC at 29.4% (22.2% excluding cell 6) being substantially lower than the 13400 cell average initial SOC at 45.2% (37.3% excluding cell 11), demonstrating the greater residual energy contained in the higher capacity cells. It also identified that where the OCV of the cell is ≤3.7 V, there is a sudden reduction in the SOC with the cells ~90% DOD. The high OCV, 4.0 V and 3.99 V, and respective SOC, 73.3% and 78.5% of cells 6 and 11 are out of keeping with the remaining results, with a possible explanation that the SUVs failed to operate correctly, and the SUVs being discarded without being fully used.

3.1.3. Cell Total Capacity

When carrying out abuse testing of cells, the cells are discharged to 0 V beyond the cell’s rated capacity and the 3.0 V minimum DOD cut-off voltage, designed to protect the cells from premature ageing and dendrite growth [34]. The availability of excess cells provided the opportunity to establish the total capacity of the cells tested.
Three 13300 and three 13400 cells were fully charged, then discharged to 3.0 V at 0.5 C, followed by a further discharge cycle until the current discharge reached ≤100 mAh. The results confirmed the additional energy available for release during cell abuse, with a maximum increase in SOC of 7.2% (26 mAh) for 13300 cells and a more substantial 14% (77 mAh) for 13440 cells.

3.2. Electrical Abuse Tests

The short-circuit test is a crucial test scenario when assessing the safe operation of Li-ion cells used in portable applications. The standard requires that cells remain safe during intended use and reasonably foreseeable misuse and that an external short-circuit will not cause a fire or explosion [23]. The tests were repeated in triplicate for 13300 and 13400 cells at 100% SOC and then 50% SOC. These first series tests were labelled as Test 1 to 12 (2 Cell types × 2 SOC × 3 repeats = 12 tests).
The tests resulted in irreversible damage to all cells due to the absence of protective safety devices commonly included within 18650 cells [36]. Figure 14 provides a temperature and current profile over time from Test 5 (a 13400 cell at 100% SOC). A high current immediately flowed on activation of the short-circuit, closely followed by a rapid temperature increase due to the generation of Joule heat created by the external short-circuit. The temperature increase and resulting internal cell pressure led to cell venting, visually confirmed within seconds and in all cases before reaching the maximum temperature, T m a x . As expected, the larger capacity 13400 cells at 100% SOC achieved the maximum current flows. However, the reverse occurred when testing the 13300 cells, where the highest current flow occurred during Test 11 (a 13300 cell at 50% SOC).
There was no direct correlation between the cathode T 1 m a x and anode T 2 m a x , with T 1 recording the highest temperature during tests 1, 2, 4, 6, 9, and 11 and T 2 recording the highest temperature in tests 3, 5, 7, 8, 10 and 12. The highest temperature (143 °C) and duration to T m a x (106 s) were recorded during test 1, which was a 13300 cell at 100% SOC). Despite the relatively small size and corresponding cross-sectional area of the cells, there was a high-temperature gradient observed between T 1 and T 2 during test 1 (39 °C) and test 12 (37 °C), when compared to tests 2–11, where a standard differential temperature of 4 °C–19 °C was recorded.
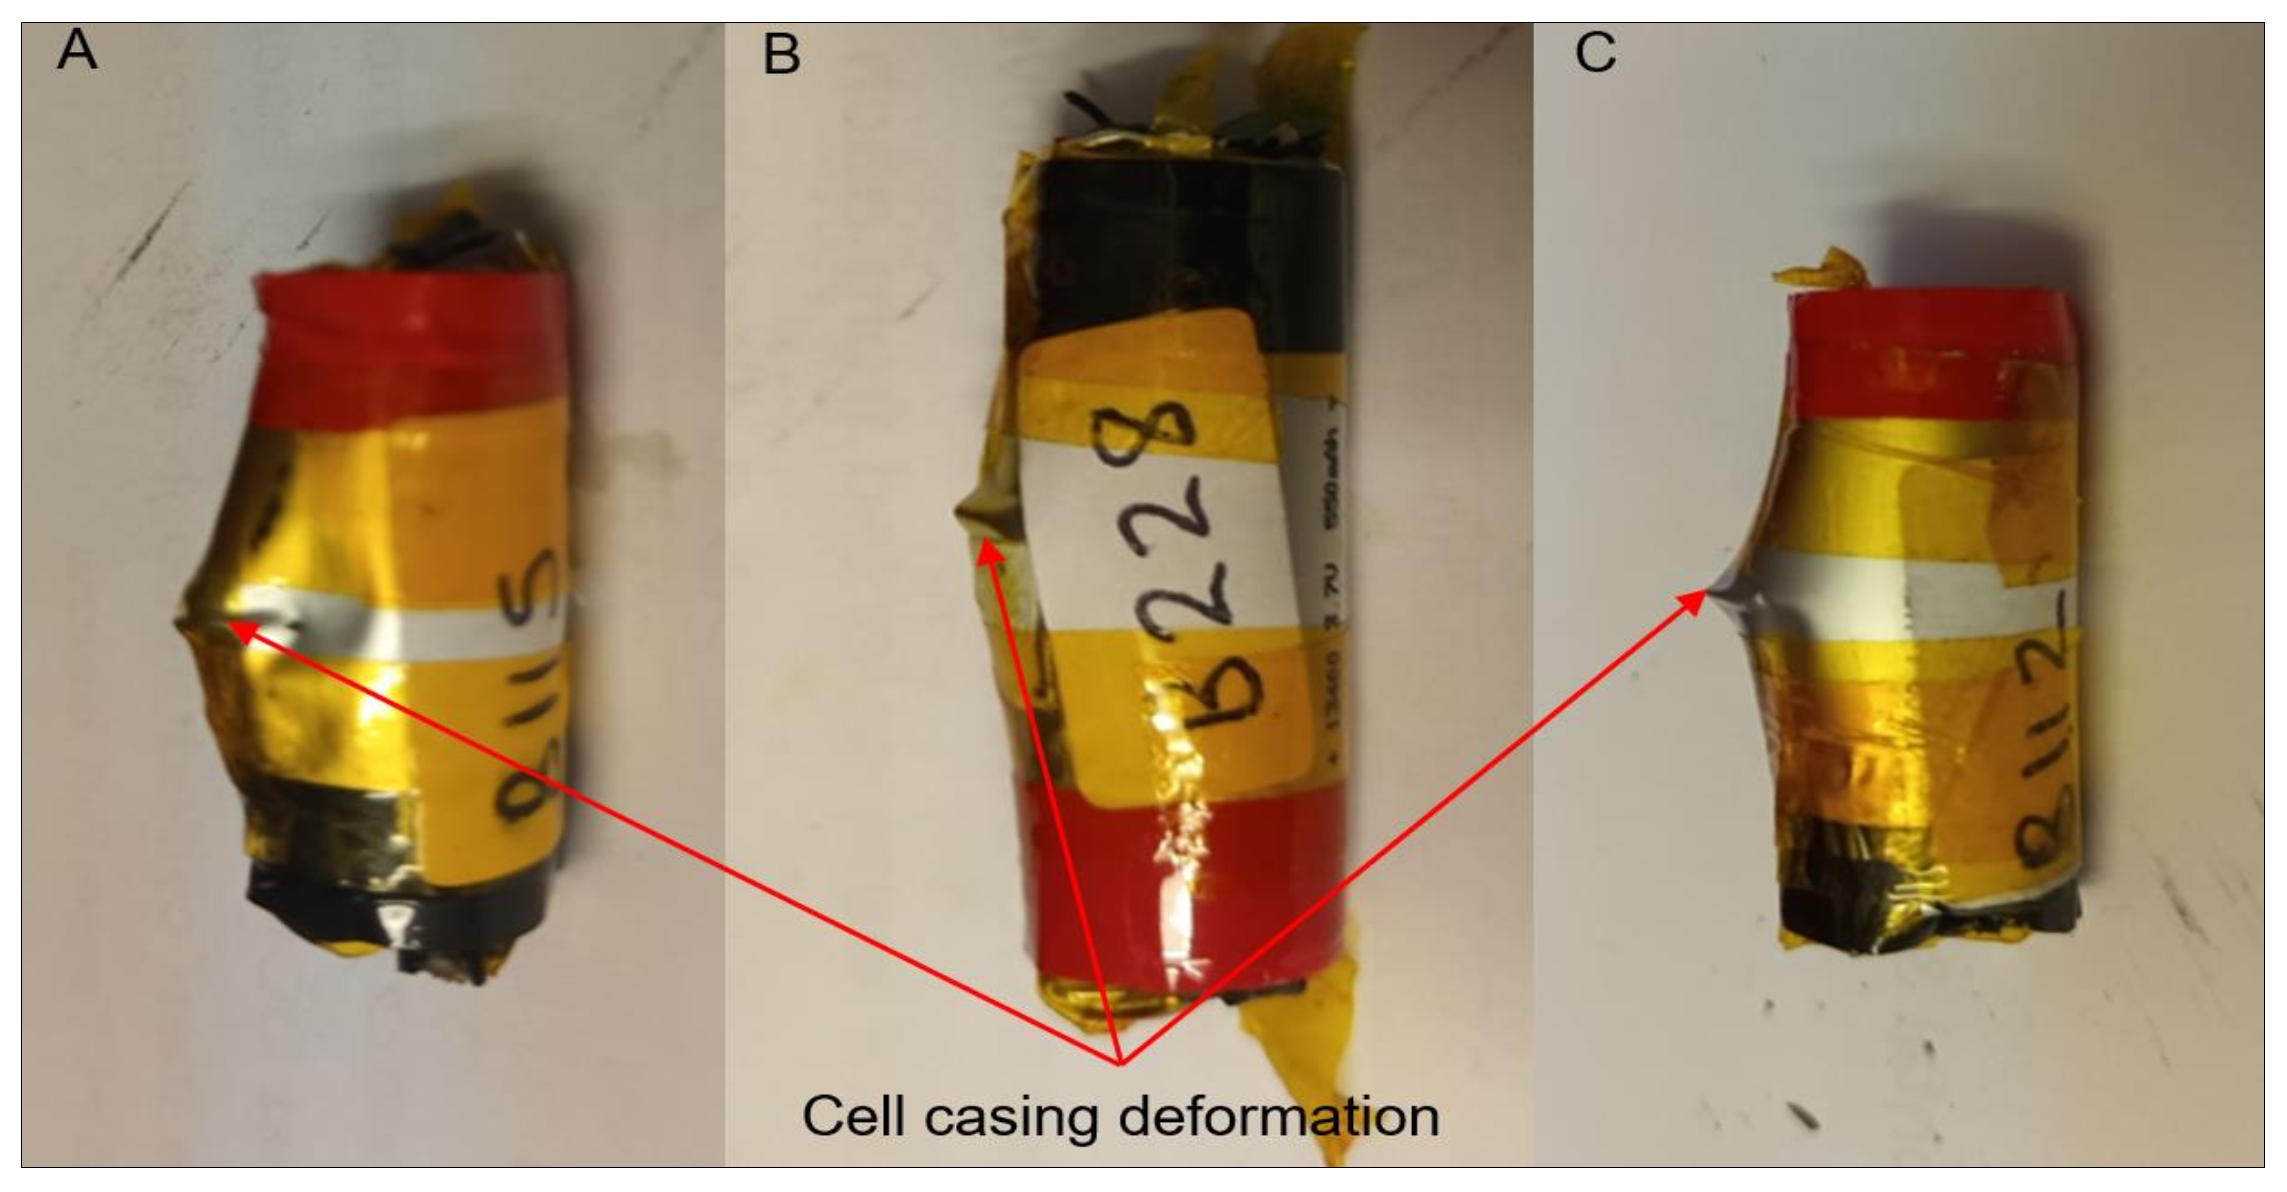
Figure 15 below provides images of three cells post-test, highlighting the central location of cell deformation due to internal pressure.
The testing rig design appeared to influence the cells’ management of the internal pressure created by the increase in temperature and corresponding vapourisation of the electrolyte. Whilst cell venting occurred at the weakest point, identified as the seal between the positive (Test 11) or negative (Test 1–10 & 12) terminal and the cell foil casing without rupture of the cell casing, deformation of the cell casing in the centre section of the cell body was witnessed on multiple cells. This suggests that the Kapton tape, the cell support, and the compression electrical connection may have, individually or in combination, restricted the gas expansion within the cells during the tests, forcing the excess internal pressure to the central section of the cell casing.

3.3. Mechanical Abuse Tests

3.3.1. Nail Tests

The nail test is a critical mechanical abuse scenario used when assessing the safe operation of Li-ion cells used in Electric Vehicles (EV). The standard provides a framework to evaluate cell safety in response to abuse conditions, including cell damage from external objects that compromise the cell’s structural integrity [8].
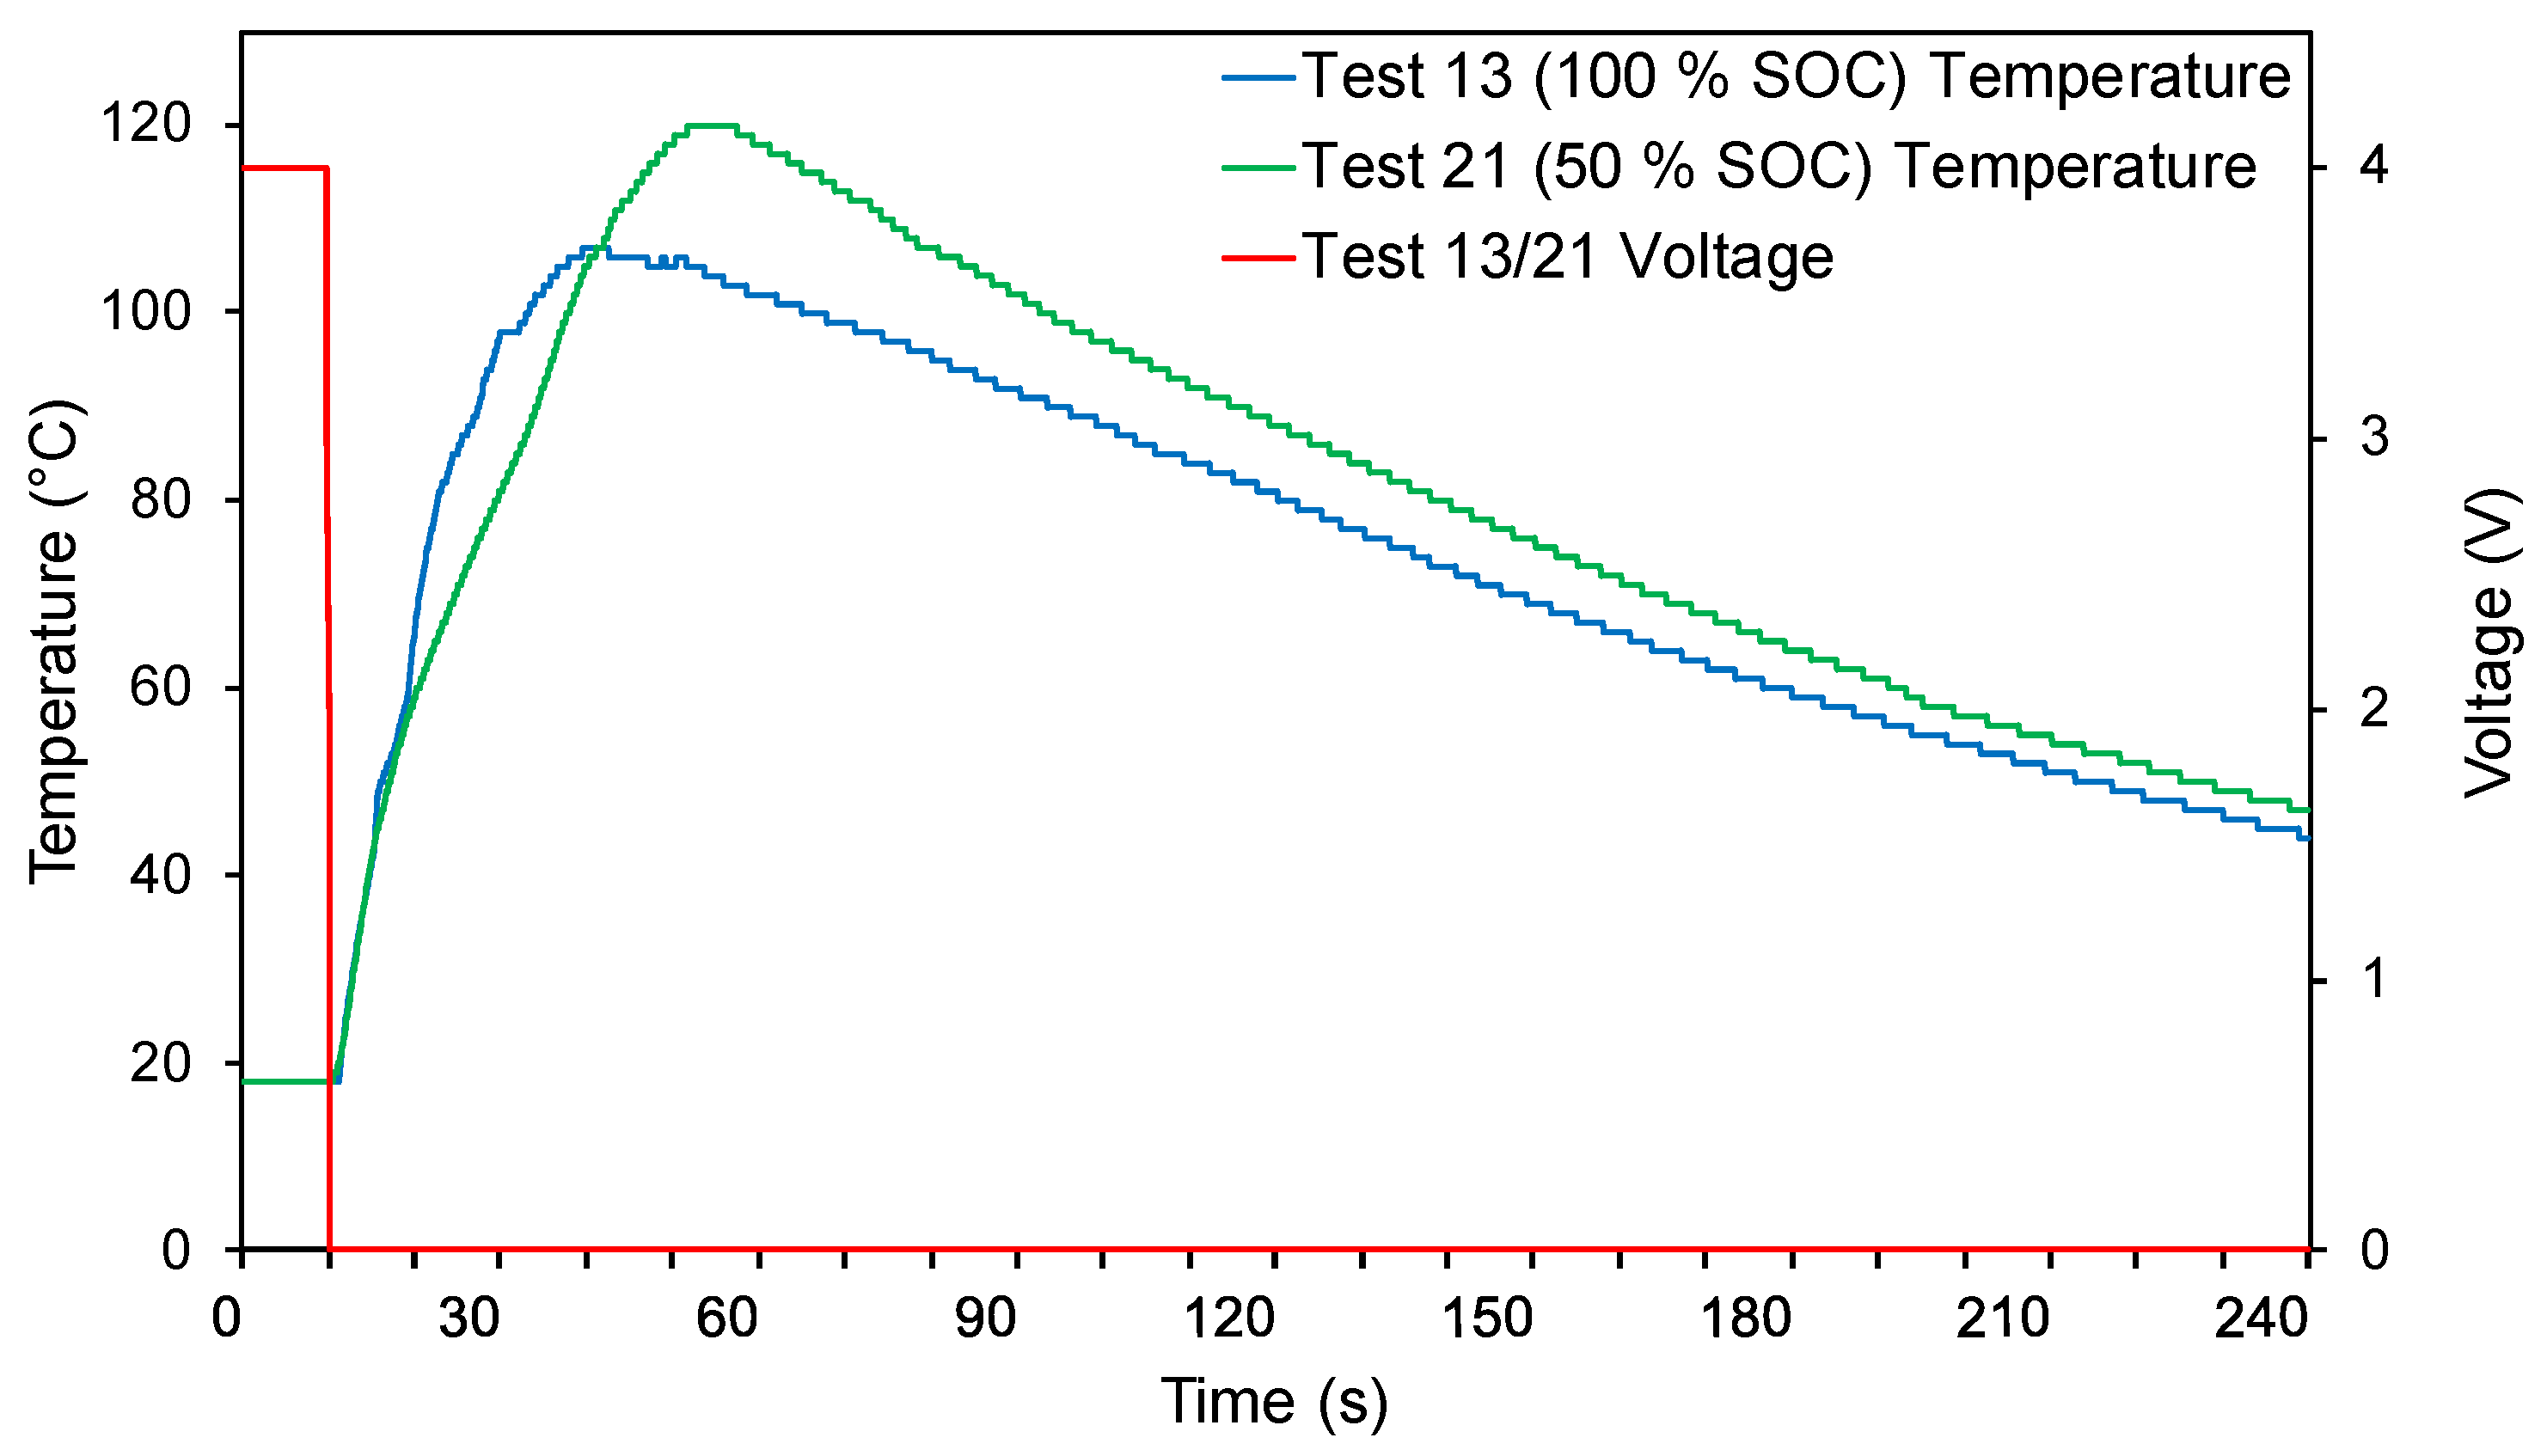
The tests were repeated in triplicate for 13300 and 13400 cells at 100% SOC and then 50% SOC. The second series of tests were labelled as Tests 13 to 24. Tests 13–15 and 17–24 showed broad similarities, with the nail penetration of the cell resulting in an immediate ISC witnessed by the cell voltage dropping to 0 V. This was closely followed by a rapid temperature increase due to the generation of Joule heat within the cell, with cell venting visually confirmed within a matter of seconds and in all cases prior to T m a x , as shown in Figure 16.
The cell SOC had a clear impact on T m a x and time to T m a x , with the mean T m a x for cells at 100% SOC lower (13300 cells 107 °C and 13400 cells 111 °C) when compared to cells at 50% SOC (13300 cells have a mean of 123 °C and 13400 cells have a mean of 117 °C). This was directly linked to time to T m a x , where cells at 100% SOC had a shorter duration time to T m a x (13300 cells have a mean of 29 s and 13400 cells have a mean of 30 s) in comparison to the longer T m a x time for cells at 50% SOC (13300 cells have a mean of 44 s and 13400 cells have a mean of 38 s).
This suggests that the releasable energy contained within the cells at 100% SOC is more significant; however, due to the use of a conductive nail and the immediate ISC this creates across the whole cell structure, there is an instantaneous energy discharge [13].
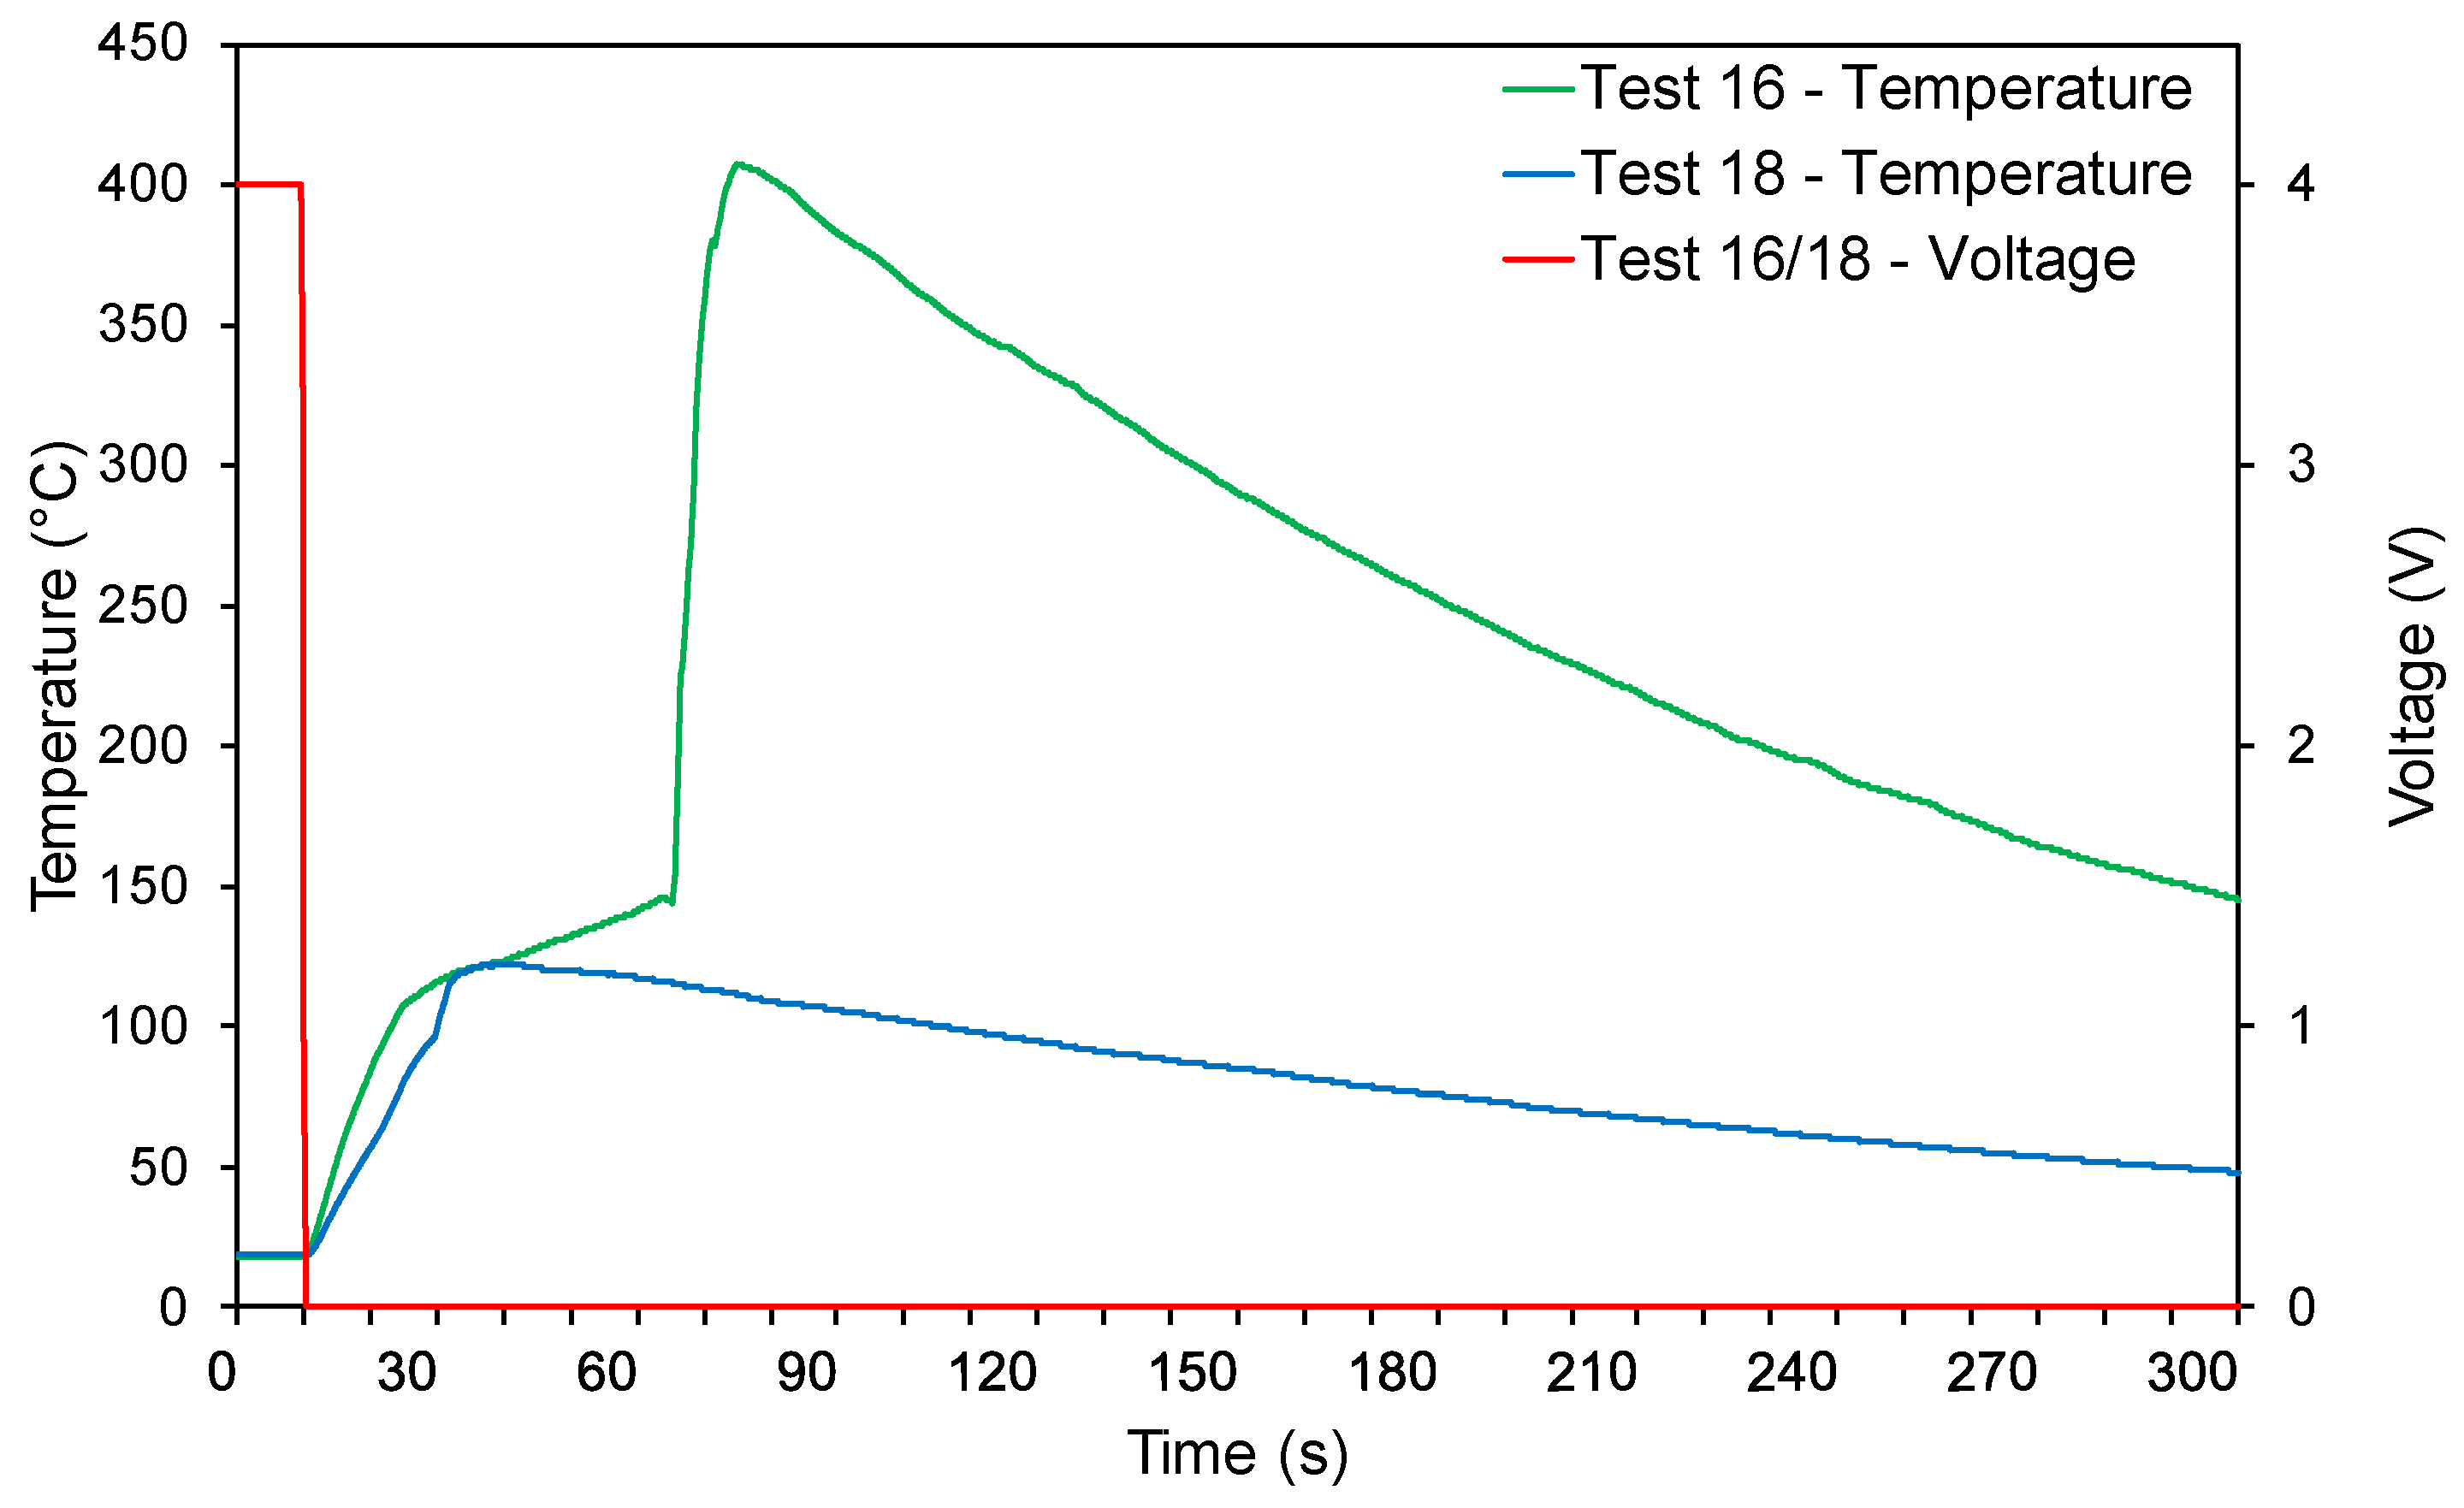
This appears to lead to the energy being released so rapidly that it does not have sufficient time to propagate through the cell body to the cell surface where the thermocouples are attached. Meanwhile, the cells at 50% SOC have lower energy levels, leading to a slower discharge, developing a heat release profile that allows the heat to dissipate more readily through the cell structure to the cell surface. Test 16 (a 13400 cell at 100% SOC) resulted in TR. The initial stages of the test followed a similar temperature profile to the subsequent tests, 17 and 18, with a rapid rise in temperature immediately following the nail penetration and ISC, as shown in Figure 17 below.
The temperature curve started to flatten at 108 °C; however, the temperature continued to rise rather than peaking and cooling as the heat dissipated to the surrounding environment. At 146 °C, rapid unignited cell venting was witnessed from the ends of the cell, which resulted in momentary cooling (−2 °C), followed by an exponential rise in temperature, taking <9 s to reach the 407 °C ( T 2 m a x ). The transition to TR is a direct result of the separator failure at 145 °C–150 °C [37] and the escalation from a localised ISC. During this rapid transformation, the T 1 thermocouple detached from the cell casing at 246 °C.
Despite the high temperatures and volumes of gases vented, the gases did not ignite; however, the non-flaming pyrolysis causes significant damage to the cell, as shown in Figure 18.
The test results confirm the limitations of the nail test due to the use of a conductive material to generate an instantaneous ISC across the whole cell structure. The test is, therefore, limited to demonstrating the impact of cell penetration by a conductive nail within a narrow set of parameters.

3.3.2. Impact Tests

The novel abuse test was developed to represent more closely the physical damage likely suffered by an SUV during waste and recycling material management processes. The tests were repeated in triplicate for the 13300 and 13400 cells at 100% SOC and then 50% SOC. The test cases were labelled as Tests 25 to 36. The cells proved highly malleable, with the cell casing remaining intact despite the significant deformation to the cell structure, as shown in Figure 19.
The results for Tests 25–29 (100% SOC) and 31–36 (50% SOC) exhibited broad similarities. The impact on the cell resulted in an immediate ISC witnessed by the cell voltage dropping to <1.0 V. This was closely followed by a rapid temperature increase due to the generation of Joule heat within the cell, with cell venting visually confirmed within a matter of seconds and in all cases prior to T m a x .
The cell SOC had a less pronounced impact on T m a x , with the average T m a x for 13300 cells at 100% SOC (107 °C) marginally higher than the T m a x average for 13300 cells at 50% (106 °C), whereas 13400 cells followed a similar pattern to the nail test with the average T m a x for 13400 cells at 50% SOC (113 °C) higher than the average T m a x for 13400 cells at 100% SOC (99 °C).
The time to T m a x showed a correlation with the nail tests, with the cells at 100% SOC having a shorter duration time to T m a x (13300 cells have a mean of 29 s and 13400 cells 25 s) in comparison to the T m a x time for cells at 50% SOC (13300 cells have a mean of 38 s and 13400 cells 48 s).
Figure 20 below provides the T 1 T 2 temperature differential comparison and voltage profile over time from Test 27 (a 13300 cell at 100% SOC). The impact test produced a more pronounced deviation in the T 1 m a x and T 2 m a x temperature readings during tests 25, 27, 30, 33, and 35, with the average temperature differential and standard deviation for the nail tests (12 °C and 14.2 °C), slightly lower when compared to the impact test (15 °C and 14.7 °C). This suggests that the impact damage to the central section of the cell restricted the heat transfer across the cell structure.
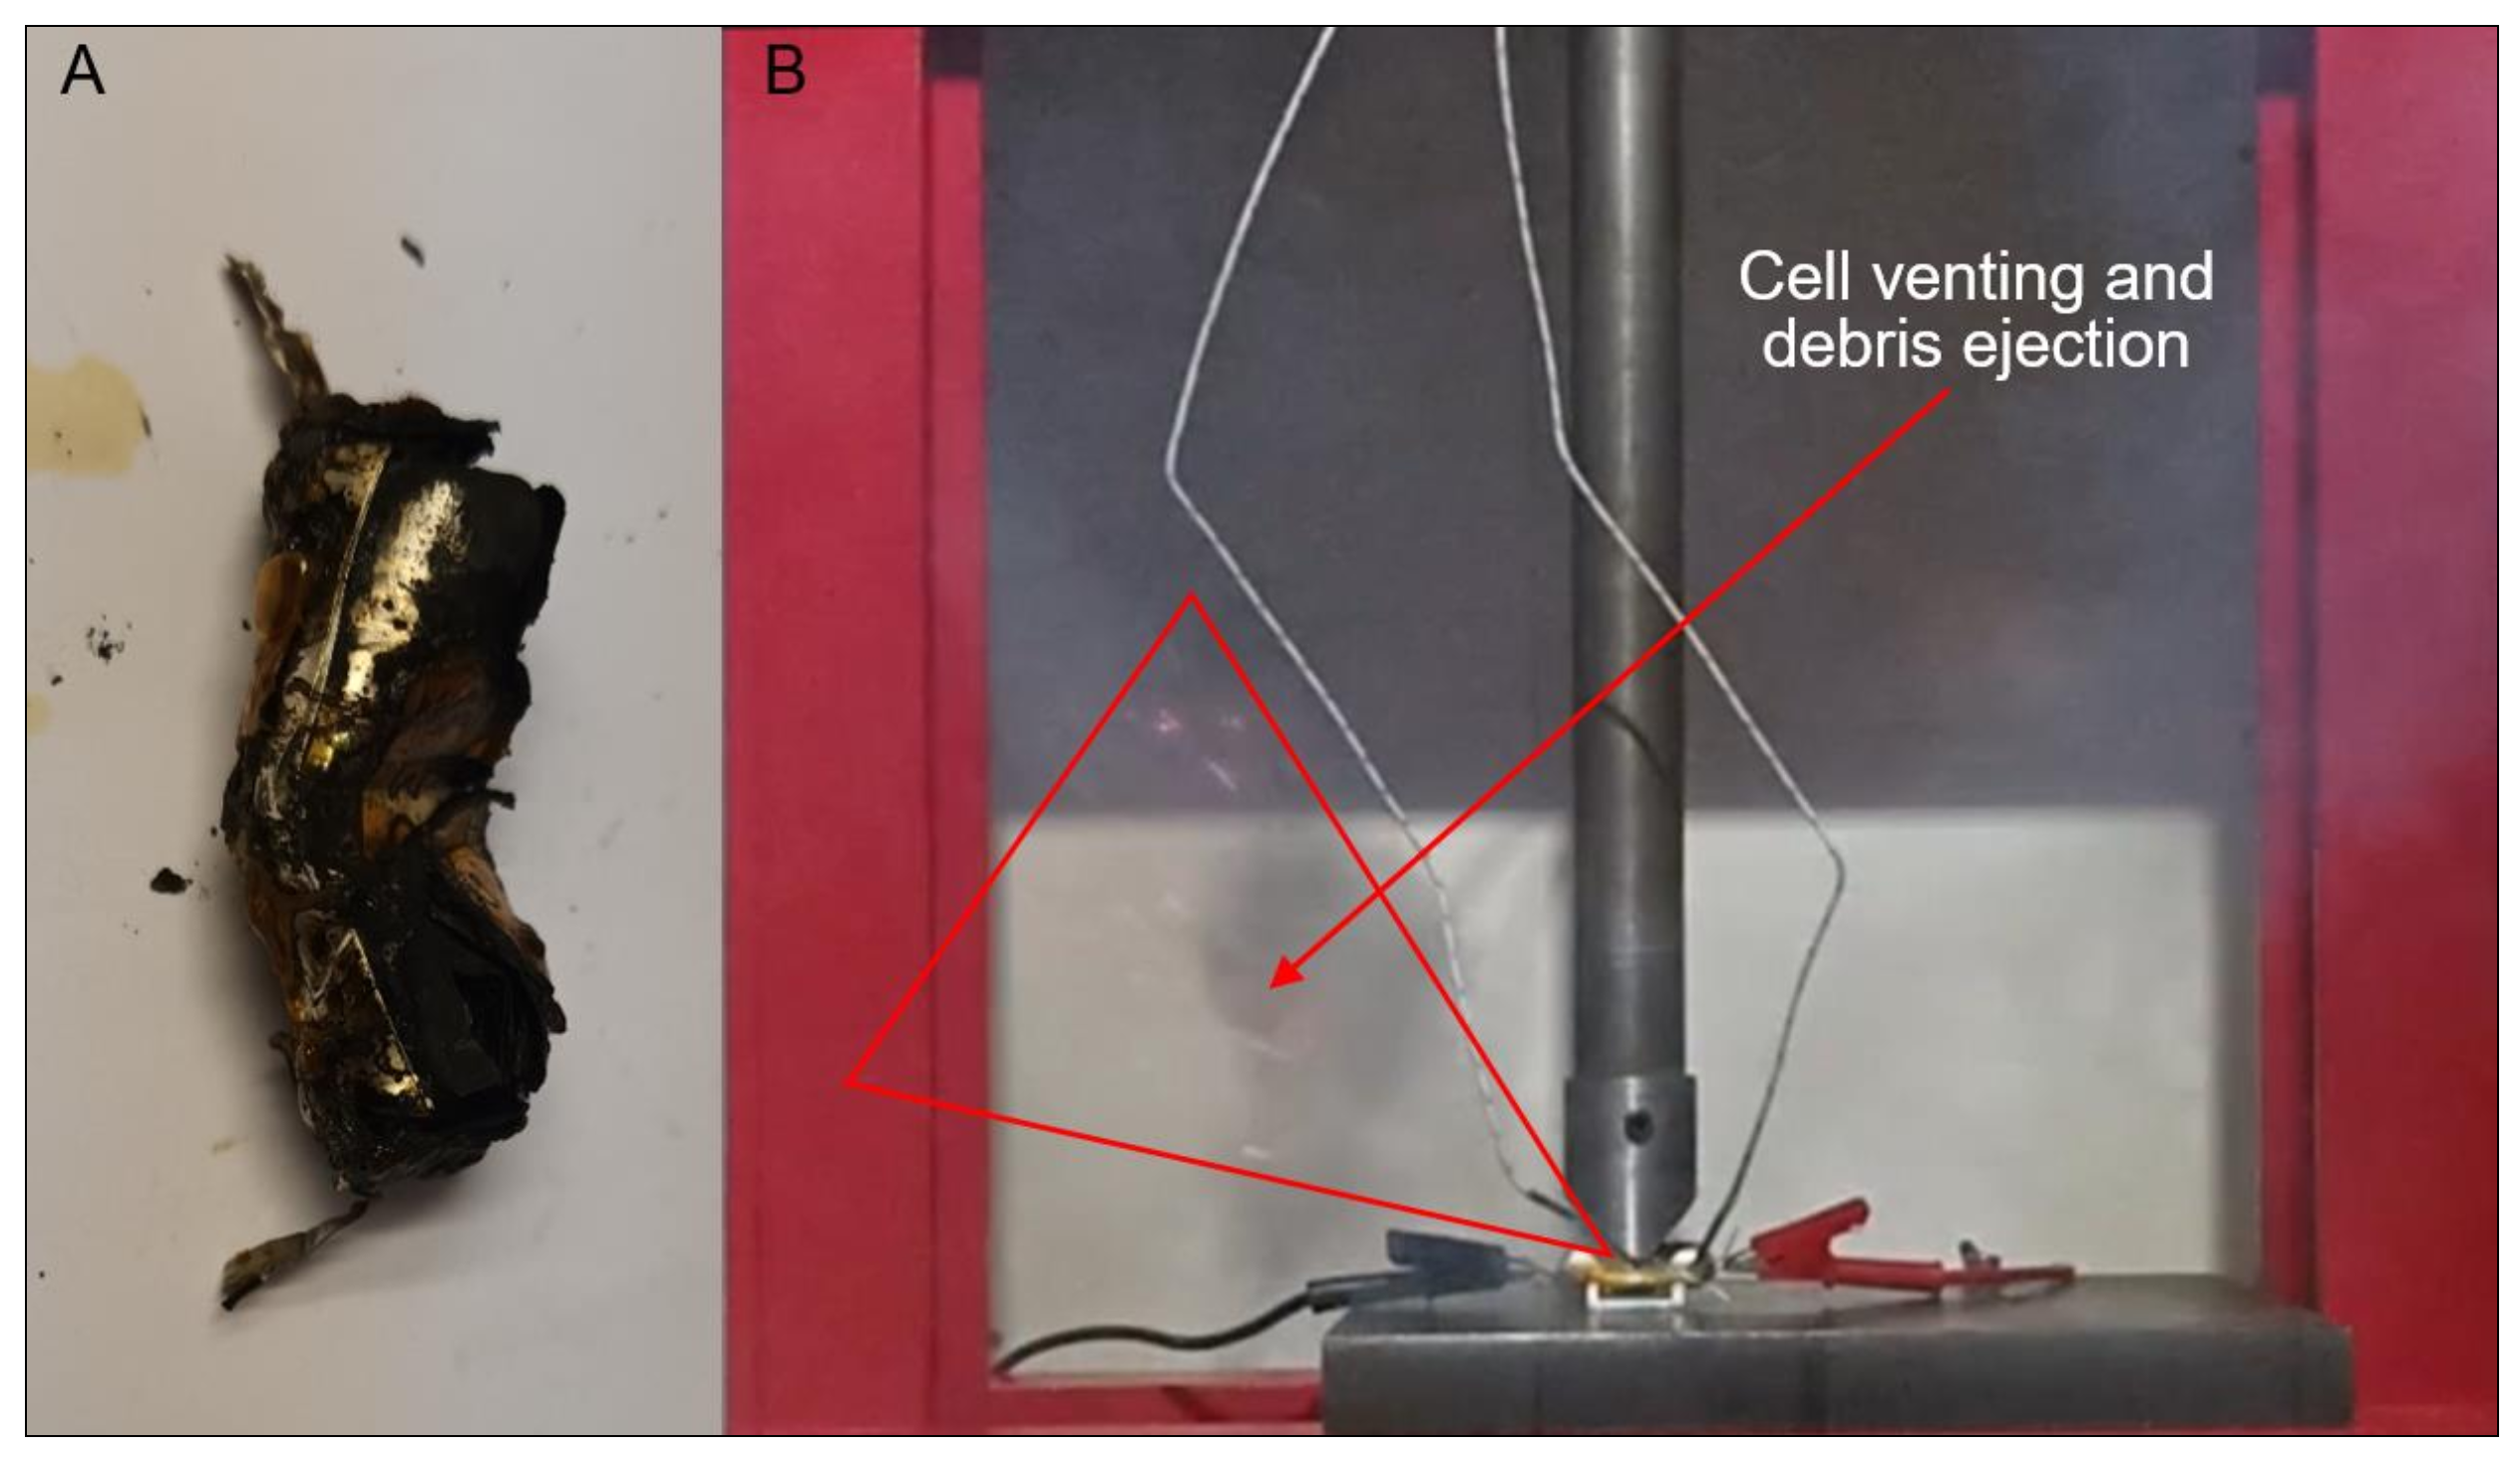
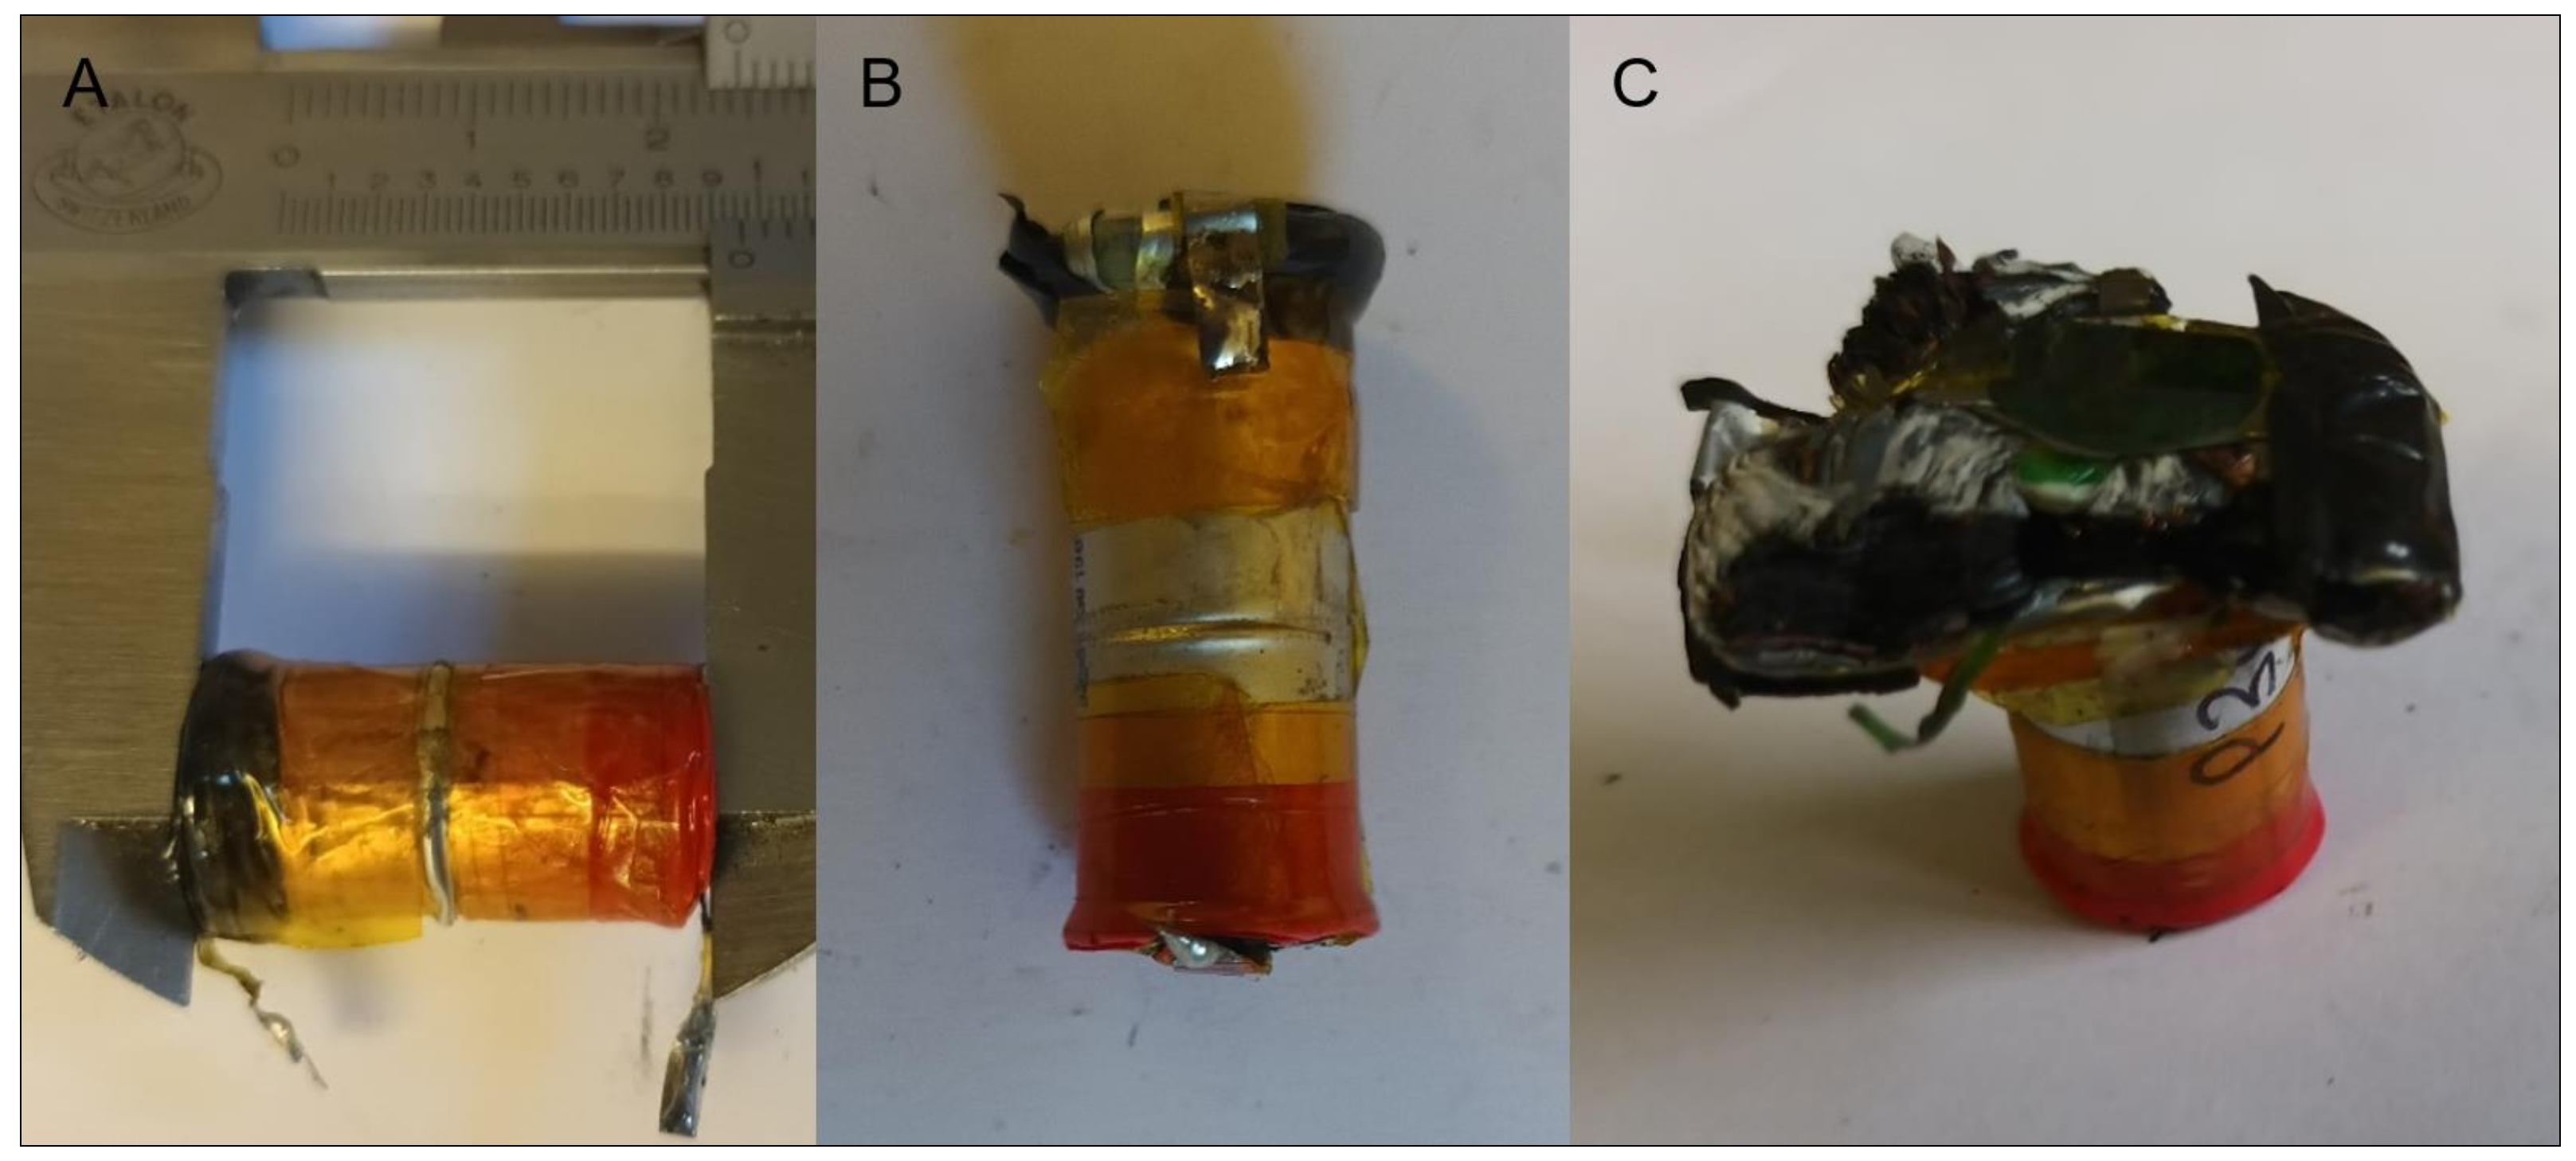
Test 30 (a 13400 cell at 100% SOC) resulted in TR, the temperature rose rapidly following the impact, and subsequent ISC with T m a x reached in <5 s. This rapid temperature rise was accompanied by more energetic gas venting due to the associated rapid expansion of gases within the cell, with venting witnessed from the point of impact. This was likely due to the high temperature weakening the cell casing, followed by the increased pressure rupturing the cell casing at the point of impact. There was no ignition of the vent gases; however, hot cell debris was seen to be ejected combined with non-flaming pyrolysis, causing significant damage to the cell, as shown in Figure 21.
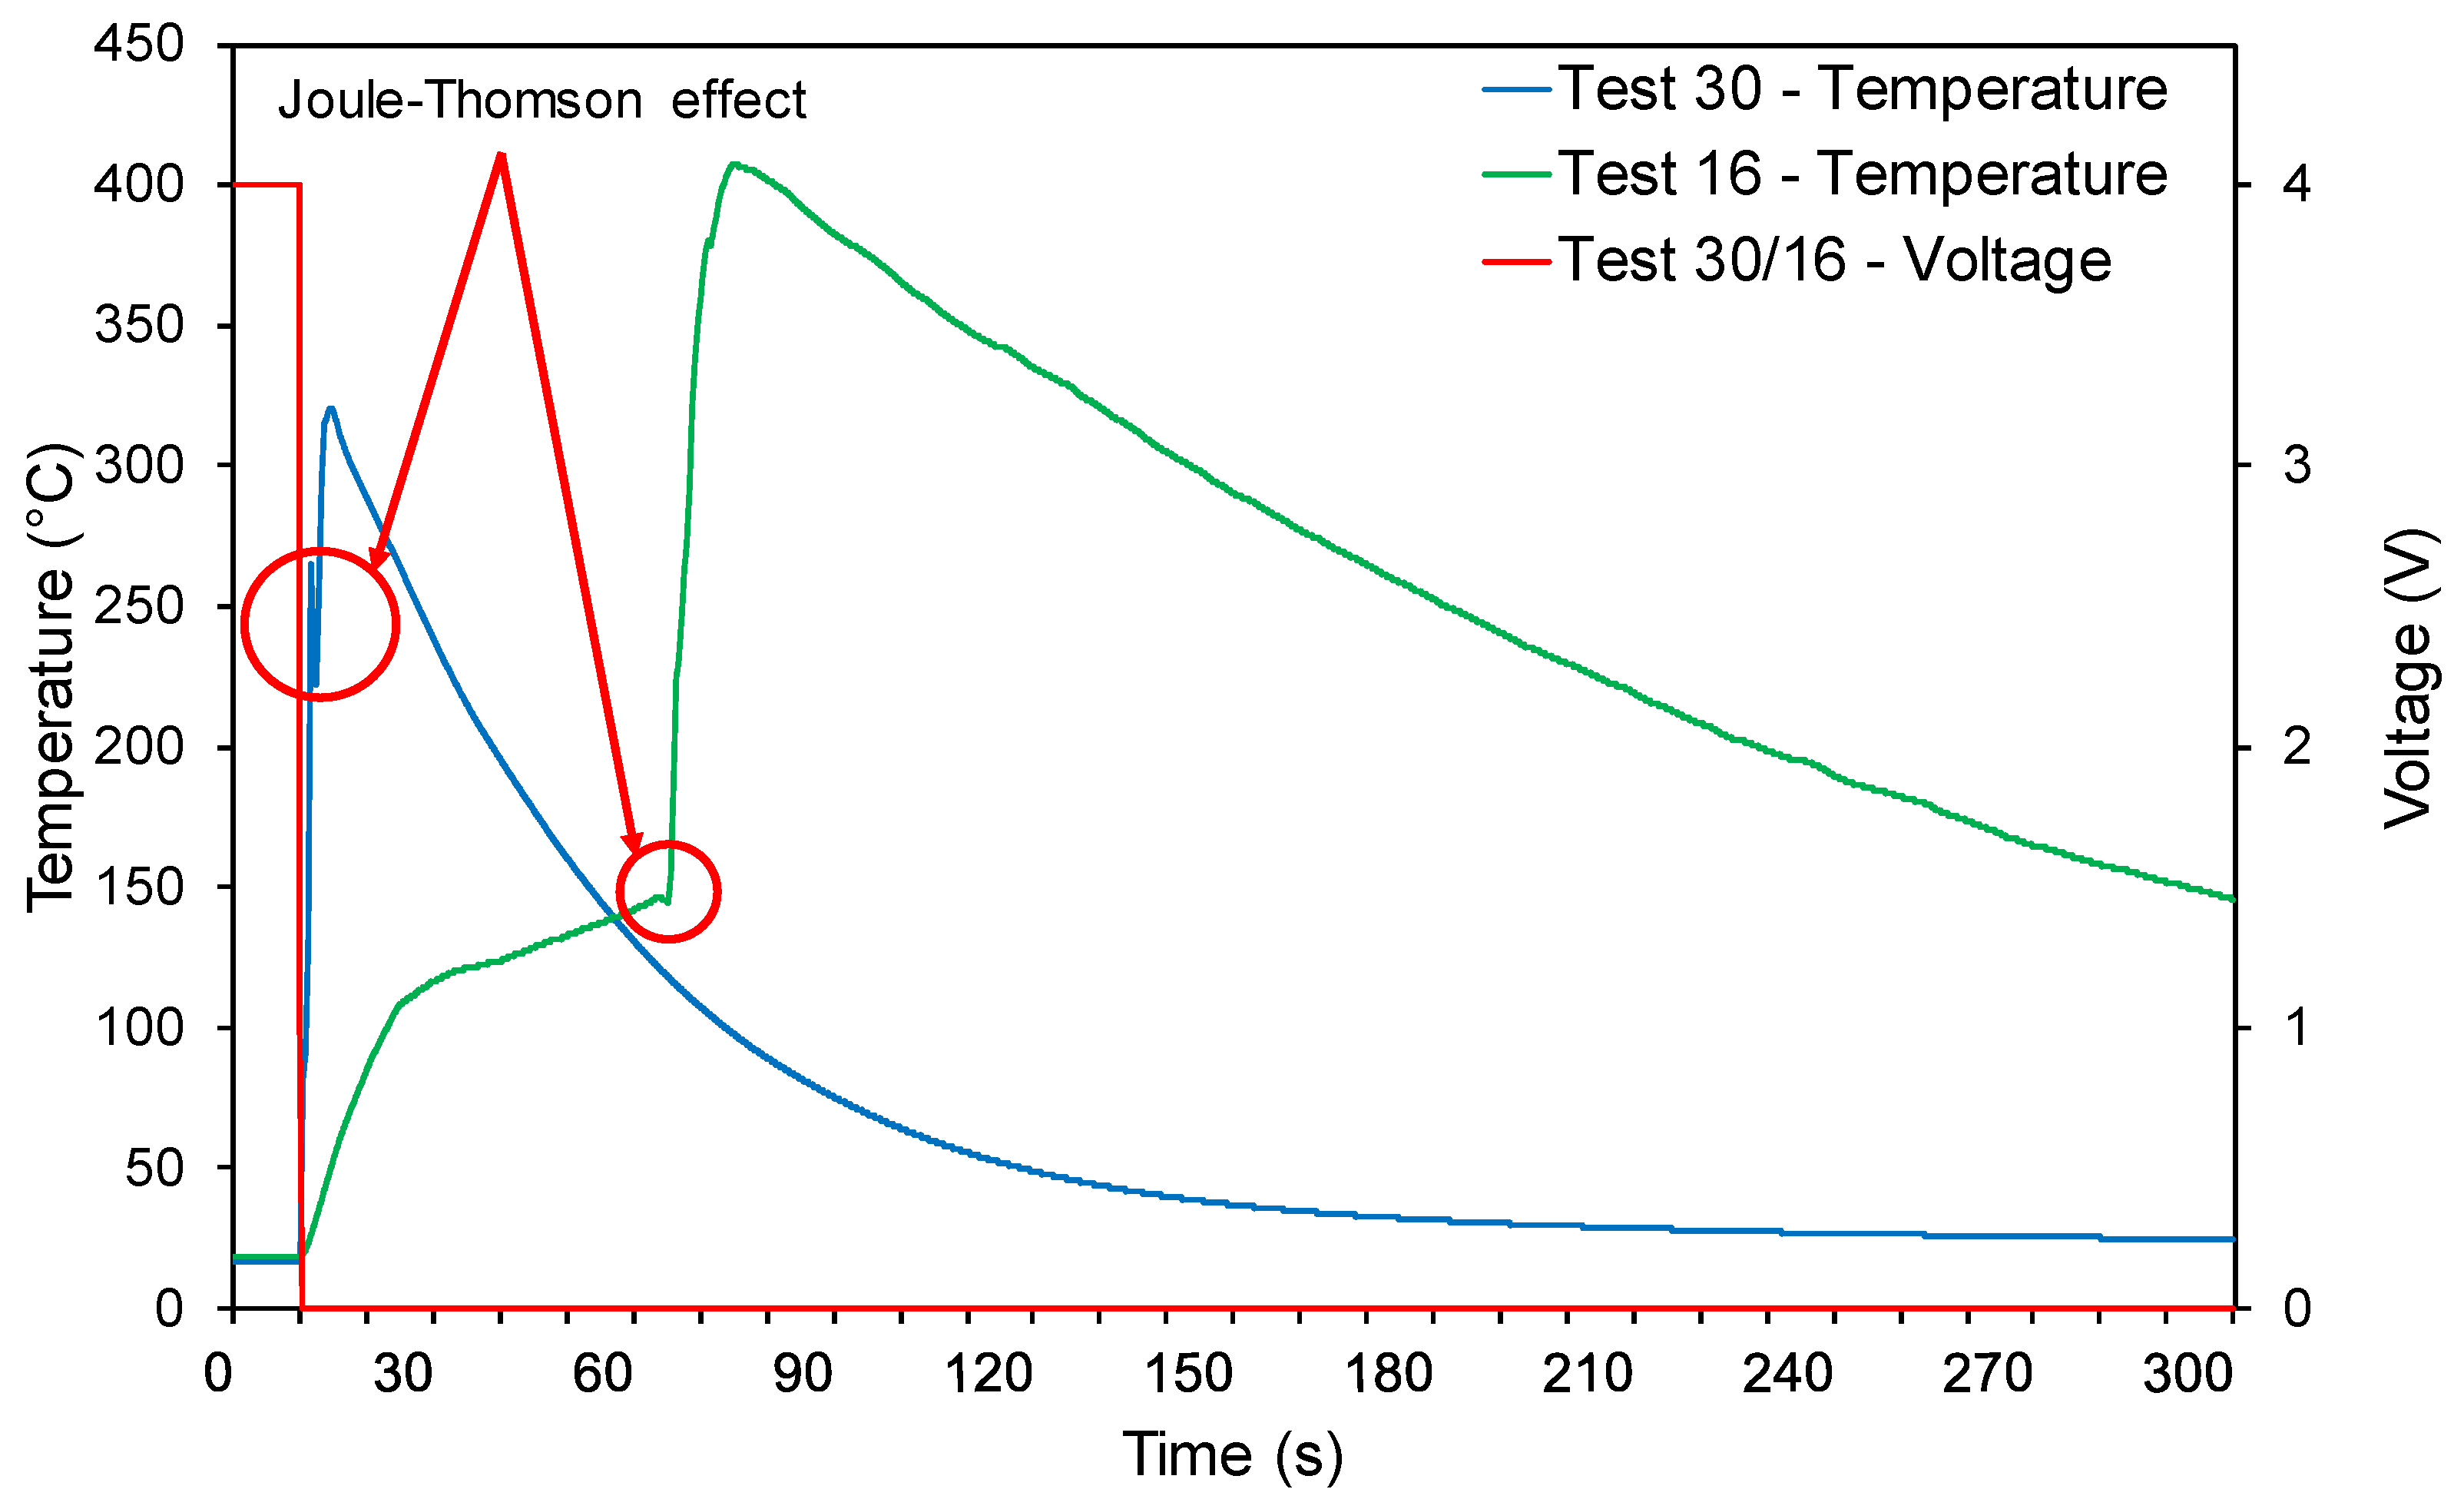
Figure 22 provides a temperature profile over time comparison between Tests 16 and 30 and the TR of 13400 cells at 100% SOC. The cell venting occurred after 2 s at 264 °C which was combined with a significant drop in the cell temperature to 222 °C (Δ42 °C) due to the vent gas expansion and resulting Joule–Thomson cooling effect (Figure 2); however, the cell temperature reduction and subsequent recovery to 264 °C, was momentary, taking just 1.3 s. The rapid transition to T m a x (<5 s) was accompanied by similar rapid cooling, with the cell remaining above 150 °C for just 42 s, likely due to the reduced cell mass following cell contents ejection and pyrolysis.

3.3.3. Crush Tests

The novel abuse test was developed to represent more closely the physical damage likely suffered by an SUV during waste and recycling material management processes. As in the previous test cases, the tests were repeated in triplicate for the 13300 and 13400 cells at 100% SOC and then 50% SOC. The last test series was labelled as Tests 37 to 48.
The malleability of the cells during the crush tests was less consistent, particularly the 13400 cells, as shown in Figure 23. The variation in cell deformation at the point of impact, including instances where the cell casing ruptured or failed, did not appear to influence the cell performance during the tests and subsequent results.
The crush tests correlated broadly with the impact tests. The cell crushing resulted in an immediate ISC witnessed by a cell voltage drop to 0 V (<1.0 V in the case of Tests 37, 39, 47, and 48). This was closely followed by a rapid temperature increase due to the generation of Joule heat within the cell, with cell venting visually confirmed within seconds and, in all cases, before T m a x .
The crush damage to the cells in Tests 37, 39, 47, and 48 resulted in an ISC and corresponding drop in cell voltage, but not immediately to <1.0 V. Whilst the slow decline in voltage did not directly impact the results from Tests 37 and 39 (13300 cells at 100% SOC), there was a significant extension in time to T m a x witnessed in Tests 47 and 48 (13400 cells at 50% SOC), with Test 47 taking 57 s and Test 48 taking 146 s. The slow and erratic decline in cell voltage and longer duration to T m a x suggests that the cells are more resilient to axial forces and structural deformation of the casing, cathode, and anode construction in some circumstances, which may be linked to the wide variation in cell manufacturers.
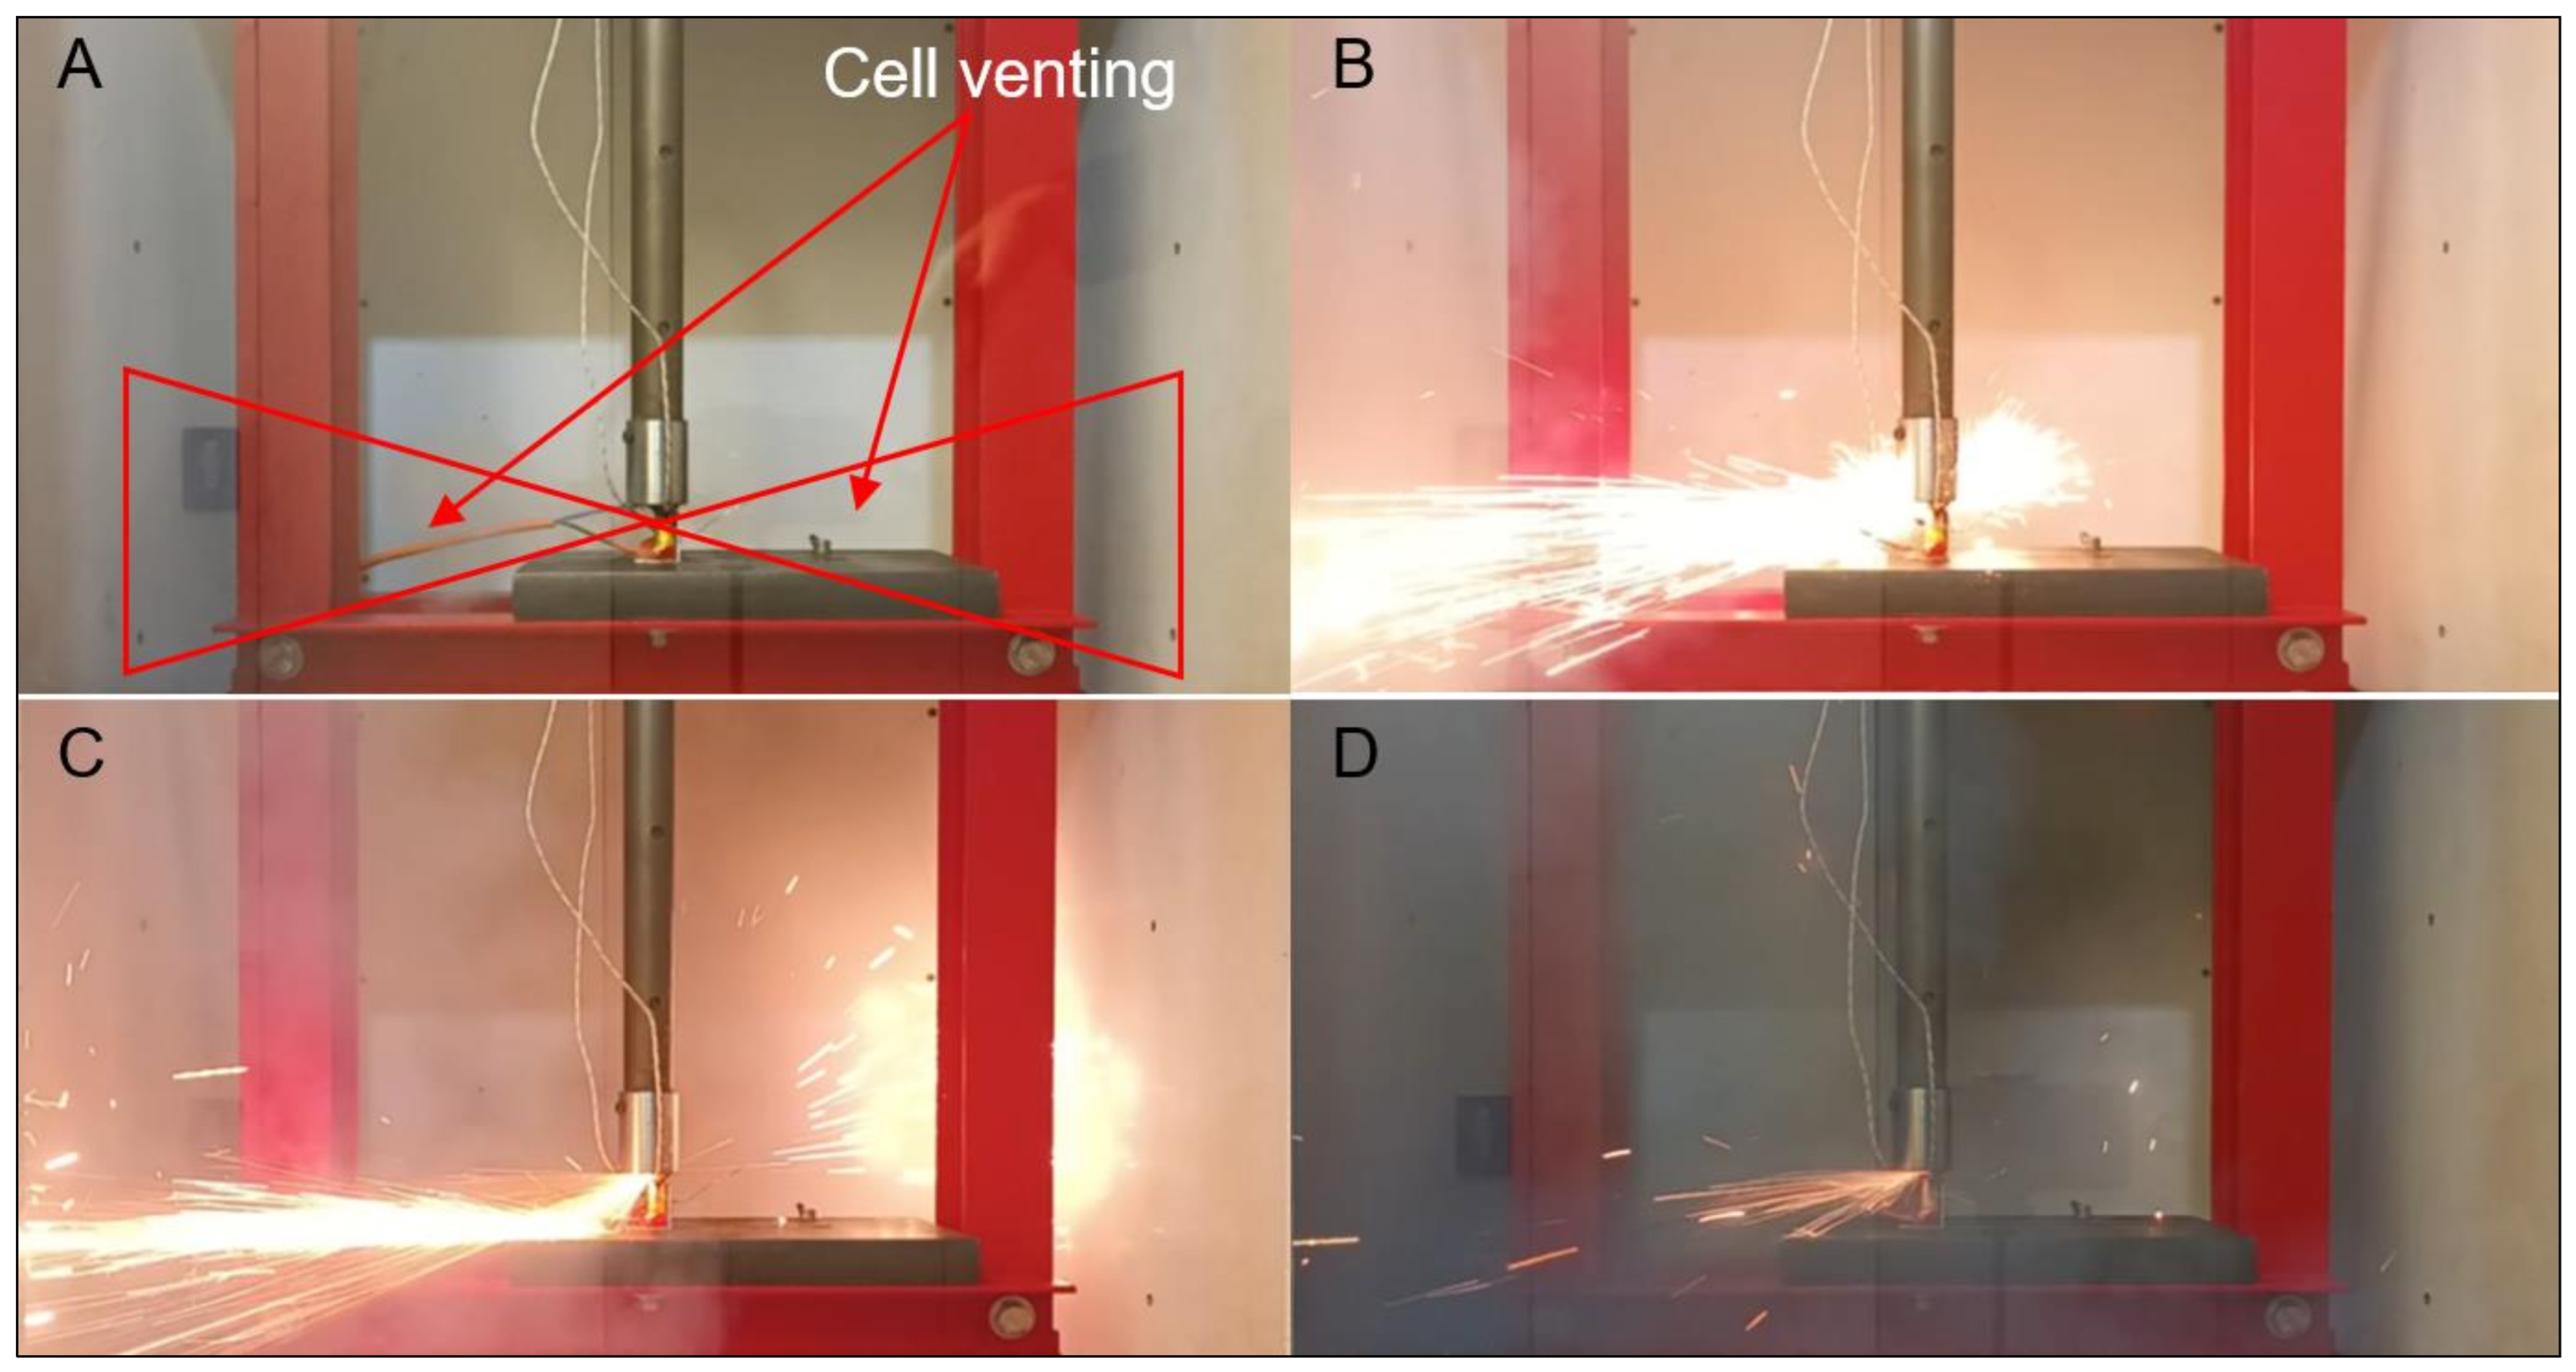
Test 42 (a 13400 cell at 100% SOC) resulted in TR, with the progress of the reaction captured from stills of the high-speed video shown in Figure 24. The temperature rose rapidly following the impact and subsequent ISC, with T m a x reached in 8 s. This rapid temperature rise was associated with violent gas venting from the top of the cell, accompanied by a momentary drop in T 2 temperature of ~10 °C at <3 s due to the vent gas expansion and the resulting Joule–Thomson cooling effect; however, the cell temperature recovery took only 500 ms.
Whilst there was no ignition of the vent gases, as the gas concentration did not reach the LFL [5,11], this was immediately followed by the ejection of sparks and incandescent material, with the material deflected horizontally in all directions by the flat mandrel. This was combined with non-flaming pyrolysis, causing significant damage to the cell structure; however, the ejection of sparks and incandescent cell matter are not considered flaming combustion [8].
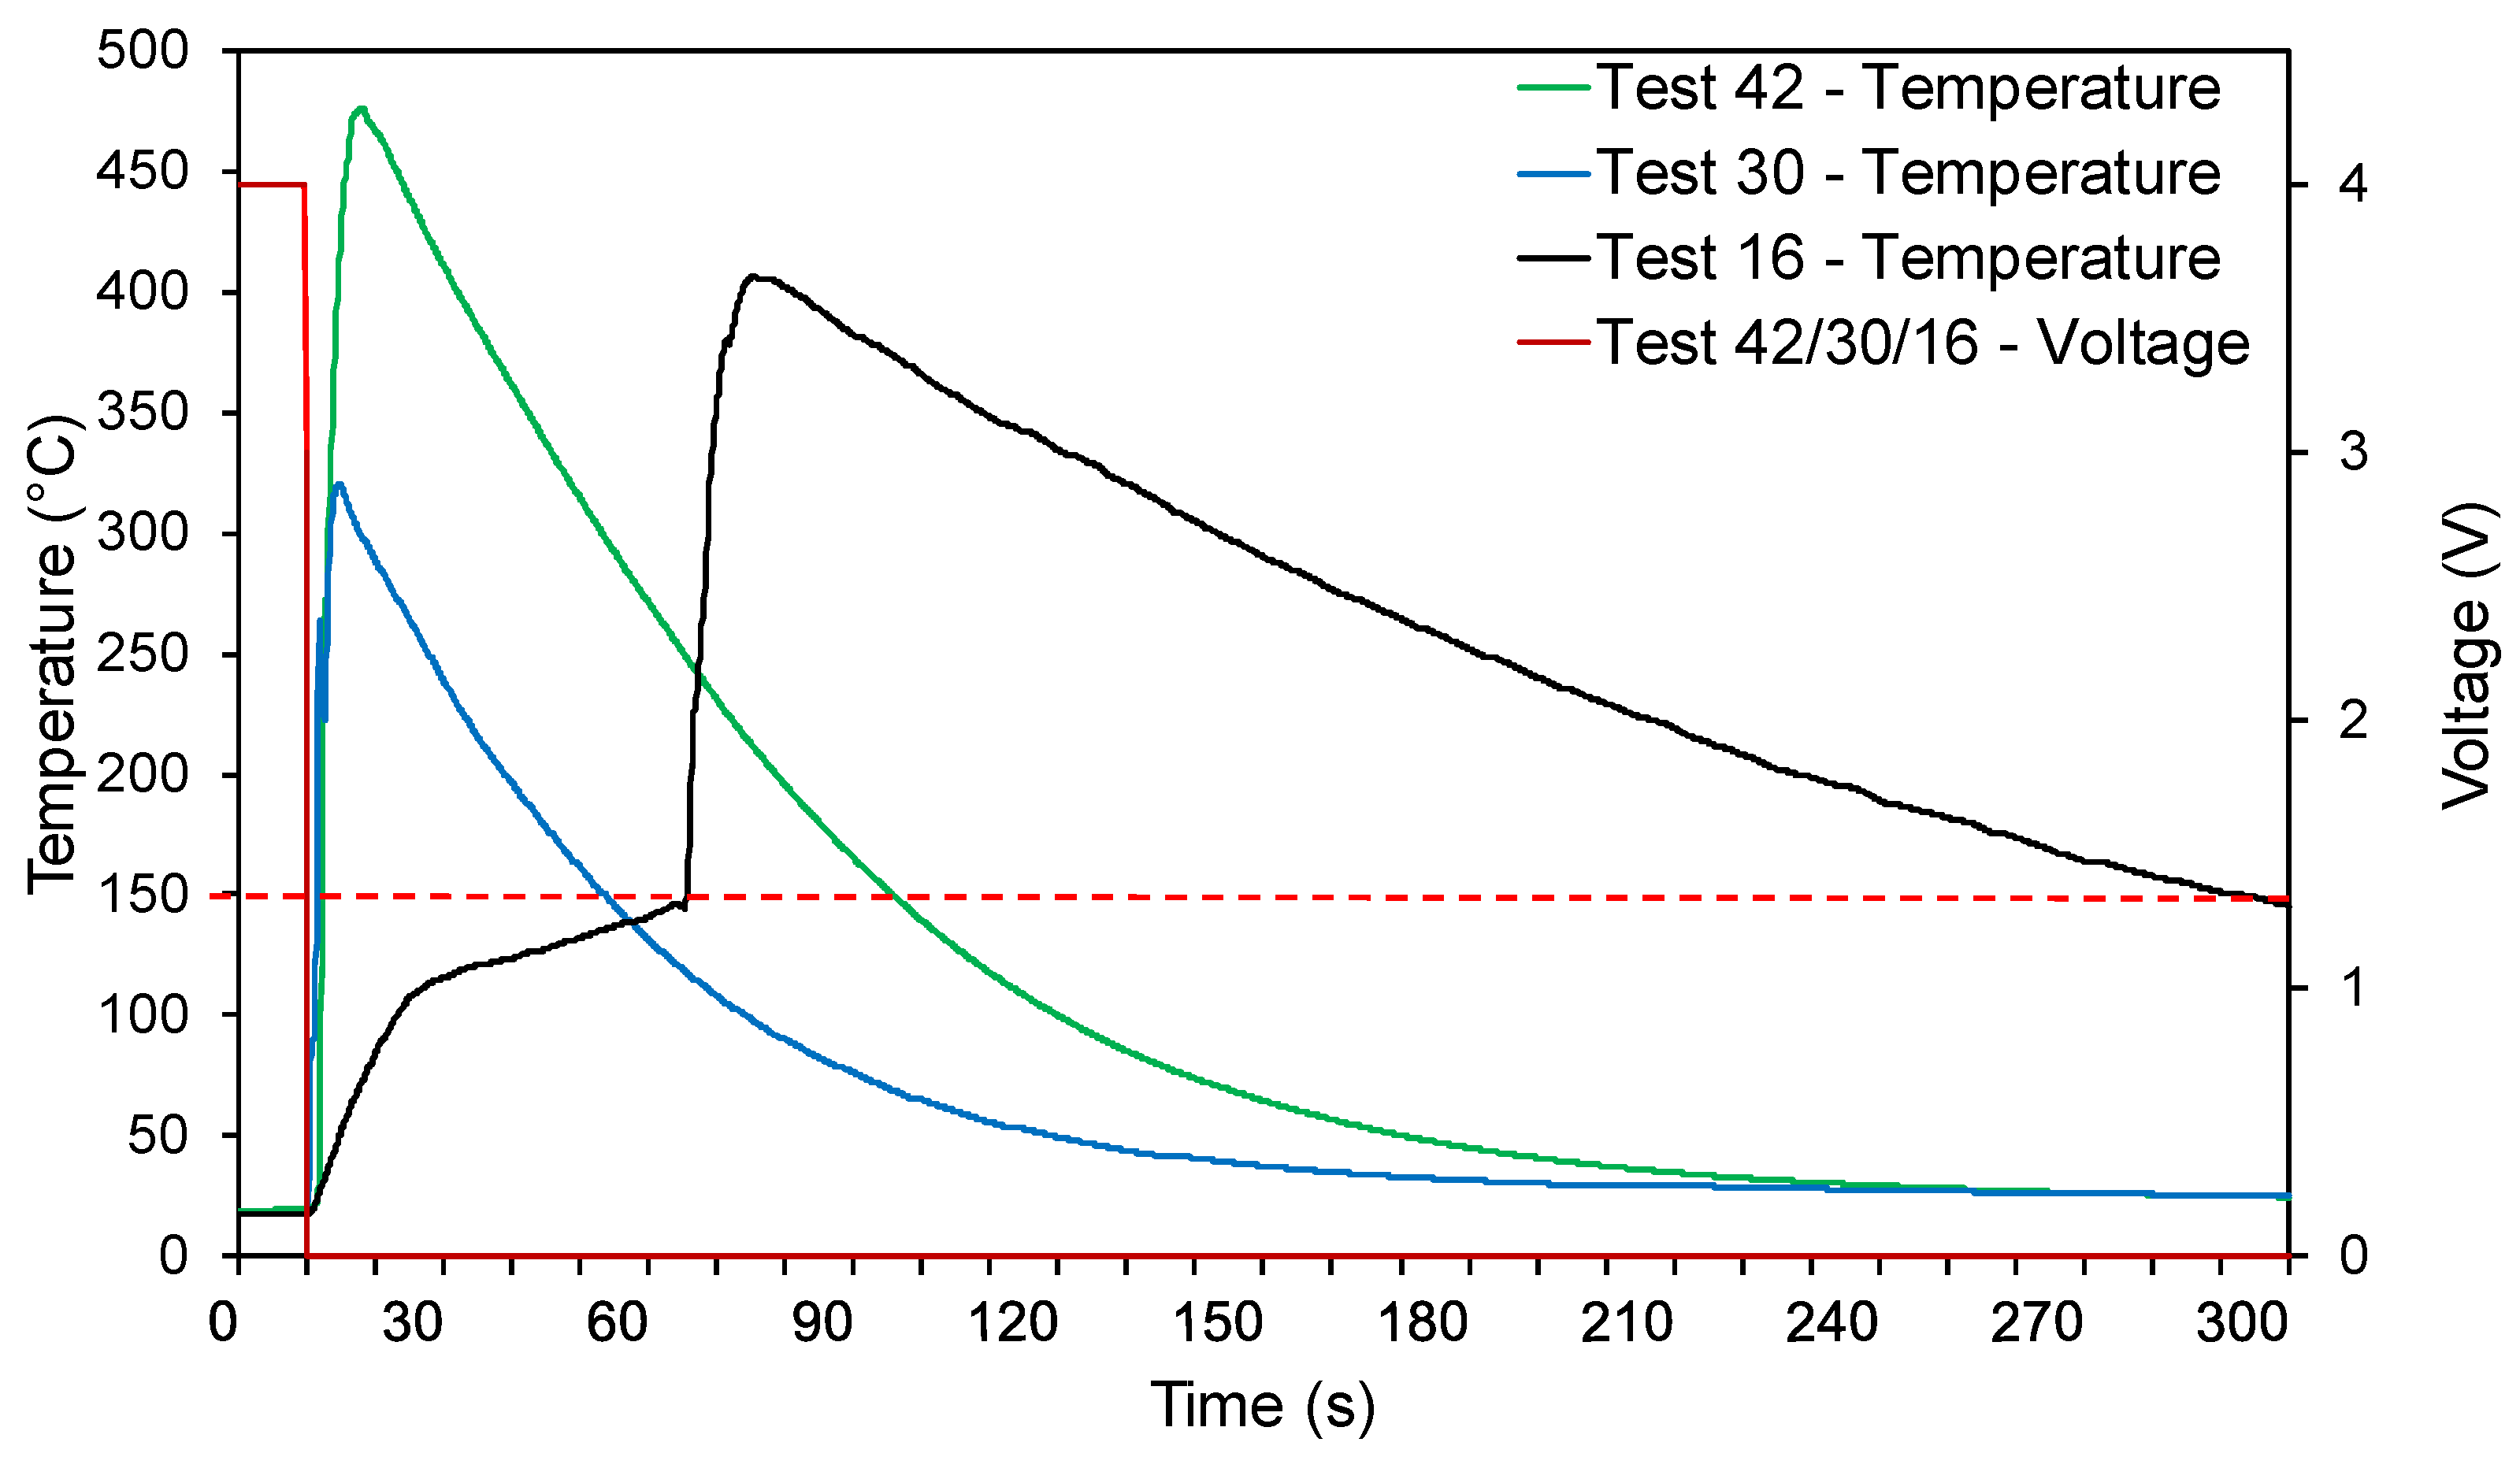
The rapid transition to T m a x mirrored Test 30 and the accompanying rapid cooling, with Figure 25 providing a comparative temperature profile over time of Tests 42, 30, and 16. The cell venting and debris ejection lasted <1 s, with post-test inspection of the flat mandrel identifying no evidence of the conductive mandrel forming a short-circuit across the cathode and anode jellyroll, suggesting the creation of an ISC due to the deformation of the cell structure.
Despite the violent TR and hot cell debris ejection, the cell temperature remained above 150 °C for 89 s (Figure 25), which suggests that the cell retained greater mass than the cell in Test 30. This is reflective of inconsistencies in cell failure modes [11] and may result from the flat mandrel obstructing and limiting the volume of cell contents ejected, with the retention of the cell mass also linked to the higher T m a x of 477 °C.

4. Conclusions

This research aimed to determine the potential for SUVs to ignite waste and recycling materials by subjecting their Li-ion cells to industry-standard and novel abuse tests. The tests were conducted on cells at 50% SOC, representing used SUVs, and 100% SOC for comparative assessment.
Despite variations in cell manufacturers, the results showed similar failure behaviours. The novel mechanical abuse tests created internal short circuits in the cells, generating significantly higher temperatures than the short-circuit test required for product safety. This demonstrates that even safe products can produce unsafe temperatures when discarded and subjected to mechanical damage during waste management processes.
However, temperature alone does not define the ability to transfer heat and ignite adjacent materials. Cells at 50% SOC reached a maximum temperature of 131 °C, below the ignition temperature of common waste materials. The high temperatures were short-lived and had limited energy to transfer heat to surroundings.
Mechanical abuse tests on 13400 cells at 100% SOC induced internal short circuit, resulting in thermal runaway on three occasions, with violent reactions during novel abuse tests. However, thermal runaway did not lead to ignition or flaming combustion. Despite higher temperatures (maximum 477 °C), the short-lived thermal profile of the 13400 cell at 100% SOC provided limited potential for establishing a competent ignition source. The occurrence of thermal runaway in these higher-capacity cells raises questions about their use in SUVs.
In conclusion, Li-ion cells in used SUVs at ≤50% SOC cannot generate sufficient heat and temperature to ignite common waste materials.

Author Contributions

Conceptualization, A.G.; methodology, A.G. and B.C.C.; software, A.G. and B.C.C.; validation, A.G.; formal analysis, A.G.; investigation, A.G.; resources, A.G. and B.C.C.; data curation, A.G.; writing—original draft preparation, A.G.; writing—review and editing, B.C.C.; visualization, A.G. and B.C.C.; supervision, B.C.C.; project administration, B.C.C. All authors have read and agreed to the published version of the manuscript.

Funding

This research received no external funding.

Data Availability Statement

The raw data supporting the conclusions of this article will be made available by the authors on request.

Acknowledgments

The first author would like to thank Scott Butler, Chris Jones, and John Reynolds, who have all freely given their time, adding industry depth and context to their subject matter knowledge.

Conflicts of Interest

The authors declare no conflicts of interest.

Abbreviations

The following abbreviations are used in this manuscript:
CCell Rated Capacity
CCConstant Current
CVConstant Voltage
CIDCurrent Interruption Device
DODDepth of Discharge
FPSFrame Per Second
ISCInternal Short-Circuit
LFLLower Flammable Limit
LiPoLithium Polymer
OCVOpen Circuit Voltage
PTCPositive Temperature Coefficient
SOCState of Charge
SUVSingle Use Vape
TRThermal Runaway

References

  1. Brown, M.; Hilton, M.; Horton, I.; Hickman, M.; Mason, R.; Brown, A. Cutting Lithium-Ion Battery Fires in the Waste Industry; Technical Report; Environmental Services Association: London, UK, 2021. [Google Scholar]
  2. Nigl, T.; Rübenbauer, W.; Pomberger, R. Cause-oriented investigation of the fire incidents in Austrian waste management systems. Detritus 2019, 9, 213–220. [Google Scholar] [CrossRef]
  3. Anta, M.; Herreras, L.; Ollion, L. Characterisation of Fires Caused by Batteries in WEEE: Survey Results from the WEEE Management Chain-Part A; Technical report; WEEE Forum: Schaerbeek, Belgium, 2020. [Google Scholar]
  4. Material Focus. Number of Disposable Single-Use Vapes Thrown away Have in a Year Quadrupled to 5 Million per Week; Material Focus: London, UK, 2023. [Google Scholar]
  5. Lisbona, D.; Snee, T. A review of hazards associated with primary lithium and lithium-ion batteries. Process Saf. Environ. Prot. 2011, 89, 434–442. [Google Scholar] [CrossRef]
  6. Larsson, F.; Andersson, P.; Blomqvist, P.; Mellander, B.E. Toxic fluoride gas emissions from lithium-ion battery fires. Sci. Rep. 2017, 7, 10018. [Google Scholar] [CrossRef] [PubMed]
  7. Wang, Q.; Ping, P.; Zhao, X.; Chu, G.; Sun, J.; Chen, C. Thermal runaway caused fire and explosion of lithium ion battery. J. Power Sources 2012, 208, 210–224. [Google Scholar] [CrossRef]
  8. SAE International. Electric and Hybrid Electric Vehicle Rechargeable Energy Storage System (RESS) Safety and Abuse Testing; Technical Report SAE J2464; SAE International: Warrendale, PA, USA, 2021. [Google Scholar]
  9. Bubbico, R.; Greco, V.; Menale, C. Hazardous scenarios identification for Li-ion secondary batteries. Saf. Sci. 2018, 108, 72–88. [Google Scholar] [CrossRef]
  10. Nigl, T.; Baldauf, M.; Hohenberger, M.; Pomberger, R. Lithium-Ion batteries as ignition sources in waste treatment processes: A semi-quantitate risk analysis and assessment of battery-caused waste fires. Processes 2020, 9, 49. [Google Scholar] [CrossRef]
  11. Abbott, K.C.; Buston, J.E.H.; Gill, J.; Goddard, S.L.; Howard, D.; Howard, G.E.; Read, E.; Williams, R.C.E. Experimental study of three commercially available 18650 lithium ion batteries using multiple abuse methods. J. Energy Storage 2023, 65, 107293. [Google Scholar] [CrossRef]
  12. An, Z.; Li, W.; Du, X.; Jia, L.; Li, Q.; Zhang, D. Experimental study on behaviors of lithium-ion cells experiencing internal short circuit and thermal runaway under nail penetration abuse condition. Appl. Therm. Eng. 2024, 247, 123058. [Google Scholar] [CrossRef]
  13. Diekmann, J.; Doose, S.; Weber, S.; Münch, S.; Haselrieder, W.; Kwade, A. Development of a new procedure for nail penetration of lithium-ion cells to obtain meaningful and reproducible results. J. Electrochem. Soc. 2020, 167, 090504. [Google Scholar] [CrossRef]
  14. Mao, B.; Chen, H.; Cui, Z.; Wu, T.; Wang, Q. Failure mechanism of the lithium ion battery during nail penetration. Int. J. Heat Mass Transf. 2018, 122, 1103–1115. [Google Scholar] [CrossRef]
  15. Shelke, A.V.; Buston, J.E.H.; Gill, J.; Howard, D.; Abbott, K.C.; Goddard, S.L.; Read, E.; Howard, G.E.; Abaza, A.; Cooper, B.; et al. Characterizing and predicting 21700 NMC lithium-ion battery thermal runaway induced by nail penetration. Appl. Therm. Eng. 2022, 209, 118278. [Google Scholar] [CrossRef]
  16. An, Z.; Shi, T.; Du, X.; An, X.; Zhang, D.; Bai, J. Experimental study on the internal short circuit and failure mechanism of lithium-ion batteries under mechanical abuse conditions. J. Energy Storage 2024, 89, 111819. [Google Scholar] [CrossRef]
  17. Chen, W.C.; De Li, J.; Shu, C.M.; Wang, Y.W. Effects of thermal hazard on 18650 lithium-ion battery under different states of charge. J. Therm. Anal. Calorim. 2015, 121, 525–531. [Google Scholar] [CrossRef]
  18. Lai, Y.W.; Chi, K.H.; Chung, Y.H. Thermal runaway characteristics of 18650 lithium-ion batteries in various states of charge. J. Therm. Anal. Calorim. 2024, 1–10. [Google Scholar] [CrossRef]
  19. Willstrand, O.; Pushp, M.; Andersson, P.; Brandell, D. Impact of different Li-ion cell test conditions on thermal runaway characteristics and gas release measurements. J. Energy Storage 2023, 68, 107785. [Google Scholar] [CrossRef]
  20. Quintiere, J.G. On a method to mitigate thermal runaway and propagation in packages of lithium ion batteries. Fire Saf. J. 2022, 130, 103573. [Google Scholar] [CrossRef]
  21. Wang, Q.; Mao, B.; Stoliarov, S.I.; Sun, J. A review of lithium ion battery failure mechanisms and fire prevention strategies. Prog. Energy Combust. Sci. 2019, 73, 95–131. [Google Scholar] [CrossRef]
  22. Juan, W.Y.; Wu, C.L.; Liu, F.W.; Chen, W.S. Fires in Waste Treatment Facilities: Challenges and Solutions from a Fire Investigation Perspective. Sustainability 2023, 15, 9756. [Google Scholar] [CrossRef]
  23. BS EN 62133-2:2017+A1:2021; Secondary Cells and Batteries Containing Alkaline or Other Non-Acid Electrolytes. Safety Requirements for Portable Sealed Secondary Cells, and for Batteries Made from Them, for Use in Portable Applications—Lithium Systems. British Standards Institution: London, UK, 2021.
  24. Zou, K.; Jiang, M.; Ning, T.; Tan, L.; Zheng, J.; Wang, J.; Ji, X.; Li, L. Thermodynamics-directed bulk/grain-boundary engineering for superior electrochemical durability of Ni-rich cathode. J. Energy Chem. 2024, 97, 321–331. [Google Scholar] [CrossRef]
  25. Bugryniec, P.J.; Resendiz, E.G.; Nwophoke, S.M.; Khanna, S.; James, C.; Brown, S.F. Review of gas emissions from lithium-ion battery thermal runaway failure—Considering toxic and flammable compounds. J. Energy Storage 2024, 87, 111288. [Google Scholar] [CrossRef]
  26. Xu, C.; Fan, Z.; Zhang, M.; Wang, P.; Wang, H.; Jin, C.; Peng, Y.; Jiang, F.; Feng, X.; Ouyang, M. A comparative study of the venting gas of lithium-ion batteries during thermal runaway triggered by various methods. Cell Rep. Phys. Sci. 2023, 4, 101705. [Google Scholar] [CrossRef]
  27. Christensen, P.; Mrozik, W.; Weaving, J. Improving the Safety of Lithium-Ion Battery Cells; Technical report; The Faraday Institution: Cambridge, UK, 2023. [Google Scholar]
  28. Mikolajczak, C.; Kahn, M.; White, K.; Long, R.T. Lithium-Ion Batteries Hazard and Use Assessment; Springer: New York, NY, USA, 2011. [Google Scholar] [CrossRef]
  29. Zhang, M.; Du, J.; Liu, L.; Stefanopoulou, A.; Siegel, J.; Lu, L.; He, X.; Xie, X. Internal Short Circuit Trigger Method for Lithium-Ion Battery Based on Shape Memory Alloy. J. Electrochem. Soc. 2017, 164, A326–A333. [Google Scholar] [CrossRef]
  30. Radaš, I.; Pilat, N.; Gnjatović, D.; Šunde, V.; Ban, Ž. Estimating the state of charge of lithium-ion batteries based on the transfer function of the voltage response to the current pulse. Energies 2022, 15, 6495. [Google Scholar] [CrossRef]
  31. Ng, K.S.; Moo, C.S.; Chen, Y.P.; Hsieh, Y.C. Enhanced coulomb counting method for estimating state-of-charge and state-of-health of lithium-ion batteries. Appl. Energy 2009, 86, 1506–1511. [Google Scholar] [CrossRef]
  32. Nigl, T.; Back, T.; Stuhlpfarrer, S.; Pomberger, R. The fire risk of portable batteries in their end-of-life: Investigation of the state of charge of waste lithium-ion batteries in Austria. Waste Manag. Res. J. A Sustain. Circ. Econ. 2021, 39, 0734242X2110106. [Google Scholar] [CrossRef]
  33. Pistoia, G. (Ed.) Electric and Hybrid Vehicles; Elsevier Science: London, UK, 2010. [Google Scholar] [CrossRef]
  34. Deng, J.; Yang, X.; Zhang, G. Simulation study on internal short circuit of lithium ion battery caused by lithium dendrite. Mater. Today Commun. 2022, 31, 103570. [Google Scholar] [CrossRef]
  35. Buston, J.; Goddard, S.; Howard, G. Testing of Vape Batteries The Development and Review of Tests for Assessing the Safety of 18650 Batteries for Vaping; Technical Report; Office for Product Safety and Standards: Birmingham, UK, 2023. [Google Scholar]
  36. Xu, B.; Lee, J.; Kwon, D.; Kong, L.; Pecht, M. Mitigation strategies for li-ion battery thermal runaway: A review. Renew. Sustain. Energy Rev. 2021, 150, 111437. [Google Scholar] [CrossRef]
  37. Bandhauer, T.M.; Garimella, S.; Fuller, T.F. A Critical Review of Thermal Issues in Lithium-Ion Batteries. J. Electrochem. Soc. 2011, 158, R1. [Google Scholar] [CrossRef]
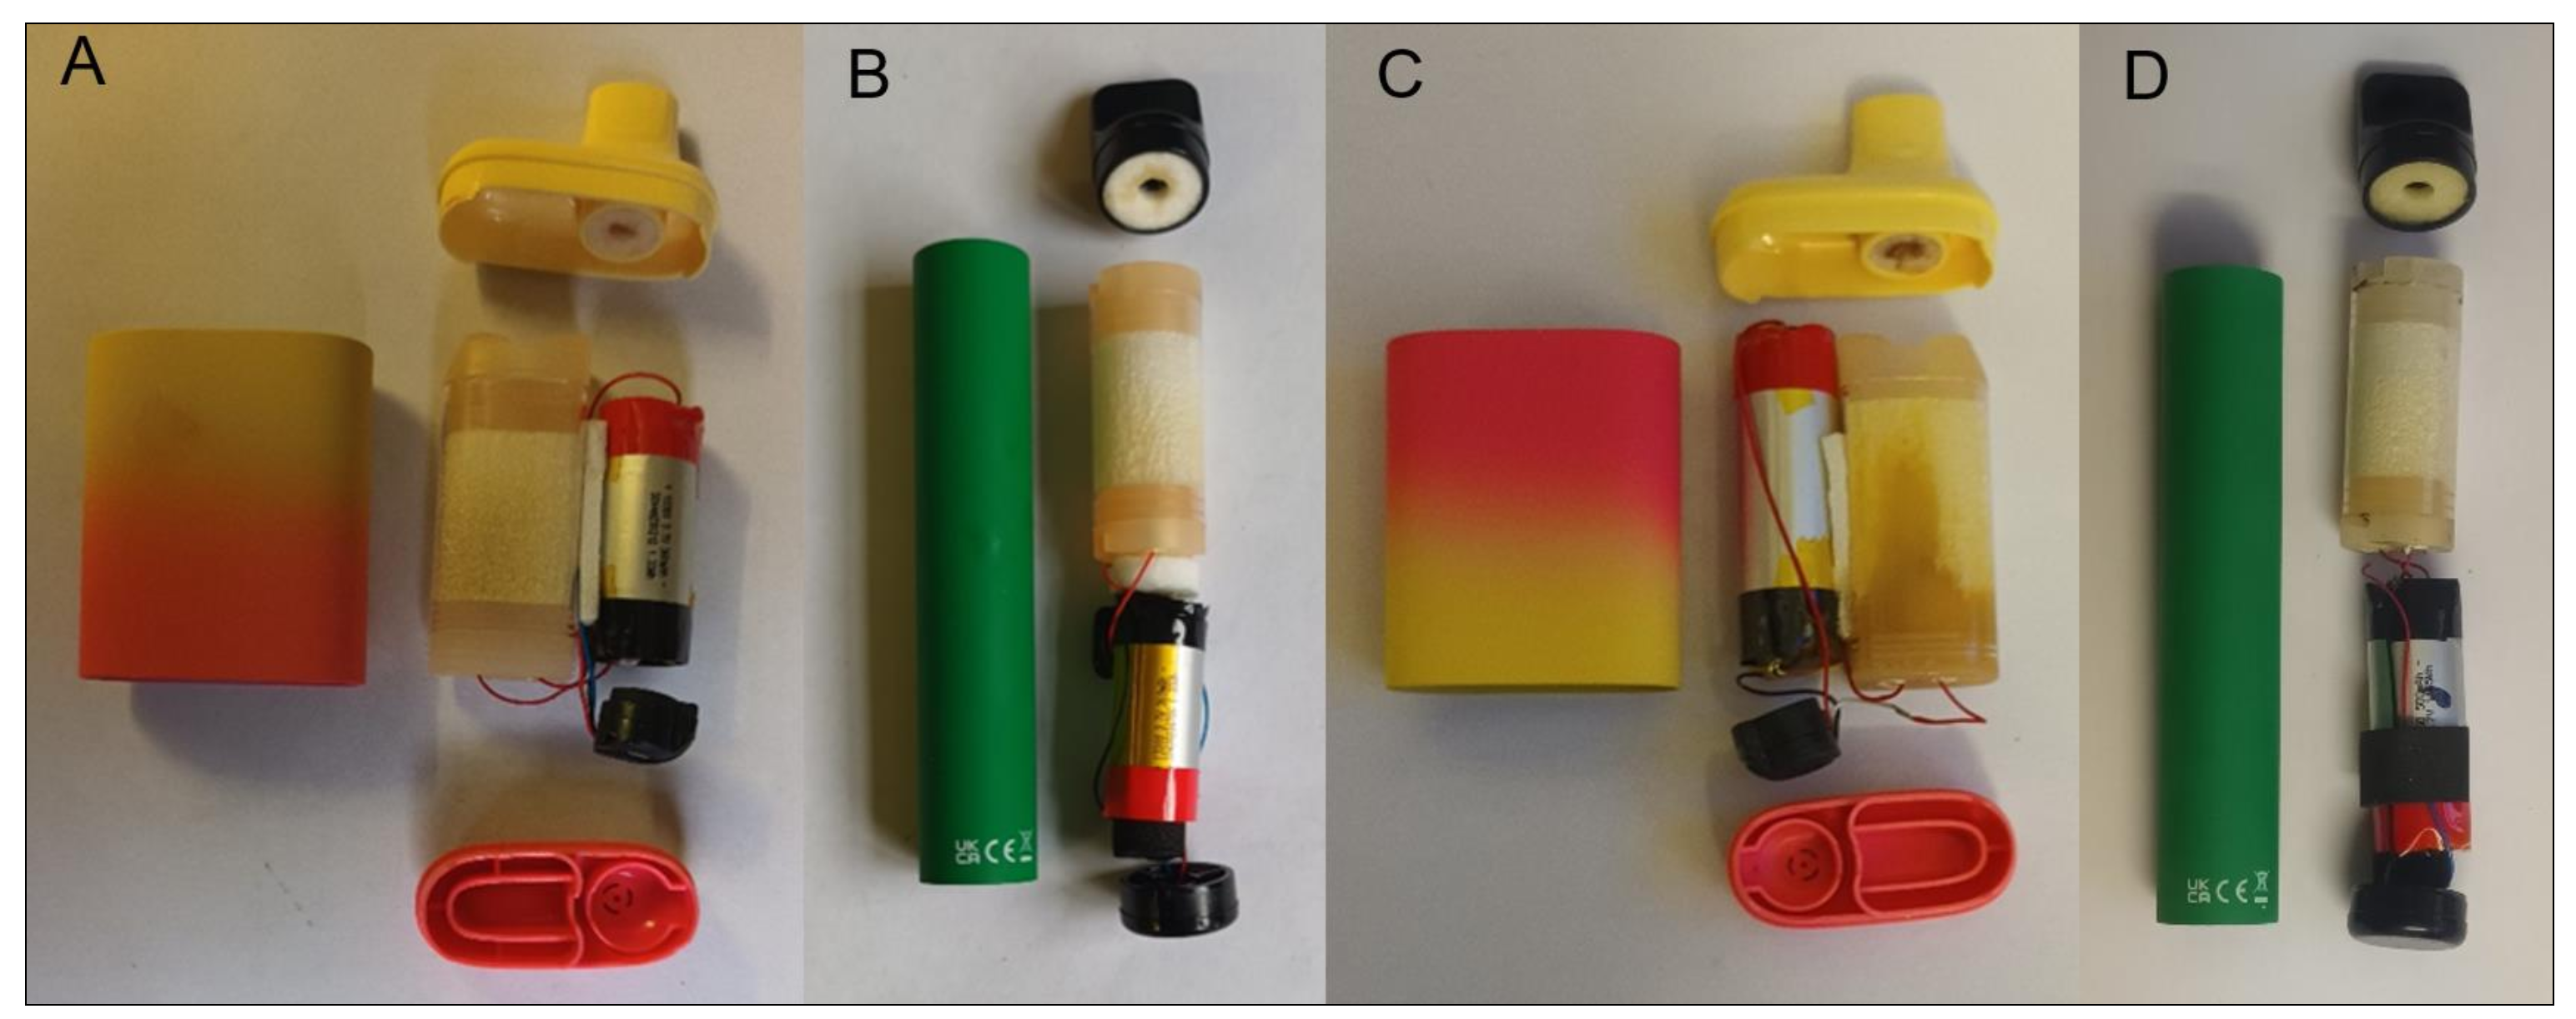
Figure 1. Explode view of pen and pod SUVs: (A) Pod SUV containing 13300–360 mAh cell, (B) Pen SUV containing 13300–360 mAh cell, (C) Pod SUV containing 13400–550 mAh cell, and (D) Pen SUV containing 13400–550 mAh cell.
Batteries 10 00236 g001
Figure 2. Examples of SUV Li-ion cells: (A) 13300–360 mAh cell and (B) 13400–550 mAh cell.
Batteries 10 00236 g002
Figure 3. A sample charge–discharge curve.
Batteries 10 00236 g003
Figure 4. Test rig enclosure, including extraction and filtration system.
Batteries 10 00236 g004
Figure 5. Test rig control systems: (A) mechanical abuse test rig, (B) control system (live), and (C) control system (safe mode).
Batteries 10 00236 g005
Figure 6. Cell thermocouple positioning.
Batteries 10 00236 g006
Figure 7. Short-circuit cell holder, electrical connections, and thermocouples.
Batteries 10 00236 g007
Figure 8. Nail test cell holder, electrical connections, and thermocouples.
Batteries 10 00236 g008
Figure 9. Impact test cell holder, electrical connections, and thermocouples.
Batteries 10 00236 g009
Figure 10. Crush test cell holder, electrical connections, and thermocouples.
Batteries 10 00236 g010
Figure 11. Range of (A) 13300 and (B) 13400 cells removed from SUVs.
Batteries 10 00236 g011
Figure 12. Example of 13400 cell construction: (A) Complete cell, (B) Plastic outer layer, (C) Protective foil casing, and (D) Cell jellyroll construction.
Batteries 10 00236 g012
Figure 13. Cell open circuit voltage distribution by vape type and cell.
Batteries 10 00236 g013
Figure 14. Test 5 cell temperature and current profile over time.
Batteries 10 00236 g014
Figure 15. Cell casing central deformation: (A) Test 1—13300 cell 100% SOC, (B) Test 7—13400 cell 50% SOC, and (C) Test 10—13300 cell 50% SOC.
Batteries 10 00236 g015
Figure 16. Tests 13 and 20 cell temperature and voltage profile over time.
Batteries 10 00236 g016
Figure 17. Tests 16 and 18 cell temperature and voltage profile over time.
Batteries 10 00236 g017
Figure 18. Nail test cell damage comparison: (A) 13400 cell 100% SOC (TR) and (B) 13400 cell 100% SOC.
Batteries 10 00236 g018
Figure 19. Impact test cell deformation: (A) Test 26—13300 cell and (B) Test 34—13400 cell.
Batteries 10 00236 g019
Figure 20. Test 27 cell temperature differential and voltage profile over time.
Batteries 10 00236 g020
Figure 21. Test 30 cell damage and venting: (A) 13400 cell damage (TR) and (B) Screenshot of cell venting (TR).
Batteries 10 00236 g021
Figure 22. Tests 30 and 16 cell temperature and voltage profile over time.
Batteries 10 00236 g022
Figure 23. Crush test cell deformation: (A) Test 37—13300 cell—Uniform deformation, (B) Test 48—13400 cell—Uniform deformation, casing ruptured, and (C) Test 41—13400 cell—Significant structural damage.
Batteries 10 00236 g023
Figure 24. Test 42 cell venting and debris ejection over time: (A) Cell venting, (B) Debris ejection (cell venting + 250 ms), (C) Debris ejection (cell venting + 500 ms), and (D) Debris ejection (cell venting + 750 ms).
Batteries 10 00236 g024
Figure 25. Tests 42, 30, and 16 cell temperature and voltage profile over time.
Batteries 10 00236 g025
Table 1. Qualitative risk assessment of batteries during the domestic waste management processes [32].
Facility Area/ProcessPossible Hazards and ThreatsRisk Level
Collection binsDamage due to external short-circuitlow
Loading activityDamage due to external short-circuitlow-medium
Collection vehicleMechanical damage due to compactionmedium
Unloading activityMechanical damage due to tip-offlow
Waste bunker/input storageDamage due to external heating (self-heating of waste)medium-high
Waste transfer activityMechanical damage due to (wheel) loader or grippermedium
Treatment facilityMechanical damage due to pre-shredding and post-shredding processes; Dangerous heat generation after damage; Carry-over through the processing facilityhigh-very high
Output storageDamage due to external short-circuit; Damage due to external heating (self-heating of waste); Dangerous heat generation after damagelow-medium
Disclaimer/Publisher’s Note: The statements, opinions and data contained in all publications are solely those of the individual author(s) and contributor(s) and not of MDPI and/or the editor(s). MDPI and/or the editor(s) disclaim responsibility for any injury to people or property resulting from any ideas, methods, instructions or products referred to in the content.