Article

Heterogeneity of Lithium Distribution in the Graphite Anode of 21700-Type Cylindrical Li-Ion Cells during Degradation

1
Department of Physics, Chair for Functional Materials, TUM School of Natural Sciences, Technical University of Munich, James-Franck-Str. 1, 85748 Garching, Germany
2
Heinz Maier-Leibnitz Zentrum (MLZ), Technical University of Munich, Lichtenbergstr. 1, 85748 Garching, Germany
3
Deutsches Elektronen-Synchrotron (DESY), Notkestraße 85, 22607 Hamburg, Germany
4
National Physical Laboratory, Hampton Road, Teddington TW11 0LW, UK
5
Schlumberger Cambridge Research, Madingley Road, Cambridge CB33 0EL, UK
6
German Engineering Science Centre (GEMS) at Heinz Maier-Leibnitz Zentrum (MLZ), Helmholtz-Zentrum Hereon, Lichtenbergstr. 1, 85748 Garching, Germany
7
Department of Earth System Science, University of Hamburg, Grindelallee 48, 20146 Hamburg, Germany
8
Synthese and Charakterisierung Innovativer Materialien, Department of Chemistry, Technical University of Munich, Lichtenbergstr. 4, 85748 Garching, Germany
*
Author to whom correspondence should be addressed.
Batteries 2024, 10(3), 68; https://doi.org/10.3390/batteries10030068
Submission received: 22 December 2023 / Revised: 10 February 2024 / Accepted: 14 February 2024 / Published: 20 February 2024

Abstract

:
Structural and spatial aspects of cell degradation are studied using a combination of diffraction-and imaging-based tools applying laboratory X-rays, neutron scattering and synchrotron radiation with electrochemical and thermal characterization. Experimental characterization is carried out on cylindrical cells of 21700-type, where four regimes of cell degradation are identified, which are supplemented by an increased cell resistance and surface temperature during cell operation. The amount of intercalated lithium in the fully charged anodes in the fresh and aged states is determined by ex situ X-ray diffraction radiography and in situ X-ray diffraction computed tomography. The qualitatively similar character of the results revealed a loss of active lithium along with the development of a complex heterogeneous distribution over the electrode stripe.

1. Introduction

In recent years, Li-ion batteries (LIBs) are considered the main energy storage systems in daily life portable electronics like smartphones, cordless tools and laptops, as well as in the mobility sector, being the major energy storage system for electric vehicles [1]. Since their commercialization in 1991, a steady development can be traced over the years [2]. Despite the overall success, there is a variety of issues left to be tackled, i.e., safety challenges due to flammable liquid electrolytes, finite lifetime, limited availability of transition metals like cobalt and nickel, and others.
Under these drawbacks of LIBs, the reduction in energy and power storage capability as a result of both cyclic [3] and/or calendric [4] aging is one of the most relevant research topics in this field. The loss of active lithium is the main driving force of capacity reduction [3], where lithium gets consumed (built) by side reactions into the solid–electrolyte interphase (SEI) [5,6]. This, in turn, leads directly to an increased internal resistance of the cell and causes a power fading of the cell [7]. Through the increased resistance, the self-heating of the cell during dis-/charging increases as well [8], causing an accelerated decomposition of the electrolyte [9], and thus is potentially the cause for the accelerated capacity fading at elevated cycling numbers [10]. The decomposition of the electrolyte is linked to a loss of active lithium inside the cell [10]. Aging processes involve a variety of parameters and factors, which are often non-trivially related with each other [5]. Therefore, the characterization of the aging behavior and the localization and separation of the underlying processes are complex.
There is a selection of appropriate experimental techniques, which are often applied and combined, where electrochemical tools and methods are of first choice. Characterization of the electrochemical performance is typically at the forefront, where a relatively large toolbox of techniques exists besides standard galvanostatic/potentiostatic characterization and cyclic voltammetry, e.g., electrochemical impedance spectroscopy [11,12], incremental capacity analysis [13,14], the galvanostatic intermittent titration technique [15], etc. In the next step, ex situ and post mortem characterization techniques are often employed in studies of aging, i.e., by taking local probes and reconstructing spatial distribution, characterization of the sample structure, morphology, composition, etc. [16]. Having in mind that LIBs are closed (environmentally isolated) systems, an accurate and non-ambiguous determination of the state of active materials is not simple and often requires application of experimental techniques that enable performing studies under real operating conditions. The most commonly used techniques are typically based on diffraction or imaging using laboratory X-rays, neutrons [6,10] and/or synchrotron radiation [17]. Methods enabling the study of the electrochemical storage systems in operando are of exceptionally high relevance as they enable probing the lithium/electrolyte without perturbation of the system, e.g., by cell opening. Application of non-destructive techniques maintains the state of the materials unchanged, e.g., eliminating electrolyte evaporation, mechanical fracturing, surface degradation, contaminations of various kinds, etc.
Besides this, non-destructive characterization techniques gained relevance for studies of heterogeneities in electrochemical energy storage systems. Indeed, the energy density and the cell lifetime are directly related to the homogeneity of the electrode material [18,19] and to the fact that:
  • Not all of the theoretical capacity is available due to non-active regions in the cell;
  • Certain parts of the cells are more stressed during electrochemical cycling and, therefore, potentially degrade faster than others, leading to locally increased cell fatigue.
Non-uniformity in different forms is present in nearly all cell characteristics, e.g., current density [20,21,22], temperature distribution [23,24], pressure [25], electrolyte concentration gradient [26], etc. In turn, this leads to a non-uniform lithiation of the electrodes on different length scales ranging from the entire cell level [10,19], over the electrode thickness [18,27,28,29] and even at the single-particle level [30]. The influence and relationship of different cell parameters was actively studied in the literature for model systems, but it is barely explored for commercial cells. Even there, the main focus is typically made on cylindrical 18650-type cells, whilst larger-format 21700-type batteries are investigated significantly less.
In the current contribution, a series of non-invasive investigation methods addressing electrochemical, structural and thermodynamic details are applied to a 21700-type cell with the aim to follow the degradation mechanism during cell aging and to draw consistent patterns and conclusions about their degradation behavior. In situ and in operando diffraction experiments were performed in order to monitor the lithiation differences in fresh and degraded cells and compared to the results of ex situ structural characterization of the materials harvested from the treated cells. Obtained results form an overview of different degradation aspects occurring in the cylinder-type lithium-ion battery.

2. Methods

2.1. Details of Electrochemical Cell Cycling

Cylindrical 21700-type INR21700-48G (Nominal Capacity: 4800 mAh; Voltage range: 2.5 V–4.2 V; Max. Current: 9600 mA (2C; discharge); 4800 mA (1C; charge); Chemistry: nickel-rich cathode|C + 1% wt Si) Li-ion cells with 21 mm outer diameter and 70 mm height, nickel-rich cathode and graphite +1% wt Si anode [31] were used as a model system. Cell cycling was carried out using a Neware BTS-4000 potentiostat. In order to introduce aging, the cell was cycled rapidly on the upper limits of specified currents, i.e., for discharging a constant current (CC) of 9.6 A (2C), and, for charging, a constant current-constant voltage (CCCV) procedure was applied with a constant current of 4.8 A (1C) and a cut-off current of 240 mA (1/20 C). Cycling was performed utilizing the full voltage window of 2.5–4.2 V. After every dis-/charging, a rest period of 15 min was applied. During cell cycling, the cell surface temperature was continuously monitored using a DS18B20 temperature sensor chip (Maxim Integrated). An example of the experimental setup used is presented in Figure S1. Measurements were performed at room temperature, which was monitored with a second sensor. The elevated temperature of the cell was obtained by subtracting the room temperature from the sample temperature.
In order to “activate the cell” after storage, before the diffraction and imaging experiments as well as before cell disassembling, the studied cells were cycled typically three times, applying CC discharge with 400 mA (1/12C) and CCCV charge with 400 mA current and 240 mA cut-off (see below). The cell was in a fully charged state at the end. An overview of the cells used in the different experiments/characterisations is summarized in Table S1.

2.2. X-ray Computed Tomography (X-ray CT)

The cell layout was non-destructively probed via X-ray computed tomography using a phoenix v|tome|x 240 s CT system. Measurements were performed using a direct tube; the acceleration voltage was set to 120 kV and the current to 100 µA. A CCD detector (DXR-250RT, General Electric, Boston, USA) with a CsI scintillator, an active area of 200 × 200 mm2 and a pixel size of 200 × 200 µm2 was used for data collection at a sample-detector distance of 647.363 mm. Over the entire angular range of 360°, 1001 projections were collected, where each projection was composed of the average of three individual exposures of 2000 ms duration. Reconstruction of the data was performed with the phoenix datos|x software. Due to the high-resolution requirements, two separate data sets were collected at the top and the bottom sections of the cells and were merged together using the software ImageJ [32] with a final visualization/rendering applying VGSTUDIO MAX (Volume Graphics, Heidelberg, Germany).

2.3. Ex Situ X-ray Diffraction Radiography (XRDR)

The previously reported X-ray diffraction radiography (XRDR) approach was successfully applied to determine the lithium content in the graphite anode of charged cells [33] and in the cathode of the discharged state [34]. Chosen cells were slowly cycled using the conditions mentioned in Section 2.1 and disassembled at state-of-charge (SOC) 100% under an argon atmosphere. The double-coated lithiated graphite anode stripe was extracted from the cells and cut into pieces in order to fit into the Ar-filled sample holder [33] consisting of an Al frame and X-ray-transparent Kapton windows. To minimize/eliminate oxygen and water contamination of the electrode stripes, a continuous stream of Ar gas was applied. Two INR21700-48G cells, nominally fresh (only cycled three times using C/12 for characterization) and aged (cycled 123 times using 2C/1C dis-/charge), were evaluated.
Measurements on the fresh cell were carried out at the P02.1 beamline [35] at PETRA III (DESY, Hamburg, Germany). At P02.1, the fixed photon energy of 60 keV, corresponding to a wavelength of 0.20714 Å, was used. The 2D diffraction data were collected using a PerkinElmer XRD1621 detector at a sample-detector distance of 2466 mm. The Ar-filled sample/electrode holders were mounted on the translation stage perpendicular to the X-ray beam with a size of 1 × 1 mm2. The diffraction signal (integrated over the electrode thickness) was collected over the sample area with 4.0 × 3.0 mm2 rastering steps (horizontal × vertical). Studies on an “aged” anode were carried out at the P24 beamline at PETRA III. Experimental conditions were similar to those reported in Ref. [33]. The photon energy of 20 keV was chosen, corresponding to a wavelength of 0.6202 Å. A MARCCD165 2D detector at a sample-detector distance of 99.8 mm was used for data collection. Rastering steps of 5.0 × 3.0 mm2 (horizontal × vertical) were selected. In both cases, the collected 2D diffraction data were radially integrated using Dioptas software [36], applying diffraction data from Si (P24) and LaB6 (P02.1) as reference.
Radially integrated 1D diffraction data were recorded in the 0.5–12.7 deg. 2 θ at 0.20714 Å (corresponding momentum transfer q range of 0.26–6.67 Å−1 for the fresh cell and 1.29–6.63 Å−1 (7.3–38.2 deg 2 θ at 0.6202 Å) for the aged one). Examples of diffraction patterns with highlighted diffraction peaks of stage I and stage II lithiated graphite are shown in Figure S2a,b as collected using P02.1 and P24 diffractometers. Similarly to previous works [33,37], the lithium concentration in the graphite anode was calculated assuming the biphasic behavior of stage I (LiC6) and stage II (LiC12) lithiated graphite compounds. The integral intensities were used to calculate the lithium concentration x in LixC6.

2.4. X-ray Diffraction Computed Tomography (XRD-CT)

Complementary to XRDR, X-ray diffraction computed tomography (XRD-CT) was applied to study the lithium distribution non-destructively. This method, in contrast to XRDR, has previously shown to be highly suitable to differentiate the individual materials inside batteries and perform local structural analysis of the electrode materials, providing the structural information resolved in-depth [18,38,39,40]. Studies were carried out at the P02.1 beamline at PETRA III with an experimental setup similar to that of the XRDR experiment, i.e., 60 keV photon energy, 1 × 1 mm2 beam size, PerkinElmer XRD1621 detector, etc. The tomography dataset was composed of 31 translation steps over a 30 mm scanning range and 48 rotation steps over [0.0:352.5] deg. in a radial plane of the battery. XRD-CT datasets were collected at different cell heights over the entire cell [0:65 mm] with a 5.0 mm step size. The radial integration of the diffraction data (absorption corrected) was performed using Dioptas software [36], and the reconstruction of the diffraction data was done using the inverse Radon transform algorithm embedded in MATLAB, where signals from the cathode, anode, separator and current collectors were identified. An example of a reconstructed diffraction pattern is depicted in Figure S3.
The in-plane radial distribution of x in LixC6 was calculated for a series of radial planes using the integral intensities of the reconstructed diffraction patterns for 001 and 002 reflections from stage I and stage II, respectively.

2.5. In Operando X-ray Diffraction

In operando X-ray diffraction was performed using the P02.1 beamline at PETRA III with the same properties and setup as the XRD-CT experiments. During this experiment, the cell was fixed in a position where the pencil beam penetrated only a small volume at the middle height in the central part of the cell. The cell was electrochemically connected to a BioLogic VMP3 potentiostat and slowly cycled during the experiment. A CCCV procedure was applied for both charging and discharging between 2.5 V and 4.2 V with a constant current of 400 mA and a cut-off current of 48 mA (1/100 C-rate). Between dis-/charging, a longer cell relaxation period of 30 min was applied. Diffraction images were taken every ca. 3 min corresponding to a change in the state-of-charge of less than 0.5% between consecutive diffraction patterns. Finally, diffraction and potentiostat data were synchronized using their respective timestamps.

2.6. High-Resolution Neutron Powder Diffraction (NPD)

The lithiation state of the positive and negative electrodes was probed simultaneously using high-resolution neutron diffraction with the instrument SPODI [41] at the FRM II (Heinz Maier-Leibnitz Zentrum, Garching, Germany). The incident monochromatic neutron beam from the (551) reflection of a vertically focused composite germanium monochromator at a take-off angle of 155° with a wavelength of λ = 1.54832(4) Å was shaped to a rectangular cross-section having 40.0 mm height and 20.0 mm width. The two-dimensional data collection was carried out in Debye–Scherrer geometry in the range of 4–152° 2 θ . Data collection was performed on a “pristine” cell at SOC = 0% and a second “pristine” cell at SOC = 100% (using the slow charging option in Section 2.1), corresponding to fully discharged and fully charged states, respectively.
Analysis of neutron data was carried out using the full-profile Rietveld method implemented into the FullProf software [42]. Signals from LiNi0.85Co0.15O2 (cathode), lithiated graphite (anode), as well as copper/aluminum (current collectors) and steel (cell housing) were identified in the diffraction data. The background has been found similar in both cells (SOC = 0 and SOC = 100), i.e., independent of the state-of-charge, and modeled using linear interpolation at positions where no reflections are present. Diffraction peaks were modeled with a pseudo-Voigt function of the Thompson–Cox–Hastings type.
Diffraction patterns obtained at SPODI (FRM II, Garching, Germany) and beamline P02.1 (DESY, Hamburg, Germany) are compared in Figure S5 of Ref. [18], where the contributions of active material (anode/cathode) and passive material are highlighted in different colors. Simplifying, the contrast of dominating the contribution of lighter elements in the neutron diffraction data, contrary to the enhanced sensitivity of synchrotron diffraction to the heavier elements of the cathode, can clearly be seen. Due to the details of neutron scattering, the high-resolution neutron powder diffraction studies of lithium-ion batteries, when applied, deliver accurate results in multi-phase data analysis [37,43].

2.7. Differential Thermal Analysis (DTA)

Investigations on chemical changes of the electrolyte were carried out using differential thermal analysis with the setup described in [8]. The cells were investigated, where one of the studied cylindrical Li-ion cells and a reference sample were simultaneously cooled down from room temperature to 150 K, equilibrated for 1 h and then heated up. The cooling/heating rate was set to 0.5 K/min in both cases. The differential thermal signal was obtained by the subtraction of the temperature at the reference from that of the sample.

2.8. Scanning Electron Microscopy (SEM) and Energy Dispersive X-ray Analysis (EDX)

Both qualitative and quantitative characterization of the surface morphology of the harvested cathode and anode materials were carried out using a Thermo Fisher Scientific Quattro S environmental scanning electron microscope (ESEM) operated by the Jülich Centre for Neutron Science JCNS (Forschungszentrum Jülich, Germany) and German Engineering Materials Science Centre GEMS (Helmholtz-Zentrum Hereon, Geesthacht, Germany) at the Heinz Maier-Leibnitz Zentrum (MLZ, Garching, Germany). A standard Everhart–Thornley Detector was used to measure the secondary and backscattered electrons for surface analysis. An electron current of 3.6 pA with an acceleration voltage of 2 kV was used. SEM data were recorded at 350×, 1000×, 3500× and 6500× magnifications. Two samples at predefined positions on the anode and cathode stripes were taken and analyzed. In EDX experiments, the detection unit was exchanged to a Thermo Fisher EDS UltraDry Si-drift detector with an energy resolution of 127 eV. Studies were performed with an acceleration voltage increased to 15 kV. Area maps (768 × 512) of the elementary composition and its distribution were investigated for both electrodes.

2.9. Inductively Coupled Plasma Optical Emission Spectroscopy (ICP-OES)

In order to verify the elemental composition of the cathode material, two slightly different inductively coupled plasma spectroscopy methods [44] on the aged electrode material were applied. The first followed the procedure in [45]. Approx. 30–50 mg of cathode material harvested from the disassembled cell was scratched off the current collector and dissolved in a solution containing 3 mL HCl (37% p. a., Fa. Merck) and 1 mL HNO3 (65% p. a., Fa. Merck) in microwave equipment (Fa. CEM) for 15 min at 180 °C. The solution was diluted to 500 g or 1000 g after dissolving and utilized for characterization using an ICP-OES system (iCAP 6500 Duo View, Fa. Thermo Fisher Scientific).
Analogous to the first method, in the second procedure, the cathode material was collected and scratched off the aluminum current collector. The material was ground to a fine powder and 3–5 mg were dissolved in 100 mL pro aqua regia corresponding to a concentration range of 30–50 mg/L. The samples were filled to 7–10 mL portions and were measured via ICP-OES spectrometer with radially-viewed plasma (Agilent 725 ICP-OES, Fa. Agilent Technologies). Five standard points (50, 10, 1, 0.1 mg/L, and blank) were measured for the calibration line using ICP multi-element standard solution IV (Fa. Merck). The processing of the measurement data was carried out with the Agilent ICP Expert II software.

3. Results and Discussion

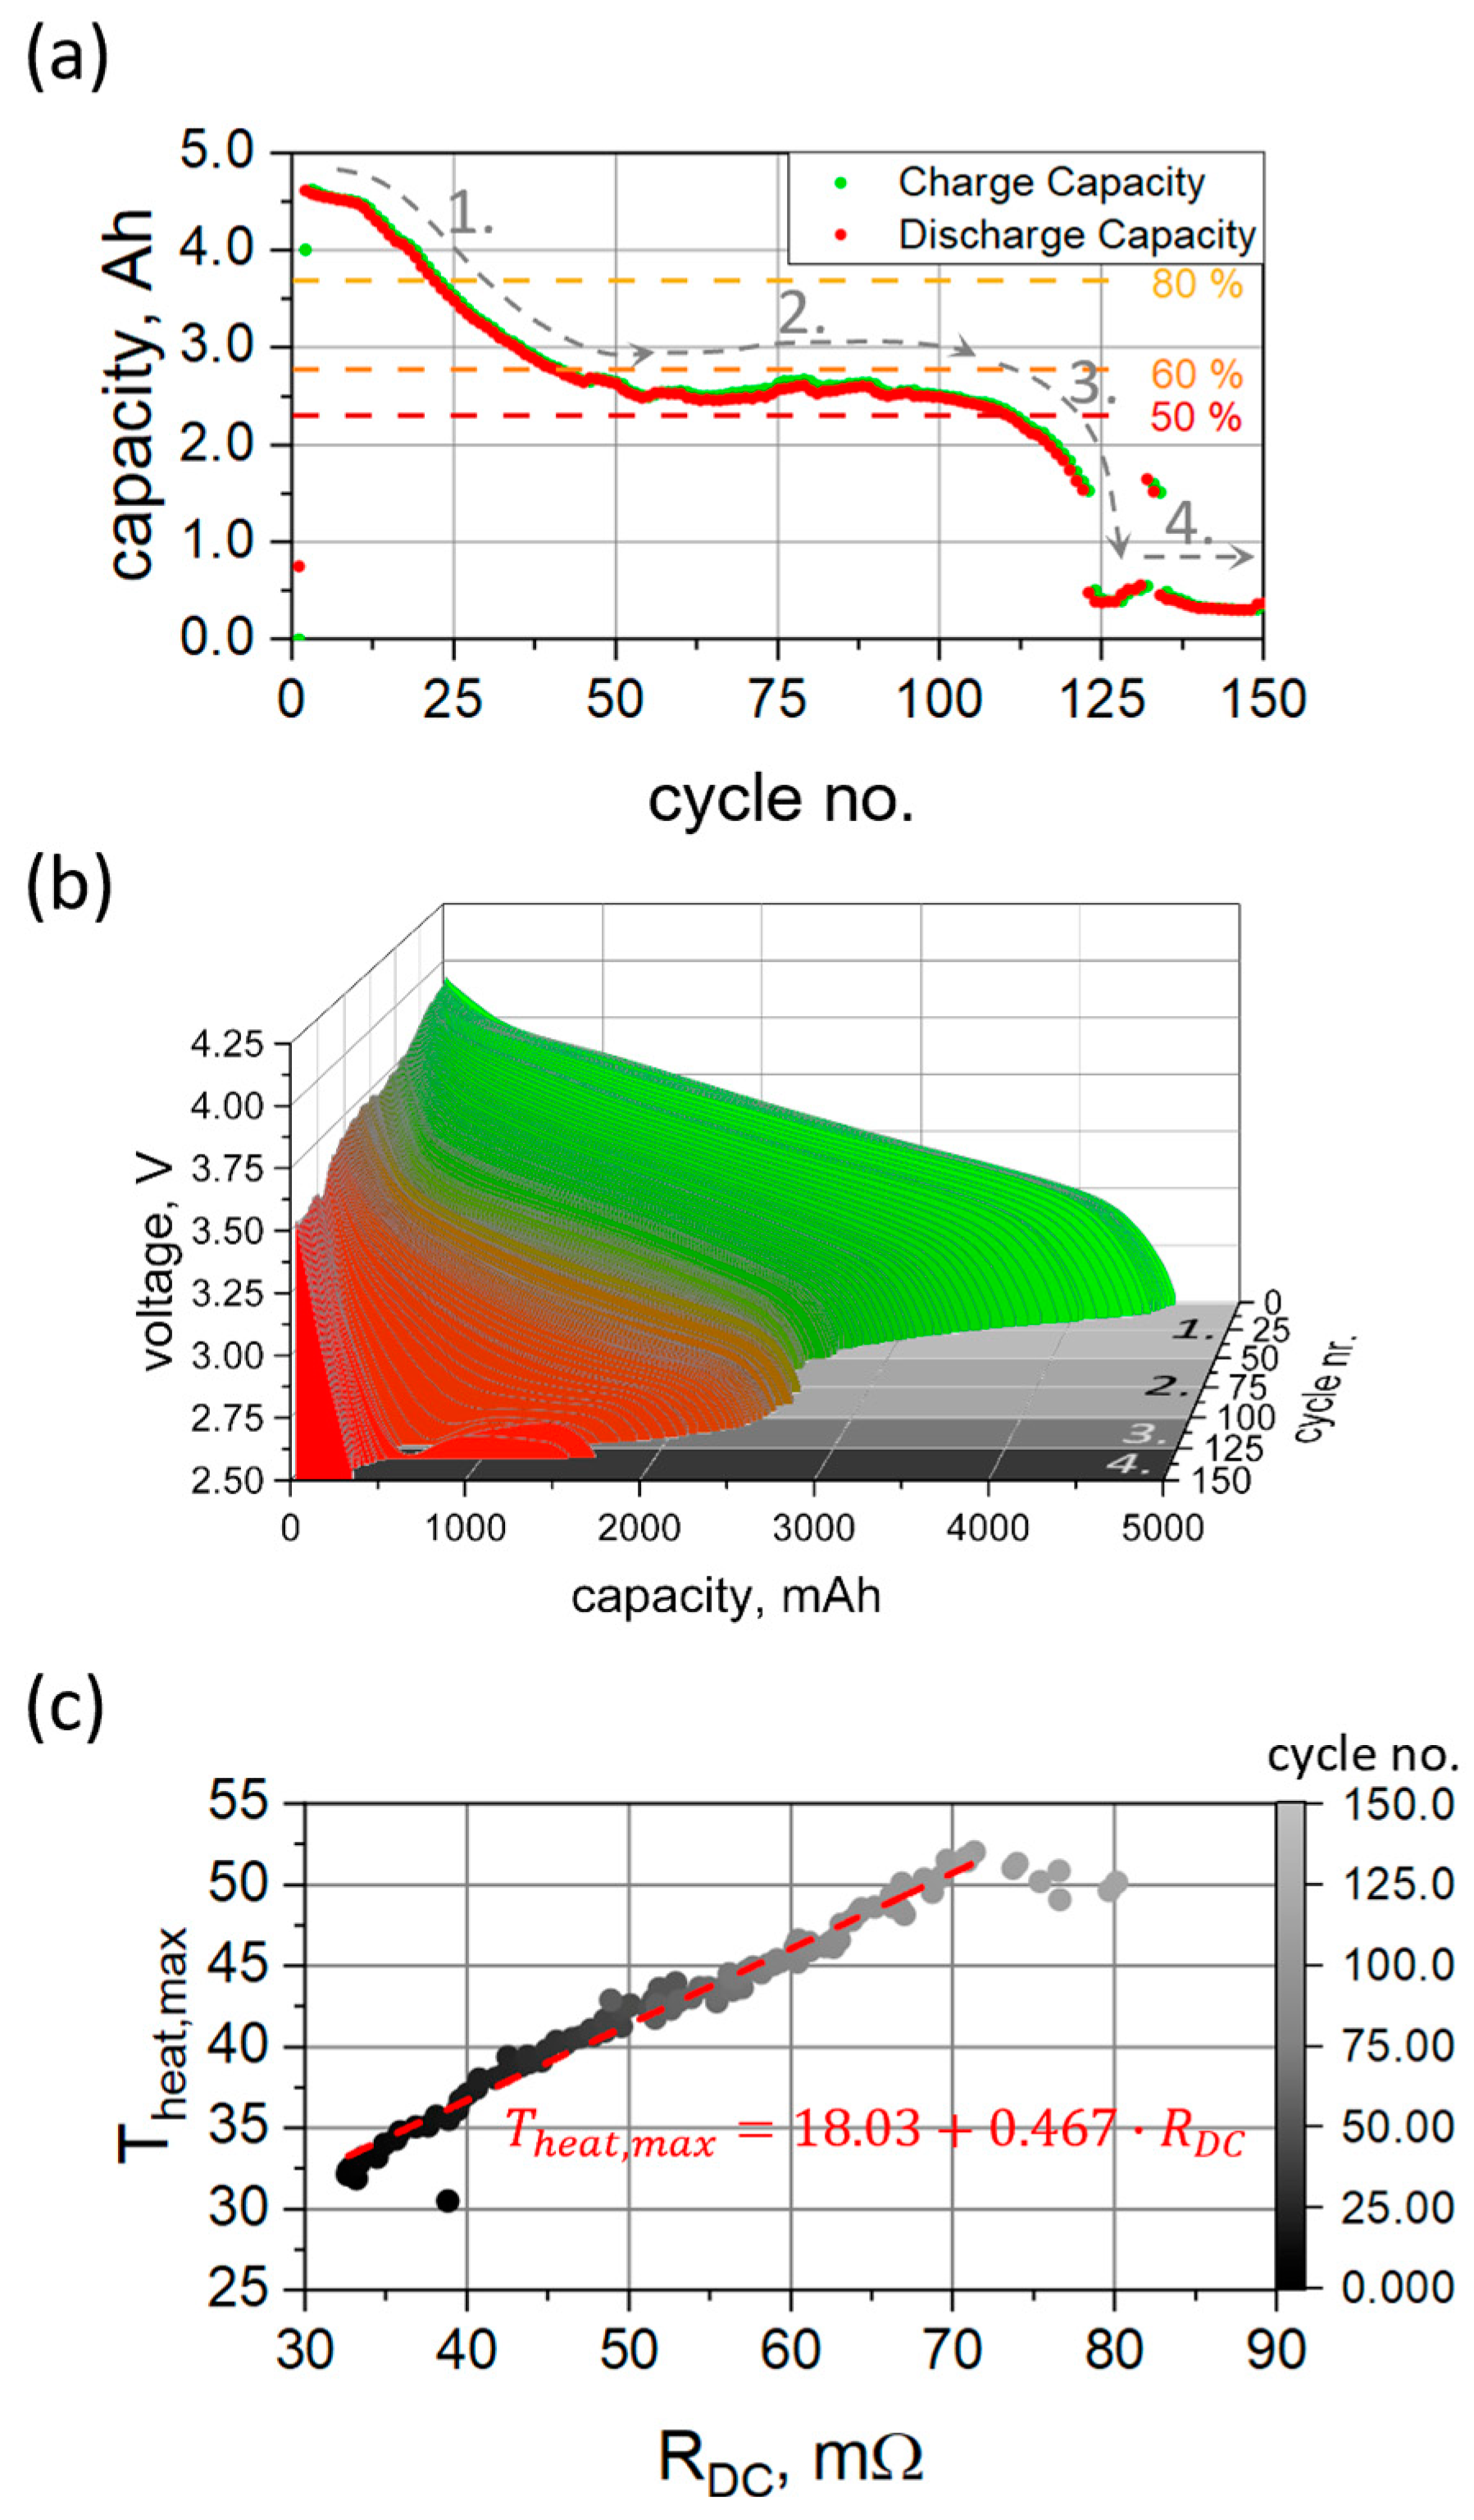
3.1. Electrochemical Aging

Four characteristic “regimes” (1–4) can be identified in the capacity dependence vs. cycle number. For the fresh state, an initial cell capacity of 4631 mAh was obtained, corresponding to ca. 96.5% of the nominal value. Cycling with currents at the upper limits specified by the manufacturer, along with the consequent increased temperature, results in a rapid loss of cell capacity (Figure 1a). At the given dis-/charging currents, the 80% level of cell capacity was reached in 23 cycles with subsequent capacity loss to 60% of the initial value after 41 cycles in total (regime 1). A stable capacity plateau was observed at ca. 55% in the region between 50 and 100 cycles (regime 2), which is then followed by a rapid capacity drop to ca. 5–10% level of the initial capacity above 125 cycles of rapid dis-/charge (regime 3). After that, the capacity remains constant at this low level (regime 4). These different regimes have been observed and described in the literature previously [7,46]. The first “acceleration” stage is believed to originate from the growth of the SEI layer, which (as resulted from the previous studies [10]) is directly related to the relationship between loss of liquid electrolyte and active lithium. The origin of the second “stabilization” stage and the third “saturation” stage cannot be attributed unambiguously, but a variety of possible modes and scenarios are discussed in the literature [7].
Another remarkable feature supplementing the rapid capacity fade is the anomalous evolution of cell voltages upon cycling (Figure 1b). The voltage profile evolves non-equidistantly and non-monotonously with cell aging. Furthermore, in regime 3, a metastable voltage plateau at ca. 2.6 V develops in the capacity range of 750–1500 mAh. The plateau characteristics (voltage and capacity windows) rapidly change with cycle number and are followed by an accelerated voltage drop (Figure 1b). At cycle numbers above 120, the lower potential limit (2.5 V) is reached shortly after applying the high discharge current (9.6 A), and cell discharging is then immediately stopped at very low capacities.
The observed anomalous behavior is often attributed to thermal effects caused by increased internal cell resistance and corresponding to Joule heating [8]. The cell resistance R (estimated by the voltage drop U upon cell discharge [10 s after application of discharge current I = 9.6 A] as R = U / I ) was found monotonously proportional to the cycle number. A similar behavior was noticed for the cell surface temperature (see Figure S4). A typical thermal profile on the charge/discharge cycle with 1C/2C currents is shown in Figure S5a). The cell temperature increases upon application of current and decreases during CV and rest phases. Temperature changes at the cell surface reflect both state-of-charge and state-of-health and are proportional to the applied current [8]. The highest temperatures on the cell surface are found at the end of the discharge process. The maximum cell temperature reached was found to be linearly proportional to the cell resistance (Figure 1c), indicating the Joule heating mechanism, which is linearly proportional to the resistance ( P J o u l e = I 2 R ). Besides the increasing cell temperature, degraded cells show anomalies in the cooling rate in the relaxation phase after cell discharge. The cooling rate can be modeled using a simple exponential decay with a single time constant showing a dependence on cycle number. Three regions [1:25]–1, [25:80]–2 and >80–3 can be defined, where a linear increase, a nearly steady state and a decrease in the decay constant are observed (Figure S5b). These regions are consistent with the characteristics of the capacity retention (Figure 1a) and indicate changes in degradation mechanisms.
Qualitatively, the observed degradation behavior is similar to that reported in Ref. [10] for a cell series using LiNi0.8Co0.15Al0.05O2 (NCA) as the cathode and graphite (C) as the anode (NCA|C chemistry), where the fading rate was found to be much slower. The local minimum in the discharge voltage characteristics was also observed but more pronounced. The observed capacity loss in the current case can be largely attributed to the power fade, i.e., cell cycling with 400 mA current results in approx. 89.7% and 78.5% capacity retention of nominal values after 50 and 100 cycles, respectively (Figure S4). Incremental capacity analysis [47,48] (Figure S6, top) of the data set collected with 400 mA unambiguously shows four peaks in the dQ/dV curves at ~ 3.46 V, ~ 3.66 V, ~ 3.94 V and ~ 4.13 V, which are typically attributed to a phase transition in the electrode materials and are widely described in the literature [49,50]. An assignment of the dQ/dV peaks was performed using the in operando X-ray diffraction data (Figure S6) discussed later. Due to an overlap of the anode and cathode features, the peaks at 3.66 V and 3.94 V cannot be assigned to just one electrode. The characteristic peaks corresponding to plateaus at lower potentials were found to be more prone to cell fatigue. The two characteristic peaks at lower potentials diminish at high degrees of aging: the peak at approx. 3.46 V can be attributed to a C L i x < 0.5 C 6 phase transition; a small shoulder to the first peak is related to the lithiation of the silicon inside the anode [51,52,53]. A “smearing out” of the peak, along with the diminishing of the shoulder, indicates the development of a non-uniform lithiation state in the graphite/silicon anode. In contrast, the ”cathode peak” at around 4.13 V has been found to be more stable against aging.
Besides the electrode degradation, the electrolyte subsystem has been found affected by cell aging as well. DTA studies of cells in the fresh and aged states (similar to the one reported in Ref. [8]) unambiguously revealed changes in the profile of the calorimetry signal (Figure S7). In the fresh state, the DTA signal is composed of two asymmetric signals, marked as S and L with maxima at 250 and 255 K. Cell aging leads to a lower magnitude of the DTA signal and a temperature shift of the maxima in the negative and positive directions, i.e., to 245 K and to 265 K for S- and L-type signals, respectively. The observed shifts of the peaks in the DTA signal can be attributed to a change in the electrolyte composition [8], whereas the overall decrease in the signal (integral area) from −10.4 to −8.6 can be attributed to a drying out of the cell, i.e., reduction of the amount of the liquid electrolyte. Observed changes of the electrolyte could be crucial to cell aging and can potentially be overcome by more stable electrolytes, e.g., based on highly fluorinated ether electrolytes [54].

3.2. Characterization of the Cell and Its Components

X-ray CT was used to probe the cell layout and details of cell organization non-destructively. Imaging of the cell interior shown in Figure S8 revealed the high-power cell design utilizing “scheme 3” of the electrode connection schemes (according to Ref. [19]). In this configuration, one current tab is connected at the beginning and another tab at the end of the anode electrode stripe. A third current tab is connected in the middle of the cathode current collector. The length of current tabs at the anode and cathode corresponds to ca. 50% (outer, anode), 85% (inner, anode) and 90% (cathode) of the electrode stack height. On extrapolation of the knowledge base established in Ref. [19] for 18650-type cells to the 21700-type cell, one can see that the length ratio between negative electrode tabs is typical for cells manufactured by Samsung SDI, whilst the relatively thick electrode (~360 µm (double-coated anode/separator/double-coated cathode/separator)) defines the cell type to the low/moderate-power cells (with a maximal discharge rate below 5C).
The cell layout has been found to affect the lithium distribution along the electrode stripes for the relatively short electrodes in 18650-type cells [19]. The effect is expected to be more pronounced in larger-diameter cells adopting larger electrode stripes and, correspondingly, a more heterogeneous current distribution. Due to the limitations of X-ray absorption, the best-identified (most absorbing) parts are the steel housing, current tabs, current collector and cathode material. The relevant cell details, like lithium and/or electrolyte distribution, cannot be revealed (at least directly). Therefore, studies of the lithium distribution were performed using X-ray and neutron diffraction.

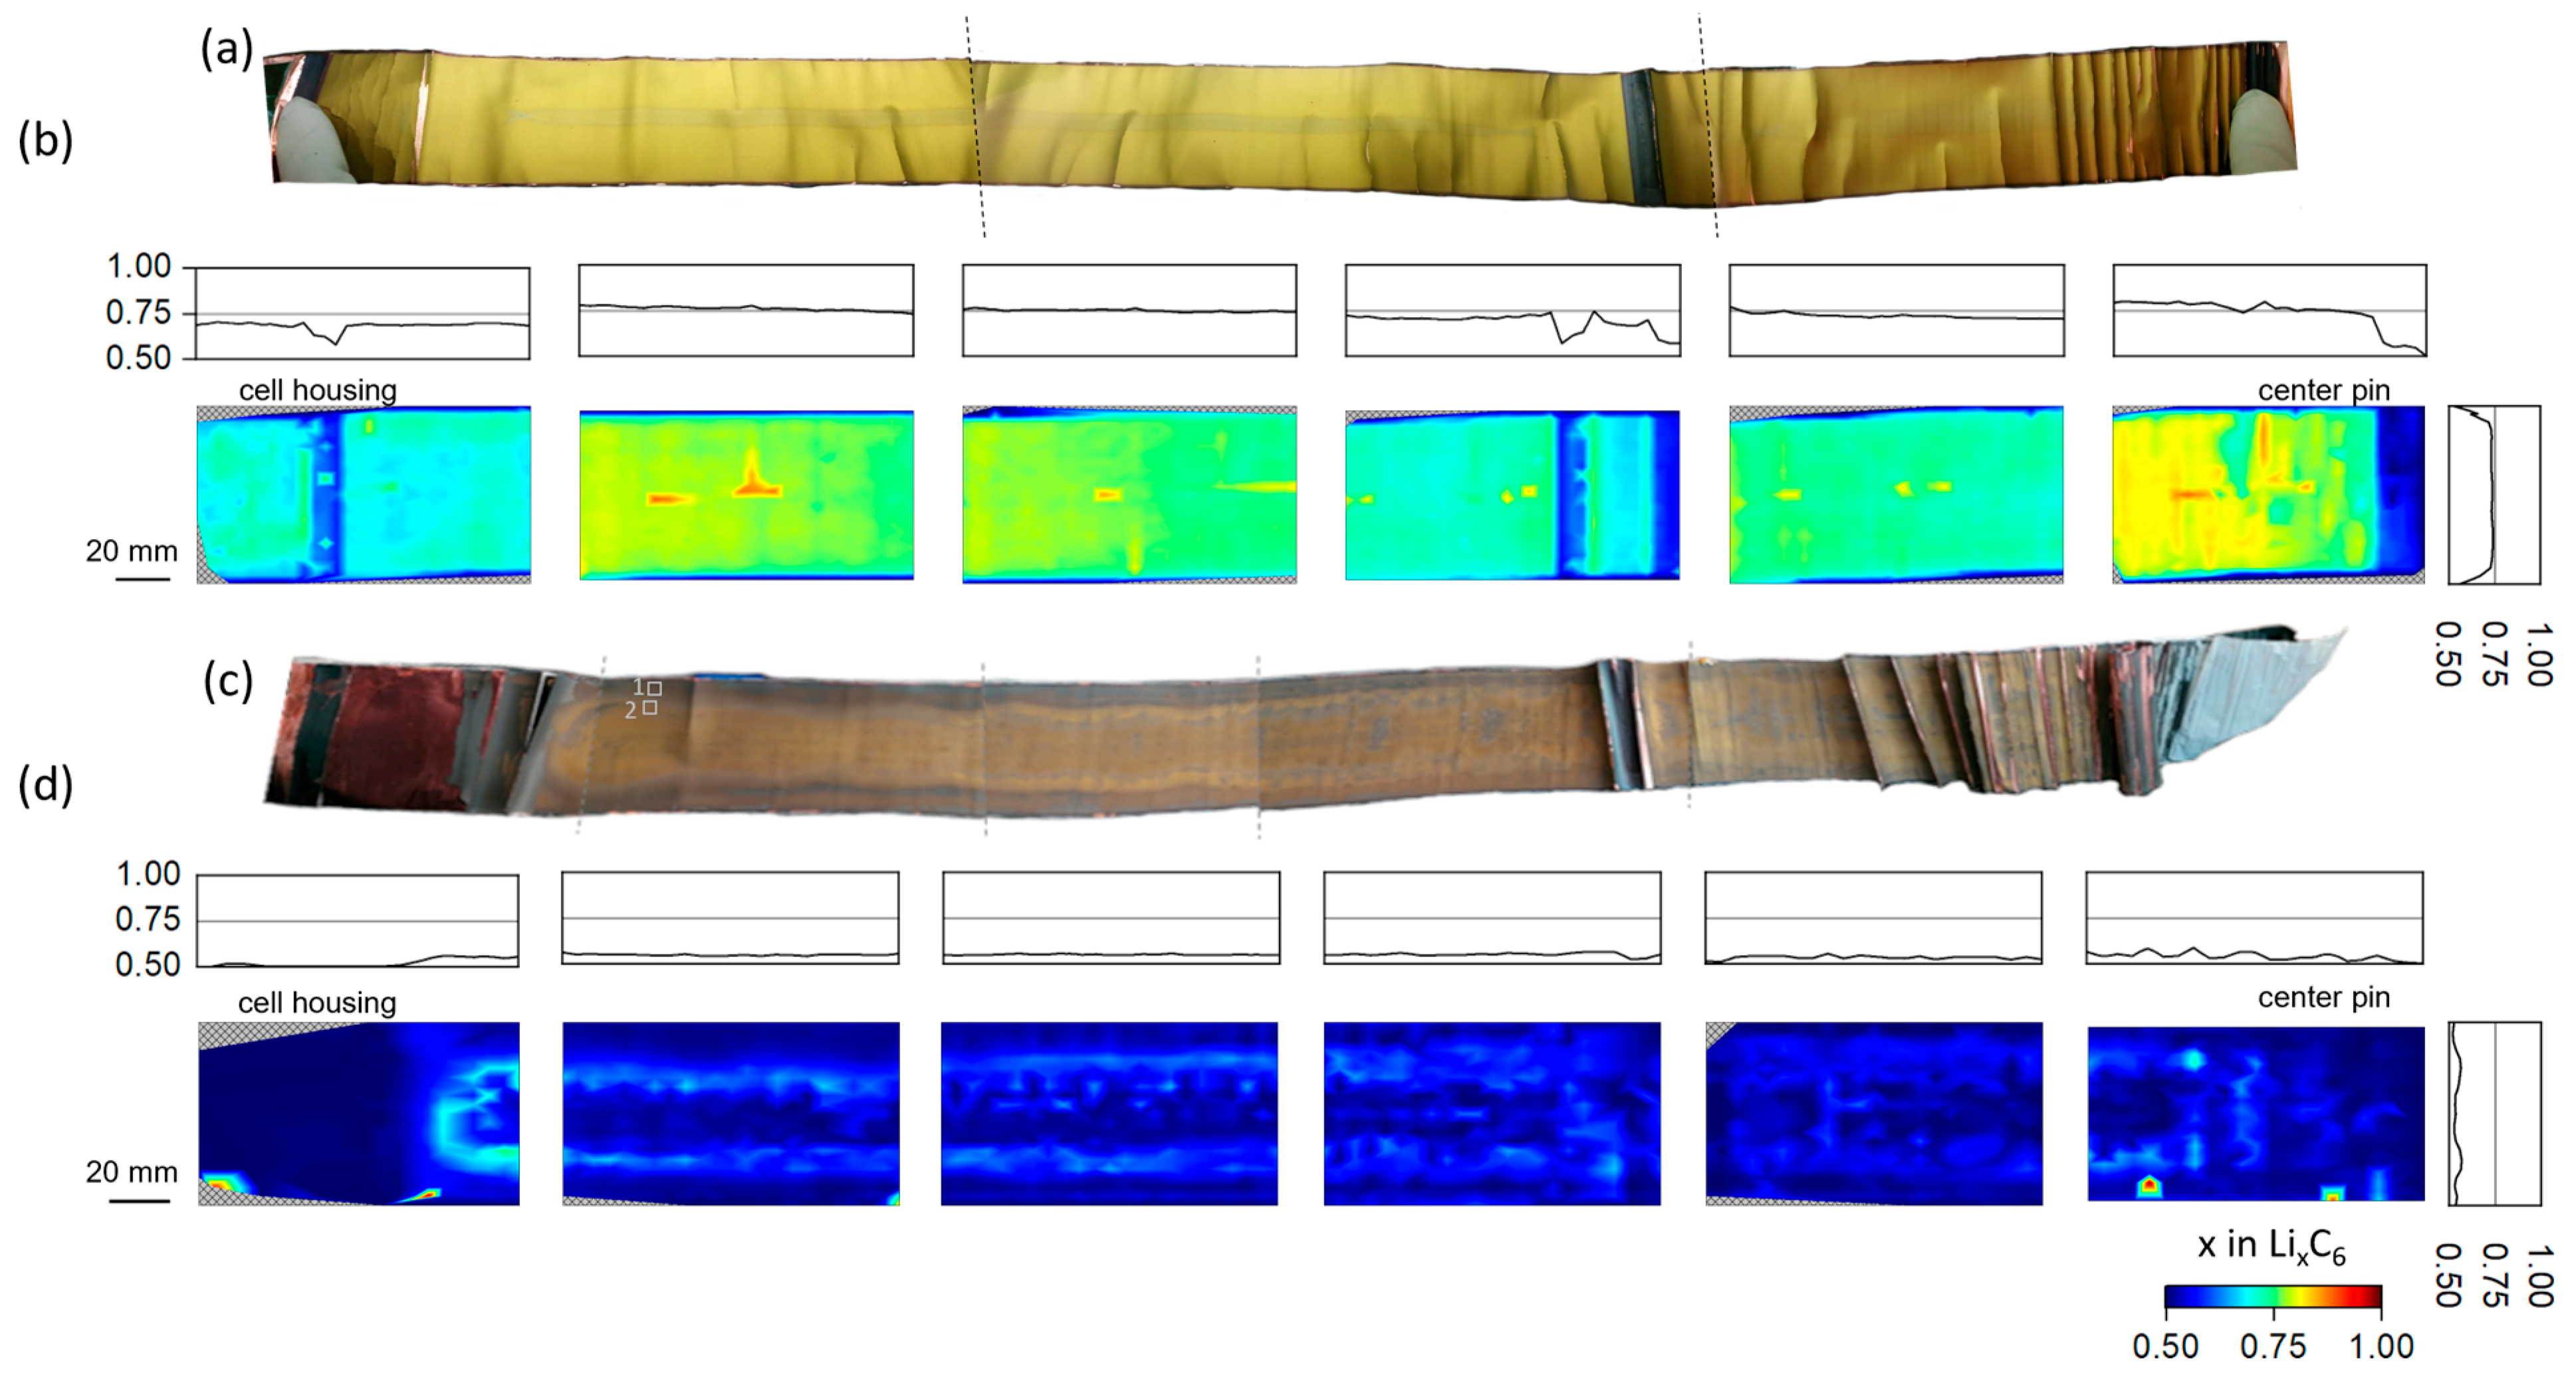
3.2.1. Ex Situ X-ray Diffraction Radiography

The surface color of the lithiated graphite is a sensitive indicator of its lithiation grade, i.e., from the literature, it is known that upon graphite lithiation, the initial black color of the graphite anode changes continuously from dark blue (LiC18) through red (LiC12) to a golden color (LiC6) [55]. The extracted lithiated graphite anode stripe in the fresh state (Figure 2a) shows a dominating golden color corresponding to LiC6. At both ends and at about 1/3 of the electrode stripe area, localized black-colored regions are present, which are attributed to sections lacking the counter electrode material. Besides this, at the middle line of the electrode stripe (middle height), a narrow region with a systematically darker shade of golden color was observed, possibly indicating Lix<1C6 average lithium content on the electrode surface. The surface and “bulk” (thickness averaged) lithium distribution can vary [18]. Therefore, the uniformity of the lithium distribution was quantified ex situ using XRDR characterization. Along with subsequent analysis of the diffraction signal from lithiated graphites, this results in an area map of the lithium content x in LixC6. For the fresh cell, the corresponding map with x in LixC6 values presented in false colors is plotted in Figure 2b. Except for minor systematic differences in the individual frames used for the experiment, an initially uniform lithium distribution (averaged over the electrode thickness) was observed for the negative electrode despite some narrow regions with systematically lower lithiation. The black regions (also identified during visual inspection) can be unambiguously associated to the regions with systematically lower lithium content in the false color plot. Averages over length and width of the electrode stripe (represented by 1D profiles on the top and right side of individual frames, respectively) reveal the uniformity of lithium distribution at the initial state of cell operation. Tracing the cell layout structure back to the lithium distribution reveals that the narrow areas of lower lithiation correspond to the positions of the current tabs and areas with no counter electrode. For the fresh state, no lithium concentration gradient can be seen in the lithium distribution across the width of the electrode strip (cell height), apart from very sharp drops at the very bottom and top of the cell, which, again, can be related to the absence of the counter electrode material in this area.
Visual inspection of the positive electrode extracted from the aged cell (cycled 125 times using 1C/2C charge/discharge current rates) revealed a series of pronounced changes compared to the “pristine” state (Figure 2c). It is worth mentioning that slow charging with 400 mA current resulted in a ca. 3070 mAh cell capacity, corresponding to ca. 60% of the initial value. Due to the generally lower lithiation level of the anode, the electrode stripe displays significantly darker colors with red to dark-red shades. At the electrode center, a region having a different color distribution from that at the outer electrode width was clearly observed. A quantitative analysis reveals a reduction of average lithium content in the fully charged state of the aged cell compared to the fresh one, where x in LixC6 equals 0.723 (fresh) and 0.541 (aged). Furthermore, the remaining lithium in the aged cell is distributed more heterogeneously, which is reflected, for example, in sprinkle-like areas of higher lithiation. Histograms of the experimentally established lithium distributions (Figure S9) revealed a different profile shape, which can be attributed to a non-uniform lithium distribution for the aged cell. In the case of the fresh state, the distribution can be approximated using one single Gauss peak, whereas in the aged state, two Gauss peaks are necessary to fit the distribution. It is worth noting that due to our experimental approach, the calculated values are mathematically limited to values between 0.5 and 1.0. The relative loss of active lithium for the aged cell can be calculated to be approx. 25% of the value of the pristine anode. Analyzing the average lithium content over the length and width of the electrode stripe, a strong development of fluctuations in lithiation can be observed close to the center pin (towards the cell’s interior).
Besides this, two well-resolved lithium concentration maxima of 0.569 and 0.565 x in LixC6 of aged cell can be identified over the electrode width (cell height) at around 14.7 mm (24.5% tot. height) and 44.1 mm (73.5% tot. height), respectively. Similar features are clearly present in both photos of the electrodes (Figure 2c) and the false color representation of the lithium content (Figure 2d). In such context, one has to refer again to the “thickness” averaged character of XRDR and the sensitivity of the visual inspection to the surface of the electrode. Aging-driven color changes of the graphite electrode surface are often observed in the literature, and a grey-red film is typically attributed to the formation of covering/passivation layers on top [56,57,58,59,60,61] as a result of side reactions occurring at the anode during cell cycling.

3.2.2. Morphology Characterization of the Extracted Battery Electrodes

The surface morphology of the extracted electrodes was probed using SEM. Probes were taken for both the anode and cathode at two representative regions in the electrode, i.e., the outer cell region (marked as 1 in Figure 2c) and, next to it, at the area characterized by a more golden color (marked as 2 in Figure 2c). The obtained SEM images are displayed in Figure S10. Visual inspection of the images reveals the central part of the electrode to be more heterogeneous than the outer cell regions, which is supported by statistical indicators of the histograms, i.e., deviations from the mean value of the image have been found to be systematically higher, and the skewness to be lower, in the central area of the electrode. The observed homogeneity can be directly associated with the formation of passivation layers on top of the anode [56]. The EDX analysis (Table S2) yields a carbon-to-Si ratio of 97.5(9):2.3(4) and 97.0(1):2.9(9) at. % for positions 1 and 2, accordingly. In state-of-the-art Li-ion batteries, silicon is often added since it offers a high theoretical capacity of 4212 mAh/g, which is over 10 times the theoretical capacity of graphite (372 mAh/g). However, silicon undergoes an extreme volume change between the delithiated and lithiated states, exceeding 300%. Therefore, only small amounts of silicon are added to the common graphite anodes in cells for mass market. Solutions like Sn-Si/graphite anodes are currently being investigated [62].
In the literature, the cathode material is stated to be LiNi0.80Co0.15Al0.05O2 [63]. However, in our EDX measurements, the transition metal-to-oxygen composition of the cathode was determined to be LiNi0.84(6)Co0.15(4)O1.90(4) and LiNi0.85(6)Co0.14(4)O1.97(6) for areas 1 and 2, indicating a manganese-free cathode with a general composition of LixNi0.85Co0.15O2. Performed ICP measurements further confirmed the absence of manganese, where weak traces of aluminum in the cathode were found, attributed to the residual traces from the aluminum current collector.

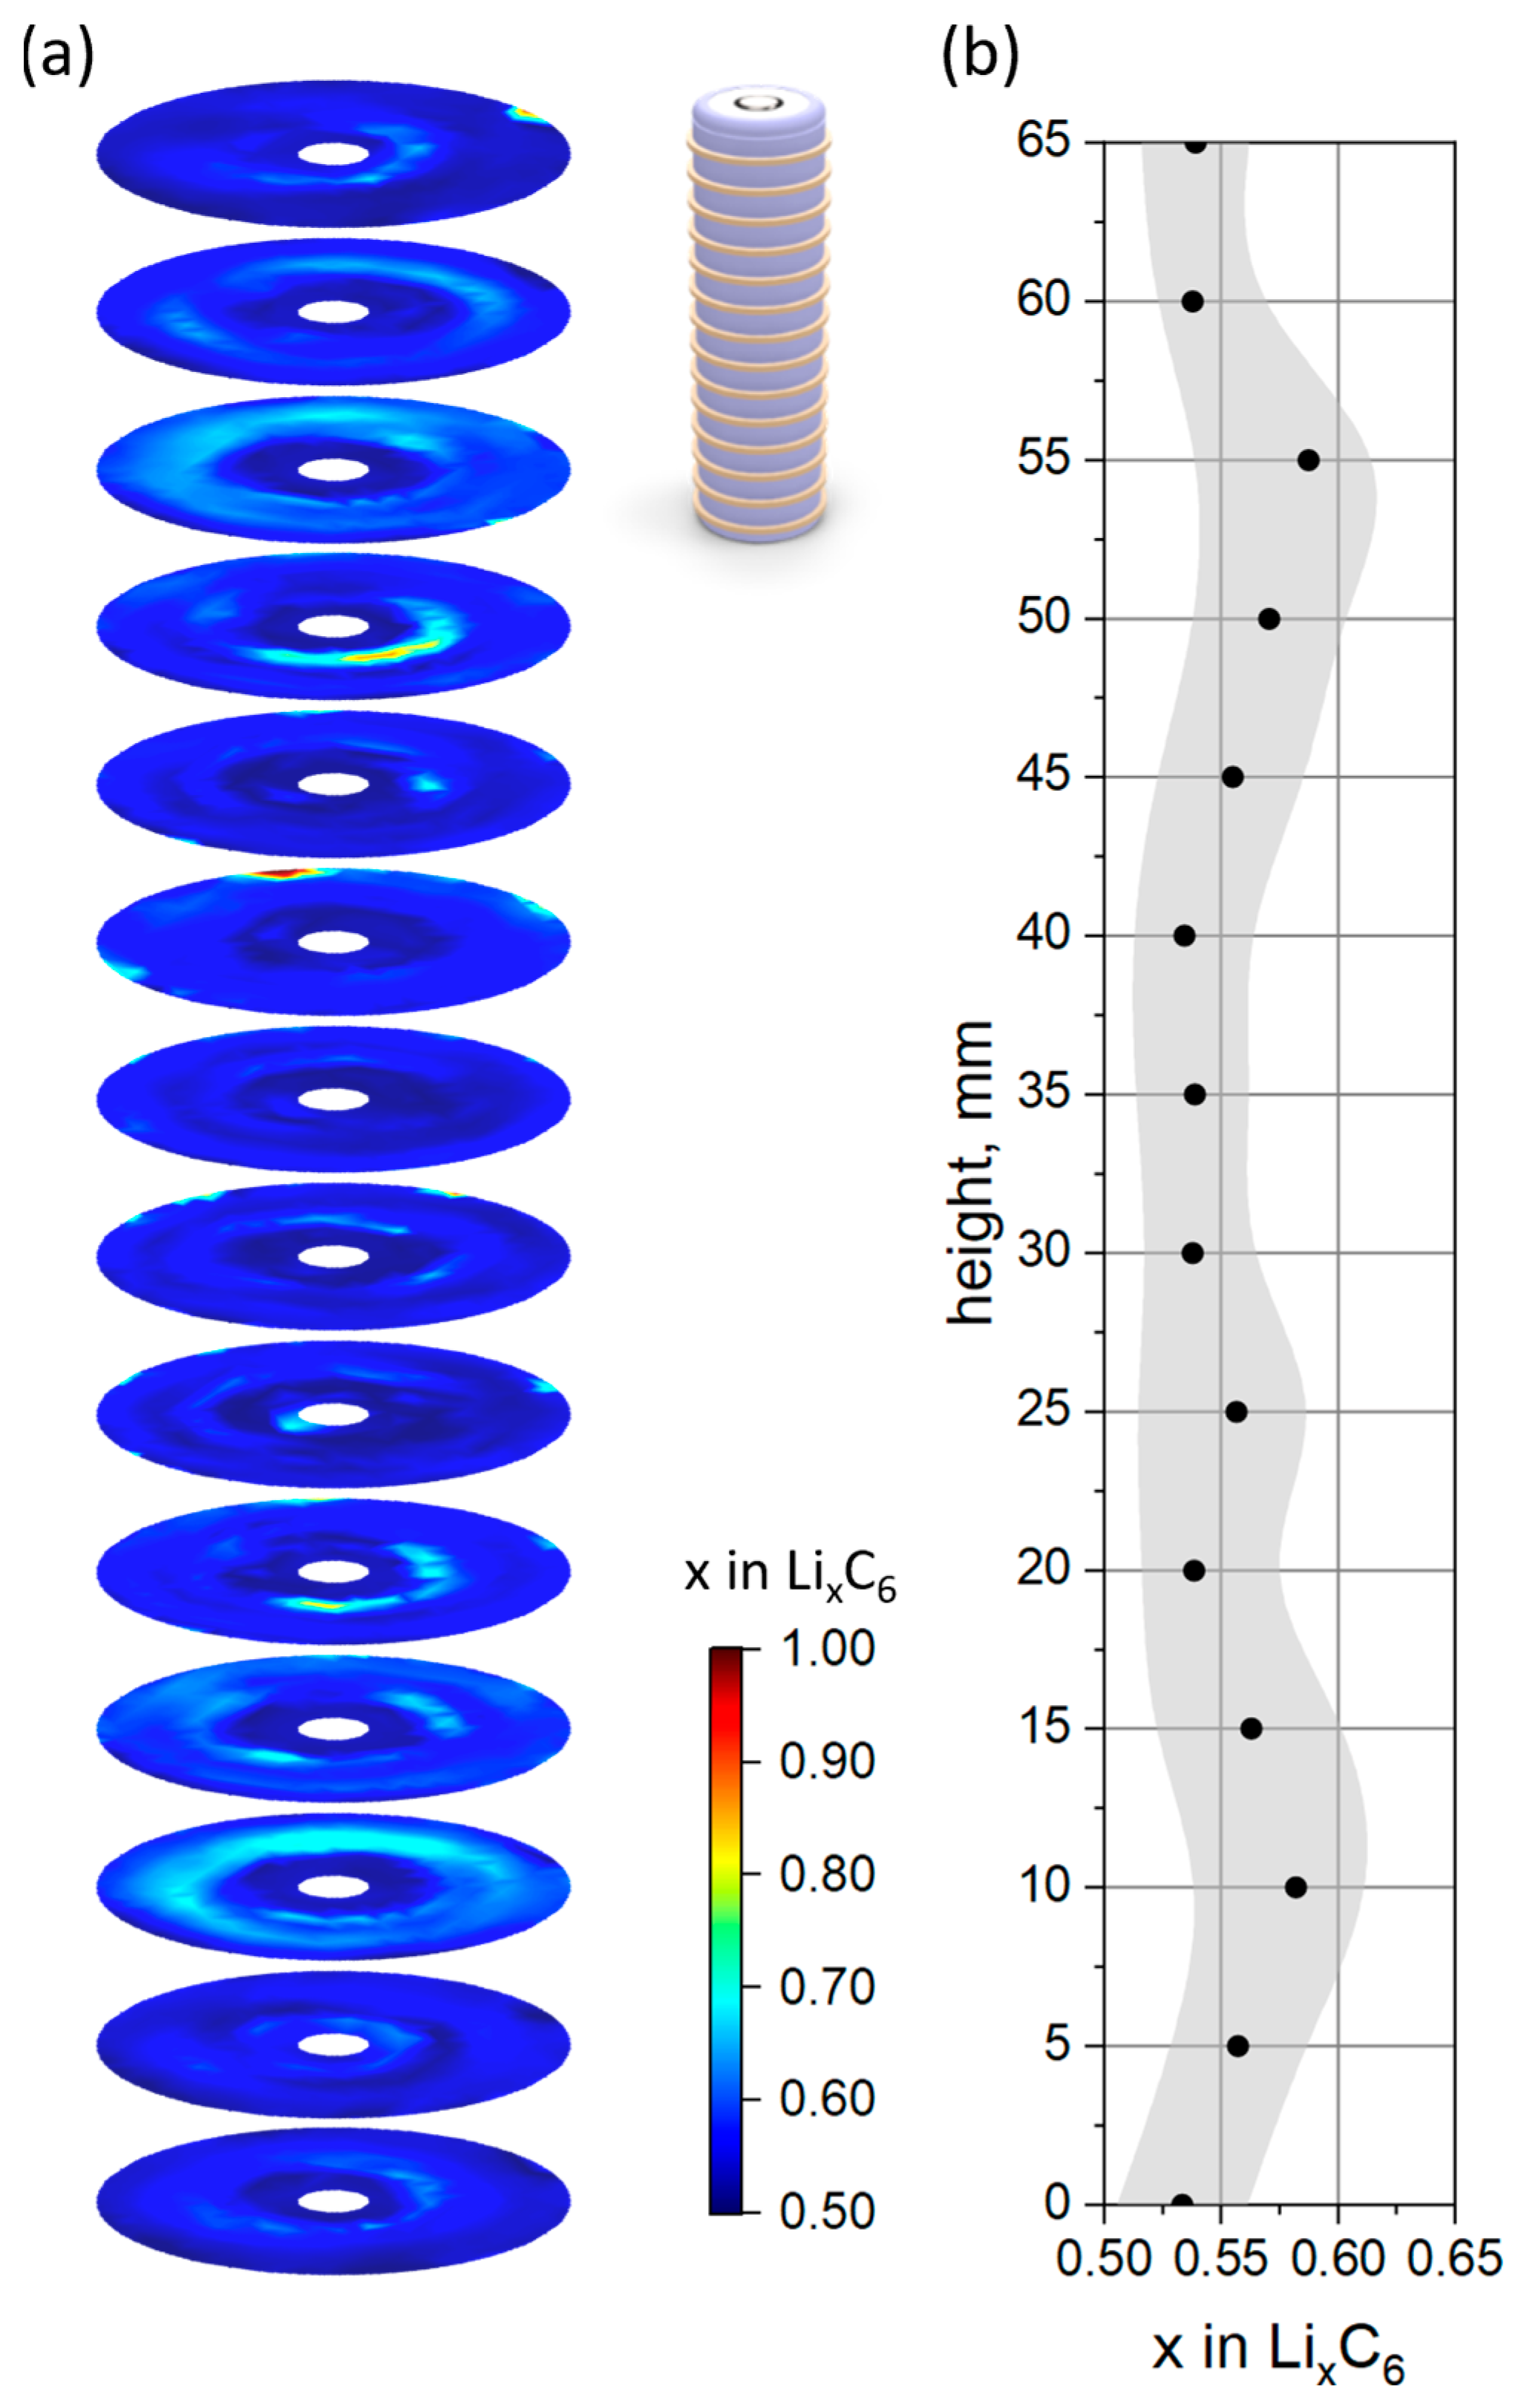
3.2.3. XRD-CT (Aged Cell, SOC = 100%)

The extracted graphite anode of the aged cell was found to be very brittle and extensively detached from the current collector, especially at locations close to the center pin. In order to validate the observed ex situ XRDR characterization and to minimize the effect of cell opening, the lithium distribution in the graphite anode was determined non-destructively using XRD-CT. A new cell of the same type was chosen from the batch and the identical cycling program was applied (see Figure S11 for details). Cycling with a small current of 400 mA yields 2930 mAh of remaining capacity in the scope of rapid cell aging/cycling so that the cell state is almost identical to the previous one in terms of remaining SOH.
The in-plane lithium distribution was investigated with a spatial resolution of 1 × 1 mm. A total of 14 planes with an offset of 5.0 mm were defined over the cell height of 65 mm. A schematic configuration of the studied planes with respect to the cell volume is shown in Figure 3a, with yellow rings representing the measured slices. The obtained in-plane distribution of the lithium content (x in LixC6) in the graphite anode of the 21700-type battery is shown in false color representation in Figure 3a (the corresponding pixel map is presented in Figure S12). In accordance with the ex situ XRDR experiment, a reduced lithium content of x = 0.552 in LixC6 is observed, which corresponds to a loss of active lithium of ca. 23.7% in comparison to the fresh electrode. Despite the rather coarse spatial resolution defined by the beam size of 1 mm in width, features of the cell layout, i.e., current tab configuration, corresponding to “scheme 3” from Ref. [19] can be traced, which is also in agreement with the results of the X-ray CT (Figure S8). The average lithium content of the individual slices was calculated and is presented in Figure 3b as black dots together with the standard deviation indicated by the grey area. Similarly to ex situ XRDR studies, two local maxima with systematically higher local lithium content can be clearly identified. The corresponding values and heights of the observed local maxima are ~ 0.584 (x in LixC6) at ~ 10.5 mm height and ~ 0.590 at ~ 53.0 mm height (measured from the cell bottom). The non-destructive analysis, which complements the ex situ experiment, shows that no significant changes occurred to the graphite anode during cell opening. Furthermore, it is confirmed that the stronger degradation in the middle of the cell is not an individual cell failure but a systematic phenomenon in the studied cell type.

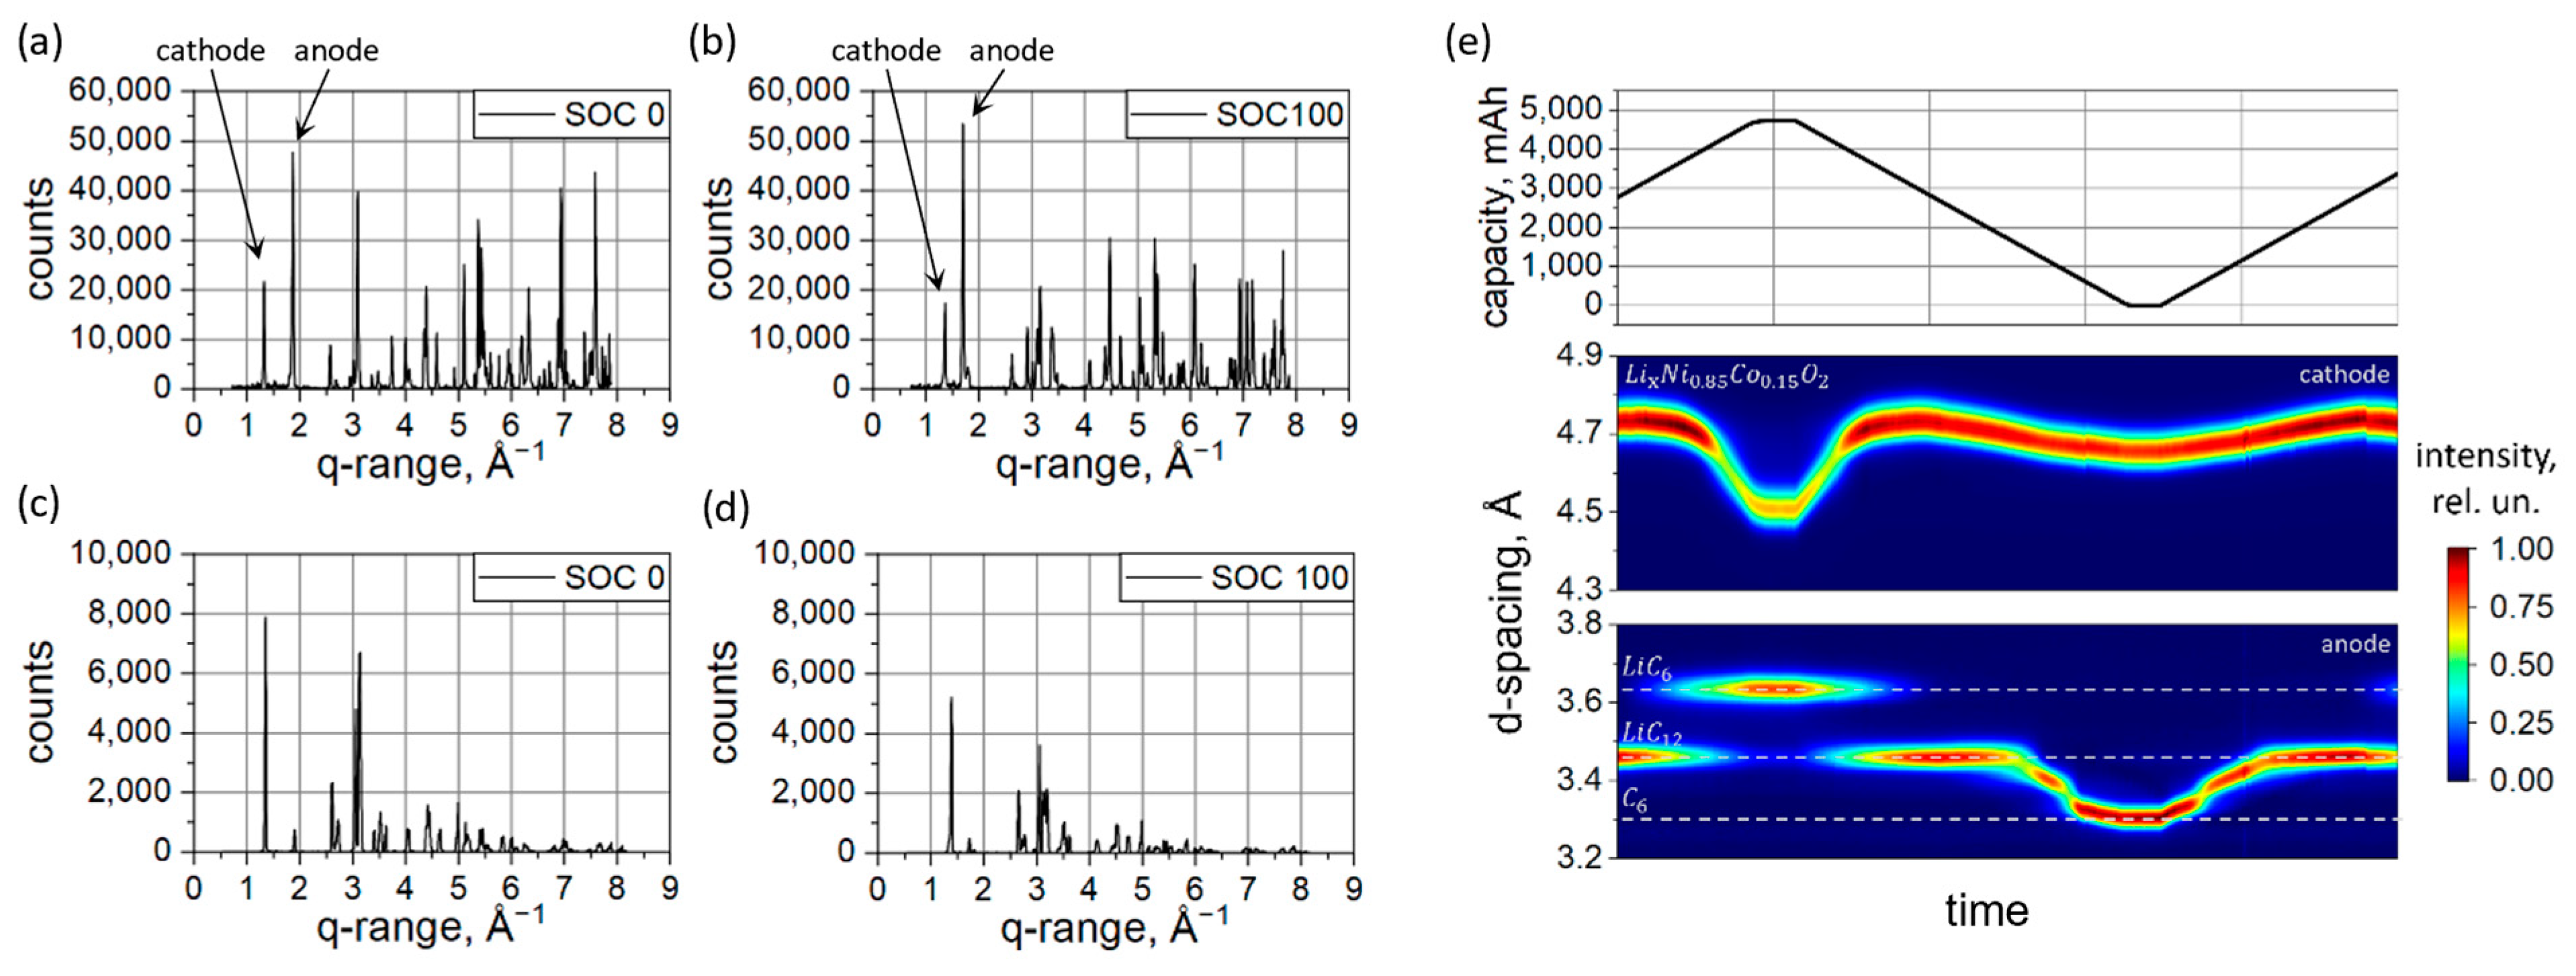
3.2.4. In Operando X-ray and Neutron Diffraction

In Figure 4a,b, neutron diffraction patterns collected at SOC = 0% and SOC = 100% of the two fresh cells are displayed, respectively. The high covered angular range enables the evaluation of the diffraction patterns using the Rietveld refinement method, which enables a highly detailed phase determination. The observed and calculated intensities, along with phase determination, are shown in Figure S13 a,b for SOC = 100 and SOC = 0, accordingly.
For the refinement, the chemical composition (transition metal to oxygen) was fixed to Ni0.85Co0.15O2, and the structural framework comprised of Ni/Co occupying the 3b site and O, the 6c site [45]. Lithium was residing at the 3a site and its y occupation in LiyNi0.85Co0.15O2 was refined. Two separate phases with different lattice parameters (corresponding to lower and higher lithiation grades) were needed to model the cathode signal at SoC = 100% and SoC = 0%. At SoC = 100%, the lower (Li0.036Ni0.85Co0.15O2) and higher (Li0.78Ni0.85Co0.15O2) lithiated cathode ratios (weight fraction) were determined as large as 76.79(1.91)%:23.21(1.89)% corresponding to the average lithium content of Li0.208(7)Ni0.85Co0.15O2. At SoC = 0%, the following ratio 66.66(5.40)%:33.34(4.75)% of Li0.912Ni0.85Co0.15O2 and Li0.948Ni0.85Co0.15O2 was obtained, leading to Li0.924Ni0.85Co0.15O2 average composition. The double-phase character of the cathode unambiguously reveals its inhomogeneous lithiation, which is essentially higher at SoC = 100%. Unfortunately, direct conclusions about the locality of lithium non-uniformities cannot be made on the basis of the volume-averaged neutron diffraction experiment.
Furthermore, the improved localization capabilities of thermal neutrons compared to X-rays when applied to lithium and/or carbon allow it to be a sensitive probe of the lithium intercalated into the graphite anode. A lithium content of x = 0.855 in LixC6 in the fully charged state was determined. For the sake of comparison, the XRD data characteristics of SOC = 0% and SOC = 100% are presented in Figure 4c,d, accordingly. The different nature of X-ray and neutron scattering entail differences in the diffraction signal from XRD and neutrons. Neutron scattering is isotope-specific, and the diffraction signal using neutrons is dominated by the contribution from the graphite anode, making carbon one of the dominating scatterers in the studied battery type. X-rays interact with the electron subsystem of the atoms, forming a tendency to scatter systematically more strongly on heavier atoms. Therefore, the XRD signal from the studied batteries is dominated by the heavier elements, e.g., Ni, Co, Fe, Cu, etc. Nevertheless, a good separation of the 001 LiC6 and 002 Lix<0.5C6 peaks from other phases and an excellent signal-to-noise ratio enables qualitative analysis of the lithium concentration in the anode from XRD. Thus, a lithium content x = 0.802 was determined in the fully charged anode LixC6 using in operando XRD. This is slightly above the average value determined from the XRDR data but can be attributed to the local character of the in operando XRD measurement, where areas with systematically low lithium content at the edges of the electrodes were not probed. From the in operando data shown in Figure 4e, one can clearly see a structural response of battery electrodes on the lithium extraction and lithiation.

4. Conclusions

A combination of electrochemical characterization with X-ray CT, ex situ synchrotron-based XRDR, in operando XRD, XRD-CT and NPD was applied to study the cycling stability and structural uniformity of cylinder-type Li-ion cells of 21700-type based on Ni-rich|C-Si chemistry. A rapid cell degradation was observed, where four well-pronounced “regimes” of cell degradation can be identified and found supplemented by anomalies in the voltage profiles. Internal resistivity of the cells was found gradually increasing with the cycle number. Besides this, a correlation with the maximum temperature on the cell surface occurring during cell discharge was found. This was directly attributed to Joule heating. Interestingly, the state-of-health also affects cell cooling, which is reflected in the time constant of cooling displaying characteristic slopes in regimes “1”, “2” and “3”. The observed effect can be attributed to heat conductivity mediated by the consequences of cell degradation, e.g., by the passivation of the electrodes, etc.
A visual inspection of negative electrodes extracted from the “fresh” battery (when fully charged) revealed a quasi-uniform lithiation of the stripe, except narrow regions at the middle “width”, top/bottom and left/right edges of the electrode, which are the regions of missing counter electrode. However, an inspection with XRDR did not show a heterogeneous behavior, which can be attributed to a surface-related character of the color change. Instead, aging resulted in strong heterogeneities of color distribution of the lithiated anode, which was supplemented by the thickness-averaged fluctuations of lithium concentrations over the electrode stripe length and width determined by XRDR. Systematically lower lithium contents were observed in the fully charged aged graphite anode, which was revealed in deviations from the “golden” state for the negative electrode in the pristine state. The ex situ observations of lithium heterogeneities in aged cells were confirmed by non-destructive XRD-CT, showing qualitatively and quantitatively a similar character of lithium distribution, which points to a systematic nature of the observed anomalies. However, the exact reason for the special shape of the lithium distribution is still unclear, as the lithium distribution is the final multiplication result of various parameters., such as current density, temperature, gas release, electrolyte wetting, losses of active electrode material and lithium inventory, etc. The special shape of “lithium isles” could be the result of a sweet spot of current distribution, temperature, pressure, etc. either alone or in combination at these cycling conditions. Their accurate description would require a consolidated experimental and theoretical effort, enabling an unambiguous description of the parameter space and accurate prediction of the lithiation behavior of lithium-ion batteries and their projected degradation.

Supplementary Materials

The following supporting information can be downloaded at: https://www.mdpi.com/article/10.3390/batteries10030068/s1, Figure S1: Exemplary image of an INR21700-48G cell built into the potentiostat and connected with a temperature sensor; Figure S2: Exemplary diffraction patterns of the XRD experiments; Figure S3: Exemplary reconstructed diffraction pattern of the XRD-CT experiment; Figure S4: Experimental capacity retention and maximal temperature recorded during cell cycling; Figure S5: Typical temperature profile and evolution of time decay constant; Figure S6: Incremental capacity plot correlated with in operando X-ray diffraction; Figure S7: Differential thermal signal from fresh and aged batteries; Figure S8: Schematic 3D reconstruction of the cell interior; Figure S9: Histograms of the lithium distribution of the XRDR experiment; Figure S10: SEM characterization of battery electrodes; Figure S11: Aging profiles of three identical INR21700-48G lithium-ion cells; Figure S12: In-plane distribution of lithium content (x in LixC6) in the graphite anode of the aged 21700-type battery represented as a heatmap; Figure S13: Rietveld refinement of a fresh cell at SOC = 100 and SOC = 0; Table S1: Overview of cells used in individual experiments; Table S2: Experimental elemental content (in at. %) for anode and cathode determined by EDX measurements.

Author Contributions

Conceptualization, J.P. and A.S. (Anatoliy Senyshyn); methodology, A.S. (Alexander Schökel) and A.S. (Anatoliy Senyshyn); software, D.P. and A.S. (Anatoliy Senyshyn); validation, A.S. (Anatoliy Senyshyn); formal analysis, D.P. and V.B.; investigation, J.P., D.P., V.B., A.S. (Alexander Schökel), A.K. and M.K.; resources, T.N. and P.M.-B.; data curation, V.B., A.S. (Alexander Schökel), C.P., A.K., M.K. and D.P.; writing—original draft preparation, D.P. and A.S. (Anatoliy Senyshyn); writing—review and editing, T.N., P.M.-B. and A.S. (Anatoliy Senyshyn); visualization, J.R.K.; supervision, P.M.-B. and A.S. (Anatoliy Senyshyn); project administration, P.M.-B. and A.S. (Anatoliy Senyshyn); funding acquisition, P.M.-B. All authors have read and agreed to the published version of the manuscript.

Funding

This research was funded by Heinz Maier-Leibnitz Zentrum.

Data Availability Statement

Dataset available on request from the authors.

Acknowledgments

Support and access to the research infrastructure of Heinz Maier-Leibnitz Zentrum and DESY are gratefully acknowledged. The authors wish to thank M.J. Mühlbauer (Karlsruhe Institute of Technology) and K. Achterhold (Technische Universität München) for the assistance with electrochemical characterization and X-ray CT; D. Garces (Centro Atomico Constituents, San Martin, Argentina) for assistance with the XRDR measurements and A. Voß (Leibnitz-Institut für Festkörper- und Werkstoffforschung Dresden) and T. Hölderle (Technische Universität München) for help with ICP-OE. We acknowledge DESY (Hamburg, Germany), a member of the Helmholtz Association HGF, for the provision of experimental facilities. Parts of this research were carried out at PETRA III using P02.1 and P24. Beamtime was allocated for proposal(s) ID 20190614 and 20180551.

Conflicts of Interest

The authors declare no conflict of interest.

References

  1. Sanguesa, J.A.; Torres-Sanz, V.; Garrido, P.; Martinez, F.J.; Marquez-Barja, J.M. A Review on Electric Vehicles: Technologies and Challenges. Smart Cities 2021, 4, 372–404. [Google Scholar] [CrossRef]
  2. Zuo, X.; Zhu, J.; Müller-Buschbaum, P.; Cheng, Y.-J. Silicon based lithium-ion battery anodes: A chronicle perspective review. Nano Energy 2017, 31, 113–143. [Google Scholar] [CrossRef]
  3. Gantenbein, S.; Schönleber, M.; Weiss, M.; Ivers-Tiffée, E. Capacity Fade in Lithium-Ion Batteries and Cyclic Aging over Various State-of-Charge Ranges. Sustainability 2019, 11, 6697. [Google Scholar] [CrossRef]
  4. Keil, P.; Schuster, S.F.; Wilhelm, J.; Travi, J.; Hauser, A.; Karl, R.C.; Jossen, A. Calendar Aging of Lithium-Ion Batteries. J. Electrochem. Soc. 2016, 163, A1872–A1880. [Google Scholar] [CrossRef]
  5. Birkl, C.R.; Roberts, M.R.; McTurk, E.; Bruce, P.G.; Howey, D.A. Degradation diagnostics for lithium ion cells. J. Power Sources 2017, 341, 373–386. [Google Scholar] [CrossRef]
  6. Shiotani, S.; Naka, T.; Morishima, M.; Yonemura, M.; Kamiyama, T.; Ishikawa, Y.; Ukyo, Y.; Uchimoto, Y.; Ogumi, Z. Degradation analysis of 18650-type lithium-ion cells by operando neutron diffraction. J. Power Sources 2016, 325, 404–409. [Google Scholar] [CrossRef]
  7. Edge, J.S.; O’Kane, S.; Prosser, R.; Kirkaldy, N.D.; Patel, A.N.; Hales, A.; Ghosh, A.; Ai, W.; Chen, J.; Yang, J.; et al. Lithium ion battery degradation: What you need to know. Phys. Chem. Chem. Phys. 2021, 23, 8200–8221. [Google Scholar] [CrossRef] [PubMed]
  8. Petz, D.; Baran, V.; Peschel, C.; Winter, M.; Nowak, S.; Hofmann, M.; Kostecki, R.; Niewa, R.; Bauer, M.; Müller-Buschbaum, P.; et al. Aging-Driven Composition and Distribution Changes of Electrolyte and Graphite Anode in 18650-Type Li-Ion Batteries. Adv. Energy Mater. 2022, 12, 2201652. [Google Scholar] [CrossRef]
  9. Campion, C.L.; Li, W.; Lucht, B.L. Thermal Decomposition of LiPF6-Based Electrolytes for Lithium-Ion Batteries. J. Electrochem. Soc. 2005, 152, A2327. [Google Scholar] [CrossRef]
  10. Mühlbauer, M.J.; Petz, D.; Baran, V.; Dolotko, O.; Hofmann, M.; Kostecki, R.; Senyshyn, A. Inhomogeneous distribution of lithium and electrolyte in aged Li-ion cylindrical cells. J. Power Sources 2020, 475, 228690. [Google Scholar] [CrossRef]
  11. Stroe, D.-I.; Swierczynski, M.; Stroe, A.-I.; Kaer, S.K.; Teodorescu, R. Lithium-ion battery power degradation modelling by electrochemical impedance spectroscopy. IET Renew. Power Gener. 2017, 11, 1136–1141. [Google Scholar] [CrossRef]
  12. Tröltzsch, U.; Kanoun, O.; Tränkler, H.-R. Characterizing aging effects of lithium ion batteries by impedance spectroscopy. Electrochim. Acta 2006, 51, 1664–1672. [Google Scholar] [CrossRef]
  13. Anseán, D.; García, V.M.; González, M.; Blanco-Viejo, C.; Viera, J.C.; Pulido, Y.F.; Sánchez, L. Lithium-Ion Battery Degradation Indicators Via Incremental Capacity Analysis. IEEE Trans. Ind. Appl. 2019, 55, 2992–3002. [Google Scholar] [CrossRef]
  14. Dubarry, M.; Truchot, C.; Liaw, B.Y. Cell degradation in commercial LiFePO4 cells with high-power and high-energy designs. J. Power Sources 2014, 258, 408–419. [Google Scholar] [CrossRef]
  15. Kleiner, K.; Melke, J.; Merz, M.; Jakes, P.; Nagel, P.; Schuppler, S.; Liebau, V.; Ehrenberg, H. Unraveling the Degradation Process of LiNi0.8Co0.15Al0.05O2 Electrodes in Commercial Lithium Ion Batteries by Electronic Structure Investigations. ACS Appl. Mater. Interfaces 2015, 7, 19589–19600. [Google Scholar] [CrossRef] [PubMed]
  16. Rikka, V.R.; Sahu, S.R.; Chatterjee, A.; Satyam, P.V.; Prakash, R.; Rao, M.S.R.; Gopalan, R.; Sundararajan, G. In Situ/ex Situ Investigations on the Formation of the Mosaic Solid Electrolyte Interface Layer on Graphite Anode for Lithium-Ion Batteries. J. Phys. Chem. C 2018, 122, 28717–28726. [Google Scholar] [CrossRef]
  17. Senyshyn, A.; Baran, V.; Mühlbauer, M.J.; Etter, M.; Schulz, M.; Tu, K.; Yang, Y. Uniformity of Flat Li-Ion Batteries Studied by Diffraction and Imaging of X-rays and Neutrons. ACS Appl. Energy Mater. 2021, 4, 3110–3117. [Google Scholar] [CrossRef]
  18. Petz, D.; Mühlbauer, M.J.; Baran, V.; Schökel, A.; Kochetov, V.; Hofmann, M.; Dyadkin, V.; Staron, P.; Vaughan, G.; Lienert, U.; et al. Lithium distribution and transfer in high-power 18650-type Li-ion cells at multiple length scales. Energy Storage Mater. 2021, 41, 546–553. [Google Scholar] [CrossRef]
  19. Petz, D.; Mühlbauer, M.J.; Schökel, A.; Achterhold, K.; Pfeiffer, F.; Pirling, T.; Hofmann, M.; Senyshyn, A. Heterogeneity of Graphite Lithiation in State-of-the-Art Cylinder-Type Li-Ion Cells. Batter. Supercaps 2021, 4, 327–335. [Google Scholar] [CrossRef]
  20. Zhang, G.; Shaffer, C.E.; Wang, C.-Y.; Rahn, C.D. In-Situ Measurement of Current Distribution in a Li-Ion Cell. J. Electrochem. Soc. 2013, 160, A610–A615. [Google Scholar] [CrossRef]
  21. Erhard, S.V.; Osswald, P.J.; Keil, P.; Höffer, E.; Haug, M.; Noel, A.; Wilhelm, J.; Rieger, B.; Schmidt, K.; Kosch, S.; et al. Simulation and Measurement of the Current Density Distribution in Lithium-Ion Batteries by a Multi-Tab Cell Approach. J. Electrochem. Soc. 2017, 164, A6324–A6333. [Google Scholar] [CrossRef]
  22. Zhang, G.; Shaffer, C.E.; Wang, C.-Y.; Rahn, C.D. Effects of Non-Uniform Current Distribution on Energy Density of Li-Ion Cells. J. Electrochem. Soc. 2013, 160, A2299–A2305. [Google Scholar] [CrossRef]
  23. Osswald, P.J.; Erhard, S.V.; Rheinfeld, A.; Rieger, B.; Hoster, H.E.; Jossen, A. Temperature dependency of state of charge inhomogeneities and their equalization in cylindrical lithium-ion cells. J. Power Sources 2016, 329, 546–552. [Google Scholar] [CrossRef]
  24. Tan, Y.; Li, Y.; Gu, Y.; Liu, W.; Fang, J.; Pan, C. Numerical Study on Heat Generation Characteristics of Charge and Discharge Cycle of the Lithium-Ion Battery. Energies 2024, 17, 178. [Google Scholar] [CrossRef]
  25. Bach, T.C.; Schuster, S.F.; Fleder, E.; Müller, J.; Brand, M.J.; Lorrmann, H.; Jossen, A.; Sextl, G. Nonlinear aging of cylindrical lithium-ion cells linked to heterogeneous compression. J. Energy Storage 2016, 5, 212–223. [Google Scholar] [CrossRef]
  26. Zhou, J.; Danilov, D.; Notten, P.H.L. A Novel Method for the In Situ Determination of Concentration Gradients in the Electrolyte of Li-Ion Batteries. Chem. A Eur. J. 2006, 12, 7125–7132. [Google Scholar] [CrossRef] [PubMed]
  27. Finegan, D.P.; Quinn, A.; Wragg, D.S.; Colclasure, A.M.; Lu, X.; Tan, C.; Heenan, T.M.M.; Jervis, R.; Brett, D.J.L.; Das, S.; et al. Spatial dynamics of lithiation and lithium plating during high-rate operation of graphite electrodes. Energy Environ. Sci. 2020, 13, 2570–2584. [Google Scholar] [CrossRef]
  28. Tardif, S.; Dufour, N.; Colin, J.-F.; Gébel, G.; Burghammer, M.; Johannes, A.; Lyonnard, S.; Chandesris, M. Combining operando X-ray experiments and modelling to understand the heterogeneous lithiation of graphite electrodes. J. Mater. Chem. A 2021, 9, 4281–4290. [Google Scholar] [CrossRef]
  29. Yao, K.P.C.; Okasinski, J.S.; Kalaga, K.; Shkrob, I.A.; Abraham, D.P. Quantifying lithium concentration gradients in the graphite electrode of Li-ion cells using operando energy dispersive X-ray diffraction. Energy Environ. Sci. 2019, 12, 656–665. [Google Scholar] [CrossRef]
  30. Xu, Y.; Hu, E.; Zhang, K.; Wang, X.; Borzenets, V.; Sun, Z.; Pianetta, P.; Yu, X.; Liu, Y.; Yang, X.-Q.; et al. In situ Visualization of State-of-Charge Heterogeneity within a LiCoO2 Particle that Evolves upon Cycling at Different Rates. ACS Energy Lett. 2017, 2, 1240–1245. [Google Scholar] [CrossRef]
  31. Popp, H.; Glanz, G.; Hamid, R.; Zhang, N.; Arrinda, M.; Ritz, S.; Cendoya, I. Benchmark, Ageing and Ante-Mortem of Sota Cylindrical Lithium-Ion Cells. In Proceedings of the Conference: Eco-Mobility 2019—14th International A3PS Conferenc, Vienna, Austria, 14–15 November 2019. [Google Scholar]
  32. Schindelin, J.; Arganda-Carreras, I.; Frise, E.; Kaynig, V.; Longair, M.; Pietzsch, T.; Preibisch, S.; Rueden, C.; Saalfeld, S.; Schmid, B.; et al. Fiji: An open-source platform for biological-image analysis. Nat. Methods 2012, 9, 676–682. [Google Scholar] [CrossRef]
  33. Petz, D.; Mühlbauer, M.J.; Baran, V.; Frost, M.; Schökel, A.; Paulmann, C.; Chen, Y.; Garcés, D.; Senyshyn, A. Lithium heterogeneities in cylinder-type Li-ion batteries—fatigue induced by cycling. J. Power Sources 2020, 448, 227466. [Google Scholar] [CrossRef]
  34. Graae, K.V.; Li, X.; Etter, M.; Schökel, A.; Norby, P. Operando space-resolved inhomogeneity in lithium diffusion across NMC and graphite electrodes in cylinder-type Li-ion batteries. J. Energy Storage 2023, 74, 109523. [Google Scholar] [CrossRef]
  35. Dippel, A.-C.; Liermann, H.-P.; Delitz, J.T.; Walter, P.; Schulte-Schrepping, H.; Seeck, O.H.; Franz, H. Beamline P02.1 at PETRA III for high-resolution and high-energy powder diffraction. J. Synchrotron Radiat. 2015, 22, 675–687. [Google Scholar] [CrossRef]
  36. Prescher, C.; Prakapenka, V.B. DIOPTAS: A program for reduction of two-dimensional X-ray diffraction data and data exploration. High Press. Res. 2015, 35, 223–230. [Google Scholar] [CrossRef]
  37. Senyshyn, A.; Mühlbauer, M.J.; Dolotko, O.; Hofmann, M.; Ehrenberg, H. Homogeneity of lithium distribution in cylinder-type Li-ion batteries. Sci. Rep. 2015, 5, 18380. [Google Scholar] [CrossRef] [PubMed]
  38. Jensen, K.M.Ø.; Yang, X.; Laveda, J.V.; Zeier, W.G.; See, K.A.; Michiel, M.D.; Melot, B.C.; Corr, S.A.; Billinge, S.J.L. X-ray Diffraction Computed Tomography for Structural Analysis of Electrode Materials in Batteries. J. Electrochem. Soc. 2015, 162, A1310. [Google Scholar] [CrossRef]
  39. Matras, D.; Ashton, T.E.; Dong, H.; Mirolo, M.; Martens, I.; Drnec, J.; Darr, J.A.; Quinn, P.D.; Jacques, S.D.M.; Beale, A.M.; et al. Emerging chemical heterogeneities in a commercial 18650 NCA Li-ion battery during early cycling revealed by synchrotron X-ray diffraction tomography. J. Power Sources 2022, 539, 231589. [Google Scholar] [CrossRef]
  40. Vamvakeros, A.; Matras, D.; Ashton, T.E.; Coelho, A.A.; Dong, H.; Bauer, D.; Odarchenko, Y.; Price, S.W.T.; Butler, K.T.; Gutowski, O.; et al. Cycling Rate-Induced Spatially-Resolved Heterogeneities in Commercial Cylindrical Li-Ion Batteries. Small Methods 2021, 5, 2100512. [Google Scholar] [CrossRef]
  41. Hoelzel, M.; Senyshyn, A.; Gilles, R.; Boysen, H.; Fuess, H. Scientific Review: The Structure Powder Diffractometer SPODI. Neutron News 2007, 18, 23–26. [Google Scholar] [CrossRef]
  42. Roisnel, T.; Rodríquez-Carvajal, J. WinPLOTR: A Windows Tool for Powder Diffraction Pattern Analysis. Mater. Sci. Forum 2001, 378–381, 118–123. [Google Scholar] [CrossRef]
  43. Didier, C.; Pang, W.K.; Guo, Z.; Schmid, S.; Peterson, V.K. Phase Evolution and Intermittent Disorder in Electrochemically Lithiated Graphite Determined Using in Operando Neutron Diffraction. Chem. Mater. 2020, 32, 2518–2531. [Google Scholar] [CrossRef]
  44. Olesik, J.W. Elemental analysis using ICP-OES and ICP/MS. Anal. Chem. 1991, 63, 12A–21A. [Google Scholar] [CrossRef]
  45. Hölderle, T.; Monchak, M.; Baran, V.; Dolotko, O.; Bette, S.; Mikhailova, D.; Voss, A.; Avdeev, M.; Ehrenberg, H.; Müller-Buschbaum, P.; et al. The structural behavior of electrochemically delithiated LixNi0.8Co0.15Al0.05O2 (x < 1) battery cathodes. J. Power Sources 2023, 564, 232799. [Google Scholar] [CrossRef]
  46. Lin, X.; Park, J.; Liu, L.; Lee, Y.; Sastry, A.M.; Lu, W. A Comprehensive Capacity Fade Model and Analysis for Li-Ion Batteries. J. Electrochem. Soc. 2013, 160, A1701. [Google Scholar] [CrossRef]
  47. Dotoli, M.; Milo, E.; Giuliano, M.; Tiozzo, A.; Baricco, M.; Nervi, C.; Ercole, M.; Sgroi, M.F. Development of an Innovative Procedure for Lithium Plating Limitation and Characterization of 18650 Cycle Aged Cells for DCFC Automotive Applications. Batteries 2022, 8, 88. [Google Scholar] [CrossRef]
  48. Jung, R.; Metzger, M.; Maglia, F.; Stinner, C.; Gasteiger, H.A. Oxygen Release and Its Effect on the Cycling Stability of LiNixMnyCozO2 (NMC) Cathode Materials for Li-Ion Batteries. J. Electrochem. Soc. 2017, 164, A1361. [Google Scholar] [CrossRef]
  49. Fly, A.; Chen, R. Rate dependency of incremental capacity analysis (dQ/dV) as a diagnostic tool for lithium-ion batteries. J. Energy Storage 2020, 29, 101329. [Google Scholar] [CrossRef]
  50. Darma, M.S.D.; Zhu, J.; Yan, P.; Zheng, C.; Mühlbauer, M.J.; Sørensen, D.R.; Indris, S.; Bergfeldt, T.; Das, C.; Heere, M.; et al. Managing Life Span of High-Energy LiNi0.88Co0.11Al0.01O2|C–Si Li-Ion Batteries. ACS Appl. Energy Mater. 2021, 4, 9982–10002. [Google Scholar] [CrossRef]
  51. Kirkaldy, N.; Samieian, M.A.; Offer, G.J.; Marinescu, M.; Patel, Y. Lithium-Ion Battery Degradation: Measuring Rapid Loss of Active Silicon in Silicon–Graphite Composite Electrodes. ACS Appl. Energy Mater. 2022, 5, 13367–13376. [Google Scholar] [CrossRef]
  52. Anseán, D.; Baure, G.; González, M.; Cameán, I.; García, A.B.; Dubarry, M. Mechanistic investigation of silicon-graphite/LiNi0.8Mn0.1Co0.1O2 commercial cells for non-intrusive diagnosis and prognosis. J. Power Sources 2020, 459, 227882. [Google Scholar] [CrossRef]
  53. Moyassari, E.; Streck, L.; Paul, N.; Trunk, M.; Neagu, R.; Chang, C.-C.; Hou, S.-C.; Märkisch, B.; Gilles, R.; Jossen, A. Impact of Silicon Content within Silicon-Graphite Anodes on Performance and Li Concentration Profiles of Li-Ion Cells using Neutron Depth Profiling. J. Electrochem. Soc. 2021, 168, 020519. [Google Scholar] [CrossRef]
  54. Ruo, W.; Haonan, W.; Huajun, Z.; Mingman, Y.; Zhongbo, L.; Guangzhao, Z.; Tong, Z.; Yunxian, Q.; Jun, W.; Iseult, L.; et al. Highly fluorinated co-solvent enabling ether electrolyte for high-voltage lithium ion batteries with graphite anode. Energy Mater. 2023, 3, 300040. [Google Scholar] [CrossRef]
  55. Harris, S.J.; Timmons, A.; Baker, D.R.; Monroe, C. Direct in situ measurements of Li transport in Li-ion battery negative electrodes. Chem. Phys. Lett. 2010, 485, 265–274. [Google Scholar] [CrossRef]
  56. Sieg, J.; Storch, M.; Fath, J.; Nuhic, A.; Bandlow, J.; Spier, B.; Sauer, D.U. Local degradation and differential voltage analysis of aged lithium-ion pouch cells. J. Energy Storage 2020, 30, 101582. [Google Scholar] [CrossRef]
  57. Klett, M.; Eriksson, R.; Groot, J.; Svens, P.; Ciosek Högström, K.; Lindström, R.W.; Berg, H.; Gustafson, T.; Lindbergh, G.; Edström, K. Non-uniform aging of cycled commercial LiFePO4//graphite cylindrical cells revealed by post-mortem analysis. J. Power Sources 2014, 257, 126–137. [Google Scholar] [CrossRef]
  58. Burow, D.; Sergeeva, K.; Calles, S.; Schorb, K.; Börger, A.; Roth, C.; Heitjans, P. Inhomogeneous degradation of graphite anodes in automotive lithium ion batteries under low-temperature pulse cycling conditions. J. Power Sources 2016, 307, 806–814. [Google Scholar] [CrossRef]
  59. Ghanbari, N.; Waldmann, T.; Kasper, M.; Axmann, P.; Wohlfahrt-Mehrens, M. Inhomogeneous Degradation of Graphite Anodes in Li-Ion Cells: A Postmortem Study Using Glow Discharge Optical Emission Spectroscopy (GD-OES). J. Phys. Chem. C 2016, 120, 22225–22234. [Google Scholar] [CrossRef]
  60. Ecker, M.; Shafiei Sabet, P.; Sauer, D.U. Influence of operational condition on lithium plating for commercial lithium-ion batteries—Electrochemical experiments and post-mortem-analysis. Appl. Energy 2017, 206, 934–946. [Google Scholar] [CrossRef]
  61. Lewerenz, M.; Warnecke, A.; Sauer, D.U. Post-mortem analysis on LiFePO4|Graphite cells describing the evolution & composition of covering layer on anode and their impact on cell performance. J. Power Sources 2017, 369, 122–132. [Google Scholar] [CrossRef]
  62. Ying, S.; Zhou, J.; Jin, L.; Yemin, M.; Xuejie, H. Evaluation of the electrochemical and expansion performances of the Sn-Si/graphite composite electrode for the industrial use. Energy Mater. 2022, 2, 200004. [Google Scholar] [CrossRef]
  63. Popp, H.; Zhang, N.; Jahn, M.; Arrinda, M.; Ritz, S.; Faber, M.; Sauer, D.U.; Azais, P.; Cendoya, I. Ante-mortem analysis, electrical, thermal, and ageing testing of state-of-the-art cylindrical lithium-ion cells. E I Elektrotechnik Und Informationstechnik 2020, 137, 169–176. [Google Scholar] [CrossRef]
Figure 1. Evolution of remaining cell capacity vs. cycle number (a); Discharge voltage profile vs. cell fatigue (b). Numbers 1–4 correspond to the different regimes observed during cell aging; Maximum recorded temperature upon discharge vs. estimated cell resistance (c). The lines are guides for the eyes.
Batteries 10 00068 g001
Figure 2. Surface color and lithium distribution in the lithiated graphite anode extracted from cylindrical 21700-type LIBs in the fresh and aged state ((a,b): fresh; (c,d): aged). Extracted graphite anodes (SOC = 100%) in (a) fresh and (c) aged state (dashed line illustrates the edges of individual images stitched together). Mean (thickness averaged) lithium concentration in the lithiated graphite anode calculated from the XRD measurements in (b) fresh and (d) aged state represented in false colors. The 1D dimensional plots on top and right represent the average lithium content over electrode stripe width (cell height) and length, respectively. Rectangles in (c) marked by 1 and 2 indicate the positions at which samples for SEM measurements were taken.
Batteries 10 00068 g002
Figure 3. In-plane distribution of lithium content (x in LixC6) in the graphite anode of the aged 21700-type battery represented by false colors (a) with an inset corresponding to the configuration of characterized planes. Calculated plane-average lithium content x in LixC6 (black dots) with standard deviation (grey area) (b).
Batteries 10 00068 g003
Figure 4. Diffraction data collected with neutrons ( λ = 1.548   Å ) at fully discharged (a) (SOC = 0%) and fully charged (b) ((SOC = 100%) state and corresponding XRD ( λ = 0.20714   Å ) patterns (c) (SOC = 0%) and (d) ((SOC = 100%). Selected 2θ region of XRD patterns in false colors (e,middle,bottom) illustrating the evolution of 003 reflection of the cathode (e,middle) and signals corresponding to the first order 00l –type reflections form lithiated graphite (e,bottom) during in operando data collection vs. cell capacity (e,top).
Batteries 10 00068 g004
Disclaimer/Publisher’s Note: The statements, opinions and data contained in all publications are solely those of the individual author(s) and contributor(s) and not of MDPI and/or the editor(s). MDPI and/or the editor(s) disclaim responsibility for any injury to people or property resulting from any ideas, methods, instructions or products referred to in the content.

