Article

Battery Energy Storage System Performance in Providing Various Electricity Market Services

1
Energy Department, Politecnico di Milano, 20156 Milano, Italy
2
Whysol-E, 20123 Milano, Italy
*
Author to whom correspondence should be addressed.
Batteries 2024, 10(3), 69; https://doi.org/10.3390/batteries10030069
Submission received: 31 December 2023 / Revised: 9 February 2024 / Accepted: 15 February 2024 / Published: 20 February 2024
(This article belongs to the Section Battery Modelling, Simulation, Management and Application)

Abstract

:
The Battery Energy Storage System (BESS) is one of the possible solutions to overcoming the non-programmability associated with these energy sources. The capabilities of BESSs to store a consistent amount of energy and to behave as a load by releasing it ensures an essential source of flexibility to the power system. Nevertheless, BESSs have some drawbacks that pose limitations to their utilization. Indeed, effectively managing the stored and released energy is crucial, considering the degradation of performance associated with these systems over time. The substantial capital expenditure (CAPEX) required to install these systems represents a current constraint, impeding their broader adoption. This work evaluates a techno-economic analysis of a 2MW/2MWh BESS providing multiple services, namely participating in capacity and balance markets. The analysis is based on a BESS model implemented in SIMULINK, adopting online data gathered from a Lithium Iron Phosphate (LFP) battery facility. The model evaluates the auxiliary power consumption, state-of-charge (SoC), state of health (SoH), and the round-trip efficiency (RTE) of the overall system. The analysis is based on three price profiles: 2019 (Business-As-Usual), 2020 (COVID-19), and 2022 (Gas Crisis). Furthermore, this work conducts a case study to analyze the behavior of the BESS. It entails a sensitivity analysis, specifically evaluating the influence of CAPEX and upward bid price on the economic viability of the project. The results show a strong relation between the CAPEX variation and the Internal Rate of Return (IRR) of the project.

1. Introduction

Renewable energy has become a paramount focus for European Union (EU) countries since it plays a vital role in achieving the Greenhouse Gas (GHG) targets established after the Paris Agreement. The European Commission presented the “Clean Energy for all Europeans package” in 2016, which was politically agreed by the European Council and the European Parliament in 2019. The EU countries reformed their energy policy framework to reduce greenhouse gas emissions and use cleaner energy to comply with the objectives of the agreement. Indeed, the decarbonization of the energy sector is one of the main actions to reduce global warming. The package discussed different topics, such as energy performance in buildings, energy efficiency, and electricity market design. However, the most important aspect was related to renewable energy. In particular, the package set an objective of reaching a 32% share of renewable energy in the overall energy production in 2030 and net-zero carbon emissions by 2050 [1]. Therefore, the energy system is currently undergoing a transition from conventional fossil-fuel-based generators towards the adoption of Renewable Energy Sources (RES). This transition involves the shift towards more local and distributed energy generation.
Nonetheless, the penetration of RES into the distribution network requires a series of actions in the planning and operation of the grid to ensure the optimal utilization of these sources. Moreover, it is of paramount importance to assess the challenges associated with the integration of RES into the electric power system.
Wind and Photovoltaics (PVs) are non-programmable and volatile energy sources where the energy supply is intermittent and unpredictable, depending on the availability of wind and the sun, making these technologies unreliable for energy supply [2]. Furthermore, they can affect the stability, security, reliability, and power quality of the electric power system due to their variability of supply and increased fluctuations in electricity provision. Therefore, with their increased share in the renewable energy installed with respect to other renewable sources, balancing the electricity supply and demand becomes more needed and challenging [3]. Consequently, the power system requires new sources of flexibility to ensure electricity supply reliability and continuity.
Battery Energy Storage Systems (BESSs) are considered a viable solution that can play a vital role in addressing these challenges given their high power capacity in relation to energy capacity [4], high ramping capability [5], and fast response [6]. In addition, their production costs have been significantly reduced [7]. BESSs can play a vital role in the integration of PVs and wind energy by providing storage capacity and ancillary services [8]. Generally, the services provided by BESSs can be divided into three main categories: applications related to the management of the Electric Power System (EPS) operations, applications related to fast response provision in the context of changes in the grid to enhance its stability and reliability, and applications related to the enhancement of the power quality [9].
The scope of this work is to perform a techno-economic evaluation of the provision of multiple services by a Lithium Iron Phosphate (LFP) storage facility. The cathode of the battery under investigation consists of LFP, while the anode comprises graphite. Moreover, the electrolyte utilized in this configuration is organic. In particular, this work aims to understand the opportunities related to using this BESS in the Italian Electricity Market, providing mainly two services: tertiary reserve and capacity market based on the price profile of three main years, 2019, 2020, and 2022. The year 2019 is considered to be a Business-As-Usual (BAU) year, the year 2020 is characterized by low demand and prices due to COVID-19, and the year 2022 is characterized by high energy prices due to the energy crisis caused by the Russia–Ukrain war. To achieve this goal, three main phases are performed:
  • Modeling of the capacity and the balancing markets defining the power setpoints required by the BESS.
  • Modeling the BESS based on online data collected from a currently operating LFP battery facility to evaluate the round-trip efficiency (RTE), auxiliary consumption, state-of-charge (SoC), and state of health (SoH).
  • Techno-economic analysis for the provision of multiple services to evaluate the economic viability of the project.

2. Literature Review

It is of paramount importance to highlight the different components of the BESS as they should be considered when modeling its behavior. Electrochemical cells are the core elements of batteries, and they can be connected in series or in parallel to form a battery pack. However, the other components of the BESS ensure its reliable operation and connection to the electric grid. These components are identified and summarized as follows:
  • Battery Pack: The battery pack is made up of a group of cells that can be connected in series or in parallel.
  • Battery Monitoring System (BMS): The BMS is responsible for checking the voltage between each cell and the voltage with respect to the ground to ensure that the battery is operating within the nominal area. It manages the charging and discharging of each cell to avoid the over/under voltage of the cells. Moreover, the temperature, the current, the SoC, and the SoH can also be monitored using the BMS.
  • Auxiliaries: The auxiliaries include the Heat Ventilation Air Conditioning (HVAC) system, Supervisory Control and Data Acquisition (SCADA), motorized switches, fire alarm systems, and control and monitoring systems. They have a vital role in the operation of the BESS by ensuring the proper operation conditions for the system.
  • DC/AC Inverter: The inverter allows the connection of the battery to the AC grid. It plays a vital role in the economics of the BESS. Moreover, the inverter’s efficiency is generally high.
  • Programmable Logic Controller (PLC): The PLC is dedicated to the coordination of the BESS and the precise regulation of energy flows with the electrical grid.
  • Transformer: The transformer is used to raise the voltage to a suitable voltage level for the connection of the battery to the grid.

2.1. BESS Models and Case Studies from the Literature

Fully considering all the components of the BESS is crucial when modeling its operation. Indeed, the inclusion of the auxiliaries in the model can affect the accuracy of the model. The auxiliary system’s operation directly affects the performance of the BESS as, for example, the operation of the HVAC system can directly affect the cell temperature, which is an important factor for BESS aging. Moreover, the energy consumed by the auxiliary system cannot be neglected as this influences the efficiency of the system. Rancilio et al. investigated in [10] the effect of modeling the auxiliaries’ consumption on the efficiency calculation. They simulated the BESS performance in providing frequency regulations. They found out that excluding the auxiliary consumption can increase the efficiency of the overall system, but this can lead to an error of up to 10%.
Despite these facts, most of the studies found in the literature focus on modeling the electrochemical behavior of the cell [11,12], neglecting other aspects such as the auxiliary consumption. Therefore, there is a gap in the literature when it comes to modeling the overall behavior of BESSs. Hutchinson et al. [13] presented an analytical model for a BESS in MATLAB/Simulink, and they verified the accuracy of the model based on an existing 2 MW installed battery. Moreover, they used the Root Mean Square Error (RMSE) to check the accuracy of the model. They achieved an RMSE of 1.29% and 1.05% when comparing the SoC estimated by the model with measurements from the installed BESS. However, they assumed fixed charging and discharging efficiencies and did not model the auxiliary loads. These crucial assumptions can dramatically affect the results obtained.
In [14], Lange et al. developed a model to simulate the behavior of the BESS when providing peak shaving. The model developed uses Look-Up Tables (LUT) to model the efficiency of converters and the capability limits of the BESS. In their model, the capacity of the battery system, charging power, discharging power, and safety offset were optimized. Although this model considers the converters, the auxiliaries are not modeled, which can affect the accuracy of the results. Furthermore, it is important to highlight that the aging model was not incorporated into the study’s framework for the purpose of monitoring the battery’s health.
On the other hand, several researchers have modeled the overall behavior of the BESS, taking into account the converters and auxiliary power consumption. Rancilio et al., in [15], developed, verified, and validated an empirical model for the technical analysis of grid-connected Lithium Nickle Manganese Cobalt (L-NMC) BESS performance. They defined a test protocol based on standards and charging/discharging experiments. Moreover, the model includes three main parts. The first part includes the battery cells and the power conversion system (PCS), consisting of the inverter and the transformer. The second element of the model is the BMS, which defines the limits of operation based on the pre-defined capability curves. The last element of the model is the auxiliary loads, including the HVAC, alarms, and SCADA. The RTE was modeled as a function of the SoC (%) and the power set points (p.u.), while the auxiliaries were correlated with the power set points (p.u.) and temperature (°C). Conversely, the paper does not explore cell aging or include an economic analysis.
Grimaldi et al., in [16], developed a data-driven empirical model to describe the aging and the energy performance of a utility-scale Li-ion battery. The novelty of the model is that data were collected from a real-world operating BESS. The authors adopted the methodology described in [15] to develop their model. However, it is noteworthy to mention that the correlation between the RTE and the SoC is not presented in this model. On the other hand, the auxiliary power consumption was correlated with the temperature (°C) and the AC power set points (p.u.). The aging model is based on semi-empirical equations collected from the literature to estimate the calendar aging, the cycle aging, and the SoH. The authors evaluated different Energy Performance Indicators (EPIs) by providing three main services: Primary Frequency Control (PFC), Secondary Voltage Regulation (SVR), and PV Unbalances Reduction. However, a business model has to be incorporated into the model to evaluate a techno-economic analysis for the BESS.

2.2. Utility-Scale BESS and Services Provision

2.2.1. The Italian Electricity Market

The structure of the Italian Electricity Market, assumed as the focus of this paper, is based on Decree No. 79 of 16 March, 1999 [17]. It is based on two different markets: The Forward Electricity Market (Mercato a Termine dell’Energia) and the Spot Electricity Market (Mercato a Pronti dell’Energia). The Forward Electricity Market is the market where energy trading is based on predetermined prices and terms for future delivery. On the other hand, the Spot Electricity Market is based on the supply and demand curves, which define the market clearing price and quantity. The Italian Spot Electricity Market can be divided into the following sessions:
  • Day-Ahead Market (DAM)
  • Intra-Day Market (IM)
  • Ancillary Services Market (ASM)
    Ex-ante
    Balancing Market (BM)
The Day-Ahead Market, Mercato del Giorno Prima (MGP), is the first market session of the electricity market. It is the auction market where a large amount of energy is generally traded. This market closes at noon on the day before delivery (D-1). Demands can be satisfied by bidding in the electricity pool or through bilateral contracts.
In the Intra-day Market, Mercato Infragiornaliero (MI), the market participants are allowed to adjust their bids defined in the MGP. Opposite to MGP, less energy is usually traded in the MI. It is divided into three MI-A auction sessions and one MI-XBID continuous trading session. Additionally, the submitted supply offer and demand bids are evaluated based on the same criterion defined in the day-ahead market. However, the accepted demand bids are paid at the zonal price.
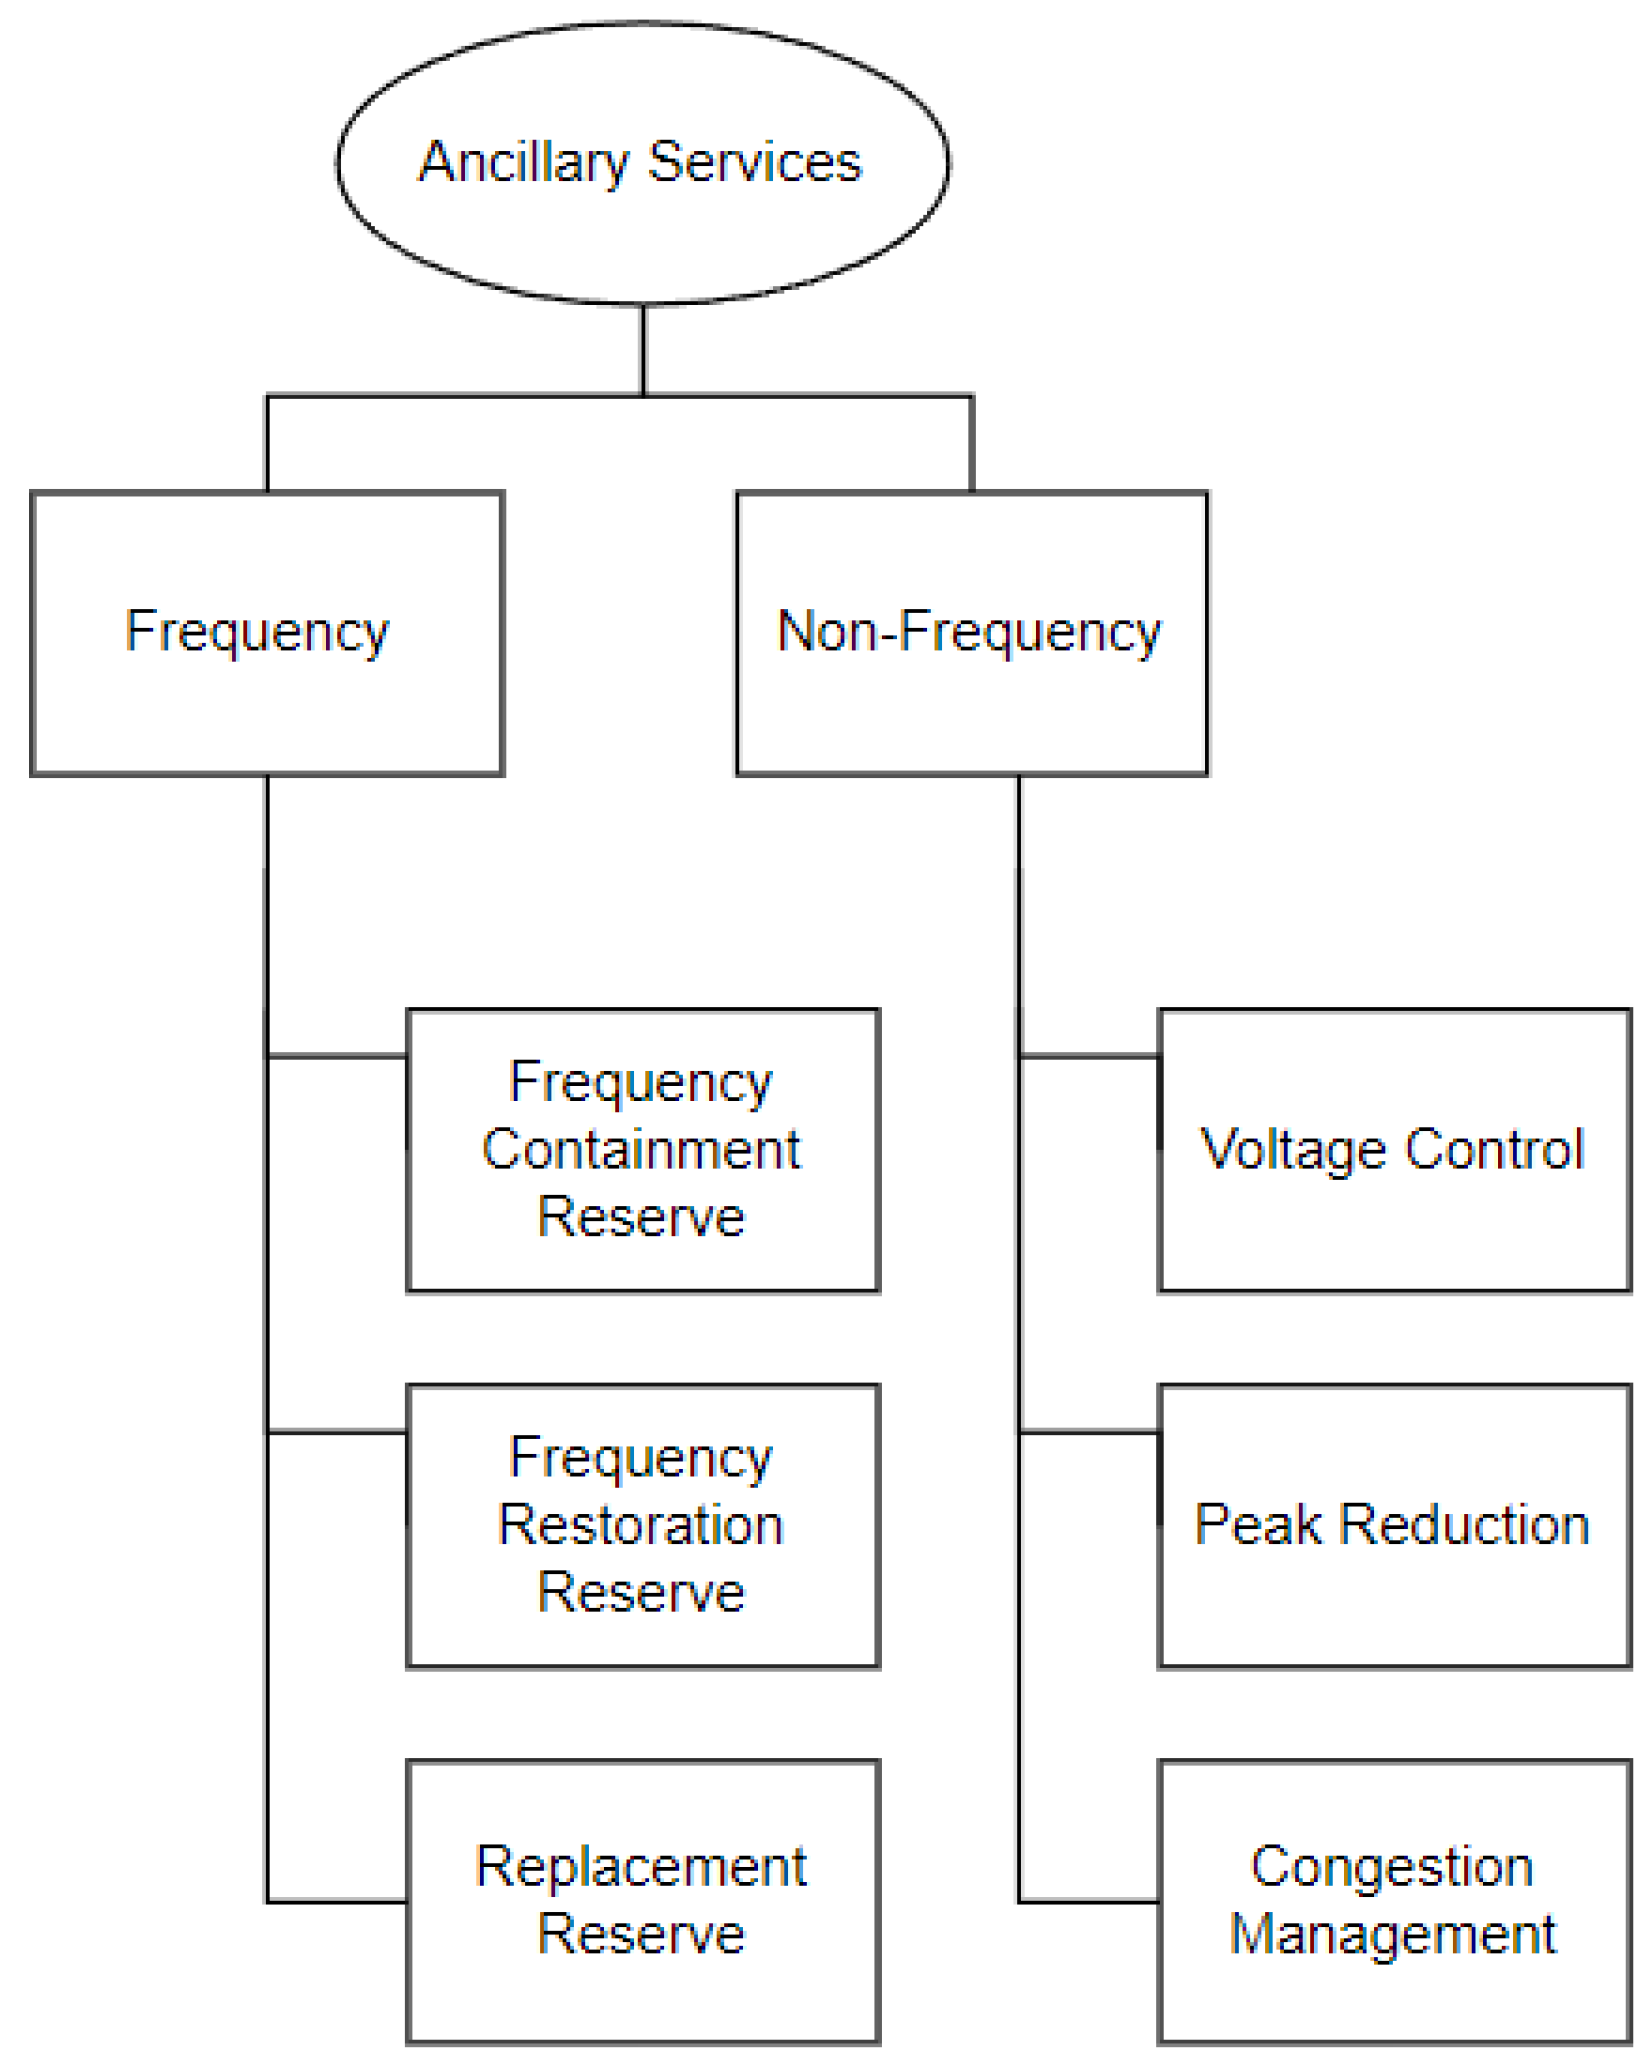
In the Ancillary Services Market, Mercato per il Servizio di Dispacciamento (MSD), the Italian Transmission System Operator (TSO), Terna S.p.A., is the only buyer. It secures the energy reserves and the resources needed to maintain the real-time balance of the grid and maintain the system’s stability and security. Moreover, it is a pay-as-bid market where accepted bids are paid at the offered price. It is noteworthy to mention that, in Italy, not all ancillary services are traded based on organized market sessions. As illustrated in Figure 1, the services traded in the MSD can be classified as frequency and non-frequency ancillary services [18].
The ancillary services designed to maintain the power system’s frequency and the balance between generation and demand are summarized and discussed below:
  • Frequency Containment Reserve: The Frequency Containment Reserve (FCR), also known as Primary Frequency Control, is the first action needed in the context of imbalances. The principles of FCR provision are defined in the grid code Annex A15 published by TERNA [19]. In particular, this service is automatic, activated locally, fast, and aims to stabilize the frequency value in the event of load generation imbalances. This service must be activated within 30 s starting from the occurrence of the imbalance [20]. As this service is required by the TSO of each EU member state, the reserve imposed on each state is defined according to the European Network of Transmission System Operators for Electricity (ENTSO-E) prescriptions.
  • Frequency Restoration Reserve: The Frequency Restoration Reserve (FRR) is divided into automatic (aFRR) and manual (mFRR). The aFRR, also known as Secondary Frequency Control (SFC), is an automatic regulation that aims to restore the frequency at the nominal value of 50 Hz. The provision of aFRR is controlled centrally based on a regulating signal received by the speed regulators of the units participating in this service [21]. Moreover, the so-called Automatic Generation Control (AGC) is the applied control for the generators [21]. AGC uses the area control error (ACE) as evidence of any disturbance or imbalance in the system [22].
  • Replacement Reserve: The Replacement Reserve (RR) must be fully delivered within 120 min, and it is usually used to solve problems related to shifts in demand, variable injection from RES due to forecast errors, and the long faults of some generating units [23]. The RR can be divided into upward and downward RR. The upward RR corresponds to the cases where the injection is increased or the consumptions are reduced. On the contrary, the downward reserve corresponds to increasing consumption or reducing generation. In this context, the Trans European Replacement Reserve Exchange (TERRE) project was approved by ENTSO-E in 2016 as the European platform for the exchange of balancing resources from replacement reserves [24]. The exchange platform is based on the LIBRA solution in which the balancing energy bids are optimized and allocated to the members of the TERRE project in order to meet their needs.
To contextualize the market size, it is essential to note that within the Italian electricity markets significant volumes of energy are traded. Specifically, the volumes amount to 290 terawatt-hours (TWh) in the DAM, 26 TWh in the IM as of 2022, and 11.2 TWh in the ASM as of 2023, with 4 TWh in the ASM ex-ante and 7.2 TWh in the BM [25,26].

2.2.2. The Evolution of Ancillary Services Market for BESS Participation

Traditionally, the ancillary services have only been provided by conventional large-scale power plants such as coal, natural gas, nuclear, and hydro power plants [27]. Given the increase of variable RES share and the decommissioning of fossil-fuel-based power plants, maintaining the stability and security of the power system is likely to become more challenging for the grid and regulators [28]. Therefore, the centralized approach that has been followed in providing the ancillary services is becoming outdated, and the electricity market design should be revised to adapt to the integration of the new flexibility sources, the Distributed Energy Resources (DER) such as the BESS.
The Balancing Service Provider (BSP), as defined by [29], is the market participant that owns units or an aggregate of units capable of providing balancing services. On the other hand, Balancing Responsible Parties (BRP) are the market participants responsible for the injection and withdrawal programs of their generating units as well as their imbalances. Imbalances are defined as the difference between the scheduled energy volume and the final one within the imbalance settlement period, a time unit within which the imbalances are calculated. Therefore, the BSP can aggregate a group of DERs for the provision of balancing services, given some terms and conditions, in a scheduling area [29]. These DERs can include demand facilities, Energy Storage Systems (ESS), and power generation facilities.
Given the new paradigm, many countries are adapting their regulations and legislations to facilitate the integration of DER into electricity markets. Rancilio et al. discussed in [30] the trends, features, and trade-offs of the evolution of the Ancillary Services Market to cope with the integration of DER.
In Italy, only conventional power plants with power > 10 MVA, programmable, and connected to the transmission network were allowed to provide the ancillary services as defined by the Italian Transmission System Operator (TERNA) in the Italian grid code. However, in 2017 a series of pilot projects were initiated by the Italian National Regulatory Authority (NRA), ARERA, to gradually evolve the provision of ancillary services by Non-Programmable Renewable Energy Sources (NP-RES). Different pilot projects have been activated with the purpose of investigating the possibility of Enabled Virtual Units (Unità Virtuali Abilitate: UVA) to participate in the ancillary services provision [31]. The ancillary services allowed to be provided by DERs were limited to mFRR and RR, with a minimum bid size of 1 MW [32]. Initially, the remuneration in the UVAM pilot project was based on a combination of energy remuneration expressed in EUR/MWh based on the energy activated in the ASM and a capacity remuneration expressed in EUR/MW based on the capacity available for the regulation [33]. In 2021, another pilot project expanded the services that the units mentioned before are allowed to offer to include the aFRR as well. In addition, the Fast Frequency Response (FFR) was introduced as a new service to be provided with a minimum bid size of 5 MW.

2.2.3. Services Provided by BESSs and Revenue Stacking

BESSs can be aggregated with other plants and participate in the provision of grid services. They are attractive energy sources, as they are capable of offering a wide range of applications such as arbitrage, ancillary services, and the integration of intermittent RES. However, a BESS is characterized by high capital costs [34]. One of the effective ways of maximizing the profitability of the BESS is through revenue stacking.
BESSs are widely used in different applications. These services can be categorized into power-based services and energy-based services. Power-based services require a high power for a limited amount of time, whereas energy-based services require a limited amount of power for an extended amount of time [35].
As previously mentioned, the increasing penetration of intermittent RES ensures the necessity of designing fast and more precise frequency control. In particular, the inertia of the power system decreased due to the penetration of inverter-based energy sources affecting the robustness of the grid towards imbalances. FFR is a possible solution for this problem. The specific requirements to provide this service can vary between countries, but generally it is based on the provision of active power within a few seconds as a response to an imbalance [36]. In Italy, TERNA proposed Fast Reserve (FR) as a new frequency control service in a pilot project launched in 2021. It is not traded in the ASM, but it is contracted to the energy sources for 5 years. The participating units provide power within 1 s. Currently, only energy sources with qualified power in the range of 5–25 MW are allowed to participate in this service. The provision of FR is based on a droop curve [37]. The units participating should provide the qualified power in response to the frequency deviations in 30 s. In case the frequency deviations have not exceeded the limits set by “level #2”, the fade-out can be activated, and the unit decreases the output power gradually in 300 s. On the other hand, if the highlighted frequency limits are violated, the unit must provide the full qualified power for at least 15 min.
As highlighted previously, FCR is the first control action taken in the context of frequency deviations. It is the process of supplying active power due to frequency fluctuations that occur due to the imbalance between generation and demand. Several studies in the literature have proven the effectiveness of BESSs in providing this service. Amin et al. [38] compared the provision of FCR by synchronous generators and a BESS using mathematical equations of governors and turbines. The results obtained showed that BESSs can provide a faster and better response to frequency deviations than synchronous generators. In [39], Arrigo et al. analyzed the impact of FCR provided by a BESS on the transient response of the grid. The authors confirmed in the conclusion the positive impact of the BESS on the reduction of the frequency variations, given a proper control strategy and enough installed capacity. The effectiveness of the provision of the service was evaluated based on an effectiveness index. Moreover, a comparison was conducted regarding the provision of the FCR by conventional generators and BESSs. They found that if the inertia of the network decreases, the BESSs are more effective in providing the service. Additionally, Datta analyzed, in [40], the impact of a BESS in providing FCR to enhance the penetration of wind power plants using a model implemented in DigSILENT. It was shown that BESSs can play a vital role in reducing oscillations after disturbances and can support the penetration of RES by absorbing excess energy and providing deficit energy. Secca et al. [41] compared the provision of FCR in three major European Countries: the Netherlands, Germany, and the UK in terms of lifetime and economics, taking into account the remuneration schemes in each country. They found that the provision of FCR by BESSs is economically viable in all the analyzed countries given the remunerations in each country. Moreover, given the remuneration schemes in the Netherlands, results showed that the Net Present Value (NPV) of BESSs providing FCR there can be 47% and 76% higher than in Germany and the UK.
However, BESSs should respect the technical requirements defined by TSOs for the provision of FCR. Therefore, it is crucial to implement SoC management strategies to ensure the availability and service continuity of BESSs. In particular, these strategies ensure that the SoC is set at a value within the maximum and minimum thresholds set by the BMS. In case of reaching the pre-defined thresholds, the BESS can be saturated, and the defined power setpoint cannot be respected. In particular, not respecting the power setpoint can lead to penalties.
Energy arbitrage involves buying electricity when prices are low and selling it when prices are high. In other words, the BESS is charged during low demand times, resulting in low prices, and discharged during high demand times, resulting in an increase in the prices. It is an energy-based service that requires the BESS to store energy for long durations [2]. In general, energy is traded in the day-ahead market. For energy arbitrage, it is of paramount importance to forecast the future behavior of the market to maximize the amount of profits.
Ponnaganti et al. assessed in [42] the potential revenues from the integration of energy storage systems with wind farms, taking advantage of the difference in prices in the DAM, comparing the profits generated by BESSs and the Thermal Energy Storage System (TESS). The DAM’s prices were predicted based on a feed-forward neural network forecasting algorithm. They adopted an analytical model to describe the charging and discharging processes of the BESS. The revenues generated were higher when the energy storage system is integrated with the wind farm. Additionally, they found that BESS is better than TESS in utilizing wind energy but worse in terms of operating and maintenance costs.
Penaranda et al. [43] compared different arbitrage strategies to determine the best one that could maximize the revenues generated in the Colombian electricity market by adopting a Mixed Integer Linear Programming (MILP) optimization problem. They proved that providing energy arbitrage only could result in negative economics, represented by negative NPV. Therefore, it is better to provide other services associated with the energy arbitrage.
Given the typically high capital costs associated with BESSs, maximizing their utilization through the provision of multiple services becomes advantageous, allowing for revenue stacking and the full exploitation of the installed battery capacity. In [44], the authors proposed the provision of a second service to generate additional revenues. The provision of several services is generally referred to as service stacking. In general, service stacking can be categorized into three different types [45]:
  • Sequential Stacking: During the sequential stacking, the BESS can be used to provide multiple services sequentially. In particular, the full capacity of the BESS is dedicated to a service for a defined time stamp and then switched to another application over time.
  • Parallel Stacking: During parallel stacking, the capacity of the BESS is divided between different services. Moreover, the capacity allocated for each service remains constant over time.
  • Dynamic Stacking: During dynamic stacking, multiple services are provided simultaneously while varying the capacity allocated for each service with time. This method is considered the most flexible, but it requires a complex Energy Management System (EMS) to be implemented.
Englberger et al. [46] compared the annual profitability of stacking methods by evaluating three scenarios of stacking services: Peak Shaving (PS) + FCR, PS + Spot Market Trading (SMT), and PS + FCR + SMT. Moreover, they compared the profitability of the dynamic and sequential strategies as a function of the inverter switching time. The study revealed that dynamic stacking has the highest profitability compared to the others in the three scenarios evaluated. Sequential stacking is more profitable than the parallel strategy, indicating that sequential switching between services is more effective than allocating fixed capacities among them.
In [37], Rancilio et al. developed a BESS model to evaluate a techno-economic analysis of the provision of two sequentially stacked ancillary services: FR and RR. The analysis pointed out that the efficiency and the Internal Rate of Return (IRR) improved with revenue stacking.
Spiller et al. developed, in [47], a procedure to size a hybrid system of BESSs and RES while evaluating the economic performance of the provision of multiple services. The different services evaluated were energy arbitrage, capacity market, mFRR, and FFR. The study compared different stacking scenarios by combining different services. The results obtained highlighted the importance of revenue stacking to enhance the economics of the project. In particular, it has been pointed out that the CAPEX covered and the IRR increased while stacking more services without increasing the number of Full Cycle Equivalent (FCE) performed by the BESS.
Finally, Hameed et al. [48] investigated the participation of BESS in the Nordic ancillary markets, with a focus on business aspects by analyzing the market prices in the past six years. In particular, they simulated two services traded in the Danish market: frequency-controlled disturbance reserve (FCR-D) and frequency-controlled normal operation reserve (FCR-N). The analysis revealed an increase in profits by 2%–8% in each of the simulated years.
3. Problem Formulation and Methodology Proposed

The proposed approach consists of two main steps. Firstly, the creation of a comprehensive market model designed to simulate the balancing and capacity markets in line with the Italian scenario. Secondly, the development of a thorough BESS model encompassing the efficiency specifications of electrochemical cells, inverters, transformers, and auxiliary systems. Additionally, the model accounts for aging phenomena.

3.1. Balancing and Capacity Market Models

The first part of the model aims to evaluate the required charging and discharging power setpoints. The market model exploits the grid convention: the power is considered positive when injected into the grid (discharging power) and negative when injected into the BESS (charging power).

3.1.1. Balancing Market

A statistical analysis is performed to define the hourly averages and standard deviations of upward and downward prices in the Italian scenario. The data gathered for each year are divided into working days (from Monday to Friday) and holidays (Saturdays, Sundays, and bank holidays). Additionally, the data include the hourly accepted prices for both regulations considered in the balancing market: maximum upward prices for upward regulation and minimum downward prices for downward regulation.
The statistical analysis reports the average and standard deviation of the hourly marginal prices awarded for each regulation (upward and downward), for both working days and holidays, and for each year considered. The calculated averages and standard deviations define the distribution of the hourly awarded prices for each service. In the case of upward regulations, hours with a “zero” awarded price are eliminated as the upward balancing service is not provided at that hour.
Then, a proper bidding strategy has been developed with the aim to define the prices and volumes to be offered to participate in the balancing market. The strategy considers the statistical analysis described previously and the real-time measurement of the SoC.
The bid price is defined based on the available energy, i.e., SoC, in the battery. Moreover, a target SoC ( S o C t a r g e t ) is defined and used to grant proper reliability for the operation of the battery, respecting the technical requirements specified in the grid code. The bid price is determined based on the average prices defined in the statistical analysis and a parameter defined as a function of the SoC. The bidding price specified for each hour, h, is formulated in Equation (1):
B ( h ) = μ ( h ) σ ( h ) × S o C ( t ) S o C t a r g e t 100
where:
  • B(h): Bid price for hour h (EUR/MWh)
  • μ (h): Average of awarded prices for upward and downward regulations for hour h (EUR/MWh)
  • σ (h): Standard deviation of awarded prices for upward and downward regulations for hour h (EUR/MWh)
  • SoC(t): State-of-Charge of the battery (%)
  • S o C t a r g e t : Target state-of-charge (%)
In particular:
  • If (SoC(t)) is higher than the target SoC ( S o C t a r g e t ), the bid price for upward regulation decreases proportionally to the difference between SoC(t) and S o C t a r g e t , increasing the probability of acceptance as upward bids got accepted if the bid price is lower than the maximum upward price.
  • If (SoC(t)) is lower than the target SoC ( S o C t a r g e t ), the bid price for downward regulation increases proportionally to the difference between SoC(t) and S o C t a r g e t , increasing the probability of acceptance since downward bids are accepted if the bid price is higher than the minimum downward price.
A minimum bid price for the upward regulation and a maximum bid price for the downward regulation are defined to guarantee the project’s economic viability. Generally, the difference between upward and downward bid prices, known as the spread, should be at least equal to the Levelized Cost of Storage (LCOS). The LCOS is defined based on Equation (2):
L C O S = C A P E X + t = 1 n O P E X ( 1 + i ) t t = 1 n E ( 1 + i ) t
where:
  • CAPEX: Capital expenditures (EUR)
  • OPEX: Operating expenditures (EUR)
  • i: Discount rate (%)
  • n: Lifetime of the asset (years)
  • E: Energy (MWh), defined based on Equation (3)
E = n c y c l e s D o D E r a t e d η R T ( 1 η s e l f ) c
where:
  • n c y c l e s : Expected number of cycles
  • η R T : Round-trip efficiency
  • η s e l f : Self-discharge
  • c: Degradation Factor
The adopted minimum value for the maximum upward bid price and the maximum value for the minimum downward bid price are EUR 250/MWh and 120 EUR/MWh, respectively.
The bid volumes for upward and downward regulations are defined, assuming that the market can offer asymmetric quantities. Moreover, they are evaluated considering the available SoC. Generally, in Italy BESS operators can bid four hourly quantities for upward and downward regulations on a market session of 4 h. Therefore, bid volumes (MW) are defined as shown in Equations (4) and (5), respectively:
P u p = m i n ( P n , S o C h 1 S o C m i n 100 t m k t E n k m k t )
P d n = m i n ( P n , S o C m a x S o C h 1 100 t m k t E n k m k t )
where:
  • P n : Nominal power of the BESS (MW)
  • S o C m a x : Maximum SoC (95%)
  • S o C m i n : Minimum SoC assigned (5%)
  • t m k t : Market session duration (4 h)
  • k m k t : Parameter introducing safety margins (1.2)
The small bids are eliminated when the SoC is close to the minimum and maximum thresholds defined. In particular:
  • If 5% < SoC < 7%, no upward bid is submitted.
  • If 93% < SoC < 95%, no downward bid is submitted.
Finally, the final power setpoint of the balancing market based on specific acceptance and rejection rules after submitting the bids for the upward and downward regulations is defined.
After defining the bidding strategy, a tailored procedure has been devised to accurately simulate the market, specifically aiming to determine whether a given bid is accepted or rejected. This approach holds statistical significance and is structured into two distinct steps:
  • The initial stage examines upward and downward bids submitted separately.
  • The subsequent stage addresses scenarios where bids for both upward and downward regulations are simultaneously accepted, requiring the award of only one bid.
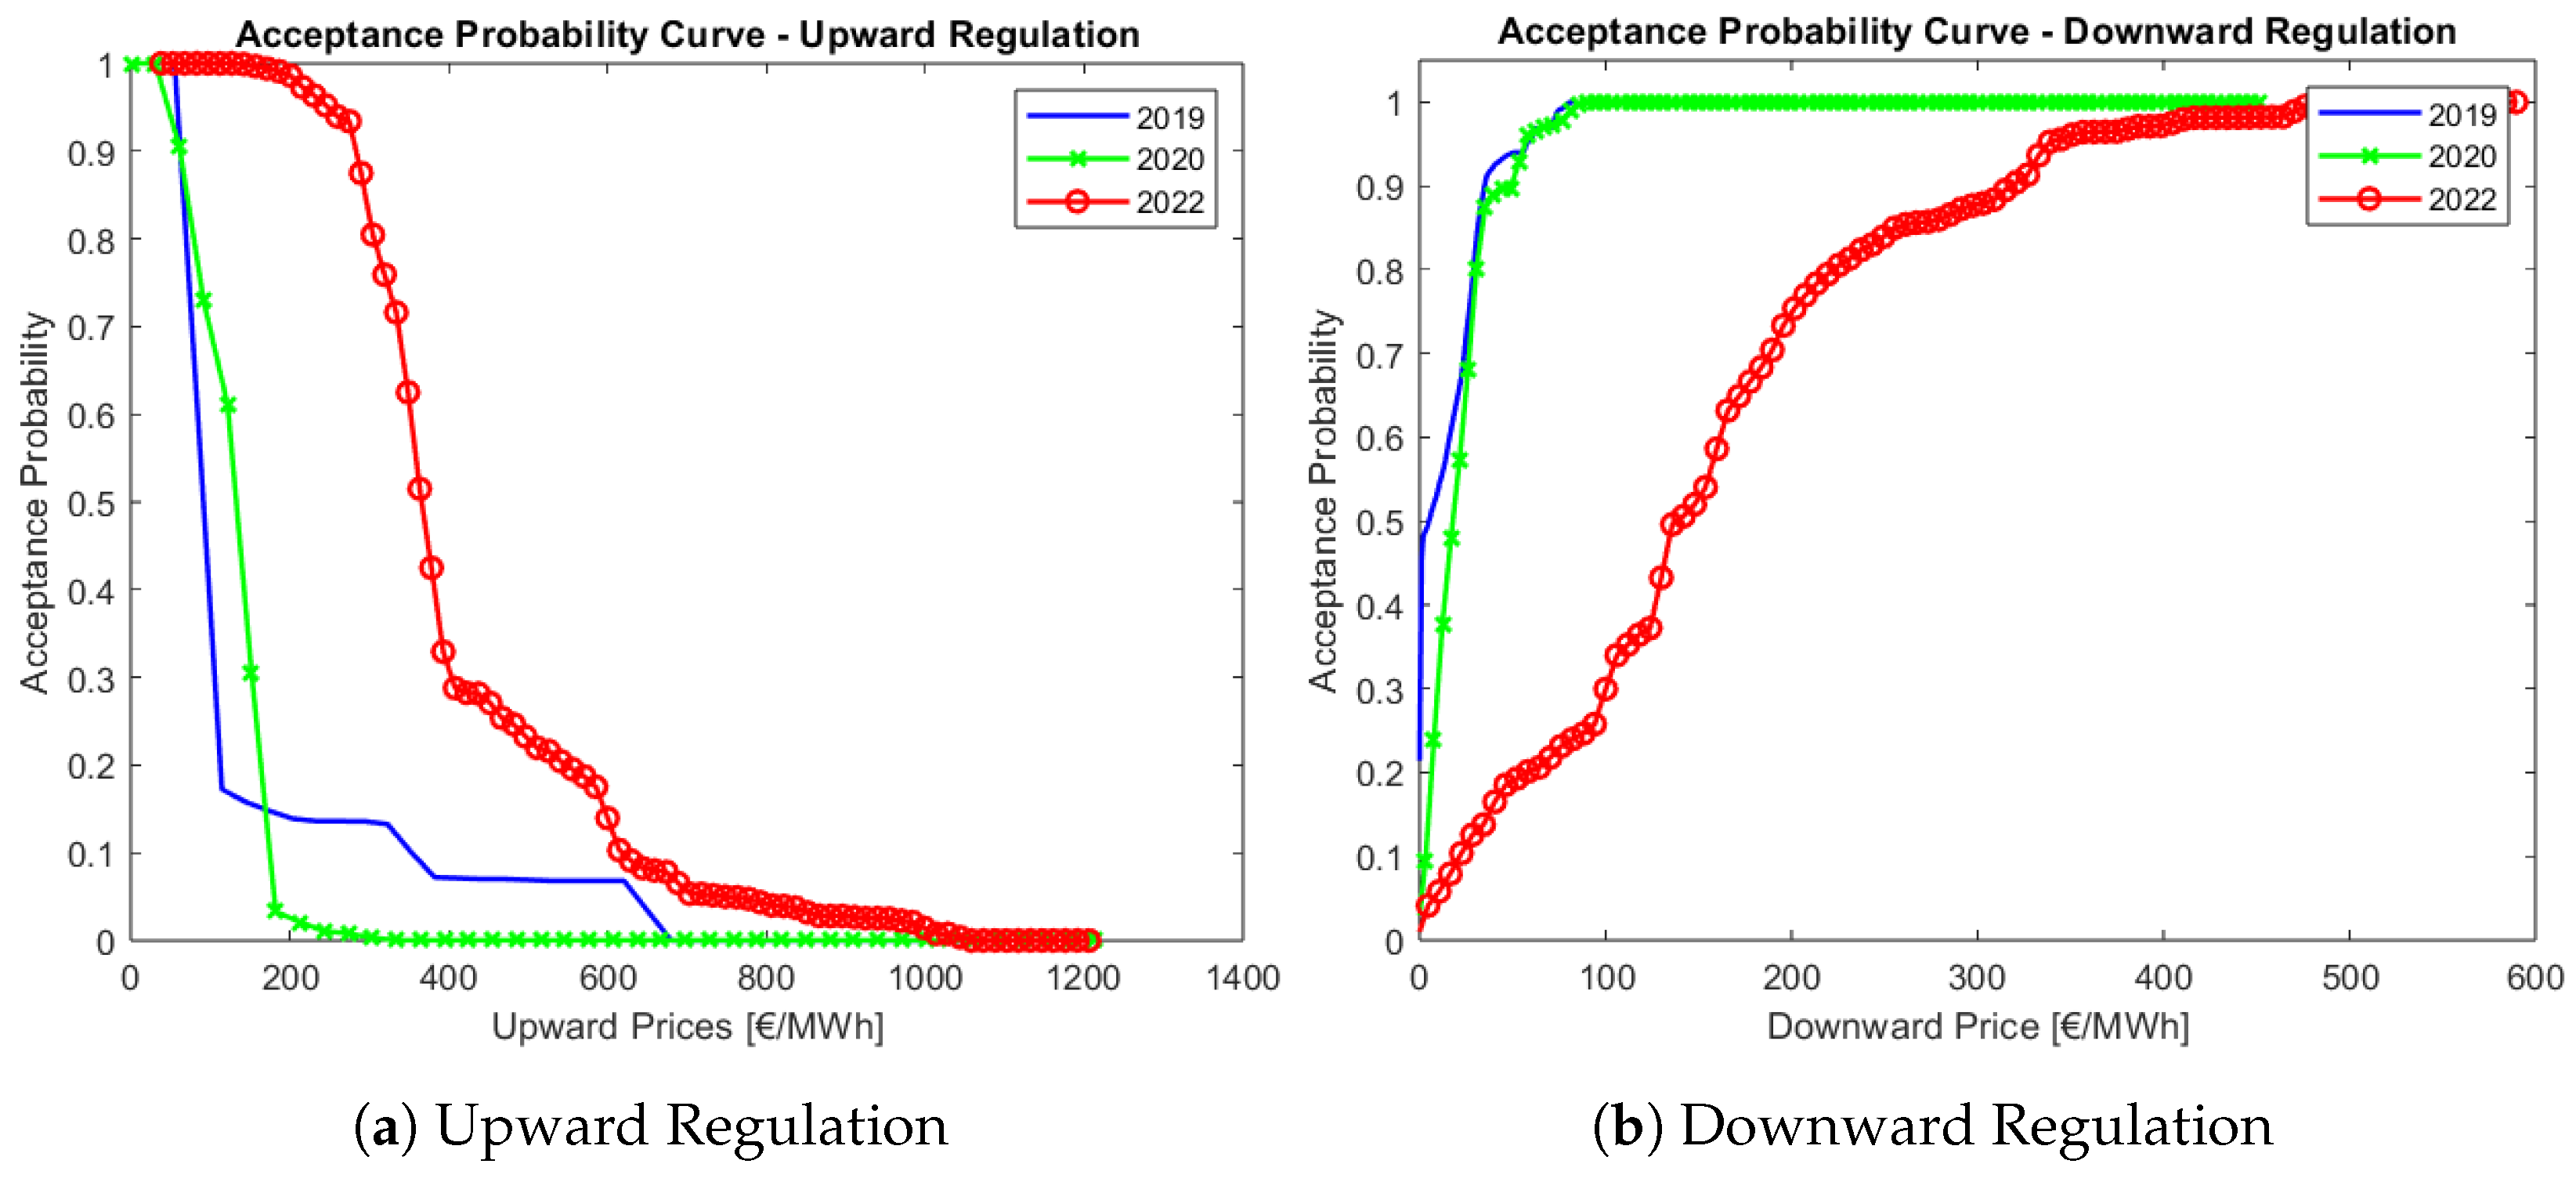
In each stage, to ascertain the acceptance or rejection of upward and downward bids, Cumulative Distribution Functions (CDFs) are constructed from historical data encompassing accepted bids for both upward and downward regulations, as illustrated in Figure 2. Extensive historical market data spanning a significant time window (one year or more) were gathered. Utilizing statistical routines, these data were employed to compute the probability density function and the corresponding CDF.
The defined CDFs illustrate the likelihood of bid acceptance given that the bid price falls below a certain threshold. These functions take the bid price as input, generating the associated probability of acceptance. However, it is important to note that the output of these generated CDFs is capped at a maximum value of 0.8. This limitation reflects the challenge of securing an offer with a 100% probability of acceptance.
In the proposed approach, an upward bid is rejected if the upward bid price is greater than the maximum upward price. For the downward regulation, the bid is rejected if the bid price is lower than the minimum downward price. The probability obtained through this method is then compared with a randomly generated number between 0 and 1 to identify whether the bid is accepted or rejected in the market session under investigation. For both regulations, the submitted offer is accepted only if the generated random number is smaller than the corresponding probability, and is rejected otherwise. If no bids are accepted during a specific hour, the battery remains inactive. However, if any submitted bid, be it for upward or downward regulation, gets accepted, it is automatically awarded. Consequently, the BESS is tasked with supplying a constant power output for the entire hour. In the event that both bids are accepted, only one reserve should be provided. Determination of the bid being awarded hinges on the discrepancy between the upward or downward bid price and the average DAM price for each simulated year. The bid with the narrower spread is granted priority. Algorithm 1 describes the structure of the balancing market adopted.
Algorithm 1: Balancing Market Algorithm
  • Input: Acceptance probability curve, M S D t u p , M S D t d o w n , p r i c e r a n d t u p ,  
  • p r i c e r a n d t d o w n  
  • Output: A C C t u p , A C C t d o w n  
  • { p r o b } t u p = probability( M S D t u p )  
  • { p r o b } t d o w n = probability( M S D t d o w n )  
  • Bool = random(0:1)  
  • If M S D t u p < p r i c e r a n d t u p  
  •      If Bool < { p r o b } t u p  
  •              A C C t u p = 1  
  •      else  
  •              A C C t u p = 0  
  • else  
  •      A C C t u p = 0  
  • If M S D t d o w n > p r i c e r a n d t d o w n  
  •      If Bool < { p r o b } t d o w n  
  •              A C C t d o w n = 1  
  •      else  
  •              A C C t d o w n = 0  
  • else  
  •      A C C t d o w n = 0

3.1.2. Capacity Market

The capacity market aims to ensure sufficient power capacity during scarcity hours. Participation in the capacity market is based on a tender procedure. In the present analysis, the BESS is asked to participate in the DAM at specific peak hours according to the regulations on the framework of the Italian capacity market defined by the TSO (TERNA), in [49]. Participants in the capacity market are entitled to a capacity premium by submitting bids at the DAM for each of the defined peak hours.
However, in the Italian Regulatory Framework the capacity premium depends on a parameter, named the derating factor, defined by TERNA, and associated with each technology that considers the reliability of providing the capacity. For BESSs, the higher the Energy-to-Power ratio (EPR), the lower the associated derating factor, demonstrating higher reliability in delivering the requested power. The derating factor is used to calculate the qualified power, P C D P , as illustrated in Equation (6). P C D P represents the minimum capacity required to be offered.
P C D P = P n o m × ( 1 d e r a t i n g )
where:
  • P C D P : Qualified Power (MW)
  • P n o m : BESS Nominal Power (MW)

3.2. BESS Model

The proposed BESS model is divided into four blocks:
  • Auxiliary Power Consumption: Calculates the auxiliaries’ consumption as a function of the temperature.
  • Round-trip Efficiency: Calculates the RTE, including the transformer, inverter, and battery efficiencies.
  • Capability Curve: Maintains the operation of the BESS within defined SoC thresholds.
  • State-of-Charge Estimation: Estimates the SoC based on the power set points previously calculated and capability curve.
The model is built based on data gathered from the Supervisory Control and Data Acquisition (SCADA) of a real-world BESS currently operating in Germany. The size of the BESS considered is 2MW/2MWh at the beginning-of-life (BoL), and it is used to provide frequency regulation.

3.2.1. Auxiliary Power Consumption

The auxiliary power consumption block calculates the power requested by the auxiliaries. The cooling system essentially defines the auxiliary consumption to maintain the operation of the BESS within the accepted temperature range. In the data received, the auxiliaries’ power is correlated with the average power set point (%) and the average ambient temperature (°C) over a day.

3.2.2. Round-Trip Efficiency Calculation

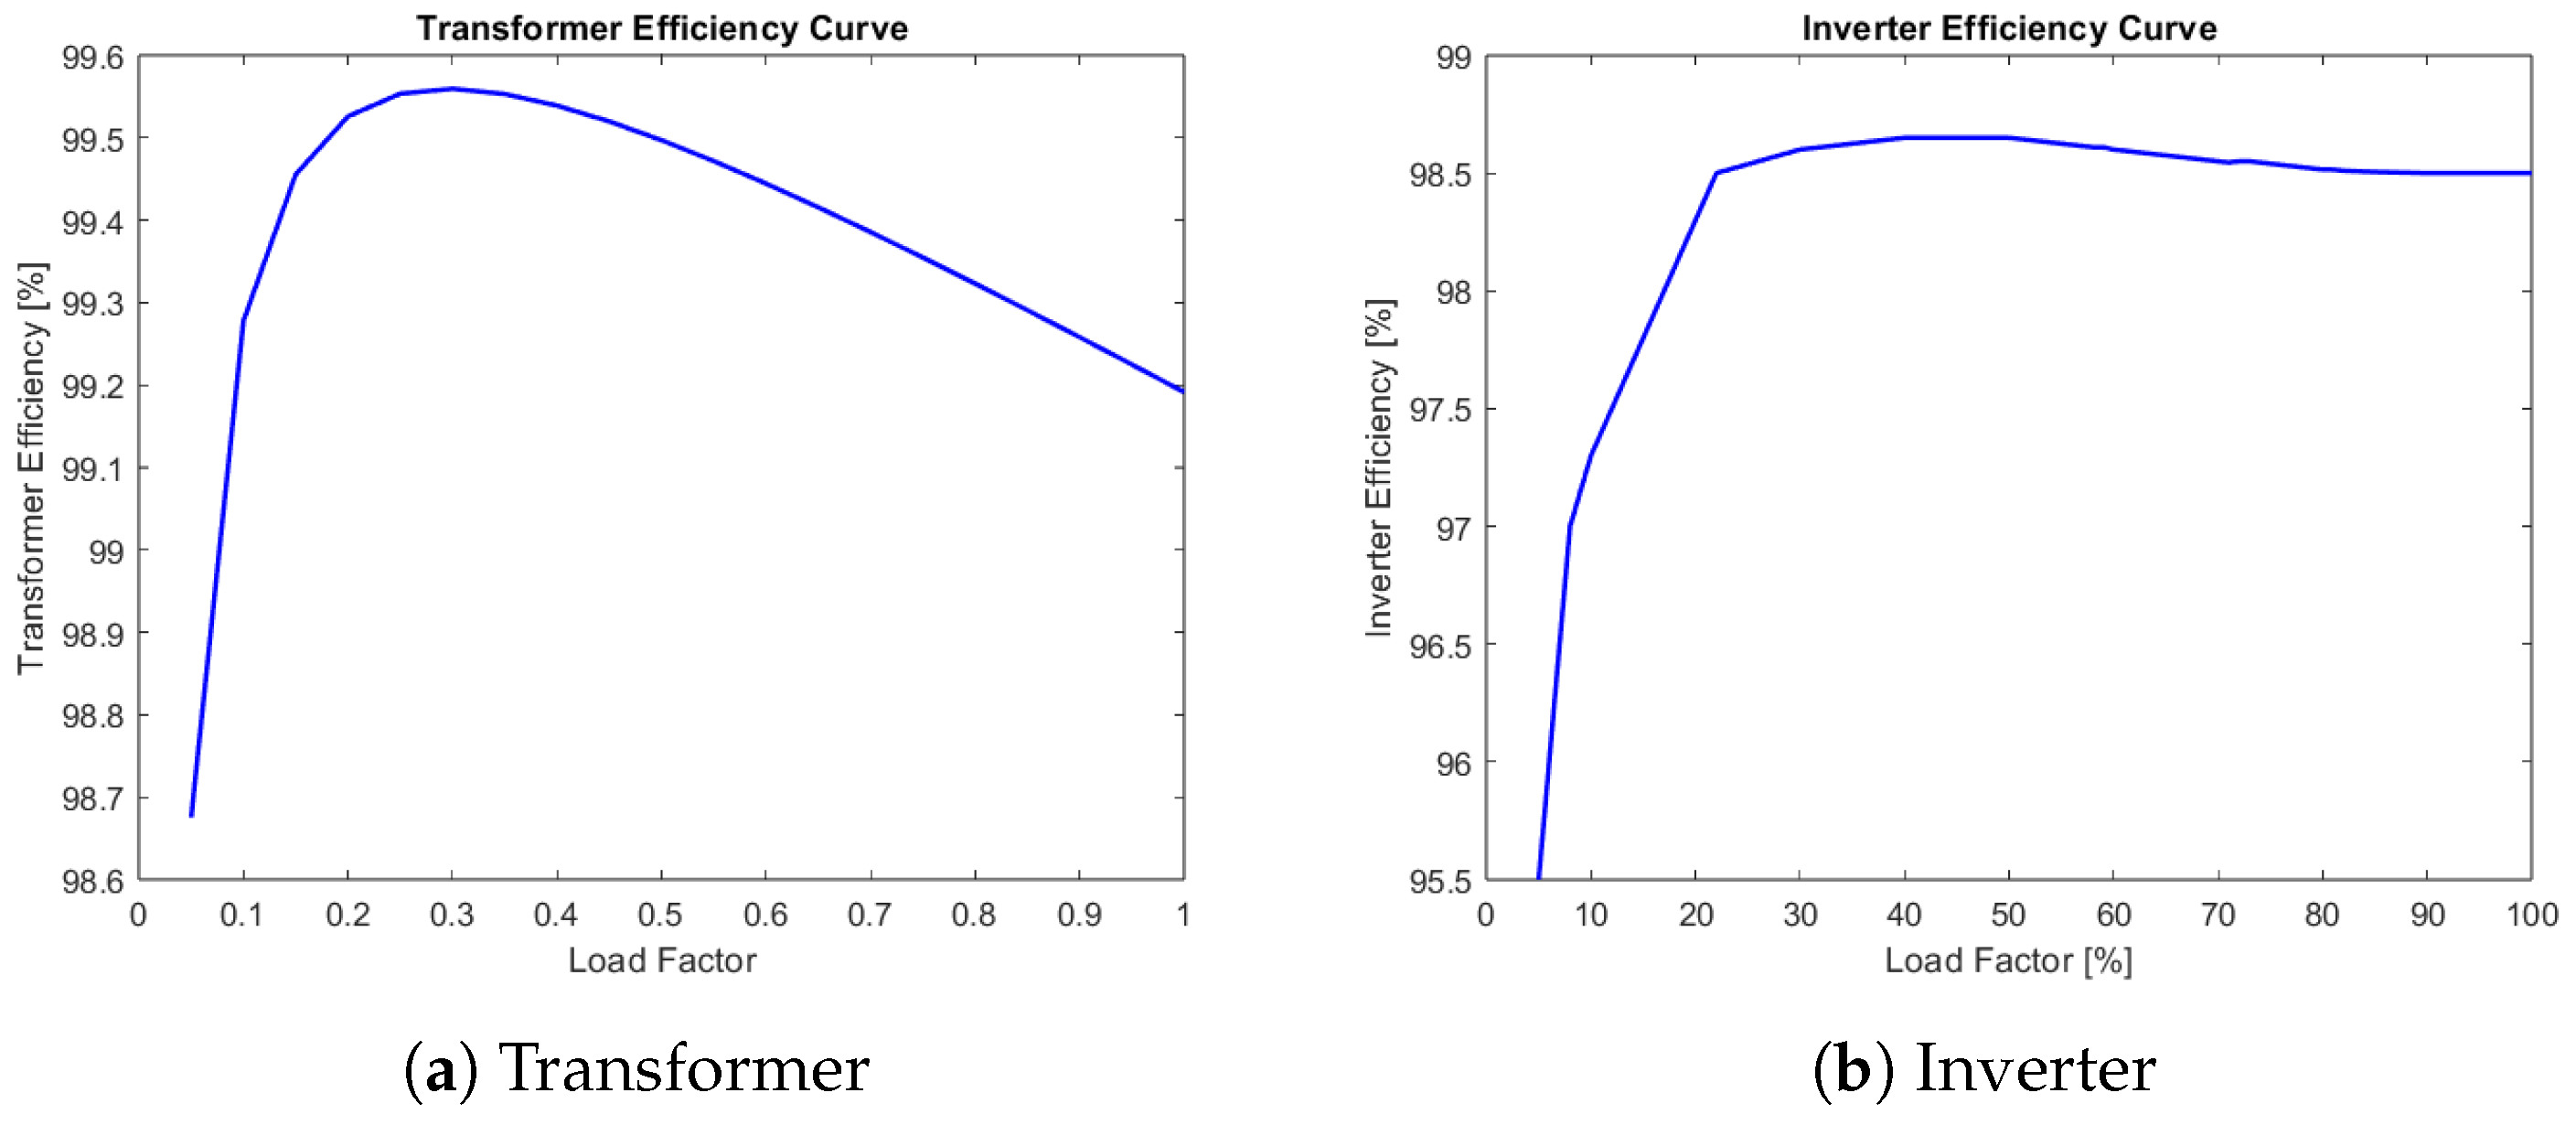
The transformer, inverter, and battery efficiencies are calculated separately. In particular, three different efficiency models are built. Then, these models are cascaded, and the output of one model is the input to the other to define the overall efficiency, starting from the transformer, the inverter, and finally the battery. The transformer is a three-phase and oil immersed with a rated power of 2000 kVA. The transformer efficiency curve is constructed based on Equation (7) [50]:
η = x · P n x · P n + P 0 + x 2 · P c n × 100
where:
  • η : Transformer efficiency (%)
  • x: Load factor = P o w e r S e t p o i n t N o m i n a l P o w e r o f T r a n s f o r m e r
  • P n : Nominal power of the transformer (W)
  • P 0 : No-load losses at rated voltage (W)
  • P c n : Losses at rated load (W)
P 0 and P c n are defined based on the regulation provided by the EU Commission regarding the operation of small, medium, and large power transformers [51]. For a three-phase liquid-immersed transformer with a rated apparent power of 2000 kVA, the maximum load losses and no-load losses are 15,000 W and 1305 W, respectively. For the inverter, the efficiency curve is directly extracted from the inverter’s data sheet [52]. Both efficiency curves are shown in Figure 3.
Finally, the battery efficiency model is built based on real-life data relevant to a utility-scale BESS. The efficiency of the electrochemical battery pack has been evaluated comparing the charging/discharging energy over small cycles, performed at different SoC with different C-rates. Moreover, the data relevant to a real-life BESS operation for over one year has been processed. The charging and discharging energies are calculated by integrating the corresponding power values using the trapezoidal rule, as highlighted in Equation (8). Finally, the battery efficiency is defined as the ratio between the discharging and charging energies, as reported in Equation (9).
E = T × P ( t ) + P ( t + 1 ) 2
η B A T = E D i s E C h × 100
where:
  • E: Charging/Discharging energy (kWh)
  • T: Sampling Time (10 s)
  • P(t): Power Value at time t (kW)
  • P(t+1): Power Value at time t+1 (kW)
  • η B A T : Battery’s Efficiency (%)
  • E D i s : Discharging Energy (kWh)
  • E C h : Charging Energy (kWh)
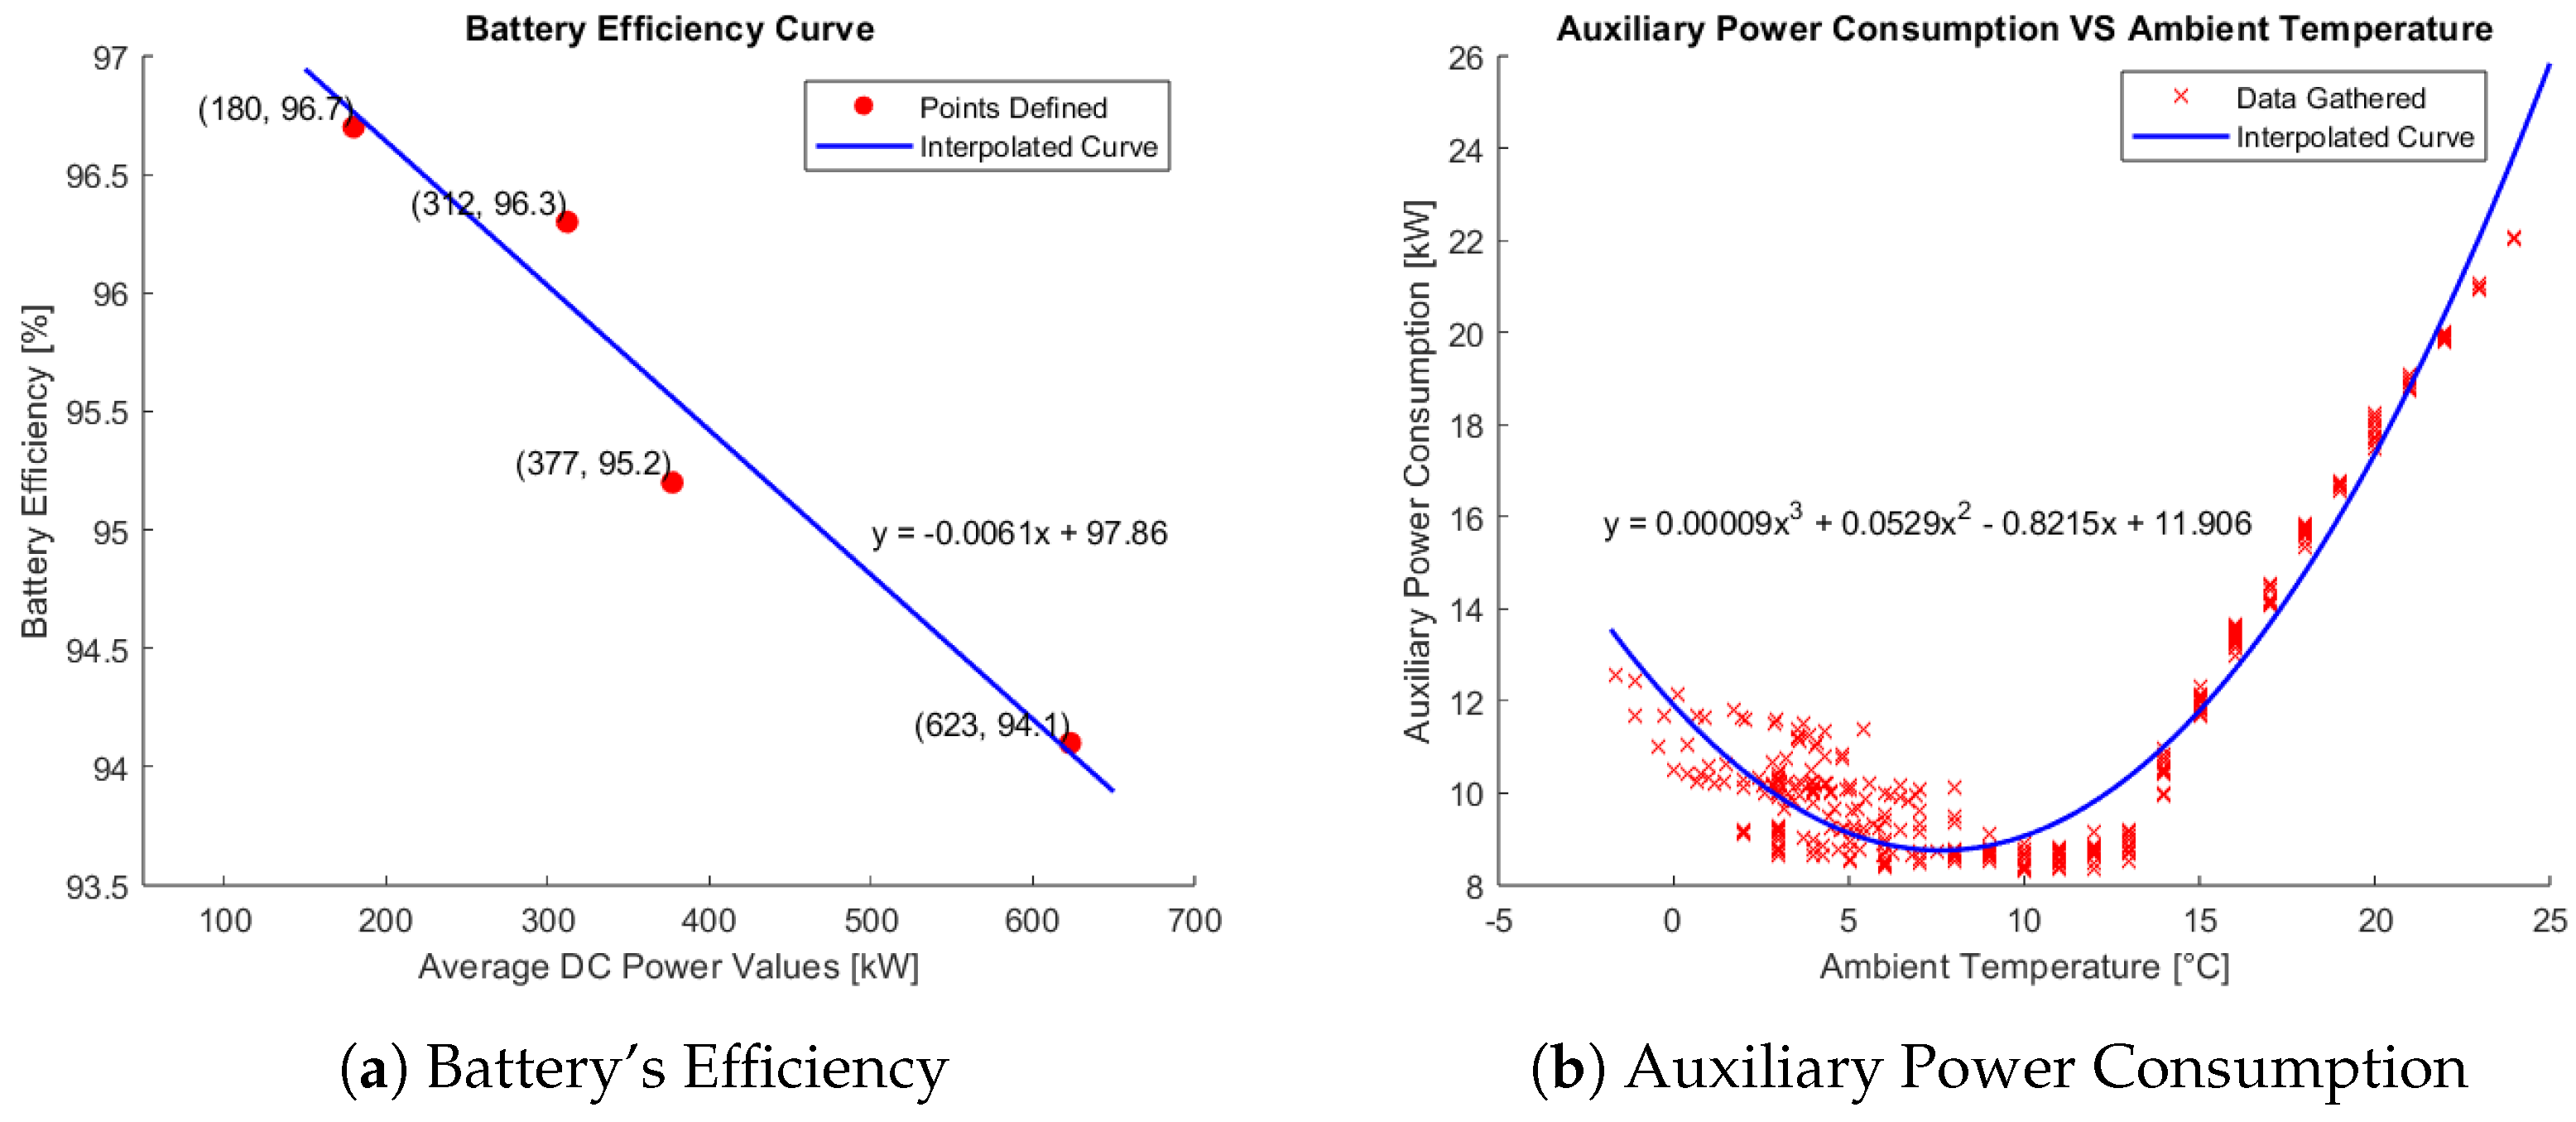
After evaluating the battery’s efficiency at different power and SoC values, the corresponding average power and midpoint SoC are calculated for each sub-cycle defined. The battery efficiencies are correlated with the corresponding DC power setpoints. Then, the resulting points are interpolated using MATLAB’s curve fitter tool to define the equation that calculates the battery’s efficiency as a function of the DC power setpoints.

3.2.3. Aging Model

The aging model is built based on a degradation curve provided by the BESS, evaluated assuming a C-rate of 1C and 365 cycles per year. These data are interpolated, enabling the construction of an equation that establishes the relationship between the BESS’s SoH and the cycles performed. Then, the full cycle equivalent is calculated by adopting Equation (10). The estimated cycles performed by the BESS are fed to the aging model to calculate the corresponding state of health.
F E C = E c h + E d i s 2 × E n o m
where:
  • E c h : Charging Energy (MWh)
  • E d i s : Discharging Energy (MWh)
  • E n o m : BESS Nominal Energy (MWh)

4. Case Study

A case study is proposed to evaluate the impact of CAPEX and upward bid price variations on the economic viability of the project. The BESS under investigation participates in two markets: capacity and balancing markets. The sensitivity analysis is proposed in order to evaluate how much the expected BESS’s CAPEX reduction will impact the economics. Finally, the IRR of the project is evaluated, changing the input parameters as follows:
  • CAPEX ranging from EUR 200 to 400/kWh;
  • Upward bid price ranging from EUR 200 to 400/MWh.
The data used for the simulations are summarized in Table 1.
The outcomes of the simulations are summarized in the following points:
  • Accepted prices and volumes in the day-ahead and balancing markets
  • Percentage of accepted bids and offers in the balancing market
  • Efficiencies and auxiliaries’ consumptions
  • States-of-charge and health
  • Full equivalent cycles performed by the BESS
Revenues and payments for each market are evaluated based on the accepted bids and offers. The cash flows determined are summed up, assuming a positive sign for revenues and a negative one for the payments. Therefore, the net profit generated from the markets is evaluated each year. The economic analysis is performed for 15 years. The linear method is assumed to compute the yearly depreciation. The OPEX is conventionally estimated at 2% of the CAPEX. Moreover, the Weighted Average Cost of Capital (WACC) is evaluated, adopting Equation (11) and assuming the data summarized in Table 2:
W A C C = D D + E × K d × ( 1 t ) + E E + D × K e
where:
  • K d : Cost of Debt
  • K e : Cost of Equity
  • t: Tax Rate
  • D/D+E: Market Value of Firm’s Debt
  • E/D+E: Market Value of Firm’s Equity
The data used in the economic analysis are highlighted in Table 3.
The economic indicators adopted to evaluate the project’s profitability are the NPV and the IRR. First, the yearly Earnings Before Interest and Taxes (EBIT) are calculated as the sum of the OPEX, revenues, and depreciation. Then, the corresponding taxes are computed by multiplying the EBIT and tax rate defined previously. If the EBIT is negative, the tax value is adjusted to zero. Afterward, the operating cash flows are calculated by summing up the OPEX, revenues, and taxes. Finally, the actualized cash flows are calculated to compute the NPV. The following equations summarize the procedure followed in the economic analysis:
E B I T = O P E X + R e v e n u e s + D e p r e c i a t i o n
T a x e s = m a x ( 0 , E B I T × t )
O C F = O P E X + R e v e n u e s + T a x e s
The percentage of CAPEX covered at the end of the analysis duration is calculated by adopting Equation (15):
C A P E X C o v e r e d [ % ] = 100 C A P E X × t = 1 15 R e v e n u e s ( t ) O P E X ( t ) P e n a l t i e s ( 1 + W A C C ) t

5. Results and Analysis

5.1. BESS Model

The proposed approach has been utilized to process data associated with a real-life 2MW/2MWh LFP BESS deployed in Germany, leading to the analytics presented in Figure 4a,b. Figure 4a illustrates the change in efficiency concerning the power output, while Figure 4b displays the auxiliary power consumption as a function of the ambient temperature.
The correlation between energy efficiency and power setpoints was observed to be linear, but requires consideration of key assumptions. Firstly, data originate from a utility-scale battery pack in Germany, collected via standard power meters and not laboratory equipment. Secondly, energy efficiency is calculated based on charge and discharge processes while maintaining consistent final SoC as per Equation (9). However, this introduces an approximation due to non-deterministic SoC estimation by the BMS. Moreover, limited information from the BESS’s SCADA system necessitates simplified procedures for standard utility-scale BESS operations. In conclusion, equipment resolution constrained DC efficiency estimation accuracy. Nevertheless, the proposed procedure effectively established a linear correlation with power setpoints. Minimal nonlinearities minimally impacted overall BESS performance estimation, remaining undetectable with this approach.
Meanwhile, the auxiliary systems exhibit minimal power consumption between external temperatures of 5 and 10 degrees. Higher temperatures require increased power consumption to cool the battery room, whereas lower temperatures require heating consumption. The proposed approach involves interpolating the obtained trends to derive a detailed mathematical model, as elaborated in the following sections. Moreover, as previously discussed, due to the lack of reliable data, inverter and transformer efficiencies have been estimated by adopting literature data, as reported in Figure 3.

5.1.1. Auxiliary Power Consumption

The coefficients calculated and the goodness of fit results are summarized in Table 4. The R 2 value of 0.9415 indicates a strong correlation between the model variables and suggests that the model provides a good fit to the data in the range defined.

5.1.2. Battery Efficiency

Regarding the cycle analysis, the results consist of four distinct data points, each with different average power and efficiency values. The computed efficiency and average DC power are summarized in Table 5.
Additionally, the coefficients calculated and the goodness of fit results are summarized in Table 6.

5.2. Statistical Analysis

As previously highlighted, the statistical analysis defines the hourly averages and standard deviations of awarded upward and downward prices. The data, gathered from the Gestore dei Mercati Energetici (GME) website, are divided into working days and holidays. The prices are classified according to the corresponding hour. Then, the hourly average and standard deviation are calculated.

5.2.1. Statistical Analysis Output

The results of the statistical analysis for 2019, for both working days and holidays, are highlighted in Figure 5a,b, respectively. The red lines represent the hourly average marginal upward prices, while the blue lines correspond to the downward ones. Moreover, the shaded areas highlight the deviations of the hourly maximum and minimum marginal prices over the year from the average values for both regulations. The average upward prices are generally in the range of 100–200 EUR/MWh, with the lowest value around 4:00 a.m. Regarding the downward marginal prices, the graph highlights an almost constant behavior indicating the constant willingness to pay throughout the day.
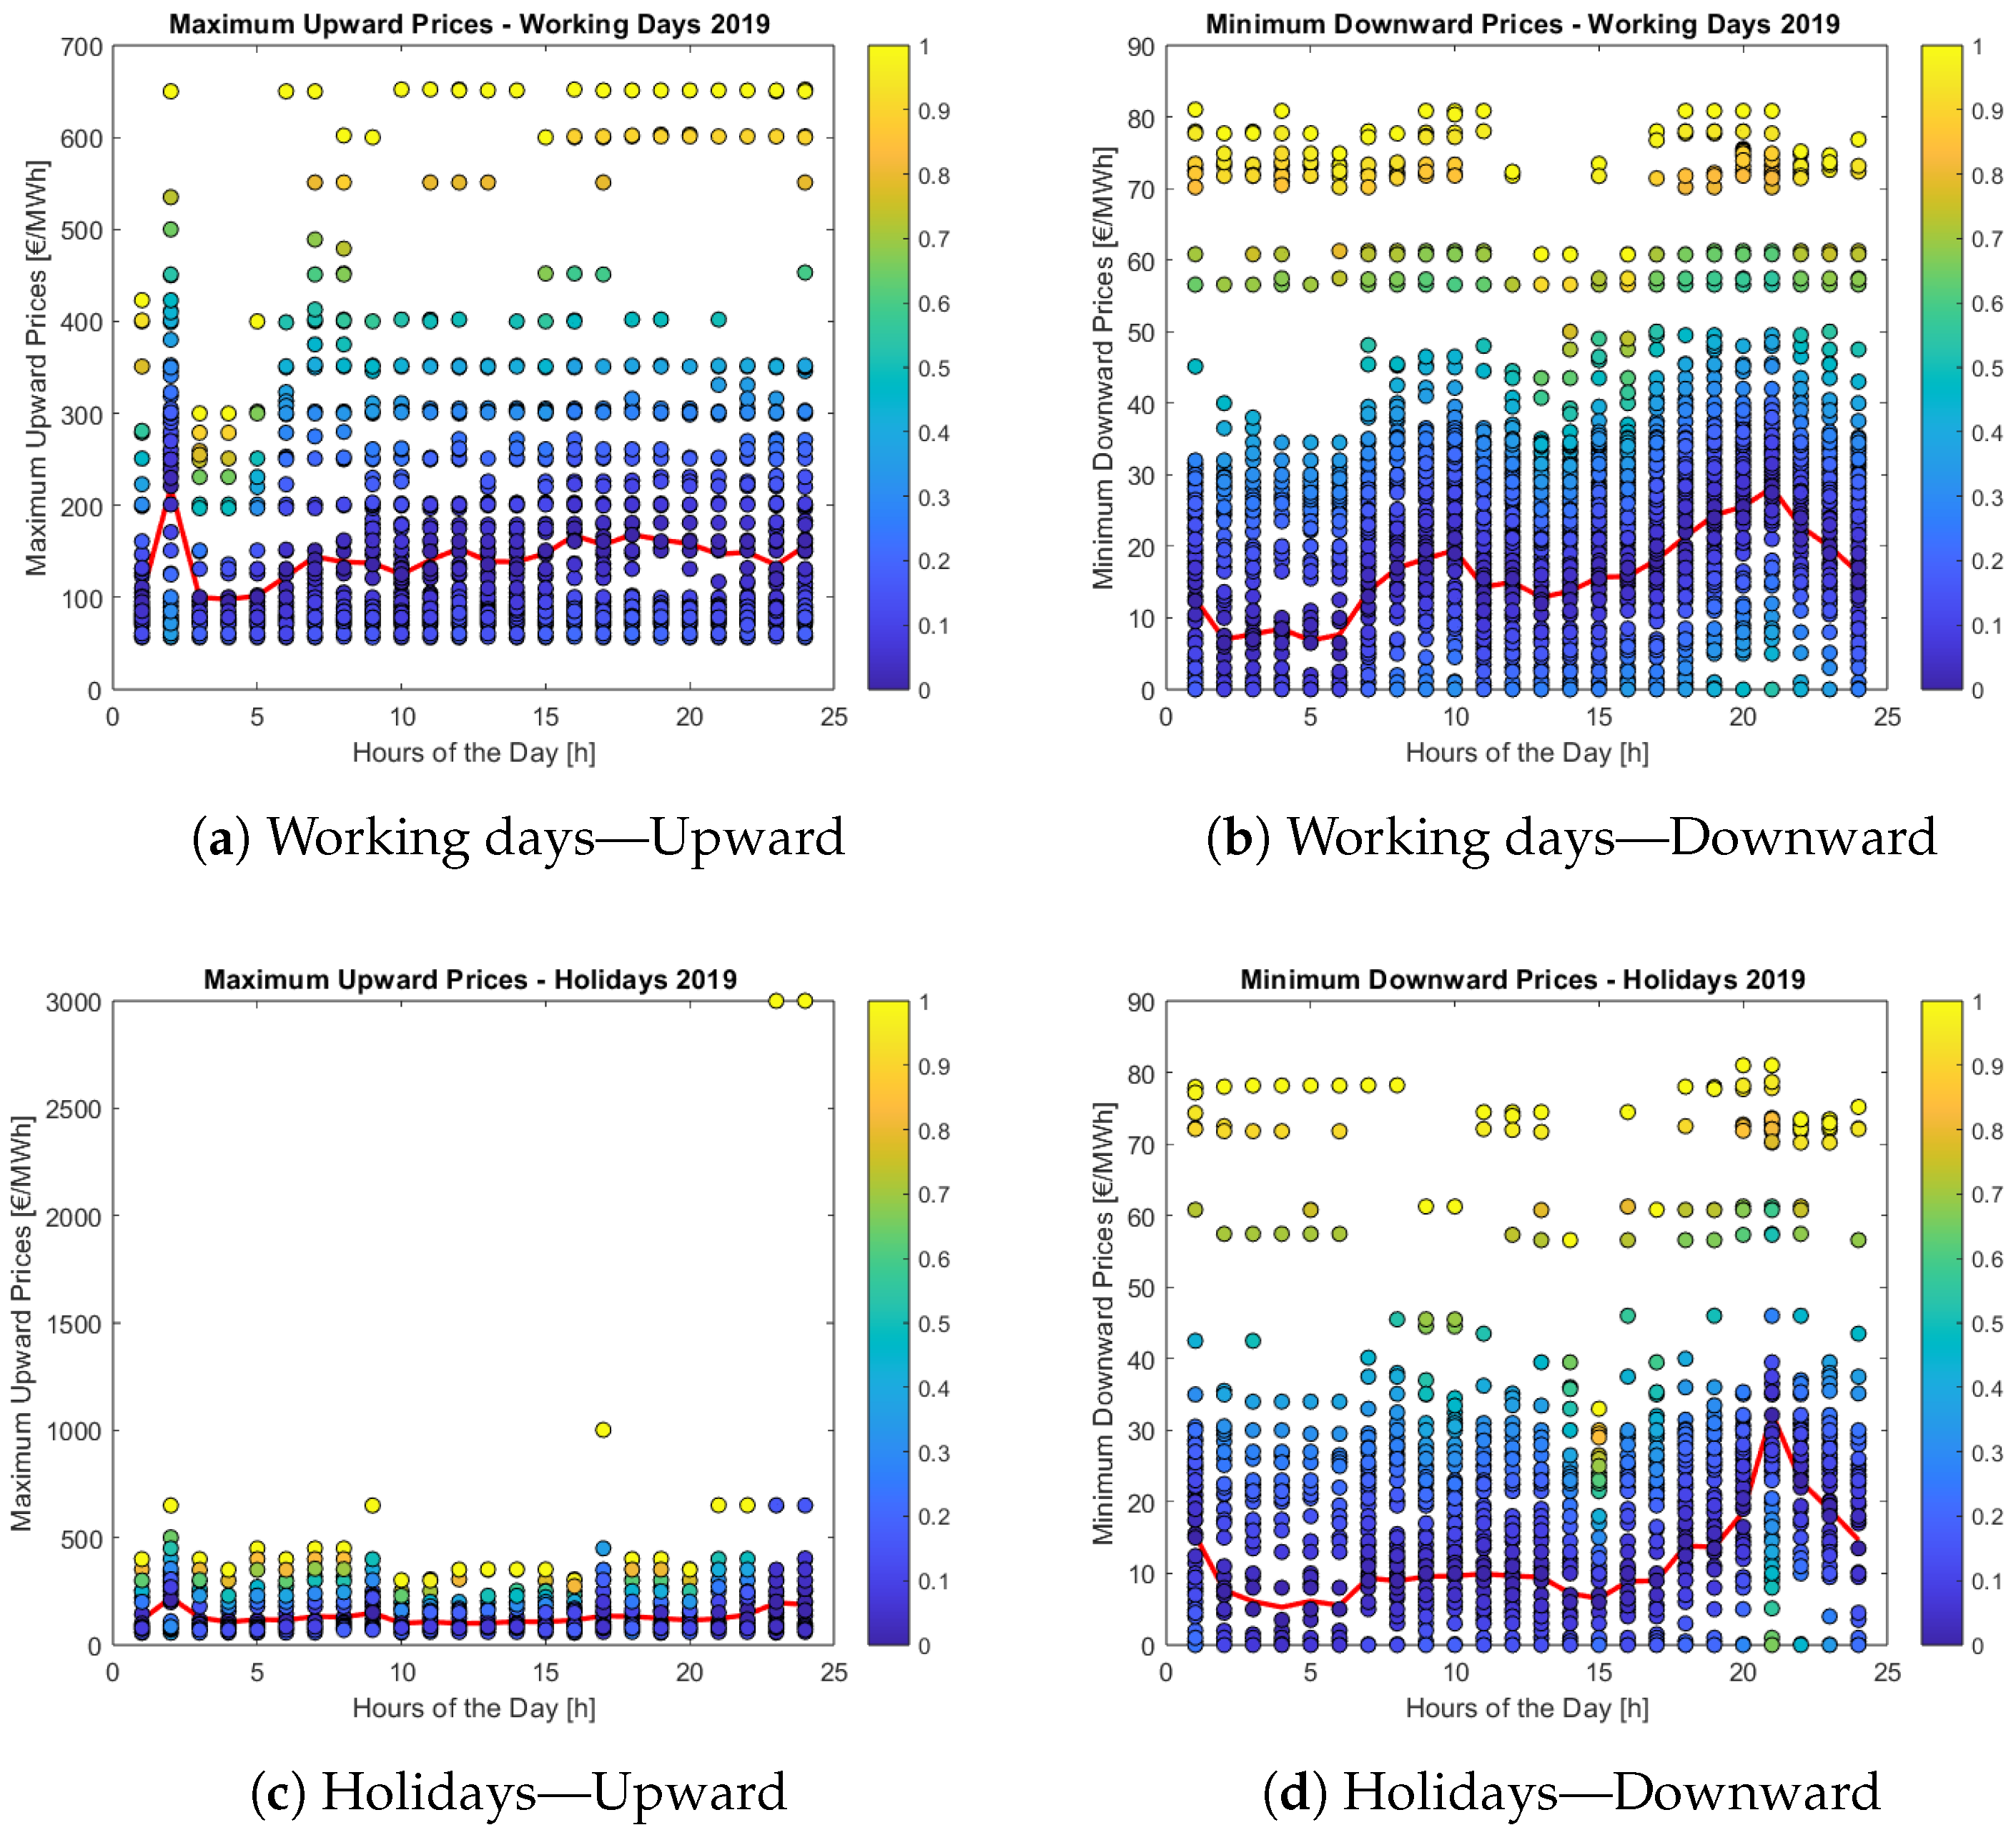
The distributions of the upward and downward marginal prices for 2019 along with the hourly average prices for working days and holidays are illustrated in Figure 6.
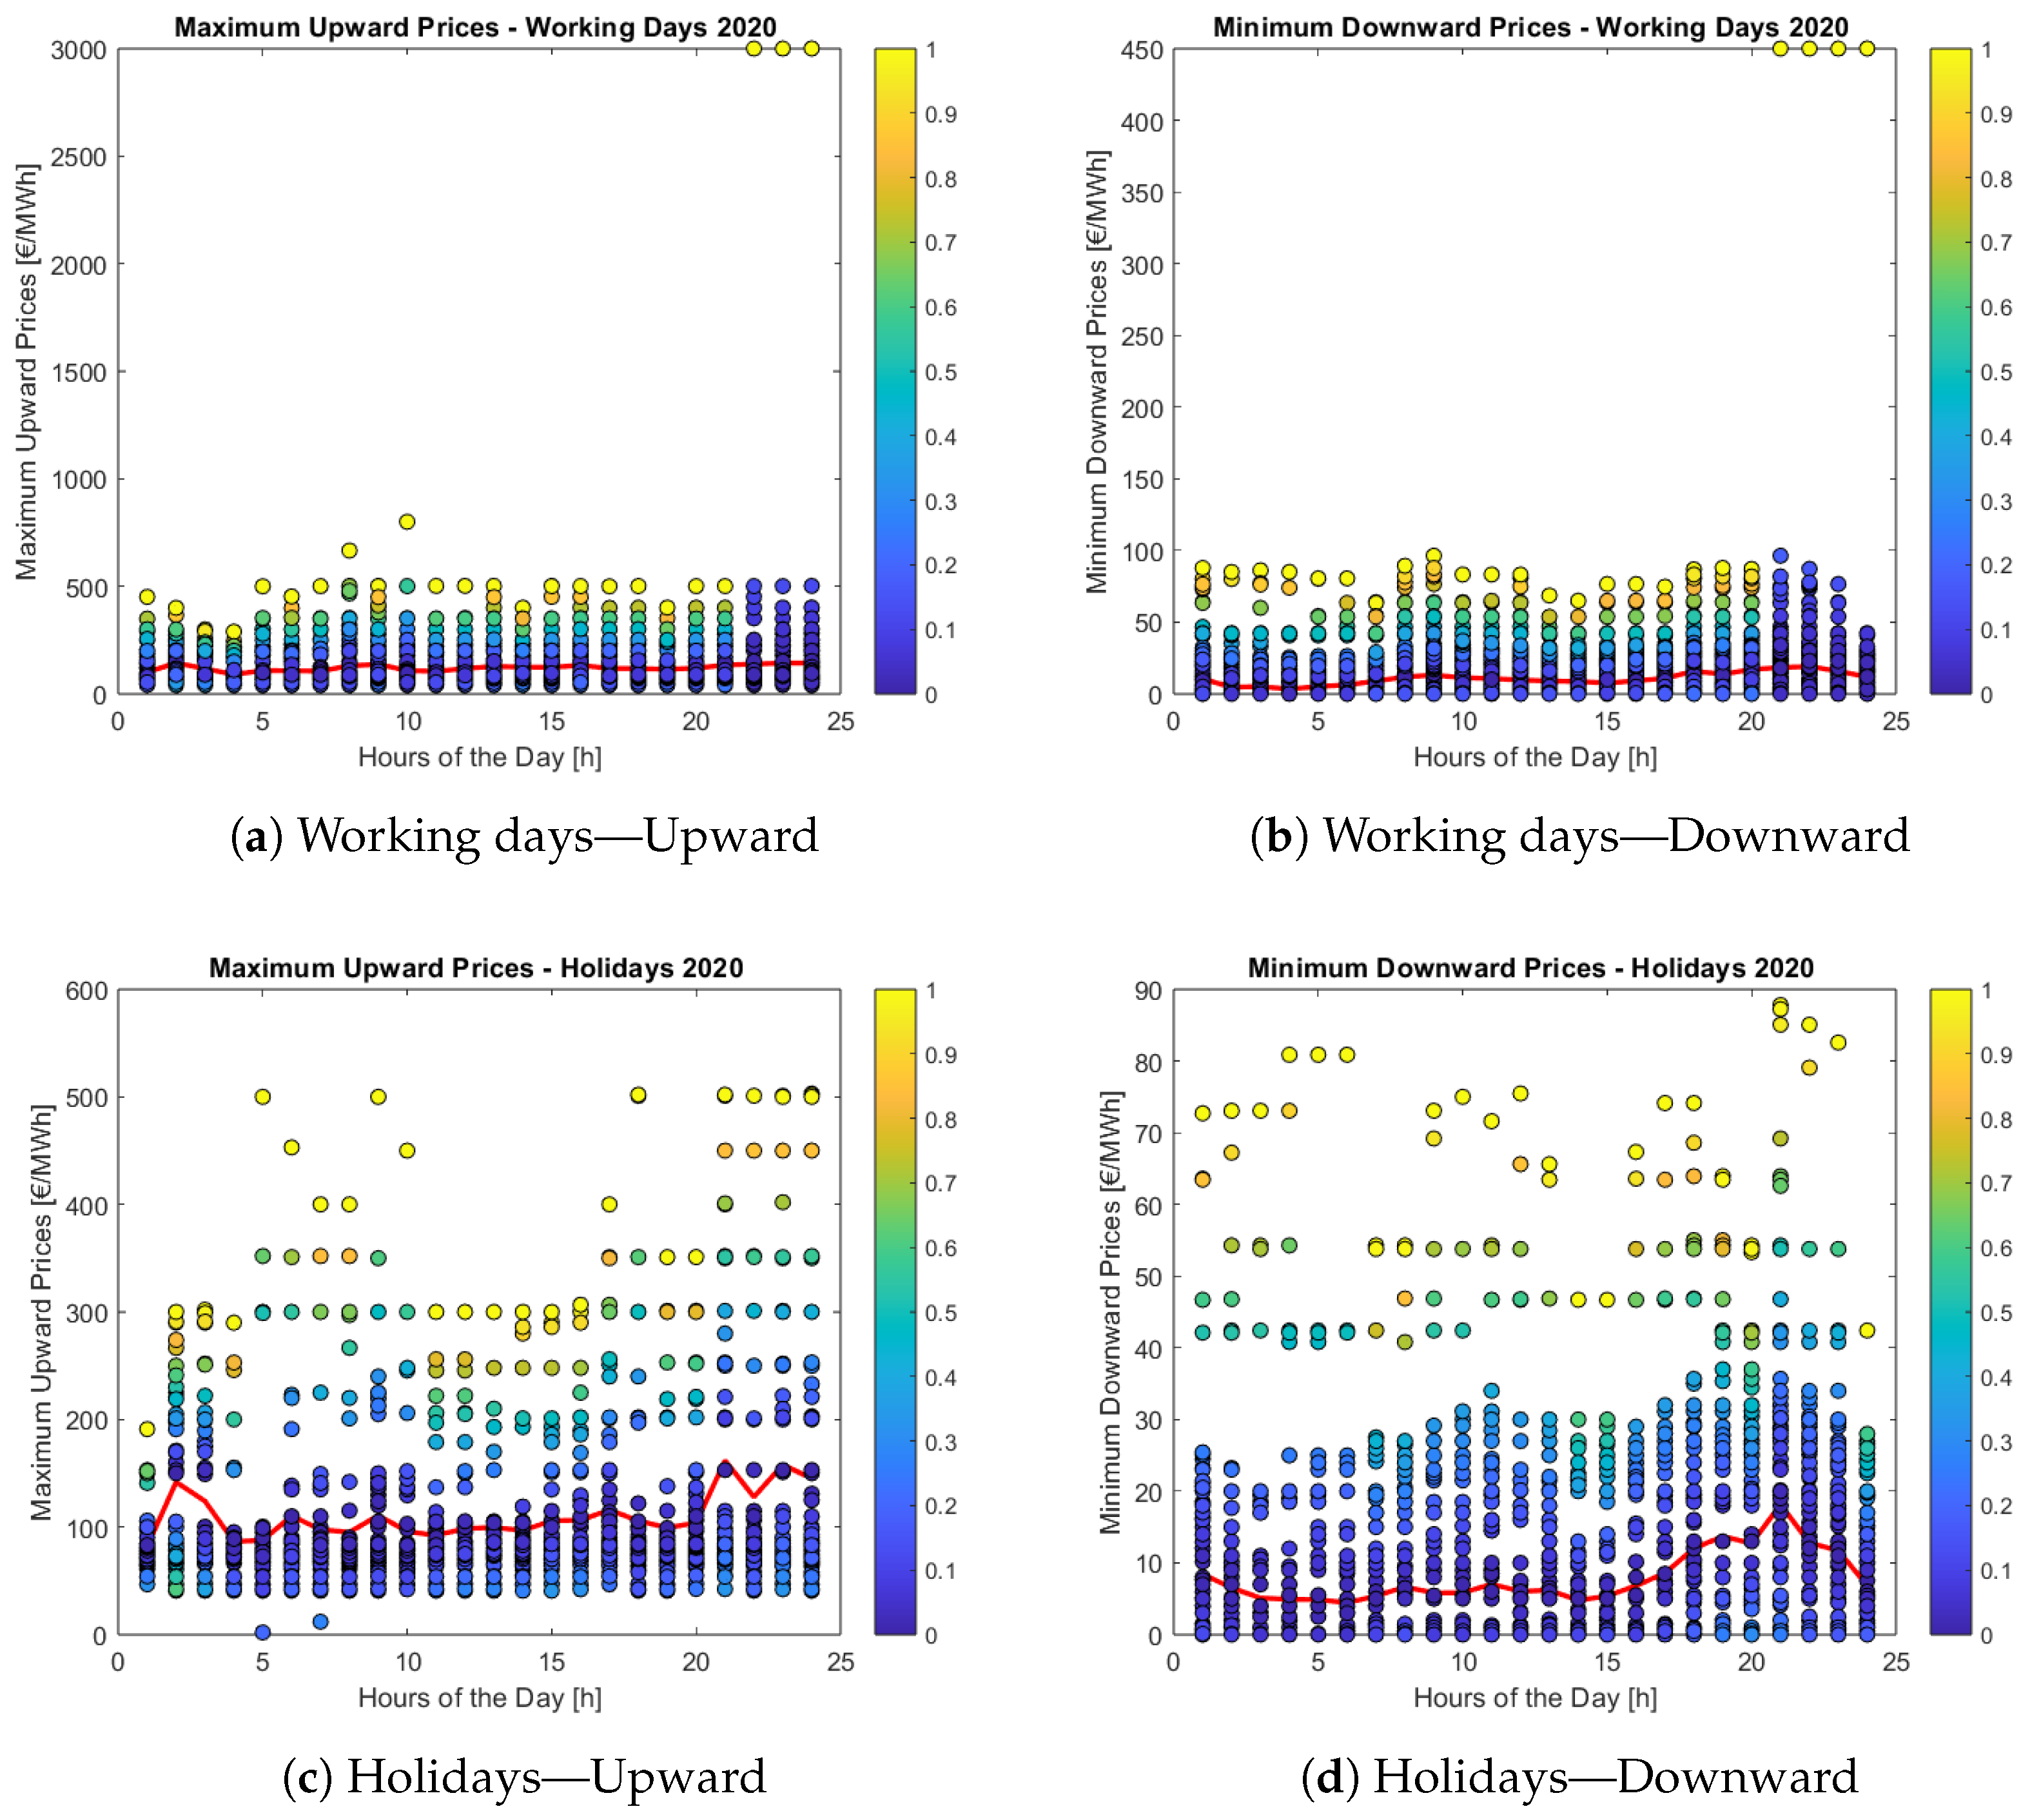
The dark blue shade signifies that the upward and downward marginal prices closely align with the hourly average value. The gradual lightening of the blue color corresponds to an increasing distance between these prices, culminating in the yellow color, which indicates a greater separation between both values. For upward regulation, as expected, the prices during working days are higher than holidays, except for a few hours. The maximum upward prices range between EUR 50 and 700/MWh, whereas the minimum downward prices range between EUR 0 and 80/MWh. However, during holidays, the maximum upward prices reach EUR 3000/MWh for a few hours at 11:00 p.m. and 12:00 a.m.
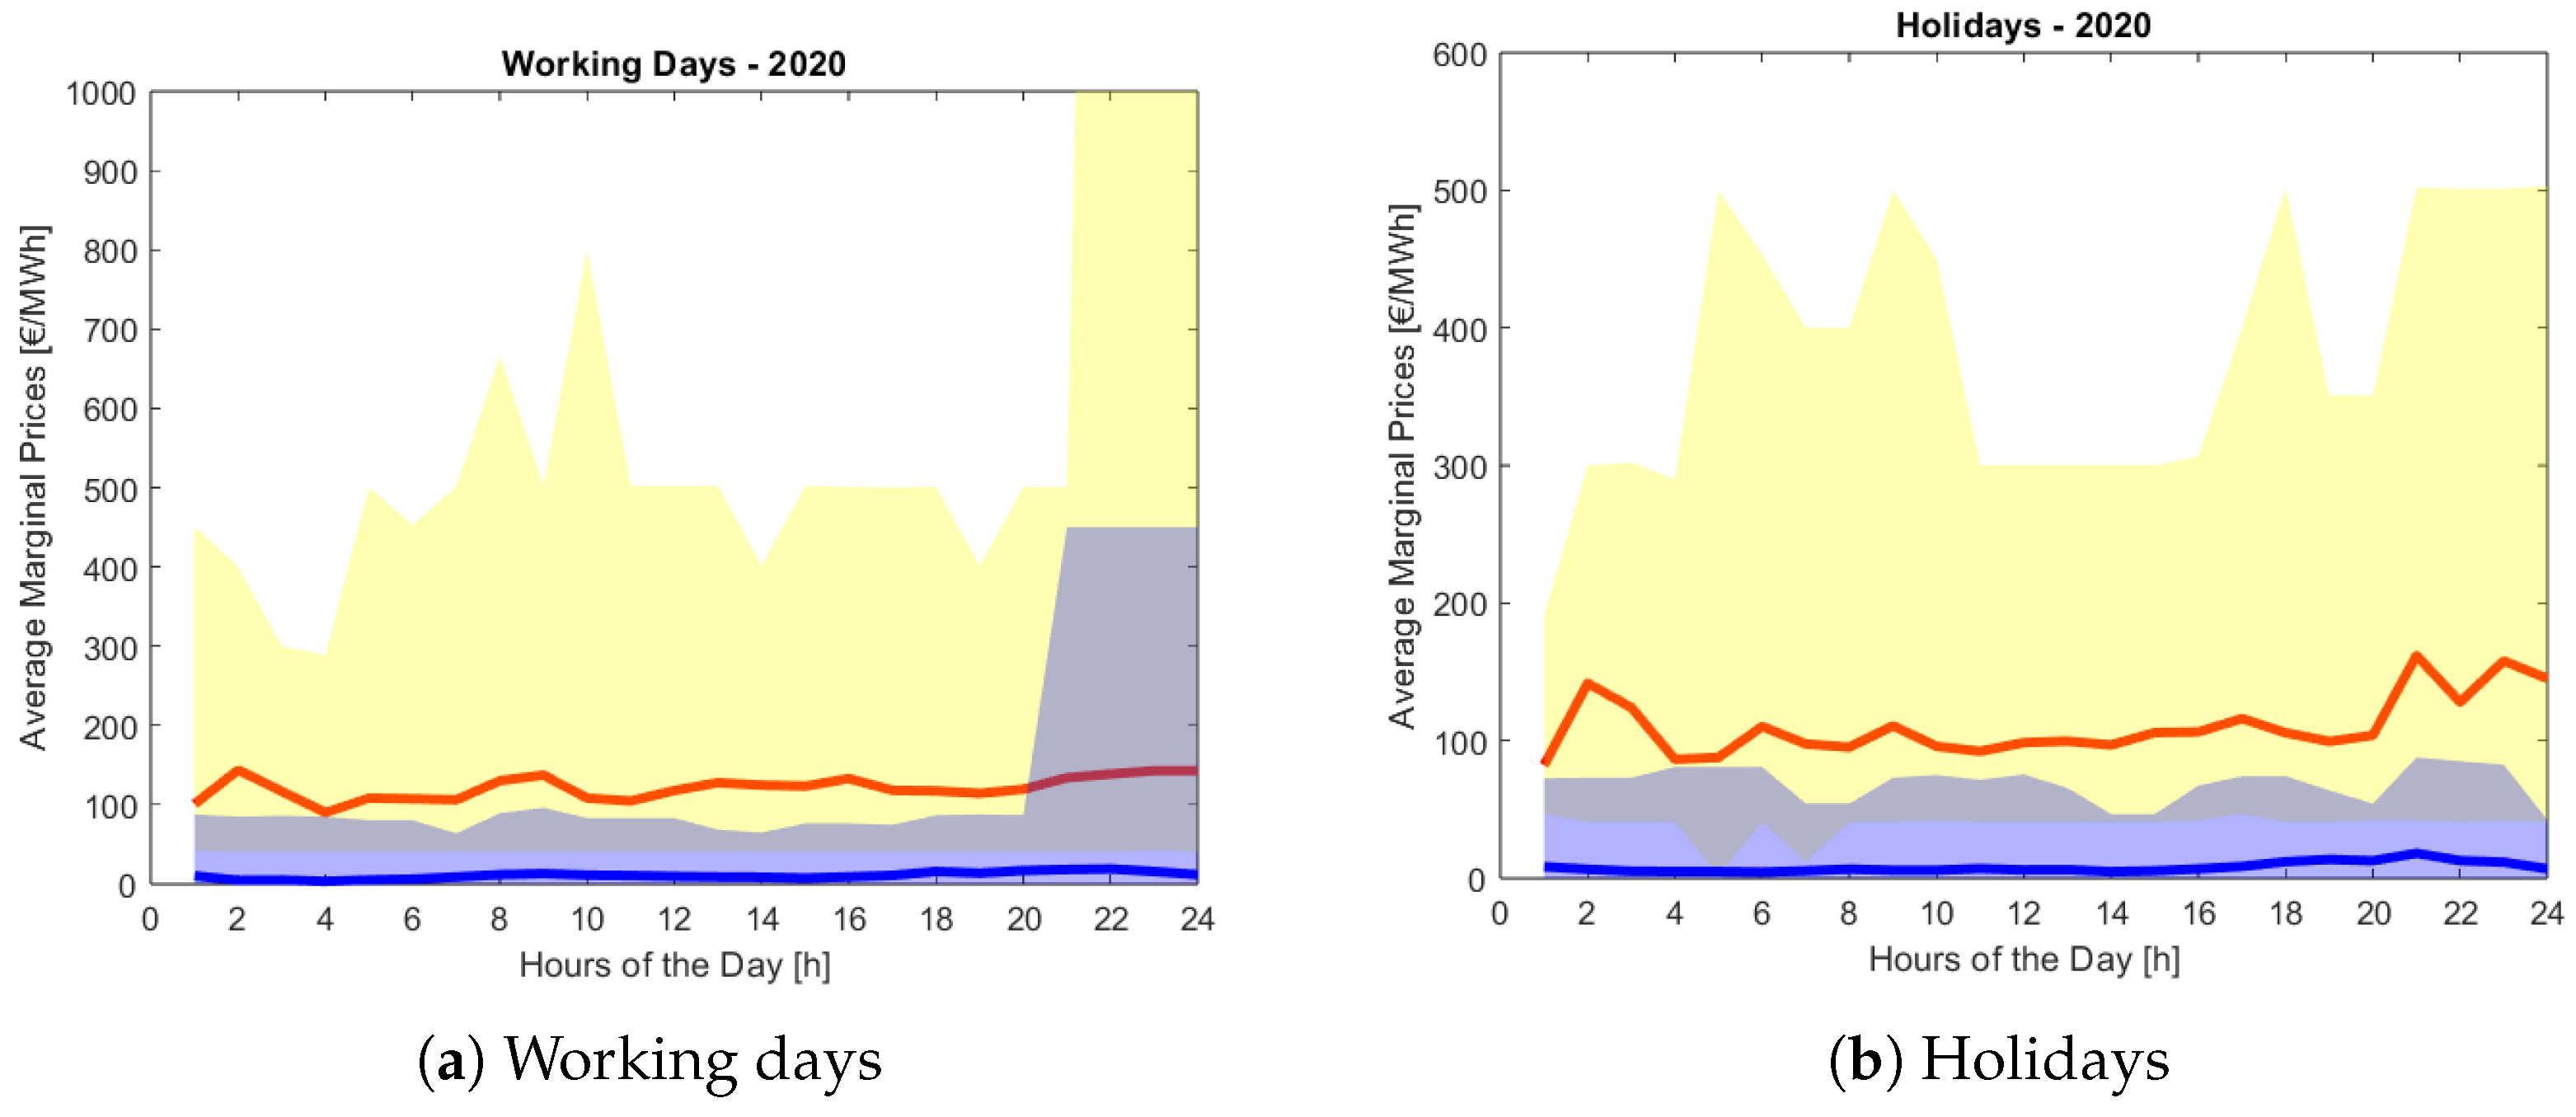
For 2020, the statistical analysis for the upward and downward prices during 2020 highlights the influence of the COVID-19 pandemic on the prices. The results obtained for 2020, for both working days and holidays, are shown in Figure 7a,b, respectively. The average upward prices are generally in the range of EUR 90–150/MWh, which is lower than the case of 2019. The maximum upward price is greater than EUR 1000/MWh during working days, between 9:00 p.m. and 24:00. However, for holidays, the maximum upward price is EUR 500/MWh. Regarding the downward marginal prices, the graph highlights an almost constant behavior indicating the constant willingness to pay throughout the day. The average downward prices range from EUR 5 to 15/MWh, and the minimum value is EUR 0/MWh throughout the year.
The distributions of the upward and downward marginal prices of 2020, along with the hourly average prices for working days and holidays, are illustrated in Figure 8. The maximum upward prices range from EUR 40 to 500/MWh, with two values close to zero. However, the minimum downward prices range between EUR 0 and 80/MWh. During working days, the maximum upward prices reached EUR 3000/MWh for three hours in 2020 at 10:00 p.m., 11:00 p.m., and 12:00 a.m. The impact of COVID-19 is highlighted in the results of the statistical analysis. The hourly average marginal prices and the price profile of 2020 are lower when compared to the business-as-usual case of 2019.
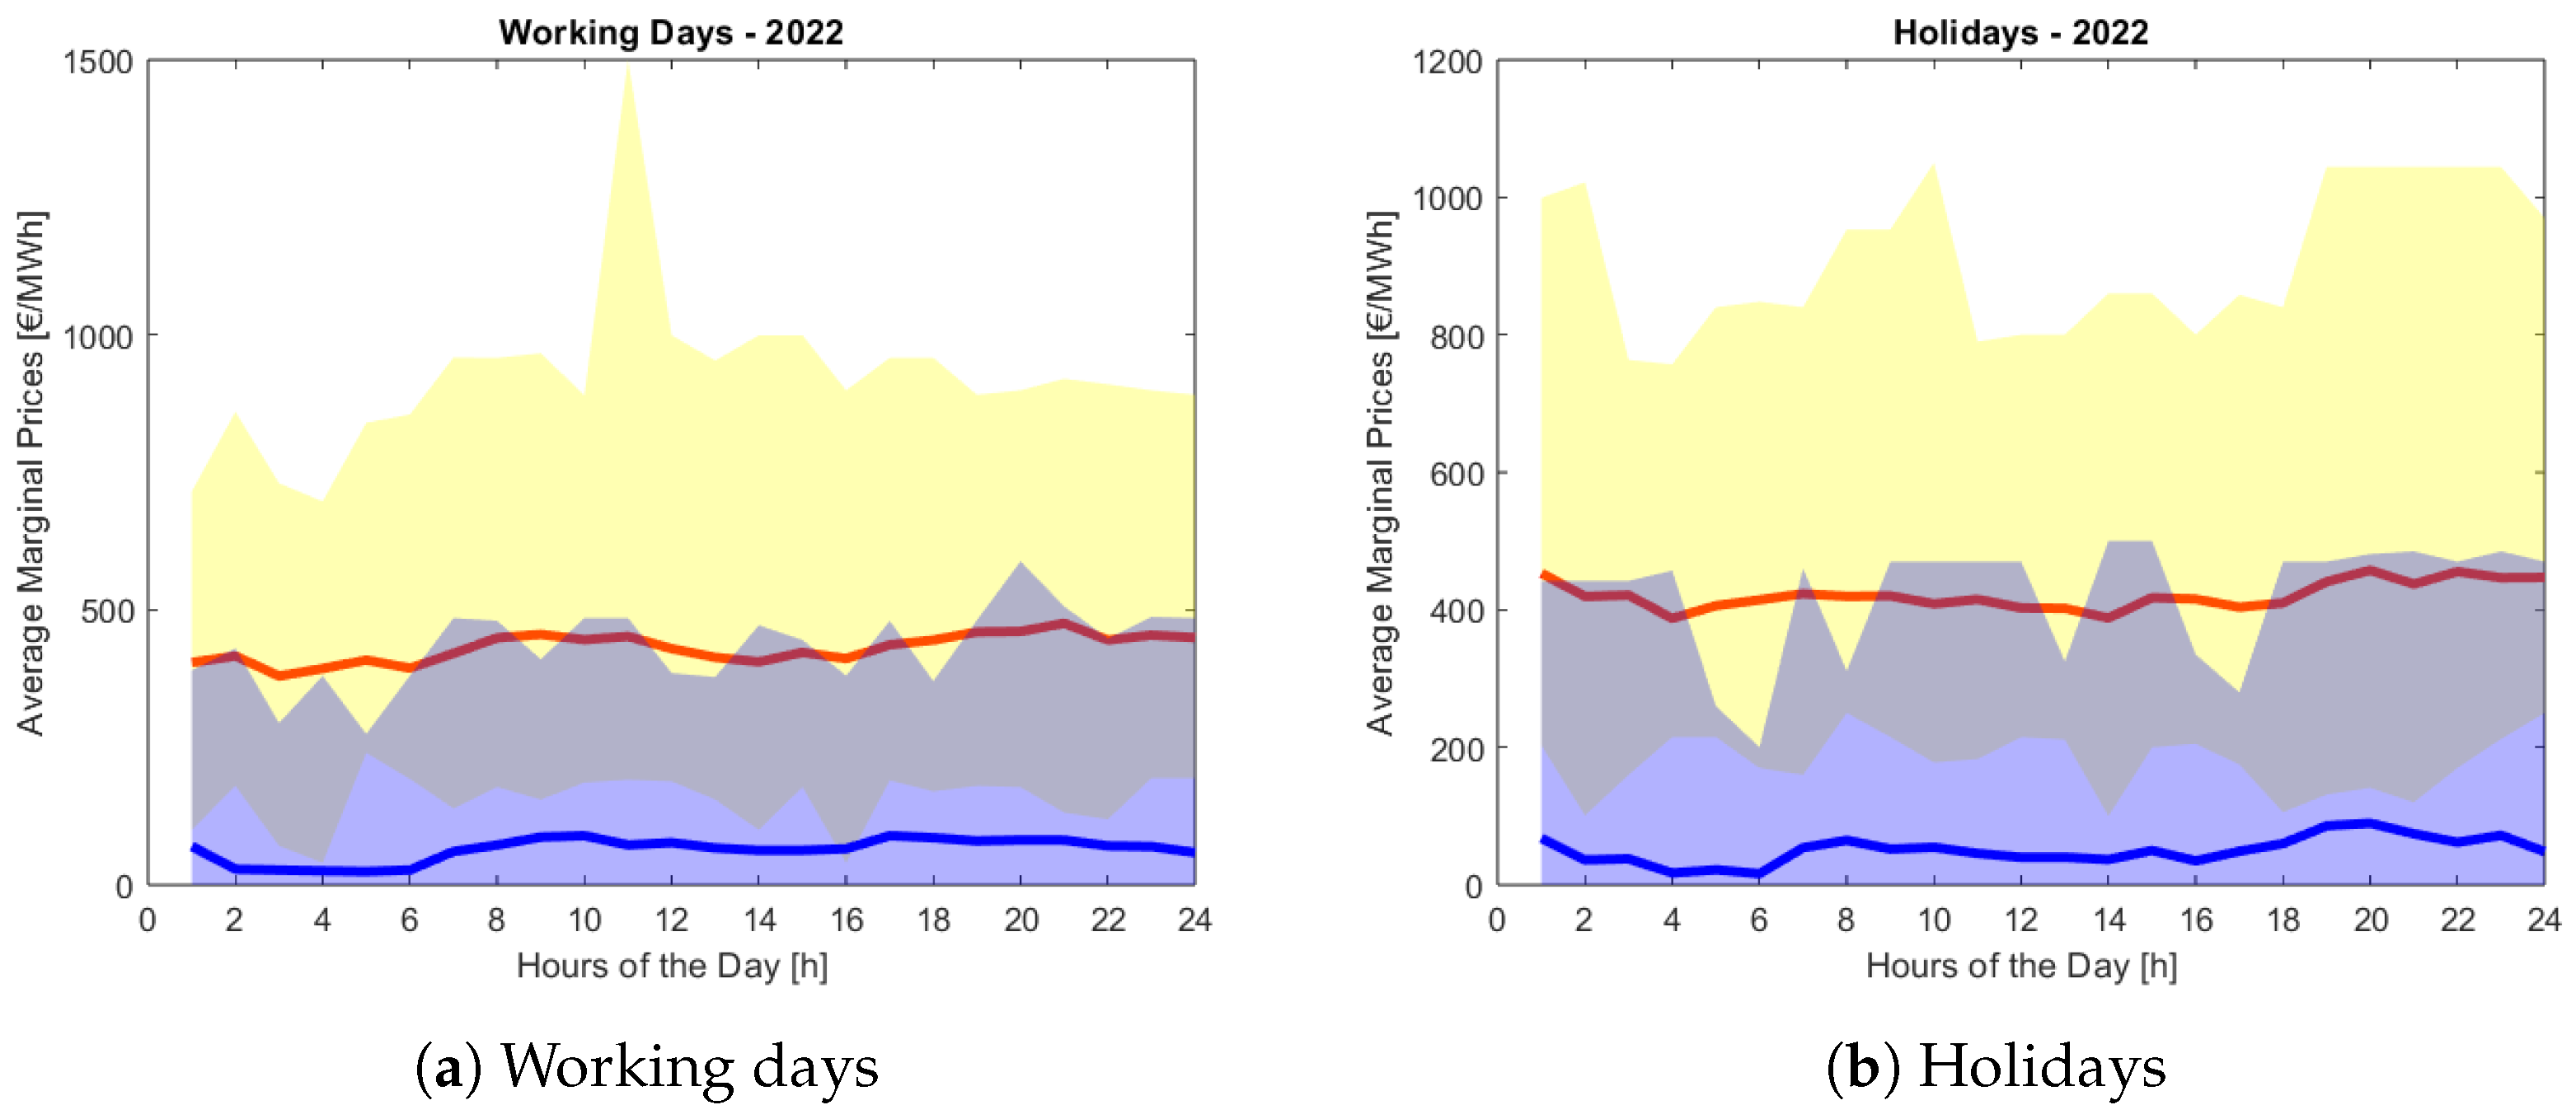
For 2022, the statistical analysis for the upward and downward prices during 2022 highlights the influence of the gas crisis on the prices. The results obtained for 2022, for both working days and holidays, are shown in Figure 9a,b, respectively. The average upward prices are generally in the range of EUR 400–500/MWh, which is higher than the case of 2019. The maximum upward price reaches EUR 1500/MWh during working days. However, the maximum upward price for holidays is around EUR 1000/MWh. Regarding the downward marginal prices, the graph shows a higher variability behavior. The average downward prices are in the range of EUR 50–100/MWh, and the minimum value is EUR 0/MWh throughout the year.
The distributions of upward and downward marginal prices of 2022 are illustrated in Figure 10. The maximum upward prices range from EUR 100 to 1100/MWh. However, the minimum downward prices range between EUR 0 and 500/MWh. During working days, the maximum upward prices reached EUR 1500/MWh for one hour in 2022 at 11:00 a.m. The impact of the gas crisis is highlighted in the results of the statistical analysis. The hourly average marginal prices and the price profile of 2022 are higher when compared to the business-as-usual case of 2019.

5.2.2. Economic Analysis

As previously illustrated, the outcomes of the statistical analysis have been utilized to define the power setpoints of the balancing market. The balancing market setpoint is added to that of the capacity market to define the final setpoint. The sole participation in the capacity market has been adopted as the base case in this analysis. Finally, the generated revenues over 15 years are evaluated and the corresponding IRR is calculated to evaluate the economics of the BESS project. The results are summarized in Table 7.
For all the years considered, the BESS shows a negative economic performance, as highlighted by the negative IRR computed. This is mainly due to the limited size of the BESS and the associated high CAPEX. Additionally, service stacking improves the economics of the project. However, as in 2022, the cycles cycled by the BESS are higher, which reduces the state of health of the batteries. Therefore, augmentation plans are needed to restore the state of health and maintain the batteries. Furthermore, services are offered at varying power rates, which have a direct impact on the overall efficiency. Specifically, participating in the balancing market typically involves requesting low-power setpoints, leading to a lower RTE. Conversely, participating in the capacity market requires higher power setpoints, consequently leading to higher RTE.

5.2.3. Sensitivity Analysis

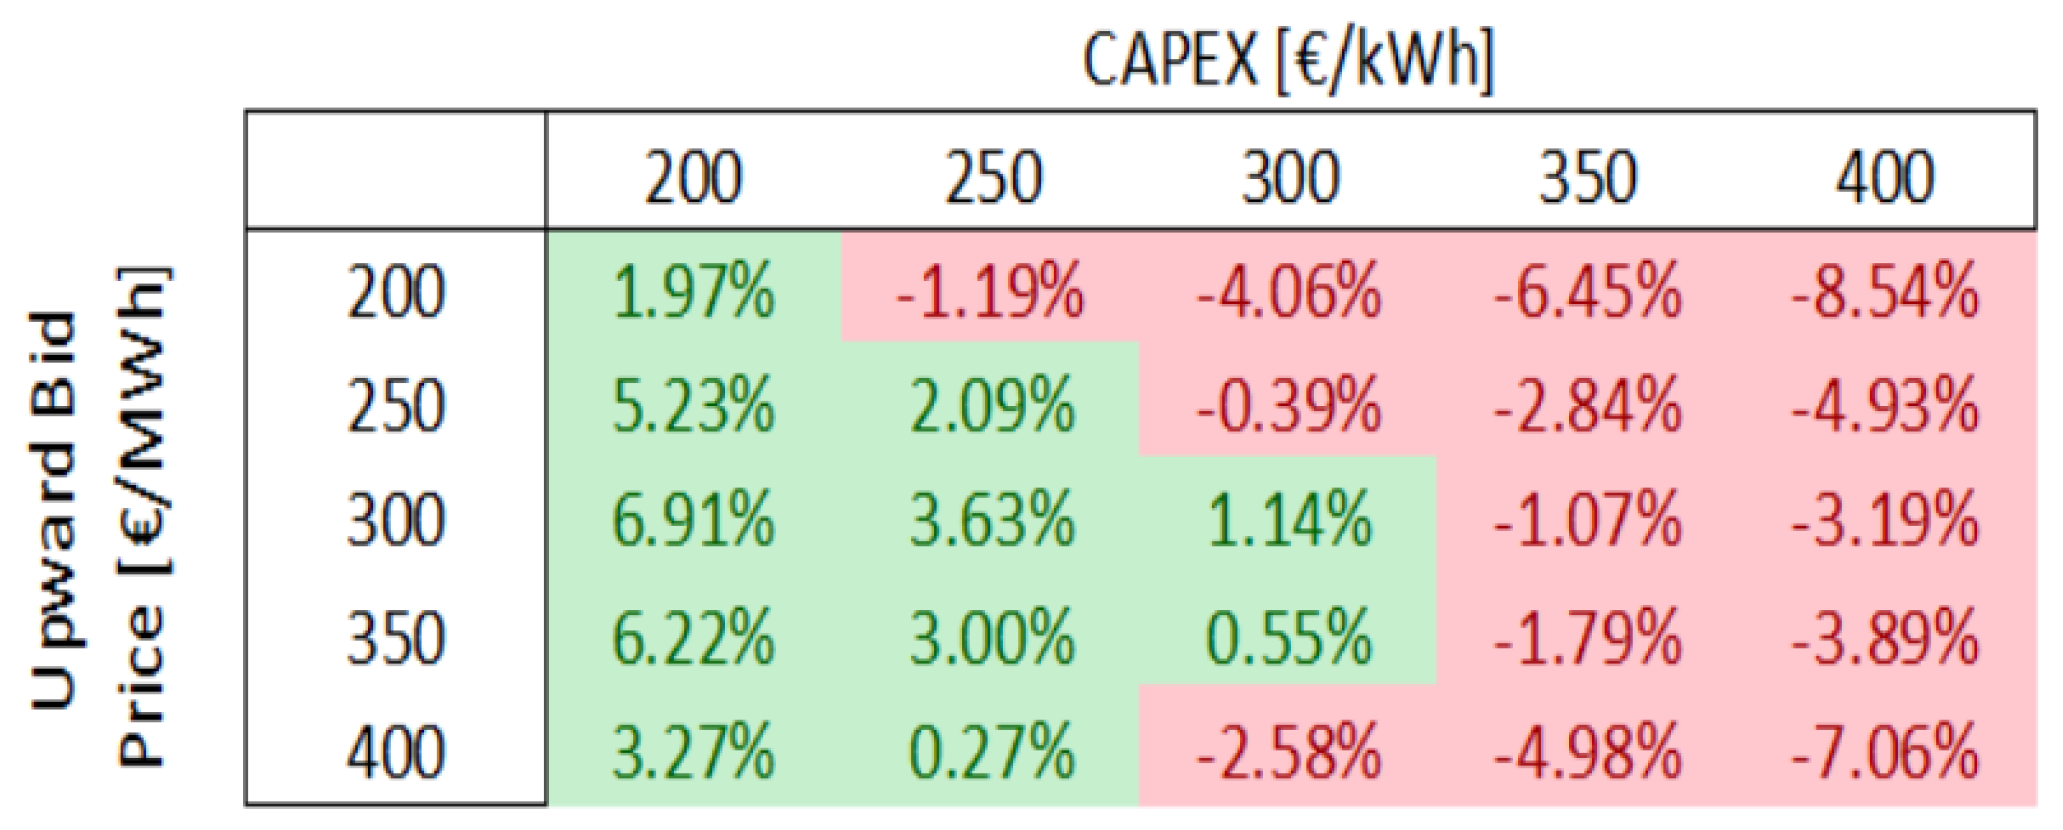
The sensitivity analysis aims to examine the influence of the CAPEX associated with the BESS and the upward bid price on the overall profitability of the project. This in-depth exploration is essential to gain insight into how variations of these key parameters can impact the economic viability of the BESS project. The IRR is selected as the economic indicator for this analysis. Additionally, a higher IRR generally signifies more profitability. The outcomes of the sensitivity analysis are highlighted in Figure 11.
The sensitivity analysis demonstrates a strong relation between the associated CAPEX and the profitability of the project. In particular, a reduction in the CAPEX corresponds to an increase in the project’s IRR for the same upward bid price offered. A CAPEX lower than EUR 300/kWh shows the highest IRR for different upward bid prices. However, noting the NPV of the project, the calculated IRRs are not enough to consider the project profitable. Specifically, it is required for the IRR to surpass the WACC assumed to yield a positive NPV. Consequently, despite the positive IRR values identified through the sensitivity analysis, the project still shows a nonprofitable nature.
Regarding the influence of the maximum upward bid price, the results highlight a positive impact up to a peak value. Specifically, the project’s IRR increased, reaching a maximum of 6.91% at an upward bid price of EUR 300/kWh. After reaching this local maximum, the IRR starts to decline. The outcome of the sensitivity analysis aligns perfectly with the expectations. Indeed, upward offers are accepted only when the upward bid price is lower than the maximum upward price defined by the market. Consequently, the probability of offer acceptance decreases as the offered price rises. In terms of NPV, it consistently remains negative, indicating an overall unprofitable nature of the project.

6. Conclusions

This paper focuses on modeling a BESS to provide multiple services for grid applications. The research study evaluates a techno-economic analysis of the performance of BESS in capacity and balancing markets. The work demonstrates a BESS model that considers the round-trip efficiency of the overall system and the auxiliary power consumption. The model is built by adopting online data collected from an operating BESS. An aging model is also integrated to estimate the state of health of the battery system. Additionally, this work presents an economic model that features the behavior of capacity and balancing markets. Finally, a sensitivity analysis is evaluated to highlight the impact of varying the CAPEX and the upward bid price on the economic performance of the BESS. The goal of the paper is to provide a comprehensive approach to properly model the BESS performances and the behavior of the electricity markets, resulting in a reliable simulation of the economic viability of energy storage as a resource for providing flexibility to the markets. In the approach proposed, both the performance of BESS and the trends of the market price are based on real-life data. In particular, market data belong to the Italian scenario.
The model proposed in this project provides a foundational framework upon which future research and improvements can be conducted. Specifically, enhancing the aging model can be achieved through the consideration of operating parameters.
Finally, it is crucial to highlight how the advanced model proposed in this paper, capable of accurately simulating both the performance of a BESS and market behavior, emphasizes the necessity of a comprehensive evaluation for energy storage projects. Without a thorough assessment, investments in such projects could result in economic losses.

Author Contributions

Conceptualization, G.R.; methodology, H.J., G.R., L.G. and M.M.; software, H.J. and L.G.; formal analysis, H.J. and M.M.; investigation, H.J.; writing—original draft preparation, H.J.; writing—review and editing, H.J., G.R., M.M., M.S. and F.B.; supervision, M.M.; project administration, M.M. All authors have read and agreed to the published version of the manuscript.

Funding

This research received no external funding.

Data Availability Statement

The data supporting the findings of this study are available from the corresponding author, MM, upon reasonable request.

Conflicts of Interest

The authors declare no conflicts of interest.

References

  1. European Commission; Directorate-General for Energy. Clean Energy for All Europeans; Publications Office of the European Union: Luxembourg, 2019. [CrossRef]
  2. Aneke, M.; Wang, M. Energy storage technologies and real life applications—A state of the art review. Appl. Energy 2016, 179, 350–377. [Google Scholar] [CrossRef]
  3. Hesse, H.C.; Schimpe, M.; Kucevic, D.; Jossen, A. Lithium-ion battery storage for the grid—A review of stationary battery storage system design tailored for applications in modern power grids. Energies 2017, 10, 2107. [Google Scholar] [CrossRef]
  4. Brivio, C.; Mandelli, S.; Merlo, M. Battery energy storage system for primary control reserve and energy arbitrage. Sustain. Energy Grids Netw. 2016, 6, 152–165. [Google Scholar] [CrossRef]
  5. Delfanti, M.; Bovera, F.; Falabretti, D.; Merlo, M.; Rancilio, G. BESS Located in Primary Substation for RES Integration and Ancillary Services Provision. In Proceedings of the 25th International Conference on Electricity Distribution, Madrid, Spain, 3–6 June 2019. [Google Scholar]
  6. Iurilli, P.; Brivio, C.; Merlo, M. SoC management strategies in Battery Energy Storage System providing Primary Control Reserve. Sustain. Energy Grids Netw. 2019, 19, 100230. [Google Scholar] [CrossRef]
  7. Cole, W.; Frazier, A.W.; Augustine, C. Cost Projections for Utility-Scale Battery Storage: 2021 Update; U.S. Department of Energy: Oak Ridge, TN, USA, 2021. [CrossRef]
  8. Zubi, G.; Dufo-López, R.; Carvalho, M.; Pasaoglu, G. The lithium-ion battery: State of the art and future perspectives. Renew. Sustain. Energy Rev. 2018, 89, 292–308. [Google Scholar] [CrossRef]
  9. Razzhivin, I.; Suvorov, A.; Ufa, R.; Andreev, M.; Askarov, A. The energy storage mathematical models for simulation and comprehensive analysis of power system dynamics: A review. Part i. Int. J. Hydrogen Energy 2023, 48, 22141–22160. [Google Scholar] [CrossRef]
  10. Rancilio, G.; Merlo, M.; Lucas, A.; Kotsakis, E.; Delfanti, M. BESS modeling: Investigating the role of auxiliary system consumption in efficiency derating. In Proceedings of the 2020 International Symposium on Power Electronics, Electrical Drives, Automation and Motion (SPEEDAM), Sorrento, Italy, 24–26 June 2020; pp. 189–194. [Google Scholar]
  11. Brivio, C.; Musolino, V.; Merlo, M.; Ballif, C. A physically-based electrical model for lithium-ion cells. IEEE Trans. Energy Convers. 2018, 34, 594–603. [Google Scholar] [CrossRef]
  12. Gambhire, P.; Ganesan, N.; Basu, S.; Hariharan, K.S.; Kolake, S.M.; Song, T.; Oh, D.; Yeo, T.; Doo, S. A reduced order electrochemical thermal model for lithium ion cells. J. Power Sources 2015, 290, 87–101. [Google Scholar] [CrossRef]
  13. Hutchinson, A.J.; Gladwin, D.T. Verification and analysis of a Battery Energy Storage System model. Energy Rep. 2022, 8, 41–47. [Google Scholar] [CrossRef]
  14. Lange, C.; Rueß, A.; Nuß, A.; Öchsner, R.; März, M. Dimensioning battery energy storage systems for peak shaving based on a real-time control algorithm. Appl. Energy 2020, 280, 115993. [Google Scholar] [CrossRef]
  15. Rancilio, G.; Lucas, A.; Kotsakis, E.; Fulli, G.; Merlo, M.; Delfanti, M.; Masera, M. Modeling a large-scale battery energy storage system for power grid application analysis. Energies 2019, 12, 3312. [Google Scholar] [CrossRef]
  16. Grimaldi, A.; Minuto, F.D.; Perol, A.; Casagrande, S.; Lanzini, A. Ageing and energy performance analysis of a utility-scale lithium-ion battery for power grid applications through a data-driven empirical modelling approach. J. Energy Storage 2023, 65, 107232. [Google Scholar] [CrossRef]
  17. Lam, L.H.; Ilea, V.; Bovo, C. Impact of the price coupling of regions project on the day-ahead electricity market in Italy. In Proceedings of the 2017 IEEE Manchester PowerTech, Manchester, UK, 18–22 June 2017; pp. 1–6. [Google Scholar]
  18. Silva, N.; Bernardo, A.M.; Pestana, R.; Pinto, C.M.; Carrapatoso, A.; Dias, S. Interaction between DSO and TSO to increase DG penetration-the Portuguese example. In Proceedings of the CIRED 2012 Workshop: Integration of Renewables into the Distribution Grid, Lisbon, Portugal, 29–30 May 2012. [Google Scholar]
  19. Gubernali, A.; Salvati, R.; Zaottini, R. Partecipazione alla regolazione di frequenza e frequenza-potenza. Terna Codice Rete 2008. [Google Scholar]
  20. Thien, T.; Schweer, D.; vom Stein, D.; Moser, A.; Sauer, D.U. Real-world operating strategy and sensitivity analysis of frequency containment reserve provision with battery energy storage systems in the german market. J. Energy Storage 2017, 13, 143–163. [Google Scholar] [CrossRef]
  21. Fabozzi, D.; Thornhill, N.F.; Pal, B.C. Frequency restoration reserve control scheme with participation of industrial loads. In Proceedings of the 2013 IEEE Grenoble Conference, Grenoble, France, 16–20 June 2013; pp. 1–6. [Google Scholar]
  22. Ullah, K.; Basit, A.; Ullah, Z.; Aslam, S.; Herodotou, H. Automatic generation control strategies in conventional and modern power systems: A comprehensive overview. Energies 2021, 14, 2376. [Google Scholar] [CrossRef]
  23. Caprabianca, M.; Falvo, M.C.; Papi, L.; Promutico, L.; Rossetti, V.; Quaglia, F. Replacement reserve for the italian power system and electricity market. Energies 2020, 13, 2916. [Google Scholar] [CrossRef]
  24. Roumkos, C.; Biskas, P.; Marneris, I. Modeling Framework Simulating the TERRE Activation Optimization Function. Energies 2020, 13, 2966. [Google Scholar] [CrossRef]
  25. dei Mercati Energetici SpA, G.G. Relazione Annuale 2022. Available online: https://www.mercatoelettrico.org/it/MenuBiblioteca/documenti/GME_RelazioneAnnualeWeb_2022.pdf (accessed on 19 December 2023).
  26. Spa, T. Rapporto Mensile sul Sistema Elettrico Dicembre 2023. Available online: https://download.terna.it/terna/Rapporto_Mensile_Dicembre_23_8dc1752b3455abb.pdf (accessed on 19 December 2023).
  27. Kroposki, B.; Johnson, B.; Zhang, Y.; Gevorgian, V.; Denholm, P.; Hodge, B.M.; Hannegan, B. Achieving a 100% renewable grid: Operating electric power systems with extremely high levels of variable renewable energy. IEEE Power Energy Mag. 2017, 15, 61–73. [Google Scholar] [CrossRef]
  28. Brouwer, A.S.; Van Den Broek, M.; Seebregts, A.; Faaij, A. Impacts of large-scale Intermittent Renewable Energy Sources on electricity systems, and how these can be modeled. Renew. Sustain. Energy Rev. 2014, 33, 443–466. [Google Scholar] [CrossRef]
  29. Commission, E. COMMISSION REGULATION (EU) 2017/2195 of 23 November 2017 establishing a guideline on electricity balancing. Off. J. Eur. Union 2017, 312, 6–53. [Google Scholar]
  30. Rancilio, G.; Rossi, A.; Falabretti, D.; Galliani, A.; Merlo, M. Ancillary services markets in europe: Evolution and regulatory trade-offs. Renew. Sustain. Energy Rev. 2022, 154, 111850. [Google Scholar] [CrossRef]
  31. Gulotta, F.; Daccò, E.; Bosisio, A.; Falabretti, D. Opening of Ancillary Service Markets to Distributed Energy Resources: A Review. Energies 2023, 16, 2814. [Google Scholar] [CrossRef]
  32. Falabretti, D.; Gulotta, F.; Siface, D. Flexibility Provision by an Aggregate of Electric Boilers in the Italian Regulatory Framework. In Proceedings of the 2021 AEIT International Annual Conference (AEIT), Milan, Italy, 4–8 October 2021; pp. 1–6. [Google Scholar]
  33. Gulotta, F.; Rossi, A.; Bovera, F.; Falabretti, D.; Galliani, A.; Merlo, M.; Rancilio, G. Opening of the Italian Ancillary Service Market to Distributed Energy Resources: Preliminary Results of UVAM project. In Proceedings of the 2020 IEEE 17th International Conference on Smart Communities: Improving Quality of Life Using ICT, IoT and AI (HONET), Charlotte, NC, USA, 14–16 December 2020; pp. 199–203. [Google Scholar]
  34. Vargas-Ferrer, P.; Álvarez-Miranda, E.; Tenreiro, C.; Jalil-Vega, F. Assessing flexibility for integrating renewable energies into carbon neutral multi-regional systems: The case of the Chilean power system. Energy Sustain. Dev. 2022, 70, 442–455. [Google Scholar] [CrossRef]
  35. Nayak, P.; Mandal, S.; Gupta, Y.; Shukla, A.; Doolla, S. Improving the efficiency of the DAB converter of an on-board EV charger using different modulation techniques. In Proceedings of the 2020 IEEE International Conference on Power Electronics, Drives and Energy Systems (PEDES), Jaipur, India, 16–19 December 2020; pp. 1–6. [Google Scholar]
  36. Zhao, T.; Parisio, A.; Milanović, J.V. Location-dependent distributed control of battery energy storage systems for fast frequency response. Int. J. Electr. Power Energy Syst. 2021, 125, 106493. [Google Scholar] [CrossRef]
  37. Rancilio, G.; Bovera, F.; Merlo, M. Revenue Stacking for BESS: Fast Frequency Regulation and Balancing Market Participation in Italy. Int. Trans. Electr. Energy Syst. 2022, 2022. [Google Scholar] [CrossRef]
  38. Amin, M.R.; Negnevitsky, M.; Franklin, E.; Naderi, S.B. Frequency response of synchronous generators and battery energy storage systems: A comparative study. In Proceedings of the 2019 29th Australasian Universities Power Engineering Conference (AUPEC), Nadi, Fiji, 26–29 November 2019; pp. 1–6. [Google Scholar]
  39. Arrigo, F.; Bompard, E.; Merlo, M.; Milano, F. Assessment of primary frequency control through battery energy storage systems. Int. J. Electr. Power Energy Syst. 2020, 115, 105428. [Google Scholar] [CrossRef]
  40. Datta, U.; Kalam, A.; Shi, J. The relevance of large-scale battery energy storage (BES) application in providing primary frequency control with increased wind energy penetration. J. Energy Storage 2019, 23, 9–18. [Google Scholar] [CrossRef]
  41. Stecca, M.; Soeiro, T.B.; Elizondo, L.R.; Bauer, P.; Palensky, P. Lifetime estimation of grid-connected battery storage and power electronics inverter providing primary frequency regulation. IEEE Open J. Ind. Electron. Soc. 2021, 2, 240–251. [Google Scholar] [CrossRef]
  42. Ponnaganti, P.; Bak-Jensen, B.; Wæhrens, B.V.; Asmussen, J. Assessment of energy arbitrage using energy storage systems: A wind park’s perspective. Energies 2021, 14, 4718. [Google Scholar] [CrossRef]
  43. Peñaranda, A.F.; Romero-Quete, D.; Cortés, C.A. Grid-scale battery energy storage for arbitrage purposes: A colombian case. Batteries 2021, 7, 59. [Google Scholar] [CrossRef]
  44. Elshurafa, A.M. The value of storage in electricity generation: A qualitative and quantitative review. J. Energy Storage 2020, 32, 101872. [Google Scholar] [CrossRef]
  45. Englberger, S.; Hesse, H.; Hanselmann, N.; Jossen, A. SimSES Multi-Use: A simulation tool for multiple storage system applications. In Proceedings of the 2019 16th International Conference on the European Energy Market (EEM), Ljubljana, Slovenia, 18–20 September 2019; pp. 1–5. [Google Scholar]
  46. Englberger, S.; Jossen, A.; Hesse, H. Unlocking the potential of battery storage with the dynamic stacking of multiple applications. Cell Rep. Phys. Sci. 2020, 1, 100238. [Google Scholar] [CrossRef]
  47. Spiller, M.; Rancilio, G.; Bovera, F.; Gorni, G.; Mandelli, S.; Bresciani, F.; Merlo, M. A Model-Aware Comprehensive Tool for Battery Energy Storage System Sizing. Energies 2023, 16, 6546. [Google Scholar] [CrossRef]
  48. Hameed, Z.; Træholt, C.; Hashemi, S. Investigating the participation of battery energy storage systems in the Nordic ancillary services markets from a business perspective. J. Energy Storage 2023, 58, 106464. [Google Scholar] [CrossRef]
  49. Mercato Della Capacità—Disposizioni Tecniche di Funzionamento (DTF)—Terna Spa. Available online: https://www.terna.it/it/sistema-elettrico/pubblicazioni/news-operatori/dettaglio/CM-Disposizioni-tecniche-di-funzionamento-DTF (accessed on 19 December 2023).
  50. Sahdev, S. Electrical Machines; Cambridge University Press: Cambridge, UK, 2017. [Google Scholar]
  51. Commission Regulation (EU) No 548/2014 of 21 May 2014 on Implementing Directive 2009/125/EC of the European Parliament and of the Council with Regard to Small, Medium and Large Power Transformers. 2014. Available online: https://www.legislation.gov.uk/eur/2014/548/data.pdf (accessed on 19 December 2023).
  52. GS1500i 1500 V Central Solar Inverter. Available online: www.nidec-industrial.com (accessed on 19 December 2023).
Figure 1. Frequency and non-frequency ancillary services market.
Batteries 10 00069 g001
Figure 2. CDFs for upward regulation (a) and downward regulation (b) for each year.
Batteries 10 00069 g002
Figure 3. Transformer (a) and inverter (b) efficiency curves.
Batteries 10 00069 g003
Figure 4. Battery efficiency (a) and auxiliary power consumption (b) curves.
Batteries 10 00069 g004
Figure 5. Average marginal prices for 2019 for upward and downward regulations: (a) working days and (b) holidays.
Batteries 10 00069 g005
Figure 6. Marginal price distributions for 2019: (a) upward prices—working days, (b) downward prices—working days, (c) upward prices—holidays, and (d) downward prices—holidays.
Batteries 10 00069 g006
Figure 7. Average marginal prices for 2020 for upward and downward regulations: (a) working days and (b) holidays.
Batteries 10 00069 g007
Figure 8. Marginal price distributions for 2020: (a) upward prices—working days, (b) downward prices—working days, (c) upward prices—holidays, and (d) downward prices—holidays.
Batteries 10 00069 g008
Figure 9. Average marginal prices for 2022 for upward and downward regulations: (a) working days and (b) holidays.
Batteries 10 00069 g009
Figure 10. Marginal price distributions for 2022: (a) upward prices—working days, (b) downward prices—working days, (c) upward prices—holidays, and (d) downward prices—holidays.
Batteries 10 00069 g010
Figure 11. IRR with respect to upward bid price and CAPEX obtained in the sensitivity analysis—2022.
Batteries 10 00069 g011
Table 1. Multi-service simulation dataset.
KeyValueUnit
Derating56(%)
P C D P 0.88(MW)
LCOS130(EUR/MWh)
Temperature ProfilesSouthern Italy for years 2019, 2020, and 2022(°C)
DAM Price ProfilesItalian Market for years 2019, 2020, and 2022(EUR/MWh)
CDFsItalian Market for years 2019, 2020, and 2022(%)
Table 2. WACC calculation dataset.
KeyValueUnit
K d 6(%)
K e 12(%)
t28(%)
D/D+E50(%)
E/D+E50(%)
Table 3. Economic Analysis Dataset.
KeyValueUnit
OPEX2% of CAPEX(EUR)
Capacity PremiumBased on [49](EUR)
Tax Rate28(%)
Table 4. Coefficients p 1 , p 2 , p 3 , and p 4 and the goodness-of-fit parameter R 2 of the fitting function.
Fitting FunctionCoefficientsValues
P a u x (T) = p 1 × T 3 + p 2 × T 2 + p 3 × T + p 4 p 1 9.4870 × 10 5
p 2 0.0530
p 3 −0.8215
p 4 11.9100
R 2 0.9415
Table 5. Results of the cycle analysis.
PointEfficiency (%)Average Power (kW)
196.74180
296.28312
395.15377
494.11623
Table 6. Coefficients p 1 and p 2 and the goodness-of-fit parameter R 2 of the fitting function.
Fitting FunctionCoefficientsValues
η = p 1 × P + p 2 p 1 −0.0061
p 2 97.8600
R 2 0.9337
Table 7. Outcomes for each assumed scenario and year.
KeyYear
201920202022
Capacity MarketService StackingCapacity MarketService StackingCapacity MarketService Stacking
FEC (cycles)-69.2-62.7411480
SoH (%)10099.6310099.6696.295.65
DAM Net Profits (EUR)----35,50035,500
BM Net Profits (EUR)-10,058-6503-15,560
Capacity Payment (EUR)61,60061,60061,60061,60061,60061,600
Net Profits (EUR)61,60071,65861,600681,03497,100112,660
IRR (%)−10.22−7.82−10.22−8.62−3.09−0.73
Disclaimer/Publisher’s Note: The statements, opinions and data contained in all publications are solely those of the individual author(s) and contributor(s) and not of MDPI and/or the editor(s). MDPI and/or the editor(s) disclaim responsibility for any injury to people or property resulting from any ideas, methods, instructions or products referred to in the content.