Abstract
The intermittent nature of power generation from photovoltaics (PV) requires reliable energy storage solutions. Using the storage system outdoors exposes it to variable temperatures, affecting both its storage capacity and lifespan. Utilizing and optimizing energy storage considering climatic variations and new storage technologies is still a research gap. Therefore, this paper presents a modified sizing algorithm based on the Golden Section Search method, aimed at optimizing the number of cells in an energy storage unit, with a specific focus on the unique conditions of Denmark. The considered energy storage solutions are Lithium-ion capacitors (LiCs) and Lithium-ion batteries (LiBs), which are tested under different temperatures and C-rates rates. The algorithm aims to maximize the number of autonomy cycles—defined as periods during which the system operates independently of the grid, marked by intervals between two consecutive 0% State of Charge (SoC) occurrences. Testing scenarios include dynamic temperature and dynamic load, constant temperature at 25 °C, and constant load, considering irradiation and temperature effects and cell capacity fading over a decade. A comparative analysis reveals that, on average, the LiC storage is sized at 70–80% of the LiB storage across various scenarios. Notably, under a constant-temperature scenario, the degradation rate accelerates, particularly for LiBs. By leveraging the modified Golden Section Search algorithm, this study provides an efficient approach to the sizing problem, optimizing the number of cells and thus offering a potential solution for energy storage in off-grid PV systems.
1. Introduction
The world’s reliance on fossil fuels has increased over the years. This nonrenewable resource of energy has adversely affected our environment, contributing to climate change. Renewable energy, particularly solar photovoltaics (PV), is a viable alternative to fossil fuels. The integration of PV into power systems has significantly increased in recent years due to the global focus on reducing greenhouse gas emissions and moving toward a sustainable-energy future. Residential PV systems combined with energy storage (ES) have become a viable electricity supply [1]. However, finding the optimal energy storage technology for such applications is an ongoing challenge, mainly due to various factors such as temperature variations, irradiation profiles, and degradation over time.
Currently, Lithium-ion batteries (LiBs) are the dominant energy storage technology in the market, offering low self-discharge, a long cycle life, and a high energy density [2]. However, LiBs (i.e., LiB plural) exhibit some limitations in outdoor/off-grid applications, especially when subjected to temperature fluctuations and subzero temperatures [3]. Furthermore, their performance degrades over time, leading to the need for oversizing the battery storage to compensate for capacity loss during the system’s operational life [4].
Supercapacitors have emerged as a promising new form of energy storage, boasting a relatively high energy density that positions them as potential competitors to batteries, particularly in light of recent advancements in materials technology [5].
Lithium-ion capacitors (LiCs) are a hybridization between the electric double-layer capacitors (EDLCs) and LiBs. LiCs (i.e., LiC plural) combine the advantages of the high energy density of LiBs with the high power density and long cycle life of the EDLCs. LiCs have emerged as a promising alternative for energy storage in off-grid PV applications. Recent research has shown that LiCs offer several advantages over LiBs, including higher power density, greater tolerance to temperature variations [6], and slower degradation rates [7]. Additionally, LiCs are a niche technology with limited industry usage, affecting their pricing compared to established LiBs [8]. As LiC market adoption grows and economies of scale take effect, their costs are expected to decrease, making them a more attractive alternative.
Despite these advantages, there is still limited literature on sizing LiCs for off-grid PV applications. Previous studies have mainly focused on sizing batteries for such applications [9,10]. This paper aims to address this gap by developing a sizing model for LiCs in off-grid residential PV applications and comparing their performance to LiBs in terms of size, degradation, and sensitivity to climatic conditions in Denmark.
This paper is structured into the subsequent sections: a literature review and discussion of the research gaps in Section 2; system modeling in Section 3; the devices’ performance characterization and comparison in Section 4; sizing and optimization in Section 5; and capacity fade as a factor of sizing and the conclusion in Section 6 and Section 7, respectively.
2. Literature Review and Research Gap
In residential systems, there has been an uptrend for integrating batteries with PV systems due to the battery prices dropping [11]. The battery lifetime is known to be shorter than the PV panel lifetime. PV panels, over a span of 25 years of operation, exhibit a 0.85% rate of degradation per year [12]. The lifespan of power electronics is approximately 10 years [13]. This makes the battery, being the most vulnerable component in the system, require regular maintenance and cell replacements throughout the system’s lifespan. This reduces the practicality of energy storage with PV systems for residential use [14].
A battery-integrated PV panel is a compact example of a PV-storage system. This concept was investigated in [15] where the optimal battery capacity and PV panel size were studied in addition to the operational condition’s effect on the battery capacity and performance. The advantages of a PV-battery concept were compared to typical solar home systems, and the model was found to have poor cooling and 2.16% extra losses compared to the regular solar residential system. After one year of operation, the battery capacity decreased by 1%. A similar system to the one presented in [4,15] was proposed in [6] but with the replacement of batteries with hybrid supercapacitors. These hybrid supercapacitors, including LiC type, combine the benefits of EDLC supercapacitors and LiBs. EDLC supercapacitors store energy as electrostatic energy, making them more durable and operable in low temperatures. On the other hand, LiBs store energy through redox reactions, providing a higher energy density at the cost of faster degradation. Hybrid supercapacitors offer a combination of these benefits, resulting in a versatile energy storage solution that balances power density and energy density [16,17].
A comparison between LiBs and LiCs in off-grid PV systems was performed in [6], which demonstrated that LiCs are less vulnerable to variables such as current and temperature. When these factors are considered for storage sizing, LiCs are less oversized than LiBs.
An important key factor in selecting the storage type is its optimization within the targeted system [18], and optimization sizing methodologies are used for renewable energy storage in residential applications [19]. Optimization based on historical data is utilized in applications like peak shaving, where the storage capacity is determined by the highest load observed throughout the year [20]. A similar study focused on the simulation-driven determination of system sizing is discussed in [21], where system modeling and simulation techniques are applied to determine the proper sizing of PV generation and energy storage (ES) capacity in an isolated solar PV system.
This approach could provide valuable insights for sizing LiCs in off-grid PV applications and aid the development of a system that is more reliable and efficient.
Importantly, the temperature applied to the ES in this work specifically refers to the temperature of the PV panels. This is in line with the concept of Integrated PV Energy Storage systems as discussed in [6], where the temperature of the panels directly influences the storage conditions.
In system sizing optimization, the choice of the optimization method is a crucial aspect. The Golden Section Search is recognized for its rapid convergence [22] and is advantageous for problems involving long simulation periods due to its ability to reduce the number of iterations required to find the optimal solution [23]. Though many studies have investigated the integration of batteries with PV systems, within the topic of the optimization of hybrid supercapacitors and the comparison between LiBs and LiCs, there remains a discernible gap in the literature regarding the comprehensive sizing methodologies and degradation models tailored specifically for LiCs in off-grid PV applications. This necessitates further exploration to ensure more efficient and reliable energy storage optimization solutions in such scenarios.
3. System Modeling
The studied off-grid PV system consists of the four following elements: PV panel, charge controller, energy storage, and dynamic load, as shown in Figure 1. This system is meant to power the basic loads of a summer house or a boat appliance without thermal management (e.g., heating or cooling) applied.
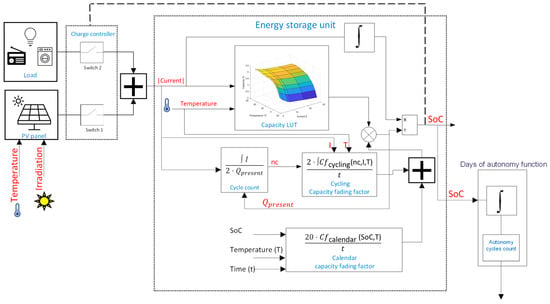
Figure 1.
System model of the integrated PV-LiC energy storage for off-grid applications.
This system model has two inputs (temperature and irradiation, as shown in Figure 1), and the inputs are plotted in Figure 2. The temperature and irradiation data were recorded in Aalborg, Denmark.
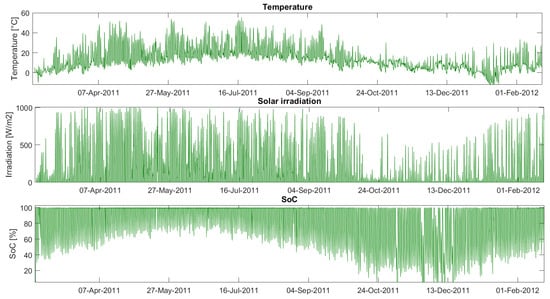
Figure 2.
SoC, irradiation, and PV panel temperature variations during the year 2011.
- PV panel: The power generation from the PV panel is depicted by , where T is the panel temperature and G is the input irradiation. The generated power is obtained from Equation (1):where is the power capacity at Standard Test Conditions (STC) while represents the temperature coefficient of the chosen photovoltaic module; the value of is .
The temperature and solar irradiation input data are provided in one-hour intervals over the course of the year. The capacity of the PV panels is set to accommodate the peak load and is not subject to optimization. The generated power from the is derived by multiplying the power from the panels, , with the efficiency η of the power electronics used in the conversion process, where η is considered 95%.
- The charge controller has the function of stopping the charging of the ES when it reaches or of stopping the discharging at . In this work, and are defined as 100% and 0%, respectively.
- LiC energy storage is demonstrated in Figure 1, and its State of Charge is described by Equation (2). This model takes two inputs, the storage power feed and panel temperature, and yields one output, the SoC. Temperature plays a significant role in influencing the storage capacity, as will be detailed in Section 4:where I = while Q represents the capacity of an individual storage cell, where Q = . As in [24], Q is represented as a two-dimensional lookup table showing the storage capacity based on temperature T and current I. Laboratory tests on the LiC cell, which demonstrate the capacity’s dependence on temperature and current, are detailed in Section 4. Additionally, the model has a sizing factor input. This factor, used to scale the storage capacity by the number of cells utilized, plays a role in the size optimization algorithm discussed in Section 5.
The capacity fade factor (Cf) was used to add a capacity fade effect over the time of operation. It will be discussed in Section 4.3.
- Dynamic load is a simulated load profile of household appliances (such as TV, radio, laptop, small heater, and small fridge) and the lighting load. The load demand (LD) is derived from (3):where α represents a randomly generated number between 0 and 1; this is used to simulate dynamic variations in the load. Additionally, the daylight factor (DLF) equals 0 when there is irradiation and the lighting load is not required (), and DLF = 1 when there is no solar irradiation and lighting is required ().
Figure 2 presents an illustrative depiction of the variation in the supercapacitor’s over the course of a year, influenced by fluctuations in irradiation and temperature. While Figure 2 does not precisely align with the subsequent scenarios under discussion, it provides qualitative insight into the dynamics of the SoC, notably emphasizing the reduced SoC levels during winter months (i.e., that the maximum depth of discharge considered in this study is 100%), attributed to the effects of rainy days and decreased irradiation and temperature (e.g., low irradiation, as depicted in Figure 2 toward the end of September).
4. ES Devices’ Performance Characterization and Comparison
Laboratory tests are performed to determine to which extent the LiC capacity depends on the C-rate and temperature as a sample test of the conditions to which this system will be exposed. In the system under study, a range of temperature conditions is experienced by the PV panel throughout the year. Based on actual data from a PV panel located in Aalborg city, operational temperatures ranging from −10 °C to 55 °C are examined. A 4 Ah LiC and a 13 Ah high-power LiB are characterized in this work. Both devices’ parameters are presented in Table 1.

Table 1.
Datasheet parameters of li-ion battery and hybrid supercapacitor cells.
The 4 Ah LiC (i.e., the highest capacity available commercially) was chosen for the novel approach of using LiCs in energy storage, comparing it with the higher-power 13 Ah LiB and providing valuable insights into its high performance in PV applications.
Table 1 data are extracted from the datasheets of the LiC and the LiB. The operating temperature range and the life cycle are laboratory tested, and the results can be found in this section.
4.1. Laboratory Characterization
All laboratory testing was performed on the LiC cells, according to the IEC 62391-1_2016 class 2 standard for ES supercapacitors [25], where six different C-rates were used for charging/discharging the LiC cells with C-rates from 0.5 C (2 A) to 7.5 C (30 A) and temperatures from −10 to 55 °C. During all the measurements, the LiC-tested cell was placed in a Memmert climatic chamber, which provides the environmental conditions required in each test. The tests provided information on the tested cell, such as the capacity and equivalent series resistance (ESR), under different conditions of discharge currents and temperatures.
The same measurements were made on the 13 Ah high-power LiB following IEC 62660-1 [26]. This was performed to assess and contrast the influence of temperature and the C-rate on the capacity of both devices.
4.2. LiB and LiC Comparison
Figure 3 illustrates the percentage of the usable capacity dependence on the C-rate and temperature for both the LiB and LiC (where the base value of the LiB: at 45 °C and 0.5 C and the base value of LiC: at 45 °C and 0.5 C).
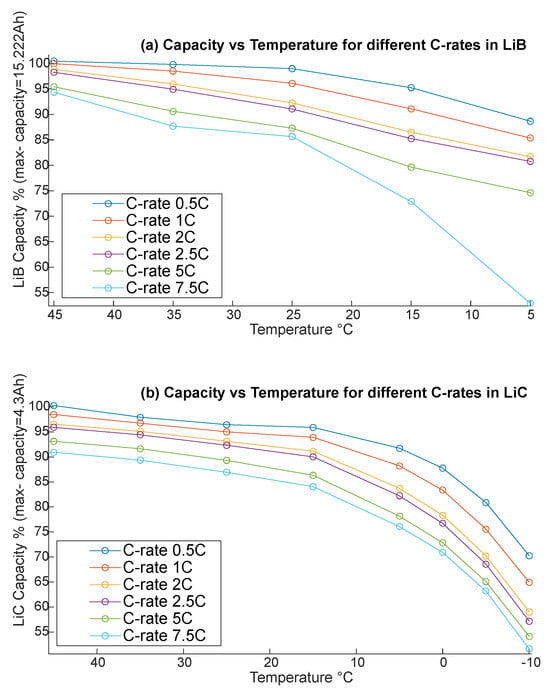
Figure 3.
The dependence of usable capacity (in percent) on C-rate and temperature for LiB (a) and LiC (b).
Observations indicate that the LiB’s capacity for a low discharging current (0.5 C and 1 C) and from 25 °C to 55 °C shows minimal dependency on the measurement conditions [6] while other higher discharging currents have some capacity loss (indicating that the capacity decreases between 88% and 52% for 7.5 C in temperatures between 15 °C and 5 °C) [6]. However, the LiC has a more stable capacity in low temperatures (even at <0 °C). As shown in Figure 3b, the LiC capacity dropped to half of its at −10 °C and a rate of 7.5 C, while in Figure 3a, LiB had a 50% capacity drop at only 5 °C for the same C-rate [6].
The obtained capacity dependency on current and temperature is presented in Figure 4 for the LiC and in Figure 5 for the LiB, where it provides an extrapolation to the data presented in Figure 3. These capacity-dependence curves are used in the ES models.
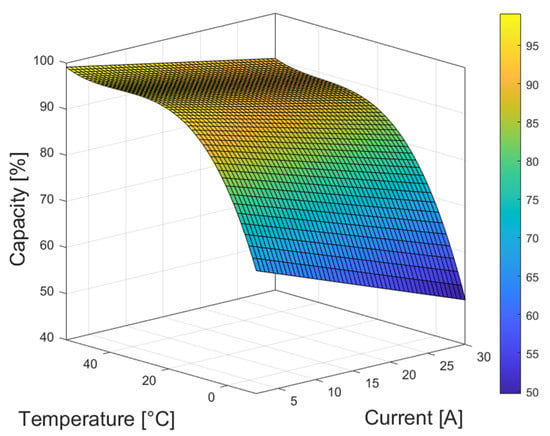
Figure 4.
LiC capacity dependence on temperature and current.
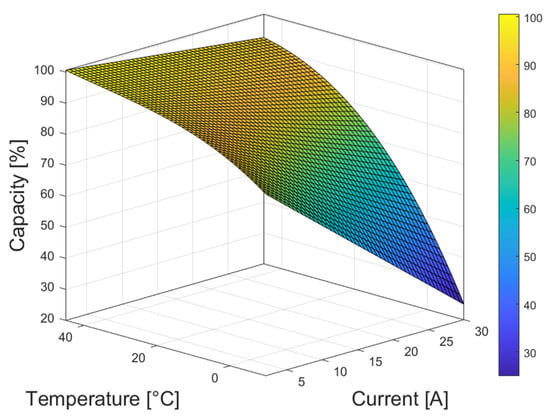
Figure 5.
LiB capacity dependence on temperature and current.
Following the analysis of the LiC and LiB performance, it is crucial to assess their lifespan and sustainability over time. The subsequent section expands on these elements, highlighting the significance of considering degradation when determining system size.
4.3. Degradation Impact on ES
In this section, the sizing work is extended by considering the degradation of the storage cells as a factor affecting the storage size to design the system, whereby the system is guaranteed to be functional for a specific number of years. The sizing process was performed for a period of 10 years to consider the impact of degradation on the system performance, where the effect of degradation is significant. The degradation of the ES in stand-alone PV applications was studied and presented in [7]. The same system model with an average load of 425 Wh/day is used in this section, where sizing with and without the capacity fading effect is studied and compared.
It should be noted that while self-discharge is significant in LiCs compared to LiBs, it was not considered a factor affecting the sizing of the LiC because solar power is generally available. There might be days with low sun irradiation causing low-power charging, but it still mitigates the impact of self-discharge [27]. However, if a longer period of autonomy is required (e.g., more than 7 days of autonomy), the self-discharge of the LiC becomes more significant and should be considered in the sizing process.
An aging model was developed for both the LiC and LiB. For the LiC, results were obtained from performing accelerated cycling aging tests for up to 21,500 cycles (4500 cycles for 1 C, 14,500 cycles for 4 C, and 21,500 cycles for 7 C). After every 2000 cycles, reference performance tests (RPTs) were carried out where the capacity and the equivalent series resistance (ESR) were measured, as shown in Figure 6. Five LiC cells were tested on a 3 × 3 test matrix with two axes representing temperature and the C-rate, as shown in Figure 7 [7].
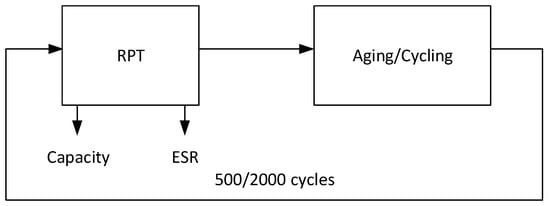
Figure 6.
The procedure of the aging test consists of two parts: cycling and RPT.
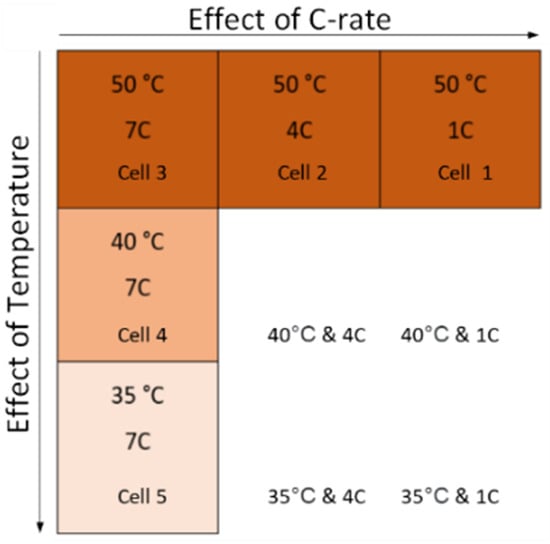
Figure 7.
Test matrix of the cycling aging conditions for five LiC cells, considering the dependence on C-rate and temperature.
The laboratory setup for conducting these tests is demonstrated in Figure 8. This setup features three Memmert temperature chambers, each set at distinct temperature levels of 50, 40, and 35 degrees Celsius. Inside these chambers are the five LiC test cells under examination. The different C-rates (1 C, 4 C, and 7 C) were applied through channels emanating from the Digatron battery test system.
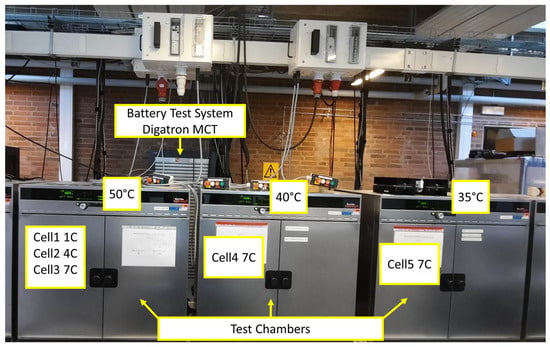
Figure 8.
Lab setup: three temperature chambers at 50, 40, and 35 °C testing LiC cells at C-rates 1 C, 4 C, and 7 C by using Digatron system.
Based on the obtained experimental results, the capacity fading (Cf) was estimated by using Equations (4) and (5) [7], where A is LiC’s degradation factor; nc is the number of cycles (cycle count during simulation); and I and T are the current and temperature in the cell, respectively. The expected number of full equivalent cycles (FECs) that the LiC can withstand at different currents and temperatures before reaching the 20% capacity fade is presented in Figure 9:
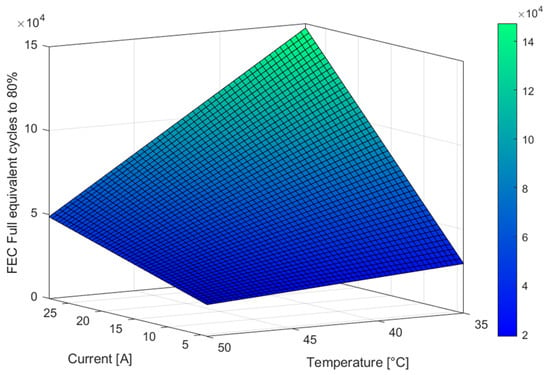
Figure 9.
LiC full equivalent cycles (FEC) to 80% of the beginning-of-life capacity.
For the LiB, lifetime results were obtained from the literature that studied this particular battery cell [28]. Thus, the capacity fade estimation model is given by (6) and (7). is the estimated FECs number that the LiB can withstand at various currents and temperatures before reaching the 20% capacity fade (end of life), which is presented in Figure 10:
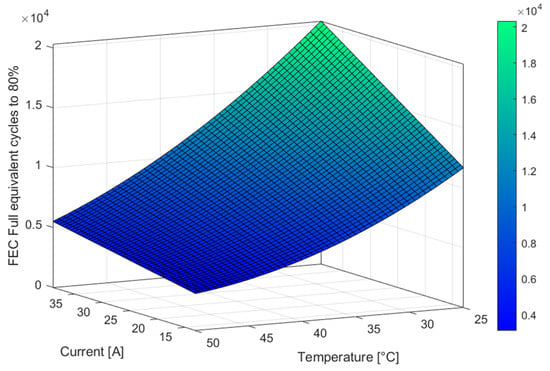
Figure 10.
LiB full equivalent cycles (FEC) to 80% of the beginning-of-life capacity.
The impact of calendar aging on LiC and LiB batteries can be quite distinct. For LiC cells, calendar aging is significantly influenced by the battery’s standby-time conditions, specifically the State of Charge (SoC) and temperature. This influence is depicted in Figure 11.
The capacity loss due to the calendar aging of LiC batteries, represented as , is defined as a function of both the SoC and temperature. This relationship is obtained from the literature [29] and aligns with the specifications provided in the LiC datasheet, which asserts a 5-year shelf life at room temperature and 0% SoC.
In this case, denotes the percentage of capacity that fades over time (t) before the battery reaches its end of life (EOL), which is defined as a 20% loss from the starting capacity and can be formulated as in (8) [30].
In contrast, the calendar aging effect on LiB batteries is rather minimal, with only a 0.8% capacity loss per year [28]. This difference underscores the varying characteristics and aging behavior of LiC and LiB batteries:
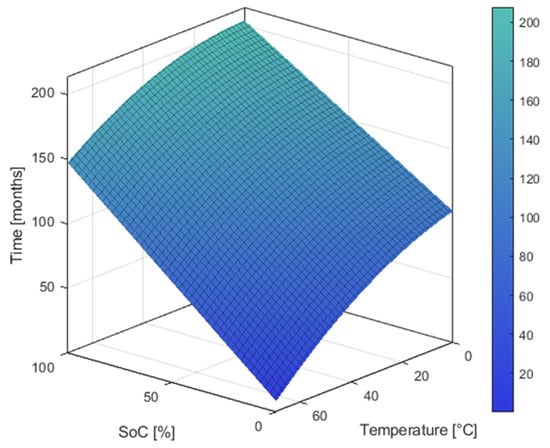
Figure 11.
The expected calendar life, expressed in months of the LiC at different SOCs and temperatures, for an EOL criterion of 20% capacity fade [30].
5. Sizing and Optimization
In this section, a modified sizing algorithm is presented, which is designed to optimize the number of cells in an energy storage unit for a system located in Denmark. This method differs from the one reported in [6], which is based on a 100% to 0% SoC definition of the autonomy cycle. The approach aims to maximize the number of autonomy cycles, taking into account the effects of irradiation, temperature, and cell capacity fading over a simulation period of 1 to 10 years. Autonomy cycles represent periods during which the system operates autonomously without any energy supplied from the grid. They are defined as the intervals between two consecutive 0% SoC occurrences in the storage unit. The rules for autonomy cycles are as follows: one day of an autonomy cycle corresponds to 24 h of available charge, two days of autonomy cycle correspond to 48 h of available charge, and so on for additional days.
As shown in Figure 1, the system model comprises a PV system and an energy storage unit, the latter of which contains a number of cells that must be optimized. The input data for irradiation and temperature are sourced from a weather station in Aalborg, Denmark. These values affect the capacity of the storage cells, which tends to degrade over time, where it becomes recognizable at the end of the 10-year simulation period.
The modified approach employs a Golden Section Search algorithm to search for the optimal integer number size that yields the maximum number of autonomy cycles. This algorithm is specifically suitable for the problem in hand because it provides relatively fewer iterations, thus overcoming the long duration of the simulation iterations and efficiently finding the optimal solution. By setting the constraints of autonomy cycles and counting them, the optimal size maximizes the targeted autonomy durations.
To find the optimal solution, the modified Golden Section Search algorithm is applied as shown in the flowchart in Figure 12. The description of the flowchart is as follows:
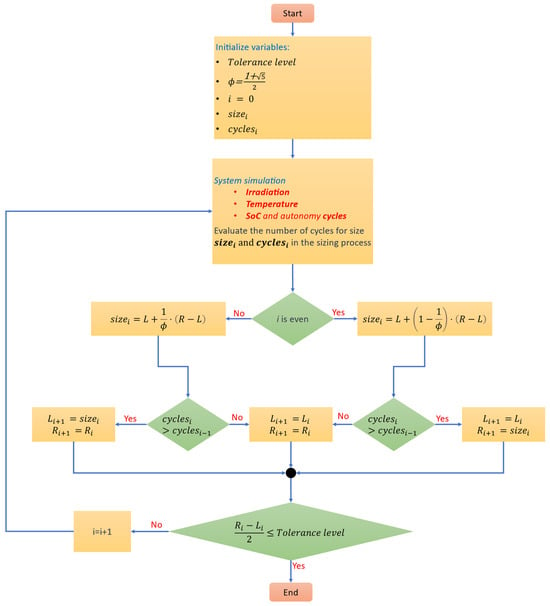
Figure 12.
Golden Section Search algorithm used for optimizing energy storage size to maximize autonomy cycles.
- Begin by initializing the variables, including the search range , tolerance level (), size at iteration , and number of cycles at iteration .
- Calculate the golden ratio and set the initial iteration index to 0.
- Enter a loop that continues until the stopping criterion is met. Inside the loop, perform the following steps:
- Calculate the at the current iteration by using a different formula depending on whether the iteration index is even or odd:
- Evaluate the number of autonomy cycles for the current size, obtaining .
- Compare the number of cycles at the current iteration with the previous iteration ( and ). Update the search range based on the comparison, ensuring that the range becomes narrower as the algorithm progresses.
- Check the stopping criterion. If , exit the loop and select the size with the highest number of autonomy cycles as the optimal size.
- If the stopping criterion is not met, increment the iteration index and repeat steps 3a to 3d.
By following the flowchart in Figure 12 and implementing the modified Golden Section Search algorithm, the optimal number of cells in the energy storage unit can be determined, maximizing the number of autonomy cycles for the system located in Denmark.
The iterative sizing process, using the Golden Section Search algorithm, is illustrated in Figure 13. This approach is designed to optimize the number of LiC cells to maximize autonomy cycles for the one day of autonomy, dynamic temperature, and dynamic load scenario. The figure presents the iteration count and the size in terms of the number of cells. Each bar in the chart represents an iteration that is labeled with the achieved number of autonomy cycles. System simulations are conducted for different cell sizes during this optimization process, with the algorithm suggesting the next cell size for testing based on the current number of autonomy cycles. Following this method, the optimal size was found to be 20 LiC cells at the third iteration as it achieves the highest number of autonomy cycles, while the total number of iterations was six.
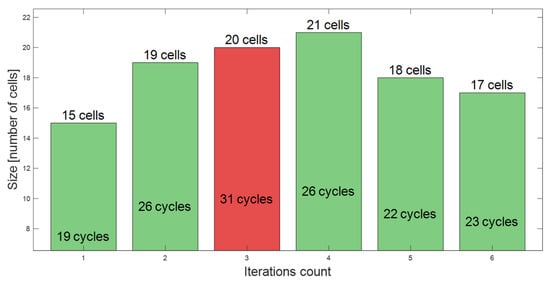
Figure 13.
Iterative sizing process via the Golden Section Search algorithm, demonstrating cell count per iteration and the associated one-day autonomy cycles.
In Figure 14, the concept of autonomy cycles is shown. The one-day autonomy cycle is the cycle between two consecutive 0% SoC, where the one day of autonomy, according to the algorithm in Figure 12, requires a storage size that maximizes the number of autonomy cycles while exceeding the optimal size, which will reduce the number of autonomy cycles as the duration between the two consecutive 0% SoC will take more time than 24 h. The figure also presents the size for the three-day cycle, five-day cycle, and seven-day cycle. The figure also shows the four sizes at the same specific time of the year, which does not necessarily represent the exact autonomy cycle and can exceed such as in the three-day cycle and five-day cycle.
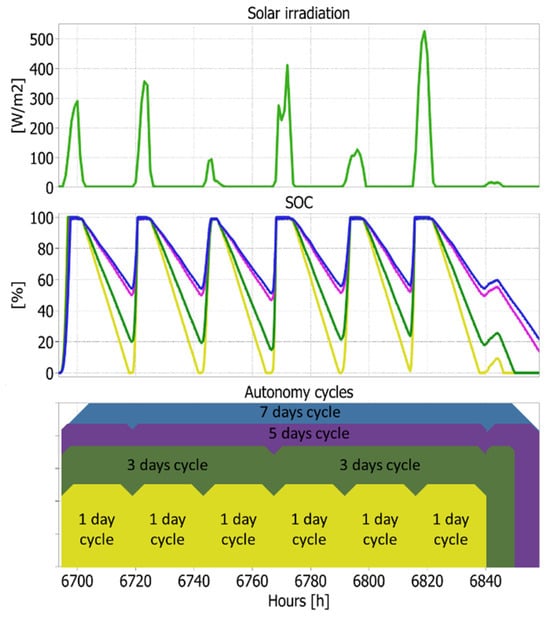
Figure 14.
Simulation of 7-day period. SOC for one, three, five, and seven days of sizing and the counted autonomy cycles for each size.
6. Capacity Fade as a Factor of Sizing
The modeled system in this section, as in Figure 1, has a PV generation capacity set to 1500 W, while the average load is 425 Wh/day. Table 2 represents the size of the ES in the case of LiC and LiB. The system is operating in the climatical conditions of Aalborg, Denmark; the study is performed for a period of 1 year and 10 years (the simulation period). Sizing is presented for LiC and LiB in three scenarios: dynamic load and dynamic temperature, a constant temperature of 25 °C, and constant load (RMS of the load). The FEC and percentage of the capacity after 10 years of operation are provided for each case. The sizing in the three scenarios is presented in Figure 15.

Table 2.
The three scenarios of sizing: dynamic temperature and load, constant temperature, and constant load, sized for 1 and 10 years.
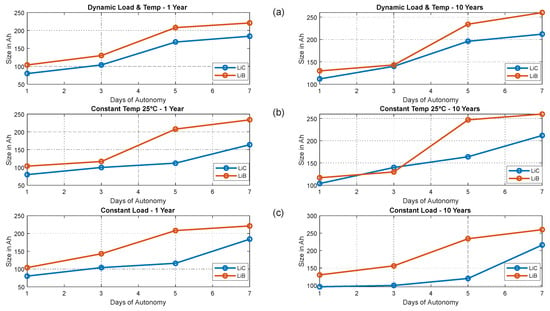
Figure 15.
The three scenarios represent. (a) Dynamic temperature and load, (b) constant temperature (25 °C), and (c) constant load.
It is noted that for the one-year period, capacity change is negligible, similar to [6], as it does not show a significant effect of the degradation, while degradation (cycling and calendar) is effective in the sizing of the (10-year) system.
Considering the degradation of the ES devices; the available energy capacity will decrease during long-term operation. ES sizing was performed for three scenarios, and the curve is fitted in Figure 16.
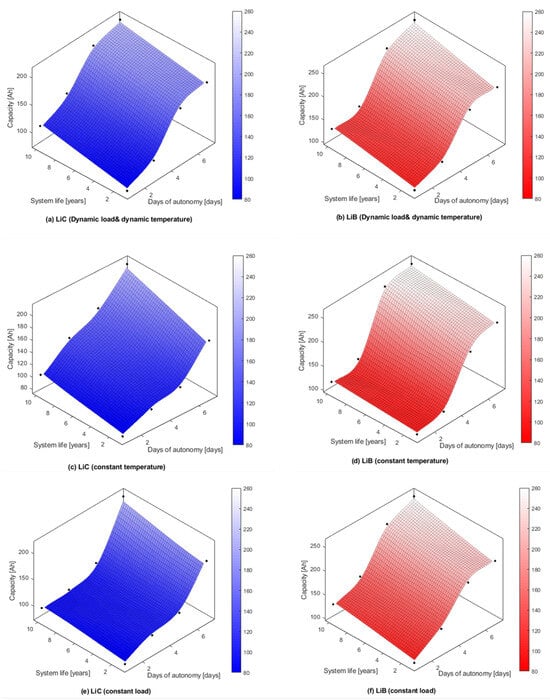
Figure 16.
Sizing of LiC (left) and LiB (right) for one, three, five, and seven days of autonomy and 1 to 10 years of operation. (a,b) for the dynamic load and temperature, (c,d) for the constant temperature at 25 °C, and (e,f) for the constant load.
- ▪
- In the dynamic temperature and load scenario, the LiC’s storage capacity was sized to be, on average, 80.24% of the LiB’s for a 1-year sizing (without considering capacity fade), as depicted on the left side of Figure 15a. In the 10-year sizing, the LiC’s relative sizing increases to an average of 87.34% of the LiB’s, as also illustrated on the right side of Figure 15a. In Figure 16a,b, a representation of a 3D interpolation of the LiC and LiB sizing capacity depending on the system lifetime and days of autonomy in the dynamic temperature and load scenario is depicted. Considering capacity fade after 10 years, the average sizing increase in the LiC ES was 26.6%, while the size of the LiB increased by an average of 16.2%, as shown in Table 2 and Figure 16a,b.
- ▪
- In the constant-temperature 25 °C scenario, without considering capacity fade, the LiC was sized at an average of 71.6% of the LiB ES size, as shown on the left side of Figure 15b. Considering capacity fade after 10 years, the average sizing increase in the LiC ES was 86.1% of the LiB’s. The size of the LiC increased by an average of 36.4% while the LiB increased by an average of 13.3%, as shown in Table 2 and Figure 16c,d. The significant increase in the size of the LiC energy storage after 10 years in this scenario can largely be attributed to calendar aging. This aging effect is accelerated by prolonged periods at a low SoC and further intensified by the constant temperature. Given that this scenario maintains a fixed temperature of 25 °C, which differs from the fluctuating temperatures in the previous scenarios, the stress on the LiC becomes more pronounced, thereby leading to more severe degradation. The result is a substantial growth in the LiC size to compensate for the capacity loss over time. The LiB also obtains an increase in size due to the effect of the higher-than-average temperature on cycling aging.
- ▪
- In the constant load (RMS of the dynamic load) scenario, and without considering capacity fade, the LiC was sized at an average of 72% of the LiB ES size, as shown on the left side of Figure 15c, where the size difference is higher than on the left side of Figure 15a. Considering the capacity fade after 10 years, the average sizing increase in the LiC ES was 10.2%, while the size of the LiB increased by an average of 16%, as shown in Table 2. This scenario is quite similar to the dynamic temperature and load scenario in terms of the size considering aging due to the similar temperature effect on the degradation process; however, it is similar to the constant-temperature 25 °C scenario when the degradation is not considered.
However, the ES tends to saturate at a certain size (increasing the size does not mean more days of autonomy) because the PV capacity is fixed in this sizing process.
By defining the required days of autonomy of the system and the required system’s lifetime, (9) is used for sizing the storage for this PV system, where refers to the days of autonomy and refers to the years of the lifetime. The coefficients of each sizing case are provided in Table 3:

Table 3.
Sizing coefficient for LiC and LiB: the 3 scenarios.
Table 3 lists the coefficients (a, b, c, d, e, f, g) for three different scenarios: “Dynamic load & temperature”, “Constant temperature 25 °C”, and “Constant LOAD”. These coefficients apply to two different types of storage technologies: LiC and LiB.
If 3 days of autonomy storage are required to operate outdoors in Aalborg for a guaranteed five-year lifetime of the system, then
and .
Figure 17 illustrates the comparative sizing performance of the LiC and LiB across different scenarios: dynamic load and temperature, constant temperature, and constant load.

Figure 17.
Color map for the sizing performance comparison of LiC (blue) and LiB (red) under three different scenarios: (a) dynamic load and dynamic temperature, (b) constant temperature, and (c) constant load.
In the dynamic scenario (a), the LiB’s performance closely matches that of the LiC at three days of autonomy for system lifespans exceeding five years. However, the LiC generally outperforms the LiB in all other conditions.
Under a constant-temperature scenario (b), the LiB surpasses the LiC at three days of autonomy for system lifespans beyond five years, yet the LiC maintains superiority in all other conditions.
In scenario (c), where the load is constant, the LiC is found to be the more robust choice, similar to the dynamic scenario. These findings contribute valuable insights toward selecting the optimal energy storage system based on the specific operational requirements and environmental conditions.
7. Conclusions
This paper investigated the optimization of energy storage systems for PV off-grid systems, motivated by the unique environmental conditions in Denmark and cool temperatures that affect the LiB capacity in outdoor applications. Utilizing the autonomy cycles’ maximizing sizing algorithm, this study revealed the complexities of the LiC and LiB performance and degradation under various scenarios over a decade. The application of the Golden Section Search algorithm significantly reduced the number of iterations in the system simulation and effectively expedited the search for optimal sizing that maximizes the probability of achieving the targeted autonomy cycles. This technique proved helpful in assessing and comparing the performance of the LiC and LiB under diverse conditions. In dynamic load and temperature scenarios, the LiB performance was similar to that of the LiC at three days of autonomy for system lifetimes exceeding five years; however, the LiC generally demonstrated superior performance in other condition values in this scenario. Under a constant-temperature scenario, the LiB outperformed the LiC at three days of autonomy for system lifespans beyond five years, while the LiC maintained a competitive edge under various other conditions. With a constant load, the LiC proved to be a more robust choice, echoing its performance in dynamic conditions. Calendar aging plays a critical role in accelerating degradation, especially at a low SoC and high temperatures. In a fixed-temperature scenario, stress on the LiC escalated, resulting in substantial degradation and a corresponding increase in size to compensate for capacity loss over time. The LiB’s size also experienced growth due to cycling aging influenced by higher-than-average temperatures. This study yielded crucial insights into the size comparisons of LiC and LiB energy storage systems. On average, the LiC energy storage was 70–80% the size of the LiB storage, indicating potential efficiency gains with LiCs. However, in a constant-temperature scenario (25 °C), factoring in capacity fade over ten years, the LiC’s size increased by an average of 36%, compared to the LiB’s average growth of 13%. This notable size expansion of the LiC under constant-temperature conditions can be largely attributed to calendar aging. This research highlights the efficacy of the modified Golden Section Search algorithm in enhancing energy storage sizing optimization. It underscores the importance of environmental factors, cell degradation patterns, and the system lifespan in making decisions concerning energy storage technologies.
Author Contributions
Methodology, T.I.; Validation, T.I.; Resources, D.-I.S.; Writing—original draft, T.I.; Writing—review & editing, T.K., D.S., A.L. and D.-I.S.; Supervision, T.K. and D.-I.S. All authors have read and agreed to the published version of the manuscript.
Funding
This research received no external funding.
Data Availability Statement
The data presented in this study are available on request from the corresponding author. The data are not publicly available due to size.
Conflicts of Interest
The authors declare no conflict of interest.
References
- Hesse, H.; Schimpe, M. Lithium-Ion Battery Storage for the Grid—A Review of Stationary Battery Storage System Design Tailored for Applications in Modern Power Grids. Energies 2017, 10, 2107. [Google Scholar] [CrossRef]
- Luo, X.; Wang, J. Overview of current development in electrical energy storage technologies and the application potential in power system. Appl. Energy 2015, 137, 511–536. [Google Scholar] [CrossRef]
- Preger, Y.; Barkholtz, H. Degradation of Commercial Lithium-Ion Cells as a Function of Chemistry and Cycling Conditions. J. Electrochem. Soc. 2020, 167, 120532. [Google Scholar] [CrossRef]
- Vega-Garita, V.; Harsarapama, A. Physical Integration of PV-Battery System: Advantages, Challenges and Thermal Model. In Proceedings of the 2016 IEEE International Energy Conference (ENERGYCON), Leuven, Belgum, 4–8 April 2016. [Google Scholar]
- Yu, F.; Pang, L.; Wang, H.X. Preparation of mulberry-like RuO2 electrode material for supercapacitors. Rare Met. 2021, 40, 440–447. [Google Scholar] [CrossRef]
- Ibrahim, T.; Kerekes, T.; Sera, D.; Spataru, S.; Stroe, D.-I. Sizing of Hybrid Supercapacitors for Off-Grid PV Applications. In Proceedings of the 2021 IEEE Energy Conversion Congress and Exposition (ECCE), Vancouver, BC, Canada, 10–14 October 2021; pp. 232–237. [Google Scholar] [CrossRef]
- Ibrahim, T.; Kerekes, T.; Sera, D.; Stroe, D.-I. Degradation behavior analysis of High Energy Hybrid Lithium-ion capacitors in stand-alone PV applications. In Proceedings of the Accepted in IECON 2022—48th Annual Conference of the IEEE Industrial Electronics Society, Brussels, Belgium, 17–20 October 2022. [Google Scholar]
- Soltani, M.; Beheshti, S.H. A comprehensive review of lithium-ion capacitor: Development, modelling, thermal management and applications. J. Energy Storage 2021, 34, 102019. [Google Scholar] [CrossRef]
- IEEE Recommended Practice for Sizing Lead-Acid Batteries for Stand-Alone Photovoltaic (PV) Systems—Redline. In IEEE Std 1013-2019 (Revision of IEEE Std 1013-2007)—Redline; IEEE: Piscataway, NJ, USA, 2019; pp. 1–82.
- Wikner, E.; Thiringer, T. Extending Battery Lifetime by Avoiding High SOC. Appl. Sci. 2018, 8, 1825. [Google Scholar] [CrossRef]
- d’Halluin, P.; Rossi, R.; Schmela, M.; SolarPower Europe. European Market Outlook for Residential Battery Storage 2020–2024; Solar Power Europe: Brussels, Belgium.
- Rada, J.; Chamberlin, C.; Lehman, P.; Jacobson, A. Comparison of PV Module Performance Before and After 11, 20, and 25.5 Years of Field Exposure. In Proceedings of the IEEE 44th Photovoltaic Specialist Conference (PVSC), Washington, DC, USA, 25–30 June 2017. [Google Scholar]
- Olalla, C.; Maksimovic, D.; Deline, C.; Martinez-Salamero, L. Impact of distributed power electronics on the lifetime and reliability of PV systems. Prog. Photovolt. Res. Appl. 2017, 25, 821–835. [Google Scholar] [CrossRef]
- Sandelic, M.; Sangwongwanich, A.; Blaabjerg, F. Effects of PV Panel and Battery Degradation on PV-Battery System Performance and Economic Profitability. In Proceedings of the 22nd European Conference on Power Electronics and Applications (EPE’20 ECCE Europe), Lyon, France, 7–11 September 2020; pp. P.1–P.10. [Google Scholar] [CrossRef]
- Vega-Garita, V.; Lucia, D.; Narayan, N.; Ramirez-Elizondo, L.; Bauer, P. PV-Battery Integrated Module as a Solution for Off-Grid Applications in the Developing World. In Proceedings of the IEEE International Energy Conference (ENERGYCON), Limassol, Cyprus, 3–7 June 2018. [Google Scholar]
- Ciccarelli, F.; Del Pizzo, A.; Iannuzzi, D. Improvement of Energy Efficiency in Light Railway Vehicles Based on Power Management Control of Wayside Lithium-Ion Capacitor Storage. IEEE Trans. Power Electron. 2014, 29, 275–286. [Google Scholar] [CrossRef]
- Uno, M.; Kukita, A. Cycle Life Evaluation Based on Accelerated Aging Testing for Lithium-Ion Capacitors as Alternative to Rechargeable Batteries. IEEE Trans. Ind. Electron. 2016, 63, 1607–1617. [Google Scholar] [CrossRef]
- Hu, X.; Li, Y.; Lv, C.; Liu, Y. Optimal Energy Management and Sizing of a Dual Motor-Driven Electric Powertrain. IEEE Trans. Power Electron. 2019, 34, 7489–7501. [Google Scholar] [CrossRef]
- Tsioumas, E.; Jabbour, N.; Koseoglou, M.; Papagiannis, D.; Mademlis, C. Enhanced Sizing Methodology for the Renewable Energy Sources and the Battery Storage System in a Nearly Zero Energy Building. IEEE Trans. Power Electron. 2021, 36, 10142–10156. [Google Scholar] [CrossRef]
- García-Plaza, M.; Carrasco, J. Peak shaving algorithm with dynamic minimum voltage tracking for battery storage systems in microgrid applications. J. Energy Storage 2018, 20, 41–48. [Google Scholar] [CrossRef]
- Kaushika, N.; Gautam, N. Simulation model for sizing of stand-alone solar PV system with interconnected array. Sol. Energy Mater. Sol. Cells 2005, 85, 499–519. [Google Scholar] [CrossRef]
- Yuan, Y.; Xu, P.; Yang, Z.; Ding, Z.; Chen, Q. Joint Robust Beamforming and Power-Splitting Ratio Design in SWIPT-Based Cooperative NOMA Systems with CSI Uncertainty. IEEE Trans. Veh. Technol. 2019, 68, 2386–2400. [Google Scholar] [CrossRef]
- Nocedal, J.; Wright, S. Numerical Optimization, 2nd ed.; Springer: New York, NY, USA, 2006; Chapter 3. [Google Scholar]
- Schönberger, J. Modeling a Lithium-Ion Cell Using PLECS®; Plexim Kontaktieren: Zürich, Switzerland.
- IEC 62391-1_2016; Fixed Electric Double-Layer Capacitors for Use in Electronic Equipment—Part 2: Sectional Specification—Electric Double-Layer Capacitors for Power Application. International Electrotechnical Committee IEC: Geneva, Switzerland, 2006.
- IEC 62660-1; Secondary Lithium-Ion Cells for the Propulsion of Electric Road Vehicles—Part 1: Performance Testing. IEC: Geneva, Switzerland, 2018; Volume 43.
- Babu, B.; Balducci, A. Self-discharge of lithium-ion capacitors. J. Power Sources Adv. 2020, 5, 100026. [Google Scholar] [CrossRef]
- Stroe, A. Analysis of Performance and Degradation for Lithium Titanate Oxide Batteries; Aalborg University Press: Aalborg, Denmark, 2018. [Google Scholar]
- Soltani, M.; Ronsmans, J.; Van Mierlo, J. Cycle life and calendar life model for lithium-ion capacitor technology in a wide temperature range. J. Energy Storage 2020, 31, 101659. [Google Scholar] [CrossRef]
- Ibrahim, T.; Kerekes, T.; Sera, D.; Mohammadshahi, S.S.; Stroe, D.-I. Sizing of Hybrid Supercapacitors and Lithium-Ion Batteries for Green Hydrogen Production from PV in the Australian Climate. Energies 2023, 16, 2122. [Google Scholar] [CrossRef]
Disclaimer/Publisher’s Note: The statements, opinions and data contained in all publications are solely those of the individual author(s) and contributor(s) and not of MDPI and/or the editor(s). MDPI and/or the editor(s) disclaim responsibility for any injury to people or property resulting from any ideas, methods, instructions or products referred to in the content. |
© 2024 by the authors. Licensee MDPI, Basel, Switzerland. This article is an open access article distributed under the terms and conditions of the Creative Commons Attribution (CC BY) license (https://creativecommons.org/licenses/by/4.0/).