Article

Monitoring of Thermal Runaway in Commercial Prismatic High-Energy Lithium-Ion Battery Cells via Internal Temperature Sensing

Chair for Production Engineering of E-Mobility Components, RWTH Aachen University, Bohr 12, 52072 Aachen, Germany
*
Author to whom correspondence should be addressed.
Batteries 2024, 10(2), 41; https://doi.org/10.3390/batteries10020041
Submission received: 21 December 2023 / Revised: 15 January 2024 / Accepted: 16 January 2024 / Published: 23 January 2024
(This article belongs to the Special Issue Thermal Safety of Lithium Ion Batteries)

Abstract

:
The temperature of a lithium-ion battery is a crucial parameter for understanding the internal processes during various operating and failure scenarios, including thermal runaway. However, the internal temperature is comparatively higher than the surface temperature. This particularly affects cells with a large cross-section, which is due to heat development within the cell and lower heat dissipation due to a poorer ratio of volume to surface area. This paper presents an approach that enables real-time monitoring of the behavior of a commercial prismatic high-energy battery cell (NMC811/C, 95 Ah, Contemporary Amperex Technology Co., Limited (Ningde, China)) in the event of thermal runaway induced by overcharging. The internal cell temperature is investigated by the subsequent integration of two hard sensors between the two jelly rolls and additional sensors on the surface of the aluminum housing of the battery cell. The sensor’s signals show a significant increase in the temperature gradient between the temperature in the core of the cell and the cell casing surface until the onset of venting and thermal runaway of the battery. The data enable a detailed investigation of the behavior of the battery cell and the comparatively earlier detection of the point of no return in the event of thermal runaway.

1. Introduction

The increasing electrification of passenger transportation is resulting in a significant increase in demand for lithium-ion batteries (LIBs) [1]. The demand in LIBs for battery electric vehicles (BEVs) for the Chinese, US and European markets currently amounts to 400 GWh and is expected to increase to 6800 GWh by 2030 [2]. However, there are still technological challenges that affect the broad acceptance of the technology for mobility applications in society. In addition to the technological challenges of increasing energy density, reducing charging time and reducing production cost, safety concerns are a critical factor [3]. A key to maximizing the safety of LIBs is a comprehensive understanding of the behavior before and during the occurrence of a failure [4].
The thermal runaway (TR) of a LIB as a failure mode is the key scientific problem in battery safety research, especially for batteries with Ni-rich cathode materials such as LiNi0.8Co0.1Mn0.1O2 (NCM811) due to their comparatively low thermal stability. Thermal runaway defines the uncontrolled increase in cell temperature, often resulting in fire, due to an exothermic chain reaction within the cell. The TR of a cell can be caused by mechanical abuse, electrical abuse, such as an external short circuit or overcharging, or thermal abuse [5,6].
In this context, the integration of sensors into the battery cell is a promising way of quantitatively monitoring internal cell behavior during operation and failure [7,8]. In recent years, increased efforts have been made to integrate various sensor types into different battery cell sizes and form factors to be able to directly monitor the internal battery cell temperature. Novais et al. use fiber Bragg grating (FBG) sensors to monitor the internal and external temperature of LIBs [9]. Nascimento et al. report that the hybrid sensor network, consisting of a Fabry–Perot (FP) and an FBG sensor embedded in the commercially available LFP pouch cell, proves to be effective, non-invasive and accurate [10]. Raghavan et al. integrate two FBG sensors into a pouch battery cell to monitor the state of the battery [11]. Lee et al. use a resistance temperature detector (RTD) to monitor the internal temperature of LFP/LTO coin cells [12]. A similar approach is taken by Zhu et al., who embed RTD thin film sensors in a pouch format LIB to monitor the internal cell temperature at multiple locations [13]. In another study by Fleming et al., NTC thermistors bonded to a flexible polyimide substrate are used as internal sensors for both a cylindrical 18650 cell and a 5.5 Ah pouch format battery cell [14]. In contrast, Mutyala et al. use a thin film K-type thermo-couple (TFTC) to monitor the temperature inside a 3 Ah pouch cell [15]. In various other approaches, thermocouples were also integrated into LIBs to quantify the temperature behavior within the cell [16,17,18,19,20].
However, most of the existing approaches are limited to investigating the internal cell temperature behavior of small-format pouch, cylindrical or coin cells during regular cycle tests. In contrast to this, Xu et al. present a study analyzing the behavior of a medium-size prismatic 37 Ah NMC111/C battery cell during thermal runaway with integrated temperature sensors in addition to a cylindrical 21700 cell and a pouch cell [21]. Parekh carries out a similar experiment with an LCO coin cell with integrated RTD and induces the thermal runaway by overcharging the cell [22]. In their work, Mei et al. present an approach to monitor the internal temperature and pressure during the thermal runaway of a commercially available 18650 LFP battery cell after applying external heat, using FBGs [23].
This work aims to investigate the temperature behavior of a large-format prismatic automotive grade LIB with a high energy density of 246 Wh/kg and NMC811/C electrode chemistry during thermal runaway using two redundant integrated thermocouples.

2. Experimental Set-Up and Methods

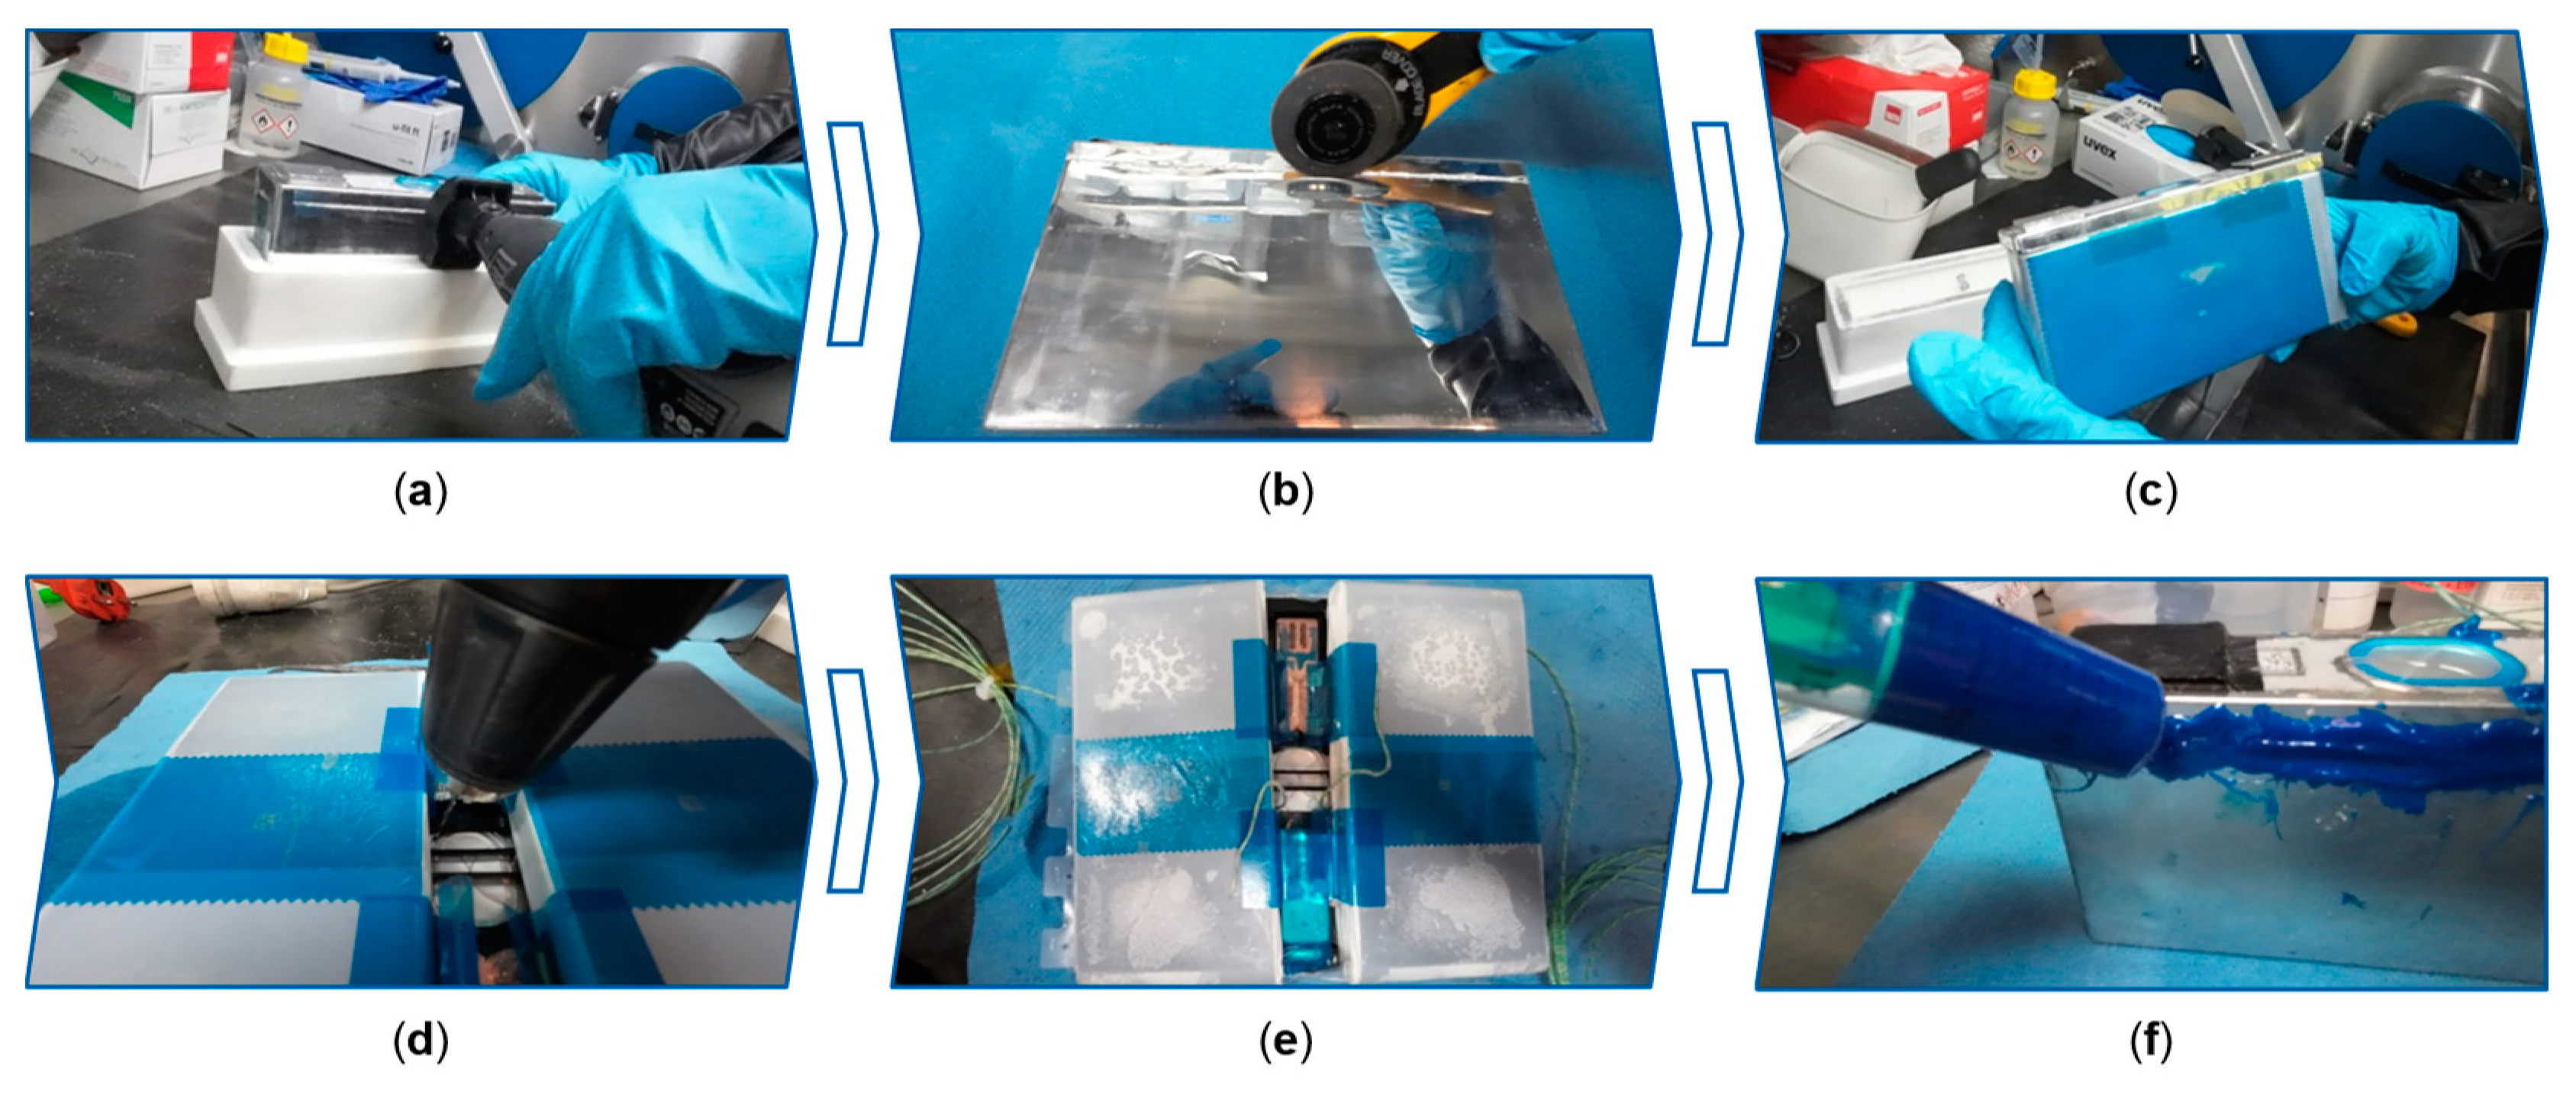
2.1. Cell Preparation and Sensor Integration

Prismatic lithium-ion cells from the manufacturer “Contemporary Amperex Technology Co., Limited” (Ningde, China) are used for the experiment. The specified nominal capacity is 95 Ah with a nominal voltage of 3.67 V, which results in a total energy of 350 Wh and a gravimetric energy density of 246 Wh/kg. The cell housing is made of aluminum and has the following dimensions: 35.7 mm × 180 mm × 102 mm. The wall thickness of the sides is 1.2 mm, whereas the wall thickness of the base is 1.4 mm. The internal cell structure consists of two jelly rolls connected in parallel. The jelly rolls each have a width of 178.1 mm, a height of 84 mm and a thickness of 16.65 mm. Graphite is used as the active material on the anode side and NMC811 on the cathode side. The aluminum foil of the cathode has a material thickness of 0.014 mm and is coated on both sides, whereby the total electrode thickness including coating is 0.12 mm. The copper foil of the anode has a comparatively lower material thickness of 0.012 mm and is also coated on both sides, whereby the total electrode thickness including coating is 0.165 mm. The separator has a thickness of 0.015 mm.
Type K thermocouples from the manufacturer “TC Mess-und Regeltechnik GmbH (Mönchengladbach, Germany)” with a measuring range of up to 1350 °C in short-time operation are used as temperature sensors to monitor the relevant temperature range despite the high temperatures during the thermal runaway of a battery cell.
A systematic process is used to enable safe and reliable integration of the thermocouples into the battery cell. During the integration process, the battery cell’s internal structure must not be damaged, as this could otherwise lead to an irreversible loss of capacity and performance or to an internal short circuit. Before the integration process, the cells are preconditioned using a constant current–constant voltage (CC-CV) charging protocol over 2 full cycles at 0.25 C and 100% depth of discharge (DOD). The thermocouples are integrated after an additional relaxation phase of 2 h at approximately 0% state of charge (SOC).
The integration process is divided into six steps according to Figure 1 and is carried out in a conventional glovebox environment under a controlled argon atmosphere. To open the cell, the first step was to make a flat circumferential cut on the top of the cell, which separates the housing cover, including the electrode stacks, from the rest of the housing. To prevent an internal short circuit caused by aluminum chips penetrating the battery cell, the housing can is cut in a two-stage cutting process.
First, the upper layer of the cut edge is removed by a spiral cutter and the metal chips are carefully removed before a round blade cutter cuts through the remaining thin aluminum layer in the second step. In the third step, the two jelly rolls, including the housing cover, are extracted from the housing. In the fourth step, the jelly rolls are unfolded to drill two holes in the housing cover near the safety valve for the thermocouples to be integrated. Once the holes have been drilled and the swarf removed, in the fifth step, the two type K thermocouples are inserted into the cell and positioned on the separator surface of the side of the two jelly rolls facing inwards. The two measuring tips of the thermocouples are positioned centrally under the electrodes at the same height. No additional measures are required to keep the two thermocouples in place, as the stiffness of the thermocouple ensures that its position does not change during folding. In the sixth and final step, the two electrode stacks with the thermocouples are again folded and reinserted into the original housing. However, while working on the open cell, the solvent of the electrolyte evaporates at room temperature. To compensate for this loss of solvent and the expected loss of capacity, 10 mL of electrolyte containing LiPF6 in EC:EMC (3:7, by wt.) is added before the cell is closed again.
To seal the reassembled cell, the 2-component structural adhesive type “BETAMATE 2090” from the manufacturer “Dow Europe GmbH (Horgen, Switzerland)” is applied to the circumferential cut edge and around the two holes for the thermocouples. The cell is left to rest for 72 h at ambient temperature to allow the adhesive to cure completely. After the curing time, the modified battery cell is tested in a vacuum leak test stand to prevent electrolyte leakage during handling and operation. In the following, the cell with integrated sensors is referred to as CellINT.
In addition to the two integrated thermocouples in the cell, the temperature is recorded on the cell surface and near the cell environment, as shown in Figure 2. The two thermocouples on the cell surface (1, 3) are located at the same respective positions as the two internal sensors (2, 4). Three additional thermocouples are used to monitor the temperature in the environment, in the center of the cell (5) and at the height of 10 mm above the safety vent (6) to monitor the temperature of the escaping flammable gases during thermal runaway.

2.2. Cyclization Pre-Tests

CellINT is first tested within a comparably low number of charge–discharge cycles to exclude a significant cell defect due to the integration of the sensor technology in the first instance. The cells therefore undergo several CC-CV cycles with 24 A (0.25 C) charging current and 14 A (0.15 C) discharging current at 100% DOD with an additional 10 min break between each charging and discharging step. CellINT is placed in a test chamber at a temperature of 22 °C during cycling. During cyclization of the modified cell, the temperature data of the internally and externally mounted temperature sensors are also recorded. This makes it possible to additionally evaluate the temperature gradient across the cell cross-section of the prismatic battery cell during normal operation. The cyclization pre-tests are carried out with a battery cell tester model “SI-9300R” from the manufacturer “Ametek, Inc. (Berwyn, PA, USA)”. The temperature data are logged using a data acquisition system from the manufacturer “Gantner Instruments GmbH (Schruns, Austria)”.

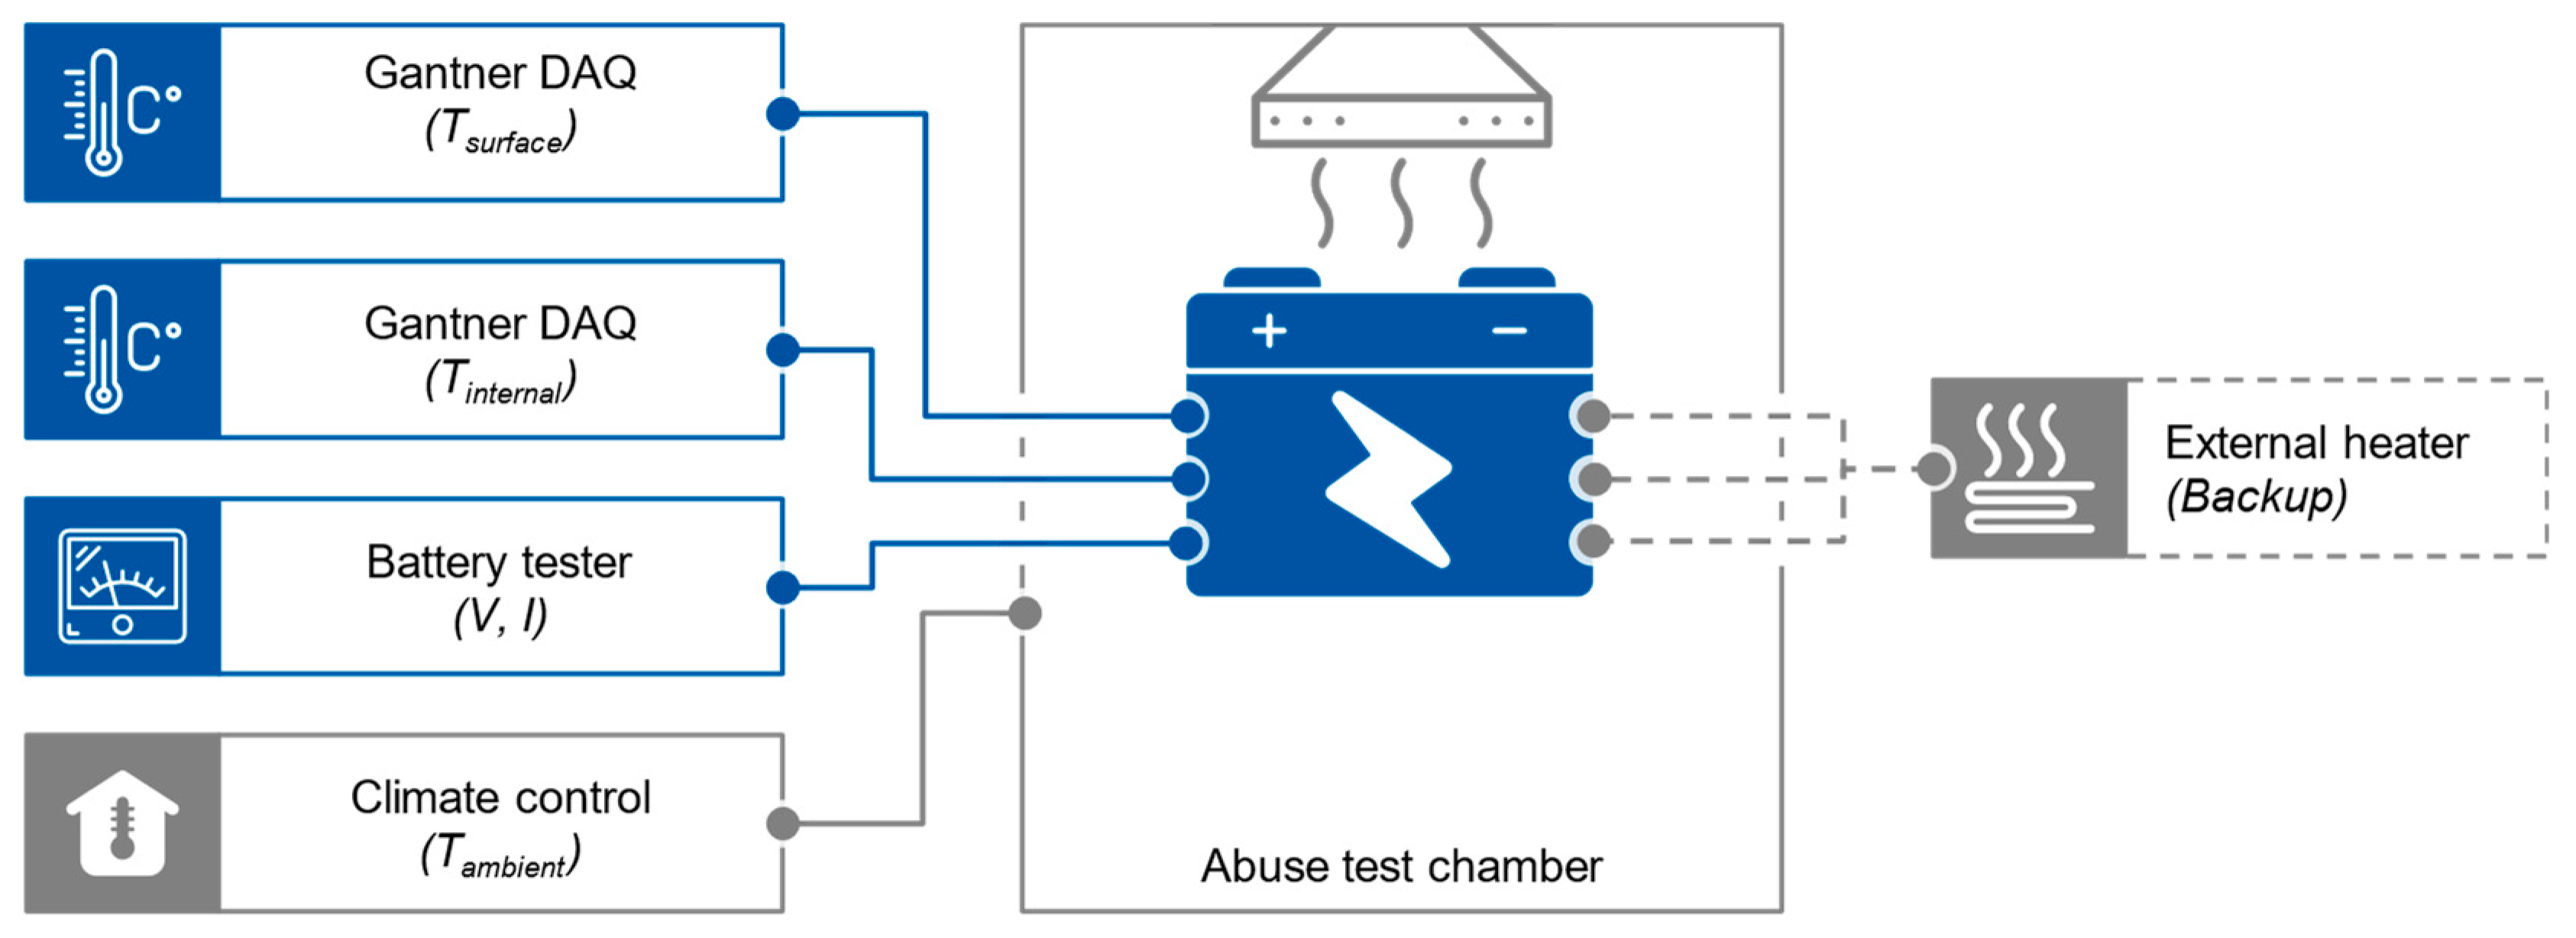
2.3. Thermal Runaway Tests

The thermal runaway tests take place in a test chamber suitable for abuse tests as displayed in Figure 3. The test chamber is equipped with active temperature control and a fume extraction and filtering system. The respective battery cell is connected to the battery cell tester and the temperature data recording unit presented in Section 2.3. The battery cell is placed upright. In case the cell cannot be brought into thermal runaway by overcharging, an external heating mechanism is installed as a backup thermal runaway trigger. For this purpose, the cell is fitted with tungsten wire heating elements encased in polyimide adhesive foil. To be able to investigate a possible influence of the integrated sensors on the thermal runaway behavior, the thermal runaway test is carried out both with CellINT and a reference cell without integrated thermocouples, referred to below as CellREF.
The SOC of the cell is approximately 0% SOC before initiating the overcharging process. A constant electrical current of 26 A is continuously supplied for this purpose. The (over-)charging continues until thermal runaway occurs.

3. Results and Discussion

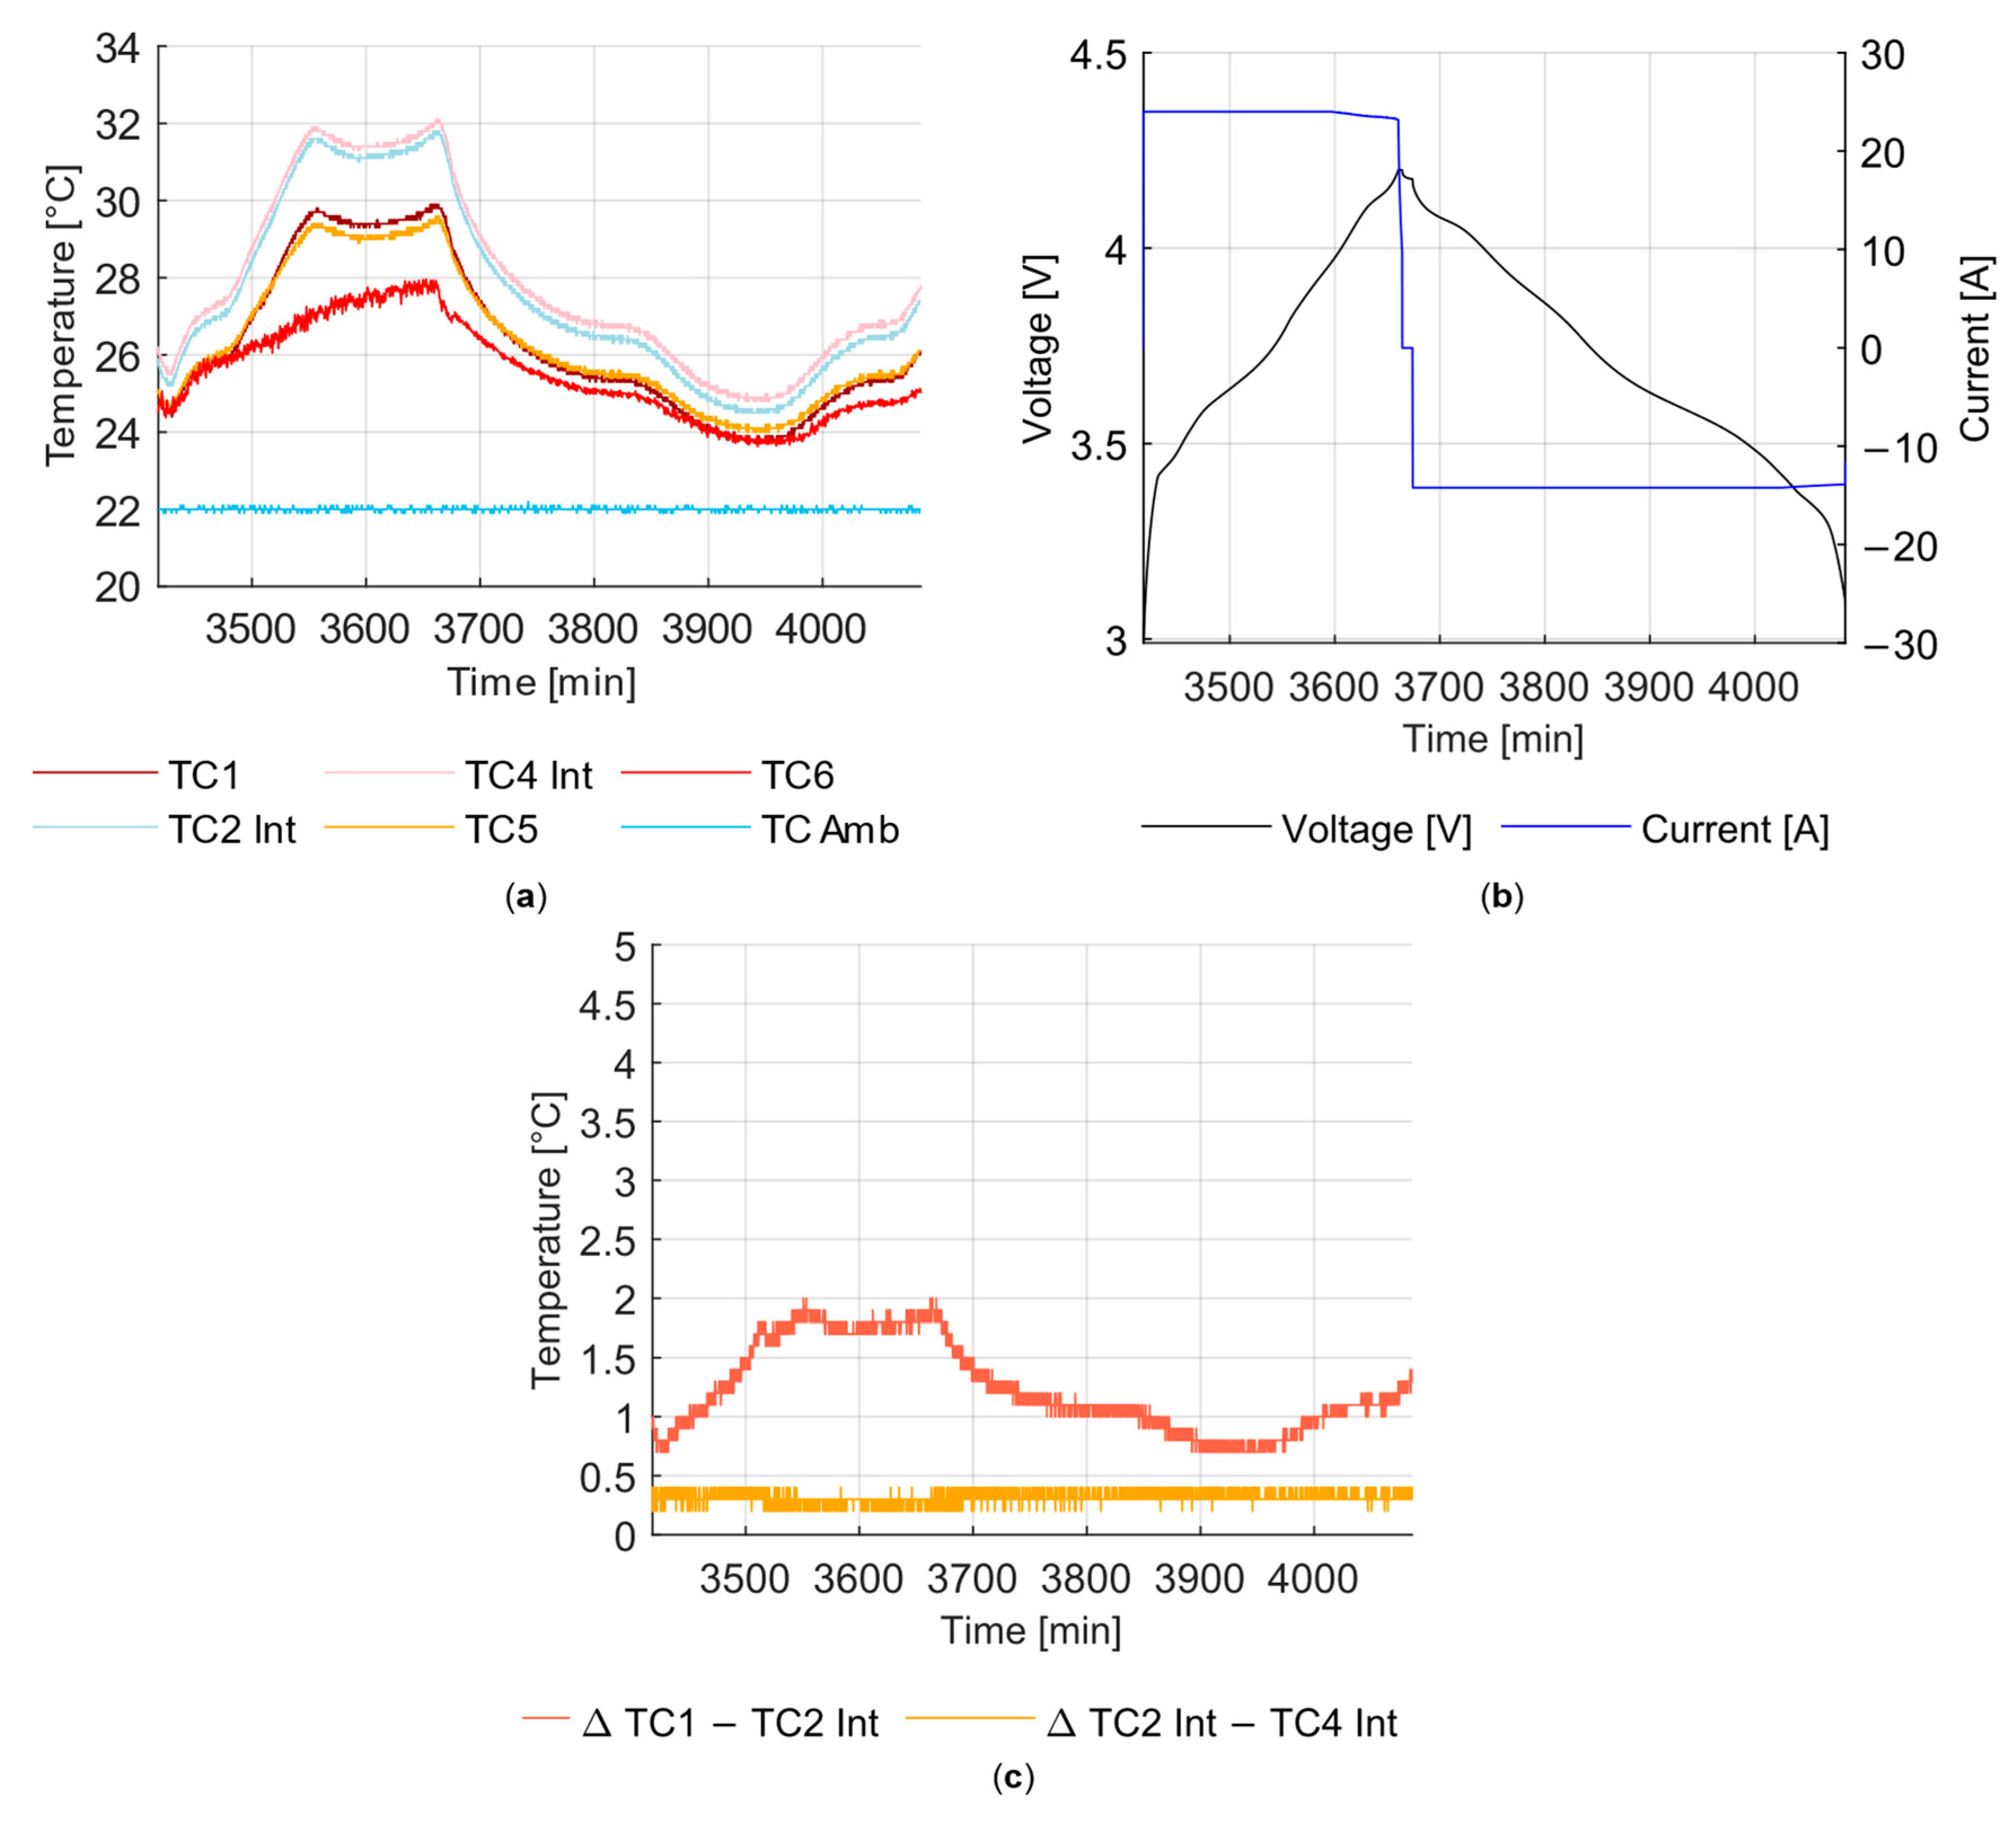
3.1. Cyclization with/without Integrated Thermocouples

To estimate the influence of the sensor insertion in the prismatic cell, the discharge capacity and quasi-open-circuit voltage (qOCV) curve at a low C rate of CellINT before and after sensor integration are compared.
According to Schmalstieg et al., it should be noted that the qOCV measurement only approximates the actual values for the open-circuit voltage, as a small current always flows and the cell is not in a relaxed state. However, the actual deviation depends on the current and is therefore comparatively small at low C rates [24]. Experimental results of the qOCV curve and discharge capacity as well as the 1 kHz impedance before and after sensor integration are shown in Figure 4 and Table 1. The deviation of the qOCV after sensor integration fluctuates around the zero value and reaches its maximum at an SOC of 0% and is 0.16% compared to the qOCV before sensor integration. The value of the discharge capacity at 22 °C and 0.15 C is 1.22% above the initial value after sensor integration. This suggests that the amount of electrolyte added during the integration process to compensate for electrolyte evaporation has expanded the lithium-ion inventory in the cell and the evaporation effect has been overcompensated.
The correlation between electrolyte quantity and cell (discharge) capacity has already been described by Günter et al. in their study [25]. For future studies on integrated sensing, it is important to determine the actual amount of evaporated solvent as precisely as possible during integration to be able to carry out the compensation precisely.
Based on the results, it can be concluded that the insertion of the thermocouples did not lead to significant impairment of the electrochemical behavior of the battery cell. However, it cannot be determined to what extent the intervention in the internal structure of the battery cell has long-term effects regarding cell aging. This would require a reference analysis of the cyclical aging behavior of CellINT.
After the initial validation tests, further full charge/discharge cycles were performed to quantify the temperature gradient between the cell center and the cell housing surface at 0.15 C. For this purpose, the course of the internal and external temperature of the cell was analyzed for a reference cycle with 100% DOD as shown in Figure 5. In Figure 5c, the temperature difference between the two thermocouples inside the cell is approximately constant at a value of 0.4 °C during the reference cycle. The distance between the two measuring points is 130 mm. The temperature difference between the center of the cell and the point on the surface of the cell housing with the smallest distance is 1.8 °C at maximum. The absolute distance between the two measuring points is 17.85 mm, whereby 1.2 mm is accounted for by the thickness of the housing wall and 16.65 mm by the total thickness of the jelly roll. This results in an average temperature gradient of 0.1 °C/mm. The comparatively greater temperature gradient can be attributed to the comparatively poorer thermal conductivity perpendicular to the electrode surface compared to the thermal conductivity in the plane of the electrode and the more efficient heat dissipation at the cell surface [26].

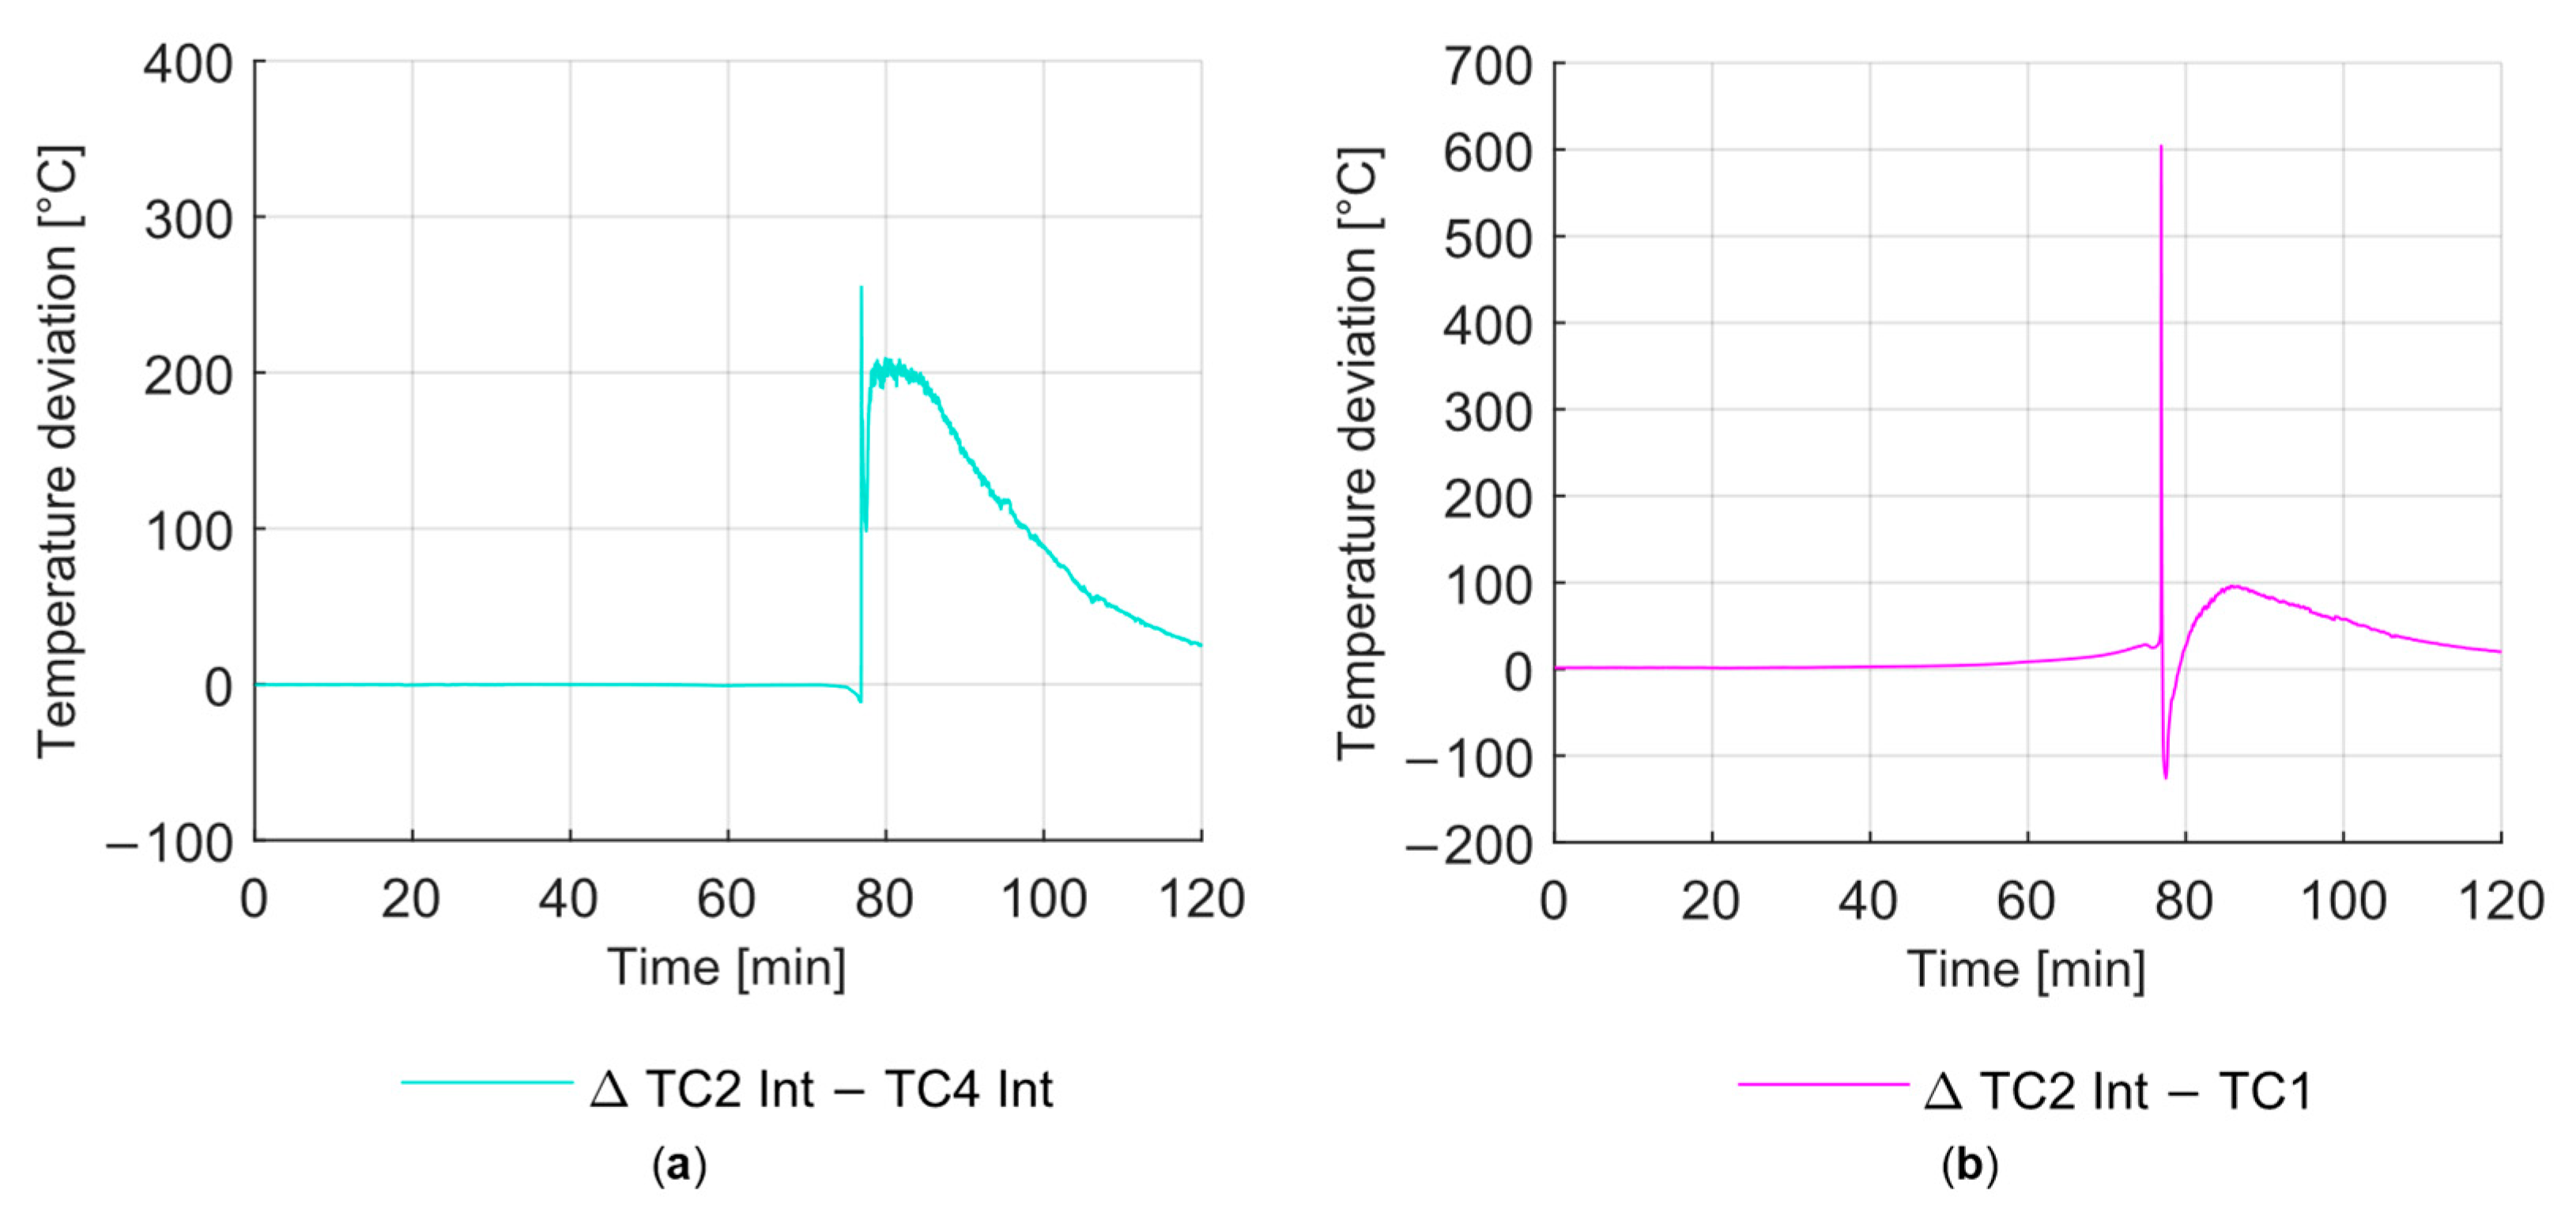
3.2. Thermal Runaway with/without Integrated Thermocouples

The evaluation of the thermal runaway behavior on the basis of different characteristic temperatures (T1, T2 and T3) before and during the thermal runaway is carried out according to Feng et al. [27]. T1 is the temperature at which the decomposition of the solid electrolyte interface (SEI) begins. T2 is the temperature at which the thermal runaway is triggered. The time of reaching temperature T2 is also indicated by a temperature rise rate at around 1 °C·s−1. At this point, the side reactions, such as the decomposition of the SEI film, are highly exothermic reactions between Li and organic solvents, melting of the separator and decomposition of the cathode materials. T3 is the maximum cell temperature during the thermal runaway of the battery cell. T2 is the most important evaluation parameter for thermal runaway behavior, as a higher T2 generally correlates with the thermal stability of a battery cell. T3 is a good indicator of the risk of thermal propagation at system level. With increasing temperature T3, the risk of thermal propagation increases [27].
For CellINT, the characteristic temperatures are analyzed based on the temperatures detected inside the cell according to Figure 6d. In this case, T1 is 95.7 °C and is reached 4289 s after the end-of-charge voltage is exceeded. Up to this point, the temperatures at measuring points 2 and 4 do not deviate significantly from each other. This is due to the small charging current of 0.25 C. The cell is in a thermally stable state, whereby the decomposition of the SEI layer has already begun. T2 is reached first at measuring point 4 after 4600 s on the selected time axis. The temperature here is 157.0 °C. For measuring point 2, T2 is reached after 4602 s at 154.7 °C. This supports the findings of Feng et al. that LIBs with high-energy-density materials will release their stored electrochemical and chemical energy at temperatures significantly below 300 °C as thermal energy [27]. For measuring point 2, T3 is reached after 4614 s at 925.5 °C. T3 is also reached at measuring point 4 after 4615 s. The maximum temperature measured inside the cell here is 723.5 °C. This significant difference in the maximum expression of T3 at two measurement points 130 mm apart on the identical electrode position is interesting for a possible consideration of a thermal propagation scenario on battery system level. The results suggest that the positioning of the sensors in the cell has a decisive influence on the detection of the actual maximum temperatures in the cell and that this must be considered when planning experiments to characterize possible propagation scenarios. This is also evident from the data for the temperature difference between different measuring points for CellINT.
The temperature difference between the two integrated thermocouples during the thermal runaway according to Figure 7a is up to approx. 260 °C at the maximum and 200 °C after the first peak has subsided at a spatial distance of 130 mm. The differential temperature between the cell interior and the cell surface stabilizes at only 100 °C after the first peak (see Figure 7b) before cooldown. This is due to the significantly poorer heat conduction behavior perpendicular to the electrode compared to heat conduction along the electrode surface, as already described in Section 3.1.
At temperatures higher than 1200 °C, the temperature measured at measuring point 6 for CellINT is considerably higher than the temperatures for T3 (see Figure 6d). Although this temperature was not measured inside the cell, it is particularly significant in the context of a possible thermal propagation scenario. The temperature of the burning gas stream escaping from the vent of the prismatic cell can additionally heat neighboring cells if deflected by, e.g., busbars in the battery system.
To compare the thermal runaway behavior of CellREF and CellINT, the temperature values measured on the cell surface are analyzed. CellREF reaches a temperature rise rate of 1 °C*s−1 on the cell surface 4.315 s after reaching the cut-off charge voltage according to Figure 8a. The temperature T2 at measuring point 1 is 107.5 °C for CellREF. CellINT reaches the critical point on the cell surface measuring point 1 at 4.623 s after the end-of-charge voltage has been exceeded (see Figure 8b). The detected temperature T2 for CellINT is 119.5 °C and, therefore, significantly higher.
At 813.0 °C, the surface temperature T3 at position 1 for CellINT is also significantly higher than for CellREF, whose maximum temperature T3 is 460.4 °C at the same position (see Figure 6c,d). However, it cannot necessarily be assumed that these temperature differences are due to the change in the cell caused by the implementation of sensors. It is conceivable that the temperature hotspots on CellREF have formed at positions other than the measurement positions. Studies on the thermal runaway behavior of identical cells under identical boundary conditions and without integrated sensors also show a divergence in thermal runaway behavior [28].
However, the comparison of the voltage data during the process of overcharging according to Figure 6a,b shows significant similarities between the behavior of CellREF and CellINT. According to Wang et al., the significant increase in cell voltage shortly before thermal runaway can be attributed to the consumption of Li, which is caused by Li-related side reactions at the interface between electrolyte and electrode and the structural change in the cathode active material [29]. The local voltage maximum for CellREF is 4.878 V. The local voltage maximum for CellINT is 4.872 V. A comparison of the temperature data from measuring point 6 of both cells shows that the voltage maximum coincides with the time directly before the vents of both cells open.
For future studies, it is necessary to determine the proportion of the deviation possibly attributable to cell modification by means of further tests to be able to evaluate the comparability.

4. Conclusions

In this work, two thermocouples were inserted into a commercial prismatic high-energy lithium-ion battery cell (NMC811/C, 95 Ah) to characterize the thermal runaway behavior. A cell prepared with thermocouples and an identical reference cell without integrated thermocouples were each brought into thermal runaway by overcharging. Based on the voltage, charge current, surface temperature and internal temperature data of the reference cell and the modified cell, the thermal runaway behavior was investigated. The experimental results provide a data-based insight into the real-time behavior of a prismatic automotive LIB with a Ni-rich cathode and high energy content. The following main conclusions can be drawn from the results:
(1)
The methods presented in the existing literature for integrating temperature sensors into small-format battery cells with low energy density and low energy content can be transferred with minor adaptations to large-format prismatic battery cells with high energy density and high energy content without major impact on the cell properties. The loss of solvent from the electrolyte due to evaporation at room temperature during sensor integration can be compensated for by subsequently adding an electrolyte with an identical composition without loss of cell capacity. In future work, there is a need to determine the amount of solvent evaporated as precisely as possible to prevent overcompensation.
(2)
In large-format prismatic high-energy battery cells, a temperature difference of up to 1.8 °C between the internal temperature between the two jelly rolls and the external cell surface temperature occurs during cycling under the condition of natural convection, even at low charging currents of 0.25 C, which are likely to be much higher at higher C rates. This confirms the assumption that cell-integrated temperature sensors offer considerable added value for understanding the internal processes in the cell, especially in large-format battery cells with a high energy density.
(3)
Using integrated thermocouples, the point of no return can be detected 21 s earlier in the event of a thermal runaway induced by overcharging with a constant charging current of 0.25 C in direct comparison to surface temperature measurement. This confirms the potential of cell-integrated temperature sensors for the early detection of potentially critical conditions for cell chemistries with low thermal stability.
In future research work, the aim is to further standardize the approach of cell-integrated sensor technology, especially for large-format prismatic cells, to fully capture the influence of the sensor technology and its integration. This would enable high-precision comparability of cell behavior with and without integrated sensors and thus better transferability of the results to cell development.

Author Contributions

Conceptualization, N.K. and F.H.; data curation, N.K. and F.H.; funding acquisition, H.H. and A.K.; methodology, N.K.; project administration, H.H. and A.K.; supervision, C.O.; visualization, N.K. and F.H.; writing—original draft, N.K. and F.H.; writing—review and editing, N.K., C.O. and M.F. All authors have read and agreed to the published version of the manuscript.

Funding

This research received no external funding.

Data Availability Statement

The data presented in this study are available on request from the corresponding author. The data are not publicly available due to privacy.

Conflicts of Interest

The authors declare no conflicts of interest.

References

  1. Rangarajan, S.S.; Sunddararaj, S.P.; Sudhakar, A.V.; Shiva, C.K.; Subramaniam, U.; Collins, E.R.; Senjyu, T. Lithium-Ion Batteries-The Crux of Electric Vehicles with Opportunities and Challenges. Clean Technol. 2022, 4, 908–930. [Google Scholar] [CrossRef]
  2. BloombergNEF. BNEF Electric Vehicle Outlook 2023; BloombergNEF: New York, NY, USA, 2023. [Google Scholar]
  3. Masias, A.; Marcicki, J.; Paxton, W.A. Opportunities and Challenges of Lithium Ion Batteries in Automotive Applications. ACS Energy Lett. 2021, 6, 621–630. [Google Scholar] [CrossRef]
  4. Chen, Y.; Kang, Y.; Zhao, Y.; Wang, L.; Liu, J.; Li, Y.; Liang, Z.; He, X.; Li, X.; Tavajohi, N.; et al. A review of lithium-ion battery safety concerns: The issues, strategies, and testing standards. J. Energy Chem. 2021, 59, 83–99. [Google Scholar] [CrossRef]
  5. Feng, X.; Ouyang, M.; Liu, X.; Lu, L.; Xia, Y.; He, X. Thermal runaway mechanism of lithium ion battery for electric vehicles: A review. Energy Storage Mater. 2018, 10, 246–267. [Google Scholar] [CrossRef]
  6. Tran, M.-K.; Mevawalla, A.; Aziz, A.; Panchal, S.; Xie, Y.; Fowler, M. A Review of Lithium-Ion Battery Thermal Runaway Modeling and Diagnosis Approaches. Processes 2022, 10, 1192. [Google Scholar] [CrossRef]
  7. Wei, Z.; Zhao, J.; He, H.; Ding, G.; Cui, H.; Liu, L. Future smart battery and management: Advanced sensing from external to embedded multi-dimensional measurement. J. Power Sources 2021, 489, 229462. [Google Scholar] [CrossRef]
  8. Jinasena, A.; Spitthoff, L.; Wahl, M.S.; Lamb, J.J.; Shearing, P.R.; Strømman, A.H.; Burheim, O.S. Online Internal Temperature Sensors in Lithium-Ion Batteries: State-of-the-Art and Future Trends. Front. Chem. Eng. 2022, 4, 804704. [Google Scholar] [CrossRef]
  9. Novais, S.; Nascimento, M.; Grande, L.; Domingues, M.F.; Antunes, P.; Alberto, N.; Leitão, C.; Oliveira, R.; Koch, S.; Kim, G.T.; et al. Internal and External Temperature Monitoring of a Li-Ion Battery with Fiber Bragg Grating Sensors. Sensors 2016, 16, 1394. [Google Scholar] [CrossRef]
  10. Nascimento, M.; Novais, S.; Ding, M.S.; Ferreira, M.S.; Koch, S.; Passerini, S.; Pinto, J.L. Internal strain and temperature discrimination with optical fiber hybrid sensors in Li-ion batteries. J. Power Sources 2019, 410–411, 1–9. [Google Scholar] [CrossRef]
  11. Raghavan, A.; Kiesel, P.; Sommer, L.W.; Schwartz, J.; Lochbaum, A.; Hegyi, A.; Schuh, A.; Arakaki, K.; Saha, B.; Ganguli, A.; et al. Embedded fiber-optic sensing for accurate internal monitoring of cell state in advanced battery management systems part 1: Cell embedding method and performance. J. Power Sources 2017, 341, 466–473. [Google Scholar] [CrossRef]
  12. Lee, C.-Y.; Lee, S.-J.; Hung, Y.-M.; Hsieh, C.-T.; Chang, Y.-M.; Huang, Y.-T.; Lin, J.-T. Integrated microsensor for real-time microscopic monitoring of local temperature, voltage and current inside lithium ion battery. Sens. Actuators A Phys. 2017, 253, 59–68. [Google Scholar] [CrossRef]
  13. Zhu, S.; Han, J.; An, H.-Y.; Pan, T.-S.; Wei, Y.-M.; Song, W.-L.; Chen, H.-S.; Fang, D. A novel embedded method for in-situ measuring internal multi-point temperatures of lithium ion batteries. J. Power Sources 2020, 456, 227981. [Google Scholar] [CrossRef]
  14. Fleming, J.; Amietszajew, T.; Charmet, J.; Roberts, A.J.; Greenwood, D.; Bhagat, R. The design and impact of in-situ and operando thermal sensing for smart energy storage. J. Energy Storage 2019, 22, 36–43. [Google Scholar] [CrossRef]
  15. Mutyala, M.S.K.; Zhao, J.; Li, J.; Pan, H.; Yuan, C.; Li, X. In-situ temperature measurement in lithium ion battery by transferable flexible thin film thermocouples. J. Power Sources 2014, 260, 43–49. [Google Scholar] [CrossRef]
  16. Zhang, G.; Cao, L.; Ge, S.; Wang, C.-Y.; Shaffer, C.E.; Rahn, C.D. In Situ Measurement of Radial Temperature Distributions in Cylindrical Li-Ion Cells. J. Electrochem. Soc. 2014, 161, A1499–A1507. [Google Scholar] [CrossRef]
  17. Martiny, N.; Rheinfeld, A.; Geder, J.; Wang, Y.; Kraus, W.; Jossen, A. Development of an All Kapton-Based Thin-Film Thermocouple Matrix for In Situ Temperature Measurement in a Lithium Ion Pouch Cell. IEEE Sens. J. 2014, 14, 3377–3384. [Google Scholar] [CrossRef]
  18. Osswald, P.J.; Erhard, S.V.; Wilhelm, J.; Hoster, H.E.; Jossen, A. Simulation and Measurement of Local Potentials of Modified Commercial Cylindrical Cells. J. Electrochem. Soc. 2015, 162, A2099–A2105. [Google Scholar] [CrossRef]
  19. Spinner, N.S.; Hinnant, K.M.; Mazurick, R.; Brandon, A.; Rose-Pehrsson, S.L.; Tuttle, S.G. Novel 18650 lithium-ion battery surrogate cell design with anisotropic thermophysical properties for studying failure events. J. Power Sources 2016, 312, 1–11. [Google Scholar] [CrossRef]
  20. Waldmann, T.; Wohlfahrt-Mehrens, M. In-Operando Measurement of Temperature Gradients in Cylindrical Lithium-Ion Cells during High-Current Discharge. ECS Electrochem. Lett. 2014, 4, A1–A3. [Google Scholar] [CrossRef]
  21. Xu, C.; Feng, X.; Huang, W.; Duan, Y.; Chen, T.; Gao, S.; Lu, L.; Jiang, F.; Ouyang, M. Internal temperature detection of thermal runaway in lithium-ion cells tested by extended-volume accelerating rate calorimetry. J. Energy Storage 2020, 31, 101670. [Google Scholar] [CrossRef]
  22. Parekh, M.H.; Li, B.; Palanisamy, M.; Adams, T.E.; Tomar, V.; Pol, V.G. In Situ Thermal Runaway Detection in Lithium-Ion Batteries with an Integrated Internal Sensor. ACS Appl. Energy Mater. 2020, 3, 7997–8008. [Google Scholar] [CrossRef]
  23. Mei, W.; Liu, Z.; Wang, C.; Wu, C.; Liu, Y.; Liu, P.; Xia, X.; Xue, X.; Han, X.; Sun, J.; et al. Operando monitoring of thermal runaway in commercial lithium-ion cells via advanced lab-on-fiber technologies. Nat. Commun. 2023, 14, 5251. [Google Scholar] [CrossRef]
  24. Schmalstieg, J.; Rahe, C.; Ecker, M.; Sauer, D.U. Full Cell Parameterization of a High-Power Lithium-Ion Battery for a Physico-Chemical Model: Part I. Physical and Electrochemical Parameters. J. Electrochem. Soc. 2018, 165, A3799–A3810. [Google Scholar] [CrossRef]
  25. Günter, F.J.; Burgstaller, C.; Konwitschny, F.; Reinhart, G. Influence of the Electrolyte Quantity on Lithium-Ion Cells. J. Electrochem. Soc. 2019, 166, A1709–A1714. [Google Scholar] [CrossRef]
  26. Chen, S.C.; Wan, C.C.; Wang, Y.Y. Thermal analysis of lithium-ion batteries. J. Power Sources 2005, 140, 111–124. [Google Scholar] [CrossRef]
  27. Feng, X.; Zheng, S.; Ren, D.; He, X.; Wang, L.; Cui, H.; Liu, X.; Jin, C.; Zhang, F.; Xu, C.; et al. Investigating the thermal runaway mechanisms of lithium-ion batteries based on thermal analysis database. Appl. Energy 2019, 246, 53–64. [Google Scholar] [CrossRef]
  28. Willstrand, O.; Pushp, M.; Andersson, P.; Brandell, D. Impact of different Li-ion cell test conditions on thermal runaway characteristics and gas release measurements. J. Energy Storage 2023, 68, 107785. [Google Scholar] [CrossRef]
  29. Wang, Z.; Yuan, J.; Zhu, X.; Wang, H.; Huang, L.; Wang, Y.; Xu, S. Overcharge-to-thermal-runaway behavior and safety assessment of commercial lithium-ion cells with different cathode materials: A comparison study. J. Energy Chem. 2021, 55, 484–498. [Google Scholar] [CrossRef]
Figure 1. Systematic approach for integrating two thermocouples into a large-format prismatic cell; (a) milling a groove 5.0 mm below the housing cover; (b) cutting through the thin cut edge; (c) extraction of the jelly rolls and the housing lid from the housing can; (d) drilling two feed-throughs for the thermocouples; (e) integration and positioning of the thermocouples; (f) closing and sealing of the cell.
Batteries 10 00041 g001
Figure 2. Projection view of the cell with thermocouple position; (a) front view; (b) side view; (c) top view.
Batteries 10 00041 g002
Figure 3. Schematic representation of the test setup in the abuse test chamber and the data interfaces.
Batteries 10 00041 g003
Figure 4. Comparison of (a) the qOCV curve for CellINT before and after sensor integration and (b) the relative deviation.
Batteries 10 00041 g004
Figure 5. Reference cycle at 100% DOD and detected internal and external cell temperature values over the charge/discharge cycle: (a) course of the temperature measured on the cell surface at measuring points 1, 5 and 6 and the temperature measured inside CellINT at measuring points 2 and 4; (b) progression of the cell voltage and charge/discharge current in the reference cycle; (c) absolute temperature difference between the internal cell temperature at measuring point 2 and the external cell temperature at measuring point 1 as well as the temperature difference between the two integrated thermocouples at measuring points 2 and 4.
Batteries 10 00041 g005
Figure 6. Test data from overcharging CellINT and CellREF without integrated sensors: (a) voltage and current data from the point of reaching the end-of-charge voltage to the thermal runaway for CellREF; (b) voltage and current data from the point of reaching the end-of-charge voltage to the thermal runaway for CellINT; (c) course of the surface temperature and the ambient temperature above the vents of CellREF during overcharging and thermal runaway; (d) course of the surface temperature and the ambient temperature above the vents of CellINT during overcharging and thermal runaway.
Batteries 10 00041 g006
Figure 7. Temperature difference between the thermocouple pairs of CellINT: (a) temperature difference between internal measurement points 2 and 4; (b) temperature difference between internal measurement point 2 and surface measurement point 1.
Batteries 10 00041 g007
Figure 8. Temperature change rate at various measuring points before, during and after the thermal runaway limited to an observation range of +/−5 °C: (a) surface temperature at measurement points 1 and 5 of CellREF; (b) surface temperature at measurement points 1 and 5 as well as internal temperature at measurement points 2 and 4 of CellINT.
Batteries 10 00041 g008
Table 1. Comparison of the discharge capacity and 1 kHz impedance for CellINT before and after sensor integration.
Reference ValuesBefore Sensor IntegrationAfter Sensor IntegrationDeviation
Discharge capacity 1
at 22 °C 0.15 C
96.09 Ah97.28 Ah+1.22%
1 kHz Impedance
at 22 °C and 50% SOC
0.921 mOhm0.893 mOhm−1.03%
1 Nominal capacity of 95 Ah according to the cell manufacturer’s data sheet. No information is provided on C rate and ambient temperature.
Disclaimer/Publisher’s Note: The statements, opinions and data contained in all publications are solely those of the individual author(s) and contributor(s) and not of MDPI and/or the editor(s). MDPI and/or the editor(s) disclaim responsibility for any injury to people or property resulting from any ideas, methods, instructions or products referred to in the content.

