Article

Magnetism and Electronic State of Iron Ions on the Surface and in the Core of TiO2 Nanoparticles

by
Anatoly Ye. Yermakov
1,2,*,
Mikhail A. Uimin
1,
Danil W. Boukhvalov
3,4,
Artem S. Minin
1,2,*,
Nadezhda M. Kleinerman
1,
Sergey P. Naumov
1,2,
Aleksey S. Volegov
1,2,
Denis V. Starichenko
1,
Kirill I. Borodin
1,2,
Vasily S. Gaviko
1,2,
Sergey F. Konev
4 and
Nikolay A. Cherepanov
5
1
M.N. Mikheev Institute of Metal Physics of Ural Branch of Russian Academy of Sciences, 620108 Ekaterinburg, Russia
2
Institute of Natural Sciences and Mathematics, Ural Federal University, 620083 Ekaterinburg, Russia
3
College of Science, Institute of Materials, Physics and Chemistry, Nanjing Forestry University, Nanjing 210037, China
4
Theoretical Physics and Applied Mathematics Department, Ural Federal University, 620002 Ekaterinburg, Russia
5
Educational and Scientific Center for Expertise of Certification and Quality Problems, Ural Federal University, 620002 Ekaterinburg, Russia
*
Authors to whom correspondence should be addressed.
Magnetochemistry 2023, 9(8), 198; https://doi.org/10.3390/magnetochemistry9080198
Submission received: 20 June 2023 / Revised: 27 July 2023 / Accepted: 1 August 2023 / Published: 3 August 2023
(This article belongs to the Section Magnetic Nanospecies)

Abstract

:
In this paper, the electron and magnetic state of iron placed either on the surface or in the core of TiO2 nanoparticles were investigated using magnetometric methods, electron paramagnetic resonance (EPR) and Mössbauer spectroscopy. It was demonstrated that the EPR spectra of TiO2 samples with iron atoms localized both on the surface and in the core of specific features depending on the composition and size of the nanoparticles. Theoretical calculations using the density functional theory (DFT) method demonstrated that the localization of Fe atoms on the surface is characterized by a considerably larger set of atomic configurations as compared to that in the core of TiO2 nanoparticles. Mössbauer spectra of the samples doped with Fe atoms both on the surface and in the core can be described quite satisfactorily using two and three doublets with different quadrupole splitting, respectively. This probably demonstrates that the Fe atoms on particle surface and in the bulk are in different unlike local surroundings. All iron ions, both on the surface and in the core, were found to be in the Fe3+ high-spin state.

1. Introduction

The surface of nanocrystalline materials substantially determines their physical and chemical properties [1,2,3]. The role of surface is especially great in photocatalysts, to which TiO2 is known to belong [4,5,6]. The catalytic properties can be changed as a result of the surface modification of TiO2 nanoparticles. As the size of nanoparticles decreases, a surface modification can take place, which is caused by the competition between the surface energy and the core energy contributions [7,8,9,10,11,12,13]. That is specifically characteristic of clusters of a finite size [14,15,16,17,18,19].
The surface modification occurs as the TiO2 nanoparticles change in size, for example, from 7 to 200 nm and the fraction of facets corresponding to the planes of different types can change on the surface. Thus, as the nanoparticles size decreases, apart from the most closely packed planes of (110) type, which are characteristic of the “core” state (or large-sized particles) of TiO2, less closely packed planes such as (101) may appear as well. The catalytic properties also change because of surface doping, for example, with Fe3+ ions. In TiO2 particles, the impurity Fe3+ ions may occupy different sites, depending on the type of planes formed on the surface. As various defects appear, the electronic and catalytic properties of the surface can be changed [20,21,22]. In this regard, the electronic features of TiO2 particles of a various size with Fe3+ ions on the surface and the analysis of magnetic state and magnetic moment of these ions present a fundamental interest. However, there are practically no works devoted to the analysis of iron magnetism on the surface of semiconductor TiO2 nanoparticles. In addition, the question of the formation of the magnetic structure of iron spins on the surface of nanoparticles also remains open, considering the influence of clustering and exchange interaction.
It was demonstrated [23,24,25,26,27] that as iron ions are present within nanoparticles of titanium oxide and other compounds, the magnetic properties and the EPR spectra can be described adequately on an assumption that the iron ions form either dimers or more complicated clusters with a negative exchange interaction between Fe3+ ions inside the clusters. In this study, we tried to establish whether we can observe such clustering of iron ions accompanied by the exchange interaction, when the iron ions are present not only in the core of titanium oxide but on the surface as well.
Thus, the main goal of experimental and theoretical research is to elucidate the role of surface and bulk contributions to the electronic properties and magnetism of iron atoms (low-spin or high-spin) upon TiO2 doping. Therefore, the subject of this research is the theoretical study and experimental investigation of the magnetic properties of TiO2: Fe nanoparticles, the determination of the role played by clustering, and the study of the electronic and spin state of iron ions localized both on the surface and in the core of TiO2 nanoparticles of various size.

2. Materials and Methods

Ferromagnetic impurities present a substantial problem for studying magnetic properties of various substances, especially of paramagnetic or diamagnetic compounds. To avoid contamination of the samples, a variety of precautions were taken. To perform all the manipulations, disposable, sterile test tubes were used; all the tools were made of non-ferromagnetic materials (aluminum, titanium, plastic). Before use, an ultrasonic activator was processed with 2 M of hydrochloric acid and then rinsed with distilled water and ethanol.
To deposit iron ions on the surface, the Ishihara Sangyo (ST-01, ST-21, ST-41) powders were used. The powders have the structure of anatase and, according to the producer’s data, the average size of TiO2 nanoparticles was 7, 20 and 200 nm, with the specific surface of 324, 65 and 9.5 m2/g, respectively.
Iron ions were deposited on the surface of titanium dioxide from the aqueous solution of iron nitrate (FeNO3·9H2O). To perform the deposition, 100 mg of iron nitrate was previously placed into a plastic test tube, and distilled water was added to a volume of 5 mL. In a separate test tube, 100 mg of TiO2 nanoparticles were placed and the iron nitrate solution was added using a sterile Pasteur pipette dropper. Further more, a sample was subjected to ultrasound for 30 s using an ultrasonic activator. The suspension of nanoparticles in the iron nitrate solution was incubated for 10–12 h (overnight). Upon incubation, the nanoparticles were separated from liquid by centrifugation (20,000 RCF), water was then added into the test tube, and the sample was subjected to ultrasound and centrifuged again. After that, water was removed and the procedure was repeated twice, but this time using isopropyl alcohol. After the last portion of alcohol was removed, another portion of some 1 mL alcohol was added to the test tube, where nanoparticles were turned into suspension, which then was transferred into glass Petri dishes to dry. After deposition of Fe, the TiO2 samples turned in color from white to faintly yellowish-brown. Further on, the samples were kept at room temperature in untight bags.
For further investigations, the samples were treated with hydrochloric acid to remove weakly bonded iron ions and with sodium dithionite to extract iron ions completely [28]. For the treatment with hydrochloric acid, a sample was placed into a 5 mL test tube, then 2 M HCl was added to a volume of 5 mL. Then, the sample was subjected to ultrasound for 30 s and then was centrifuged and rinsed with alcohol following the procedure described above. The treatment with sodium dithionite was carried out in a similar way, using 0.5 M solution of Na2S2O4.
Part of the samples were subjected to calcination in air at temperatures from 100 to 400 °C to ensure diffusion of the iron atoms into the core of nanoparticles. The powder of nanoparticles was placed into a quartz ampoule, which was then heated in a furnace up to a required temperature. After calcination, part of the samples were treated with acid or, consequently, with acid and sodium dithionite following the procedure described above. The samples subjected to etching in Na2S2O4 are marked with the symbol E2 added. Table 1 contains the description of the samples and their corresponding treatment.
X-ray diffraction studies were carried out in copper radiation by means of an Empyrean Series 2 diffractometer manufactured by PANalytical, (Malvern, UK), with CuKα and CrKα radiation. To calculate the size of coherent scattering regions (CSR) and phase compositions, the HighScore v.4.x software (PANalytical, Malvern, UK) package was used. The X-ray investigations all samples (ST-01, ST-21, ST-41) including ST-01 before and after Fe deposition and proceeding annealing are shown in Supplementary Materials, Figures S1 and S2. Rietveld refinement demonstrates that the all diffraction peaks correspond to TiO2 in crystalline modification of anatase, no extraneous phases were detected.
To analyze microstructure of samples, the transmission electron microscope Tecnai G2 30 (FEI Company, Hillsbro, OR, USA) with maximum accelerating voltage up to 300 kV was used. The brightfield and darkfield TEM images for the samples ST-01 and ST-21 are presented on Figures S3 and S4.
The magnetic properties of nanopowders with a various spatial distribution of Fe3+ ions in TiO2 nanoparticles were measured using SQUID magnetometry (Quantum Design MPMS XL7 (Quantum Design, San Diego, CA, USA) in the temperature range from 2 to 300 K in the fields up to 70 kOe. Magnetic susceptibility was measured at room tempera-ture in the fields up to 12 kOe using a Faraday balance.
EPR measurements were performed at room temperature using a standard Adani CMS 8400 homodyne X-band (9.4 GHz) EPR spectrometer and a Bruker ELEXSYS 580 pulse spectrometer in stationary mode. A powder sample was placed into a quartz tube of 4.0 mm in diameter. A sample’s volume ranged from 2.0 to 5.0 mm3. The EPR spectra were recorded using a rectangular cavity resonator with high quality factor. Absolute val-ues of the g-factors were calibrated with the EPR signal from chromium chloride CrCl3 (S = 3/2) with g = 1.986. All the spectra presented in Figure 1, Figure 2A–C and Figure 3A–C are normalized to the sample mass and are given in arbitrary units (arb. units).
The samples of TiO2 doped with iron ions were also studied by FTIR spectroscopy using a DRS attachment spectrometer. The presence of iron ions on the surface after deposition was confirmed by additional lines appearing in the spectra in the range of (1200–1500) cm−1 (Figures S5–S7). These lines disappeared after etching in HCl (Figure S7).
For the Mössbauer studies, the samples were prepared in a similar way, but isotopically enriched ferric nitrate solution (57Fe enrichment of 95%) was used as a precursor.
To control quality of sample preparation using the commercially available salt and the solution of 57Fe in HNO3, Figure 1 displays the EPR spectra for the samples prepared with the use of the different precursors. The spectra appeared to be nearly identical. Furthermore, in this report, the samples obtained from the solution of 57Fe in HNO3 were to be denoted similarly to the samples prepared with the use of the commercially available salt, yet with letter M added to the notation.
The Mössbauer spectra were measured on a spectrometer MS2201 at room temperature with a source of 57 Co in rhodium matrix in the transmission geometry with a moving sample. The values of isomer shift are given relative to α–Fe at 295 K. Samples for the experiments were powders placed in the solution of polystyrene in toluene with the subsequent evaporation of toluene. The effective sample thickness did not exceed 0.15 mg 57Fe/cm2, which provided the Lorentzian shape of spectral lines. The SpectrRelax program [29] allowed direct fitting of the spectra with several sub-spectra.

3. Results

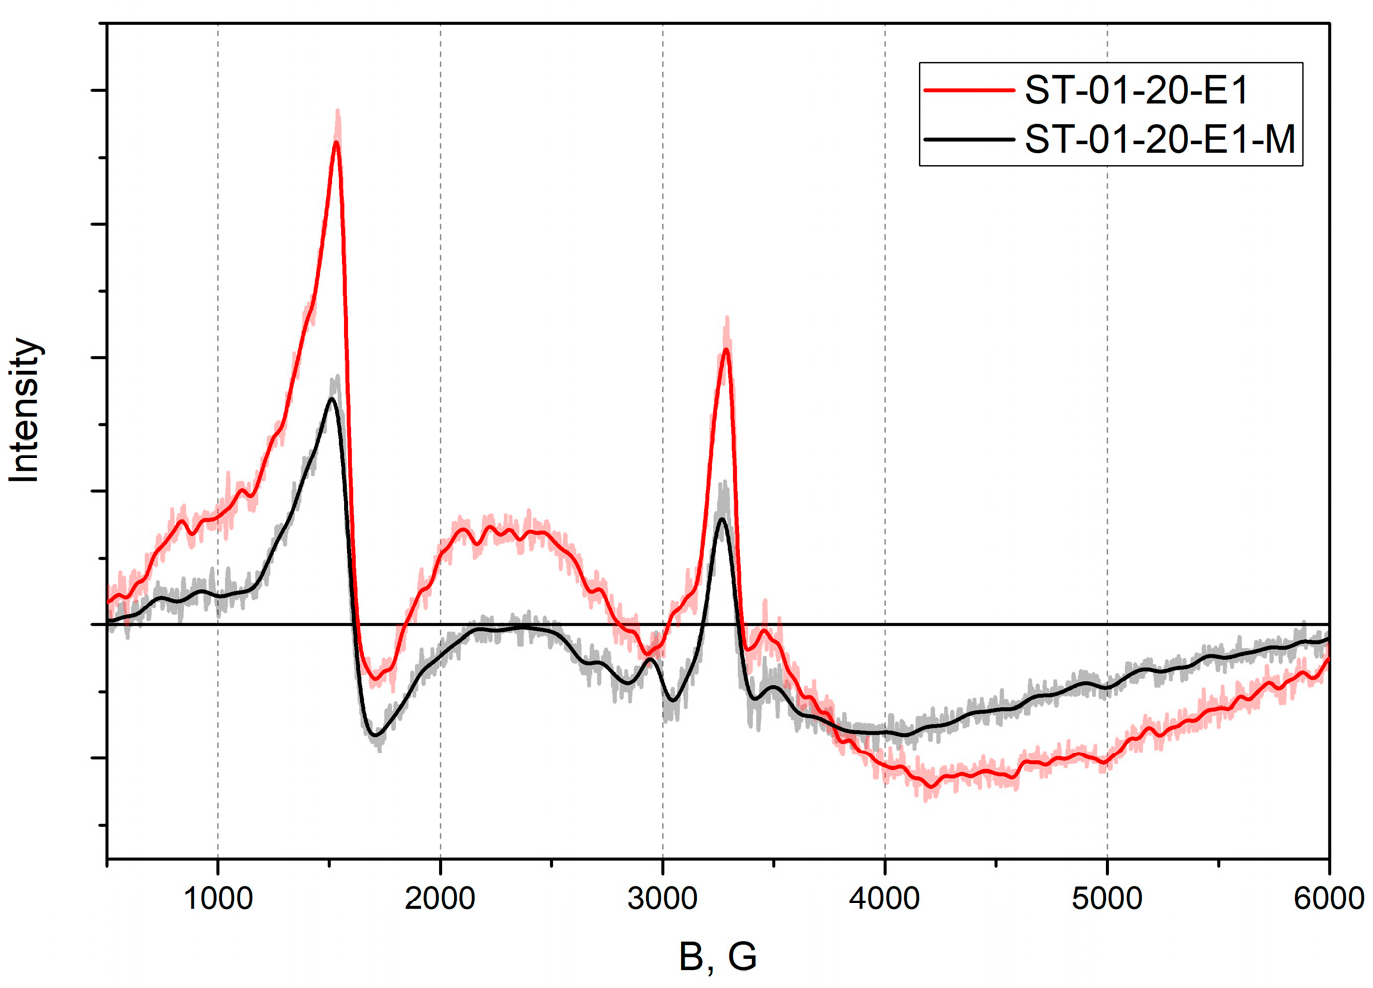
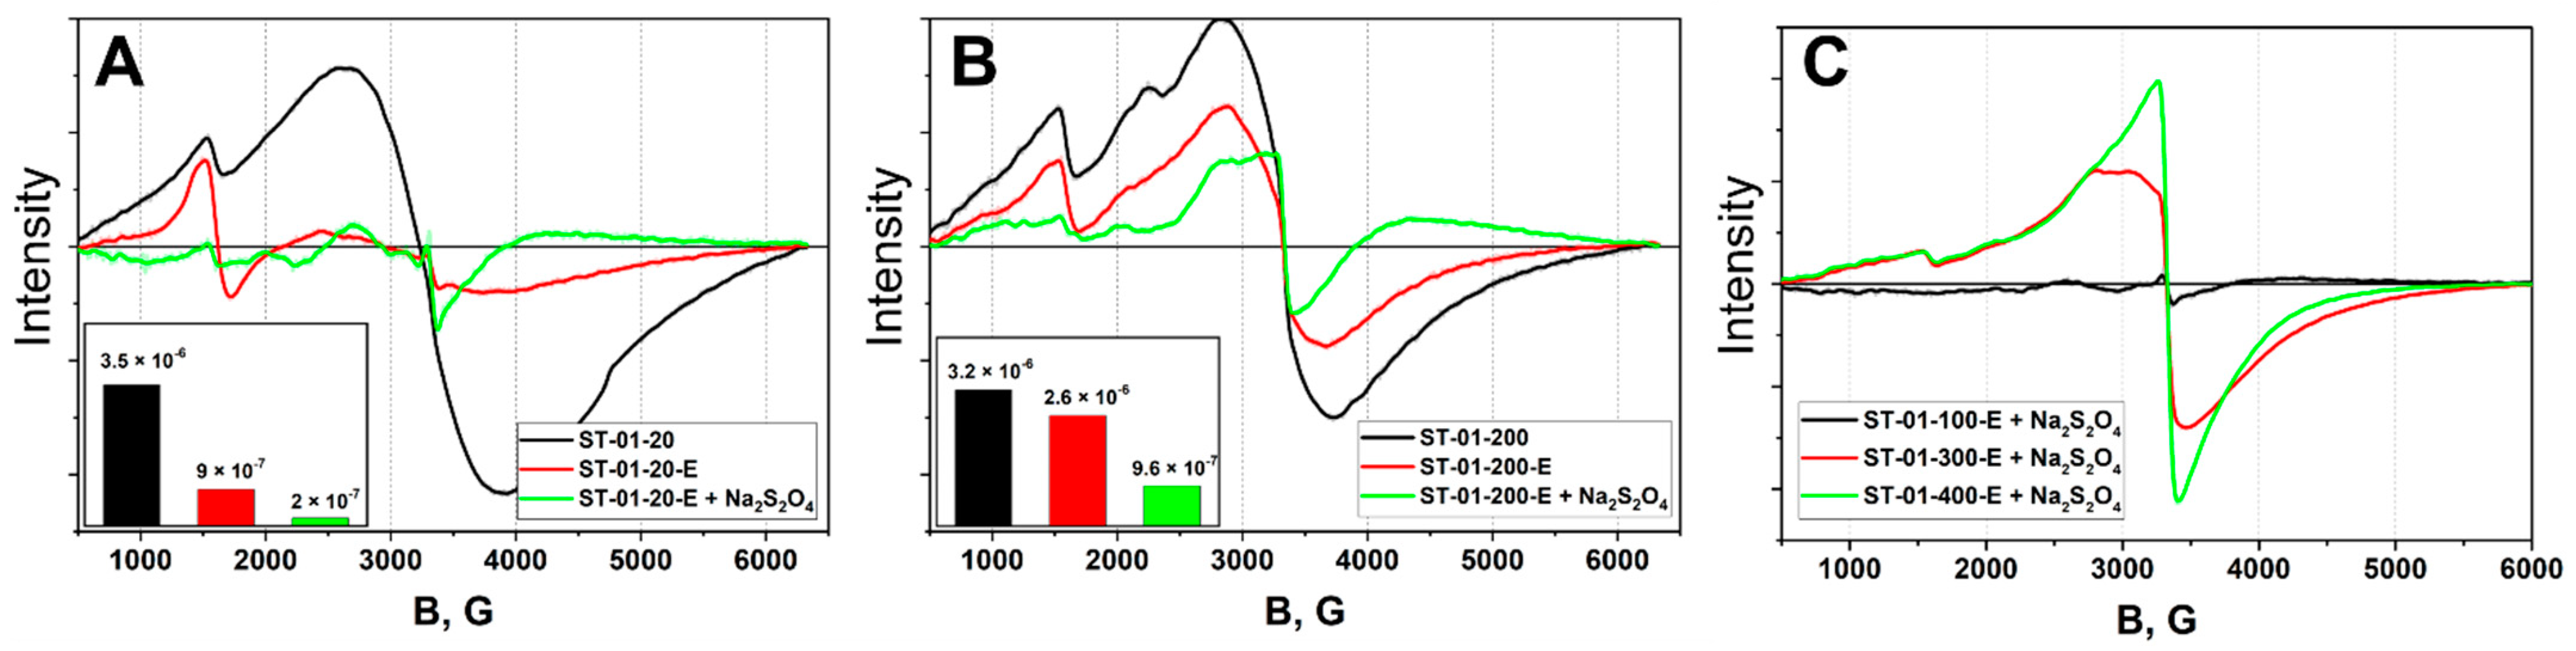
3.1. EPR Investigations of TiO2 Nanopowders with Fe Deposited on the Surface and in the Core of Nanoparticles of Different Size

The EPR spectra of iron-doped titanium oxide can contain lines corresponding to oxygen vacancies, Ti3+ ions and Fe3+ ions. Analysis of the EPR spectra allows valuable information to be obtained on the nearest neighborhood of iron ions and on the magnetic interactions in the system, which can affect the form of the lines.
Since iron ions are deposited from the solution at room temperature, it would be reasonable to assume that iron ions can localize in the lattice sites and interstitials in the different surface planes. In what follows, we can call such states as ‘the surface states”. It can be seen from Figure 2A–C that, after depositing Fe ions, the EPR spectra of the samples contained two basic lines: rather a narrow line with the g-factor of ~4.3 and a broad line near the g-factor of 2. The wide signal near the g-factor of 2 may result from the presence of a great number of iron ions on the surface, which interact in such way that areas with the long-range order are formed. Near the g-factor of 2, there is also a line attributed to the iron ions at the sites with a high symmetry, such as, for example, the anatase lattice with the titanium ion position in the octahedral symmetry. However, this line should be much narrower and hardly visible both before and after the etching (see the insets in Figure 2A–C).
In the sequence of samples ST-01, ST-21, ST-41, the signal with the g-factor of 4.3 was observed to decrease, and it nearly disappeared for the sample ST-41-20. Small traces of this signal were observed after etching, while for the sample ST-21-20 and, specifically, for the sample ST-01-20, this signal was rather strong; and for the sample ST-01, its intensity was prevailing. It is customary to assign such signal to individual weakly interacting iron ions located in the sites of low symmetry. The decrease in the EPR signal normalized to the unit mass of a sample is naturally explained by the decreasing number of sites at which the iron ions can be located because of the reduction in the specific surface area of a sample in the sequence of samples ST-01, ST-21, ST-41. However, there was no exact correlation observed between the signal intensity and the specific surface, which appeared to be related to the different number of sites of iron sorption per unit area surface for the samples of these three types.
Annealing followed by etching in HCl was used to investigate the changes in the spectra of titanium dioxide samples containing iron ions on the surface, as the iron ions were transferred to the core of nanoparticles. The samples of ST-01 and ST-21 series were used, as they contained the greatest quantity of iron per unit mass. In the Supplement the EPR spectra of ST-01 samples (Figures S8–S12) and ST-21 samples (Figures S13–S17) after iron deposition and annealing at different temperatures are displayed as well.
Figure 3A–C display the EPR spectra of samples ST-01 immediately after iron was deposited on TiO2 nanoparticles (A), and of the samples annealed at different temperatures followed by etching (B, C).
To interpret the spectra, let us first consider the measurements of the samples’ magnetic properties. The magnetization curves at room temperature turned out to be linear functions, which is characteristic of paramagnetic or antiferromagnetic substances. The susceptibility values are given in the insets in Figure 3A,B. The susceptibility was reduced significantly by etching, which was caused by the removal of iron ions located predominantly on the surface of particles. It can be noted that the acid etching in HCl led to an incomplete removal of Fe3+ ions; a part of the ions was retained, with the amount of iron being virtually unchanged upon repeated etching in HCl. Etching in dithionite is much more effective, removing over 94% Fe, if the susceptibility is taken as a measure of the amount of Fe.
When non-interacting iron ions substitute for titanium ions (the paramagnetic centers), the EPR spectra should look like a narrow line with the g-factor = 2 [30,31]. With the octahedral symmetry of the nearest neighborhood distorted for any of several reasons, the line with the g-factor g = 4.3 should be observed (the field of 1560 G). As shown in Figure 3A (the inset), the contribution into the line (the g-factor = 2; the width on the order of (5–10) G) became relatively clear only after etching in dithionite (ST-01-20-E1-E2), when iron concentration became very low. It should be noted that a similar line can be generated by oxygen vacancies. After the iron ions were deposited, this kind of contribution due to vacancies was very small even after etching in HCl (ST-01-20-E1). The major contributions into the EPR spectrum were provided by a broad line, which is characteristic of magnetically ordered materials, and by a line in the vicinity of the g-factor = 4.3, which is also rather broad. The broadening of the EPR line near g = 4.3 and the formation of several-kG-wide EPR signal are evidence of an exchange interaction between the magnetic moments of iron ions. Since no ferromagnetic contribution was revealed in the magnetization curves, we have to assume that the iron ions interacted antiferromagnetically. Note that, with iron ions localized in the core of TiO2, there have also been signs of a negative exchange interaction reported in [32]. However, in our case of the states immediately after the deposition of iron ions and etching in HCl, the considerably broader EPR lines were observed in the spectra, which is characteristic of the materials with a long-range magnetic order rather than with small clusters, as was the case in the reference [30].
Several hypotheses can be put forward, which can provide an explanation for the formation of areas with a long-range magnetic order and a negative exchange interaction between iron ions on the surface. A plausible source of the broad lines could be antiferromagnetic oxide α-Fe2O3 (hematite) as a possible by-product of the reactions occurring while iron ions are deposited on the surface. However, for hematite (α-Fe2O3), there would have been lines in the Mössbauer spectra with high hyperfine fields. As shown below, such lines were not observed in the spectra, which indicates that the samples contained no hematite.
Another explanation suggests that there were clusters of iron ions formed on the surface. It can be assumed that, at a high concentration, the clusters can interact with each other, thus forming lengthy areas with the AFM order. At a high concentration of Fe3+ ions, to ensure the charge balance, oxygen vacancies, which are known to be electron donors, inevitably appear as Ti4+ ions are substituted by Fe3+ ions. Involvement of the electrons can facilitate the exchange interaction between the Fe3+ ions, even at considerable distances, due to of Ruderman–Kittel–Kasuya–Yosida (RKKY) interaction. At the high concentration of Fe3+ ions on the surface, the mechanisms cannot be overruled that underlie the direct super-exchange over one or two oxygen positions, with oxygen vacancies also being involved in the exchange [33]. Hypothetically, therefore, these mechanisms can result in the formation of the long-range magnetic order. Further etching removed a considerable amount of iron atoms, disrupting the long-range magnetic order. After etching in HCl (Figure 3A of ST-01-20-E1-red line), the EPR spectra of the samples showed the most intense line with the g-factor of 4.3. One can assume that this line was mainly attributed to Fe3+ ions localized in the tetrahedrally or rhombohedrally distorted sites on the surface [34,35,36]. A narrow line with the g-factor of 2, which was clearly observed after etching in dithionite (Figure 3A, green line), was likely to be attributed to the oxygen vacancies remained after etching or to the iron ions located at the titanium sites, which hardly interact, due to their low concentration.
With calcination at 200 °C, the form of the lines changed little before etching (Figure 3B); however, the effectiveness of etching is reduced considerably, judging by the comparatively small decrease in susceptibility (the inset in Figure 3B). As compared to the uncalcined sample after etching in HCl, not only did the iron ions with the g-factor of 4.3 survive but also the ions with the g-factor of 2 as well. Etching in dithionite removed practically all the ions with the g-factor of 4.3, saving a considerable number of ions with the g-factor of 2. Plausibly, the iron ions, diffusing into the core at 200 °C, occupied predominantly octahedral positions there.
As the calcination temperature increased up to 400 °C, the EPR spectrum of the sample after etching in dithionite (Figure 3C) became identical to the spectra of the TiO2-Fe samples synthesized from the solution of titanium and iron salts [32]. As suggested in this paper, the basic line of the EPR spectrum near the g-factor of 2 was composed of several contributions made by iron ions in the octahedral positions, which can be isolated or interact one with another.
The persistent minor signal with the g-factor of 4.3 appeared to be attributed to the iron ions with defects (for instance, vacancies) in the closest surrounding, as had been earlier reported in [31]. Hence, a conclusion can be made that the broadening of the lines with the g-factor of 2 after calcinations resulted from diffusion of iron ions into the core of the particles followed by the formation of non-interacting paramagnetic centers and areas (clusters) with a negative exchange interaction. A general conclusion to be drawn from the EPR analysis of the TiO2: Fe samples was that the choice of synthesis route allowed different distribution patterns of iron ions to be realized both on the surface and in the core of nanoparticles of various size.
It was important to assess the validity and reproducibility of the procedure of deposition of iron ions on TiO2. To perform this, a series of samples were prepared for each type of the initial TiO2 following a standard technique, and all the samples were analyzed by EPR spectroscopy. The EPR spectra obtained are provided in the Supplementary Materials, Figures S18–S20. No considerable differences were revealed between the samples within one group, which confirmed the validity of the technique. The Supplementary Materials also contain the investigation results obtained for the samples calcinated at different temperatures and after the acid etching and the treatment in sodium dithionite.

3.2. Results of Theoretical Study and Experimental Investigation of the Magnetic Properties of the Surface and the Cores of TiO2: Fe Nanoparticles and Discussion

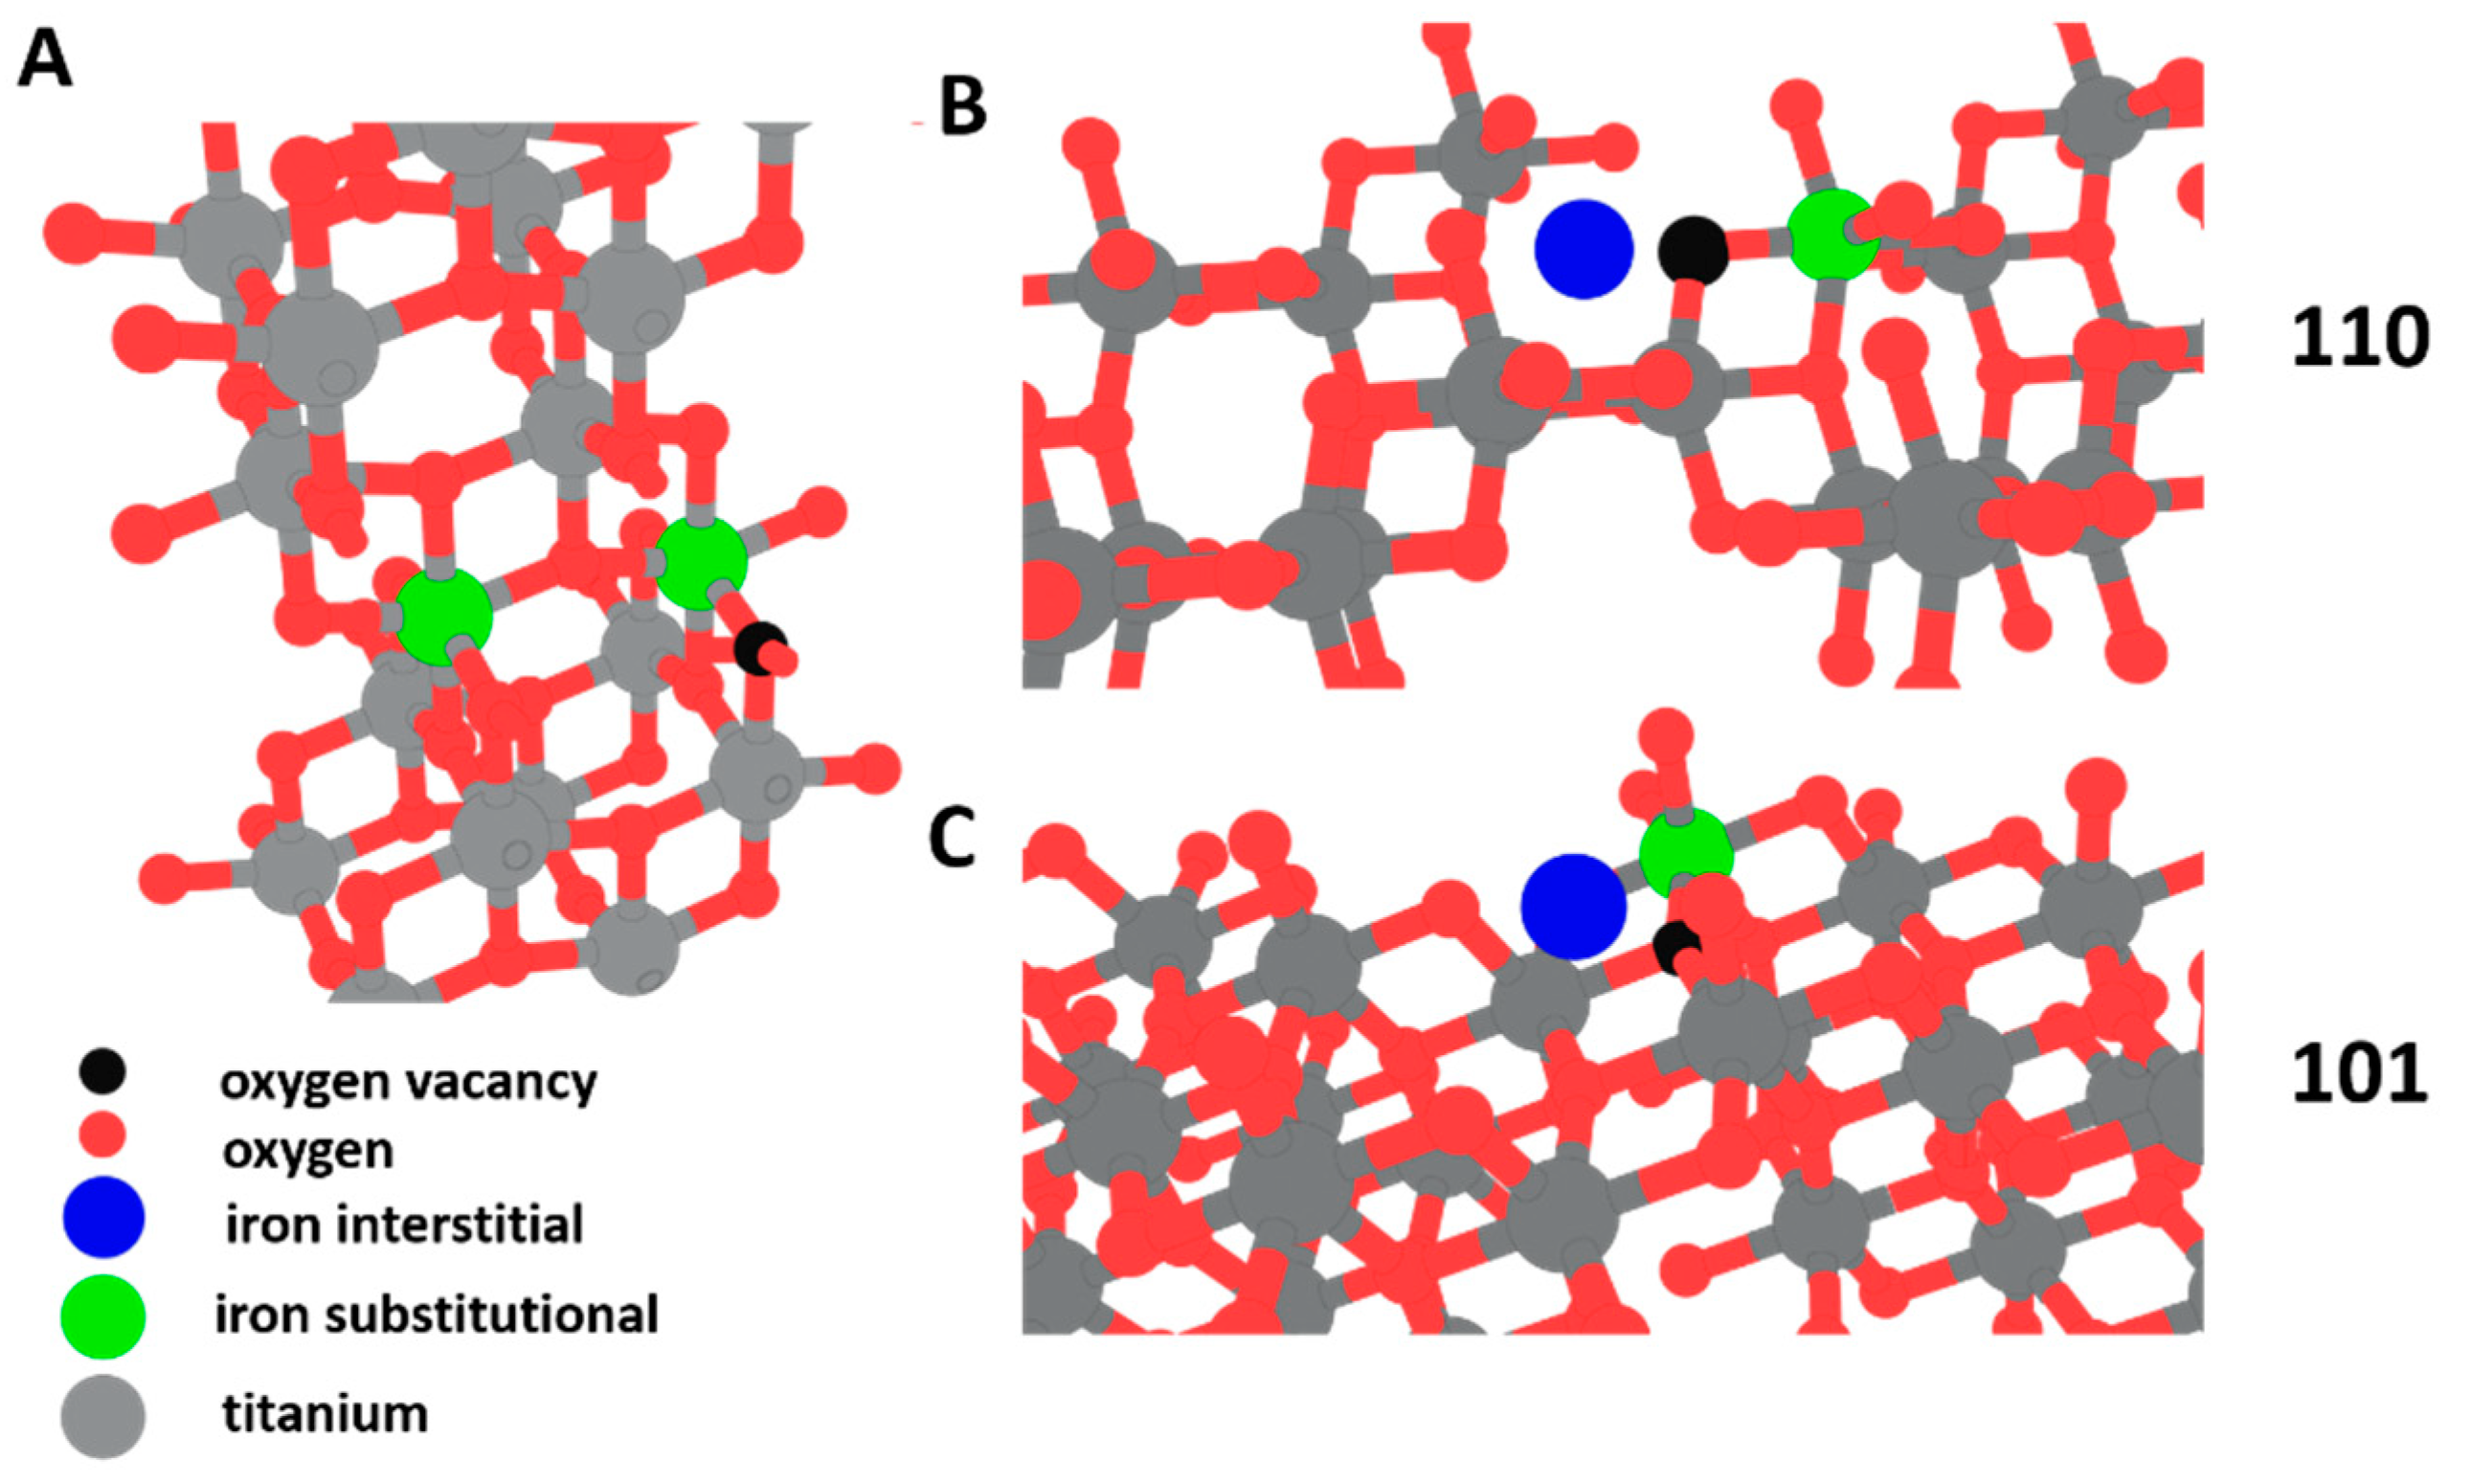
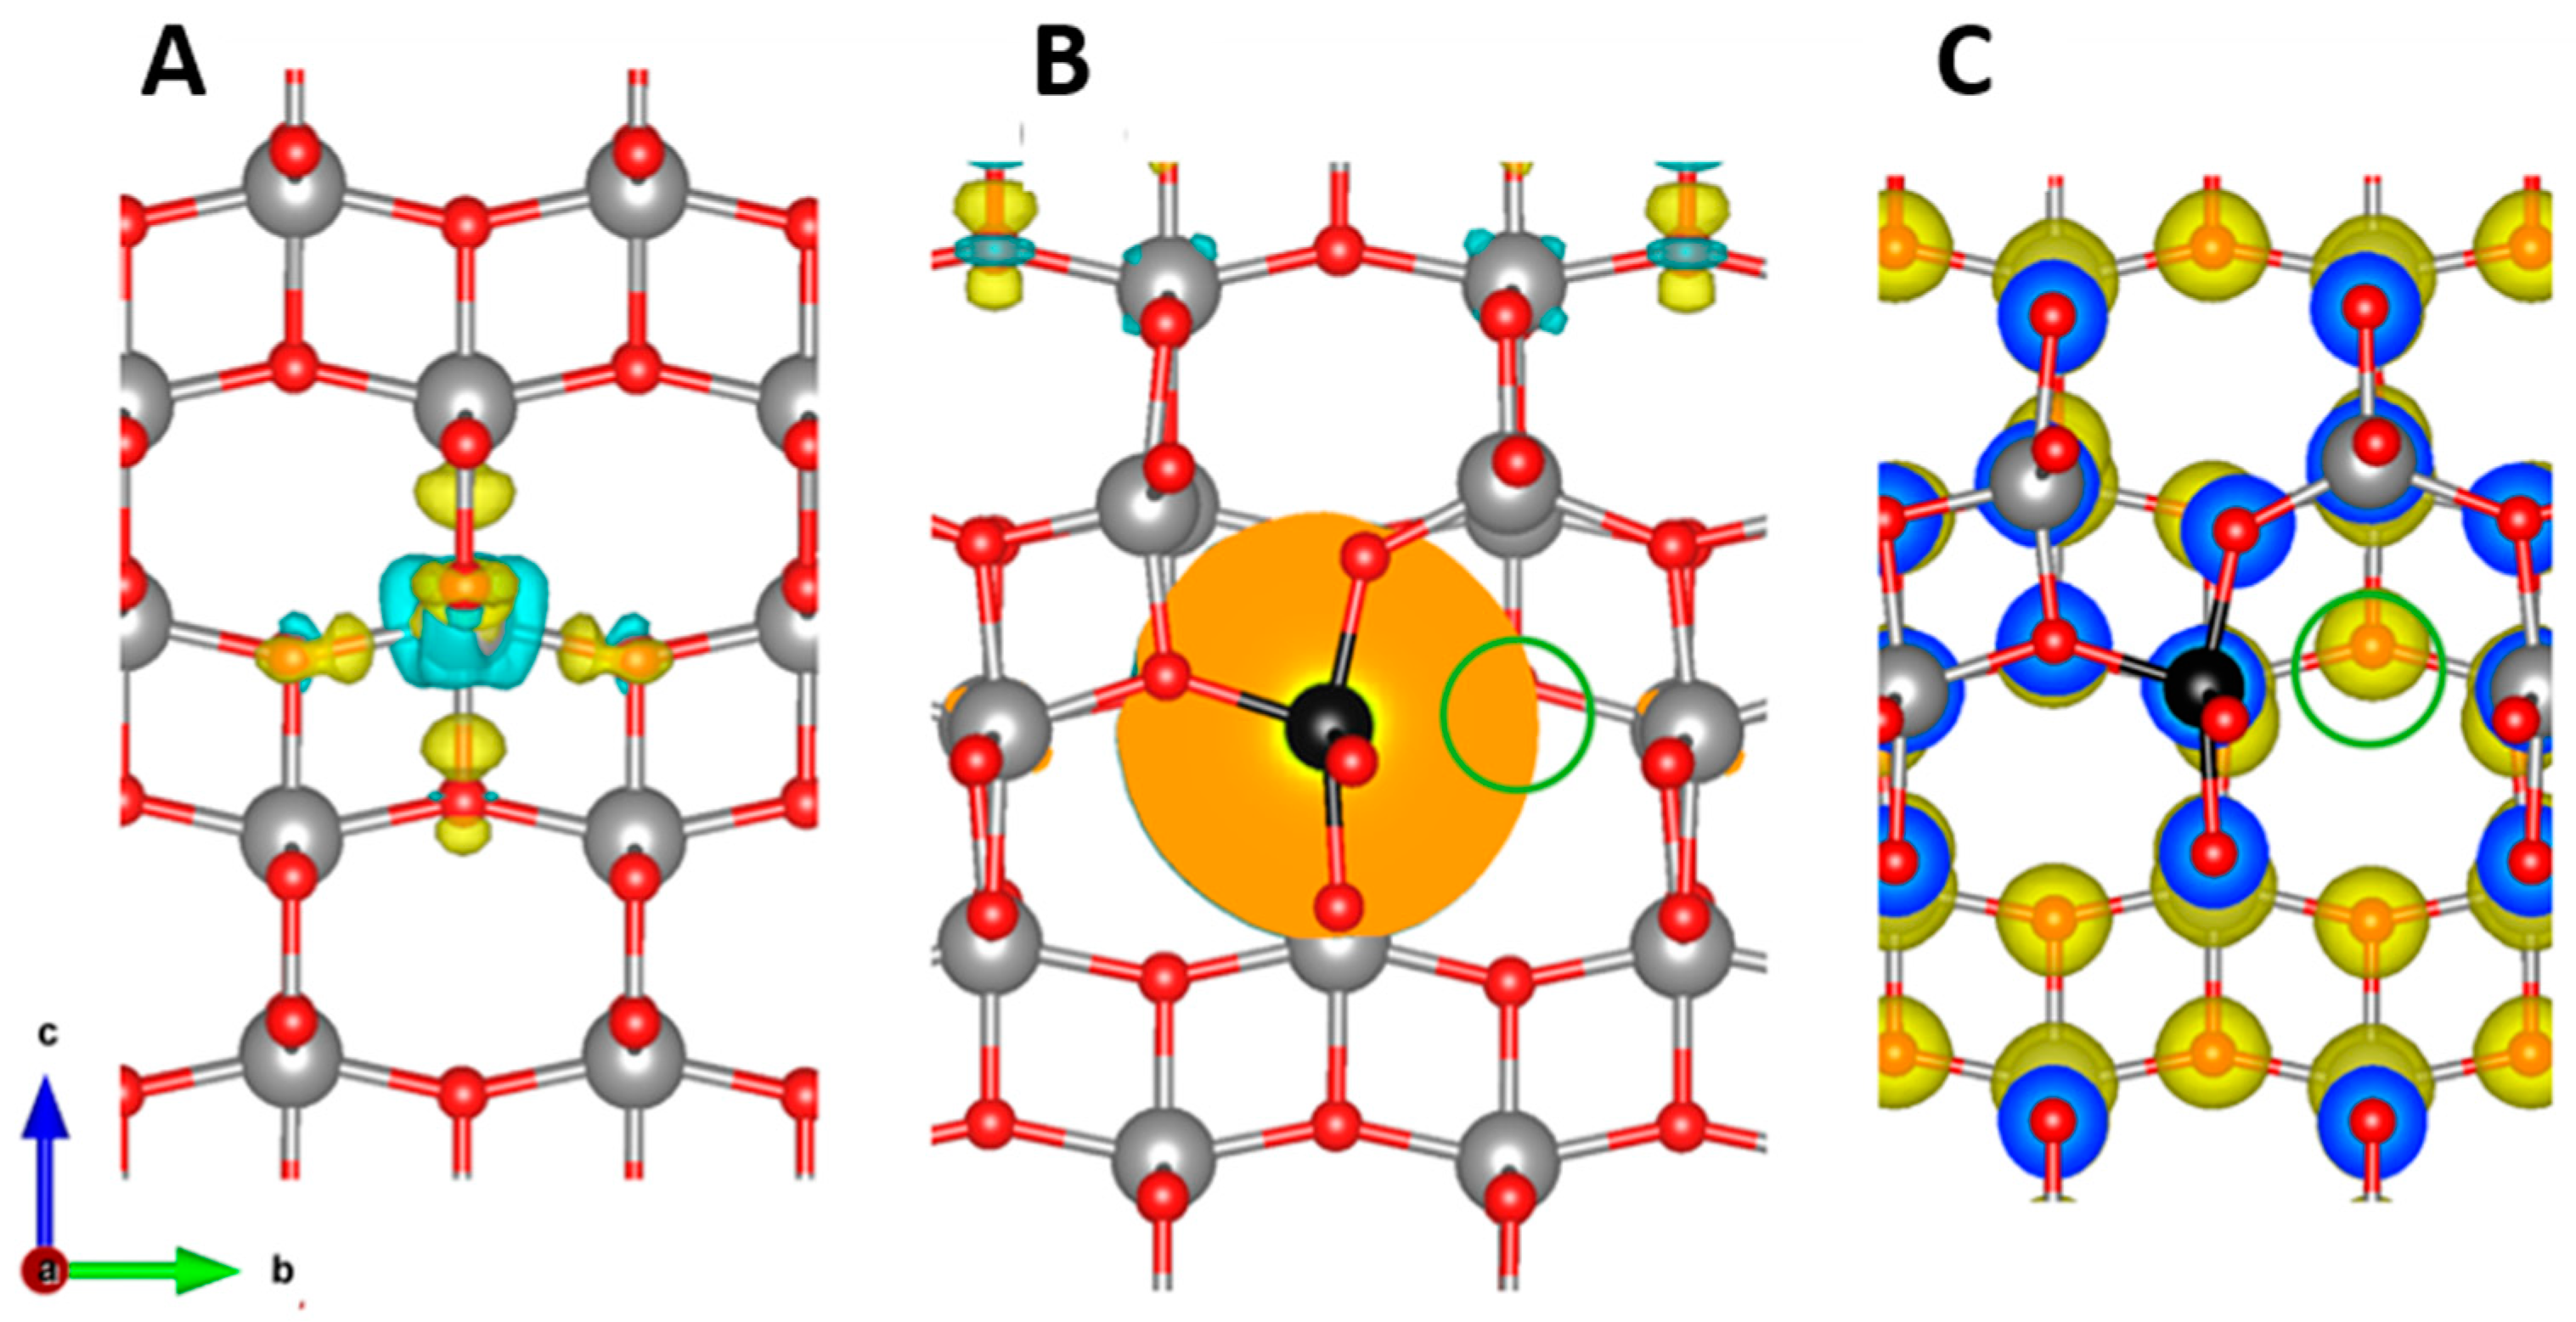
3.2.1. Theoretical Study of Magnetism of the Surface and the Core of TiO2-Based Nanocrystalline Systems Doped with Iron

The distribution, energetics, and magnetic properties of TiO2 doped with iron were studied through theoretical DFT calculations. For this purpose, a pseudopotential approach implemented in the SIESTA code was applied [37]. All calculations used the Perdew-Burke-Ernzerhof generalized gradient approximation (GGA-PBE) with spin-polarization [38]. Relevant codes were employed to optimize the atomic positions fully. In the optimization course, the ion cores were described by non-relativistic and norm-conserving pseudopotentials with cut-off titanium, iron, and oxygen radii as 2.10, 2.15 and 1.15 au, respectively [39]. Moreover, the wave functions were expanded with a double-ζ plus polarization basis of localized orbitals for all species (excluding hydrogen), while a double-ζ basis was applied for hydrogen. The k-point mesh within the Monkhorst-Pack scheme [40] is 4 × 4 × 3 for simulations of bulk and 4 × 4 × 2 for simulations of surfaces.
To assess the patterns of distribution of the iron ions in the studied systems, the simulation of various combinations of substitutional (FeTi) and interstitial (Fei) iron defects was carried out for the core and the most stable (110) and (101) surfaces of anatase TiO2 with and without oxygen vacancies (see Figure 4 and Figure S21 (Relaxed structures) in Supplement). The most energetically favorable configurations are shown in Table 2. In the case of core crystals, the formation of interstitial iron impurities was extremely unfavorable (the formation energy was above 3 eV/Fe).
On the contrary, the formation of substitutional defects is favorable near the oxygen vacancies. The oxygen vacancy formation leads to the reduction of two titanium ions from Ti4+ to Ti3+. Hence, substituting these Ti3+ ions with iron impurities is to form Fe3+ centers. Since Fe3+ is obviously more natural than Fe4+, this location of iron impurities is visible and more energetically favorable than in the areas without defects. Fe3+ ion has five electrons in 3d shell. This occupancy should correspond with the moment of five Bohr’s magnetons (S = 5/2). Contrary calculated magnetic moments of Fe3+ centers are visibly smaller (about 4.3 μB). The chemical bonds between metal and oxygen atoms in TiO2 must be discussed to understand these results. Each Ti ion has four covalent bonds with oxygen atoms and two coordination bonds. These two types of bonds correspond to shorter and longer Ti-O distances. The formation of coordination bonds leads to filling the unoccupied metal center orbitals with the already occupied ligand orbitals. That is why another name for this type of bond is dative.
To visualize the distinction between two types of bonds, the changes in charge density redistribution were calculated and are shown in Figure 5A. The incorporation of substitutional iron impurities led to the charge redistribution even on distant bonds (see Figure 5B). In the case of the coordination of Fe3+ ion, the formation of the dative bonds was possible only with unoccupied orbitals of one spin orientation, which provided a reduction in the magnetic moment on iron and slight (below 0.2 μB) polarization of surrounding oxygen atoms (see Figure 5C).
The next step of our simulations was modeling the incorporation of iron impurities in the surface and subsurface layers. Our simulations demonstrated that incorporating iron impurities in the surface layer was about 0.5 eV/Fe more energetically favorable than in the subsurface layer for all defects and surfaces considered. Contrary to the core for both discussed surfaces, the most energetically favorable defects were single interstitial impurities (see Table 2). The incorporation of iron impurity into the void in the surface usually correlated with the formation of two covalent bonds between Fei and the nearest oxygen atoms that turn iron into 3d6 configuration. The calculations demonstrated that for interstitial iron impurities in all the discussed surfaces, the enthalpy values were negative. Hence, these iron centers should be passivated at ambient conditions by forming additional covalent bonds with some species, such as oxygen or hydroxyl groups. This passivation turned interstitial Fe2+ to Fe3+ with five electrons in 3d shell. The passivation of nanopowders TiO2: Fe was confirmed by FTIR investigation. The hydroxyl groups (Fe-OH) were revealed (see Figure S5 in Supplementary Files).
The formation of the covalent bonds between interstitial iron impurities and surrounding oxygen atoms also provided a reduction in the nearest titanium atoms on the surface. The substitution of these Ti3+ centers by iron impurities was also an energetically favorable process (see Table 2). For all the considered surfaces, this process led to the appearance of one more Fe3+ center in the TiO2 matrix. Similarly, to the core incorporation of the iron impurities in the surface, note that it did not provide significant changes in interatomic distances (see Table 2).
The last step of our simulations is the check of the magnetic interactions between two iron ions. For this purpose, we calculated the difference between the total energies of the same systems with antiparallel and parallel orientations of the spins. The magnetic interactions between two iron spins in the core were relatively strong (−1073 K). All pairs of iron ions in the surface antiferromagnetic configurations were also favorable. However, the values of the magnetic interactions were smaller than for the core.

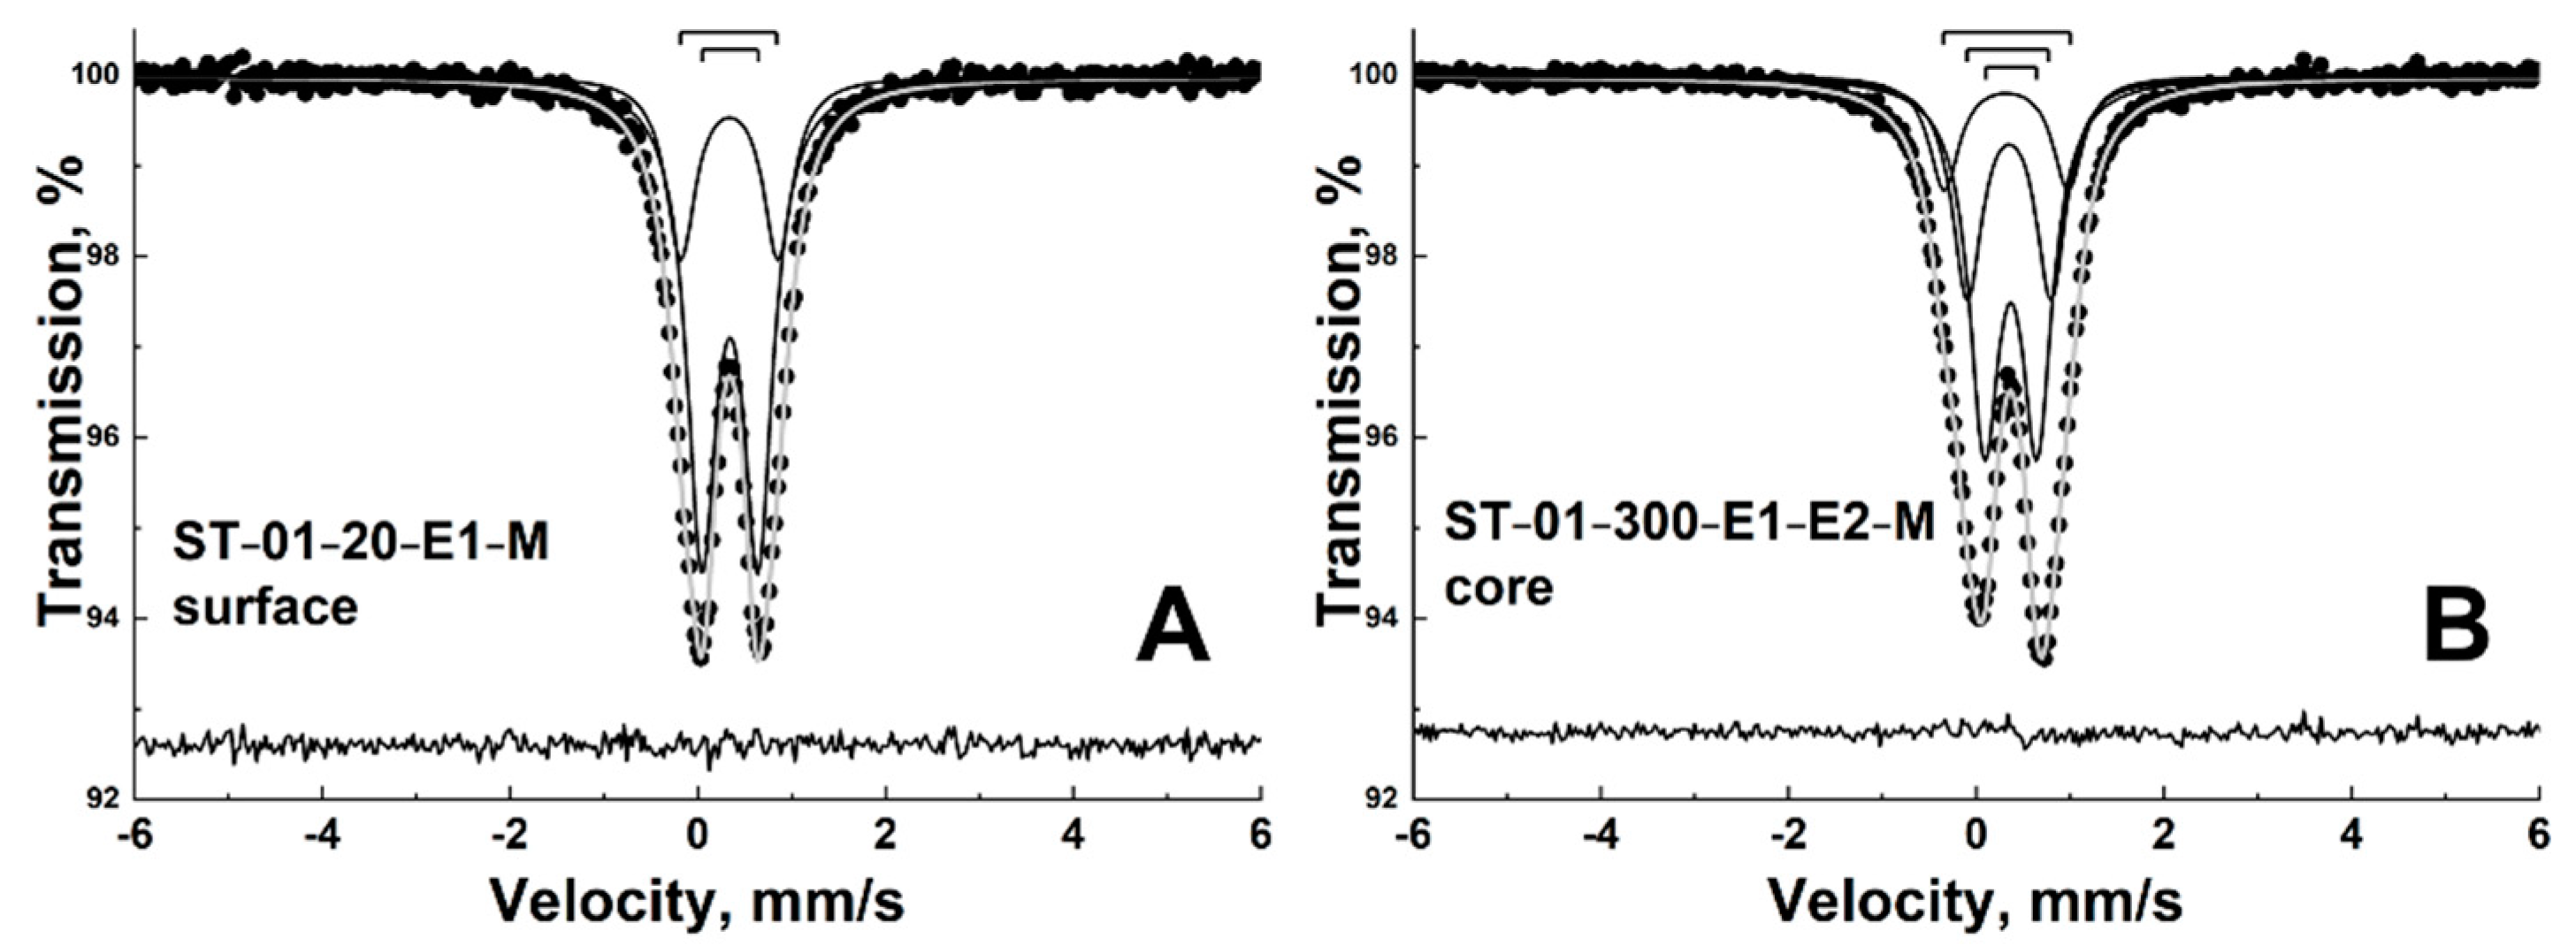
3.2.2. Mössbauer Spectroscopy of Nanocrystalline TiO2 Samples with Localization of Fe Ions on the Surface and in the Core

The 57Fe isotope (see the procedure in Experimental section) was used on ST-01 sample and the samples were subjected to acid and thermal treatments to create the different localizations of iron on the surface and in the core (see Table 3).
Figure 6 displays the 57Fe Mössbauer spectra of ST-01-20-E1-M and ST-01-300-E1-E2-M samples measured at room temperature and fitted by the superposition of partial contributions.
The Mössbauer spectra of both samples were broadened asymmetric doublets. The spectra did not show Zeeman splitting; which means that, at room temperature, 57Fe probe atoms did not experience magnetic ordering (at least, its relaxation time was less than 10−8 s). The broadening and asymmetry of the spectra indicates that the experimental spectra are a superposition of partial contributions differing in hyperfine parameters. These contributions can be ascribed to iron atoms that are in local surroundings of various compositions and geometries (reported in Table 2).
As mentioned above, the Mössbauer spectra were processed by superposition of subspectra. Figure 6 shows that the ST-01-20-E1-M spectrum was quite smooth and did not have any shape features and, so, the fitting of such a spectrum with many subspectra was associated with significant difficulties in finding the result (variable parameters began to correlate with each other, which gave an infinite number of solutions to the fitting problem). The spectrum of ST-01-20-E1-M was satisfactorily described by two quadrupole doublets with the equal linewidth (Γ = 0.381 ± 0.004 mm/s). It turned out experimentally that it was not possible to reveal a larger number of contributions on the surface related to Fe atoms in different environments and planes as followed from the theoretical analysis (see Table 2) because these contributions most likely had close hyperfine parameters.
In the process of the model description of the spectrum of the sample ST-01-300-E1-E2-M with the core localization of iron, it was found that it was not enough to use two sub-spectra. A satisfactory description was achieved by using at least three doublets with the equal linewidth (Γ = 0.391 ± 0.003 mm/s). The hyperfine parameters and intensities of partial contributions obtained by processing the Mössbauer spectra of samples ST-01-20-E1-M and ST-01-300-E1-E2-M are given in Table 4.
Based on the isomer shifts of the subspectra, it can be concluded that all iron atoms, both on the surface and in the core of TiO2 nanoparticles in ST-01-20-E1-M and ST-01-300-E1-E2-M samples, had the Fe3+ electron configuration. This is consistent with the theoretical analysis data (Table 2). It should be noted that the spectra of both samples contained contributions with significantly different quadrupole splittings. This probably demonstrates that the Fe atoms in each of the samples were in different spin state and/or in different local surroundings.

3.3. Magnetic Properties of ST-01, ST-21 Nanopowders Doped with Iron

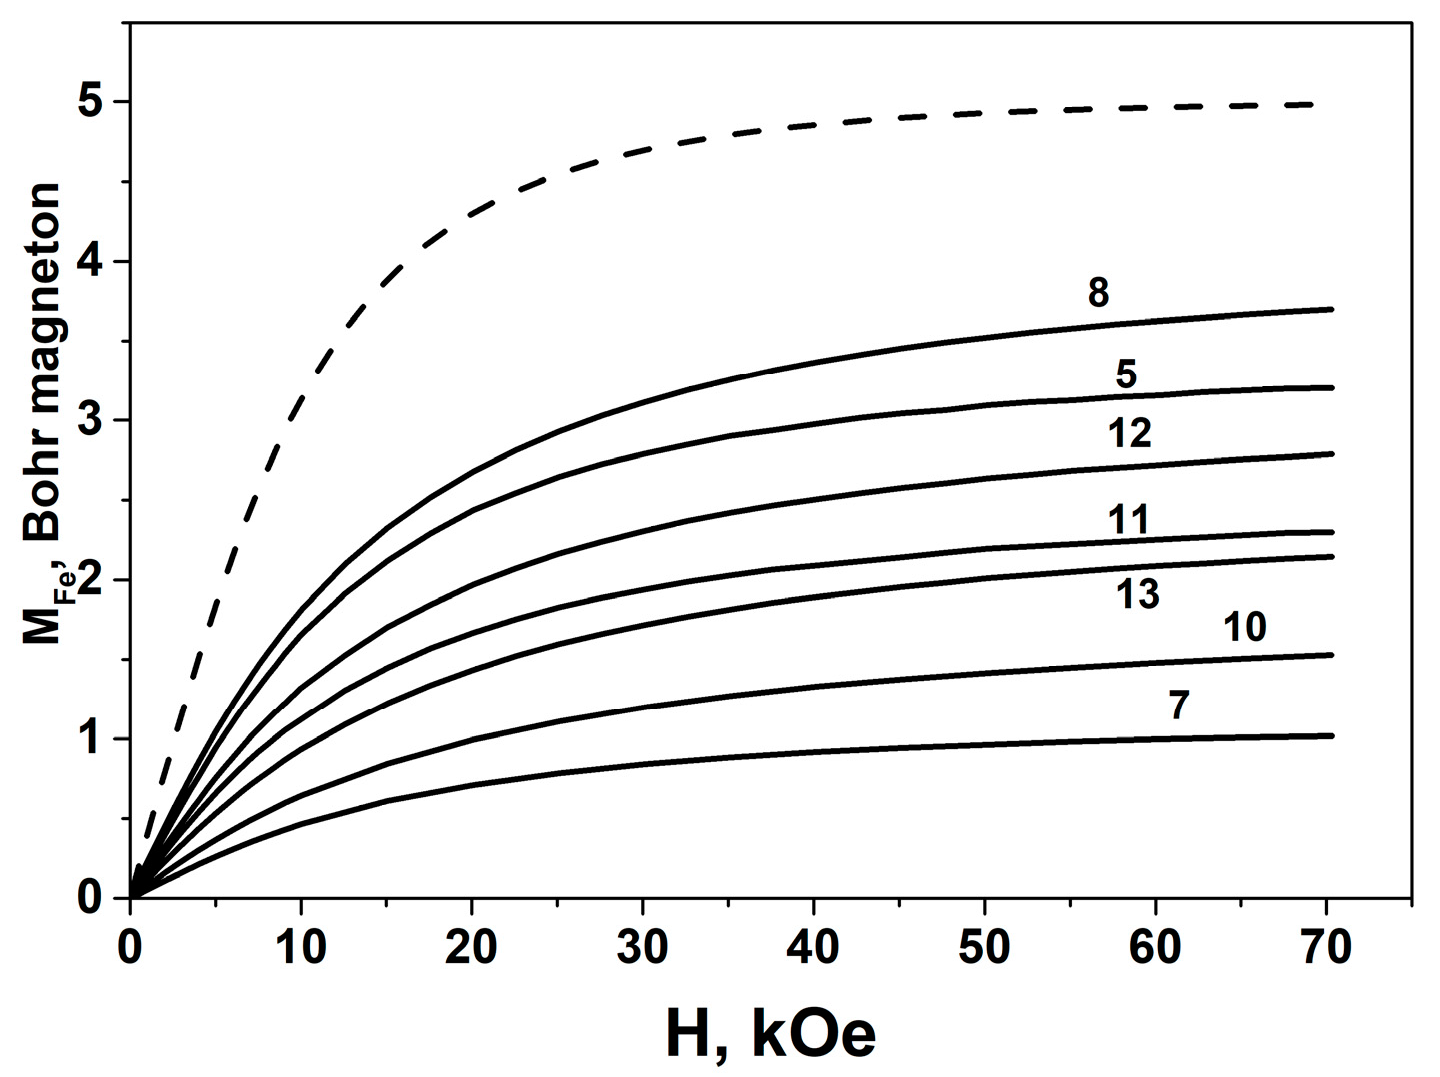
3.3.1. Analysis of Magnetization Curves for Samples ST-01, ST-21 Doped Iron

Figure 7 displays the magnetization curves for some samples from Table 1 of the series ST-01 and ST-21 at T = 2 K. All the curves are seen to be plotted lower than the calculated curve of the Brillouin function for non-interacting paramagnetic ions of Fe3+. As mentioned earlier, we related this fact to the negative exchange interaction between Fe ions. We tried to determine whether the value of this interaction changes with Fe concentration. It seemed obvious at first sight that the higher the concentration, the stronger the effect of such interaction. With core doping, the dependence of the magnetic moment at the maximum field (70 kOe) on iron concentration can be used. This is, of course, a simplification in a way, because magnetization does not reach saturation even in this maximum field. From the mass concentration of iron, a distance between iron ions can be calculated, assuming that the iron ions are distributed uniformly. For the iron contents used, the distances range from 1 to 2 nm (Figure 8A). Considering these long distances between the iron ions, we must admit that the model of uniform distribution of iron ions at such concentrations contradicts not only the EPR spectra but also the magnetic data available, since it excludes the exchange interaction between the ions.
As seen from Figure 8A, with increasing Fe concentration, the average magnetic moment decreased monotonously. Strictly speaking, with a random distribution of Fe ions, the magnetic moment should not have decreased at such distances. This decrease may be evidence of an already increased occurrence of clustering, i.e., the sufficiently closely located iron ions in the TiO2 matrix and the exchange interaction of antiferromagnetic nature between them.
It would be incorrect to use the total content of iron directly in the case of surface doping because iron ions were distributed on the surface only rather than over the whole core. However, if one sets a certain thickness of the surface layer, for example, close to the interatomic distance of 0.3 nm, then one can introduce the term “effective mass concentration” in this surface layer, taking into account the surface area of the particles. Increasing the thickness of surface layer, say, by a factor of two or three, would not change the result qualitatively, i.e., the tendency for the magnetic moment to decrease with growing iron content remains. Figure 8B displays the data from Table 1 confirming this, and, for these samples, it is on the surface that iron ions are deposited. It should be pointed out once again that, in this case, the “effective” concentration was rather conditional and was inversely proportional to the given thickness of the layer. It is important that changing the scale along the concentration axis would not affect the general tendency: as the concentration increased, the average magnetic moment continued to decrease. The deviation from this behavior of the magnetic moment observed for sample No.9 (ST-01-100-E1) was, probably, a result of the redistribution of iron ions upon annealing. Although all such ions remained on the surface, they may be etched out by dithionite and either move to the second layer (which can also be reachable for dithionite etching) or distributed more uniformly over the first layer, thus decreasing the likelihood of interaction. For the samples No.8 and No.11 of ST-21 series, a considerable deviation should be noted in the value of the magnetic moment as compared to the behavior observed for the samples of ST-01 series. The catalytic properties of TiO2 ST-01 and TiO2 ST-21 are known to differ rather strongly [20]. Possibly, this is caused by differences in the surface structure, which can also influence the disposition (the clustering rate or non-homogeneous distribution) of Fe ions on the surface.
Hence, with iron ions localized both on the surface and in the core of nanoparticles, the magnetization reduction was greater when the iron concentration was higher. The magnetization values in the field of 70 kOe at 2 K for high and low Fe concentrations differed more than by a factor of three.

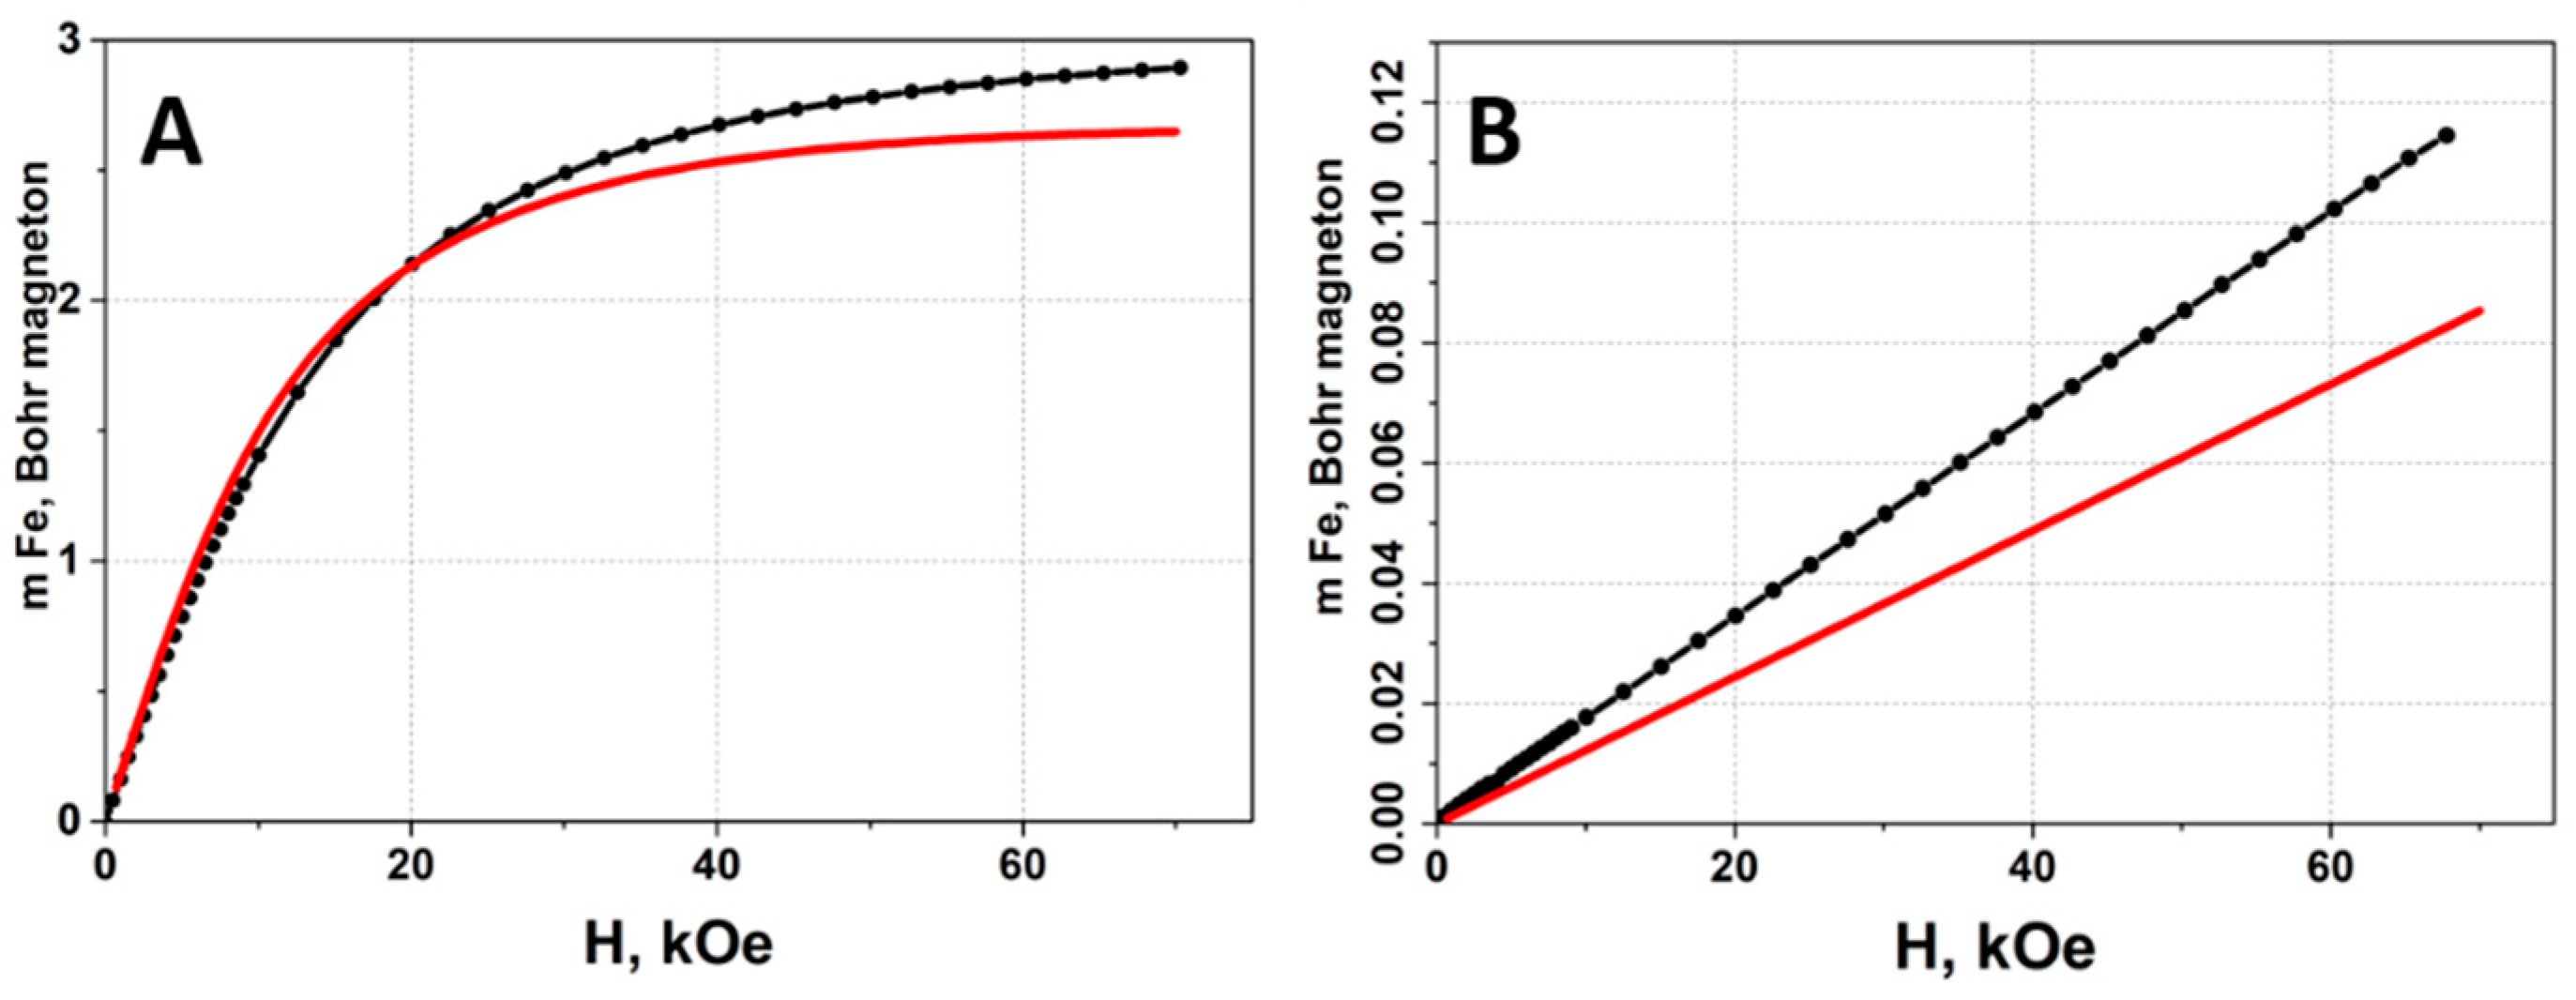
3.3.2. Estimation of the Effect of the Low-Spin State of Fe3+ on the Magnetization of TiO2 Samples

Let us consider another possibility of the magnetization reduction in the iron-doped TiO2 nanoparticles. First, as follows from the DFT calculation, the magnetic moments of iron ions located on the different surfaces of TiO2 nanoparticles (Table 2) were lower than the threshold value of 5 µB for a free Fe3+ ion, and the decrease can reach nearly 30%. However, a considerably greater difference in the magnetization value was experimentally observed for the surface states. Thus, for the sample ST-01-20-E1-4 (Table 1), the magnetization was approximately one µB instead of the theoretically predicted (3.6–4) µB (Table 2).
Hypothetically, the magnetization reduction in the specified systems can originate from the low-spin state of iron ions. To estimate the possibilities of such states to occur, an effort was made to describe the magnetization curves by the sum of two Brillouin functions, with the spin S = 1/2 and the spin S = 5/2. The ratio of these two contributions was fitted to achieve the best correspondence of their sum to the experimental curves M(H) obtained at 2 K. As an example, Figure 9A displays the magnetization curves of the sample ST-01-20-E1 (see description in Table 1, sample 4).
It can be seen from Figure 9A,B that for the specified mix of spins, even with a relatively large fraction of the low-spin states, the sum of two Brillouin functions had a slope too low in the high magnetic fields, which contradicted the experiment. At room temperature (Figure 8B), this discrepancy was even greater. Additionally, as seen from Figure 8B, with the surface doping with iron ions, the value of magnetic moment may vary within a considerably wider range from 3 µB down to 1 µB, which is rather indicative of another mechanism of magnetization reduction.
Therefore, the most realistic reason for the magnetization reduction was the dimerization mentioned earlier or the clustering of iron ions in the lattice of TiO2 with prevailing negative interactions between iron ions, regardless of whether doping was on the surface or in the core of nanoparticles [30].

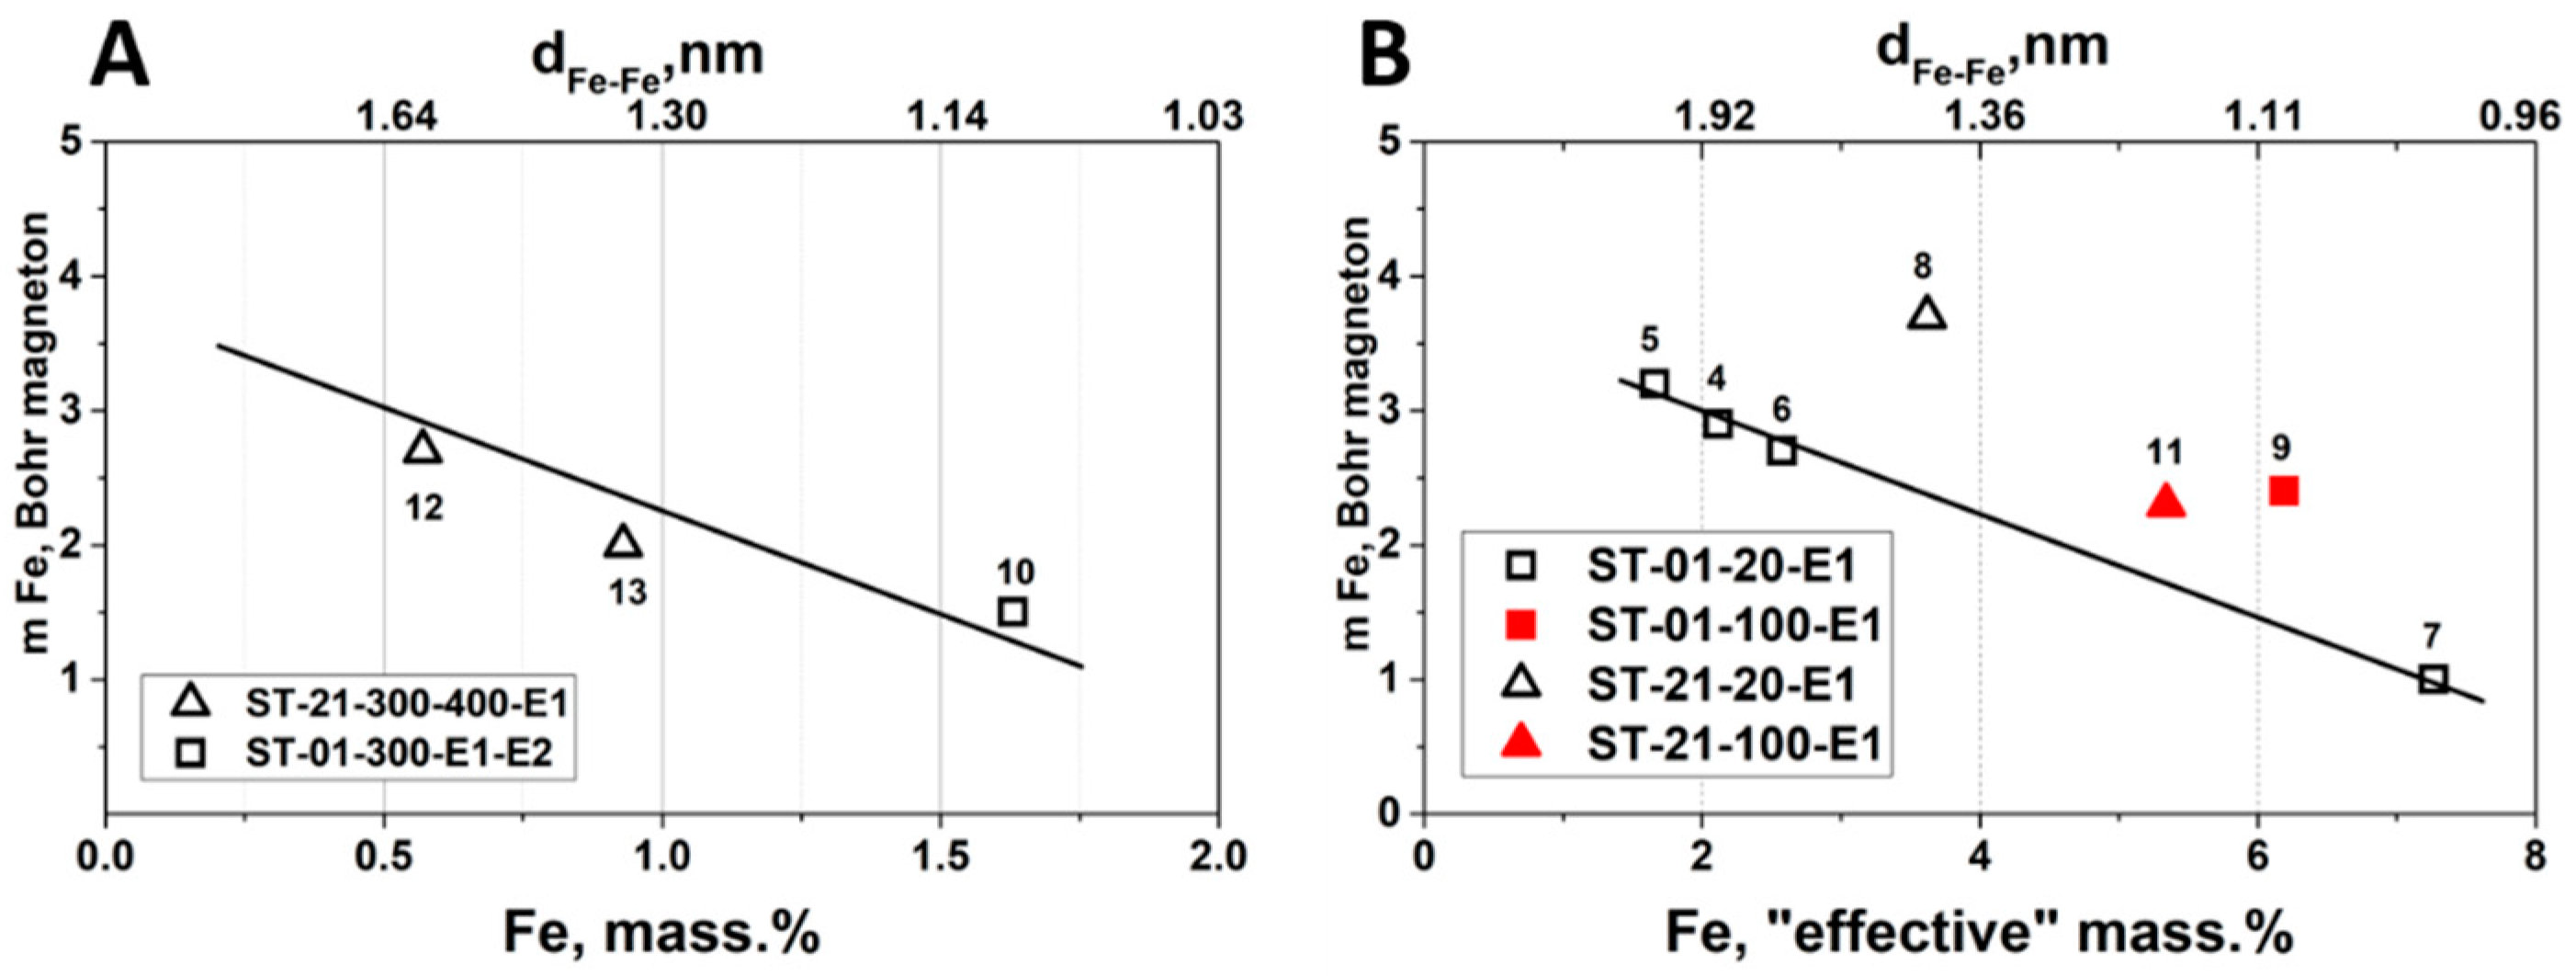
3.3.3. Analysis of Effective Magnetic Moments

For a non-interacting Fe3+ ion with the spin S = 5/2, the calculated value of effective magnetic moment μeff = 2 (S(S + 1))1/2 equaled 5.9 µB. In experiment, the effective magnetic moment was determined from the Curie or Curie–Weiss constant, which was calculated from the temperature dependence of the inverse susceptibility.
Figure 10A,B displays the temperature dependences of the inverse susceptibility—1/χ(T)—for the samples with the surface (A) and core (B) doping. The Curie constant C and the effective magnetic moment are determined from the slope of 1/χ(T); the intercept on the abscissas axis determines the Weiss constant (θ) for the case of interacting carriers of magnetic moment. The Weiss constant θ amounts to −5 K and −15 K for the samples ST-01-20-E1 and ST-01-300-E1-E2, respectively, which indicates the presence of negative exchange interactions in the system. Note that the value of θ is determined with a rather great error, a few degrees K at least, so we would not speculate about the difference in these values for the specified samples.
The effective magnetic moment equals 4.6 µB (for ST-01-20-E1) and 4.2 (for ST-01-300-E1-E2), with an insignificant difference between the values, however, being noticeably lower than the calculated magnetic moment value of 5.9 µB. Such a decrease agrees quite well with the decreasing of the magnetic moment in high fields at low temperatures, as discussed above.

4. Conclusions

To sum up all the results obtained in this study, the following conclusions can be made. The magnetic properties of the TiO2 samples with different localization of iron ions depend, mostly, on the iron concentration. The higher the content of iron, the higher the probability that clusters or dimers with the negative exchange interaction are formed both on the surface and in the core of nanoparticles.
The analysis of the effective magnetic moment determined using the Curie–Weiss law showed that all the studied systems were characterized by the high-spin state of iron ions 3+ with the negative exchange interaction. The value of the effective magnetic moment depended on the concentration of iron in TiO2 regardless of the iron localization.
The analysis of the EPR spectra showed that, depending on the localization of iron atoms (on the surface or in the core of nanoparticles), a spectral contribution with the g~4.3 or g~2 predominated, respectively. The complicated shape of the lines was due to the coexistence of paramagnetic Fe ions and clusters consisting of interacting Fe ions.
The Mössbauer spectra of samples doped with Fe atoms both on the surface and in the core can be described quite satisfactorily by two and three doublets, respectively. Yet, in both cases, the spectra contained contributions with significantly different quadrupole splittings. This probably demonstrates that the Fe atoms in each of the samples were in different spin states and/or in unlike local surroundings.

Supplementary Materials

The following supporting information can be downloaded at: https://www.mdpi.com/article/10.3390/magnetochemistry9080198/s1. Figure S1. XRD of different initial TiO2 samples taken in CrKα radiation. A—ST-01, B—ST-21, C—ST-41. Figure S2. XRD of different TiO2 samples taken in CuKα radiation. A—ST-01, B—ST-01 after deposition of iron ions and treatment with HCl, C—ST-01 after deposition of iron ions, annealing at 300 °C in air, treatment with hydrochloric acid and sodium dithionite. Figure S3. Brightfield (grayscale) and overlapped darkfield (yellow) images of ST-01 nanoparticles. Figure S4. Brightfield (grayscale) image of ST-21 nanoparticles. Figure S5. FTIR of titanium dioxide samples. Figure S6. FTIR of titanium dioxide samples with iron ions deposited on the surface. Figure S7. FTIR of titanium dioxide samples with iron ions deposited on the surface after HCl treatment. Figure S8. EPR spectra of iron ion deposited samples prepared from TiO2 ST-01. The inset shows the magnetic susceptibility of the sample. Figure S9. EPR spectra of samples prepared from ST-01 at different stages of the process, vacuum annealed at 100 °C. The inset shows the magnetic susceptibility of the sample. Figure S10. EPR spectra of samples prepared from ST-01 at different stages of the process, vacuum annealed at 200 °C. The inset shows the magnetic susceptibility of the sample. Figure S11. EPR spectra of samples prepared from ST-01 at different stages of the process, vacuum annealed at 300 °C. The inset shows the magnetic susceptibility of the sample. Figure S12. EPR spectra of samples prepared from ST-01 at different stages of the process, vacuum annealed at 400 °C. The inset shows the magnetic susceptibility of the sample. Figure S13. EPR spectra of samples prepared from ST-21 at different stages of the process, vacuum dried at room temperature. The inset shows the magnetic susceptibility of the sample. Figure S14. EPR spectra of samples prepared from ST-21 at different stages of the process, vacuum dried at 100 °C. The inset shows the magnetic susceptibility of the sample. Figure S15. EPR spectra of samples prepared from ST-21 at different stages of the process, vacuum dried at 200 °C. The inset shows the magnetic susceptibility of the sample. Figure S16. EPR spectra of samples prepared from ST-21 at different stages of the process, vacuum dried at 300 °C. The inset shows the magnetic susceptibility of the sample. Figure S17. EPR spectra of samples prepared from ST-21 at different stages of the process, vacuum dried at 400 °C. The inset shows the magnetic susceptibility of the sample. Figure S18. EPR spectra of iron ion deposited TiO2 ST-01 samples. Figure S19. EPR spectra of iron ion deposited samples TiO2 ST-21. Figure S20. EPR spectra of iron ion deposited samples TiO2 ST-41. Figure S21. Relaxed structures of TiO2 used for DFT calculation.

Author Contributions

Conceptualization, A.Y.Y.; methodology, A.S.M., S.F.K. and N.A.C.; investigation, M.A.U., D.W.B., A.S.V., A.S.M., S.P.N., N.M.K., D.V.S., K.I.B. and V.S.G.; original draft preparation, A.Y.Y.; writing—review and editing, M.A.U. and A.Y.Y. All authors have read and agreed to the published version of the manuscript.

Funding

The research was carried out within the state assignment of Ministry of Science and Higher Education of the Russian Federation (theme “Magnet” No. 122021000034-9) and theme “Spin” No. 122021000036-3).

Institutional Review Board Statement

Not applicable.

Informed Consent Statement

Not applicable.

Data Availability Statement

Data will be made available on request.

Acknowledgments

Transmission electron microscopy and Mossbauer investigations were performed in the Collaborative Access Center of the M.N. Mikheev Institute of Metal Physics of the Ural Branch of the Russian Academy of Sciences. The authors are also grateful to K. Ishihara (Tokyo University) for providing TiO2 samples (ST-01, ST-21, ST-41) and Belskaya N.P. (Ural Federal University) for providing us with sodium dithionite.

Conflicts of Interest

The authors declare no conflict of interest.

References

  1. Groß, A. Theoretical Surface Science: A Microscopic Perspective. In Theoretical Surface Science: A Microscopic Perspective; Springer: Berlin/Heidelberg, Germany, 2009; pp. 165–184. ISBN 978-3-540-68966-9. [Google Scholar]
  2. Mohamed, A.E.-M.A.; Mohamed, M.A. Nanoparticles: Magnetism and Applications. In Magnetic Nanostructures; Abd-Elsalam, K.A., Mohamed, M.A., Prasad, R., Eds.; Nanotechnology in the Life Sciences; Springer International Publishing: Cham, Switzerland, 2019; pp. 1–12. ISBN 978-3-030-16438-6. [Google Scholar]
  3. Pryazhnikov, D.V.; Kubrakova, I.V. Surface-Modified Magnetic Nanoscale Materials: Preparation and Study of Their Structure, Composition, and Properties. J. Anal. Chem. 2021, 76, 685–706. [Google Scholar] [CrossRef]
  4. Li, N.; Zhang, W.; Wang, D.; Li, G.; Zhao, Y. Synthesis and Applications of TiO2-based Nanostructures as Photocatalytic Materials. Chem. Asian J. 2022, 17, e202200822. [Google Scholar] [CrossRef] [PubMed]
  5. Fàbrega, C.; Andreu, T.; Cabot, A.; Morante, J.R. Location and Catalytic Role of Iron Species in TiO2:Fe Photocatalysts: An EPR Study. J. Photochem. Photobiol. A Chem. 2010, 211, 170–175. [Google Scholar] [CrossRef]
  6. Areerachakul, N.; Sakulkhaemaruethai, S.; Johir, M.A.H.; Kandasamy, J.; Vigneswaran, S. Photocatalytic Degradation of Organic Pollutants from Wastewater Using Aluminium Doped Titanium Dioxide. J. Water Process Eng. 2019, 27, 177–184. [Google Scholar] [CrossRef]
  7. Chernyshev, A.P. Mechanism of the Order-Disorder Transition in Ultra-Small Metal Nanoparticles. Phys. E Low-Dimens. Syst. Nanostructures 2018, 104, 111–115. [Google Scholar] [CrossRef]
  8. Howard-Fabretto, L.; Andersson, G.G. Metal Clusters on Semiconductor Surfaces and Application in Catalysis with a Focus on Au and Ru. Adv. Mater. 2020, 32, 1904122. [Google Scholar] [CrossRef] [PubMed]
  9. Doud, E.A.; Voevodin, A.; Hochuli, T.J.; Champsaur, A.M.; Nuckolls, C.; Roy, X. Superatoms in Materials Science. Nat. Rev. Mater. 2020, 5, 371–387. [Google Scholar] [CrossRef]
  10. Banach, E.; Bürgi, T. Metal Nanoclusters as Versatile Building Blocks for Hierarchical Structures. Helv. Chim. Acta 2022, 105, e202100186. [Google Scholar] [CrossRef]
  11. Mason, J.L.; Folluo, C.N.; Jarrold, C.C. More than Little Fragments of Matter: Electronic and Molecular Structures of Clusters. J. Chem. Phys. 2021, 154, 200901. [Google Scholar] [CrossRef]
  12. Wang, H.; Lu, J. A Review on Particle Size Effect in Metal-Catalyzed Heterogeneous Reactions. Chin. J. Chem. 2020, 38, 1422–1444. [Google Scholar] [CrossRef]
  13. Baletto, F. Structural Properties of Sub-Nanometer Metallic Clusters. J. Phys. Condens. Matter 2019, 31, 113001. [Google Scholar] [CrossRef] [PubMed]
  14. Reimann, S.M.; Koskinen, M.; Häkkinen, H.; Lindelof, P.E.; Manninen, M. Magic Triangular and Tetrahedral Clusters. Phys. Rev. B 1997, 56, 12147–12150. [Google Scholar] [CrossRef] [Green Version]
  15. Illy, S.; Tillement, O.; Machizaud, F.; Dubois, J.M.; Massicot, F.; Fort, Y.; Ghanbaja, J. First Direct Evidence of Size-Dependent Structural Transition in Nanosized Nickel Particles. Philos. Mag. A 1999, 79, 1021–1031. [Google Scholar] [CrossRef]
  16. Jones, R.O. Cluster Geometries from Density Functional Calculations—Prospects and Limitations. In The European Physical Journal D; Châtelain, A., Bonard, J.-M., Eds.; Springer: Berlin/Heidelberg, Germany, 1999; pp. 81–84. ISBN 978-3-642-88190-9. [Google Scholar]
  17. Yasuda, H.; Mori, H. Effect of Cluster Size on the Chemical Ordering in Nanometer-Sized Au-75at%Cu Alloy Clusters. Z. Für Phys. D At. Mol. Clust. 1996, 37, 181–186. [Google Scholar] [CrossRef]
  18. Doye, J.P.K. Physical Perspectives on the Global Optimization of Atomic Clusters. In Global Optimization; Pintér, J.D., Ed.; Nonconvex Optimization and Its Applications; Springer: Berlin/Heidelberg, Germany, 2006; Volume 85, pp. 103–139. ISBN 978-0-387-30408-3. [Google Scholar]
  19. Baletto, F.; Ferrando, R. Structural Properties of Nanoclusters: Energetic, Thermodynamic, and Kinetic Effects. Rev. Mod. Phys. 2005, 77, 371–423. [Google Scholar] [CrossRef] [Green Version]
  20. Ohtani, B.; Mahaney, O.O.P.; Amano, F.; Murakami, N.; Abe, R. What Are Titania Photocatalysts?―An Exploratory Correlation of Photocatalytic Activity with Structural and Physical Properties. J. Adv. Oxid. Technol. 2010, 13, 247–261. [Google Scholar] [CrossRef]
  21. Gupta, A.; Zhang, R.; Kumar, P.; Kumar, V.; Kumar, A. Nano-Structured Dilute Magnetic Semiconductors for Efficient Spintronics at Room Temperature. Magnetochemistry 2020, 6, 15. [Google Scholar] [CrossRef] [Green Version]
  22. Chouhan, L.; Bouzerar, G.; Srivastava, S.K. Effect of Mg-Doping in Tailoring D0 Ferromagnetism of Rutile TiO2 Compounds for Spintronics Application. J. Mater. Sci Mater. Electron. 2021, 32, 11193–11201. [Google Scholar] [CrossRef]
  23. Wertheim, G.K.; Remeika, J.P. Mössbauer Effect Hyperfine Structure of Trivalent Fe57 in Corundum. Phys. Lett. 1964, 10, 14–15. [Google Scholar] [CrossRef]
  24. Katsuhisa, T. ESR and Mössbauer Studies on Structure and Magnetic Properties of Iron-Containing Amorphous Oxides. Ph.D. Thesis, Kyoto University, Kyoto, Japan, 1991. [Google Scholar]
  25. Yermakov, A.Y.; Boukhvalov, D.W.; Volegov, A.S.; Uimin, M.A.; Zakharova, G.S.; Korolev, A.V.; Rosenfeld, E.V.; Mesilov, V.V.; Minin, A.S.; Galakhov, V.R.; et al. Unconventional Magnetism of Non-Uniform Distribution of Co in TiO2 Nanoparticles. J. Alloys Compd. 2020, 826, 154194. [Google Scholar] [CrossRef]
  26. Molochnikov, L.S.; Borodin, K.I.; Yermakov, A.E.; Uimin, M.A.; Minin, A.S.; Vostroknutova, A.V.; Eremina, R.M.; Kurkin, M.I.; Konev, S.F.; Konev, A.S.; et al. Magnetism and Temperature Dependence of Nano-TiO2: Fe EPR Spectra. Mater. Chem. Phys. 2022, 276, 125327. [Google Scholar] [CrossRef]
  27. Bingham, P.A. Magnetism and Temperature Dependence of Nano-TiO2: Fe EPR Spectra, Chapter 5, Electron Spin Resonance. Ph.D. Thesis, University of Sheffield, Sheffield, UK, 2000. [Google Scholar]
  28. Ferretti, A.M.; Forni, L.; Oliva, C.; Ponti, A. EPR Study of Iron-Doped MFI Zeolite and Silicalite Catalysts: Effect of Treatments after Synthesis. Res. Chem. Intermed. 2002, 28, 101–116. [Google Scholar] [CrossRef]
  29. Matsnev, M.E.; Rusakov, V.S. SpectrRelax: An Application for Mössbauer Spectra Modeling and Fitting. In Proceedings of the International Conference MSMS-12, Olomouc, Czech Republic, 11–15 June 2012; pp. 178–185. [Google Scholar]
  30. Yu, S.; Yun, H.J.; Lee, D.M.; Yi, J. Preparation and Characterization of Fe-Doped TiO2 Nanoparticles as a Support for a High Performance CO Oxidation Catalyst. J. Mater. Chem. 2012, 22, 12629. [Google Scholar] [CrossRef]
  31. Adán, C.; Bahamonde, A.; Fernández-García, M.; Martínez-Arias, A. Structure and Activity of Nanosized Iron-Doped Anatase TiO2 Catalysts for Phenol Photocatalytic Degradation. Appl. Catal. B Environ. 2007, 72, 11–17. [Google Scholar] [CrossRef]
  32. Yermakov, A.Y.; Gubkin, A.F.; Korolev, A.V.; Molochnikov, L.S.; Uimin, M.A.; Rosenfeld, E.V.; Kurkin, M.I.; Minin, A.S.; Volegov, A.S.; Boukhvalov, D.W.; et al. Formation of Fe–Fe Antiferromagnetic Dimers in Doped TiO2:Fe Nanoparticles. J. Phys. Chem. C 2019, 123, 1494–1505. [Google Scholar] [CrossRef]
  33. Vasil’yev, A.N.; Zvereva, Y.A.; Volkova, O.S.; Markina, M.M. Nizkorazmernyy magnetizm. In Nizkorazmernyy Magnetizm; Izdatel’stvo Fizmatlit: Moscow, Russia, 2017; p. 336. [Google Scholar]
  34. Dong, F.; Wang, H.; Wu, Z.; Qiu, J. Marked Enhancement of Photocatalytic Activity and Photochemical Stability of N–Doped TiO2 Nanocrystals by Fe3+/Fe2+ Surface Modification. J. Colloid Interface Sci. 2010, 343, 200–208. [Google Scholar] [CrossRef] [PubMed]
  35. Thorp, J.S.; Eggleston, H.S. Rhombic Symmetry Sites in Fe/TiO2 Powders. J. Mater. Sci. Lett. 1985, 4, 1140–1142. [Google Scholar] [CrossRef]
  36. Janes, R. Structural and Spectroscopic Studies of Iron (III) Doped Titania Powders Prepared by Sol-Gel Synthesis and Hydrothermal Processing. Dye. Pigment. 2004, 62, 199–212. [Google Scholar] [CrossRef]
  37. Soler, J.M.; Artacho, E.; Gale, J.D.; García, A.; Junquera, J.; Ordejón, P.; Sánchez-Portal, D. The SIESTA Method for Ab Initio Order- N Materials Simulation. J. Phys. Condens. Matter 2002, 14, 2745–2779. [Google Scholar] [CrossRef] [Green Version]
  38. Perdew, J.P.; Burke, K.; Ernzerhof, M. Generalized Gradient Approximation Made Simple. Phys. Rev. Lett. 1996, 77, 3865–3868. [Google Scholar] [CrossRef] [Green Version]
  39. Troullier, N.; Martins, J.L. Efficient Pseudopotentials for Plane-Wave Calculations. Phys. Rev. B 1991, 43, 1993–2006. [Google Scholar] [CrossRef] [PubMed]
  40. Monkhorst, H.J.; Pack, J.D. Special Points for Brillouin-Zone Integrations. Phys. Rev. B 1976, 13, 5188–5192. [Google Scholar] [CrossRef]
Figure 1. EPR spectra of the samples obtained with the use of the different precursors: the commercially available salt of Fe(NO3)3 (ST-01-20-E1) and the solution of 57Fe in nitric acid (ST-01-20-E1-M).
Magnetochemistry 09 00198 g001
Figure 2. EPR spectra of ST-01 (A), ST-21 (B) and ST-41 (C) samples after depositing Fe3+ ions (black lines) and after etching with HCl (red lines).
Magnetochemistry 09 00198 g002
Figure 3. (A) EPR spectra of TiO2: Fe ST-01-20 samples before and after etching in HCl and dithionite. In the inset, the values of susceptibility are shown for the samples before (black) and after etching in HCl (red) and dithionite (green). (B) EPR spectra of TiO2: Fe samples after annealing at 200 °C (ST-01-200) and after the following etching in HCl (ST-01-200-E1) and dithionite Na2S2O4 (ST-01-200-E1 + E2). In the inset, the values of susceptibility are shown for the samples before (black) and after etching in HCl (red) and dithionite Na2S2O4 (green). On panel (C) reported EPR spectra of samples after annealing at 100, 300 and 400 °C and after etching in Na2S2O4.
Magnetochemistry 09 00198 g003
Figure 4. Top and side views of two substitutional iron impurities in core TiO2 with oxygen vacancy between defects (A) and pair of substitutional and interstitial Fe impurities in the vicinity of oxygen vacancy in (110) and (101) surfaces, (B) and (C), respectively. Not all bonds are shown.
Magnetochemistry 09 00198 g004
Figure 5. (AC). Charge density redistribution after formation of Ti-O bonds in perfect TiO2 (A) and formation of Fe-O bonds after incorporation of iron impurity in TiO2 matrix with oxygen vacancy (B). The yellow “clouds” corresponds with increasing charge density and cyan with decreasing. Panel (C) shows the difference between charge densities with different spins around a single substitutional iron impurity in a TiO2 matrix with oxygen vacancy. The blue and yellow “clouds” corresponds with the prevalence of charge densities of different orientations of spins. The isosurface level used for the visualization is 0.015, 0.001 and 0.2 e3 for (a), (b) and (c) panels, respectively. The location of oxygen vacancy is indicated by a green circle.
Magnetochemistry 09 00198 g005
Figure 6. 57Fe Mossbauer spectra of ST-01-20-E1-M (A) and ST-01-300-E1-E2M (B) samples and their fitting with superposition of subspectra.
Magnetochemistry 09 00198 g006
Figure 7. Magnetization curves of samples with different contents of iron. The numbers of the curves correspond to the samples’ numbers in Table 1. The dash line denotes the Brillouin function for the spin S = 5/2.
Magnetochemistry 09 00198 g007
Figure 8. (A) Magnetization of some samples at core doping at 2 K versus concentration of Fe ions in core of nanoparticles. (B) Magnetization of some samples at surface doping at 2 K versus the “effective” concentration of Fe ions in the surface layer. The layer thickness is taken equal to 0.3 nm.
Magnetochemistry 09 00198 g008
Figure 9. (A,B) Magnetization curves of the sample ST-01-20-E1-1 (black dots) and their description with a mix of spin states S = 5/2 (58%) and S = 1/2 (42%) at 2 K (A) and at room temperature (B) (red lines).
Magnetochemistry 09 00198 g009
Figure 10. Temperature dependence of inverse susceptibility. (A) Sample ST-01-20-E1-1 with surface doping (number 1 in Table 1) (B) Sample ST-01-300-E1-E2 with core doping (number 10 in Table 1).
Magnetochemistry 09 00198 g010
Table 1. Designation of the samples at various stages of their preparation, calcination and etching. The numbers 100, 300 and 400 denote the calcination temperatures (degree Celsius); for the samples prepared without calcination, the number 20 (RT) is used. The samples etched in acid are marked with symbol E1; samples etched in dithionite are marked with symbol E2.
No.SampleCalcination T, °CFe Conc., wt.%
Location of iron atoms on the surface of TiO2 nanoparticles
1ST-01-20204.17
2ST-21-20202.09
3ST-41-20200.52
4ST-01-20-E1-1200.42
5ST-01-20-E1-2200.33
6ST-01-20-E1-3200.51
7ST-01-20-E1-4201.44
8ST-21-20-E1200.18
Location of iron atoms in the core of TiO2 nanoparticles
9ST-01-100-E11001.09
10ST-01-300-E1-E23001.62
11ST-21-100-E11000.26
12ST-21-300-E13000.57
13ST-21-400-E14000.91
Table 2. Calculated formation energies, magnetic moments, occupancies, coordination numbers (CN), Fe-Fe and Fe-O distances for the most energetically favorable configurations of substitutional (FeTi) and interstitial (Fei) iron impurities in the core and the two most stable (110) and (101) surfaces of TiO2 nanoparticles with and without oxygen vacancies (vO).
HostConfiguration of ImpuritiesFormation Energy, eV/FeMagnetic Moments, μBOccupancyCNd(Fe-Fe), Åd(Fe-O), Å
CoreFeTi−0.043.803d6 4s06---1.91, 1.99
FeTi + FeTi−0.133.733d6 4s063.111.90, 1.98
Core + vOFeTi−1.684.273d5 4s05---1.90, 1.94, 2.08
FeTi + FeTi−1.414.26, 4.313d5 4s053.011.94, 2.00, 2.06
(110)Fei−5.734.143d5 4s05---1.93, 2.02
FeTi + Fei−3.834.20, 1.123d5 4s0 (HS, LS)52.721.90, 1.93, 2.02
(110) + vOFei−2.983.693d6 4s03---1.90
FeTi + Fei−3.143.63, 4.273d5 4s0, 3d6 4s03, 52.821.90
(101)Fei−4.533.833d6 4s03---1.90, 2.01
FeTi + Fei−3.143.92, 4.243d6 4s0, 3d5 4s03, 44.521.82, 1.94, 2.08
(101) + vOFei−5.183.883d6 4s03---1.90, 2.07
FeTi + Fei−3.433.82, 4.193d6 4s0, 3d5 4s03, 34.751.89, 2.02
Table 3. Marking and treatments of TiO2-Fe57 samples used in the Mössbauer study.
SampleAnnealingEtchingMass. % Fe57
ST-01-20-E1-MnoHNO34.00
ST-01-300-E1-E2-M300 °CHCl, Na2S2O62.72
Table 4. The Mössbauer parameters (isomer shift-IS, quadrupole splitting-QS) and intensities (I) of partial contributions obtained by processing the Mössbauer spectra of samples ST-01-20-E1-M and ST-01-300-E1-E2-M.
ST-01-20-E1-MST-01-300-E1-E2-M
I, rel.un.IS, mm/sQS, mm/sI, rel.un.IS, mm/sQS, mm/s
10.72 ± 0.010.343 ± 0.0070.60 ± 0.010.318 ± 0.0020.35 ± 0.0020.89 ± 0.01
20.28 ± 0.020.337 ± 0.0051.04 ± 0.010.515 ± 0.0020.367 ± 0.0010.56 ± 0.01
3---0.167 ± 0.0010.318 ± 0.0031.32 ± 0.01
Disclaimer/Publisher’s Note: The statements, opinions and data contained in all publications are solely those of the individual author(s) and contributor(s) and not of MDPI and/or the editor(s). MDPI and/or the editor(s) disclaim responsibility for any injury to people or property resulting from any ideas, methods, instructions or products referred to in the content.

