Article

Influence of Mn Doping on Local Spin Moments and Stacking Fault Energies in Co(Mn) Alloys

1
Department of Physics and Astronomy, The University of Alabama, Tuscaloosa, AL 35487, USA
2
Department of Metallurgical and Materials Engineering, The University of Alabama, Tuscaloosa, AL 35487, USA
3
Materials and Structures Division, NASA Glenn Research Center, Cleveland, OH 44135, USA
*
Author to whom correspondence should be addressed.
Magnetochemistry 2023, 9(6), 138; https://doi.org/10.3390/magnetochemistry9060138
Submission received: 5 May 2023 / Revised: 18 May 2023 / Accepted: 20 May 2023 / Published: 23 May 2023
(This article belongs to the Special Issue Advances in Magnetic Nanomaterials and Nanostructures)

Abstract

:
We report on the results of first principles calculations investigating the influences of Mn doping on the local moments and stacking fault energies (SFEs) in the Co 95.8 Mn 4.2 and Co 91.6 Mn 8.4 systems as compared to pure face-centered cubic Co. A supercell was developed to maintain periodicity in calculations, provide a simple relaxation mechanism, and allow for easy expansion to accommodate different concentrations of Mn. Calculations to determine the generalized SFE were performed on relaxed and non-relaxed systems in both ferromagnetic and nonmagnetic states. Analysis revealed fluctuations in the magnetic moments that are closely tied to the relaxation state and faulting state of the system. In the case of systems containing Mn, we observed a dependence of the SFE on the location of the Mn atom(s) within the supercell relative to the stacking fault interface and a strong induced magnetic moment for these atoms.

1. Introduction

Advanced soft magnetic materials used in motors, transformers, and filter inductors can enable low-carbon-footprint transportation systems [1,2,3,4,5]. Of interest for this work, among others, are complex metal-amorphous nanocomposite Co-based alloys that include other constituent elements, such as Fe, Mn, B, Si, and Nb [6,7,8]. The alloys begin as an amorphous ribbon, which is annealed to produce fine nanocrystallites embedded within an amorphous matrix. B, Si, and Nb segregate to the amorphous phase, while the nanocrystallites remain Co-rich with some amounts of Fe and Mn. Both the nanocrystalline and amorphous phases are ferromagnetic (FM), and, while the nanocrystalline phase exhibits higher saturation magnetization, the glassy matrix has higher resistivity, resulting in reduced eddy current losses at higher frequencies. The combined composite material also exhibits a very low magnetostriction, further keeping the coercivity and magnetic losses to a minimum. In addition, secondary processing of the ribbon, such as stress annealing, can be used to tune the permeability of the ribbon over nearly five orders of magnitude [9]. This capability to induce strong magnetic anisotropy in Co-based alloys is thought to have its origin in fault generation in the nanocrystalline phase during stress annealing. Thus, these intricate composite materials are designed to optimize magnetic properties for a given application through complex compositional and microstructural control. However, much more research is needed to understand the atomistic behavior of these materials.
An initial analysis of Co 78 x Fe 2 Mn x B 1 4 Si 2 Nb 4 alloys, where 0.5 x 6 , via transmission electron microscopy and ferromagnetic resonance showed evidence that the nanocrystallites were formed in both the hexagonal close-packed (HCP) and face-centered cubic (FCC) crystallographic phases [6], despite the tendency of bulk Co to be stable in the HCP phase at room temperature [10]. Further experimental work with this type of material has focused on certain magnetic and crystallographic behaviors, particularly as concentrations of the alloying elements change [6,7,8]. This work will focus on the theoretical analysis of the structural behavior of the Co-rich nanocrystallites. As many of the constituent elements remain in the amorphous phase and are not part of the nanocrystallite system, specific attention will be paid to a Co 1 x Mn x binary alloy system to determine the influence, if any, of Mn doping on the stability of the two primary crystallographic phases of Co. We have chosen to focus on Mn as the dopant due to experimental observations made by Koenig et al. [7] and Nakarmi et al. [8]. Additionally, the magnetic behavior of Mn as a dopant in Co is sensitive to composition, as noted by Stepanyuk et al. [11]. This will be performed via the calculation of the generalized stacking fault energy (SFE) curve of pure Co and Mn-doped Co. As there is not much substantial analysis regarding the influences of local moments on the SFE [12], the moments of atoms in the system at different points along the SFE curve were determined.

1.1. Cobalt Phases

It has been well established that Co exists in either the HCP or FCC phases depending on certain conditions, namely temperature, where, in general, the FCC phase is stable at high temperatures and the HCP phase is stable at room temperature [12,13]. However, for very fine grains, it is believed that Co exists primarily in the FCC phase [10]. Additional factors affecting phase stability include strain [12], which, for bulk samples at room temperature, favors the conversion of any residual FCC phase to HCP [14]. The opposite behavior, however, is expected for nanocrystalline Co, which is predicted to undergo deformation via phase transformation from HCP to FCC, as the energy required for a phase transformation is lower than that required to generate twins [15]. Consequently, as the Co 78 x Fe 2 Mn x B 1 4 Si 2 Nb 4 alloys have been shown to possess very small grains of the order of only a few nanometers [7], this work will focus on understanding stacking fault behavior in Co and Mn-doped Co in the FCC phase. It should be noted that Mn dopants in FCC Fe are reported by Limmer et al. to stabilize the local HCP phase [16], so there is potential for a similar behavior to arise in our calculations.
While Co is known to be in a stable FM state regardless of the crystallographic phase [17], there are some situations where its magnetic phase differs from what is traditionally expected. Namely, in the case of pure Co, it is predicted that a nonmagnetic (NM) phase is feasible when the lattice of FCC Co undergoes some degree of compression [18]. Additionally, in the case of Co 1 x Mn x alloys, an antiferromagnetic phase has been found to exist for 0.42 x 0.52 [19]. While these concentrations are much higher than those used in typical soft magnetic alloys, it is indicative that the presence of Mn can affect the magnetic properties of the material. Zhao et al. note that, in Ni-based solid-solution alloys, there appears to be a relationship between the SFE and magnetic moment of constituent atoms [20]. Due to this potential Mn behavior, as well as the observed behavior in Ni-based alloys, there will also be some focus on the effect of Mn doping on the local moments and their potential effects on phase stability.

1.2. Density Functional Theory and Stacking Faults

Density functional theory (DFT) is a computational method that can be used to determine the SFE, γ S F , of a system and understand the wider behaviors of such energy landscapes [21,22]. It has been used to determine the effects of pressure [23], alloying elements [13,24,25,26,27,28], and spin polarization [29,30] on stacking fault energies and related properties. DFT allows for fine-tuning of the supercells used in calculations, such as defining individual magnetic moments to determine effects from magnetic behavior [29] or allowing the system to relax to an energetic minimum in a particular direction [31].
When performing analysis of the SFE, there are two main methods: the supercell approach and the axial (next-)nearest neighbor Ising (A(N)NNI) model. The supercell approach utilizes a large crystal sheared along a given plane to simulate a stacking fault. This approach results in the generation of something called the generalized SFE surface, or γ surface, that includes an intrinsic stacking fault (ISF). However, such an approach is often computationally expensive due to the size of the supercell needed to simulate the fault [29]. On the other hand, the A(N)NNI model has the benefit of using a much smaller system than the supercell approach, thus allowing for less time-consuming calculations of potentially complex systems [32,33]. However, it is noted by Bleskov et al. [29] that the A(N)NNI models, while computationally fast, do not account for factors such as the local magnetic ordering that could occur due to the formation of a defect in the system. For this reason, we have decided to use the supercell approach when calculating the SFE of the Co-Mn system. Additionally, while many analyses of Co-based materials appear to take the magnetism of the system as a whole into account, there is very little analysis of the influence of local moments [12]. Since the local moments are of particular interest to this work, using the supercell approach for calculations becomes even more critical.

1.3. Experimental Determination of Stacking Faults

Just as different phases can be observed via microscopy methods such as electron diffraction, the presence of stacking faults can be experimentally observed through defect analysis of electron microscopy images [34,35,36,37,38]. Additionally, indirect observations can be made using X-ray diffraction methods [36]. Direct analysis via microscopy can result in the experimental determination of γ I S F . Doing so, however, requires knowledge of mechanical properties such as the shear modulus, elastic constants, and Poisson’s ratio [34,35]. Experimental determination of the SFE has shown that faulting behavior, such as the size of the dislocation, can be influenced by annealing and can result in drastic changes to the SFE [37]. It has also been used to verify the predictions of constituent alloying element effects on the SFE in high-entropy alloys [38]. However, one should keep in mind that experimentally reported SFE values can have a wide variance due to their local environment [20]. As such, one can potentially use this experimental approach to verify the computationally determined γ I S F for the Co-rich phase of the material, though care would need to be taken to determine local effects, if any.

2. Methodology

2.1. Supercell Design

Prior to the design of the supercells used for SFE calculations, the lattice constant of pure FCC Co was optimized using the 4-parameter Murnaghan equation [26,39]
E ( V ) = a + B 0 V B 0 1 + ( V 0 / V ) B 0 B 0 1 ,
where a = E 0 B 0 V 0 B 0 1 is a fitting parameter. In this case, E ( V ) is the energy of a cell of volume V, E 0 is the equilibrium energy, B 0 is the equilibrium bulk modulus, B 0 is the first derivative of the equilibrium bulk modulus, and V 0 is the equilibrium volume [26]. The equilibrium lattice parameter a 0 for FCC Co can be determined by fitting the energy curve that results from varying the lattice constant. As the crystalline phase of Co can vary based on factors such as lattice compression and magnetic state, this optimization was performed for both the FM and NM cases. Figure 1 shows the energy curve for FCC Co in both the FM and NM states for varying lattice constants, as calculated through DFT. The equilibrium constant for the FM case is determined to be a 0 3.514 Å, and for the NM case, is determined to be a 0 3.455 Å. This overall behavior of a slightly compressed lattice in the NM case is consistent with the predictions of Moruzzi et al. [18]. The equilibrium lattice constant for FCC Co in the FM state is lower than the experimental value of a 0 3.5370 Å reported by Owen and Jones [10]. However, deviance of computationally determined lattice constants from experimentally calculated values of a 0 has been observed in other metals [30,31]. As such, we are comfortable with the a 0 calculated for this work.
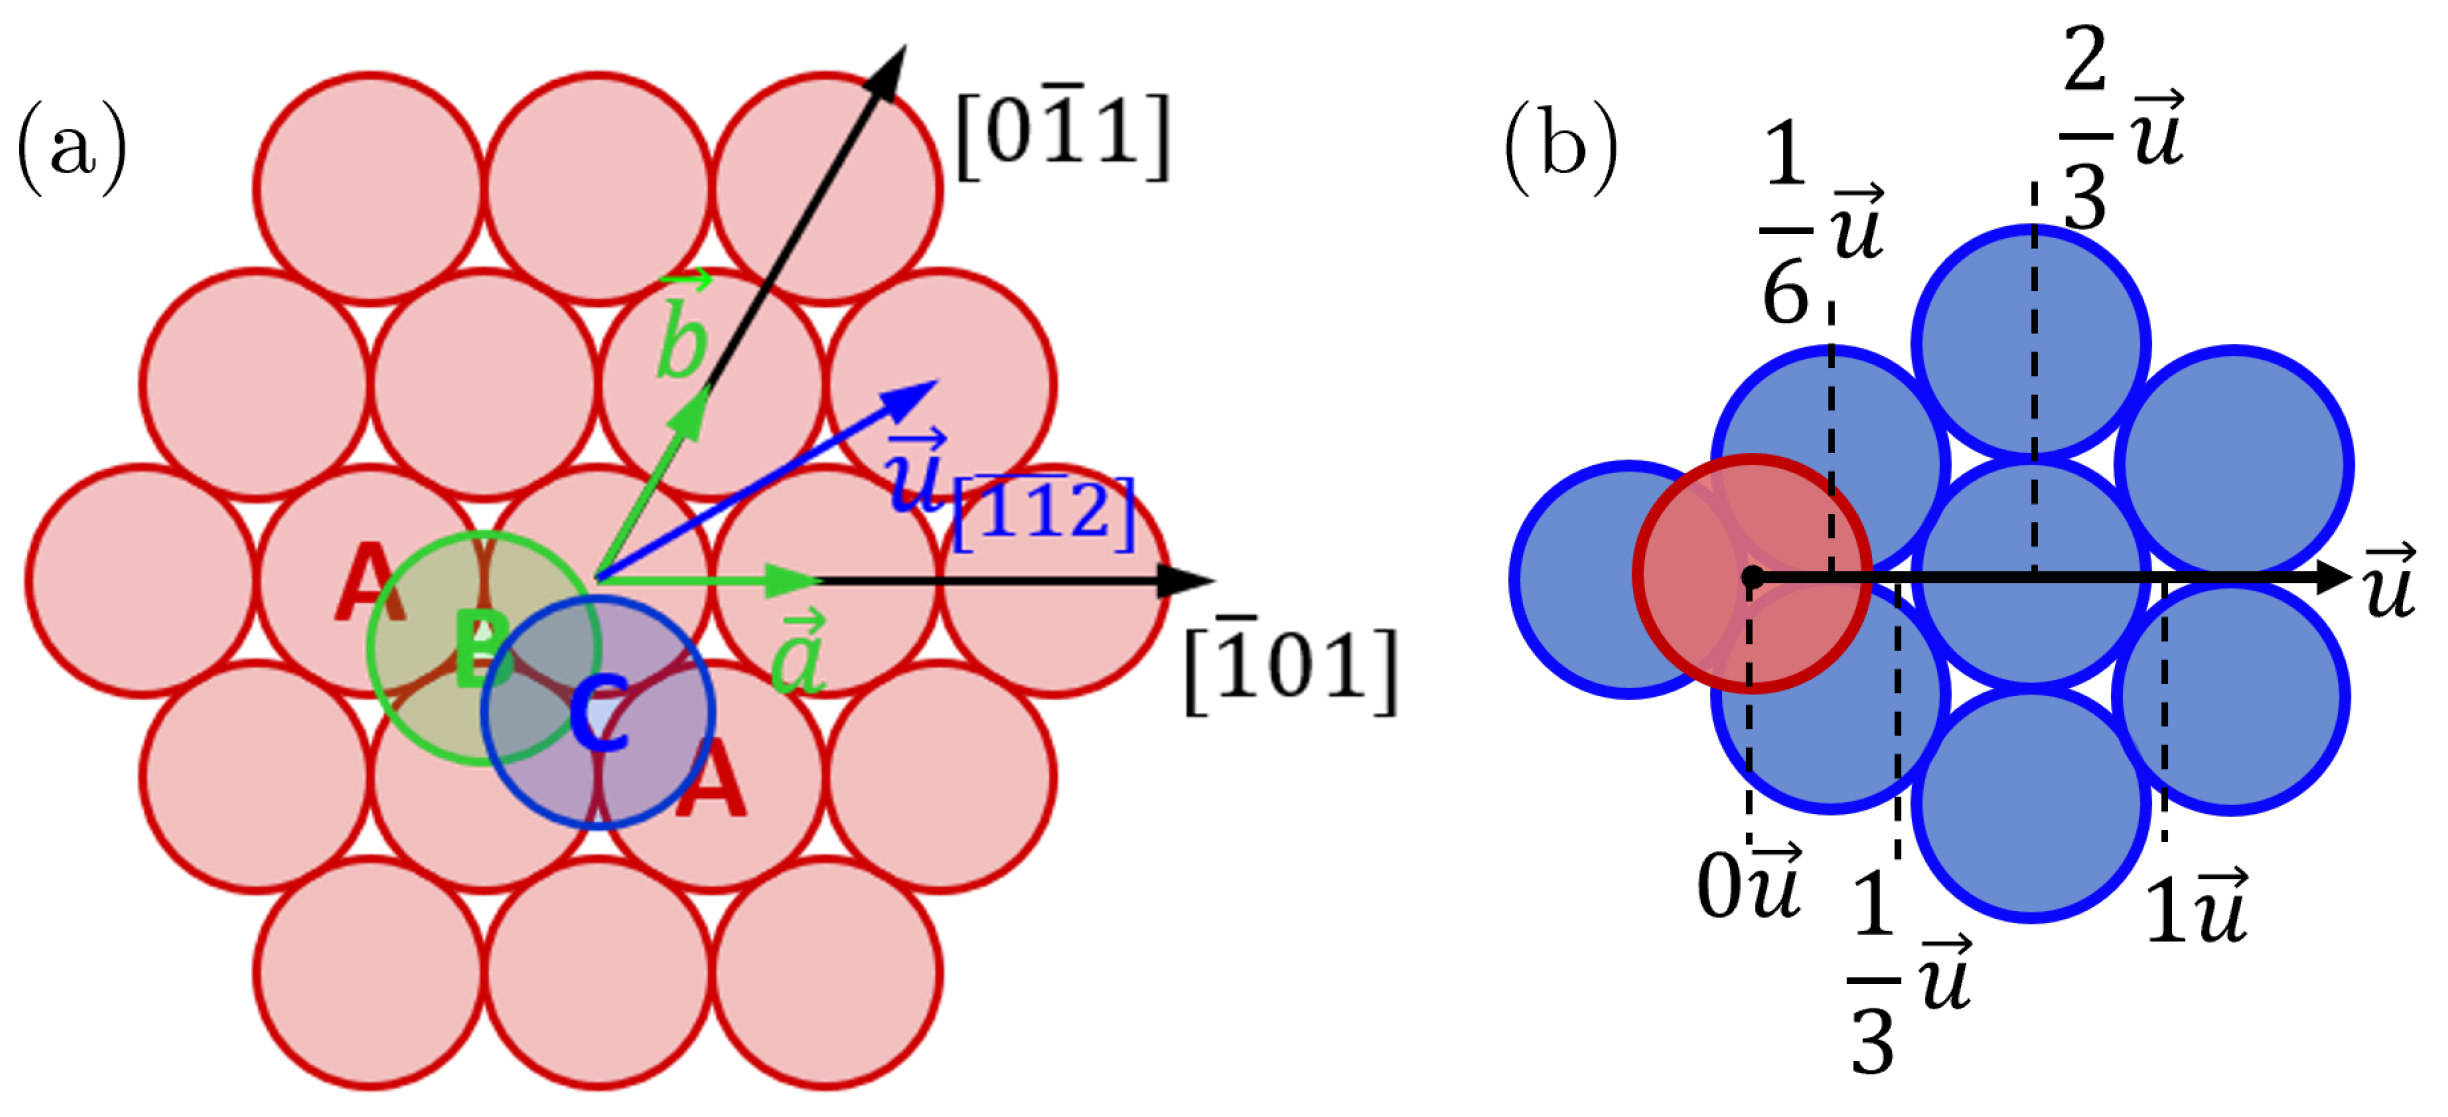
Supercells are then formulated using a triple-shift supercell approach, as proposed by Gholizadeh et al. [40]. While FCC structures are often depicted with { 100 } as the basal plane, they can be reoriented such that the close-packed { 111 } plane becomes the basal plane. This produces a set of base lattice vectors a = x e ^ x , b = x 2 e ^ x + x 3 2 e ^ y , and c = L d 111 e ^ z , where x = a 0 2 is the distance between nearest neighbors, L is the number of atomic layers in the supercell, and d 111 = a 0 3 is the distance between { 111 } planes. In this orientation, the FCC structure very closely resembles the HCP structure in terms of stacking, as pictured in Figure 2. This becomes beneficial when generating stacking faults that result in an intermediate HCP arrangement of atoms, as the shift now only needs to be defined in the x y plane that serves as the basal plane of the cell. The full dislocation that tends to occur in this type of system follows the Burgers vector B = 1 2 1 ¯ 01 . Typically, this dislocation occurs as a result of two smaller dislocations known as Shockley partials, which are lower-energy dislocations that occur along a Burgers vector B = 1 6 2 ¯ 11  [41]. In FCC crystals, this results in an intermediate HCP stacking arrangement, which will be seen along the dislocation vector defined for the system. We designed the supercell so that it is made of three smaller cells that are shifted along vectors in the 112 family, such that there is zero net displacement within the cell. This triple-shift approach, pictured in Figure 3, allows us to maintain high symmetry with a fixed supercell shape and a straightforward relaxation process [40]. The dislocation vector u can also be easily determined by taking the sum of the lattice vectors a and b . Figure 3 shows the subcells used in this approach and how they shift to allow for zero net displacement over the whole supercell. Additionally, this approach allows relatively easy expansion of the supercell to accommodate varying concentrations of alloying elements such as Mn. To ensure that the size of the supercell along the c axis remains the same, and thus the distance between each simulated fault, lattice expansion only occurs in the x and y directions. We decided to have six atomic layers between each stacking fault, as seen in the approaches by Su et al. and Gholizadeh et al. [31,40].
For pure Co, the supercell consisted of three subcells, each with one atom per layer, for a total of eighteen atoms. For the Co 1 x Mn x alloy, the number of atoms was increased to four per layer, for a total of seventy-two atoms. As a result of this expansion, the lattice vectors a and b are extended by a factor of 2. Due to symmetries, the Co 95.8 Mn 4.2 system, simulated using one Mn atom per 24-atom subcell, had three unique cases of Mn placement: the first layer (nearest to the stacking fault), the second layer, and the third layer (farthest from the stacking fault). For the Co 91.6 Mn 8.4 system, simulated using two Mn atoms per twenty-four-atom subcell, γ S F was calculated using six unique cases: layers one and four, layers one and three, layers one and two, layers two and five, layers two and four, and layers three and four. In all doped systems, there was no more than one Mn atom per layer.

2.2. DFT Parameters

All calculations for this work were performed using the Vienna ab initio simulation package (VASP) [42,43]. For all calculations, the exchange-correlation effects utilized the generalized gradient approximation, as developed by Perdew, Burke, and Ernzerhof [44], with a defined cutoff energy of 270 eV. Resources provided by VASP suggest using a higher cutoff energy in the event that there is difficulty achieving energy convergence. As we did not experience these difficulties, we decided to keep the cutoff energy near the default value, as determined by the potential files.
To determine the optimal Wigner–Seitz radius for DFT calculations, the RWIGS parameter for each self-consistent run was increased from its initial value of 1.302, provided by the relevant potential file, initially in increments of 0.005, with smaller increments used when nearing the optimal value. The optimal value, in this case, is one that yields a unit cell filling of 100%. For our purposes, this was found to be 1.373 for the FM case and 1.351 for the NM case. Due to their similar atomic sizes, the RWIGS parameters for Co and Mn are assumed to be approximately equivalent.
For all supercells, regardless of Mn concentration or magnetization state, calculations were performed for the relaxed and non-relaxed supercells. Relaxation involves allowing the atoms within the supercell to deviate from their defined lattice positions in order to find a lower-energy configuration. For a non-relaxed system, we do not allow this process to occur and thus keep the atoms in their defined lattice sites. This can occasionally lead to energetic contributions due to an unstable configuration. To relax the systems, we utilize the selective dynamics functionality in VASP to define the axes along which the atoms can move. In our case, we permit motion along the z axis and disallow motion along the x and y axes. This type of relaxation is chosen to preserve the position of atoms in the x y plane and thus preserve the stacking fault. This also allows atomic motion while preserving the basal plane lattice. The initial relaxation run utilized a conjugate gradient algorithm and a loop break condition of an energy difference of 1 × 10 4 eV. The second relaxation step reduced the energy difference to 1 × 10 5 eV, while using a RMM-DIIS ionic relaxation scheme [45]. The final run for the relaxed systems, and the only one for the non-relaxed systems, was a simple, self-consistent run that terminated upon energy convergence. The pure Co system utilized an automatically generated Monkhorst–Pack mesh of k-points [46] with reciprocal lattice vector subdivisions of 11/11/1. This results in a linear k-point density of roughly 4.57 points per [Å 1 ] in the FM case and 4.49 points per [Å 1 ] in the NM case. Due to the increased scale in the x and y directions for the Co 1 x Mn x systems, the subdivisions are changed to 7/7/1, resulting in a linear k-point density of roughly 5.36 points per [Å 1 ] in the FM case and 5.28 points per [Å 1 ] in the NM case.

2.3. Calculating SFE

The SFE can be calculated from the Gibbs free energy of the system such that
γ S F ( u ) = G d e f ( u ) G i d e a l | A i n t | ,
where G d e f is the free energy of the defected system at a specific point along the dislocation vector u , G i d e a l is the free energy of the system with no defects, and A i n t is the area of the interface over which the fault occurs [26]. As the system used in our calculations contains three individual stacking faults, we also normalize the γ S F with respect to the number of faults. The energies necessary for the calculations are obtained from the output of the self-consistent calculations performed in VASP. For relaxed systems, this involves using the final energies after all relaxation steps have been performed.

3. Results and Discussion

3.1. SFE Behavior

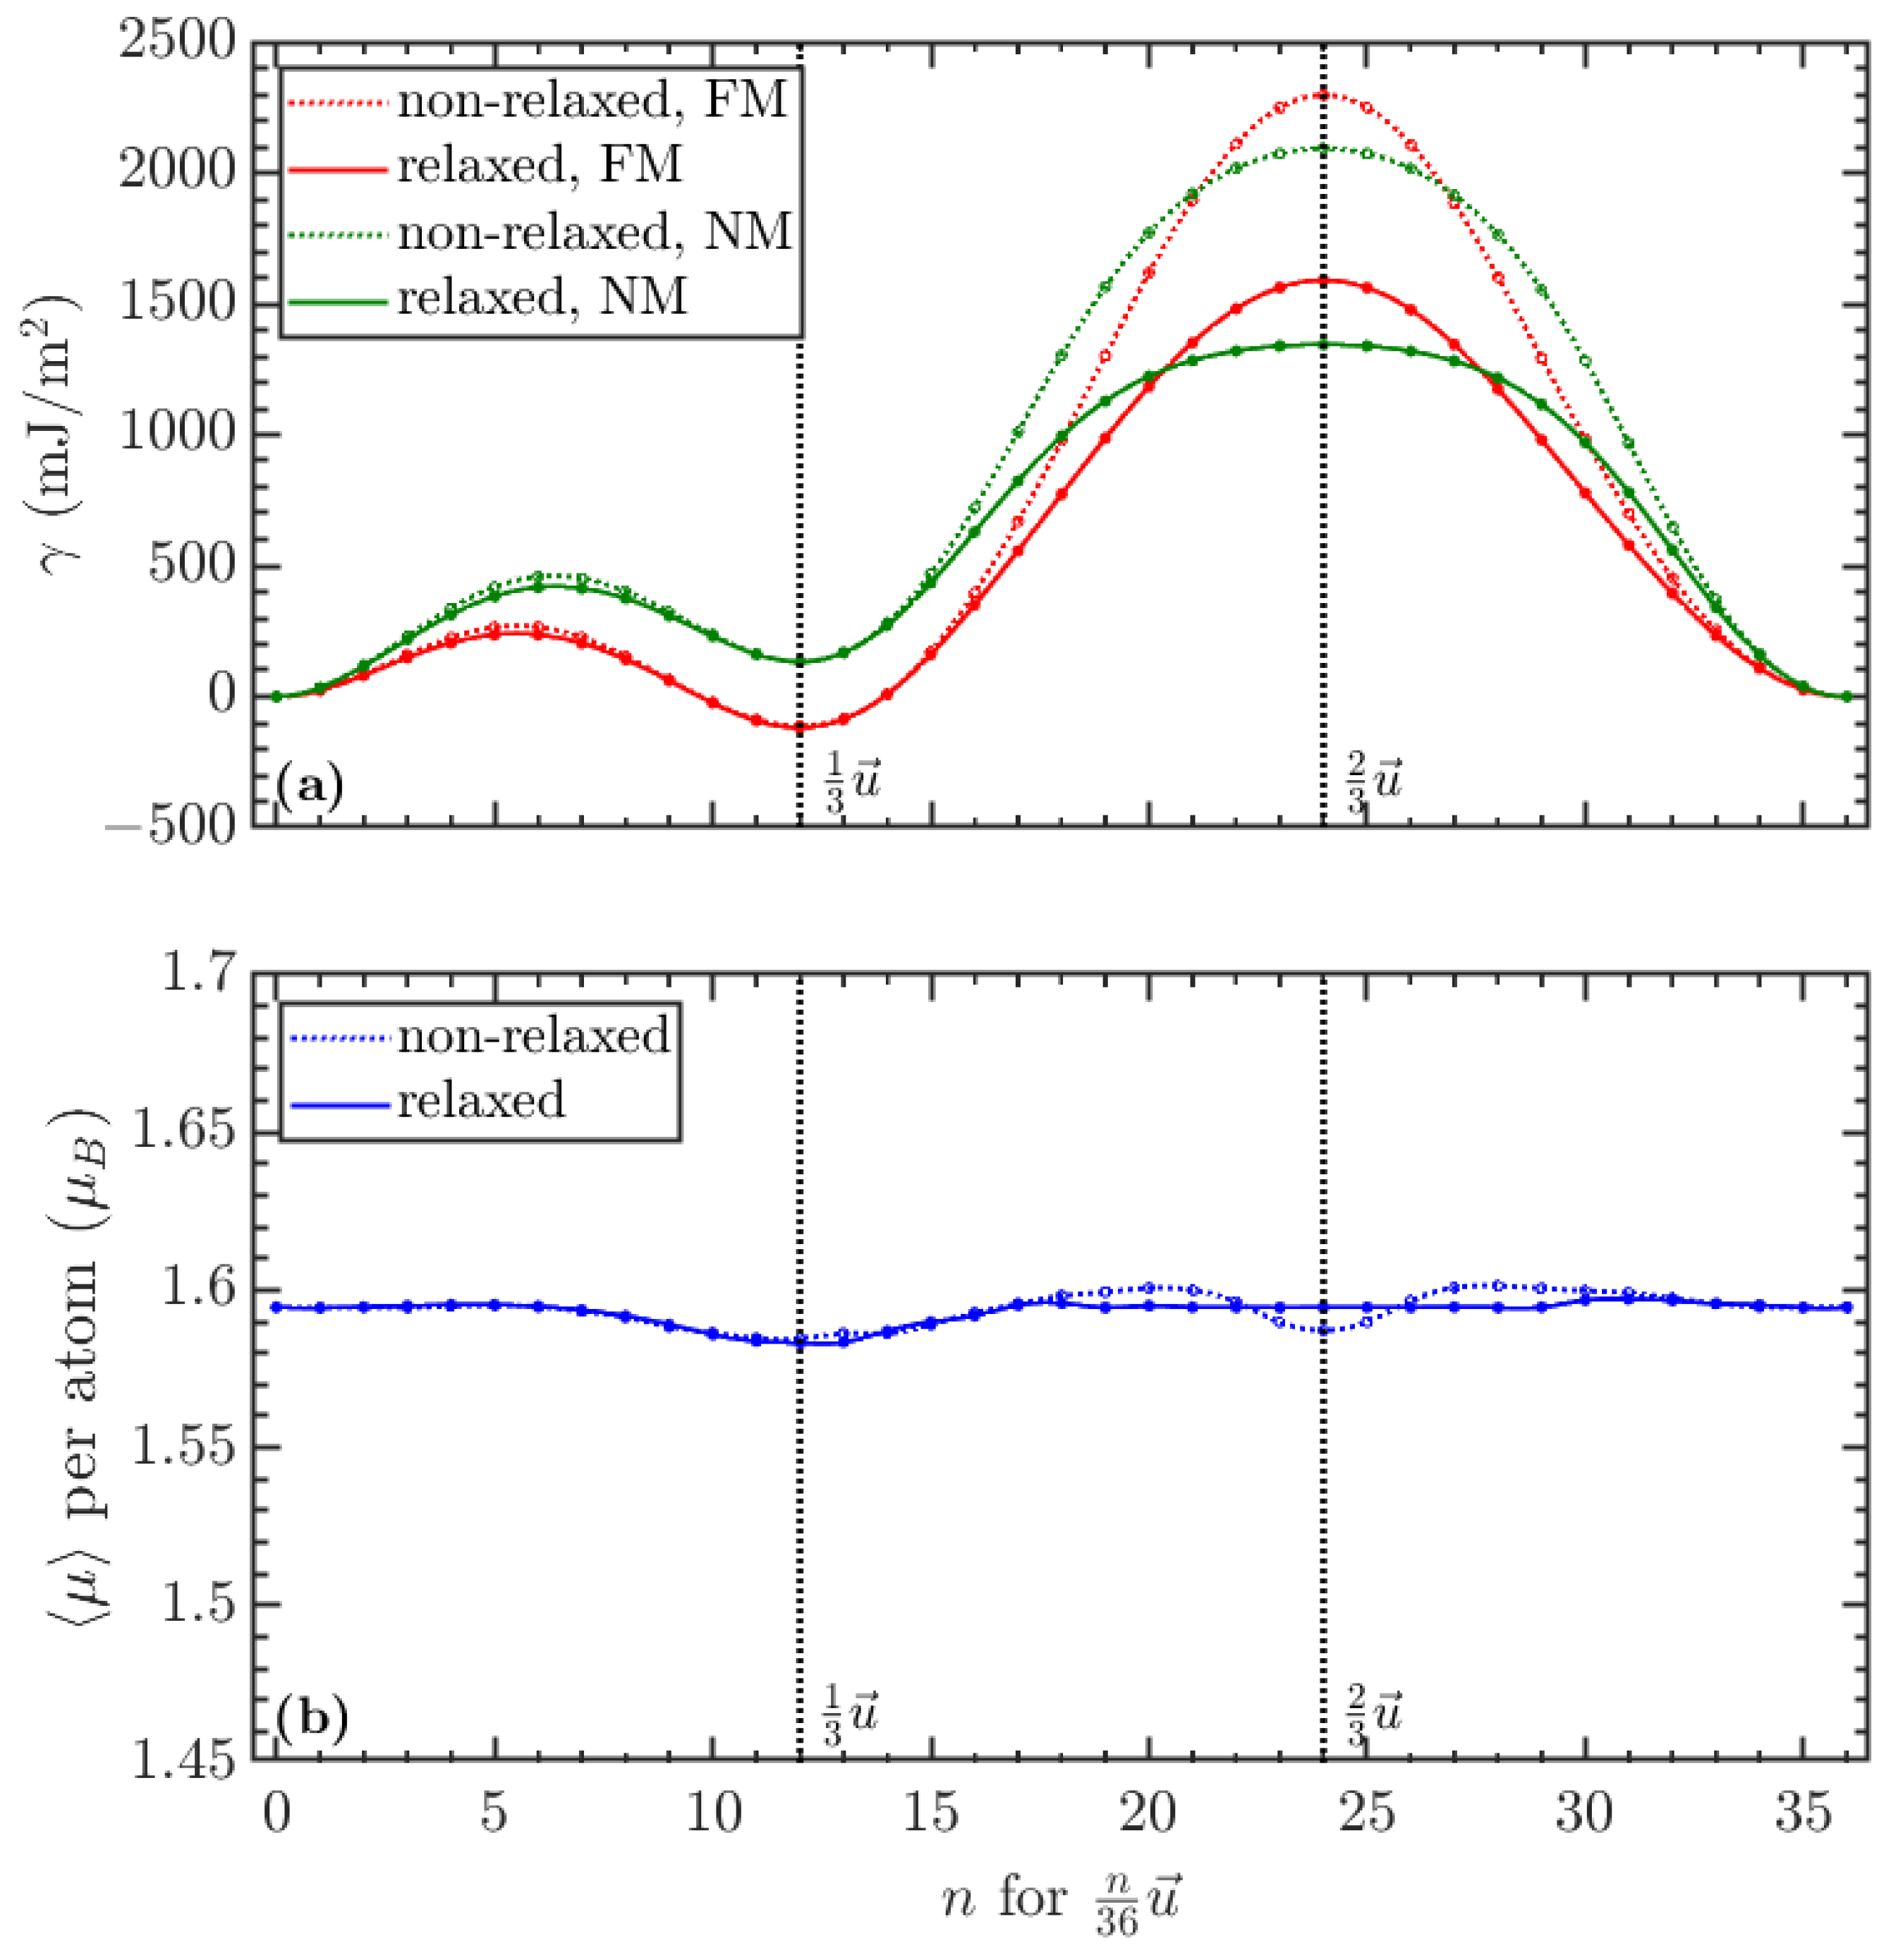
Regardless of the composition of the system, its magnetic state, or its relaxation state, the SFE curves followed a similar pattern. As can be expected, the SFE reaches a local minimum at points along the displacement vector u that correspond to arrangements where close-packed stacking is preserved (FCC or HCP stacking). A maximum is achieved at points along u that correspond to a violation of close-packed stacking. Namely, this occurs at 1 6 u , where there is partial atomic overlap, and 2 3 u , where there is complete atomic overlap. The point at which complete atomic overlap occurs is the only region where the NM system has a lower SFE than the FM system. Additionally, the SFE for the NM system is markedly higher at the HCP arrangement ( 1 3 u ) than for the FM system, as seen in Figure 4. This is true for both systems that have and have not been relaxed. The relaxation of the system in all cases reduces the SFE in the 2 3 u region by at least 400 mJ/m 2 at the peak, with minimal changes elsewhere along u . Relaxation also affects the magnetic moments of atoms within the system, so this must be considered when deciding whether to relax the system or to perform calculations in the non-energetically minimized state.
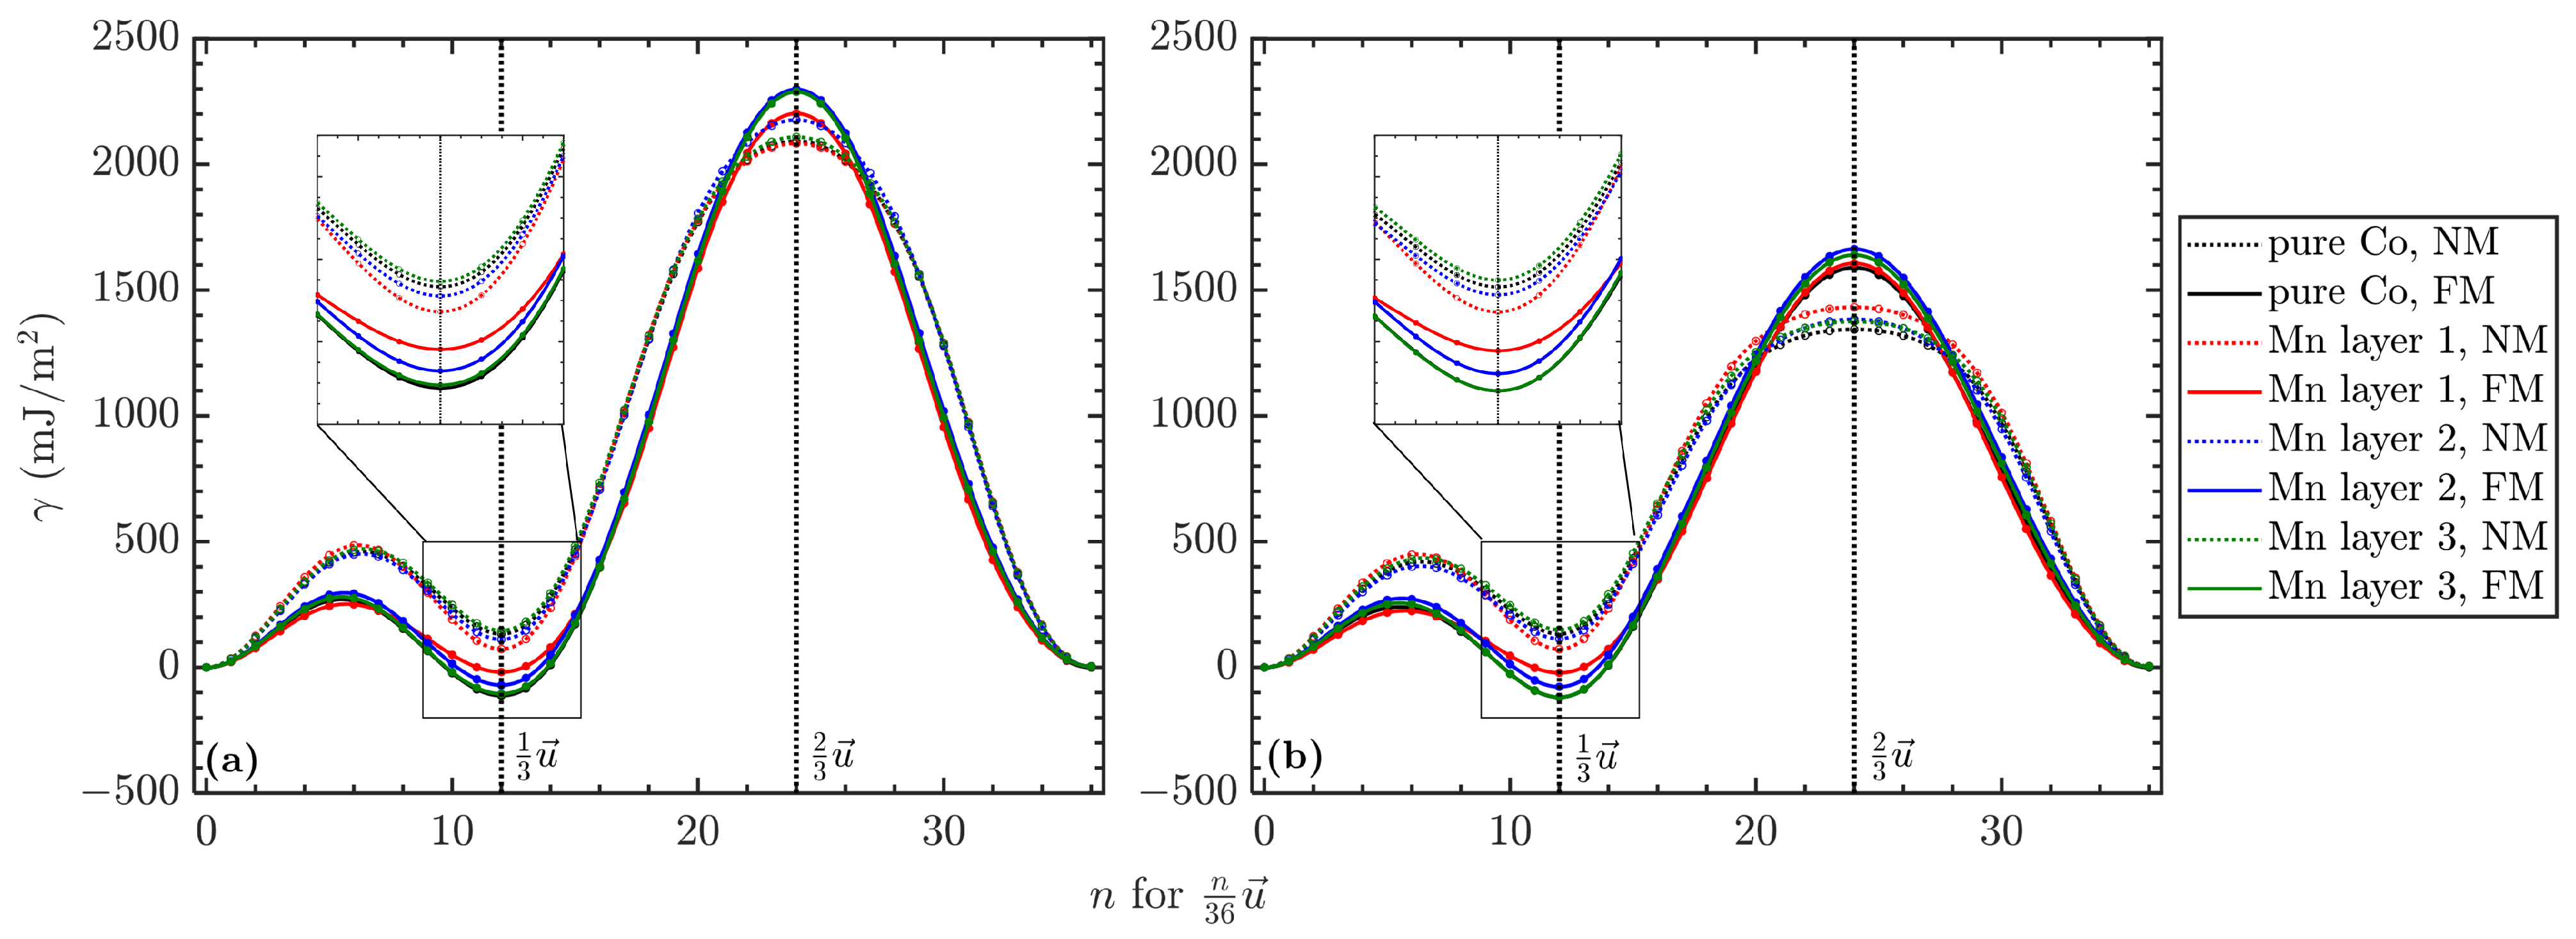
Doping with Mn results in SFE curves displaying similar behavior as the pure Co system. However, both the location and the amount of Mn appear to influence the SFE to some degree. Figure 5 and Figure 6 demonstrate the variations between curves as the position of the Mn atom in relation to the stacking fault is changed. Table 1 provides the calculated values of γ S F for all cases. These results provide several insights. First, the introduction of a small amount of Mn will influence the calculated SFE. This can be expected as the Mn atom can be assumed to be a defect within the system. Most notably, however, is that the SFE in the FM case sees its greatest increase when the Mn is situated nearest to the fault interface. For the NM cases, the trend is reversed: the Mn decreases the SFE of the system, with few exceptions, though this also depends on proximity to the fault interface. As the produced material is magnetic, we can assume from the γ I S F calculation that Mn will stabilize the faulting phase and situate itself as far from the fault as possible.
The cited results in Table 1, particularly those from Achmad et al. [26], are different from our calculated results. However, as is noted by Tian et al. [13], the supercell design of Achmad [26] utilizes a number of layers that is not divisible by three and thus creates an artificial fault due to cell periodicity in the calculations. As we have chosen 18 as the number of layers in the supercell, it is safe to assume that our calculations do not exhibit this sort of artifact. The difference in value between our results and those of Tian [13] for pure Co may be the result of differing relaxation schemes. Additionally, the positive value for γ S F , as determined by Zheng et al. [15], is indicative of the HCP–FCC phase transition being less energetically favorable than the reverse. We also note that the reduction in γ S F with the addition of Mn is similar to what is presented by Limmer et al. [16]; however, the dependence on the positioning of the Mn indicates that the γ S F is sensitive to the local environment, as suggested by Zhao et al. [20].

3.2. Magnetic Behavior

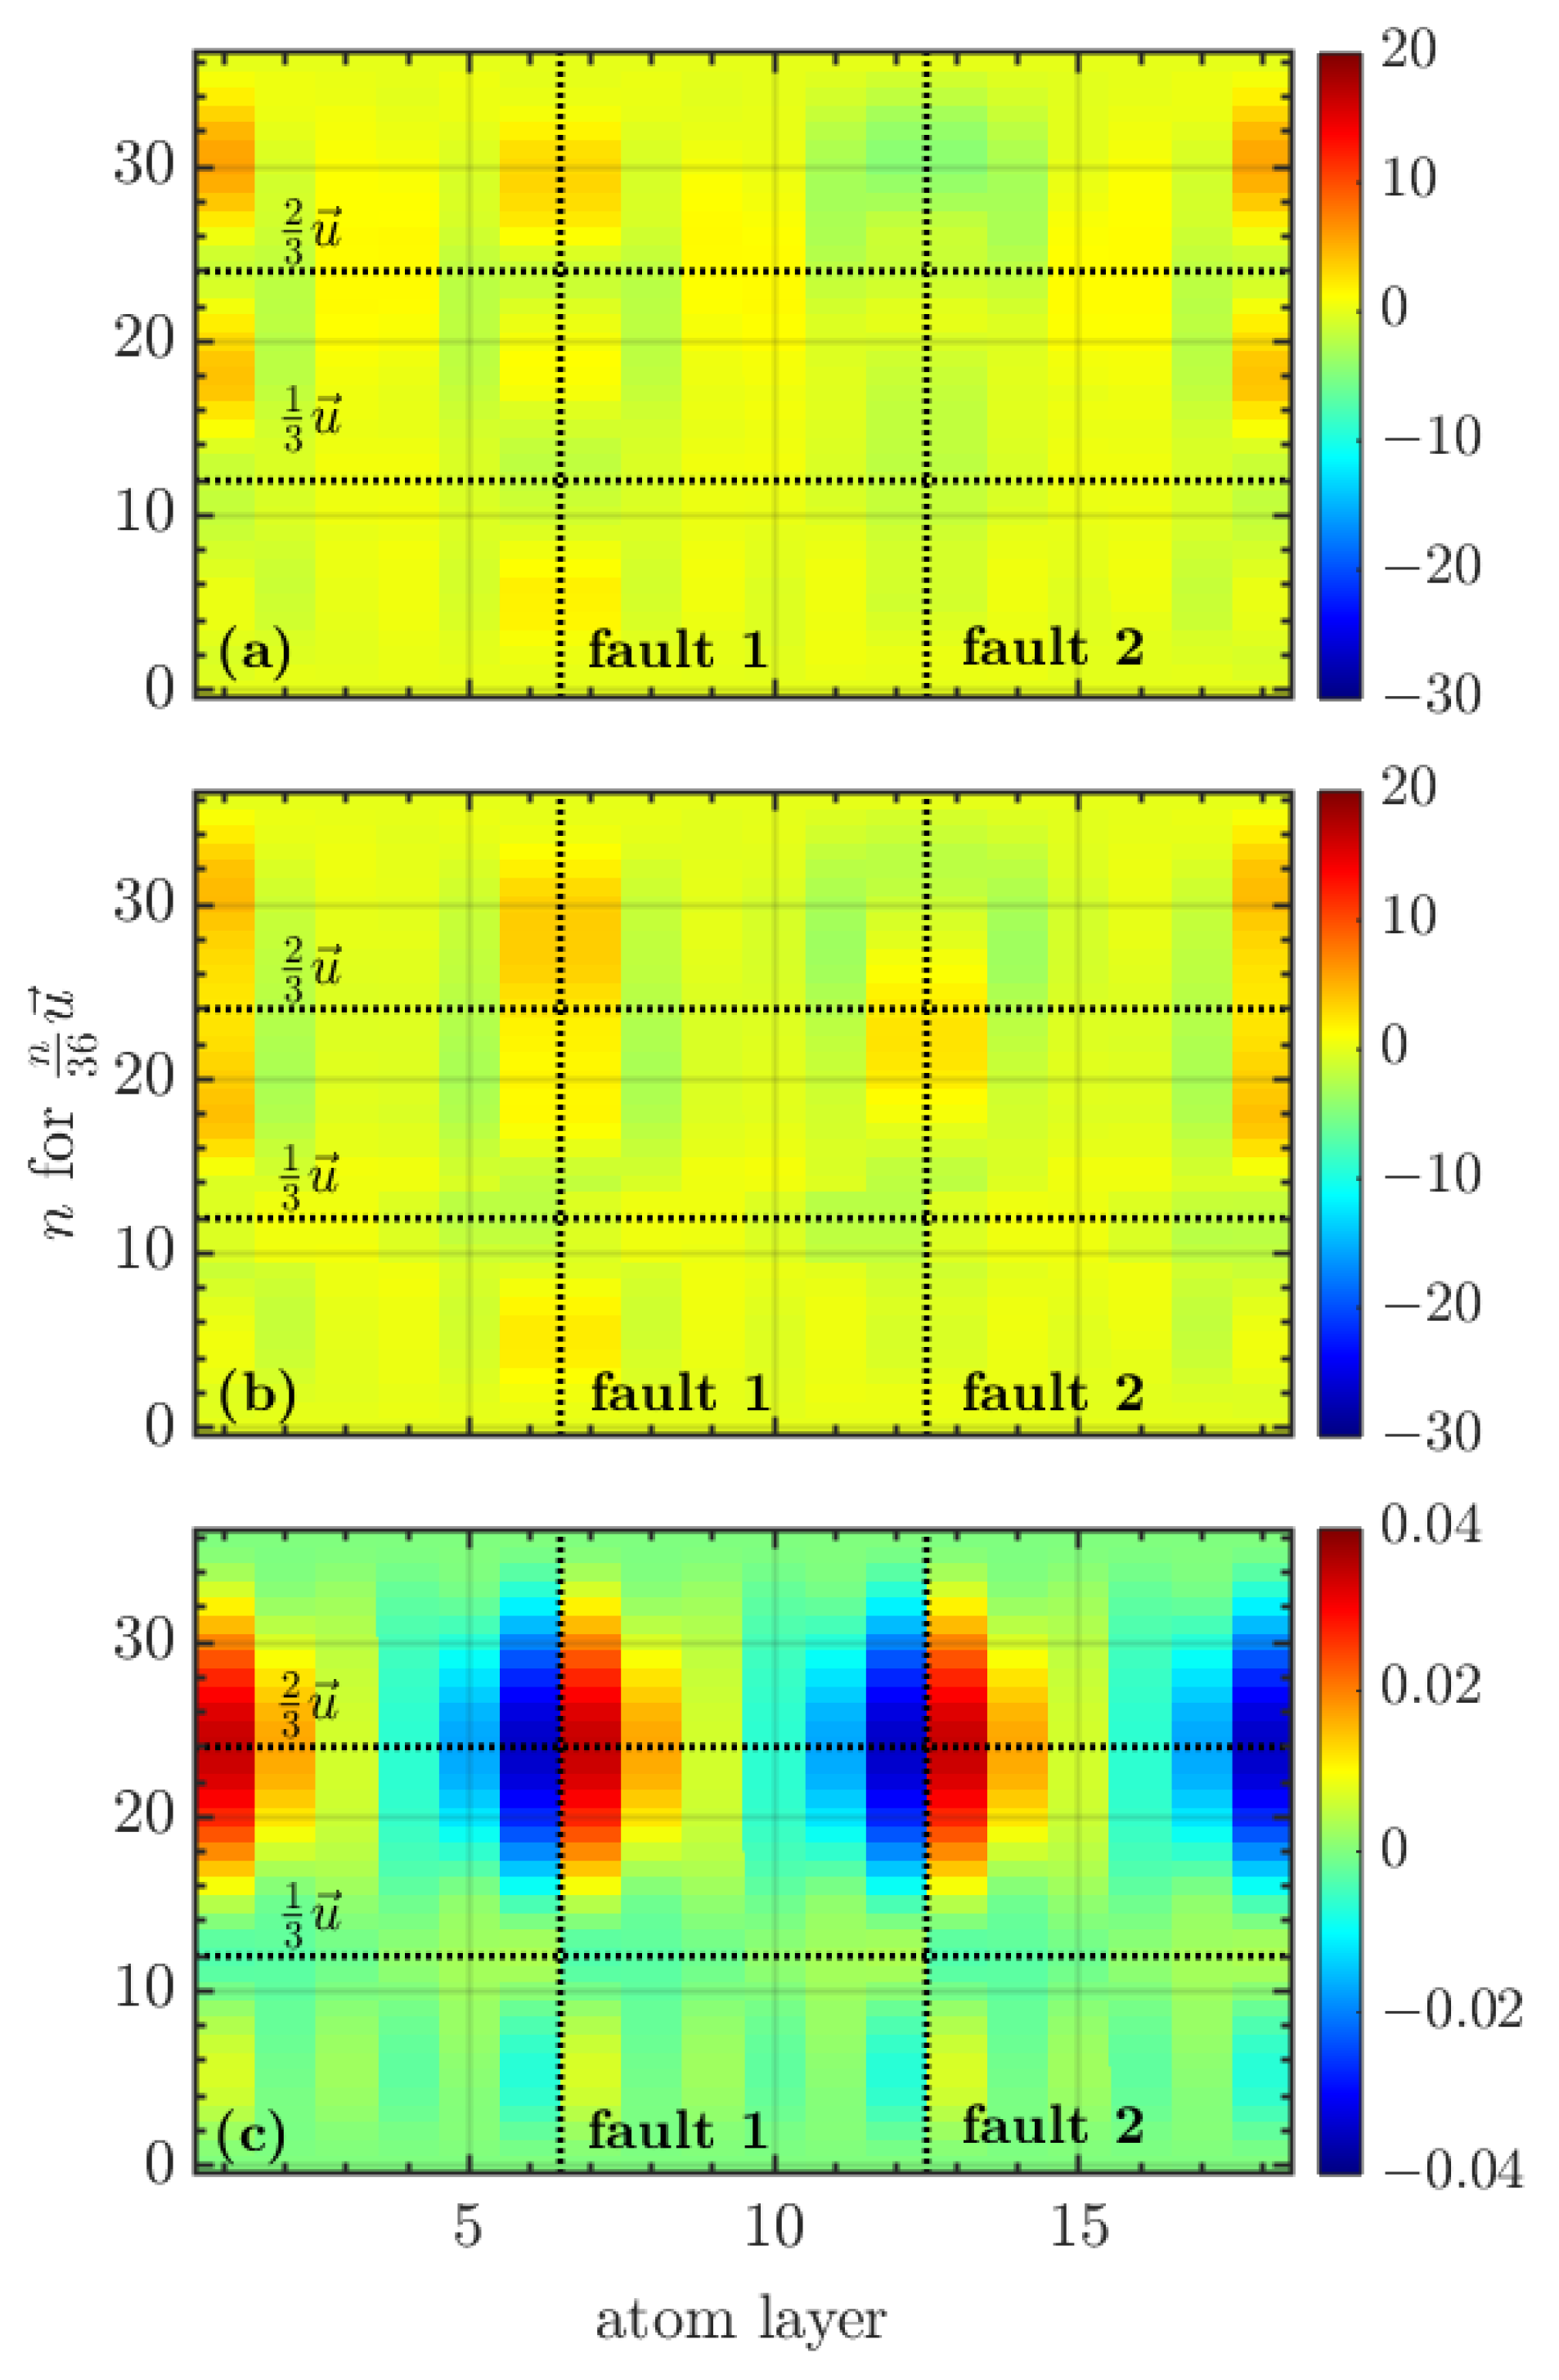
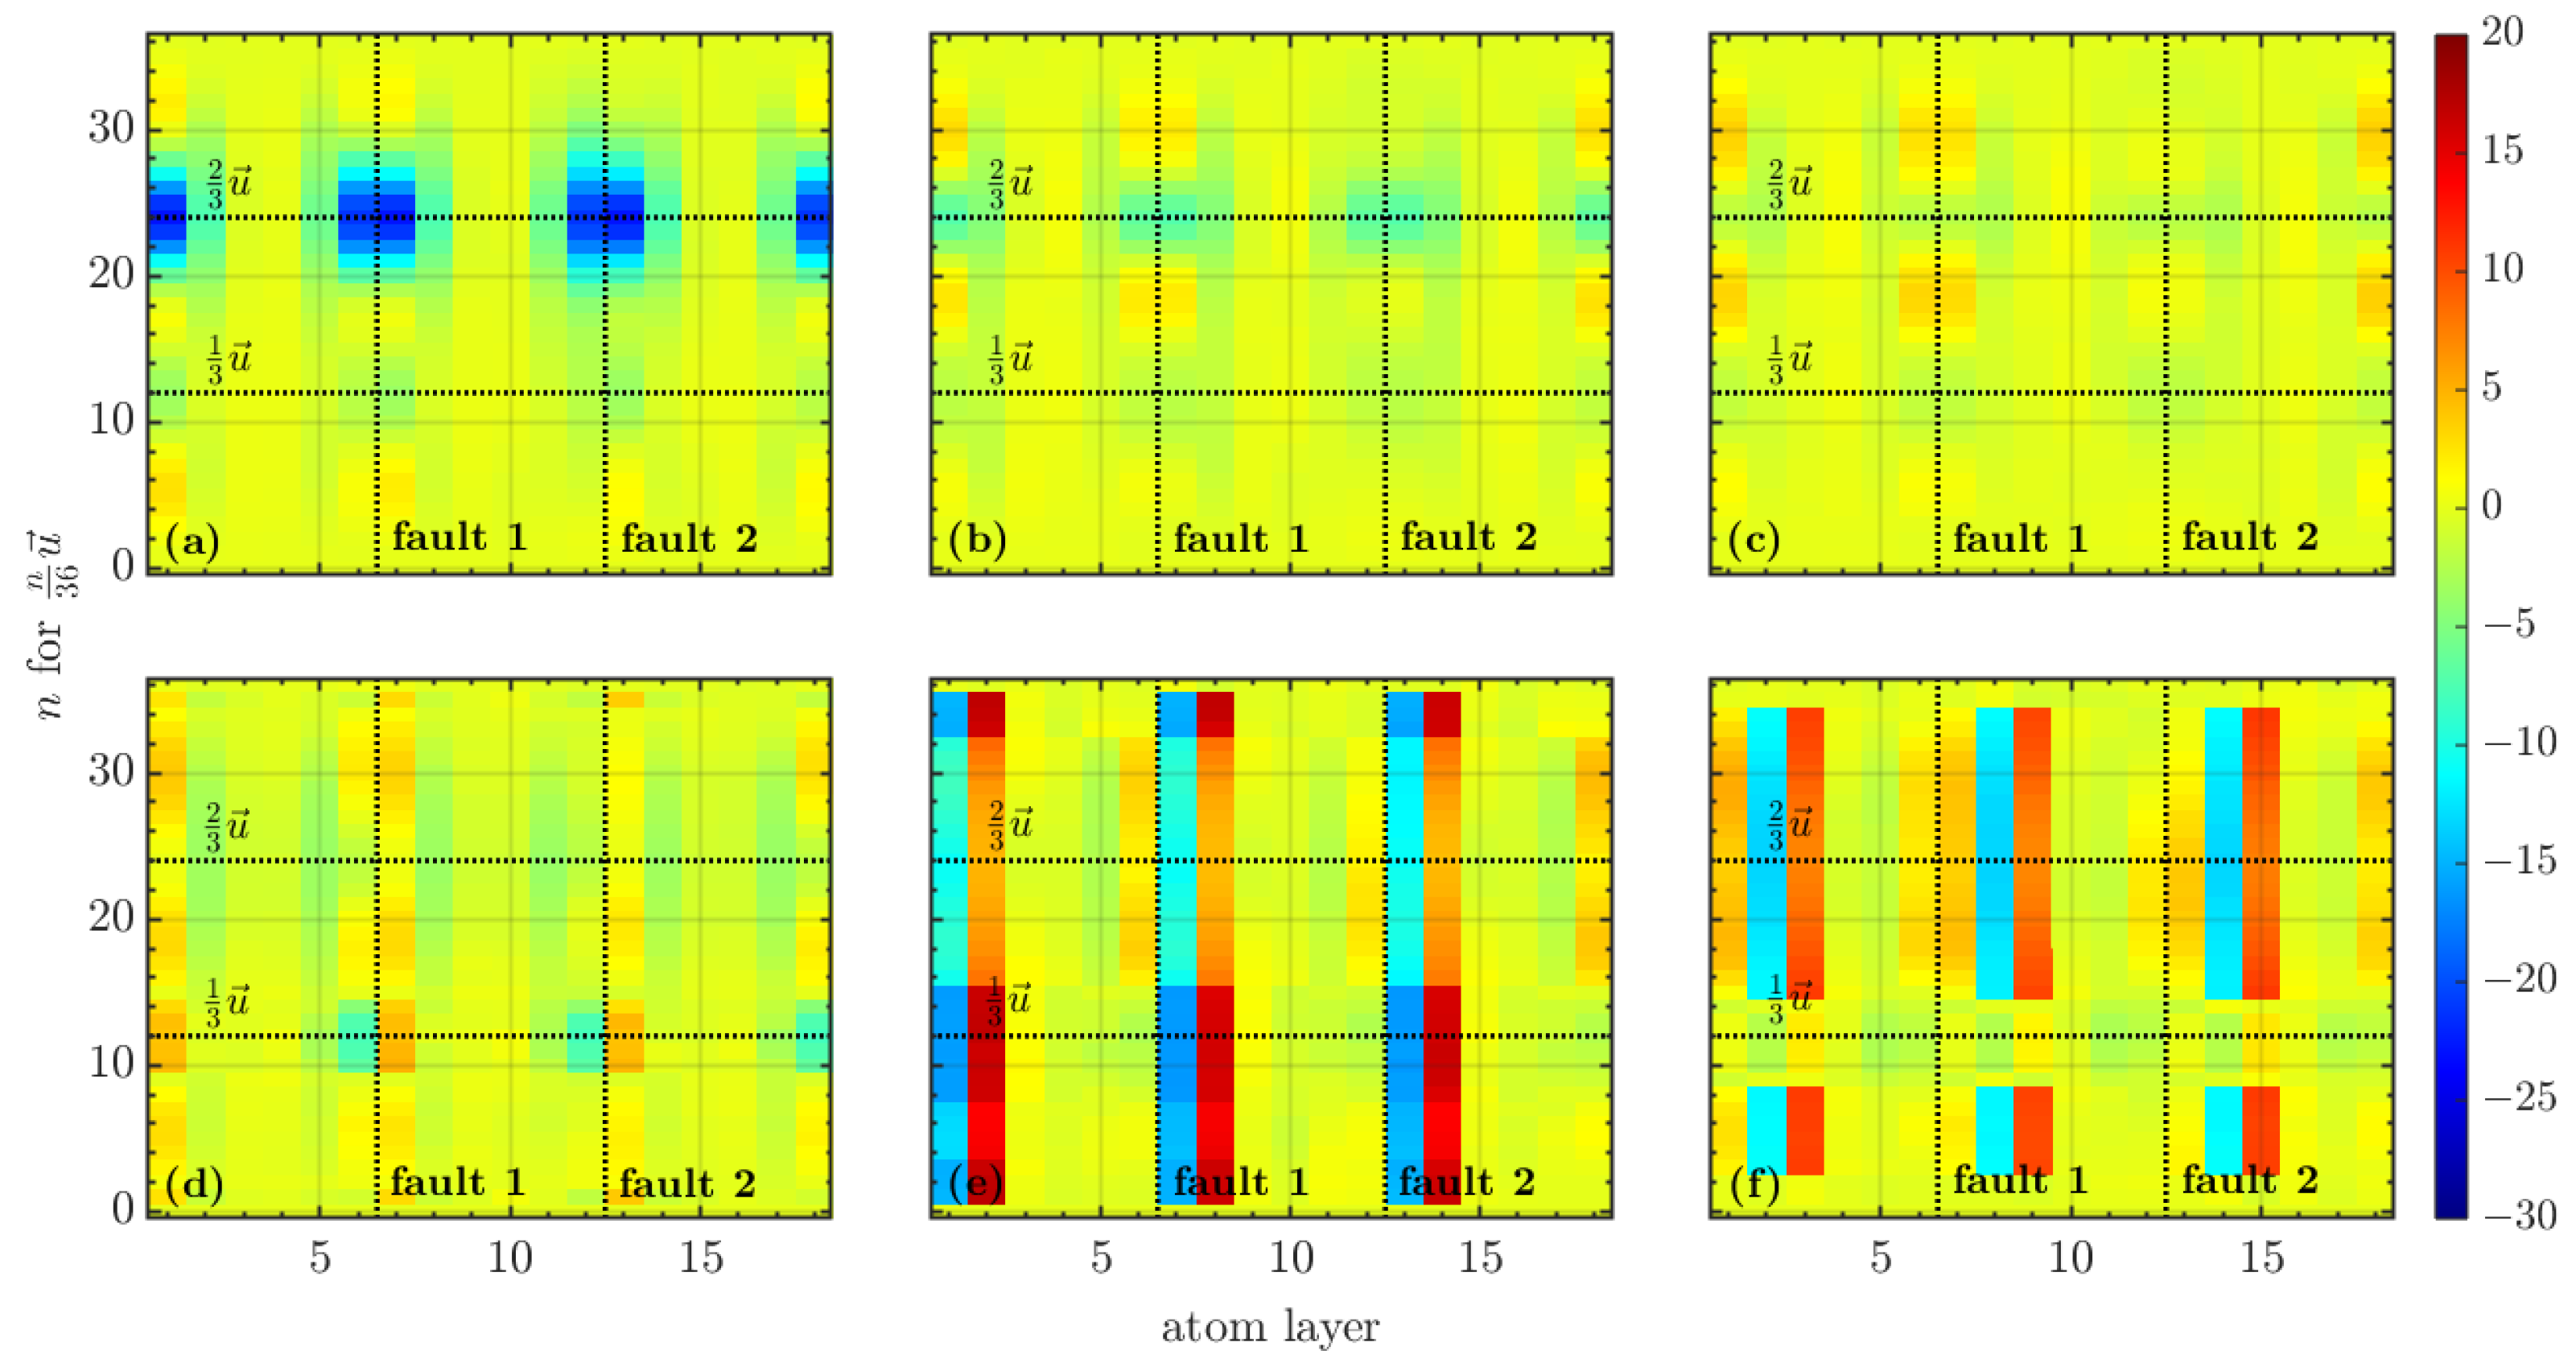
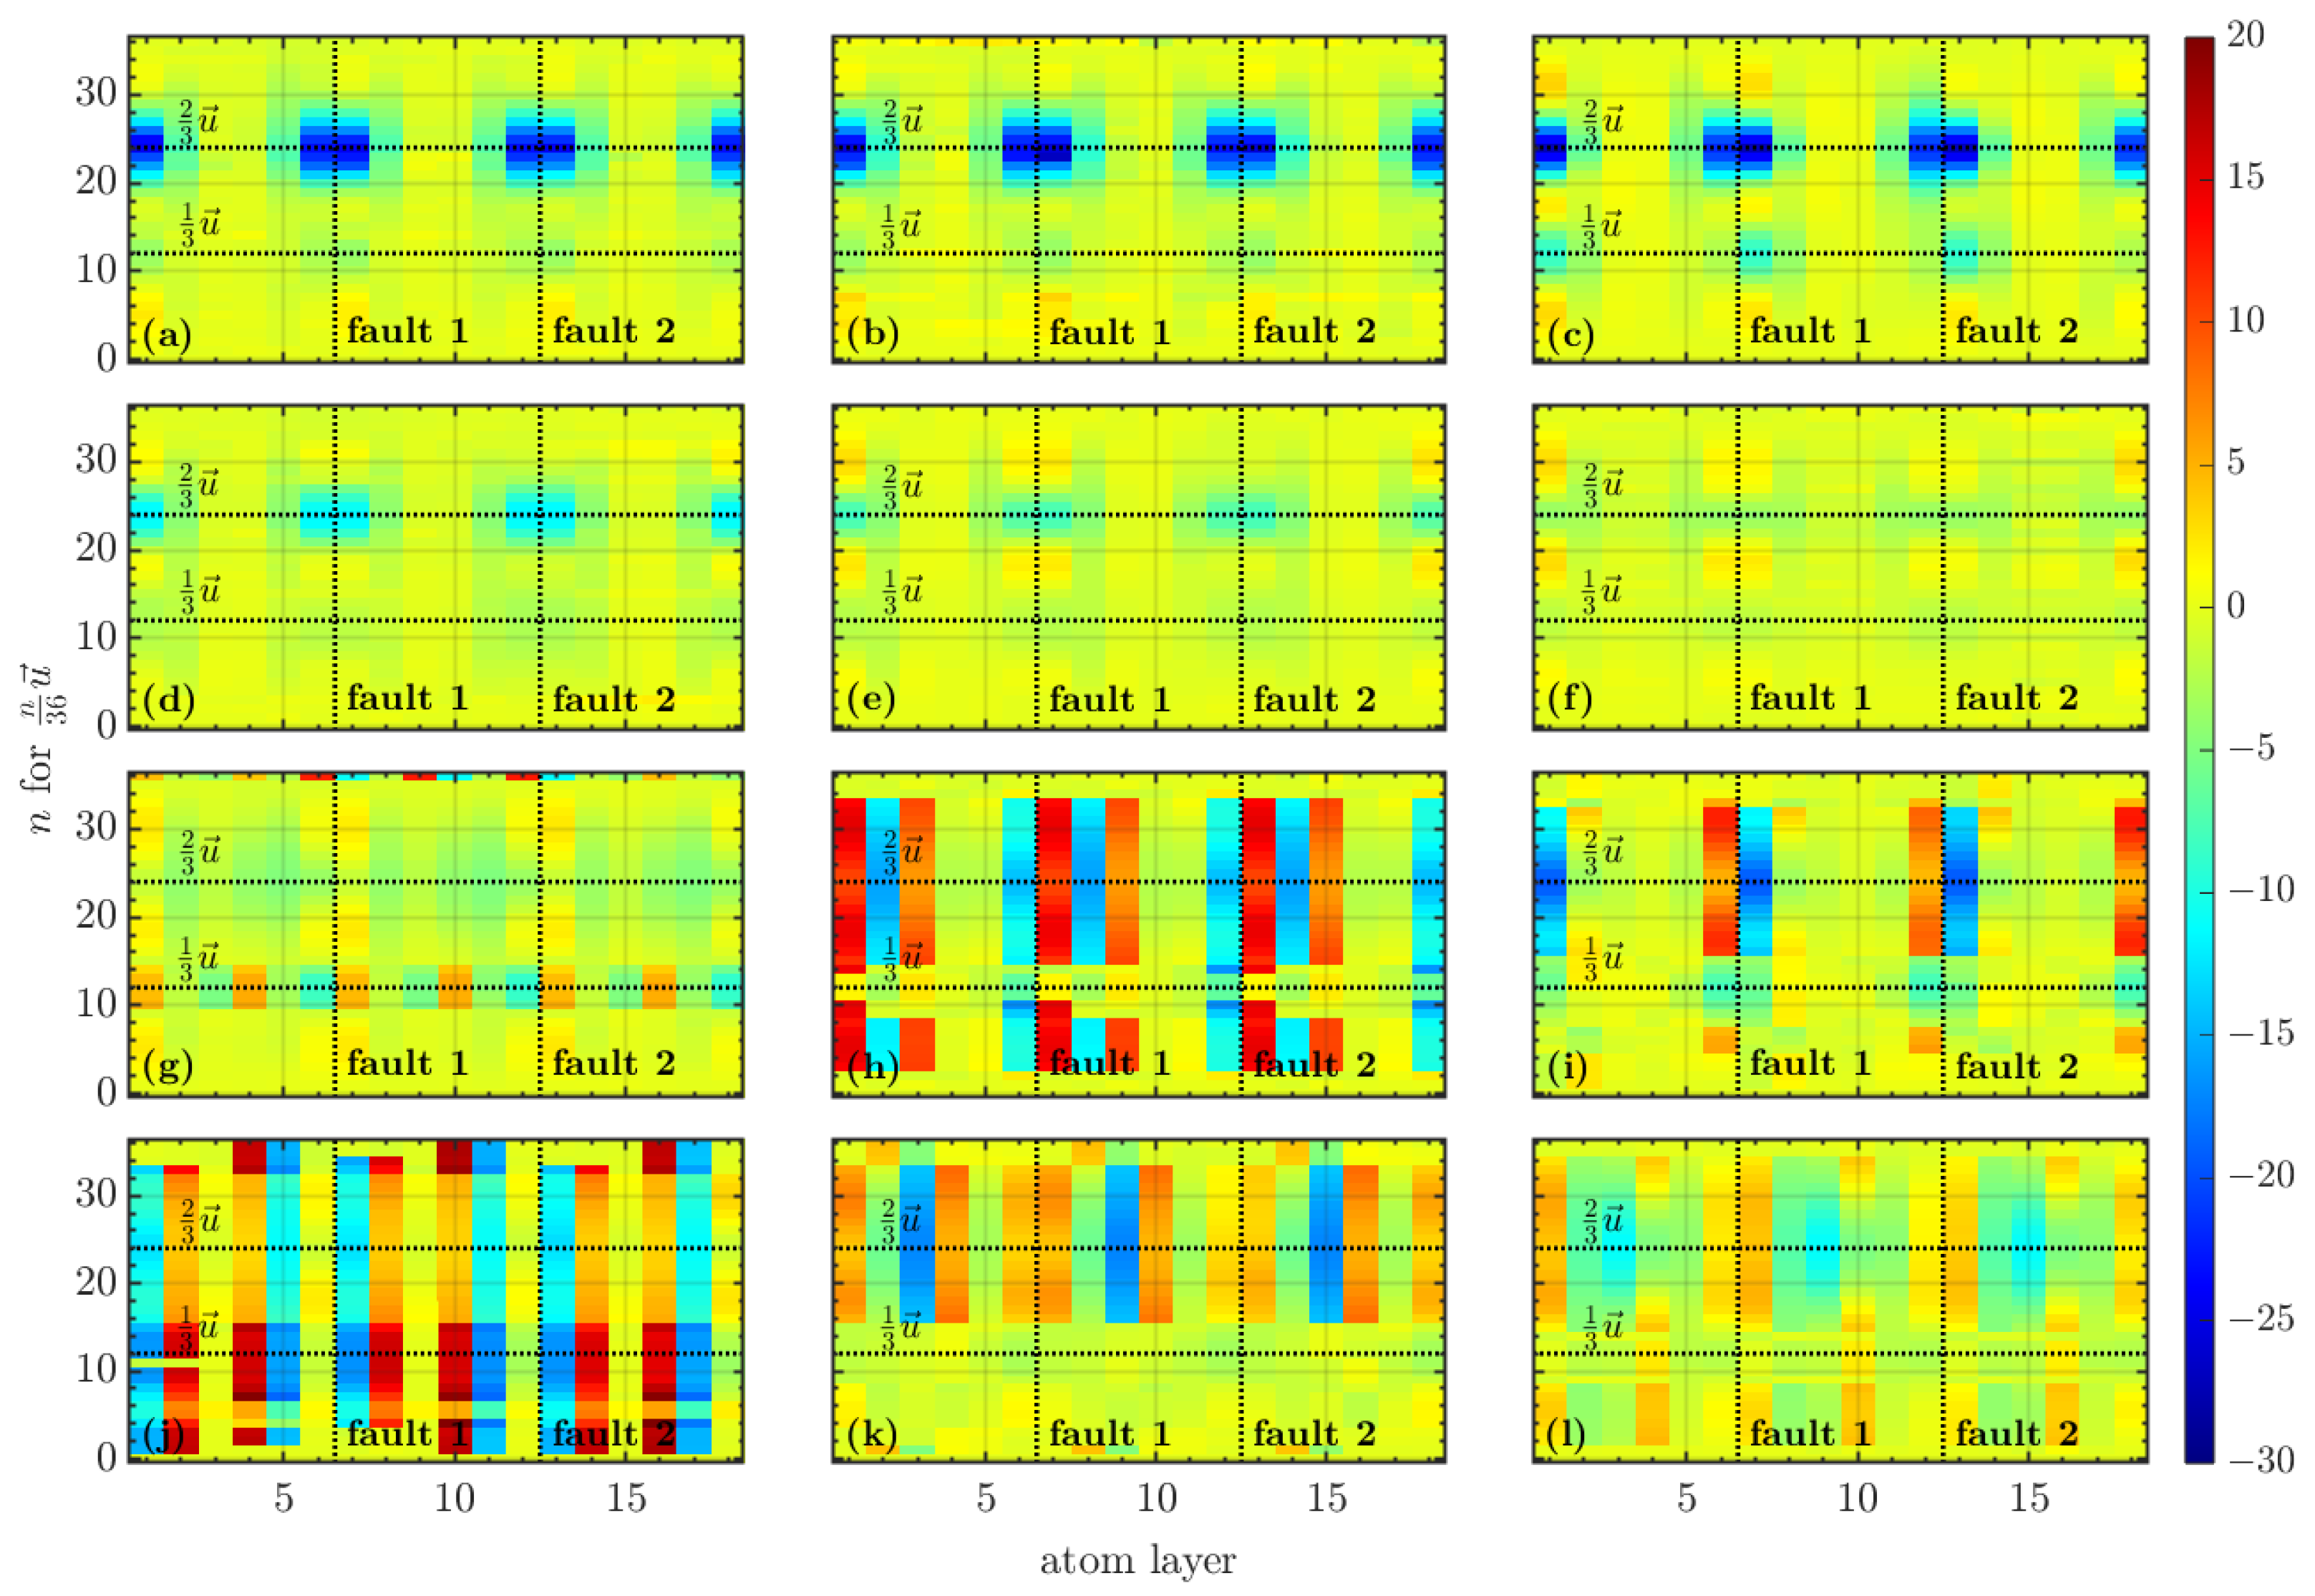
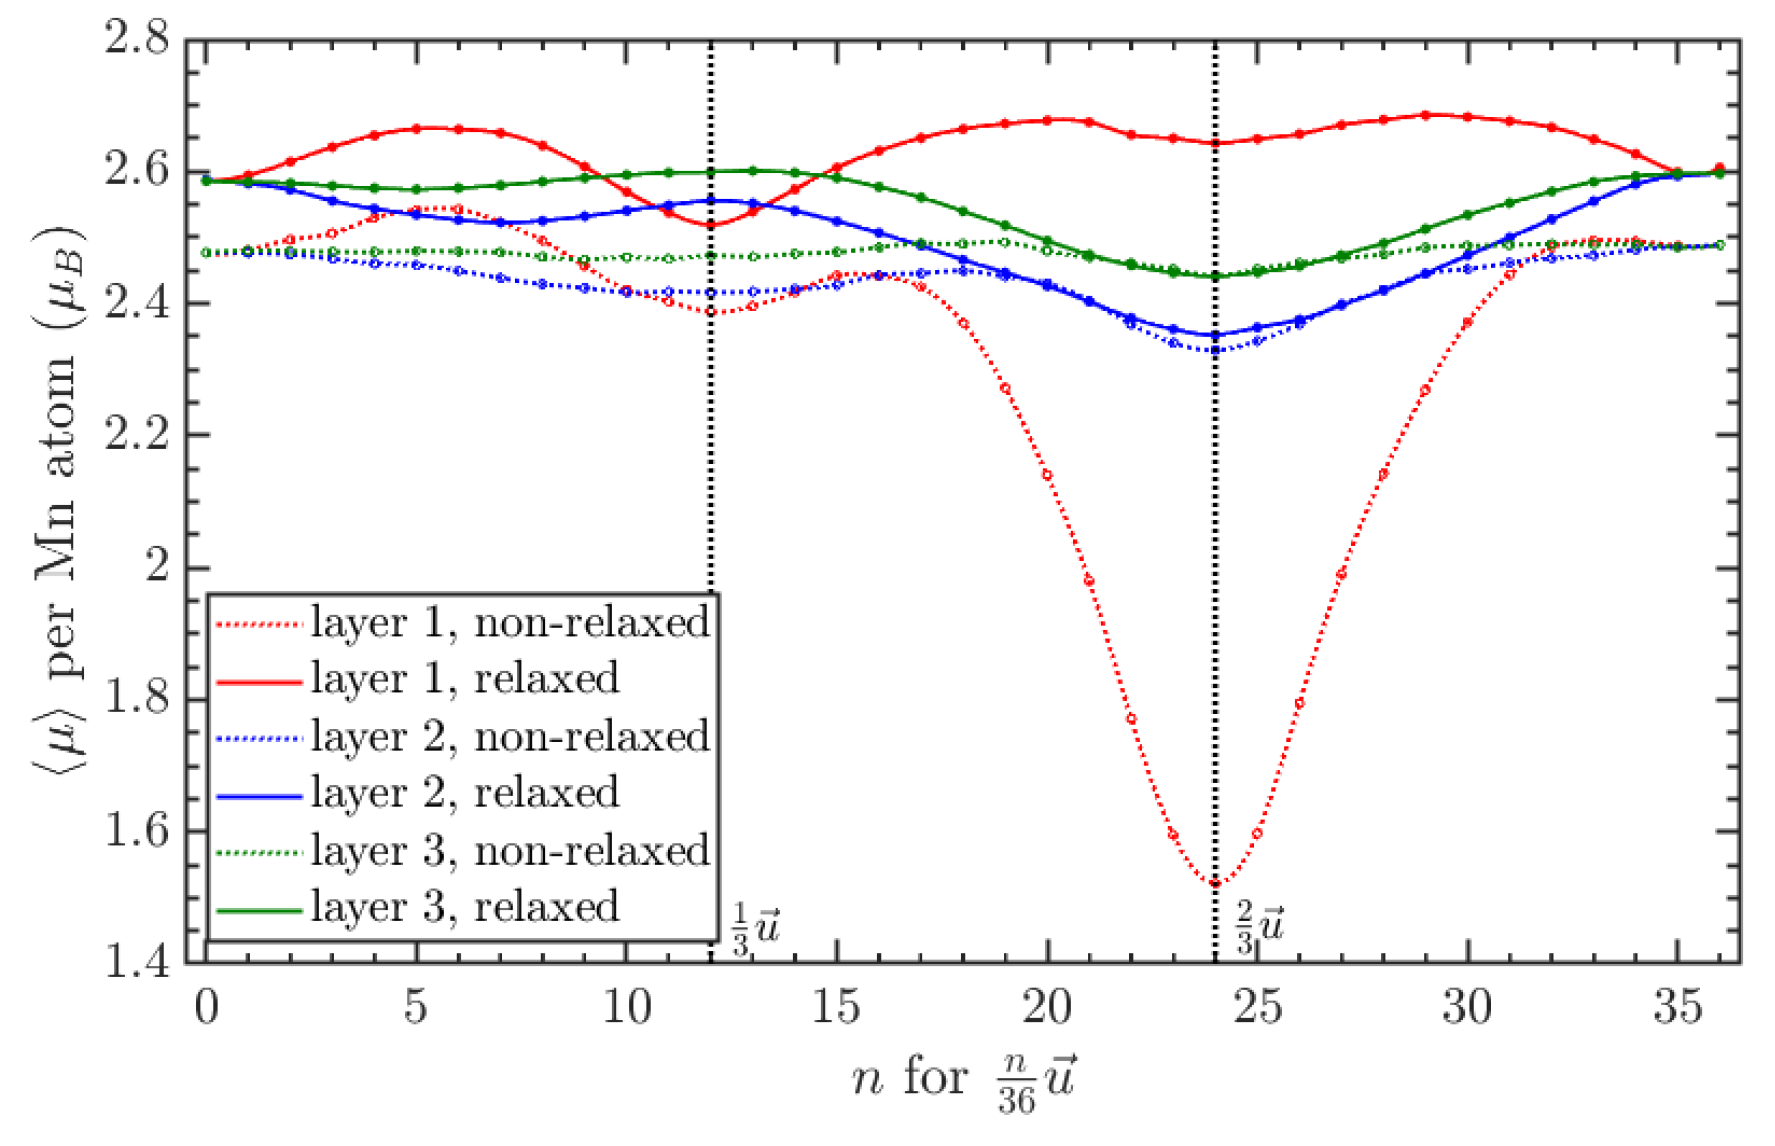
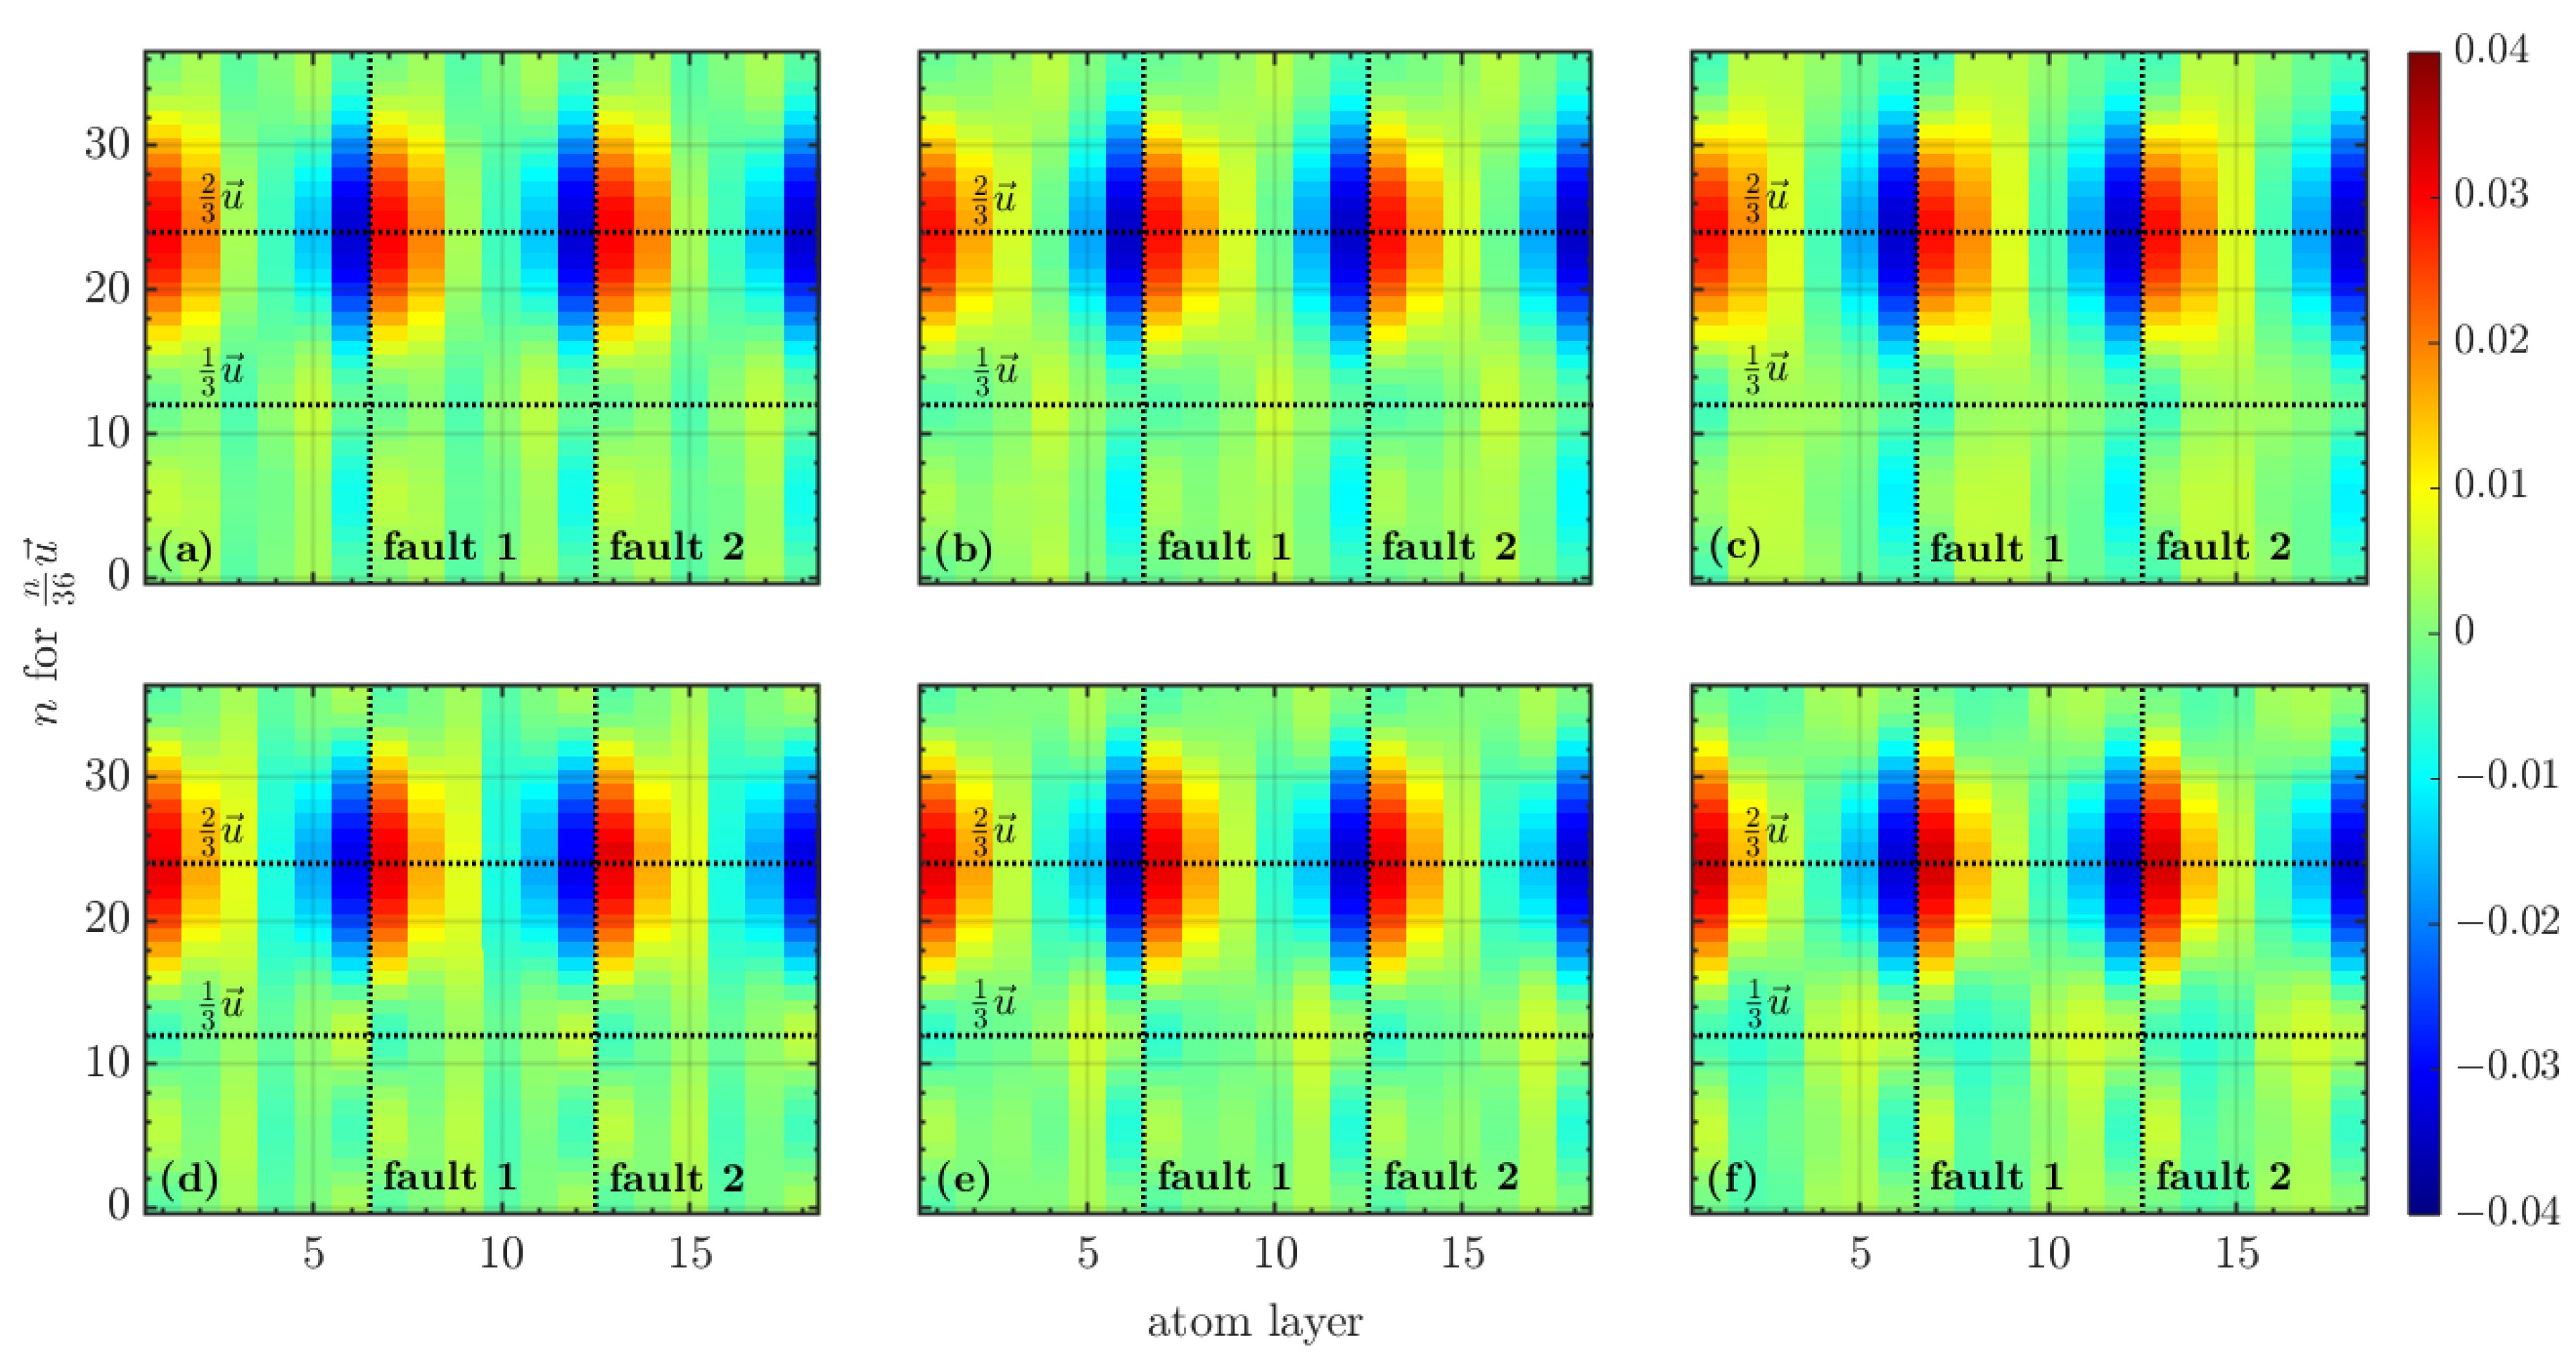
As mentioned previously, the relaxation state of the system, regardless of Mn content, results in changes in the average magnetic moment per atom within the system. This is typically seen as the stabilization of the magnetic moment, with the greatest fluctuation occurring at 2 3 u , as seen in Figure 4, Figure 7 and Figure 8. Upon further analysis, it becomes apparent that the layers with the greatest relative changes in magnetic moment are those nearest to the stacking fault interfaces, shown in Figure 9. When introducing Mn to the system, it becomes readily apparent which layers contain Mn due to the changes in average magnetic moment in those layers, as shown in Figure 10 and Figure 11. This effect demonstrates that, even though the Mn atom is predefined in input files as having a magnetic moment of 0 μ B , it gains a moment as a result of the neighboring Co atoms. Changes in the moment at the stacking fault interface are indicative of a potential relationship between the moment and the SFE (or the fault itself), similar to the reports for the Ni alloy systems provided by Zhao et al. [20]. The influence of the Mn atoms on the average moment per atom can potentially impact such things as the saturation magnetization of the material, so it is beneficial to have this understanding. Our results indicate FM coupling between all atoms within the system, regardless of the location or amount of Mn. The average magnetic moments per atom μ at the fault are provided in Table 2.
To determine the degree to which a magnetic moment of Mn atoms was induced, additional analysis was carried out that focused solely on the Mn atoms, which can be seen in Figure 12 and Figure 13. In most cases, the induced magnetic moment has a strength of more than 2 μ B , which is higher than the typical moment of Co, and in some cases, the induced moment is higher than that of Fe. A significant drop in the magnetic moment is seen when the system is in its most frustrated arrangement ( 2 3 u ). Regardless of Mn concentration, this steep change is greatest when the Mn atom is in the layer nearest to the stacking fault interface. Unlike the average moment per atom over the whole system, relaxation does not stabilize the magnetic moment present in Mn atoms in the same fashion. Rather, it reduces the minute fluctuations that occur as the subcells are shifted along the displacement vector. In the Co 91.6 Mn 8.4 system, interesting behavior is observed when the atoms are in layers that mirror each other (subcell layers two and five, or layers three and four): the average moment for Mn atoms, independent of relaxation state, is nearly identical. With this in mind, it can be determined that the induced moment can be affected by three different factors: the layer in which the Mn atom is inserted, the position along the displacement vector u , and the relaxation state of the system.

3.3. Relaxation

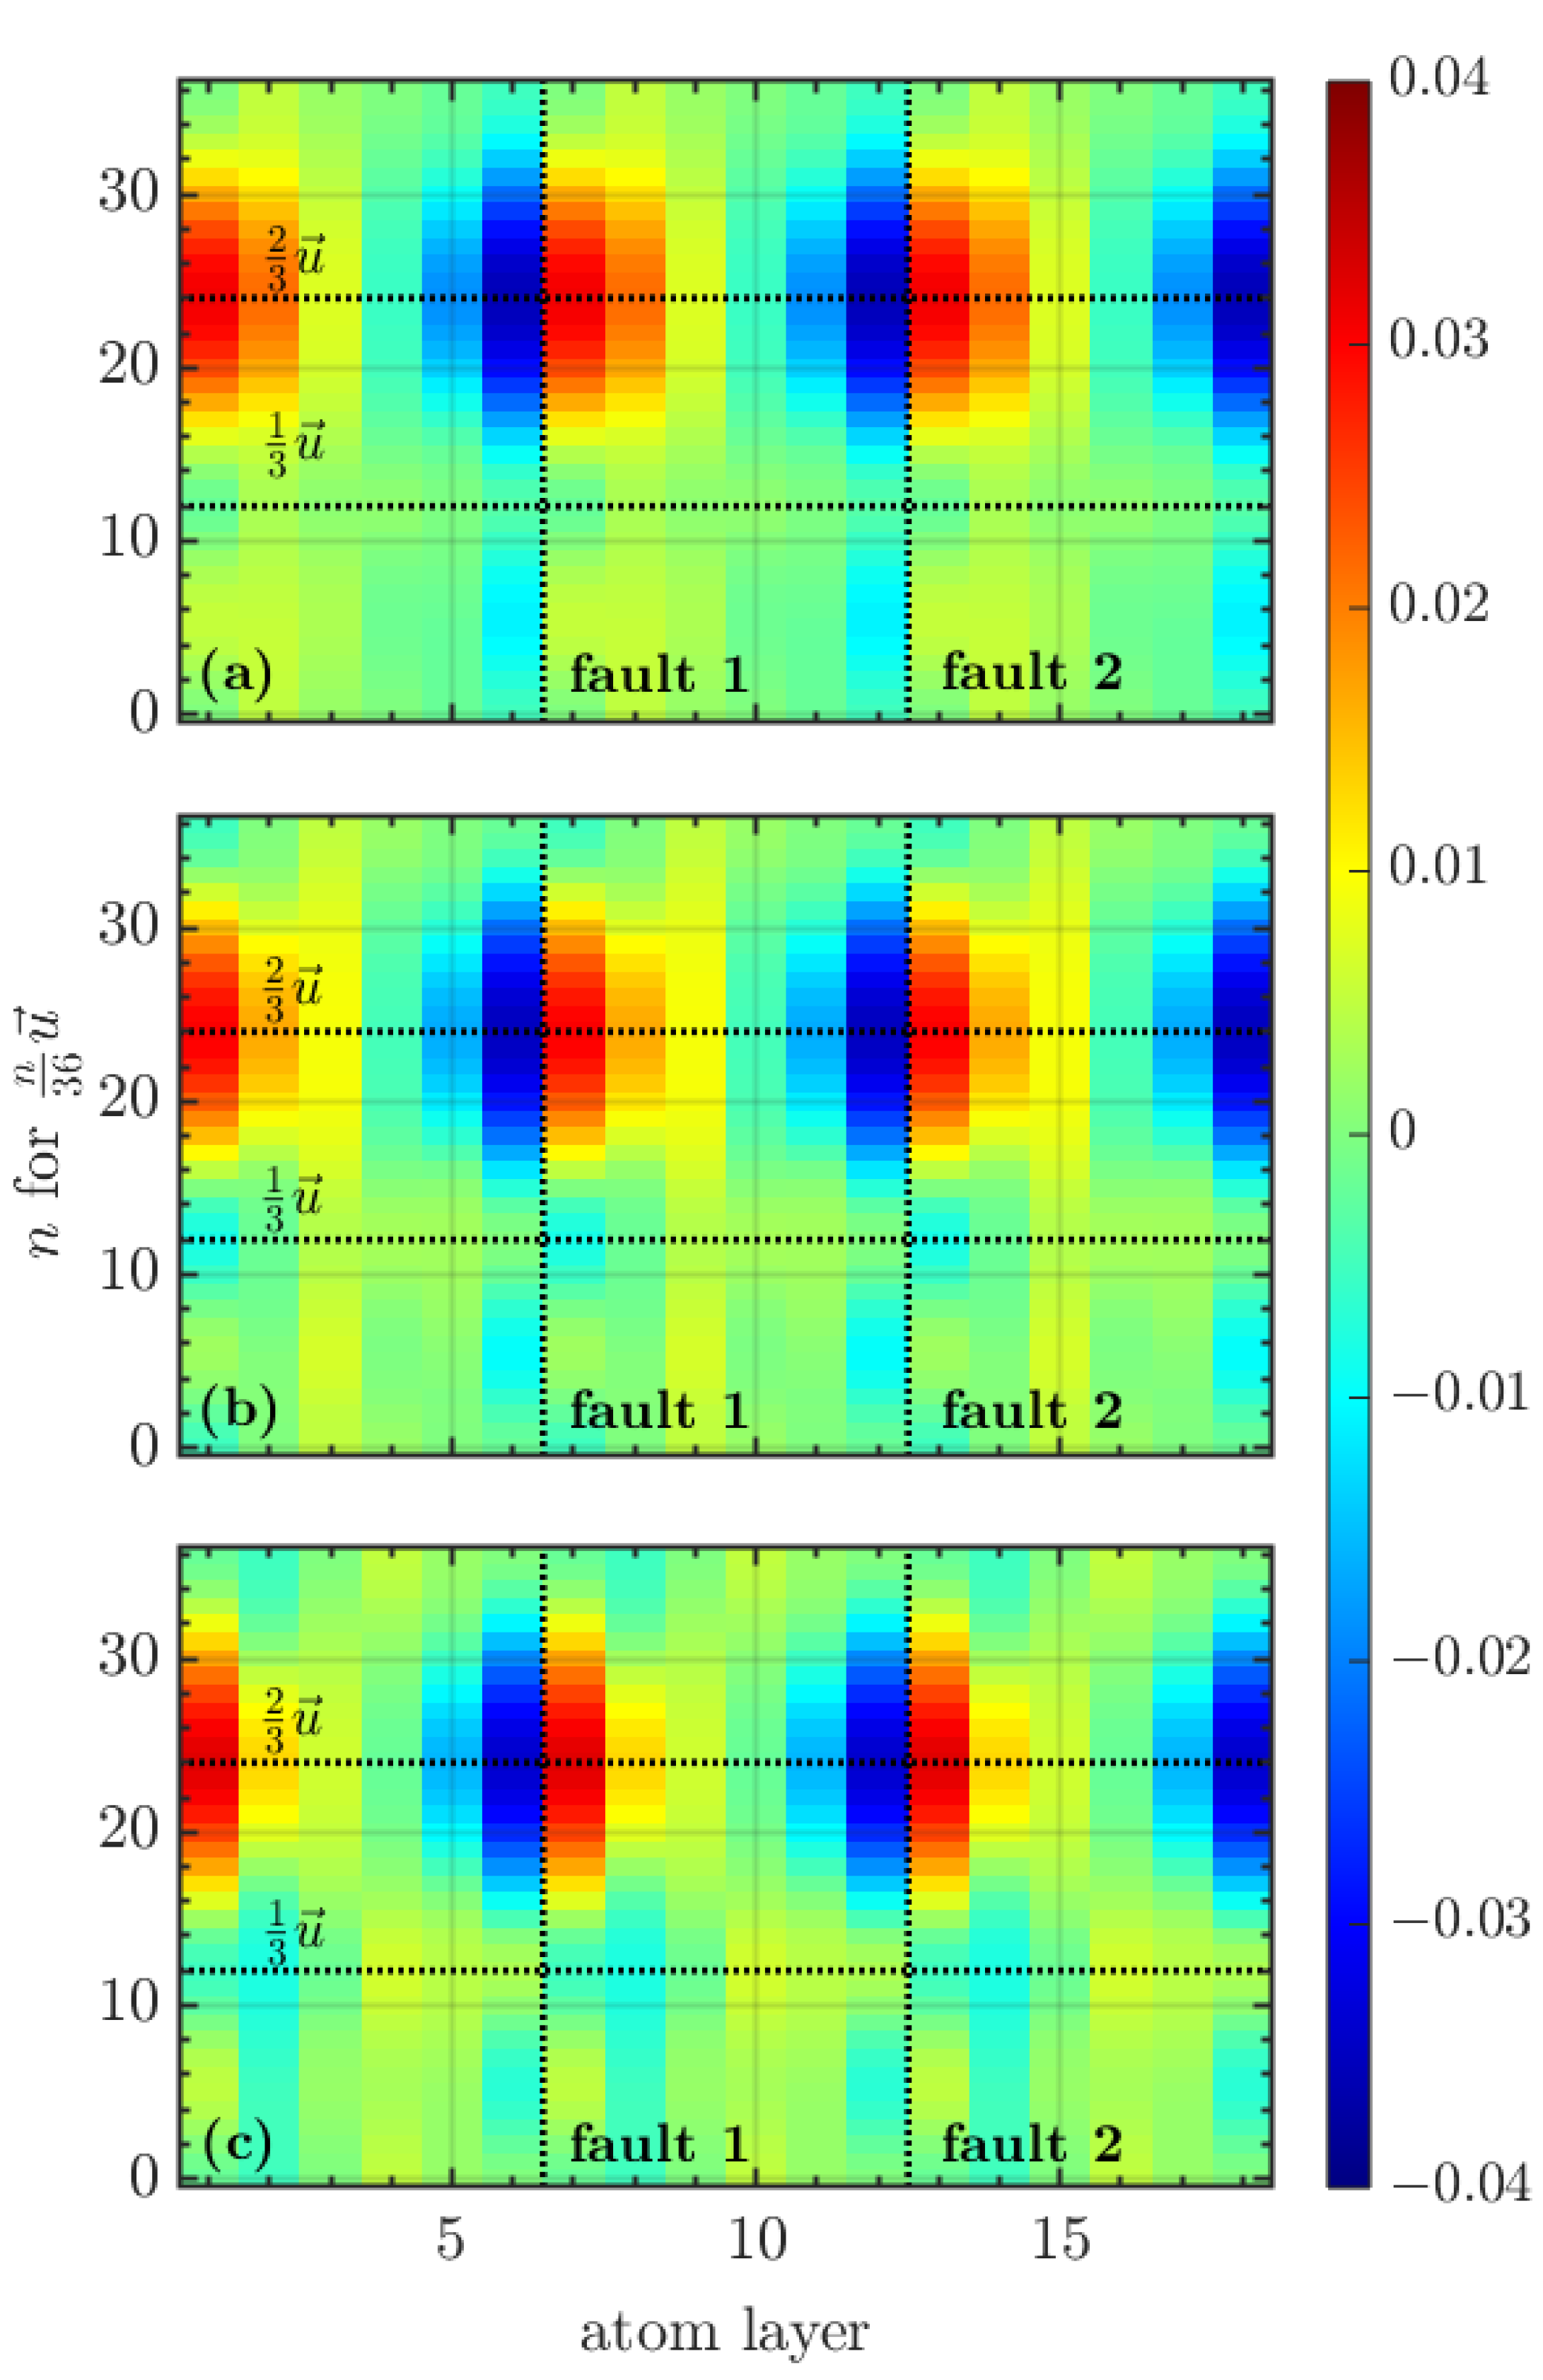
As ionic motion was only permitted to occur in the z direction during relaxation to preserve the stacking faults, it was anticipated that the greatest change in position for atoms would occur at the fault interface. Analysis of the average Δ z per layer of the supercell confirms that this is mostly the case, with the most drastic changes happening when close-packed stacking is violated ( 2 3 u ), as seen in Figure 9, Figure 14 and Figure 15. Regardless of the composition and magnetic state, the patterns present in Δ z are relatively similar. There is occasional variance in the average Δ z per layer depending on the location of Mn atoms in the supercell of order 0.01 Å.
To determine the influence of the Mn atoms on the average Δ z per layer, only the Δ z of the Mn atoms was analyzed. The Δ z per Mn atom for the 4.2 at.% Mn system is shown in Figure 16, and the 8.4 at.% Mn system is shown in Figure 17. This analysis revealed some interesting behavior in both systems. In the former, the case where the Mn atom is one layer removed from the stacking fault interface is where it experiences the greatest Δ z . Interestingly, a peak in Δ z is not observed at 2 3 u when the Mn atom is in the layer adjacent to the stacking fault. Rather, while the Δ z does increase as the dislocation approaches that point, it actually decreases slightly when there is complete atomic overlap. The Δ z of the Mn atom if it is two layers removed from the stacking fault varies very little, with a magnitude less than 0.005 Å.
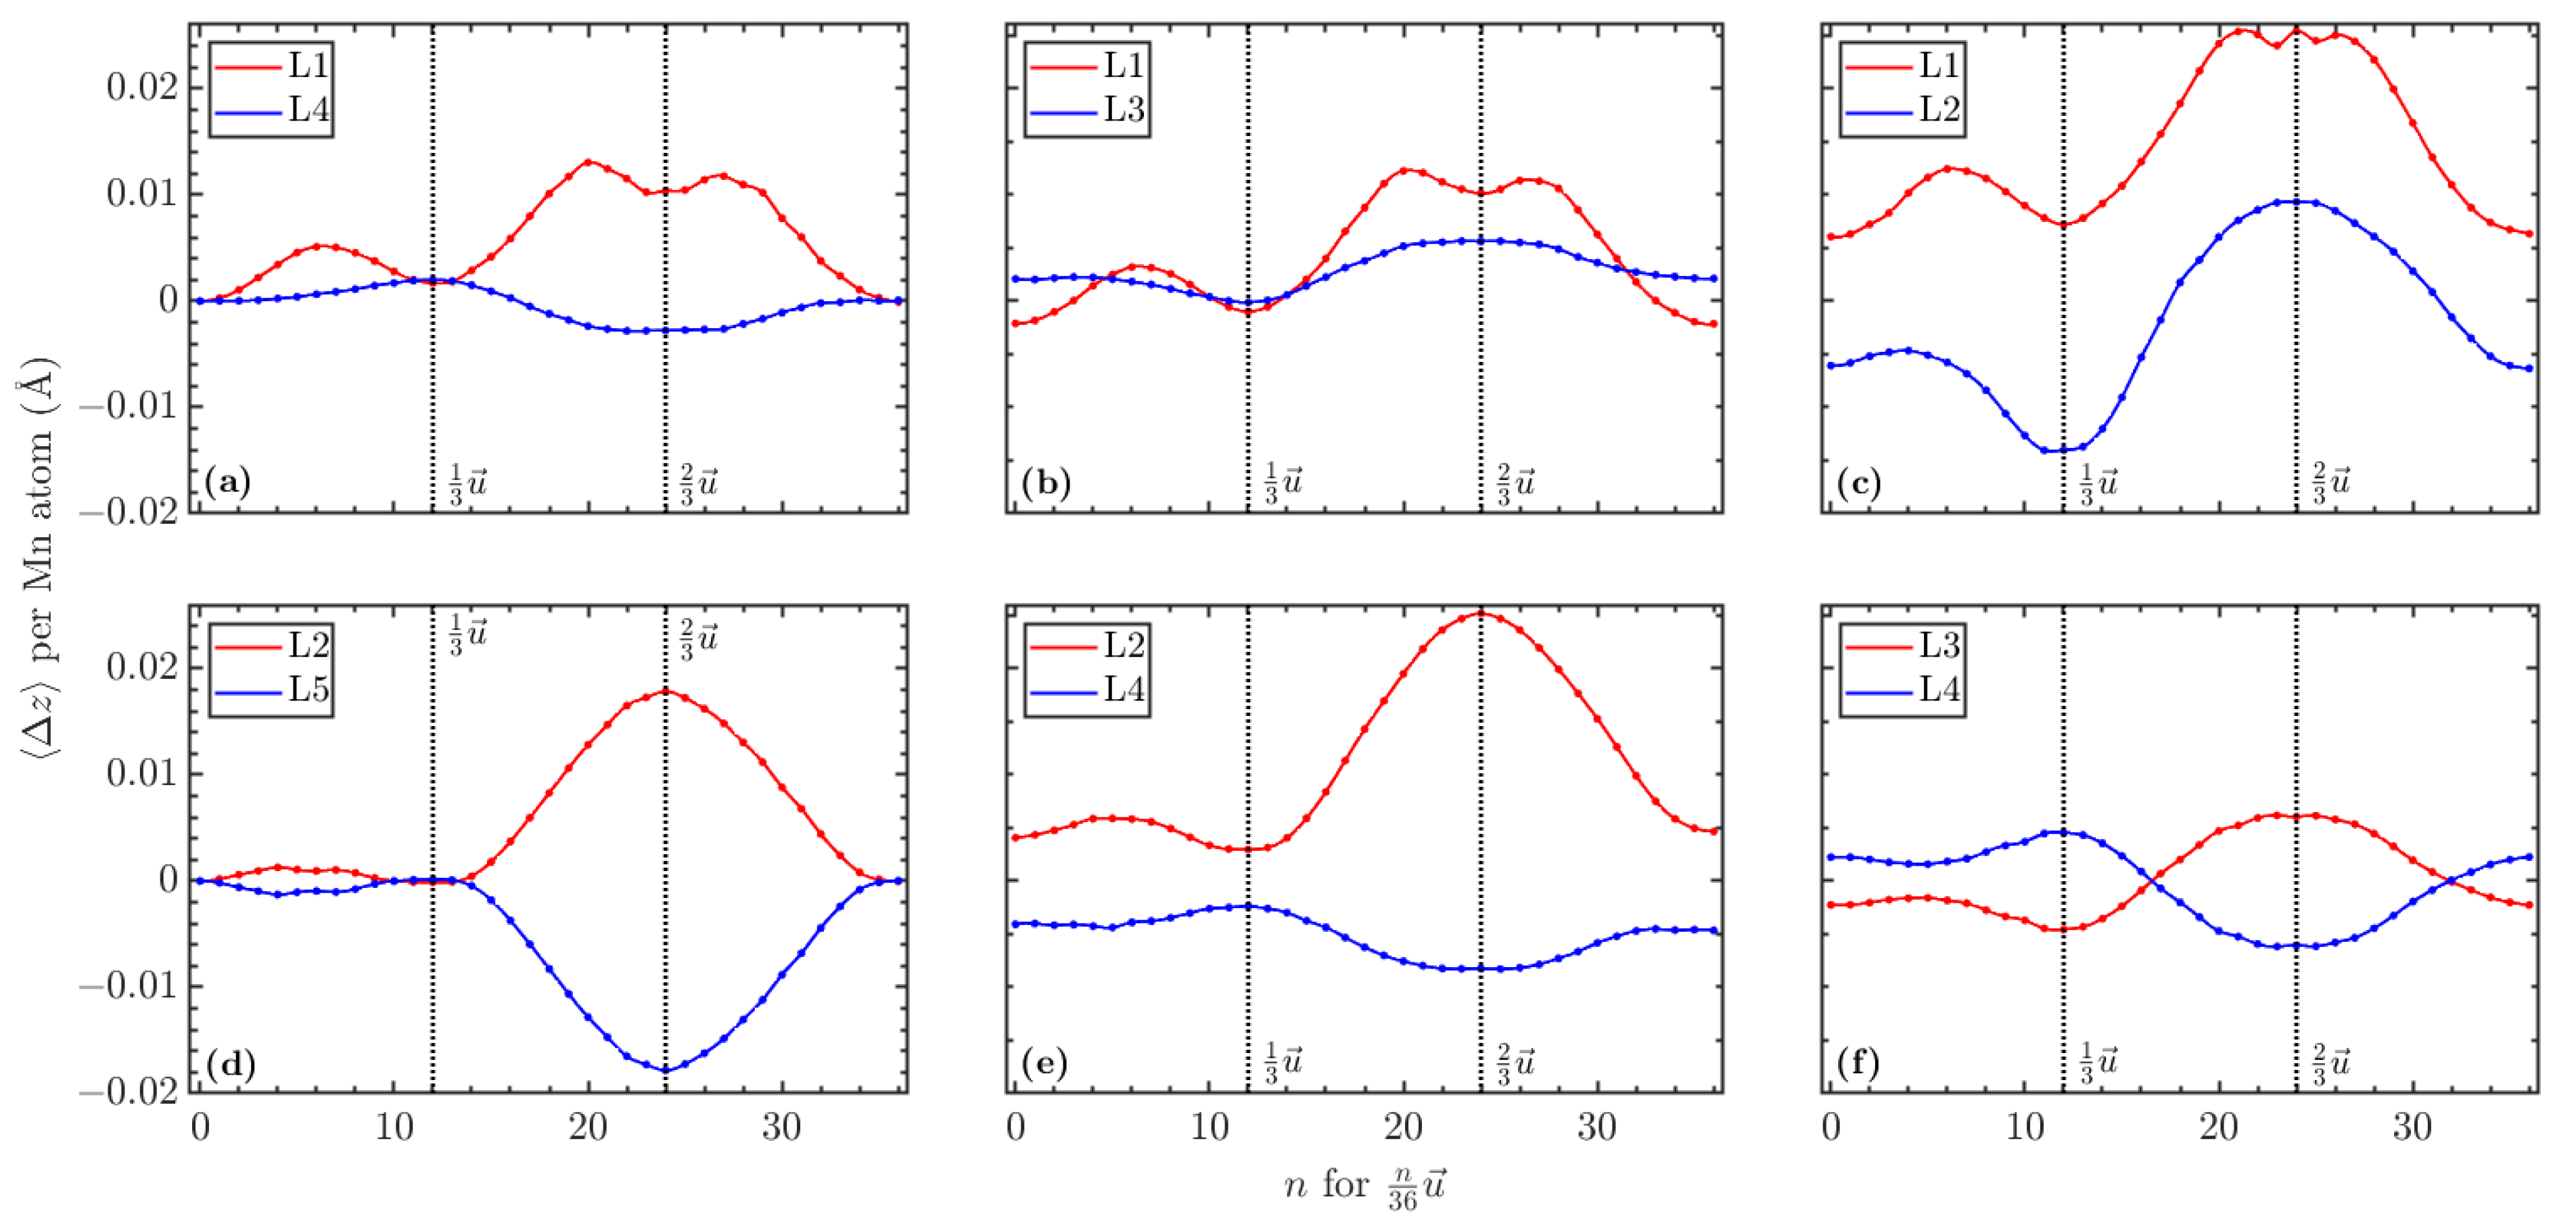
When looking at the Mn displacement in the 8.2 at.% system, it becomes apparent that the greatest fluctuation in displacement occurs if the Mn atom is closer to the stacking fault interface. In most of the cases, the Mn atom nearest to the stacking fault sees a positive Δ z at 2 3 u , while the atom farther away sees a negative Δ z . In cases where the Mn atoms are in layers equidistant from the stacking fault interface, the Δ z values for each atom are approximately equal to each other in magnitude but result in opposite displacement. Such behavior can be attributed to the symmetry present within the supercell. In all FM cases, the effects of relaxation on γ I S F were strongest when the Mn was isolated from the interface.

4. Conclusions

Through DFT calculations, we have determined that Mn doping has a noticeable effect on the local moments and stacking fault energies of FCC Co(Mn) systems. We have verified that the FM phase yields stacking faults that are more stable than those in the NM phase. We found that the substitution of 8.4 at.% Mn will result in a more stable intrinsic fault than for pure Co, indicating an increased likelihood of faulting. In this case, we have determined that the stacking fault is most stable with Mn partitioned away from the fault. One can thus assume that this composition will exhibit a high rate of faulting, which may potentially serve to enhance desirable mechanical properties [47,48]. Additionally, for this configuration, we observed a slight increase in the average magnetic moment per atom when compared to the pure Co system. This has some implications for the saturation magnetization and permeability of the material, given that its intended uses benefit from a higher permeability to reduce energy losses. However, specific determinations cannot be made without knowing the anisotropy of the material. Relaxation calculations indicate that atoms deviate relatively little from their initial locations in systems with an ISF. As there is less energy associated with systems that lack this sort of motion, it is unlikely that this sort of system will seek to lower its energy further by the nucleation of other types of defects. As such, we can infer that we can tailor the γ I S F and μ to suit our needs through doping with Mn.

Author Contributions

Conceptualization, G.B.T., T.M., C.M., R.N. and A.L.; methodology, C.M. and K.C.-P.; software, C.M.; validation, K.C.-P.; formal analysis, K.C.-P.; investigation, K.C.-P.; resources, C.M.; data curation, K.C.-P.; writing—original draft preparation, K.C.-P.; writing—review and editing, P.N., A.K., G.B.T., T.M., C.M., R.N. and A.L.; visualization, K.C.-P.; supervision, G.B.T., T.M., C.M., R.N. and A.L.; project administration, G.B.T., T.M., C.M., R.N. and A.L.; funding acquisition, G.B.T., T.M. and C.M. All authors have read and agreed to the published version of the manuscript.

Funding

Funding for this work was provided by the National Aeronautics and Space Administration under NASA CAN 80NSSC18M0023 and the Alabama Space Grant Consortium under NASA Training Grant NNX15AJ18H.

Institutional Review Board Statement

Not applicable.

Informed Consent Statement

Not applicable.

Data Availability Statement

The raw data generated for this work can be obtained from the corresponding author upon reasonable request.

Acknowledgments

Computational support was provided by the University of Alabama High Performance Computing facilities and staff. R.N. and A.L. would like to acknowledge additional support for this work from the NASA Advanced Air Transport Technology Project, Power and Propulsion Subproject under the leadership of Amy Jankovsky.

Conflicts of Interest

The authors declare no conflict of interest. The funders had no role in the design of the study; in the collection, analyses, or interpretation of data; in the writing of the manuscript; or in the decision to publish the results.

Abbreviations

The following abbreviations are used in this manuscript:
FMFerromagnetic
HCPHexagonal close-packed
FCCFace-centered cubic
SFEStacking fault energy
NMNonmagnetic
DFTDensity functional theory
A(N)NNIAxial (next-)nearest neighbor Ising
ISFIntrinsic stacking fault
VASPVienna ab initio simulation package

References

  1. Welstead, J.; Felder, J.L. Conceptual design of a single-aisle turboelectric commercial transport with fuselage boundary layer ingestion. In Proceedings of the 54th AIAA Aerospace Sciences Meeting, San Diego, CA, USA, 4–8 January 2016; p. 1027. [Google Scholar] [CrossRef]
  2. Gutfleisch, O.; Willard, M.A.; Brück, E.; Chen, C.H.; Sankar, S.; Liu, J.P. Magnetic materials and devices for the 21st century: Stronger, lighter, and more energy efficient. Adv. Mater. 2011, 23, 821–842. [Google Scholar] [CrossRef] [PubMed]
  3. McHenry, M.; Laughlin, D. Nano-scale materials development for future magnetic applications. Acta Mater. 2000, 48, 223–238. [Google Scholar] [CrossRef]
  4. Herzer, G. Nanocrystalline soft magnetic alloys. Handb. Magn. Mater. 1997, 10, 415–462. [Google Scholar] [CrossRef]
  5. Leary, A.M.; Ohodnicki, P.R.; McHenry, M.E. Soft magnetic materials in high-frequency, high-power conversion applications. JOM 2012, 64, 772–781. [Google Scholar] [CrossRef]
  6. Srivastava, A.; Cole, K.; Wadsworth, A.; Burton, T.; Mewes, C.; Mewes, T.; Thompson, G.B.; Noebe, R.D.; Leary, A.M. Broadband characterization of stress induced anisotropy in nanocomposite Co74.6Fe2.7Mn2.7Nb4Si2B14. J. Magn. Magn. Mater. 2020, 500, 166307. [Google Scholar] [CrossRef]
  7. Koenig, A.G.; Tweddle, D.; Leary, A.; Noebe, R.; Mewes, C.; Mewes, T.; Thompson, G.B. Evaluating the effect of Mn composition on chemical partitioning in Co(78−x)Fe2MnxB14Si2Nb4 magnetic amorphous nanocomposites. J. Alloys Compd. 2021, 875, 159976. [Google Scholar] [CrossRef]
  8. Nakarmi, P.; Koenig, A.; Tweddle, D.; Cole-Piepke, K.; Leary, A.; Noebe, R.; Thompson, G.; Mewes, C.; Mewes, T. Magnetization dynamics of amorphous and nanocomposite CoFeMnNbSiB films with the addition of excess cobalt and boron. J. Magn. Magn. Mater. 2022, 564, 170029. [Google Scholar] [CrossRef]
  9. Byerly, K.; Ohodnicki, P.; Moon, S.; Leary, A.; Keylin, V.; McHenry, M.; Simizu, S.; Beddingfield, R.; Yu, Y.; Feichter, G.; et al. Metal Amorphous Nanocomposite (MANC) Alloy Cores with Spatially Tuned Permeability for Advanced Power Magnetics Applications. JOM 2018, 70, 879–891. [Google Scholar] [CrossRef]
  10. Owen, E.A.; Jones, D.M. Effect of Grain Size on the Crystal Structure of Cobalt. Proc. Phys. Soc. Sect. B 1954, 67, 456–466. [Google Scholar] [CrossRef]
  11. Stepanyuk, V.; Zeller, R.; Dederichs, P.; Mertig, I. Electronic structure and magnetic properties of dilute Co alloys with transition-metal impurities. Phys. Rev. B 1994, 49, 5157–5164. [Google Scholar] [CrossRef]
  12. Achmad, T.L.; Fu, W.; Chen, H.; Zhang, C.; Yang, Z.G. Effect of strain on the intrinsic stacking fault energy of fcc Co: A first-principles study. J. Mater. Sci. 2018, 53, 10217–10230. [Google Scholar] [CrossRef]
  13. Tian, L.Y.; Lizárraga, R.; Larsson, H.; Holmström, E.; Vitos, L. A first principles study of the stacking fault energies for fcc Co-based binary alloys. Acta Mater. 2017, 136, 215–223. [Google Scholar] [CrossRef]
  14. Iskounen, N.; Dubos, P.A.; Fajoui, J.; Coret, M.; Moya, M.J.; Girault, B.; Barrier, N.; Bruzy, N.; Hug, E.; Gloaguen, D. Experimental Investigation of Allotropic Transformation of Cobalt: Influence of Temperature Cycle, Mechanical Loading and Starting Microstructure. Metall. Mater. Trans. A 2021, 52, 1477–1491. [Google Scholar] [CrossRef]
  15. Zheng, G. Molecular dynamics and first-principles studies on the deformation mechanisms of nanostructured cobalt. J. Alloys Compd. 2010, 504S, S467–S471. [Google Scholar] [CrossRef]
  16. Limmer, K.; Medvedeva, J.; Van Aken, D.; Medvedeva, N. Ab initio simulation of alloying effect on stacking fault energy in fcc Fe. Comput. Mater. Sci. 2015, 99, 253–255. [Google Scholar] [CrossRef]
  17. de la Peña O’Shea, V.A.; Moreira, I.d.P.R.; Roldán, A.; Illas, F. Electronic and magnetic structure of bulk cobalt: The α, β, and ϵ-phases from density functional theory calculations. J. Chem. Phys. 2010, 133, 024701. [Google Scholar] [CrossRef]
  18. Moruzzi, V.; Marcus, P.; Schwarz, K.; Mohn, P. Ferromagnetic phases of bcc and fcc Fe, Co, and Ni. Phys. Rev. B 1986, 34, 1784–1791. [Google Scholar] [CrossRef]
  19. Men’shikov, A.; Takzeĭ, G.; Dorofeev, Y.; Kazantsev, V.; Kostyshin, A.; Sych, I. The magnetic phase diagram of cobalt-manganese alloys. J. Exp. Theor. Phys. 1985, 89, 1269–1279. [Google Scholar]
  20. Zhao, S.; Osetsky, Y.; Stocks, G.; Zhang, Y. Local-environment dependence of stacking fault energies in concentrated solid-solution alloys. NPJ Comput. Mater. 2019, 5, 13. [Google Scholar] [CrossRef]
  21. Hu, Q.M.; Yang, R. Basal-plane stacking fault energy of hexagonal close-packed metals based on the Ising model. Acta Mater. 2013, 61, 1136–1145. [Google Scholar] [CrossRef]
  22. Lu, G.; Kioussis, N.; Bulatov, V.V.; Kaxiras, E. Generalized-stacking-fault energy surface and dislocation properties of aluminum. Phys. Rev. B 2000, 62, 3099–3108. [Google Scholar] [CrossRef]
  23. Yan, J.; Zhang, Z.; Yu, H.; Li, K.; Hu, Q.; Yang, J.; Zhang, Z. Effects of pressure on the generalized stacking fault energy and twinning propensity of face-centered cubic metals. J. Alloys Compd. 2021, 866, 158869. [Google Scholar] [CrossRef]
  24. Achmad, T.L.; Fu, W.; Chen, H.; Zhang, C.; Yang, Z.G. Effect of solute segregation on the intrinsic stacking fault energy of Co-based binary alloys: A first-principles study. J. Alloys Compd. 2018, 748, 328–337. [Google Scholar] [CrossRef]
  25. Achmad, T.L.; Fu, W.; Chen, H.; Zhang, C.; Yang, Z.G. Effects of alloying elements concentrations and temperatures on the stacking fault energies of Co-based alloys by computational thermodynamic approach and first-principles calculations. J. Alloys Compd. 2017, 694, 1265–1279. [Google Scholar] [CrossRef]
  26. Achmad, T.L.; Fu, W.; Chen, H.; Zhang, C.; Yang, Z.G. First-principles calculations of generalized-stacking-fault-energy of Co-based alloys. Comput. Mater. Sci. 2016, 121, 86–96. [Google Scholar] [CrossRef]
  27. Dodaran, M.S.; Guo, S.; Khonsari, M.M.; Shamsaei, N.; Shao, S. A theoretical calculation of stacking fault energy of Ni alloys: The effects of temperature and composition. Comput. Mater. Sci. 2021, 191, 110326. [Google Scholar] [CrossRef]
  28. Muzyk, M.; Pakiela, Z.; Kurzydlowski, K. Generalized stacking fault energy in magnesium alloys: Density functional theory calculations. Scr. Mater. 2012, 66, 219–222. [Google Scholar] [CrossRef]
  29. Bleskov, I.; Hickel, T.; Neugebauer, J.; Ruban, A. Impact of local magnetism on stacking fault energies: A first-principles investigation for fcc iron. Phys. Rev. B 2016, 93, 214115. [Google Scholar] [CrossRef]
  30. Wu, X.; Wang, R.; Wang, S. Generalized-stacking-fault energy and surface properties for HCP metals: A first-principles study. Appl. Surf. Sci. 2010, 256, 3409–3412. [Google Scholar] [CrossRef]
  31. Su, Y.; Xu, S.; Beyerlein, I.J. Density functional theory calculations of generalized stacking fault energy surfaces for eight face-centered cubic transition metals. J. Appl. Phys. 2019, 126, 105112. [Google Scholar] [CrossRef]
  32. Denteneer, P.J.H.; van Haeringen, W. Stacking-fault energies in semiconductors from first-principles calculations. J. Phys. C Solid State Phys. 1987, 20, L883. [Google Scholar] [CrossRef]
  33. Cheng, C.; Needs, R.J.; Heine, V.; Churcher, N. Confirmation of an ANNNI-Like Model for Polytypism in SiC. Europhys. Lett. 1987, 3, 475. [Google Scholar] [CrossRef]
  34. Ning, X.; Ye, H. Experimental determination of the intrinsic stacking-fault energy of SiC crystals. J. Phys. Condens. Matter 1990, 2, 10223. [Google Scholar] [CrossRef]
  35. Aerts, E.; Delavignette, P.; Siems, R.; Amelinckx, S. Stacking Fault Energy in Silicon. J. Appl. Phys. 1962, 33, 3078. [Google Scholar] [CrossRef]
  36. Reed, R.; Schramm, R. Relationship between stacking-fault energy and x-ray measurements of stacking-fault probability and microstrain. J. Appl. Phys. 1974, 45, 4705. [Google Scholar] [CrossRef]
  37. Gallagher, P. The Influence of Alloying, Temperature, and Related Effects on the Stacking Fault Energy. Metall. Trans. 1970, 1, 2429–2461. [Google Scholar] [CrossRef]
  38. Liu, S.; Wu, Y.; Wang, H.; He, J.; Liu, J.; Chen, C.; Liu, X.; Wang, H.; Lu, Z. Stacking fault energy of face-centered-cubic high entropy alloys. Intermetallics 2018, 93, 269–273. [Google Scholar] [CrossRef]
  39. Murnaghan, F.D. Finite Deformations of an Elastic Solid. Am. J. Math. 1937, 59, 235–260. [Google Scholar] [CrossRef]
  40. Gholizadeh, H.; Draxl, C.; Puschnig, P. The influence of interstitial carbon on the γ-surface in austenite. Acta Mater. 2013, 61, 341–349. [Google Scholar] [CrossRef]
  41. Hirth, J.; Lothe, J. Theory of Dislocations, Reprint Edition. 1992. Available online: https://www.researchgate.net/publication/249656382_The_Theory_of_Dislocations (accessed on 4 May 2023).
  42. Kresse, G.; Furthmüller, J. Efficient iterative schemes for Ab Initio Total-Energy Calc. Using a Plane-Wave Basis Set. Phys. Rev. B 1996, 54, 11169. [Google Scholar] [CrossRef]
  43. Kresse, G.; Joubert, D. From ultrasoft pseudopotentials to the projector augmented-wave method. Phys. Rev. B 1999, 59, 1758. [Google Scholar] [CrossRef]
  44. Perdew, J.P.; Burke, K.; Ernzerhof, M. Generalized Gradient Approximation Made Simple. Phys. Rev. Lett. 1997, 77, 3685–3688. [Google Scholar] [CrossRef] [PubMed]
  45. Pulay, P. Convergence acceleration of iterative sequences. the case of scf iteration. Chem. Phys. Lett. 1980, 73, 393–398. [Google Scholar] [CrossRef]
  46. Monkhorst, H.J.; Pack, J.D. Special points for Brillouin-zone integrations. Phys. Rev. B 1976, 13, 5188–5192. [Google Scholar] [CrossRef]
  47. Chandran, M.; Sondhi, S. First-principle calculation of stacking fault energies in Ni and Ni-Co alloy. J. Appl. Phys. 2011, 109, 103525. [Google Scholar] [CrossRef]
  48. Zhao, Y.; Zhu, Y.; Liao, X.; Horita, Z.; Langdon, T. Tailoring stacking fault energy for high ductility and high strength in ultrafine grained Cu and its alloy. Appl. Phys. Lett. 2006, 89, 121906. [Google Scholar] [CrossRef]
Figure 1. Energy curves for face-centered cubic (FCC) Co in both a ferromagnetic (FM) and nonmagnetic (NM) state. Lattice compression of approximately 6.3 at.% from our determined FM lattice constant of a 0 3.514 Å causes the NM state to become more energetically favorable than the FM state. The value a i n t indicates the lattice parameter at which the FM and NM phases have the same energy.
Magnetochemistry 09 00138 g001
Figure 2. (a) Depiction of atoms in an FCC arrangement, with the 111 plane as the basal plane. Additionally depicted are the vectors a = x e ^ x and b = x 2 e ^ x + x 3 2 e ^ y used to designate the supercell used in calculations, along with the dislocation vector u = a + b . (b) defines key points along the dislocation vector u , an approach used by Bleskov et al. [29] and Su et al. [31].
Magnetochemistry 09 00138 g002
Figure 3. The triple-shift scheme used for construction of the supercell. Each of the three cells is shifted in a direction that belongs to the 211 family, but that, when summed, result in zero net displacement. This allows for simulating a stacking fault while maintaining periodicity for DFT calculations. A, B, and C indicate the different layers of the FCC stacking sequence.
Magnetochemistry 09 00138 g003
Figure 4. (a) The stacking fault energies (SFEs) along u for FM and NM pure Co systems in both relaxed and non-relaxed states. The NM system has a higher energy at 1 3 u but a lower energy and broader peak at 2 3 u . (b) The average magnetic moment per atom in the pure Co system for both relaxed and non-relaxed states. The system attempts to adjust its magnetic behavior to reduce overall energy.
Magnetochemistry 09 00138 g004
Figure 5. The SFEs along u for FM and NM systems with 4.2 at.% Mn compared to pure Co in both the (a) non-relaxed and (b) relaxed states. While this system exhibits similar behavior to the pure Co system, the position of the Mn atom in relation to the stacking fault influences the intensity of the reduction in energy at 1 3 u .
Magnetochemistry 09 00138 g005
Figure 6. The SFE curves for the 8.4 at.% Mn systems in both the (a) non-relaxed and (b) relaxed states. The behavior is similar to that of the 4.2 at.% Mn systems in that the positioning of the Mn atoms influences the deviation of the SFE from that of the pure Co system.
Magnetochemistry 09 00138 g006
Figure 7. (a) The SFEs along u for the FM 4.2 at.% Mn system, in both a relaxed and non-relaxed state. Relaxation has the greatest effect on the SFE at 2 3 u . (b) The average magnetic moment per atom in the 4.2 at.% Mn system, for both relaxed and non-relaxed states. The system attempts to adjust its magnetic behavior to reduce overall energy. The average moment varies depending on the layer in which the Mn atom is inserted.
Magnetochemistry 09 00138 g007
Figure 8. (a) The SFEs along u for the FM 8.4 at.% Mn system in both a relaxed and non-relaxed state. Relaxation has the greatest effect on the SFE at 2 3 u . (b) The average magnetic moment per atom in the 8.4 at.% Mn system for both relaxed and non-relaxed states. The system attempts to adjust its magnetic behavior to reduce overall energy. The influence of Mn positioning is more apparent than for the 4.2 at.% systems.
Magnetochemistry 09 00138 g008
Figure 9. (a) The normalized magnetic moment per layer (%) for the non-relaxed pure Co system. (b) The normalized magnetic moment per layer (%) for the relaxed pure Co system. Relaxation causes more apparent changes in the magnetic behavior at the fault interface when the system is geometrically frustrated, such as at 2 3 u . In both cases, normalization is with respect to the moments at a displacement of 0 u . (c) The average Δ z per layer (Å) for the FM pure Co system. In an unfavorable stacking arrangement, relaxation causes the atoms to move away from each other at the fault interface. This effect dissipates farther from the stacking fault.
Magnetochemistry 09 00138 g009
Figure 10. (ac) The normalized magnetic moment per layer (%) for the non-relaxed 4.2 at.% Mn systems. (df) The normalized magnetic moment per layer (%) for the relaxed 4.2 at.% Mn systems. (a,d) show the moments when the Mn atom is in the layer adjacent to the fault interface, (b,e) show the moments when the Mn atom is one layer removed from the fault interface, and (c,f) show the moments when the Mn atom is two layers removed. Normalization is with respect to the moment at a displacement of 0 u . Relaxation causes changes in the moments such that it becomes apparent which layers contain Mn atoms.
Magnetochemistry 09 00138 g010
Figure 11. (af) The normalized magnetic moment per layer (%) for the 8.4 at.% Mn systems in the non-relaxed state. (gl) The normalized magnetic moment per layer (%) for the 8.4 at.% Mn systems in the relaxed state. (a,g) show the moments for Mn in layers 1 and 4, (b,h) the moments for layers 1 and 3, (c,i) the moments for layers 1 and 2, (d,j) the moments for layers 2 and 5, (e,k) the moments for layers 2 and 4, and (f,l) the moments for layers 3 and 4. Relaxation not only indicates the layers in which there are Mn atoms but also shows the changes in moments for Co atoms in neighboring layers.
Magnetochemistry 09 00138 g011
Figure 12. The average magnetic moment per Mn atom in the 4.2 at.% Mn systems in both the relaxed and non-relaxed states. Despite having a defined moment of 0 μ B at the start of calculations, the Mn atom gains a moment that varies depending on its proximity to the fault interface. For these systems, relaxation increases the induced moment in the Mn atoms regardless of proximity to the interface.
Magnetochemistry 09 00138 g012
Figure 13. The average magnetic moment per Mn atom in the 8.4 at.% Mn systems in both the relaxed and non-relaxed states. (a) shows this for Mn in layers 1 and 4, (b) for layers 1 and 3, (c) for layers 1 and 2, (d) for layers 2 and 5, (e) for layers 2 and 4, and (f) for layers 3 and 4. As with the 4.2 at.% Mn system, the Mn atoms were assigned a moment of 0 μ B at the start of the calculations. In situations where the arrangement is mirrored, as in (d,f), the two Mn atoms have the same induced moment.
Magnetochemistry 09 00138 g013
Figure 14. The average Δ z per layer (Å) for the FM 4.2 at.% Mn systems where the Mn atom is (a) adjacent to the interface, (b) one layer removed from the interface, or (c) two layers removed from the interface. The location of the Mn atom affects how rapidly the fluctuations in atomic displacement dissipate throughout the supercell.
Magnetochemistry 09 00138 g014
Figure 15. The average Δ z per layer (Å) for the FM 8.4 at.% Mn systems. (a) shows the Δ z for Mn in layers 1 and 4, (b) for layers 1 and 3, (c) for layers 1 and 2, (d) for layers 2 and 5, (e) for layers 2 and 4, and (f) for layers 3 and 4. As with the 4.2 at.% Mn system, the location of Mn atoms influences how shifts in atomic positions propagate throughout the supercell.
Magnetochemistry 09 00138 g015
Figure 16. The average Δ z per Mn atom (Å) of the 4.2 at.% Mn systems in both the FM and NM states. The magnetic state of the system has an obvious influence on the positional changes of the Mn atoms, indicating that the system is attempting to attain a lower energy both through physical displacement and changes in magnetic moment.
Magnetochemistry 09 00138 g016
Figure 17. The average Δ z per Mn atom (Å) of the 8.4 at.% Mn systems in the FM state. (a) shows the Δ z for Mn in layers 1 and 4, (b) for layers 1 and 3, (c) for layers 1 and 2, (d) for layers 2 and 5, (e) for layers 2 and 4, and (f) for layers 3 and 4. The location of the Mn atom in relation to the stacking fault interface and other Mn atoms influences the degree to which the atoms shift during relaxation. As with the magnetic moments in these cases, a similar effect is observed where situations resulting in a mirror arrangement result in displacements that are equal in magnitude but opposite in direction.
Magnetochemistry 09 00138 g017
Table 1. The SFE γ S F for the local minimum occurring at 1 3 u of all systems, including some determined values from [13,15,26]. The effect on the SFE varies depending on the quantity and position of Mn within the system. Negative values for γ S F are indicative of the faulted structure being more stable than the parent phase. Fields populated with “–” indicate no value reported by that work.
γ SF (mJ/m 2 ) at ISF
SystemFM, Non-Rel.FM, Rel.NM, Non-Rel.NM, Rel.
Co−112.23−118.77133.25132.90
1Mn, layer 1−18.38−21.6672.9672.38
1Mn, layer 2−70.45−77.17111.02113.61
1Mn, layer 3−104.79−118.25146.53149.36
2Mn, layers 1,4−16.40−18.9379.5482.09
2Mn, layers 1,3−21.73−26.9475.7582.19
2Mn, layers 1,21.89−1.6240.4047.08
2Mn, layers 2,5−26.28−27.0485.9492.93
2Mn, layers 2,4−75.91−87.27108.93102.26
2Mn, layers 3,4−116.62−129.67145.51147.27
Co [13]−106.2
Co [26]0.15
Co (hcp) [15]≈75
Co-9 at.% Mn [26]4.57
Co-9 at.% Cr [13]≈−150
Co-9 at.% Cr [26]−25.78
Table 2. The average magnetic moment μ for the local minimum occurring at 1 3 u of all FM systems. The average moment per atom varies as a result of the strength of the induced moment in the Mn atoms, which in turn varies depending on the atom’s location within the supercell.
μ ( μ B ) per Atom at ISF
SystemNon-RelaxedRelaxed
Co1.5851.583
1Mn, layer 11.6051.608
1Mn, layer 21.6081.614
1Mn, layer 31.6111.614
2Mn, layers 1,41.6331.641
2Mn, layers 1,31.6391.630
2Mn, layers 1,21.5441.560
2Mn, layers 2,51.6351.642
2Mn, layers 2,41.6021.604
2Mn, layers 3,41.5611.579
Disclaimer/Publisher’s Note: The statements, opinions and data contained in all publications are solely those of the individual author(s) and contributor(s) and not of MDPI and/or the editor(s). MDPI and/or the editor(s) disclaim responsibility for any injury to people or property resulting from any ideas, methods, instructions or products referred to in the content.