
MRI Quantitative Evaluation of Muscle Fatty Infiltration


 , , ,
, , ,
Abstract
1. Introduction
2. Chemical-Shift MR Imaging
3. MR Spectroscopy
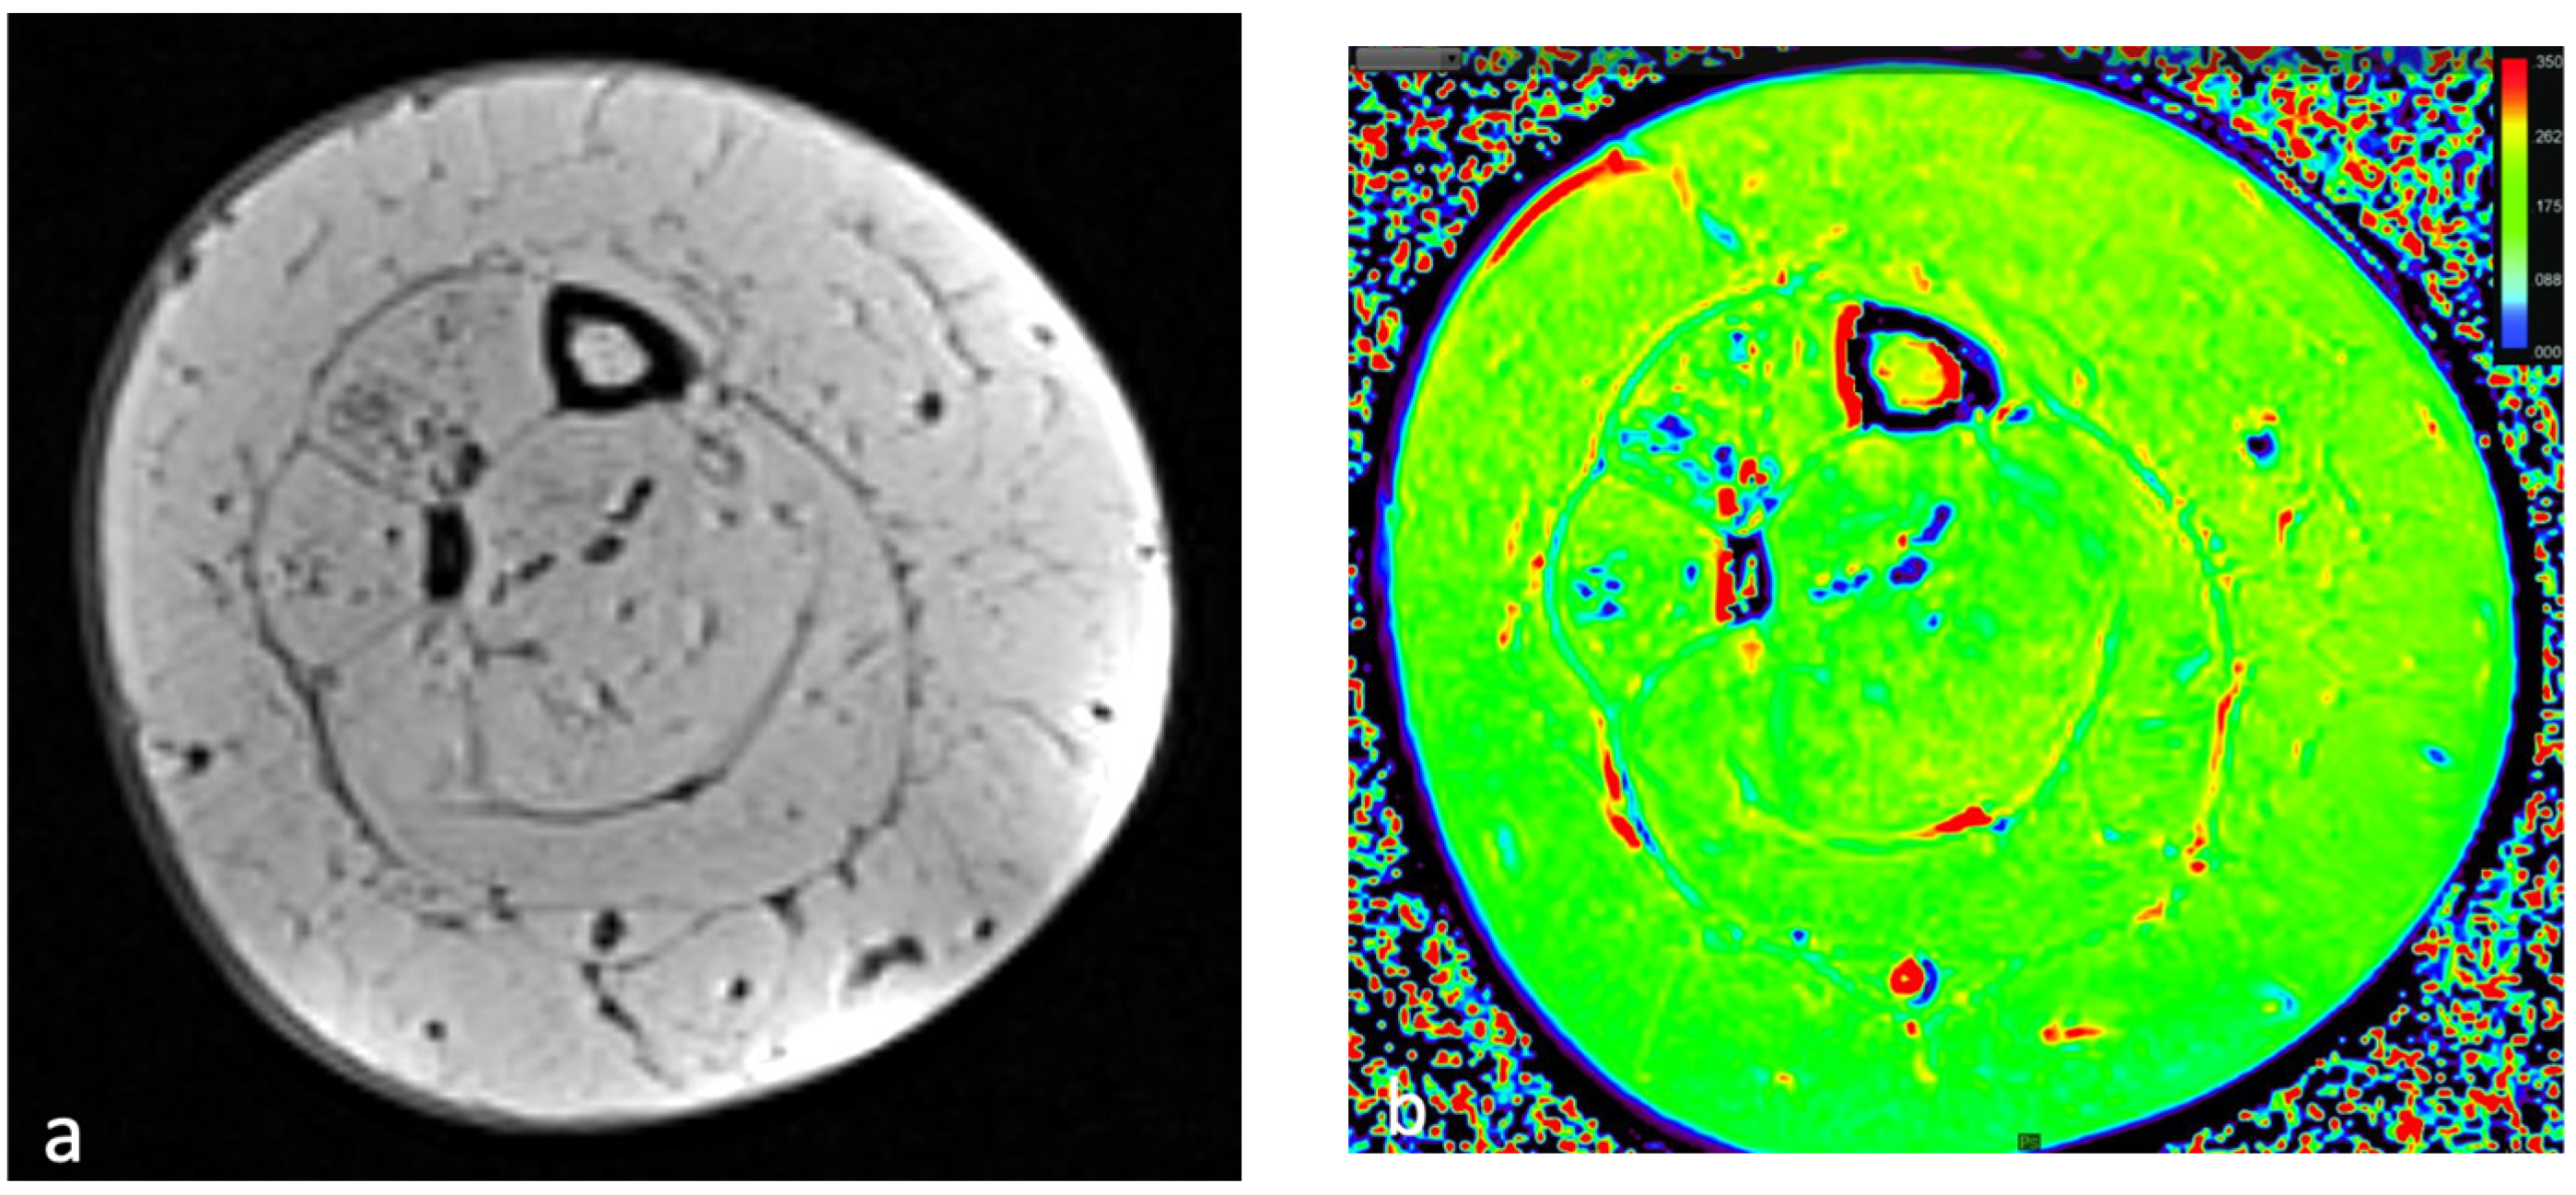
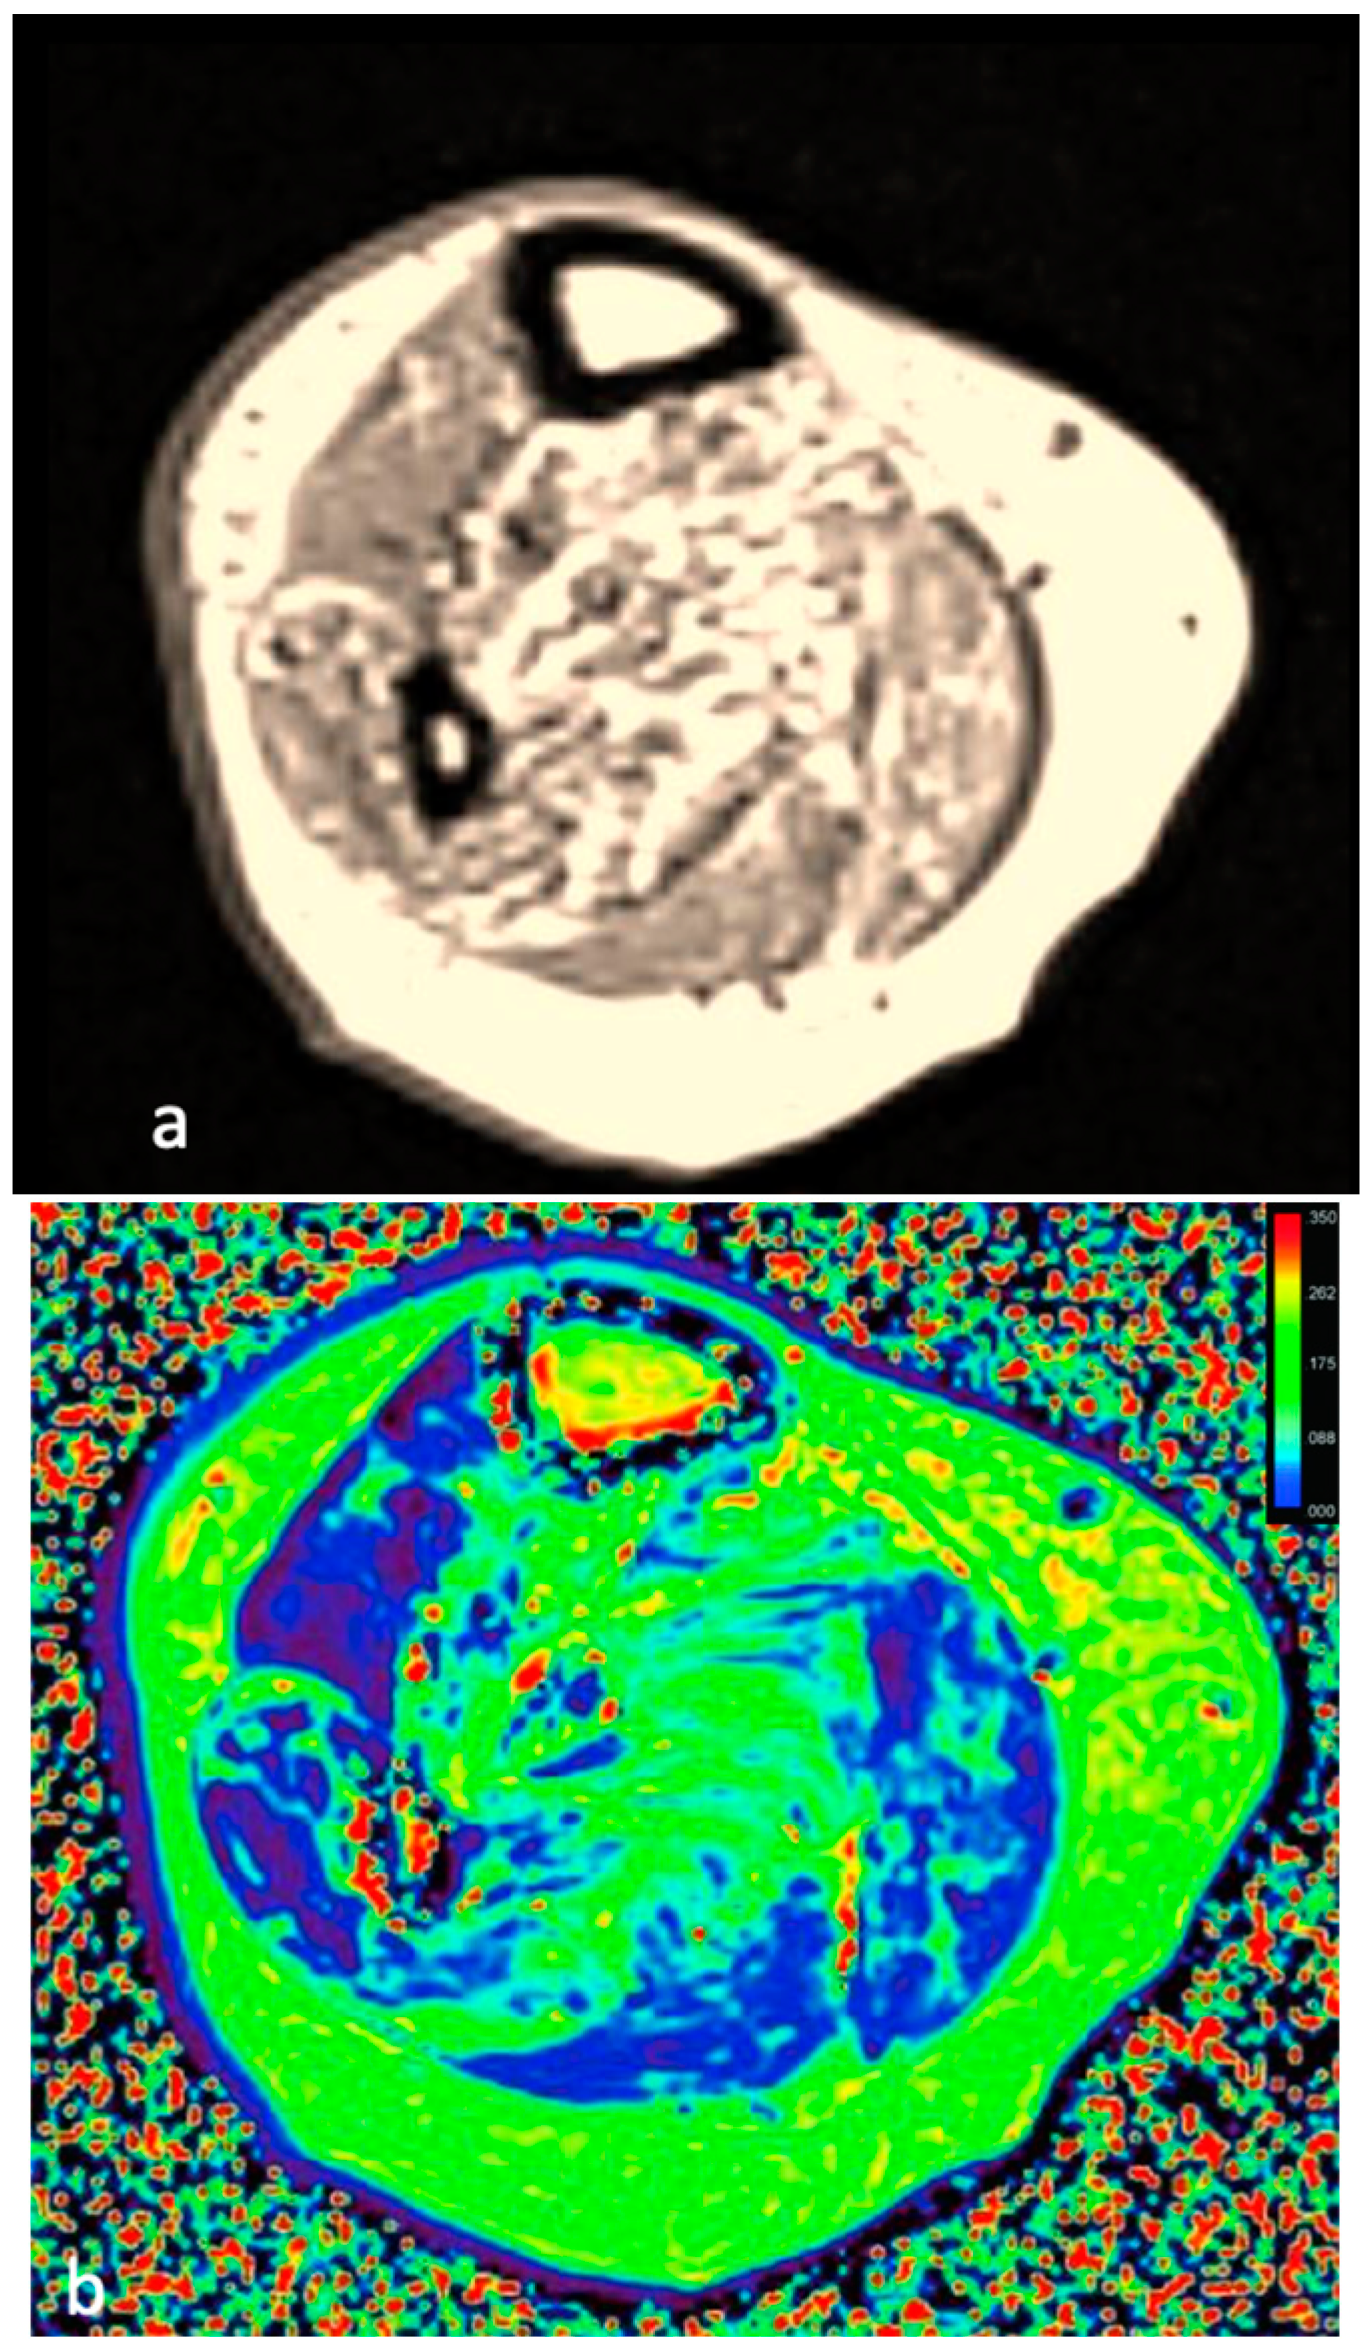
4. Relaxometry Mapping
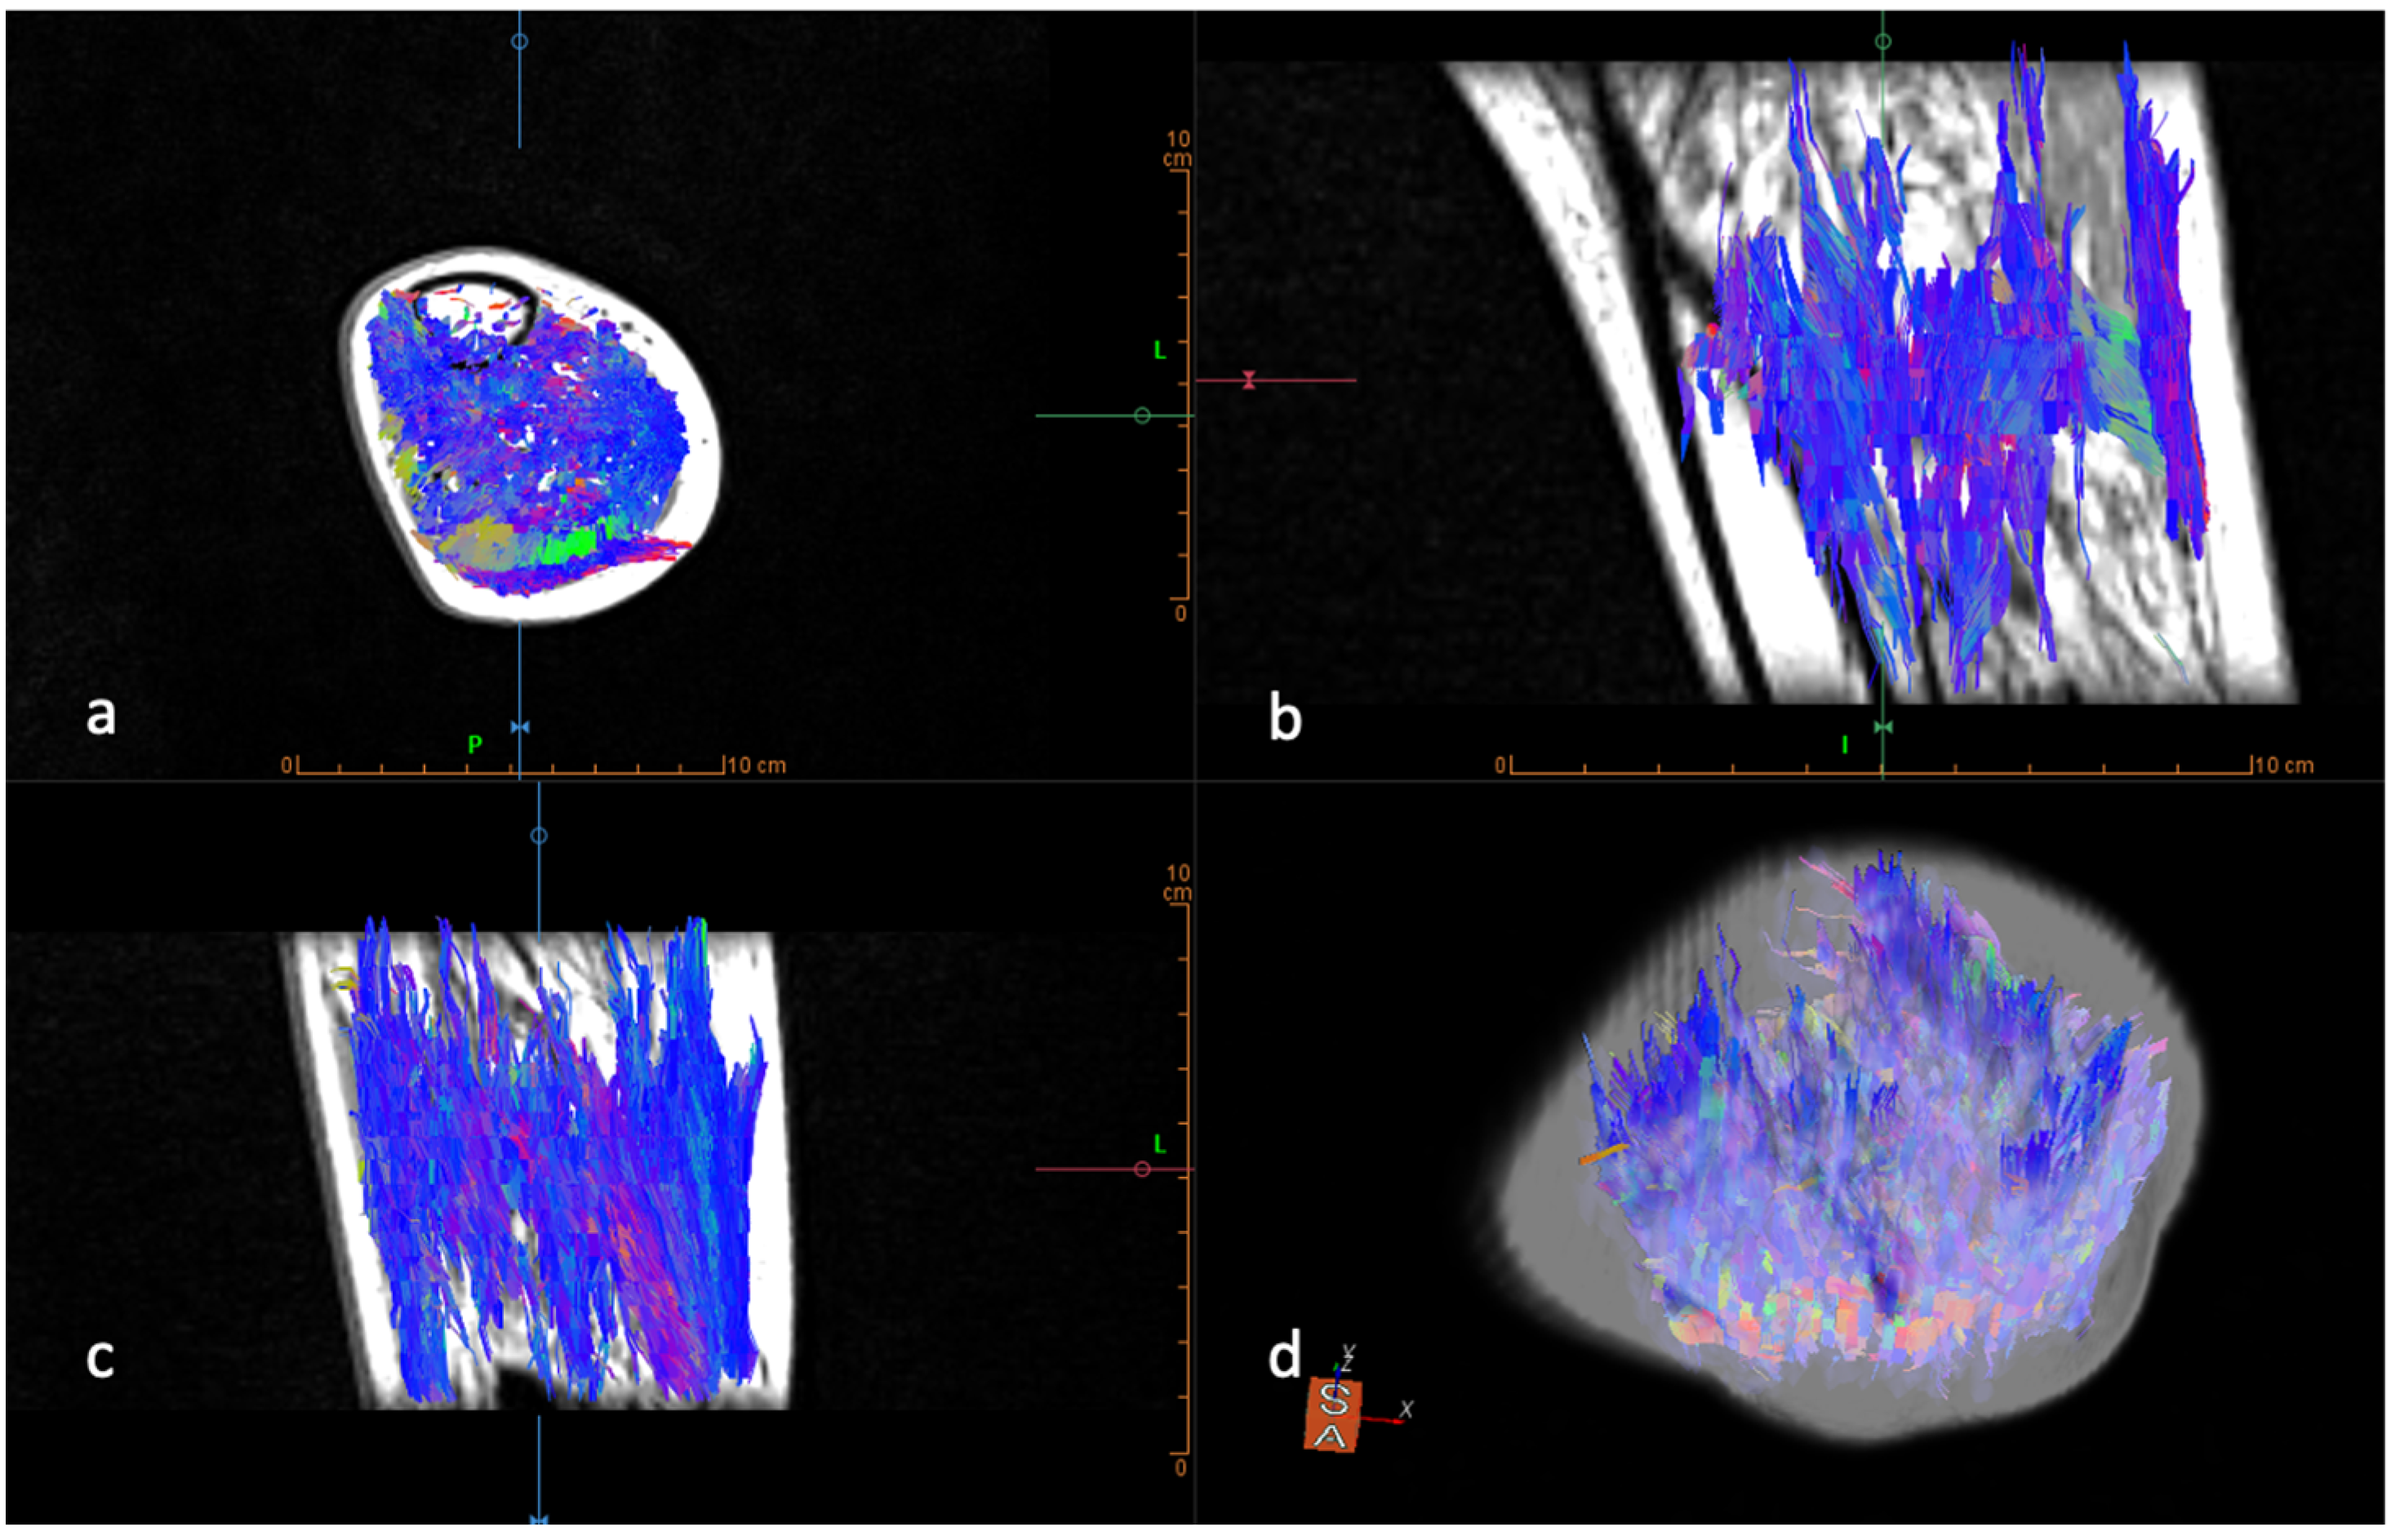
Diffusion-Weighted Imaging
5. Artificial Intelligence
6. Conclusions
Author Contributions
Funding
Institutional Review Board Statement
Informed Consent Statement
Data Availability Statement
Conflicts of Interest
References
- Rosenkrantz, A.B.; Mendiratta-Lala, M.; Bartholmai, B.J.; Ganeshan, D.; Abramson, R.G.; Burton, K.R.; Yu, J.-P.J.; Scalzetti, E.M.; Yankeelov, T.E.; Subramaniam, R.M.; et al. Clinical Utility of Quantitative Imaging. Acad. Radiol. 2015, 22, 33–49. [Google Scholar] [CrossRef]
- Chianca, V.; Albano, D.; Messina, C.; Vincenzo, G.; Rizzo, S.; Del Grande, F.; Sconfienza, L.M. An update in musculoskeletal tumors: From quantitative imaging to radiomics. Radiol. Med. 2021, 126, 1095–1105. [Google Scholar] [CrossRef]
- Forbes, S.C.; Willcocks, R.J.; Rooney, W.D.; Walter, A.G.; Vandenborne, K. MRI quantifies neuromuscular disease progression. Lancet Neurol. 2016, 15, 26–28. [Google Scholar] [CrossRef]
- Chianca, V.; Albano, D.; Messina, C.; Gitto, S.; Ruffo, G.; Guarino, S.; Del Grande, F.; Sconfienza, L.M. Sarcopenia: Imaging assessment and clinical application. Abdom. Radiol. 2022, 47, 3205–3216. [Google Scholar] [CrossRef]
- Marcus, R.L.; Addison, O.; Kidde, J.P.; Dibble, L.E.; Lastayo, P.C. Skeletal muscle fat infiltration: Impact of age, inactivity, and exercise. J. Nutr. Health Aging 2010, 14, 362–366. [Google Scholar] [CrossRef]
- Messina, C.; Vitale, J.A.; Pedone, L.; Chianca, V.; Vicentin, I.; Albano, D.; Gitto, S.; Sconfienza, L.M. Critical appraisal of papers reporting recommendation on sarcopenia using the AGREE II tool: A EuroAIM initiative. Eur. J. Clin. Nutr. 2020, 74, 1164–1172. [Google Scholar] [CrossRef]
- Huber, F.A.; Del Grande, F.; Rizzo, S.; Guglielmi, G.; Guggenberger, R. MRI in the assessment of adipose tissues and muscle composition: How to use it. Quant. Imaging Med. Surg. 2020, 10, 1636–1649. [Google Scholar] [CrossRef]
- Chianca, V.; Cuocolo, R.; Albano, D. Editorial for “Quantification of Bone Marrow Fat Fraction and Iron by MRI for Distinguishing Aplastic Anemia and Myelodysplastic Syndromes”. J. Magn. Reson. Imaging 2021, 54, 1761–1762. [Google Scholar] [CrossRef]
- Del Grande, F.; Santini, F.; Herzka, D.; Aro, M.R.; Dean, C.W.; Gold, G.E.; Carrino, J.A. Fat-Suppression Techniques for 3-T MR Imaging of the Musculoskeletal System. RadioGraphics 2014, 34, 217–233. [Google Scholar] [CrossRef]
- Bray, T.J.P.; Singh, S.; Latifoltojar, A.; Rajesparan, K.; Rahman, F.; Narayanan, P.; Naaseri, S.; Lopes, A.; Bainbridge, A.; Punwani, S.; et al. Diagnostic utility of whole body Dixon MRI in multiple myeloma: A multi-reader study. PLoS ONE 2017, 12, e0180562. [Google Scholar] [CrossRef]
- Jungmann, P.M.; Agten, C.A.; Pfirrmann, C.W.; Sutter, R. Advances in MRI around metal. J. Magn. Reson. Imaging 2017, 46, 972–991. [Google Scholar] [CrossRef]
- Lins, C.F.; Salmon, C.E.G.; Nogueira-Barbosa, M.H. Applications of the Dixon technique in the evaluation of the musculoskeletal system. Radiol. Bras. 2021, 54, 33–42. [Google Scholar] [CrossRef]
- Kellman, P.; Hernando, D.; Shah, S.; Zuehlsdorff, S.; Jerecic, R.; Mancini, C.; Liang, Z.-P.; Arai, A.E. Multiecho dixon fat and water separation method for detecting fibrofatty infiltration in the myocardium. Magn. Reson. Med. 2009, 61, 215–221. [Google Scholar] [CrossRef]
- Lee, S.; Lucas, R.M.; Lansdown, D.A.; Nardo, L.; Lai, A.; Link, T.M.; Krug, R.; Ma, C.B. Magnetic resonance rotator cuff fat fraction and its relationship with tendon tear severity and subject characteristics. J. Shoulder Elb. Surg. 2015, 24, 1442–1451. [Google Scholar] [CrossRef]
- Duijnisveld, B.J.; Henseler, J.F.; Reijnierse, M.; Fiocco, M.; Kan, H.E.; Nelissen, R.G. Quantitative Dixon MRI sequences to relate muscle atrophy and fatty degeneration with range of motion and muscle force in brachial plexus injury. Magn. Reson. Imaging 2017, 36, 98–104. [Google Scholar] [CrossRef]
- Wieser, K.; Joshy, J.; Filli, L.; Kriechling, P.; Sutter, R.; Fürnstahl, P.; Valdivieso, P.; Wyss, S.; Meyer, D.C.; Flück, M.; et al. Changes of Supraspinatus Muscle Volume and Fat Fraction After Successful or Failed Arthroscopic Rotator Cuff Repair. Am. J. Sports Med. 2019, 47, 3080–3088. [Google Scholar] [CrossRef]
- Wren, T.A.L.; Bluml, S.; Tseng-Ong, L.; Gilsanz, V. Three-Point Technique of Fat Quantification of Muscle Tissue as a Marker of Disease Progression in Duchenne Muscular Dystrophy: Preliminary Study. Am. J. Roentgenol. 2008, 190, W8–W12. [Google Scholar] [CrossRef]
- Dahlqvist, J.R.; Vissing, C.R.; Thomsen, C.; Vissing, J. Severe paraspinal muscle involvement in facioscapulohumeral muscular dystrophy. Neurology 2014, 83, 1178–1183. [Google Scholar] [CrossRef]
- Wokke, B.H.; Bos, C.; Reijnierse, M.; van Rijswijk, C.S.; Eggers, H.; Webb, A.; Verschuuren, J.; Kan, H. Comparison of dixon and T1-weighted MR methods to assess the degree of fat infiltration in duchenne muscular dystrophy patients. J. Magn. Reson. Imaging 2013, 38, 619–624. [Google Scholar] [CrossRef]
- Kim, H.S.; Yoon, Y.C.; Choi, B.; Jin, W.; Cha, J.G. Muscle fat quantification using magnetic resonance imaging: Case–control study of Charcot–Marie–Tooth disease patients and volunteers. J. Cachex Sarcopenia Muscle 2019, 10, 574–585. [Google Scholar] [CrossRef]
- Gujar, S.K.; Maheshwari, S.; Björkman-Burtscher, I.; Sundgren, P.C. Magnetic resonance spectroscopy. J. Neuroophthalmol. 2005, 25, 217–226. [Google Scholar] [CrossRef]
- Aringhieri, G.; Zampa, V.; Tosetti, M. Musculoskeletal MRI at 7 T: Do we need more or is it more than enough? Eur. Radiol. Exp. 2020, 4, 48. [Google Scholar] [CrossRef]
- Wang, L.; Salibi, N.; Wu, Y.; Schweitzer, M.E.; Regatte, R. Relaxation times of skeletal muscle metabolites at 7T. J. Magn. Reson. Imaging 2009, 29, 1457–1464. [Google Scholar] [CrossRef]
- Deshmukh, S.; Subhawong, T.; Carrino, A.J.; Fayad, L. Role of MR spectroscopy in musculoskeletal imaging. Indian J. Radiol. Imaging 2014, 24, 210–216. [Google Scholar] [CrossRef]
- Ogg, R.; Kingsley, R.; Taylor, J. WET, a T1- and B1-Insensitive Water-Suppression Method for in Vivo Localized 1H NMR Spectroscopy. J. Magn. Reson. Ser. B 1994, 104, 1–10. [Google Scholar] [CrossRef]
- Liu, Y.; Gu, Y.; Yu, X. Assessing tissue metabolism by phosphorous-31 magnetic resonance spectroscopy and imaging: A methodology review. Quant. Imaging Med. Surg. 2017, 7, 707–716. [Google Scholar] [CrossRef]
- Leung, D.G.; Sneag, D.B.; Del Grande, F.; Carrino, J.A.; Kalia, V. Advanced MRI Techniques for Muscle Imaging. Semin. Musculoskelet. Radiol. 2017, 21, 459–469. [Google Scholar] [CrossRef]
- Janssen, B.H.; Voet, N.B.M.; Nabuurs, C.I.; Kan, H.E.; de Rooy, J.W.J.; Geurts, A.C.; Padberg, G.W.; van Engelen, B.G.M.; Heerschap, A. Distinct Disease Phases in Muscles of Facioscapulohumeral Dystrophy Patients Identified by MR Detected Fat Infiltration. PLoS ONE 2014, 9, e85416. [Google Scholar] [CrossRef]
- Reeder, S.B.; Cruite, I.; Hamilton, G.; Sirlin, C.B. Quantitative assessment of liver fat with magnetic resonance imaging and spectroscopy. J. Magn. Reson. Imaging 2011, 34, 729–749. [Google Scholar] [CrossRef]
- Fischer, M.A.; Nanz, D.; Shimakawa, A.; Schirmer, T.; Guggenberger, R.; Chhabra, A.; Carrino, J.A.; Andreisek, G. Quantification of Muscle Fat in Patients with Low Back Pain: Comparison of Multi-Echo MR Imaging with Single-Voxel MR Spectroscopy. Radiology 2013, 266, 555–563. [Google Scholar] [CrossRef]
- Ogon, I.; Takebayashi, T.; Takashima, H.; Morita, T.; Yoshimoto, M.; Terashima, Y.; Yamashita, T. Quantitative Analysis Concerning Atrophy and Fat Infiltration of the Multifidus Muscle with Magnetic Resonance Spectroscopy in Chronic Low Back Pain. Spine Surg. Relat. Res. 2019, 3, 163–170. [Google Scholar] [CrossRef]
- Forbes, S.C.; Arora, H.; Willcocks, R.J.; Triplett, W.T.; Rooney, W.D.; Barnard, A.M.; AlAbasi, U.; Wang, D.-J.; Lott, D.J.; Senesac, C.R.; et al. Upper and Lower Extremities in Duchenne Muscular Dystrophy Evaluated with Quantitative MRI and Proton MR Spectroscopy in a Multicenter Cohort. Radiology 2020, 295, 616–625. [Google Scholar] [CrossRef]
- Paoletti, M.; Pichiecchio, A.; Piccinelli, S.C.; Tasca, G.; Berardinelli, A.L.; Padovani, A.; Filosto, M. Advances in Quantitative Imaging of Genetic and Acquired Myopathies: Clinical Applications and Perspectives. Front. Neurol. 2019, 10, 78. [Google Scholar] [CrossRef]
- Albano, D.; Chianca, V.; Cuocolo, R.; Bignone, R.; Ciccia, F.; Sconfienza, L.M.; Midiri, M.; Brunetti, A.; Lagalla, R.; Galia, M. T2-mapping of the sacroiliac joints at 1.5 Tesla: A feasibility and reproducibility study. Skelet. Radiol. 2018, 47, 1691–1696. [Google Scholar] [CrossRef]
- Chianca, V.; Albano, D.; Cuocolo, R.; Messina, C.; Gitto, S.; Brunetti, A.; Sconfienza, L.M. T2 mapping of the trapeziometacarpal joint and triangular fibrocartilage complex: A feasibility and reproducibility study at 1.5 T. Radiol. Med. 2019, 125, 306–312. [Google Scholar] [CrossRef]
- Staroswiecki, E.; Granlund, K.L.; Alley, M.T.; Gold, G.E.; Hargreaves, B.A. Simultaneous estimation of T2 and apparent diffusion coefficient in human articular cartilage in vivo with a modified three-dimensional double echo steady state (DESS) sequence at 3 T. Magn. Reson. Med. 2012, 67, 1086–1096. [Google Scholar] [CrossRef]
- Albano, D.; Bignone, R.; Chianca, V.; Cuocolo, R.; Messina, C.; Sconfienza, L.M.; Ciccia, F.; Brunetti, A.; Midiri, M.; Galia, M. T2 mapping of the sacroiliac joints in patients with axial spondyloarthritis. Eur. J. Radiol. 2020, 131, 109246. [Google Scholar] [CrossRef]
- Arpan, I.; Forbes, S.C.; Lott, D.J.; Senesac, C.R.; Daniels, M.J.; Triplett, W.T.; Deol, J.K.; Sweeney, H.L.; Walter, G.A.; Vandenborne, K. T2 mapping provides multiple approaches for the characterization of muscle involvement in neuromuscular diseases: A cross-sectional study of lower leg muscles in 5-15-year-old boys with Duchenne muscular dystrophy. NMR Biomed. 2013, 26, 320–328. [Google Scholar] [CrossRef]
- Santini, F.; Deligianni, X.; Paoletti, M.; Solazzo, F.; Weigel, M.; de Sousa, P.L.; Bieri, O.; Monforte, M.; Ricci, E.; Tasca, G.; et al. Fast Open-Source Toolkit for Water T2 Mapping in the Presence of Fat From Multi-Echo Spin-Echo Acquisitions for Muscle MRI. Front. Neurol. 2021, 12, 248. [Google Scholar] [CrossRef]
- De Mello, R.; Ma, Y.; Ji, Y.; Du, J.; Chang, E.Y. Quantitative MRI Musculoskeletal Techniques: An Update. Am. J. Roentgenol. 2019, 213, 524–533. [Google Scholar] [CrossRef]
- Larmour, S.; Chow, K.; Kellman, P.; Thompson, R.B. Characterization of T1 bias in skeletal muscle from fat in MOLLI and SASHA pulse sequences: Quantitative fat-fraction imaging with T1 mapping. Magn. Reson. Med. 2017, 77, 237–249. [Google Scholar] [CrossRef]
- Bull, S.; White, S.K.; Piechnik, S.K.; Flett, A.S.; Ferreira, V.; Loudon, M.; Francis, J.M.; Karamitsos, T.; Prendergast, B.D.; Robson, M.D.; et al. Human non-contrast T1 values and correlation with histology in diffuse fibrosis. Heart 2013, 99, 932–937. [Google Scholar] [CrossRef]
- Murphy, W.; Totty, W.; Carroll, J. MRI of normal and pathologic skeletal muscle. Am. J. Roentgenol. 1986, 146, 565–574. [Google Scholar] [CrossRef]
- Marty, B.; Coppa, B.; Carlier, P.G. Monitoring skeletal muscle chronic fatty degenerations with fast T1-mapping. Eur. Radiol. 2018, 28, 4662–4668. [Google Scholar]
- Barp, A.; Carraro, E.; Albamonte, E.; Salmin, F.; Lunetta, C.; Comi, G.P.; Messina, C.; Albano, D.; Chianca, V.; Sconfienza, L.M.; et al. Muscle MRI in two SMA patients on nusinersen treatment: A two years follow-up. J. Neurol. Sci. 2020, 417, 117067. [Google Scholar] [CrossRef]
- Vetrano, I.G.; Sconfienza, L.M.; Albano, D.; Chianca, V.; Nazzi, V. Recurrence of carpal tunnel syndrome in isolated non-syndromic macrodactyly: DTI examination of a giant median nerve. Skelet. Radiol. 2019, 48, 989–993. [Google Scholar] [CrossRef]
- Bäumer, P.; Pham, M.; Ruetters, M.; Heiland, S.; Heckel, A.; Radbruch, A.; Bendszus, M.; Weiler, M. Peripheral Neuropathy: Detection with Diffusion-Tensor Imaging. Radiology 2014, 273, 185–193. [Google Scholar] [CrossRef]
- Schlaffke, L.; Rehmann, R.; Froeling, M.; Kley, R.; Tegenthoff, M.; Vorgerd, M.; Schmidt-Wilcke, T. Diffusion tensor imaging of the human calf: Variation of inter- and intramuscle-specific diffusion parameters. J. Magn. Reson. Imaging 2017, 46, 1137–1148. [Google Scholar] [CrossRef]
- Giraudo, C.; Motyka, S.; Weber, M.; Feiweier, T.; Trattnig, S.; Bogner, W. Diffusion Tensor Imaging of Healthy Skeletal Muscles: A Comparison between 7 T and 3 T. Investig. Radiol. 2019, 54, 48–54. [Google Scholar] [CrossRef]
- Chianca, V.; Albano, D.; Messina, C.; Cinnante, C.M.; Triulzi, F.M.; Sardanelli, F.; Sconfienza, L.M. Diffusion tensor imaging in the musculoskeletal and peripheral nerve systems: From experimental to clinical applications. Eur. Radiol. Exp. 2017, 1, 12. [Google Scholar] [CrossRef]
- Cotten, A.; Haddad, F.; Hayek, G.; Lefebvre, G.; Dodré, E.; Budzik, J.-F. Tractography: Possible Applications in Musculoskeletal Radiology. Semin. Musculoskelet. Radiol. 2015, 19, 387–395. [Google Scholar] [CrossRef]
- Wang, K.; Chen, Z.; Zhang, F.; Song, Q.; Hou, C.; Tang, Y.; Wang, J.; Chen, S.; Bian, Y.; Hao, Q.; et al. Evaluation of DTI Parameter Ratios and Diffusion Tensor Tractography Grading in the Diagnosis and Prognosis Prediction of Cervical Spondylotic Myelopathy. Spine 2017, 42, E202–E210. [Google Scholar] [CrossRef]
- Chianca, V.; Albano, D.; Rizzo, S.; Maas, M.; Sconfienza, L.M.; Del Grande, F. Inter-vendor and inter-observer reliability of diffusion tensor imaging in the musculoskeletal system: A multiscanner MR study. Insights Imaging 2023, 14, 32. [Google Scholar] [CrossRef]
- Klupp, E.; Cervantes, B.; Schlaeger, S.; Inhuber, S.; Kreuzpointer, F.; Schwirtz, A.; Rohrmeier, A.; Msc, M.D.; Hedderich, D.M.; Msc, M.N.D.; et al. Paraspinal Muscle DTI Metrics Predict Muscle Strength. J. Magn. Reson. Imaging 2019, 50, 816–823. [Google Scholar] [CrossRef]
- Ponrartana, S.; Ramos-Platt, L.; Wren, T.A.L.; Hu, H.H.; Perkins, T.G.; Chia, J.M.; Gilsanz, V. Effectiveness of diffusion tensor imaging in assessing disease severity in Duchenne muscular dystrophy: Preliminary study. Pediatr. Radiol. 2015, 45, 582–589. [Google Scholar] [CrossRef]
- Be, S.E.W.; Heemskerk, A.M.; Welch, E.B.; Li, K.; Damon, B.M.; Park, J.H. Quantitative effects of inclusion of fat on muscle diffusion tensor MRI measurements. J. Magn. Reson. Imaging 2013, 38, 1292–1297. [Google Scholar] [CrossRef]
- Guggenberger, R.; Nanz, D.; Bussmann, L.; Chhabra, A.; Fischer, M.A.; Hodler, J.; Pfirrmann, C.W.; Andreisek, G. Diffusion tensor imaging of the median nerve at 3.0T using different MR scanners: Agreement of FA and ADC measurements. Eur. J. Radiol. 2013, 82, e590–e596. [Google Scholar] [CrossRef]
- Adelnia, F.; Shardell, M.; Bergeron, C.M.; Fishbein, K.W.; Spencer, R.G.; Ferrucci, L.; Reiter, D.A. Diffusion-weighted MRI with intravoxel incoherent motion modeling for assessment of muscle perfusion in the thigh during post-exercise hyperemia in younger and older adults. NMR Biomed. 2019, 32, e4072. [Google Scholar] [CrossRef]
- Li, Y.T.; Cercueil, J.-P.; Yuan, J.; Chen, W.; Loffroy, R.; Wáng, Y.X.J. Liver intravoxel incoherent motion (IVIM) magnetic resonance imaging: A comprehensive review of published data on normal values and applications for fibrosis and tumor evaluation. Quant. Imaging Med. Surg. 2017, 7, 59–78. [Google Scholar] [CrossRef]
- Le Bihan, D.; Johansen-Berg, H. Diffusion MRI at 25: Exploring brain tissue structure and function. Neuroimage 2012, 61, 324–341. [Google Scholar] [CrossRef]
- Le Bihan, D. What can we see with IVIM MRI? Neuroimage 2019, 187, 56–67. [Google Scholar] [CrossRef]
- Ran, J.; Yin, C.; Liu, C.; Li, Y.; Hou, B.; Morelli, J.N.; Dai, B.; Li, X. The Diagnostic Value of MR IVIM and T2 Mapping in Differentiating Autoimmune Myositis From Muscular Dystrophy. Acad. Radiol. 2021, 28, e182–e188. [Google Scholar] [CrossRef]
- Jungmann, P.; Pfirrmann, C.; Federau, C. Characterization of lower limb muscle activation patterns during walking and running with Intravoxel Incoherent Motion (IVIM) MR perfusion imaging. Magn. Reson. Imaging 2019, 63, 12–20. [Google Scholar] [CrossRef]
- Xu, W.; Hao, D.; Hou, F.; Zhang, D.; Wang, H. Soft Tissue Sarcoma: Preoperative MRI-Based Radiomics and Machine Learning May Be Accurate Predictors of Histopathologic Grade. Am. J. Roentgenol. 2020, 215, 963–969. [Google Scholar] [CrossRef]
- Gorelik, N.; Gyftopoulos, S. Applications of Artificial Intelligence in Musculoskeletal Imaging: From the Request to the Report. Can. Assoc. Radiol. J. 2021, 72, 45–59. [Google Scholar] [CrossRef]
- Campagner, A.; Sconfienza, L.; Cabitza, F. H-Accuracy, an Alternative Metric to Assess Classification Models in Medicine. In Studies in Health Technology and Informatics; IOS Press: Amsterdam, The Netherlands, 2020; Volume 270, pp. 242–246. [Google Scholar] [CrossRef]
- Chartrand, G.; Cheng, P.M.; Vorontsov, E.; Drozdzal, M.; Turcotte, S.; Pal, C.J.; Kadoury, S.; Tang, A. Deep Learning: A Primer for Radiologists. RadioGraphics 2017, 37, 2113–2131. [Google Scholar] [CrossRef]
- Gitto, S.; Cuocolo, R.; Albano, D.; Chianca, V.; Messina, C.; Gambino, A.; Ugga, L.; Cortese, M.C.; Lazzara, A.; Ricci, D.; et al. MRI radiomics-based machine-learning classification of bone chondrosarcoma. Eur. J. Radiol. 2020, 128, 109043. [Google Scholar] [CrossRef]
- Albano, D.; Cuocolo, R.; Patti, C.; Ugga, L.; Chianca, V.; Tarantino, V.; Faraone, R.; Albano, S.; Micci, G.; Costa, A.; et al. Whole-body MRI radiomics model to predict relapsed/refractory Hodgkin Lymphoma: A preliminary study. Magn. Reson. Imaging 2022, 86, 55–60. [Google Scholar] [CrossRef]
- Chianca, V.; Cuocolo, R.; Gitto, S.; Albano, D.; Merli, I.; Badalyan, J.; Cortese, M.C.; Messina, C.; Luzzati, A.; Parafioriti, A.; et al. Radiomic Machine Learning Classifiers in Spine Bone Tumors: A Multi-Software, Multi-Scanner Study. Eur. J. Radiol. 2021, 137, 109586. [Google Scholar] [CrossRef]
- Gitto, S.; Cuocolo, R.; Annovazzi, A.; Anelli, V.; Acquasanta, M.; Cincotta, A.; Albano, D.; Chianca, V.; Ferraresi, V.; Messina, C.; et al. CT radiomics-based machine learning classification of atypical cartilaginous tumours and appendicular chondrosarcomas. Ebiomedicine 2021, 68, 103407. [Google Scholar] [CrossRef]
- Weber, K.A.; Abbott, R.; Bojilov, V.; Smith, A.C.; Wasielewski, M.; Hastie, T.J.; Parrish, T.B.; Mackey, S.; Elliott, J.M. Multi-muscle deep learning segmentation to automate the quantification of muscle fat infiltration in cervical spine conditions. Sci. Rep. 2021, 11, 312–329. [Google Scholar] [CrossRef]
- Ro, K.; Kim, J.Y.; Park, H.; Cho, B.H.; Kim, I.Y.; Shim, S.B.; Choi, I.Y.; Yoo, J.C. Deep-learning framework and computer assisted fatty infiltration analysis for the supraspinatus muscle in MRI. Sci. Rep. 2021, 11, 15065. [Google Scholar] [CrossRef]
- Verdú-Díaz, J.; Alonso-Pérez, J.; Nuñez-Peralta, C.; Tasca, G.; Vissing, J.; Straub, V.; Fernández-Torrón, R.; Llauger, J.; Illa, I.; Díaz-Manera, J. Accuracy of a machine learning muscle MRI-based tool for the diagnosis of muscular dystrophies. Neurology 2020, 94, e1094–e1102. [Google Scholar] [CrossRef]
- Ding, J.; Cao, P.; Chang, H.-C.; Gao, Y.; Chan, S.H.S.; Vardhanabhuti, V. Deep learning-based thigh muscle segmentation for reproducible fat fraction quantification using fat–water decomposition MRI. Insights Imaging 2020, 11, 128. [Google Scholar] [CrossRef]
- Feng, L.; Ma, D.; Liu, F. Rapid MR relaxometry using deep learning: An overview of current techniques and emerging trends. NMR Biomed. 2022, 35, e4416. [Google Scholar] [CrossRef]


| Imaging Techniques | Type of Evaluation | Disadvantages |
|---|---|---|
| Dixon | Quantification of muscular fat fraction with excellent reliability. | B0 heterogeneity, which causes the shift of fat and water peaks with the suppression of a wrong component. |
| Spectroscopy | MRS evaluates metabolic muscle changes in case of muscle fat infiltration through the quantitative analysis of metabolites containing phosphorus. | Significant sampling error due to the variability of the positioning of the volume of interest. |
| Relaxometry | Quantitative relaxation time evaluation of the selected muscle. | The presence of edema determines errors in quantifying muscular fat infiltration. |
| DTI | Quantitative evaluation of the degree of muscular adipose infiltration by calculating the fraction anisotropy. | Complexity of the sequence setup and the scan times. |
| IVIM | Quantitative evaluation of the incoherently flowing vascular blood signal from that of the other tissue. | Cardiac activity and motion artifacts. |
Disclaimer/Publisher’s Note: The statements, opinions and data contained in all publications are solely those of the individual author(s) and contributor(s) and not of MDPI and/or the editor(s). MDPI and/or the editor(s) disclaim responsibility for any injury to people or property resulting from any ideas, methods, instructions or products referred to in the content. |
© 2023 by the authors. Licensee MDPI, Basel, Switzerland. This article is an open access article distributed under the terms and conditions of the Creative Commons Attribution (CC BY) license (https://creativecommons.org/licenses/by/4.0/).
Share and Cite
Chianca, V.; Vincenzo, B.; Cuocolo, R.; Zappia, M.; Guarino, S.; Di Pietto, F.; Del Grande, F. MRI Quantitative Evaluation of Muscle Fatty Infiltration. Magnetochemistry 2023, 9, 111. https://doi.org/10.3390/magnetochemistry9040111
Chianca V, Vincenzo B, Cuocolo R, Zappia M, Guarino S, Di Pietto F, Del Grande F. MRI Quantitative Evaluation of Muscle Fatty Infiltration. Magnetochemistry. 2023; 9(4):111. https://doi.org/10.3390/magnetochemistry9040111
Chicago/Turabian StyleChianca, Vito, Bottino Vincenzo, Renato Cuocolo, Marcello Zappia, Salvatore Guarino, Francesco Di Pietto, and Filippo Del Grande. 2023. "MRI Quantitative Evaluation of Muscle Fatty Infiltration" Magnetochemistry 9, no. 4: 111. https://doi.org/10.3390/magnetochemistry9040111
APA StyleChianca, V., Vincenzo, B., Cuocolo, R., Zappia, M., Guarino, S., Di Pietto, F., & Del Grande, F. (2023). MRI Quantitative Evaluation of Muscle Fatty Infiltration. Magnetochemistry, 9(4), 111. https://doi.org/10.3390/magnetochemistry9040111