Abstract
Cyclic 3d-4f molecular magnets have received considerable attention owing to their potential applications in high-density data storage and quantum information processing. As a rare example of ferromagnetic polynuclear Cr rings, {Cr8Y8} represents a valuable test bed to directly study the magnetic interaction between Cr3+ ions in large hexadecametallic {Cr8Ln8} (Ln = 4f metal) molecules. We have proposed a “single-J” model to approximate the low-temperature spin dynamics of {Cr8Y8} in our earlier study, while a zero-field splitting (ZFS) of the quantum levels was also suggested by the heat capacity data. In order to have a deeper understanding of the magnetism of {Cr8Y8}, it is necessary to verify the ZFS by means of high-resolution spectral methods and identify its origin. In this work, we present a high-frequency electron spin resonance (HF-ESR) study on the ZFS of {Cr8Y8}. The X-band ESR spectra consists of multi-peak structure, indicative of magnetic anisotropy that breaks the degeneracy between spin states in the absence of a magnetic field. HF-ESR spectra are collected to extract the ZFS parameters. We observed a sharp resonance peak due to the transitions between the S = 11 quantum levels and a broadband corresponding to a distribution of resonance peaks due to the ZFS of the S = 12 quantum levels. By analyzing HF-ESR spectra, we confirm the expected S = 12 ground state and determine its ZFS parameter D as −0.069 K, and, furthermore, we reproduce the spectra recorded at 154 GHz. The macrospin model proves to still be valid. The ZFS is attributed to the axial magnetic anisotropy, as found in some other Cr-based molecular wheels. The detailed HF-ESR investigation presented in this paper will benefit the studies on other {Cr8Ln8} wheels with magnetic Ln3+ ions and highlights the importance of the HF-ESR method as a high-resolution probe in determining the ZFS parameters with very small magnitude.
1. Introduction
Since the 1980s, the field of molecular magnetism has witnessed great developments toward the characterization, understanding, and control of the magnetic properties of molecular magnets, with a major goal in using them for important applications, such as spintronics, quantum technologies, high-density data storage, and magnetic cooling. Distinguished from the traditional bulk magnets, crystals of molecular magnets are composed of identical molecules, which are magnetically isolated from each other by coordinating ligands and contain a certain number of organic or inorganic magnetic centers. As a consequence of the advances in coordination chemistry, many molecular magnets with different compositions and structures can be rationally designed and synthesized at the molecular scale. Paramagnetic metal molecular wheels are an intriguing family of molecular magnets with cyclic geometries and periodic boundary conditions, providing finite model systems for one-dimensional spin chains. In addition to the static magnetic properties stemming from their special structure, paramagnetic metal molecular wheels also exhibit remarkable spin dynamics at the crossover between classical and quantum regimes and possess fascinating quantum properties, holding much potential for both fundamental physics and quantum information processing applications [1,2,3]. The transition metal (3d) substituents form the largest and best-studied class of molecular wheels [4], while the lanthanide (4f) containing wheels are also fast developing [5]. By coupling 4f ions to 3d ions, heterometallic 3d-4f molecular wheels demonstrate interesting properties, such as slow magnetic relaxation owing to the large magnetic anisotropy of 4f ions [6], as well as toroidal magnetic moments that can simultaneously break time and space symmetries [7]. In this context, large hexadecametallic {M8Ln8} (M = 3d metal, Ln = 4f metal) wheels have been discovered and investigated in detail [7,8,9,10], demonstrating that the {M8Ln8} family represents an ideal playground for investigating the effect of magnetic ions and the exchange interaction on the resultant magnetic properties.
Spin dynamics are a crucial aspect in understanding the magnetic properties of molecular magnets and have become the subject of intensive research by means of spectroscopic methods. The spin correlations can be determined quantitatively by analyzing spin dynamics in terms of an underlying spin Hamiltonian. The accurate experimental characterization and the related analysis approach to spin dynamics are of great importance in acquiring the structure–activity relationship of cyclic molecular magnets.
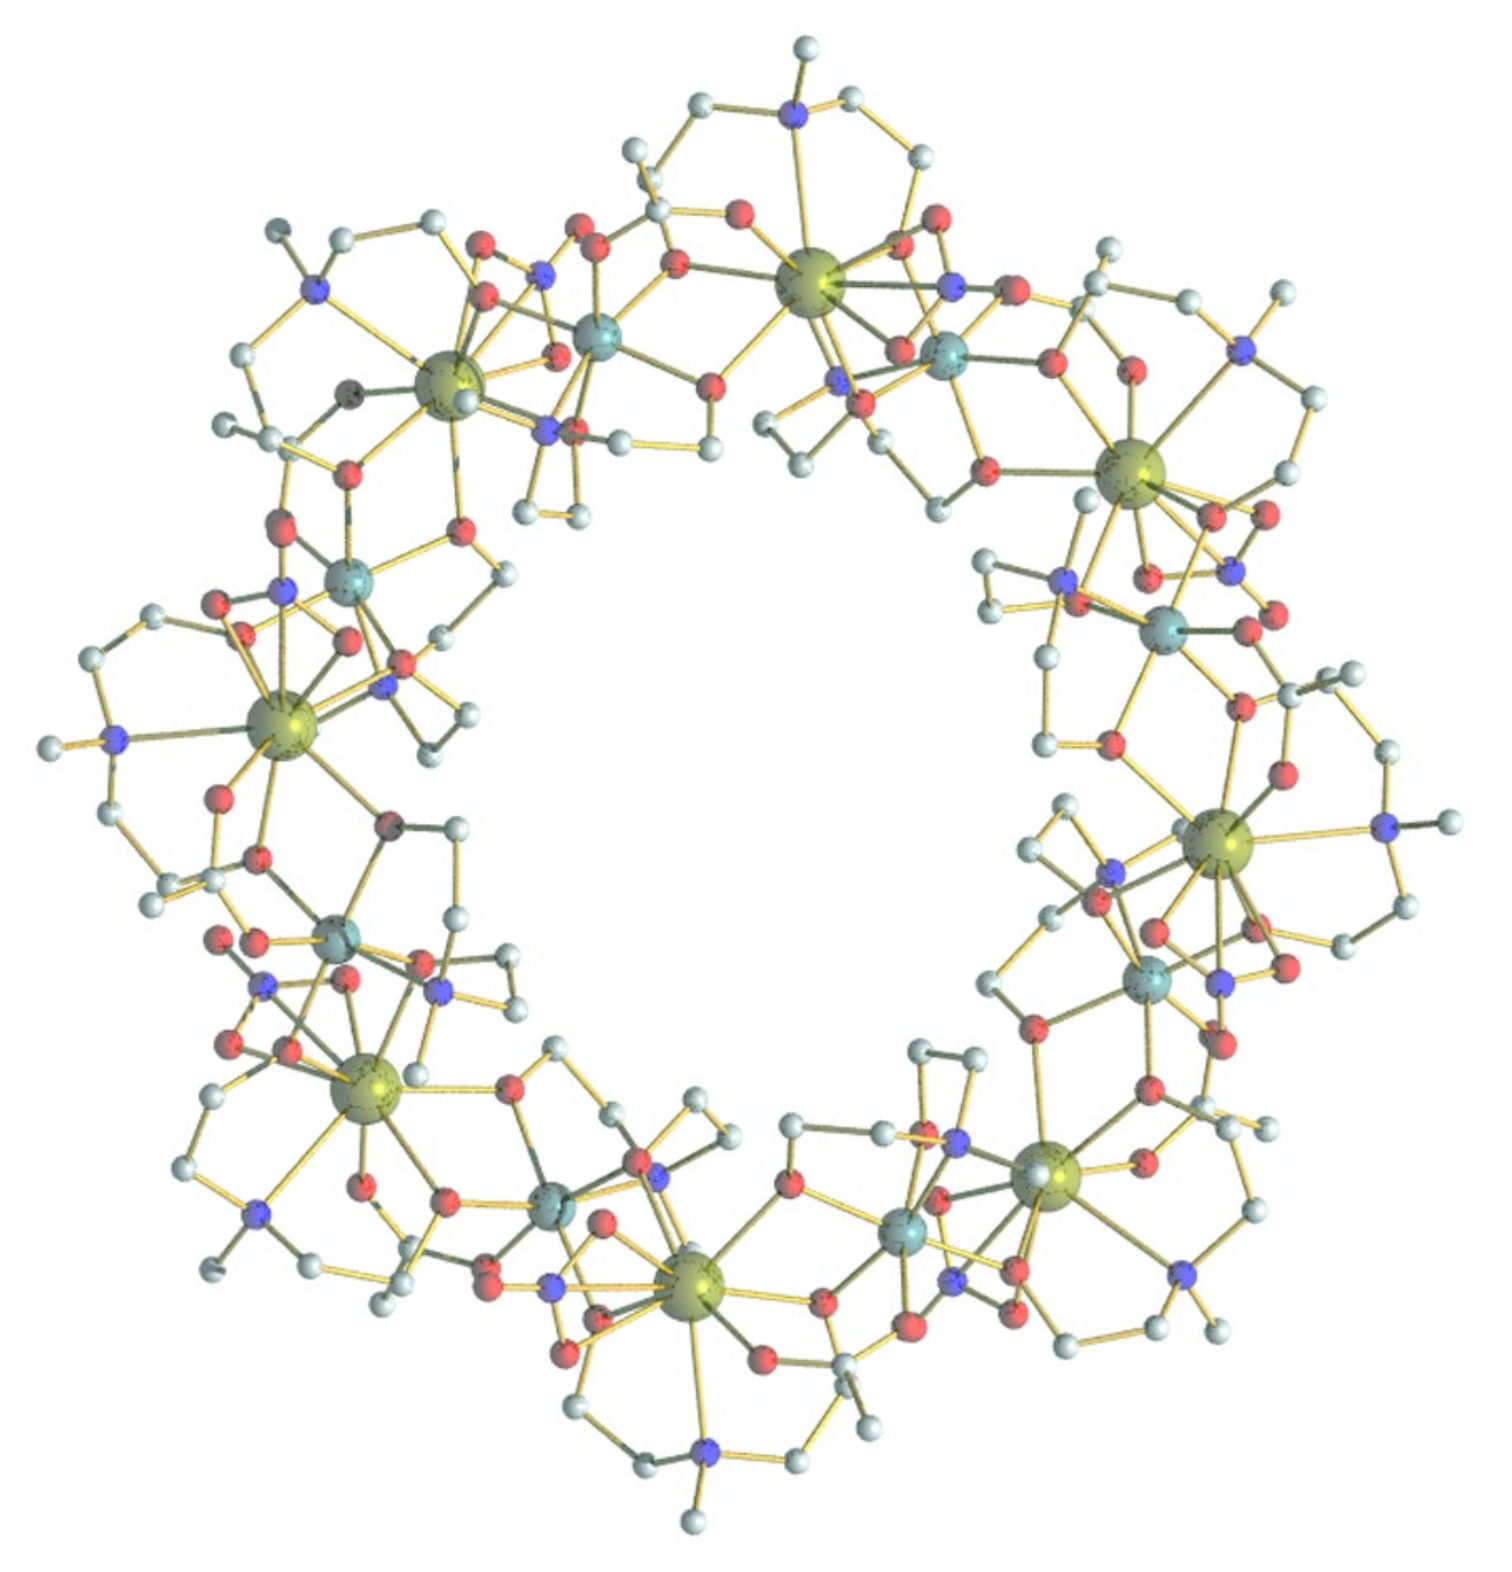
We have investigated the magnetic property and spin dynamics of some {M8Ln8} compounds [7,9,10]. To demonstrate the structure of {M8Ln8} molecules, one {Cr8Y8} molecule is plotted in Figure 1, where the 3d and 4f ions are arranged alternatively to form a fluctuant wheel-like structure [7,8,9]. The next-nearest-neighbor (NNN) 3d–3d interaction can be comparable to the magnetic interaction between nearest-neighbor (NN) 3d and 4f ions, and plays an important role in the spin dynamics [10]. However, the NNN interaction is often ignored in a complex system, such as {M8Ln8}, because it is difficult to be precisely determined. Therefore, {Cr8Y8} becomes a valuable starting point as an isostructural analogue of {Cr8Ln8} complexes by substituting magnetic Ln3+ ions with diamagnetic Y3+, allowing a direct characterization of the NNN Cr3+–Cr3+ interaction. Although Y3+ is diamagnetic, the neighboring Cr3+ moments are coupled through a long -O-C-C-N-C-C-O- pathway justifying weak exchange interaction [10]. We have investigated the low-temperature spin dynamics of {Cr8Y8} using time-of-flight inelastic neutron scattering (INS) and heat capacity techniques [10]. Low-lying spin levels have been determined at various external magnetic fields and are consistent with the calculation based on the spin model using a unique ferromagnetic exchange constant, J = 0.151 meV (~1.76 K), and a -JSiSj formalism. The heat capacity data measured down to 60 mK suggested a small energy gap of less than 0.009 meV (~0.1 K), which was tentatively attributed to the zero-field splitting (ZFS) of the ground state levels [10]. However, this energy gap was too small to be unambiguously verified by the INS and heat capacity experiments due to limited instrumental resolutions. Although in principle the high-resolution INS methods (e.g., neutron backscattering spectroscopy) can detect INS signals of a few µeVs, it is very challenging to sufficiently deuterate the sample. The large amount of hydrogen atoms yields strong incoherent scattering and broadens the central elastic line, causing difficulties in resolving low-energy excitation. Therefore, a more suitable method is needed to verify the ZFS in {Cr8Y8}. Electron spin resonance (ESR) is an important technique for the characterization of molecular magnets [11]. The g factors, ZFS parameters and magnetic interactions can be determined accurately. However, it is challenging for the commercial ESR spectrometers to study systems with large spins and magnetic anisotropy, whose energy gaps may be too large to be detected due to the limited frequency and field ranges. We overcome this problem by using the high-frequency and high-field ESR method (HF-ESR), which probes larger excitations of the electronic spins with increased resolution and sensitivity [11]. In this paper, we present a detailed HF-ESR investigation to clarify the ZFS of {Cr8Y8} and quantitatively determine its parameters and origin.
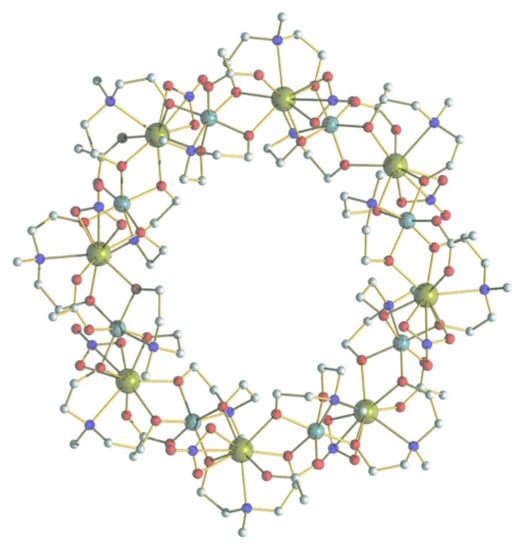
Figure 1.
The molecular structure of {Cr8Y8}. Cr cyan, Y dark yellow, C grey, N blue, and O red. The hydrogen atoms are omitted for clarity.
2. Materials and Methods
The reagents and solvents for the syntheses were all purchased from commercial sources and used without further treatments. The {Cr8Y8} crystals were synthesized by heating a mixture of Y(NO3)3·5H2O (365 mg, 1 mmol), Cr(acac)3 (349 mg, 1 mmol), N-methyldiethanolamine (357 mg, 3 mmol), triethylamine (303 mg, 3 mmol), and acetonitrile (8 mL) at 130 °C with autogenous pressure for three days. Please find more details about sample synthesis in Reference [9].
The low-field ESR experiments were carried out using a Bruker X-band (9.4 GHz) spectrometer in the temperature range T = 2−300 K. HF-ESR measurements were performed using a homemade pulsed field ESR facility at the Wuhan National High Magnetic Field Center, Wuhan, China [12,13]. The facility is a transmission-type instrument, where the microwaves are propagated by oversized cylindrical light pipes. The tuneable microwave frequencies were produced by the combination of Gunn oscillators (Millitech, Northampton, MA, USA) and backward wave oscillators. The magnetic field was generated by a pulsed field magnet. The detection was performed by an InSb hot-electron bolometer (QMC Ltd., Cardiff, UK). In order to minimize the field-induced torqueing effect, the {Cr8Y8} powders were finely ground, mixed with KBr, and pressed into pellets. The HF-ESR experiment was then performed in a continuous wave (cw) mode. The {Cr8Y8} pellets were placed in the sample cavity at the center of variable external magnetic fields and irradiated by a microwave radiation field with a constant frequency. The sweeping external magnetic field leads to Zeeman Effect, which lifts the degeneracy of electronic states. When the energy of Zeeman splitting between quantum spin levels matches the energy of incoming photons, an ESR spectrum is achieved and received by the detectors. It should be noted that a selection rule (Δms = ±1) for the transitions between the quantum levels (ms) is followed during the ESR process. The simulation of ESR spectra were completed by using EasySpin software [14]. The AC susceptibility was performed on a Quantum Design Physical Property Measurement System (PPMS Dynacool) equipped with a 3He-4He dilution refrigerator (0.05 K–4 K). Sub-Kelvin AC susceptibility was measured by using the ACDR option on PPMS Dynacool. The {Cr8Y8} powders were pressed into a pellet. A small piece with a mass of ~10 mg was glued by GE varnish to the sapphire sample stage, which was attached to the cold head of the 3He-4He dilution insert. The sample was then placed at the center of a ACDR coil set, which provided the oscillating AC magnetic field excitation at the user-selected frequencies (10 Hz–10,000 Hz) and amplitudes (up to 4 Oe), and detected the oscillating response of the sample. The AC susceptibility was thus measured by the mutual induction-based determination. The spurious background signals arising from the coil sets and the sample holder were removed from the sample signals by measuring the empty sample holder to quantify the background and canceling it with the trim coils. Therefore, the AC susceptibility data presented in this paper can be reasonably inferred to have originated from the sample alone. The selected AC driving field was 3 Oe in amplitude.
3. Results and Discussion
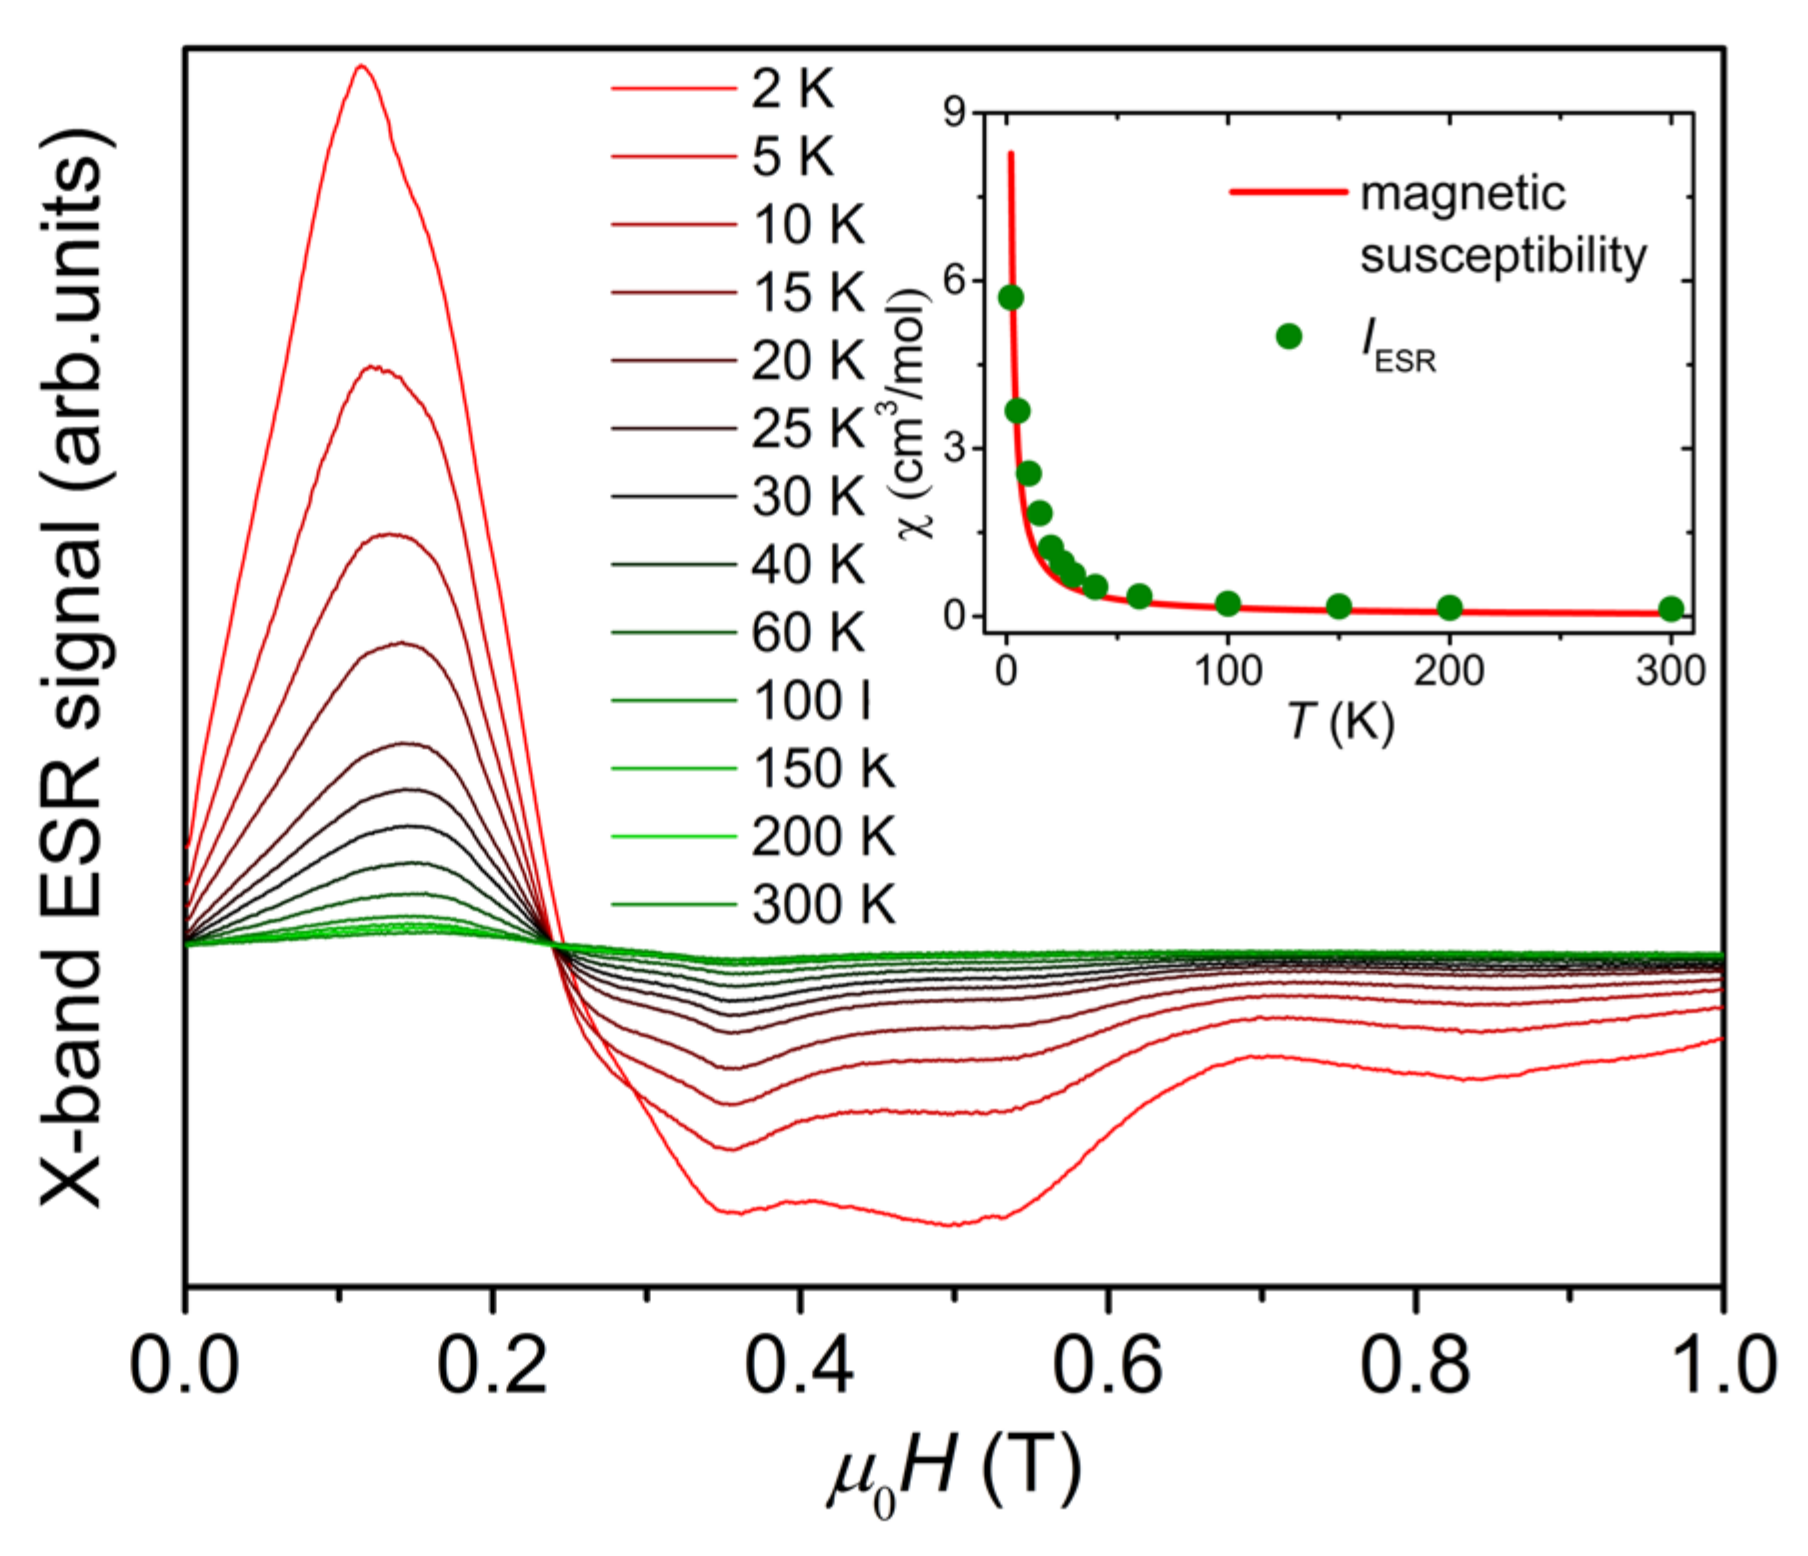
Figure 2 shows X-band ESR first-order differential signal spectra of {Cr8Y8} powder sample measured at 9.4 GHz in the temperature range of 2–300 K. The spectrum is asymmetric and composed of a significant multi-peak structure, which cannot be fitted with the Lorentz formula. With the decrease in temperature, the asymmetry of the spectrum and the multi-peak structure are enhanced. The multi-peak structure is due to the presence of magnetic anisotropy, which should be small because the multi-peak structure is clearly visible in the low-field and low-frequency X-band ESR spectra. In the inset of Figure 2, we integrate the first-order differential ESR signal over the investigated field range of 0–1 T and plot the integral intensity, IESR, as a function of temperature, in comparison with the magnetic susceptibility curve χ(T). Because IESR is proportional to the paramagnetic susceptibility of materials [15], the temperature dependence of IESR is comparable to the χ(T) curve after multiplying IESR by a constant, as shown in the inset of Figure 2, confirming the paramagnetic behavior of {Cr8Y8} above 2 K [9]. The deviation between the χ(T) curve and the temperature dependence of IESR is because the integration has been performed over the field range (0–1 T) of the X-band ESR spectra. It covers only half of the resonance peaks, which span a large field range of about 1.8 T, as shown in the HF-ESR spectra in Figure 3. Therefore, it is indispensable to use HF-ESR to precisely determine the ZFS parameters.
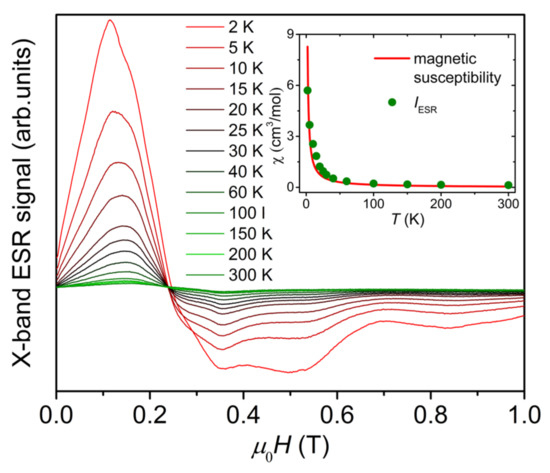
Figure 2.
X-band ESR first-order differential signal spectra of {Cr8Y8} measured at 9.4 GHz within 2–300 K. The inset is the temperature dependence of the integral intensity of the spectrum (IESR, green dots), together with the magnetic susceptibility curve (red line) adapted from Reference [9].
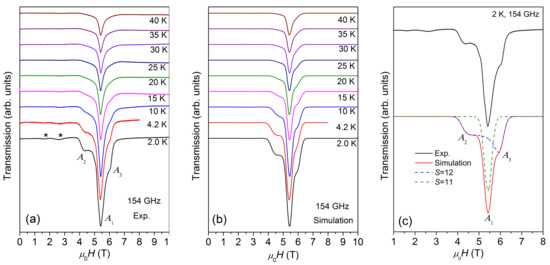
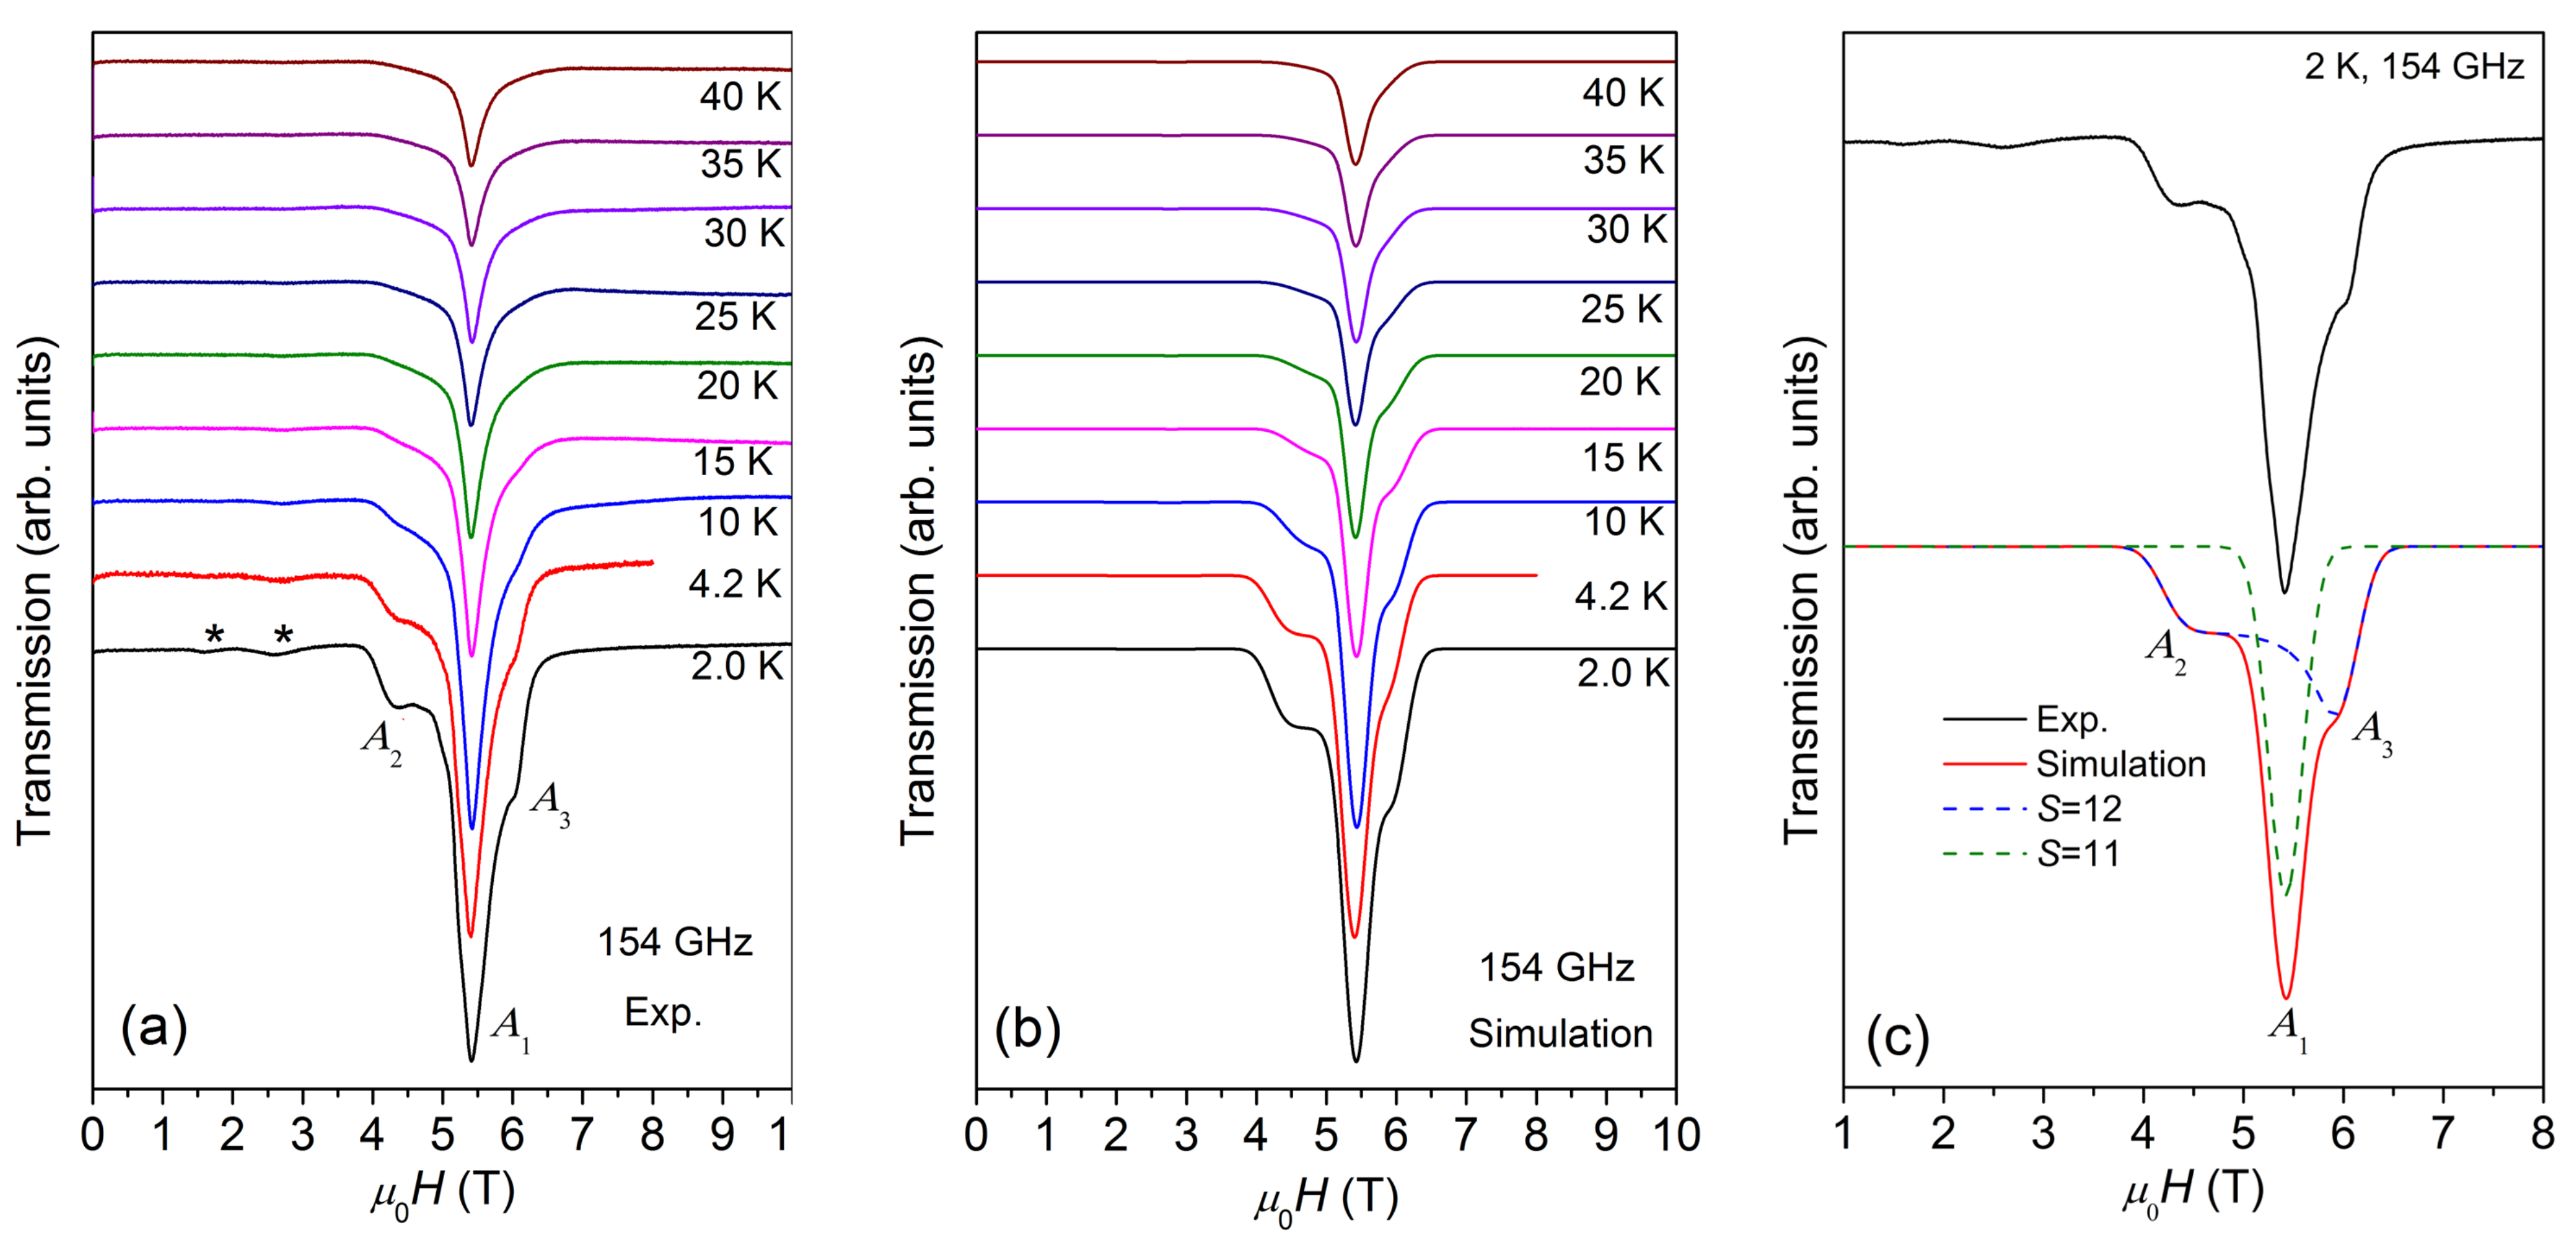
Figure 3.
(a) ESR spectra of {Cr8Y8} measured at 154 GHz within the temperature range of 2–40 K. (b) Best simulations of the ESR spectra at the same conditions. (c) The experimental spectra (black solid line) measured at 2 K and 154 GHz, and the simulated spectra (red solid line), which includes the contributions from S = 12 (blue dashed line) and S = 11 (green dashed line). The low-temperature powder spectrum has strong high-field peaks and weak low-field peaks, indicating that D is negative (see text). The best simulation yields D = −0.069 K for S = 12 and D ≈ 0 for S = 11 states.
The multi-peak structure of ESR spectra are further characterized by HF-ESR measurements. Figure 3a displays the temperature-dependent ESR spectra measured at 154 GHz. The spectrum is composed of a main peak, A1, located at the center, overlapped with a weak and broad structure with a low-field peak, A2, and a high-field peak, A3. With the decrease in temperature, the intensity of the spectrum increases and reaches the maximum at 2 K, similar to the case of X-band ESR spectra. Meanwhile, two weak peaks appear at ~1.6 and ~2.6 T. Figure 3a also reveals that the whole spectral width remains unchanged as the temperature varies, demonstrating that the magnetic anisotropy is independent of temperature.
The ESR spectra of paramagnetic molecules could be described in terms of the following general spin Hamiltonian, including the Zeeman interaction and ZFS terms,
where g is the Landé factor, µB is the Bohr magneton, ŜI2 (I = X, Y, Z) are spin matrices, S is the total spin quantum number, and D and E are the axial and rhombic ZFS parameters (E ≤ D/3), respectively. For simplicity, the rhombic anisotropy is ignored (E = 0). In the case of axial symmetry, where the Zeeman energy is much larger than (2S + 1)D, the spectrum should consist of 2S parallel (H//easy axis) and 2S perpendicular (H⊥easy axis) M → M + 1 transitions with resonance fields Hr(M) = (ge/g)[H0−(2M + 1)D′], where ge = 2.00232 is the g value of a free electron in vacuum, D′ = D/(geμB) and D/(2geμB) for parallel and perpendicular transitions, respectively, according to the selection rule, ΔM = ±1 [16]. If D is negative and the temperature is low, the low-field resonance should be stronger than the high-field resonances when a magnetic field is applied parallel to the magnetic easy axis of the molecule (H//easy axis). This case is opposite for H⊥easy axis. For powder ESR spectra, since the orientation of molecules is random and the H⊥easy axis has a larger degree of freedom than the H//easy axis, the low-temperature spectrum, if D is negative, should be composed of weak low-field peaks and strong high-field peaks.
According to our earlier studies [10], the ground state of {Cr8Y8} is S = 12, the first excited state is S =11, and the other higher-order excited states are S = 10, 9, …etc. The energy gap between S = 12 and S = 11 is about 0.133 meV (1.54 K), which is quite small and lower than the lowest measurement temperature of 2 K. This means that the ESR spectrum at 2 K is contributed not only by the ground state of S = 12, but also by the S = 11 and possibly even higher order excited states. Thus, the analysis of ESR spectra is carried out by using Equation (1). To avoid over-parameterization, only S = 12 and S =11 are taken into account. The simulated spectra at 154 GHz are shown in Figure 3b and an example simulation of the 2 K spectrum is given in Figure 3c, where both S = 12 and S = 11 contributions are shown. The best simulation reproduces the spectrum at 2 K very well, yielding g = 2.03 and D = −0.069 K for S = 12 (weight 0.60 ± 0.05), and g = 2.03 and D ≈ 0 for S = 11 (weight 0.40 ± 0.04). The two weak low-field peaks marked with asterisks in Figure 3a are not considered in the simulation because their origin is not clear.
Based on the above simulations, the multi-peak structure of the spectra is easy to understand. At 154 GHz, the Zeeman energy is about 7.3 K and all S = 12 and S = 11 quantum levels are expected to be populated at 2 K. The strong central peak, A1, at around 5.4 T is attributed to the transitions between the S = 11 quantum levels. The intrinsic linewidth (FWHM) for an ESR transition used in the simulation is 412 mT. The spectral width is small because the magnetic anisotropy (i.e., D) is negligible for S = 11 quantum levels. The spectrum across the larger field range from 4.4 to 6.2 T (between A2 and A3) appears as a broad structure as a result of multiple resonance peaks from a larger spin ground state of S = 12, which splits into 2S + 1 Zeeman levels in magnetic fields. Within the S = 12 quantum levels, A2 pertains to the M = −12→ −11 transition and A3 to the M = 11→12 transition. The broadband between A2 and A3 consists of the resonance peaks of other allowed transitions; however, these are difficult to resolve unambiguously. The intensity of A3 is higher than that of A2, revealing that the sign of D for S = 12 quantum levels is negative. Therefore, {Cr8Y8} exhibits a negative axial magnetic anisotropy and the Ms = ±12 levels have the lowest zero-field energy for H//easy axis. Axial magnetic anisotropy exists widely in the Cr-based molecular wheels. Although the ground state of the antiferromagnetic ring {Cr8} is a nonmagnetic singlet (total S = 0), it has an anisotropy axis z perpendicular to the ring plane [17]. Significant anisotropy has been found in a large family of {Cr7M} (M = a divalent ion, e.g., Ni2+, Mn2+, Zn2+, Co2+, and Cu2+), whose z axis is effectively chosen to be perpendicular to the mean plane of the molecular ring [18,19,20]. Some ferromagnetically coupled {Cr10} wheels also exhibit small axial magnetic anisotropy in the ground state, whose ZFS parameter D can be as low as −0.057 K [21,22].
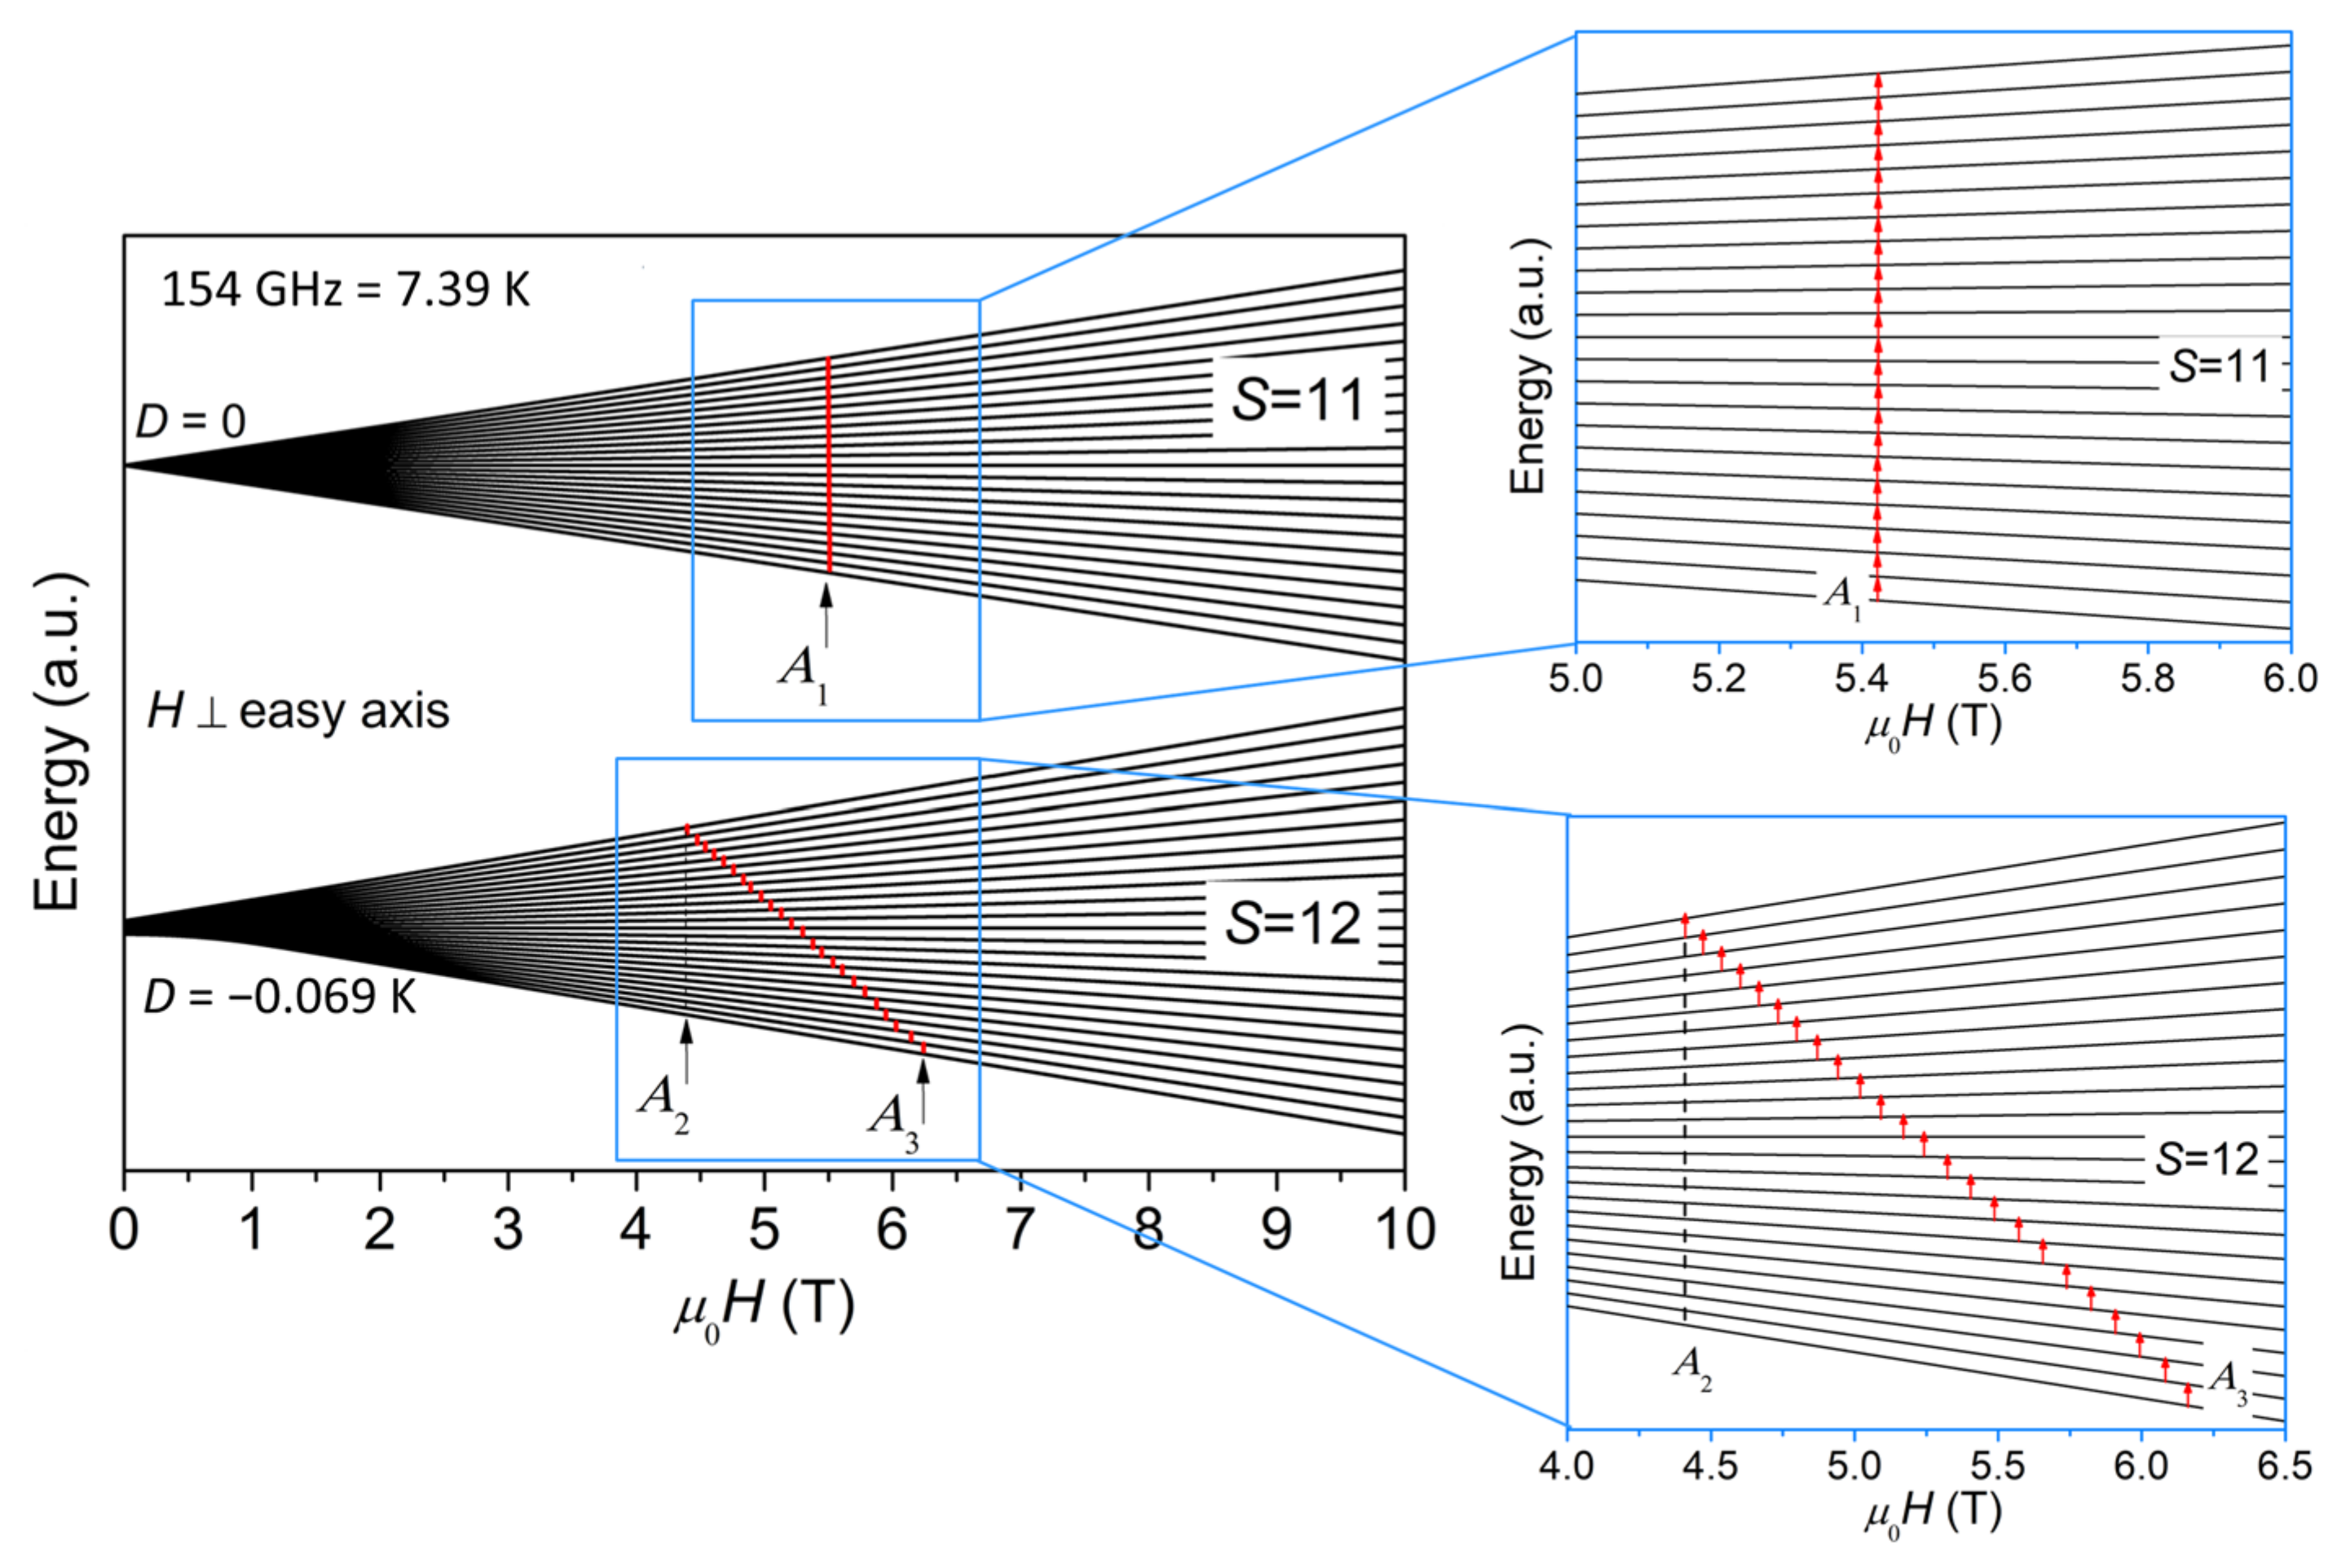
Figure 4 plots a schematic representation of the energy levels for S = 12 and S = 11 as a function of magnetic field (H⊥easy axis), where A1, A2, and A3 are marked with arrows. The case for H//easy axis is shown in Figure S1 in Supplementary Materials. The diagram for H⊥easy axis in Figure 4 explains how the ESR peaks are assigned, i.e., because the contribution from H⊥easy axis is dominant for powder ESR spectra, as noted earlier. For the sake of clarity, the S = 11 quantum levels are shifted along y axis to be set apart from the S = 12 quantum levels in Figure 4. The separation of S = 11 and S = 12 quantum levels does not affect the data interpretation or central purpose of this paper because of the ΔS = 0 selection rule for ESR. It should be noted here that we assume the effect of level crossing induced by the applied magnetic field is insignificant. Although we have not seen any sign of level crossing in the field dependence of magnetization [9] and the heat capacity at various external fields [10], we cannot rule out the possibility of level crossing, considering the fact that the temperature and field ranges of the previous magnetization and heat capacity investigations are limited and may not reach the conditions for level crossing to occur. If level crossing did play a role, additional ESR lines would appear [23]. However, our ESR spectra certainly do not have enough resolution to resolve these additional lines and identify level crossing. Therefore, more investigations will be needed to address the issue of level crossing in the future.
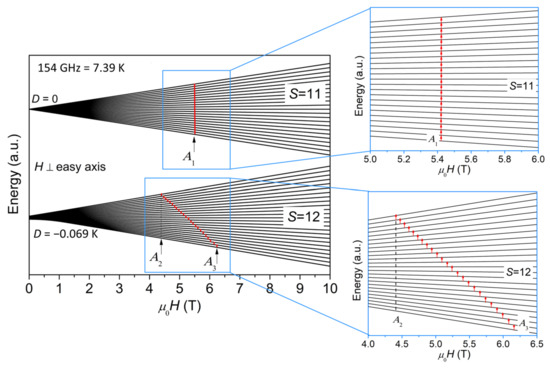
Figure 4.
A schematic representation of the energy levels for S = 11 and S = 12 as a function of magnetic field (H⊥easy axis), where A1, A2, and A3 for 154 GHz are marked with arrows. The S = 11 and S = 12 quantum levels are separated for the sake of clarity. The regions where the transitions at 154 GHz occur are zoomed in and shown on the right.
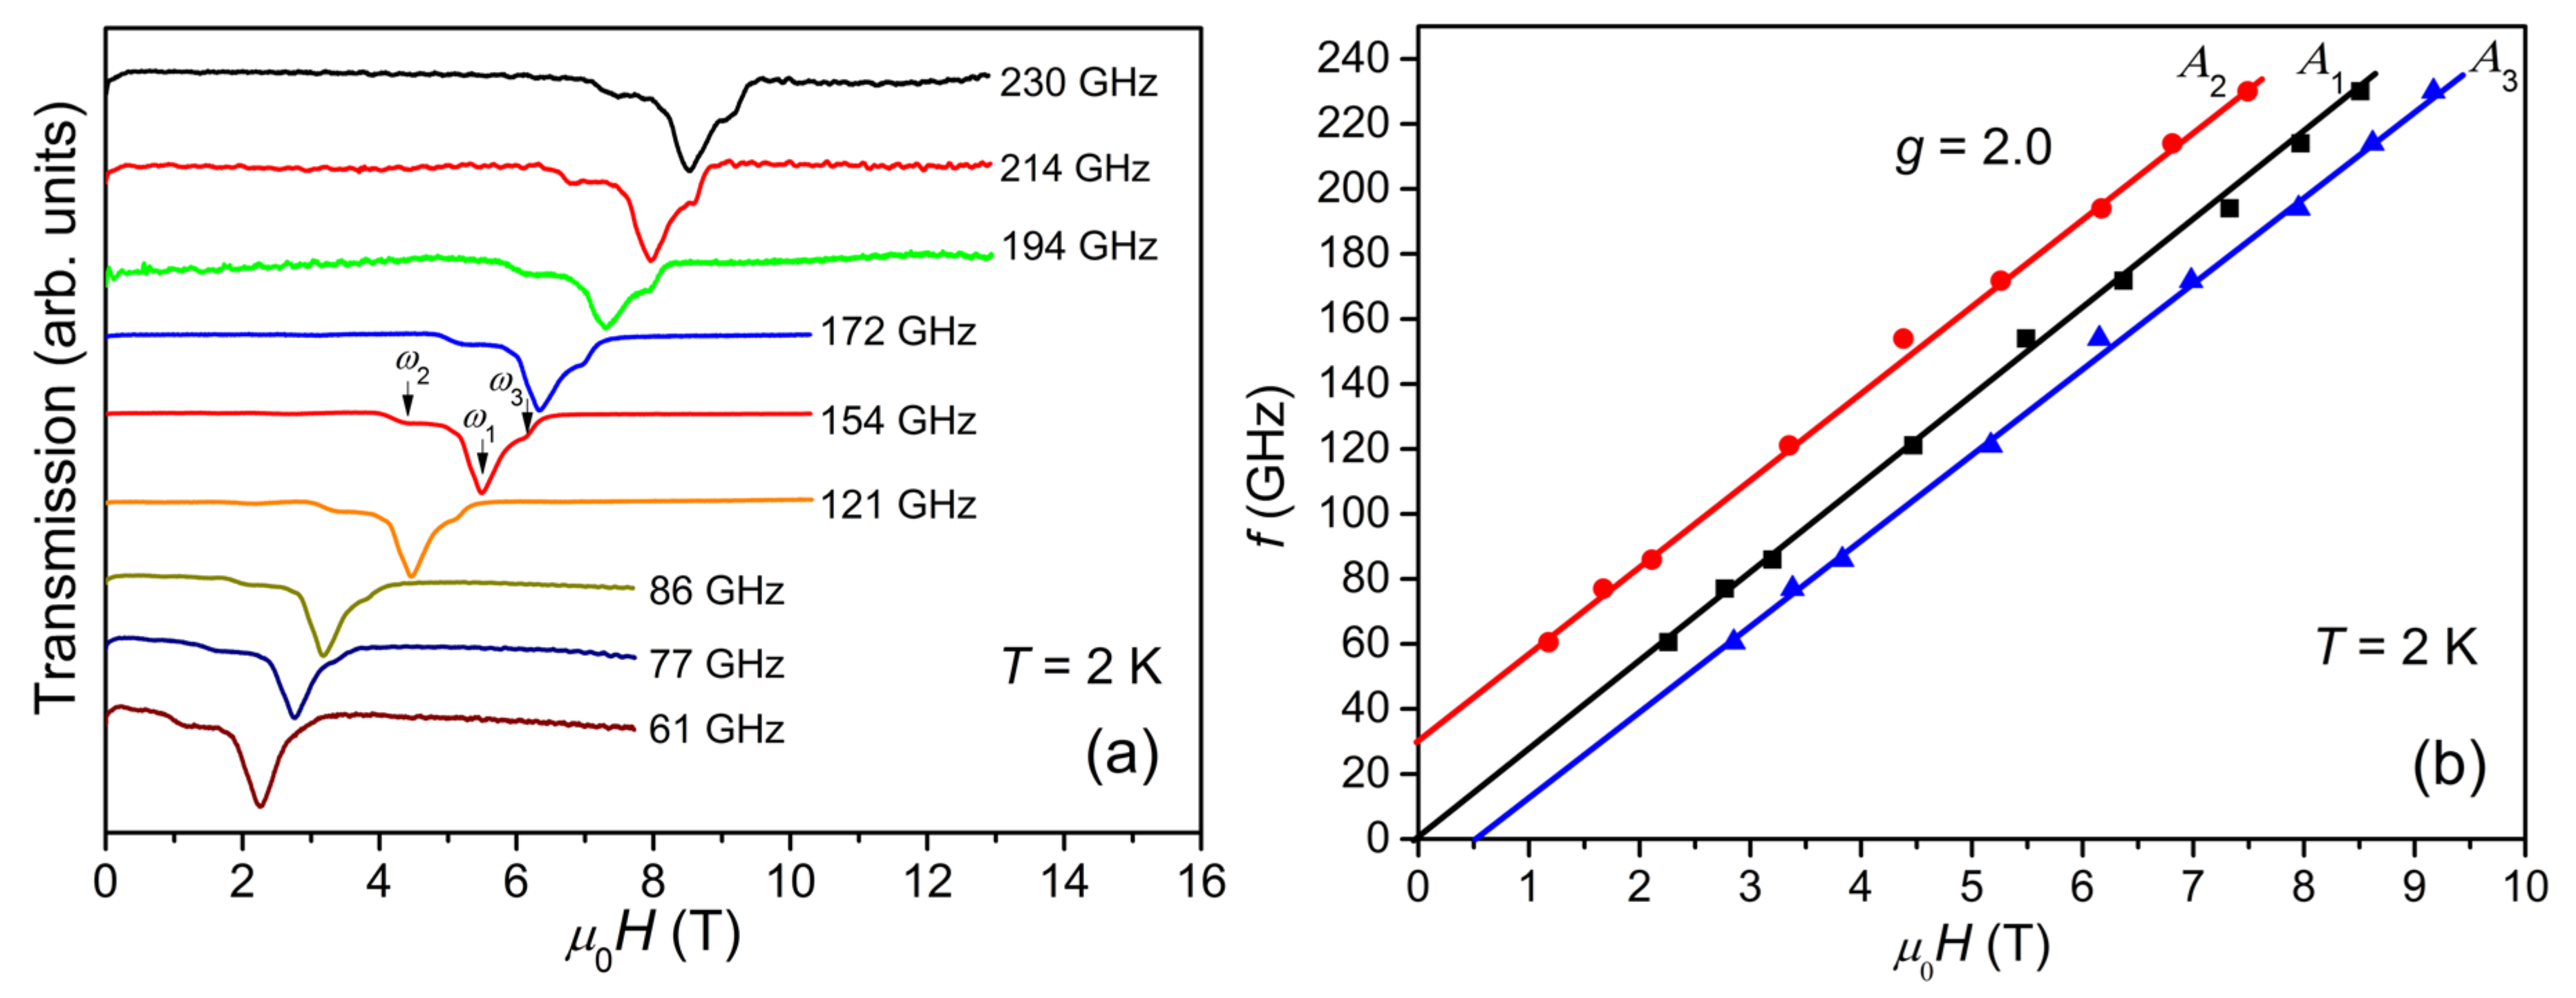
Figure 5a shows the ESR spectra collected at 2 K with frequencies varying from 61 to 230 GHz. The spectra move regularly to higher fields with increasing frequency. All spectra look quite similar to each other and cover a magnetic field range of about 1.8 T, independent of the frequency. The frequency vs. magnetic field (f-H) plots for A1, A2, and A3 are shown in Figure 5b. The frequencies for A2 and A3 exhibit a good linear dependence on the magnetic fields, yielding a g-factor value of 2.0 as expected for Cr3+ ions. The extrapolation of the f-H plot of A1 passes through the origin, suggesting a negligible D parameter for S = 11. The y-intercept of the f-H plot of A2, Δ ≈ 30 GHz, relates to the magnetic anisotropy gap arising from the ZFS of the S = 12 spin states. Since Δ = (122 − 112)│D│, the estimated value of │D│ is 0.063 K, which is in agreement with the simulation result.
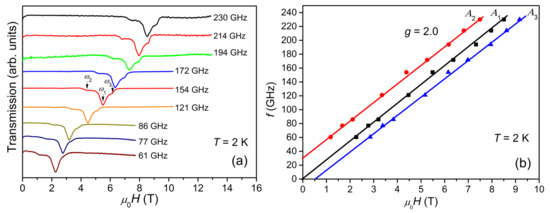
Figure 5.
(a) ESR spectra collected at 2 K with frequencies varying from 61 to 230 GHz. (b) The f-H diagram: black squares, red circles, and blue triangles correspond to the central peak, A1, low-field peak, A2, and high-field peak, A3, respectively. The solid straight lines represent linear fits to the corresponding f-H plots.
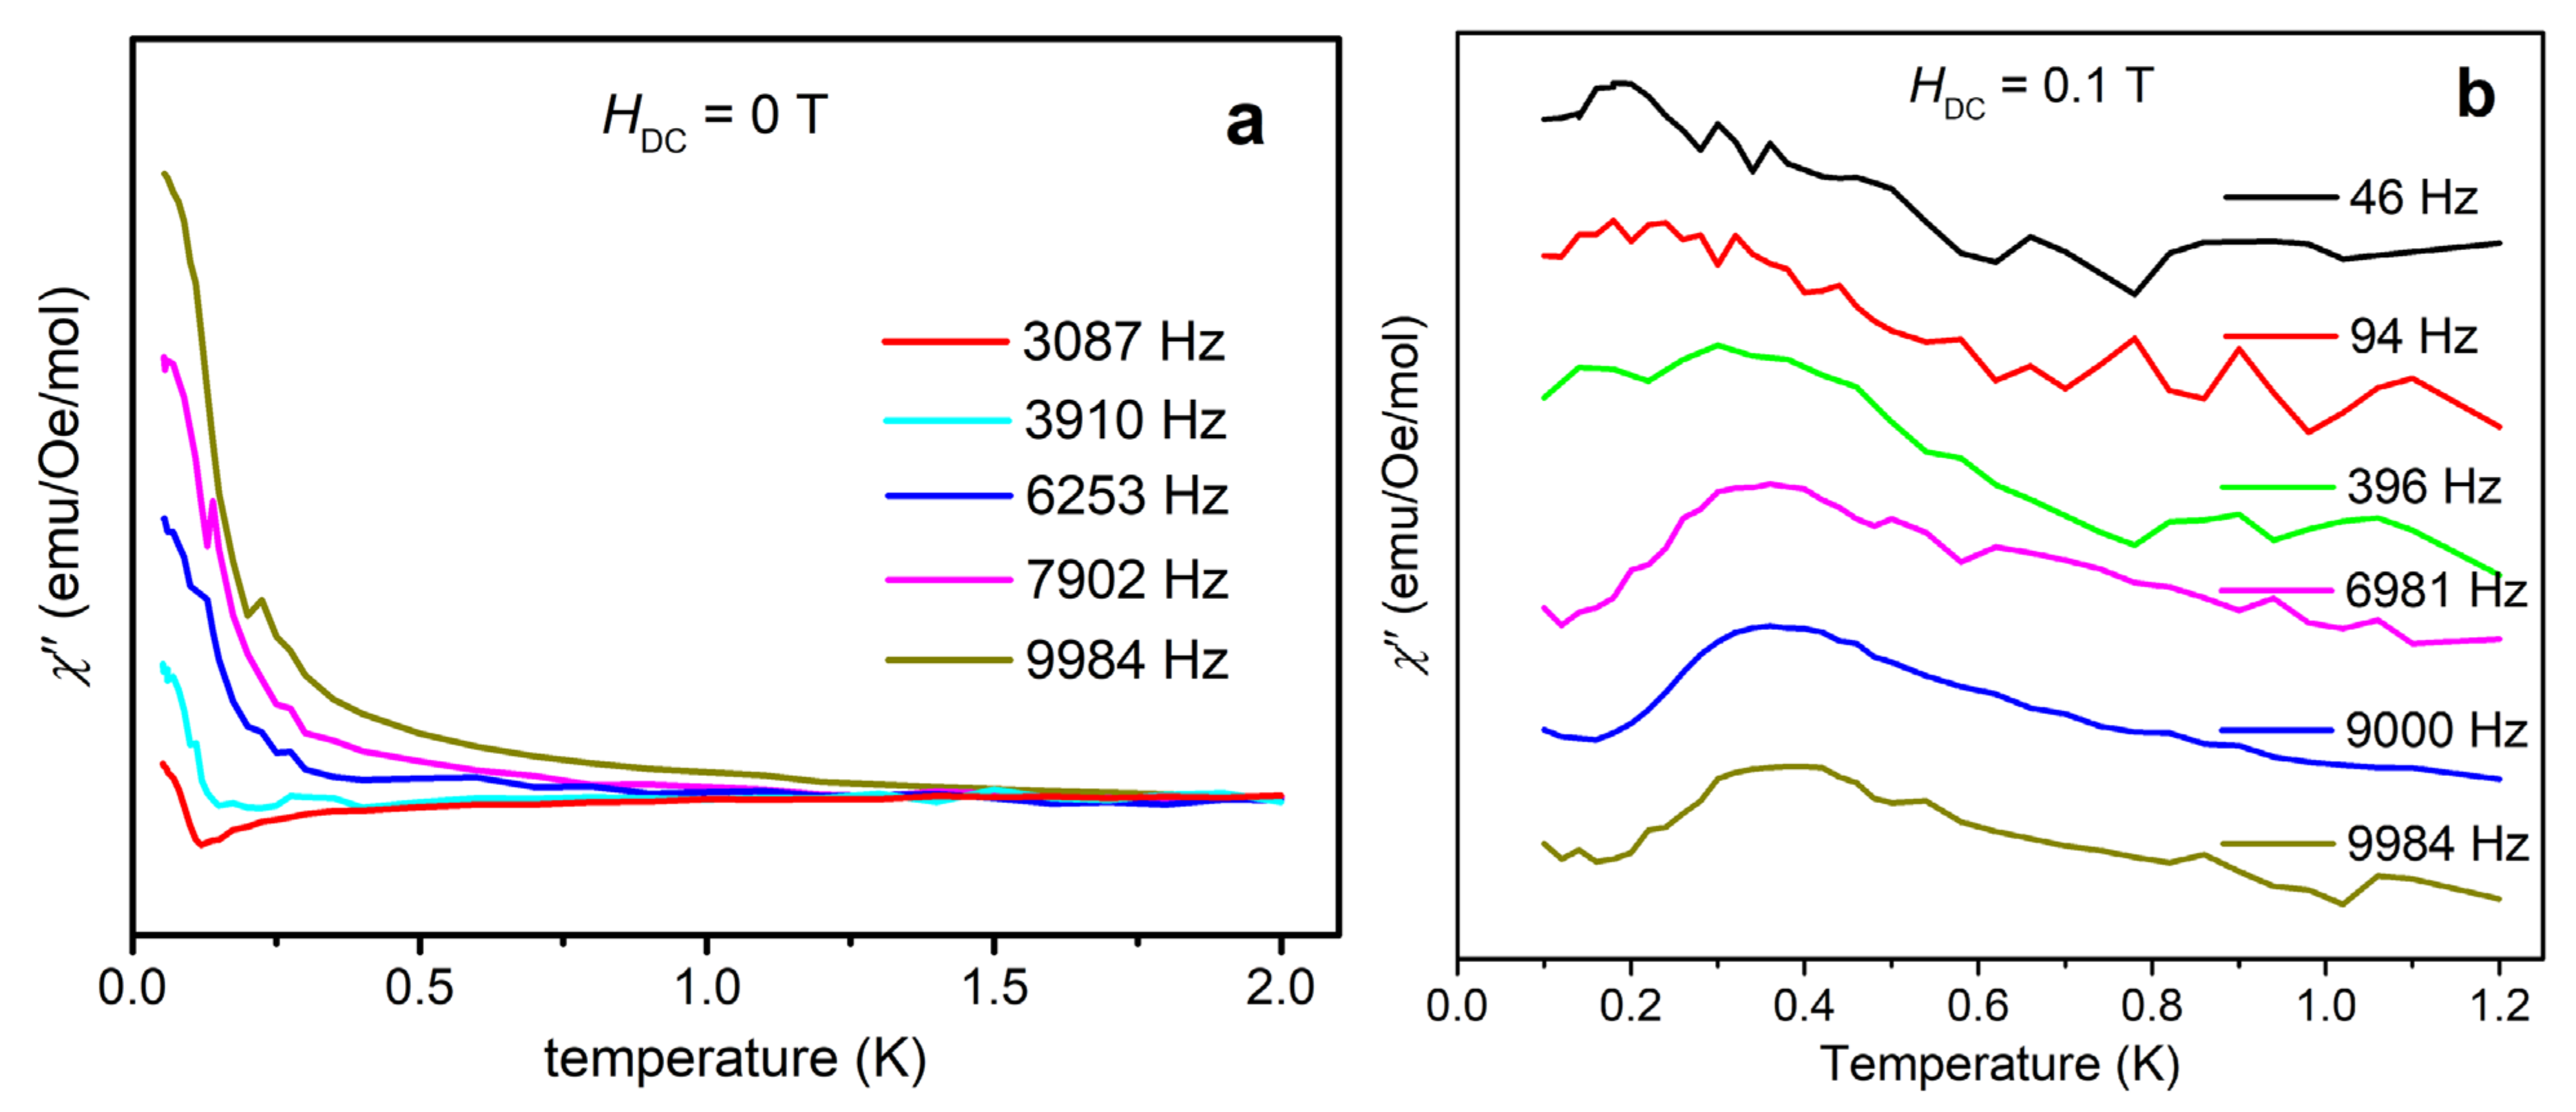
The ESR results show that {Cr8Y8} represents a rare example of ferromagnetic Cr3+ molecular rings with a total ground-state spin of 12 and a negative ZFS parameter D. Single-molecule magnet (SMM) behavior may arise in such complexes [24]. AC magnetic susceptibility is a powerful method to probe the slow relaxation of magnetization, which is characteristic of SMM. Below the blocking temperature, the reverse of molecular magnetization cannot follow the oscillating AC field, giving rise to a frequency-dependent out-of-phase magnetic susceptibility χ”. In Reference 9, no frequency-dependent χ” has been observed by AC susceptibility, indicative of no SMM behavior in {Cr8Y8} above 2 K. This outcome is reasonable because the magnetic anisotropy is very small, as found by HF-ESR. Therefore, we have measured χ” down to 50 mK by using a PPMS Dynacool instrument equipped with a 3He-4He dilution refrigerator. Indeed, a χ” signal is observed and shows a discernible frequency dependence, as shown in Figure 6a. However, the peak value cannot be extracted. A tail of peak is seen below about 0.5 K, indicative of fast quantum tunneling of magnetization (QTM) through the spin-reversal barrier via degenerate energy levels [25,26]. In order to better observe the χ” peaks, we applied an external magnetic field to reduce QTM for the following reasons: 1) the external field increases the barrier to thermally-activated relaxation; and 2) the external field makes the energy levels on one side of the double-well molecular energy spectrum mismatch those on the other side, and thus decreases the rate of resonant QTM. Therefore, the χ” peaks should shift to higher temperatures and provide more evidence for the possible SMM behavior. Figure 6b shows the χ” signal recorded with an external magnetic field of 0.1 T at various frequencies from 46 to 9984 Hz in the temperature range of 0.1–1.2 K. In Figure 6b, a clear frequency-dependent χ” peak can be seen at around 0.2 K at low frequencies. It shifts to around 0.4 K at high frequencies, indicative of a field-induced SMM behavior. The peak position represents the temperature at which the relaxation rate matches the AC field frequency. The temperature for slow relaxation is very low, consistent with the small magnetic anisotropy energy as determined by HF-ESR. Further AC susceptibility investigation with higher external fields may be interesting, but is beyond the scope of this paper.
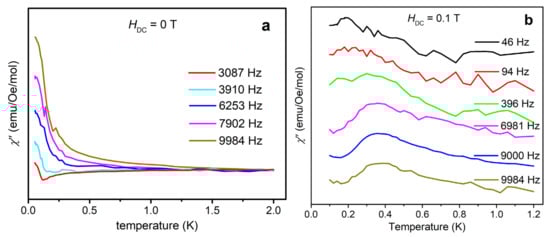
Figure 6.
(a) Out-of-phase AC susceptibility χ” measured under zero external magnetic field with various frequencies from 50 mK to 2 K. The peak tails below 0.5 K may indicate fast quantum tunneling of magnetization (QTM) via degenerate energy levels. (b) Out-of-phase AC susceptibility χ” measured under 0.1 T external magnetic field with various frequencies from 46 to 9984 Hz in the temperature range of 0.1–1.2 K. Because the applied field suppresses QTM, the χ” peaks are visible and show frequency dependence, indicative of field-induced SMM behaviors.
4. Conclusions
We have measured the HF-ESR spectra from the ferromagnetic molecular ring {Cr8Y8} at various incident frequencies and temperatures. The resonance peaks observed are attributed to the transitions between the quantum levels of S = 12 and S = 11 spin states. The temperature-dependent transfer of ESR spectral weight shows that the sign of the ZFS parameter D is negative. The best simulation of ESR spectra yields D = −0.069 K for S = 12 spin states. The zero-field AC susceptibility shows frequency-dependent χ” signals and signature of fast QTM below ~0.5 K. By applying an external magnetic field, the rate of QTM is suppressed and the frequency dependence of χ” peaks suggests a field-induced SMM behavior. The temperature to observe the SMM behavior of {Cr8Y8} is very low, which is in agreement with the small anisotropy energy determined by HF-ESR. The detailed HF-ESR investigation presented in this paper will benefit studies on the family of {Cr8Ln8} molecular wheels and also highlights the importance of the HF-ESR method as a high-resolution probe in determining the ZFS parameters with very small magnitude.
Supplementary Materials
The following supporting information can be downloaded at: https://www.mdpi.com/article/10.3390/magnetochemistry9020049/s1, Figure S1: A Schematic representation of the energy levels for S = 11 and S = 12 as a function of magnetic field (H//easy axis). The allowed transitions for 154 GHz are marked with red arrows. The S = 11 and S = 12 levels are separated for the sake of clarity.
Author Contributions
Conceptualization, Z.F. and Y.-Z.Z.; methodology, Z.-W.O.; software, H.B.; validation, Z.-W.O. and W.T.; investigation, Z.F., Z.-W.O. and Q.-C.L.; resources, Z.F.; sample preparation, Q.-C.L. and H.B.; data curation, W.T.; writing—original draft preparation, Z.F. and Z.-W.O.; writing—review and editing, Z.F., Z.-W.O. and H.G.; visualization, Z.F.; supervision, J.-K.Z.; project administration, Y.-Z.Z.; funding acquisition, Z.F. and Z.-W.O. All authors have read and agreed to the published version of the manuscript.
Funding
This work was supported by the National Natural Science Foundation of China (Grant Nos. 11875325 and U20A2073) and the China Institute of Atomic Energy (Grant No. 16YZ201809). A portion of this work was performed on the Steady High Magnetic Field Facilities, High Magnetic Field Laboratory, CAS.
Institutional Review Board Statement
Not applicable.
Informed Consent Statement
Not applicable.
Data Availability Statement
All relevant data that support the findings of this study are available from the corresponding authors on request.
Conflicts of Interest
The authors declare no conflict of interest.
References
- Troiani, F.; Ghirri, A.; Affronte, M.; Carretta, S.; Santini, P.; Amoretti, G.; Piligkos, S.; Timco, G.; Winpenny, R.E.P. Molecular Engineering of Antiferromagnetic Rings for Quantum Computation. Phys. Rev. Lett. 2005, 94, 207208. [Google Scholar] [CrossRef] [PubMed]
- Ardavan, A.; Rival, O.; Morton, J.J.L.; Blundell, S.J.; Tyryshkin, A.M.; Timco, G.A.; Winpenny, R.E.P. Will Spin-Relaxation Times in Molecular Magnets Permit Quantum Information Processing? Phys. Rev. Lett. 2007, 98, 057201. [Google Scholar] [CrossRef] [PubMed]
- Wedge, C.J.; Timco, G.A.; Spielberg, E.T.; George, R.E.; Tuna, F.; Rigby, S.; McInnes, E.J.L.; Winpenny, R.E.P.; Blundell, S.J.; Ardavan, A. Chemical Engineering of Molecular Qubits. Phys. Rev. Lett. 2012, 108, 107204. [Google Scholar] [CrossRef]
- Ma, X.; Li, H.; Chen, L.; Zhao, J. The main progress over the past decade and future outlook on high-nuclear transition-metal substituted polyoxotungstates: From synthetic strategies, structural features to functional properties. Dalton Trans. 2016, 45, 4935–4960. [Google Scholar] [CrossRef]
- Woodruff, D.N.; Winpenny, R.E.P.; Layfield, R.A. Lanthanide Single-Molecule Magnets. Chem. Rev. 2013, 113, 5110–5148. [Google Scholar] [CrossRef]
- Wang, H.-S.; Zhang, K.; Song, Y.; Pan, Z.-Q. Recent advances in 3d-4f magnetic complexes with several types of non-carboxylate organic ligands. Inorg. Chim. Acta 2021, 521, 120318. [Google Scholar] [CrossRef]
- Zhang, H.-L.; Zhai, Y.-Q.; Qin, L.; Ungur, L.; Nojiri, H.; Zheng, Y.-Z. Single-Molecule Toroic Design through Magnetic Exchange Coupling. Matter 2020, 2, 1481–1493. [Google Scholar] [CrossRef]
- Vignesh, K.R.; Langley, S.K.; Moubaraki, B.; Murray, K.S.; Rajaraman, G. Large Hexadecametallic {Mn(III)-Ln(III)} Wheels: Synthesis, Structural, Magnetic, and Theoretical Characterization. Chemistry 2015, 21, 16364–16369. [Google Scholar] [CrossRef] [PubMed]
- Qin, L.; Singleton, J.; Chen, W.P.; Nojiri, H.; Engelhardt, L.; Winpenny, R.E.P.; Zheng, Y.Z. Quantum Monte Carlo Simulations and High-Field Magnetization Studies of Antiferromagnetic Interactions in a Giant Hetero-Spin Ring. Angew. Chem. Int. Ed. Engl. 2017, 56, 16571–16574. [Google Scholar] [CrossRef] [PubMed]
- Fu, Z.; Qin, L.; Sun, K.; Hao, L.; Zheng, Y.-Z.; Lohstroh, W.; Günther, G.; Russina, M.; Liu, Y.; Xiao, Y.; et al. Low-temperature spin dynamics of ferromagnetic molecular ring {Cr8Y8}. npj Quantum Mater. 2020, 5, 32. [Google Scholar] [CrossRef]
- Gatteschi, D.; Barra, A.L.; Caneschi, A.; Cornia, A.; Sessoli, R.; Sorace, L. EPR of Molecular Nanomagnets. Coord. Chem. Rev. 2006, 250, 1514–1529. [Google Scholar] [CrossRef]
- Wang, S.L.; Li, L.; Ouyang, Z.W.; Xia, Z.C.; Xia, N.M.; Peng, T.; Zhang, K.B. Development of High-magnetic-field, High Frequency Electronic Spin Resonance System. Acta Phys. Sin. 2012, 61, 107601. [Google Scholar] [CrossRef]
- Nojiri, H.; Ouyang, Z.W. THz Electron Spin Resonance on Nanomagnets. Terahertz Sci. Technol. 2012, 5, 1–10. [Google Scholar]
- Stoll, S.; Schweiger, A. EasySpin, a Comprehensive Software Package for Spectral Simulation and Analysis in EPR. J. Magn. Reson. 2006, 178, 42–55. [Google Scholar] [CrossRef]
- Hofer, P. Basic experimental methods in continuous wave electron paramagnetic resonance. In Electron Paramagnetic Resonance, a Practitioners Toolkit; Brustolon, M., Giamello, E., Eds.; John Wiley & Sons, Inc.: Hoboken, NJ, USA, 2009; pp. 37–82. [Google Scholar]
- Weil, J.A.; Bolton, J.R. Electron Paramagnetic Resonance: Elementary Theory and Practical Applications, 2nd ed.; Wiley-Interscience: Hoboken, NJ, USA, 2007. [Google Scholar]
- Baker, M.L.; Guidi, T.; Carretta, S.; Ollivier, J.; Mutka, H.; Güdel, H.U.; Timco, G.A.; McInnes, E.J.L.; Amoretti, G.; Winpenny, R.E.P.; et al. Spin dynamics of molecular nanomagnets unraveled at atomic scale by four-dimensional inelastic neutron scattering. Nat. Phys. 2012, 8, 906–911. [Google Scholar] [CrossRef]
- Timco, G.A.; McInnes, E.J.L.; Winpenny, R.E.P. Physical studies of heterometallic rings: An ideal system for studying magnetically-coupled systems. Chem. Soc. Rev. 2013, 42, 1796–1806. [Google Scholar] [CrossRef]
- Timco, G.A.; McInnes, E.J.L.; Pritchard, R.G.; Tuna, F.; Winpenny, R.E.P. Heterometallic Rings Made From Chromium Stick Together Easily. Angew. Chem. Int. Ed. 2008, 47, 9681–9684. [Google Scholar] [CrossRef] [PubMed]
- Garlatti, E.; Albring, M.A.; Baker, M.L.; Docherty, R.J.; Mutka, H.; Guidi, T.; Garcia, S.V.; Whitehead, G.F.; Pritchard, R.G.; Timco, G.A.; et al. A detailed study of the magnetism of chiral {Cr₇M} rings: An investigation into parametrization and transferability of parameters. J. Am. Chem. Soc. 2014, 136, 9763–9772. [Google Scholar] [CrossRef]
- Sharmin, S.; Ardavan, A.; Blundell, S.J.; Coldea, A.I.; McInnes, E.J.L.; Low, D. Electron paramagnetic resonance studies of the high-spin molecule Cr10(OMe)20(O2CCMe3)10. Appl. Phys. Lett. 2005, 86, 032507. [Google Scholar] [CrossRef]
- Low, D.M.; Rajaraman, G.; Helliwell, M.; Timco, G.; van Slageren, J.; Sessoli, R.; Ochsenbein, S.T.; Bircher, R.; Dobe, C.; Waldmann, O.; et al. A family of ferro- and antiferromagnetically coupled decametallic chromium(III) wheels. Chemistry 2006, 12, 1385–1396. [Google Scholar] [CrossRef]
- Galeev, R.T. Manifestation of the Anticrossing of Energy Levels in EPR Spectra of Spin Clusters. Phys. Solid State 2016, 58, 1098–1100. [Google Scholar] [CrossRef]
- Gatteschi, D.; Sessoli, R.; Villain, J. Molecular Nanomagnets, 1st ed.; Oxford University Press: Oxford, UK, 2006. [Google Scholar]
- Sessoli, R.; Gatteschi, D.; Caneschi, A.; Novak, M.A. Magnetic bistability in a metal-ion cluster. Nature 1993, 365, 141–143. [Google Scholar] [CrossRef]
- Habib, F.; Lin, P.H.; Long, J.; Korobkov, I.; Wernsdorfer, W.; Murugesu, M. The use of magnetic dilution to elucidate the slow magnetic relaxation effects of a Dy2 single-molecule magnet. J. Am. Chem. Soc. 2011, 133, 8830–8833. [Google Scholar] [CrossRef] [PubMed]
Disclaimer/Publisher’s Note: The statements, opinions and data contained in all publications are solely those of the individual author(s) and contributor(s) and not of MDPI and/or the editor(s). MDPI and/or the editor(s) disclaim responsibility for any injury to people or property resulting from any ideas, methods, instructions or products referred to in the content. |
© 2023 by the authors. Licensee MDPI, Basel, Switzerland. This article is an open access article distributed under the terms and conditions of the Creative Commons Attribution (CC BY) license (https://creativecommons.org/licenses/by/4.0/).