Article

Observations of Time-Domain Structures in the Plasmaspheric Plume by Van Allen Probes

1
State Key Laboratory of Marine Geology, School of Ocean and Earth Science, Tongji University, Shanghai 200092, China
2
Department of Physics, Auburn University, Auburn, AL 36849, USA
*
Author to whom correspondence should be addressed.
Magnetochemistry 2023, 9(1), 22; https://doi.org/10.3390/magnetochemistry9010022
Submission received: 14 December 2022 / Revised: 31 December 2022 / Accepted: 3 January 2023 / Published: 5 January 2023
(This article belongs to the Special Issue Magnetodynamics of Space Plasmas)

Abstract

:
Time-domain structures (TDS), manifested as ≥ 1 ms pulses with significant parallel electric fields, play an important role in accelerating electrons in the field-aligned direction. These precipitated electrons contribute to the formation of aurora. In this study, we present observations of time-domain structures that occurred in the plasmaspheric plumes at the post-midnight to dawn sector. The close correlation between TDS and plasmaspheric plumes implies that the generation of TDS might be modulated by plasma density. During the wave occurrence, protons with an energy level below 1 keV show the enhanced field-aligned pitch-angle distributions, and the electron fluxes with the energies ranging from tens to hundreds of eV are also significantly enhanced. The correlation between TDS and scattered particles indicates the importance of including time-domain structures in future studies of radiation belt dynamics.

1. Inroduction

Plasmaspheric plumes are important plasma regions partially detached from the plasmasphere and may extend far from the Earth [1,2]. A number of satellite missions and ground-based measurements observed the plasmaspheric plume structures beyond the plasmapause [3,4]. They can be identified as a significant localized density increase, followed by a sharp density decrease near the plasmapause [5]. Plasmaspheric plumes preferentially occur under geomagnetic storms or substorms from the duskside to nightside sector [6,7].
Plasmaspheric plumes can provide favorable conditions for generating different types of plasma waves, such as plasmaspheric hiss [8,9,10], whistler-mode chorus [11], and electromagnetic ion cyclotron waves [12,13]. These plasma waves play a crucial role in the dynamics of the inner magnetosphere and the coupling between the magnetosphere and the ionosphere. For example, plasmaspheric hiss is found to be very effective in energetic electron precipitation loss [14,15]. Evidence of scattering the radiation belt electrons and heating cold electrons caused by electromagnetic ion cyclotron waves has also been found in plasmaspheric plumes [10,13]. Thus, plasma waves in plasmaspheric plumes have attracted a lot of attention from researchers in the community.
Time-domain structures (TDS) are of several milliseconds duration; they are repetitive spikes with significant parallel electric field components [16]. These structures are abundant through space and occur in the Van Allen radiation belt at L ∼ 5–6 from the night to the dawn sector [17,18]. TDS are believed to produce magnetic-field-aligned electron-pitch-angle distributions at energies up to a hundred keV [16,19,20]. Numerical simulations confirmed that TDS could accelerate thermal electrons along geomagnetic field lines [21,22]. Direct observational evidence supports that TDS scatter electrons into the ionosphere [23]. Although some generation mechanisms of TDS have been proposed, including the instability of two electron beams, parametric decay, and nonlinear evolution [16,22,24,25], the detailed process is still an ongoing topic.
TDS were observed in different plasma regions of space before, such as in the polar magnetosphere [19], the magnetotail [26], the plasma sheet boundary [27], and the magnetic reconnection location [28]. In this study, by analyzing the data from the Van Allen Probes satellite, we show that TDS are observed within the plasmaspheric plumes. These waves might be associated with field-aligned distributed protons and the enhancement of electron flux.

2. Instruments and Data

The Van Allen Probes consisting of two identical spacecraft (A and B) were launched in 2012 into a nearly equatorial elliptical orbit. The perigee of the orbit is ∼ 1.1 R E , and the apogee is ∼ 6.5 R E . The mission covers most regions of the inner magnetosphere and provides a comprehensive plasma wave, and particle measurements [29]. The wave magnetic field measurements used in this study are from the Electric and Magnetic Field Instrument Suite and Integrated Science (EMFISIS) [30]. The EMFISIS suite contains the tri-axial fluxgate magnetometer (MAG), the waveform frequency receiver (WFR), and the high-frequency receiver (HFR) covering different frequency ranges. The MAG observes the local magnetic field, and the WFR provides the wave spectra matrix in the frequency range from ∼10 Hz to 12 kHz. A primary objective of HFR is the determination of the electron density, which can be inferred from upper hybrid frequency [31]. The electric field data from the Electric Fields and Waves (EFW) instruments [32] can measure waves with frequencies below 16 Hz. The helium oxygen proton electron (HOPE) instrument measures electrons and ions with different species over the energy range from ∼1 eV to ∼50 keV [33]. The energetic and relativistic particle flux is measured by MagEIS [34] and REPT [35]. In this study, we only use the HOPE instrument for particle analysis.

3. Observation

In this section, we present representative events that show the characteristics of time-domain structures (TDS) in plasmaspheric plumes and their effects on particle dynamics.

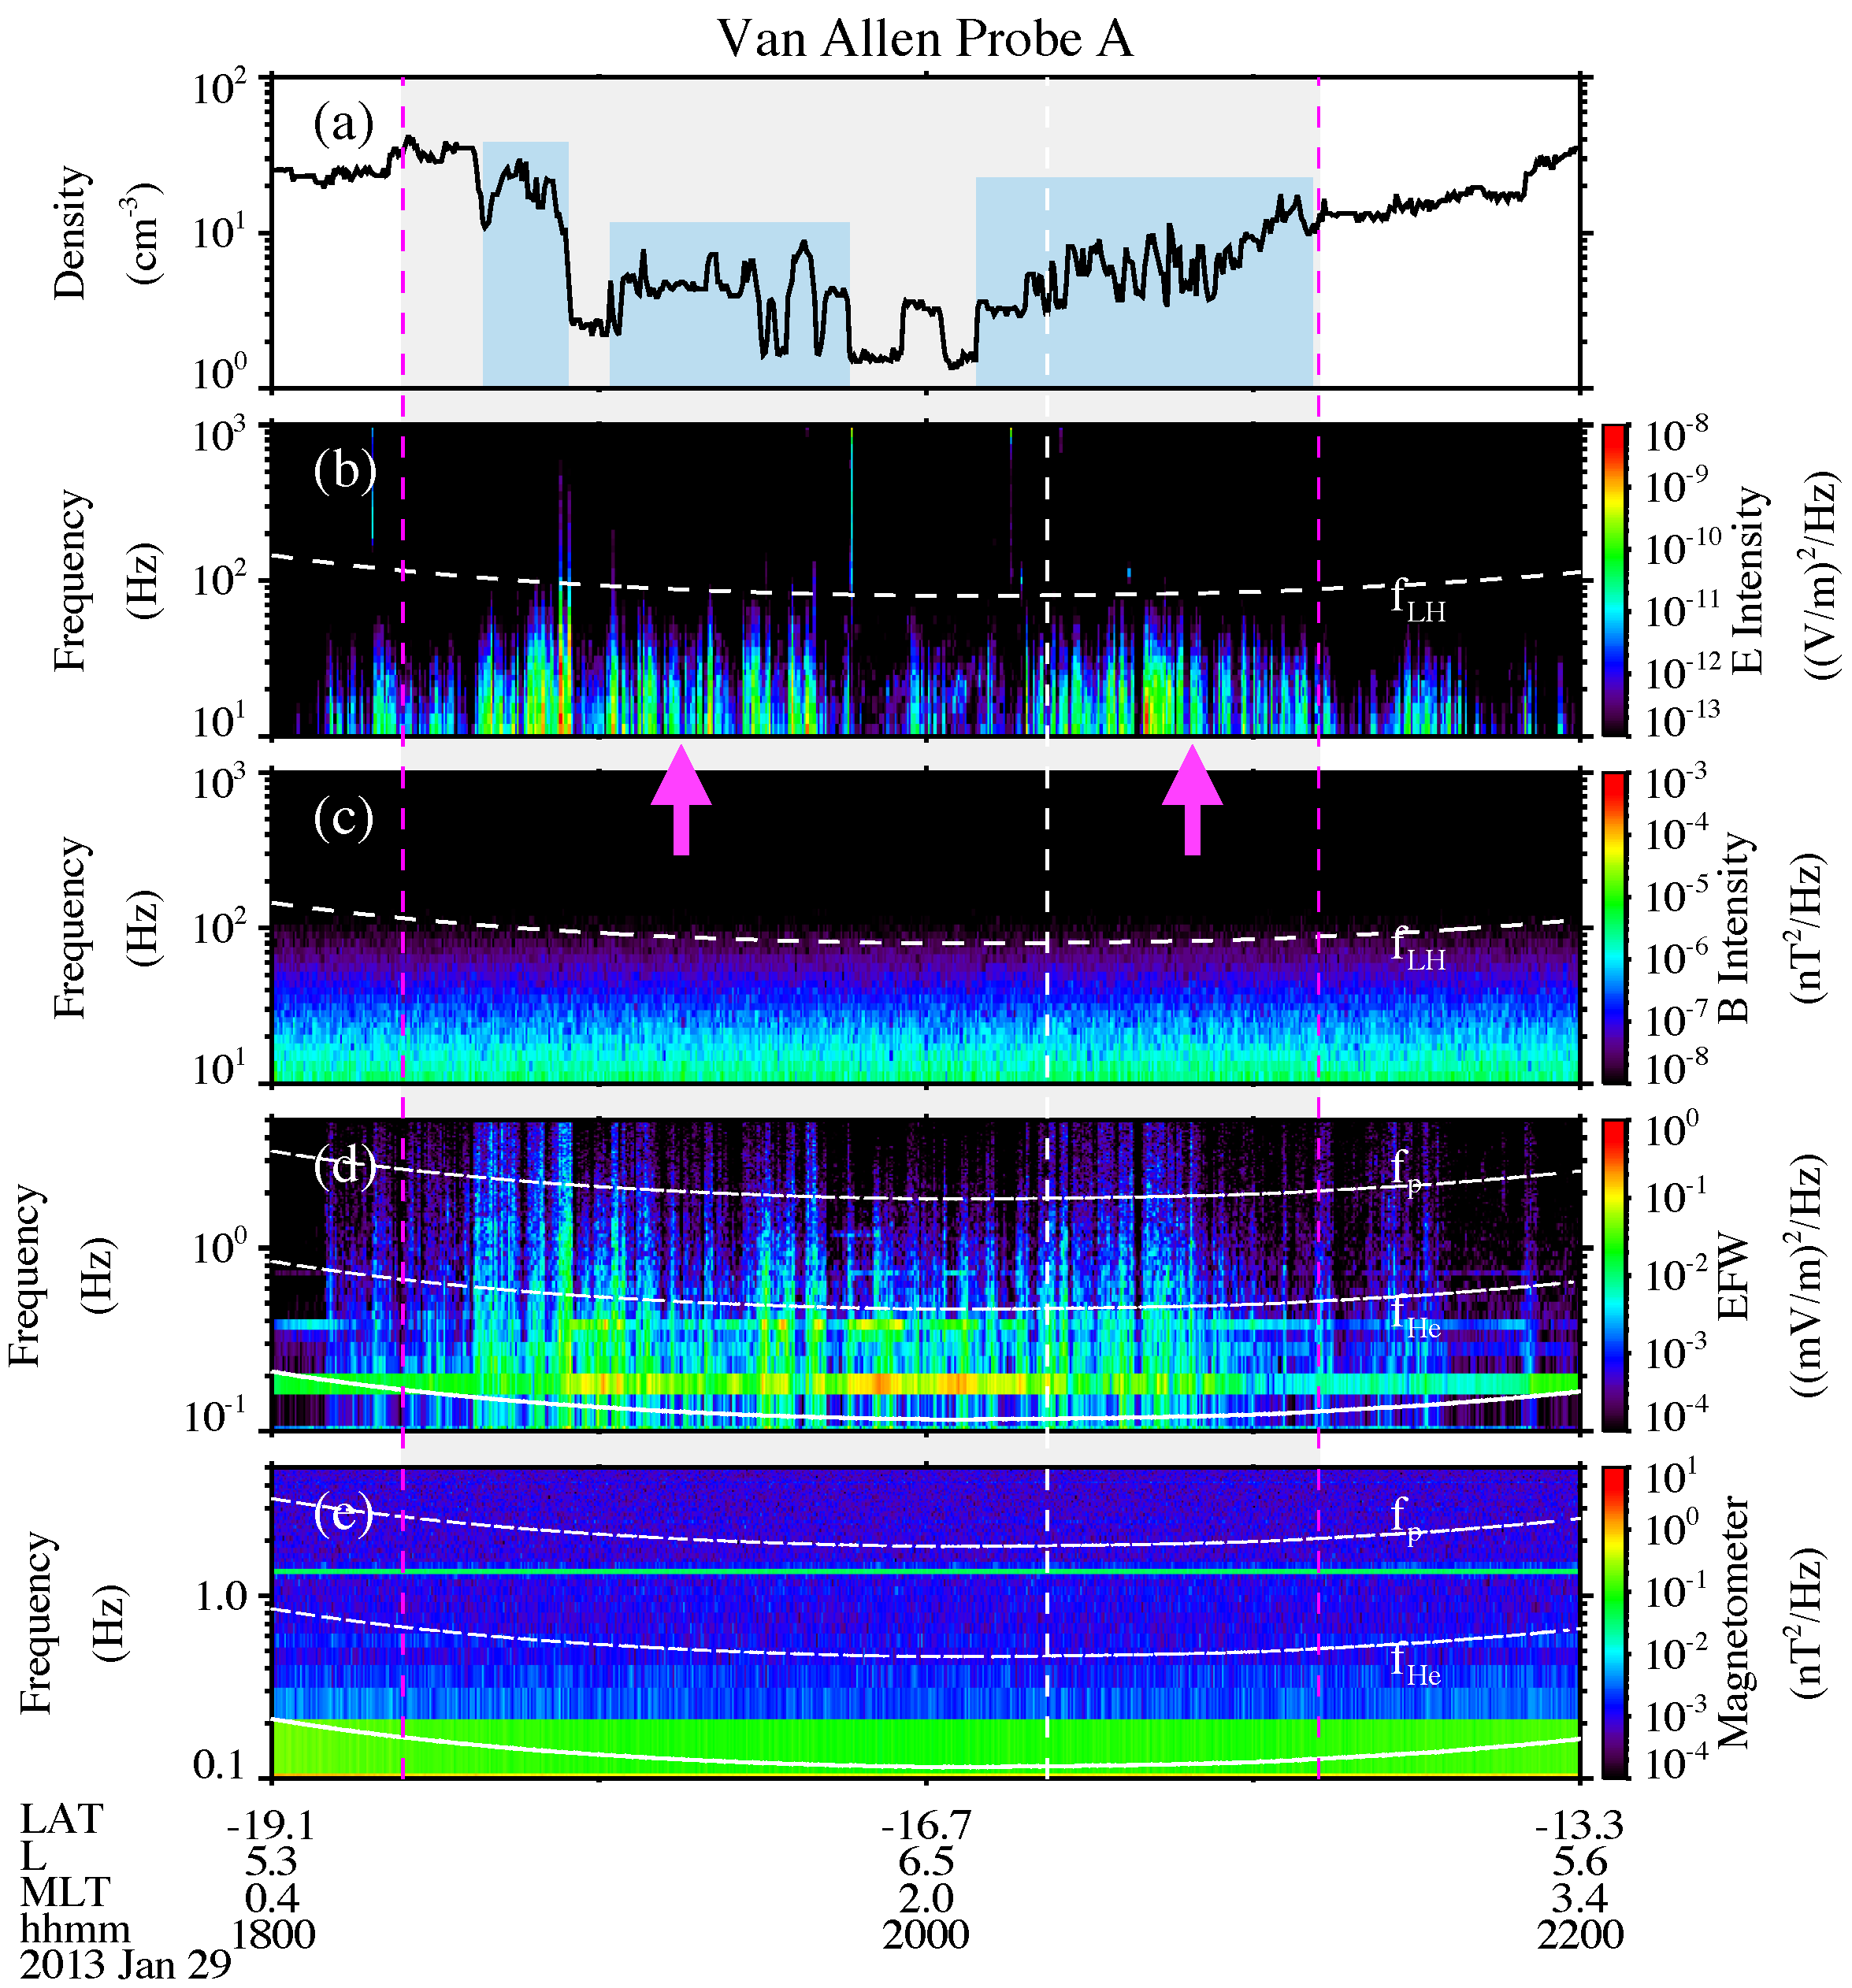
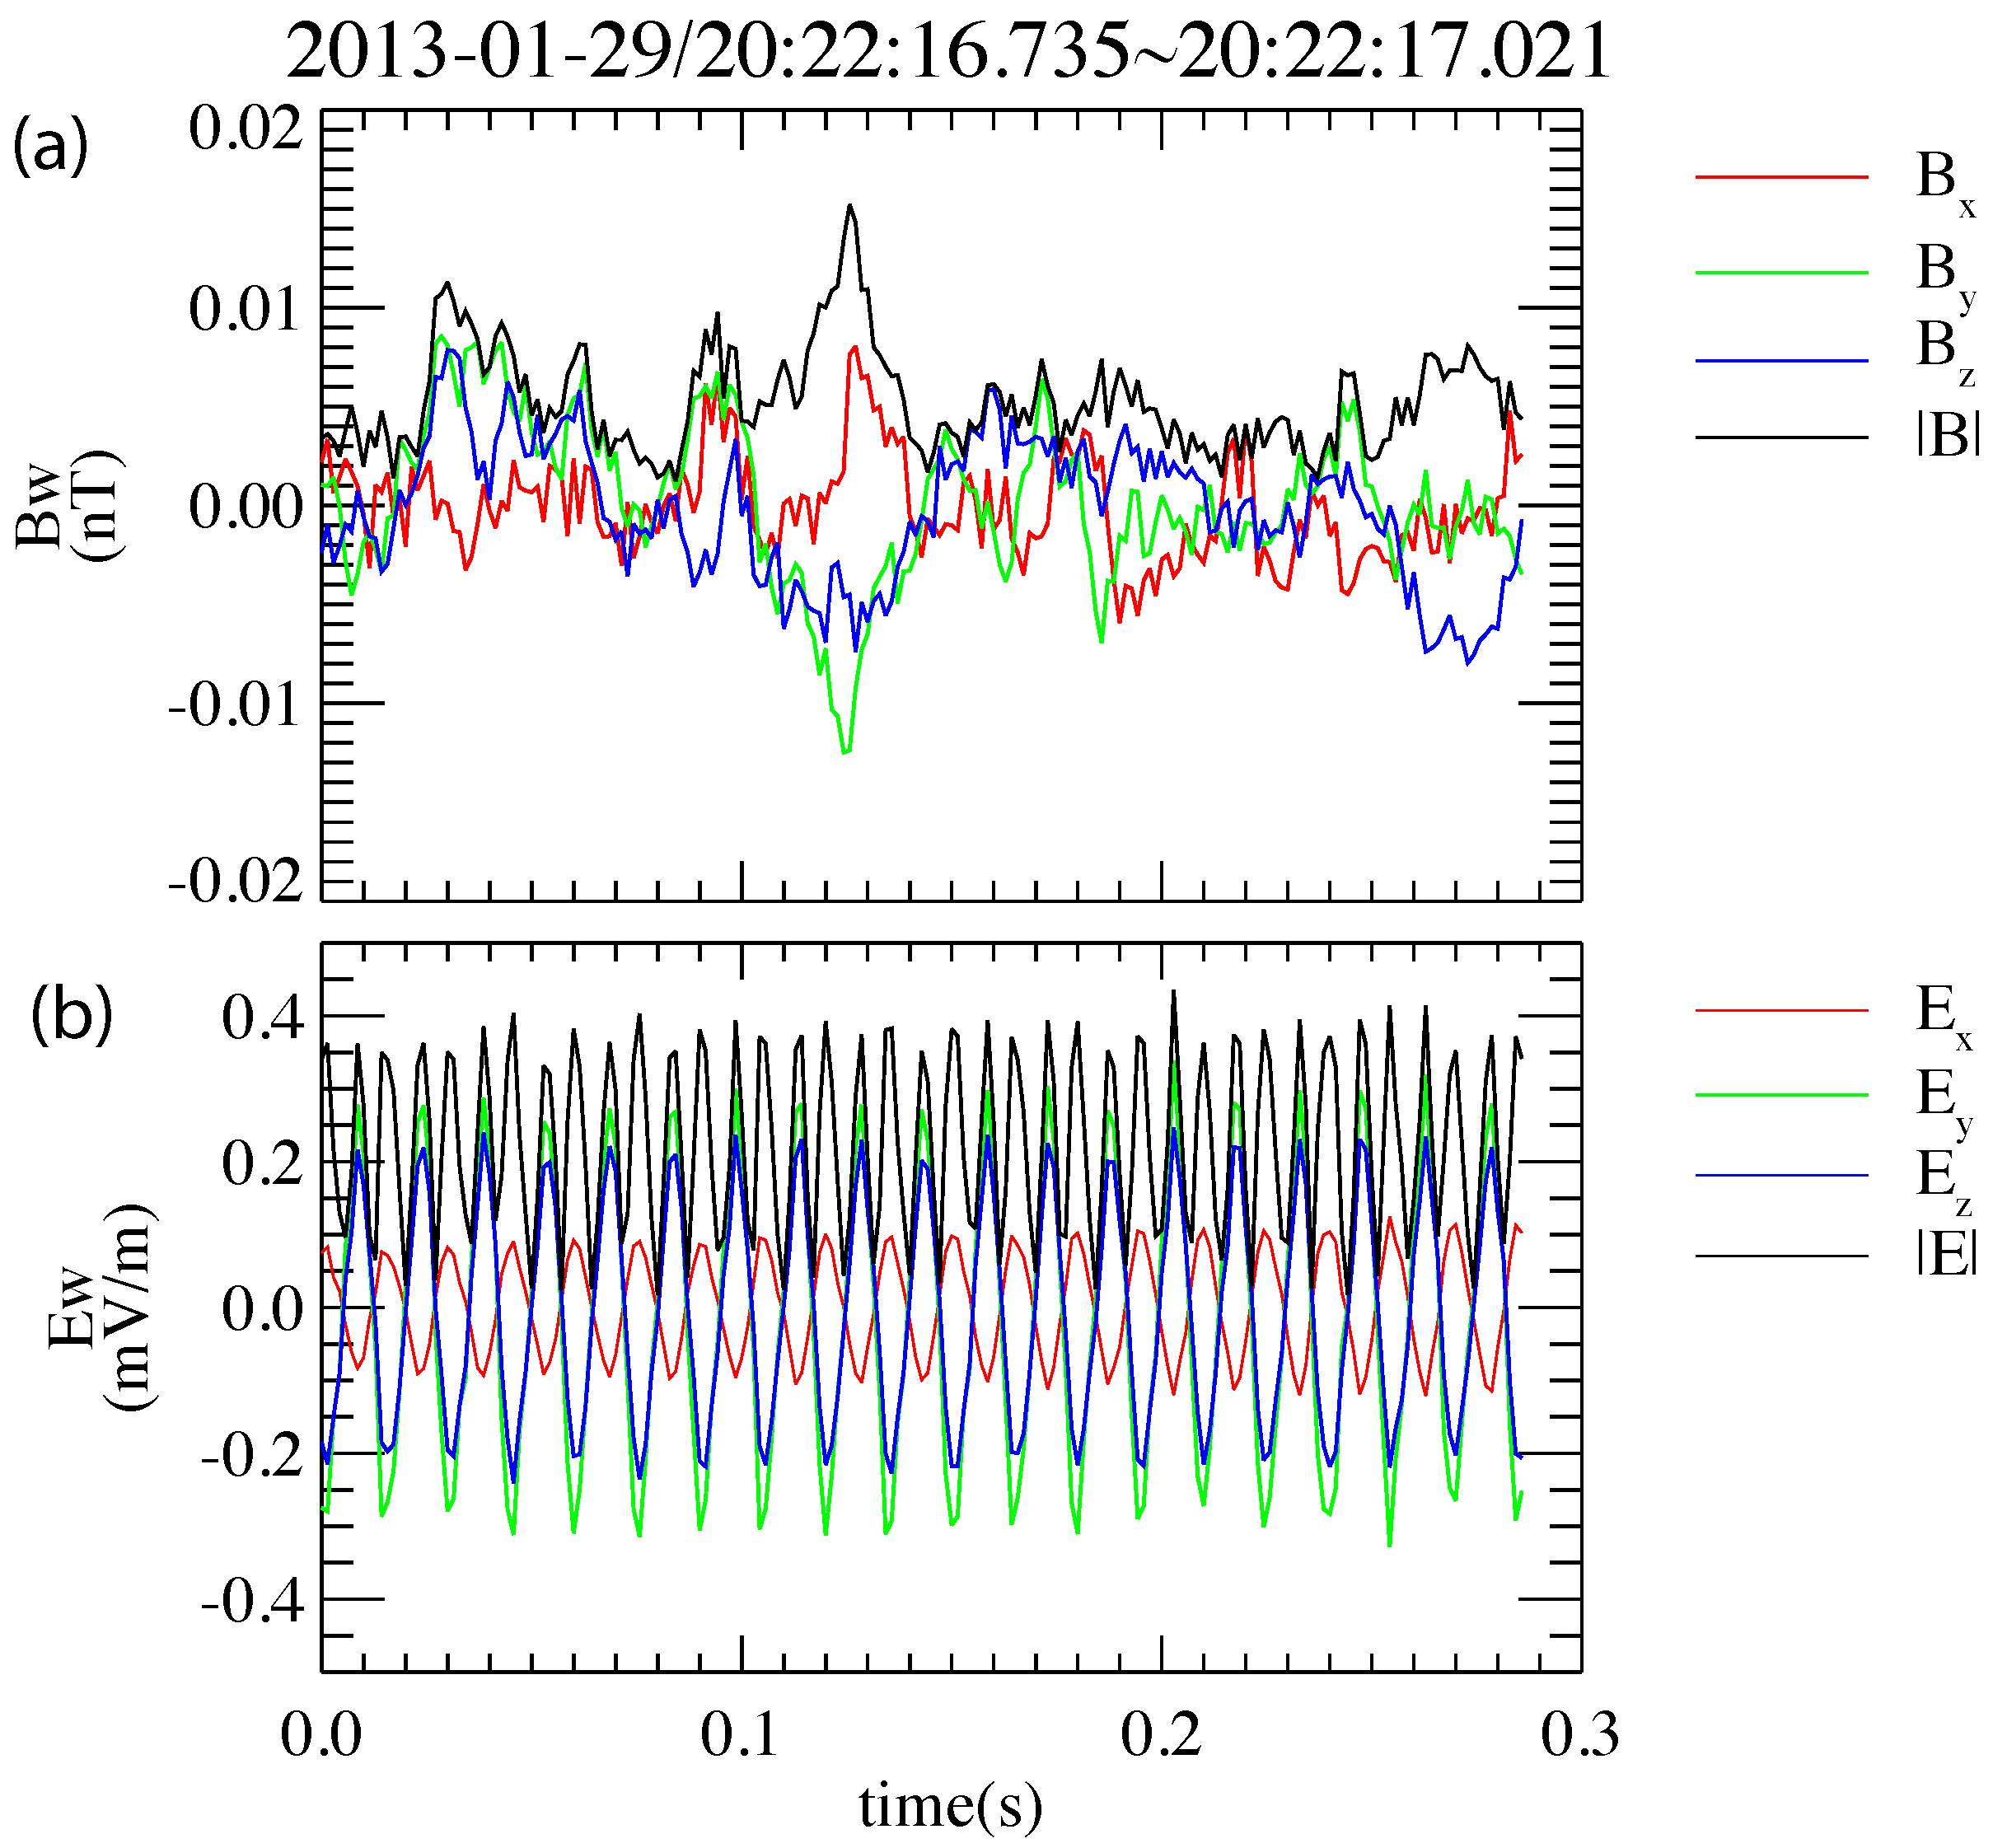
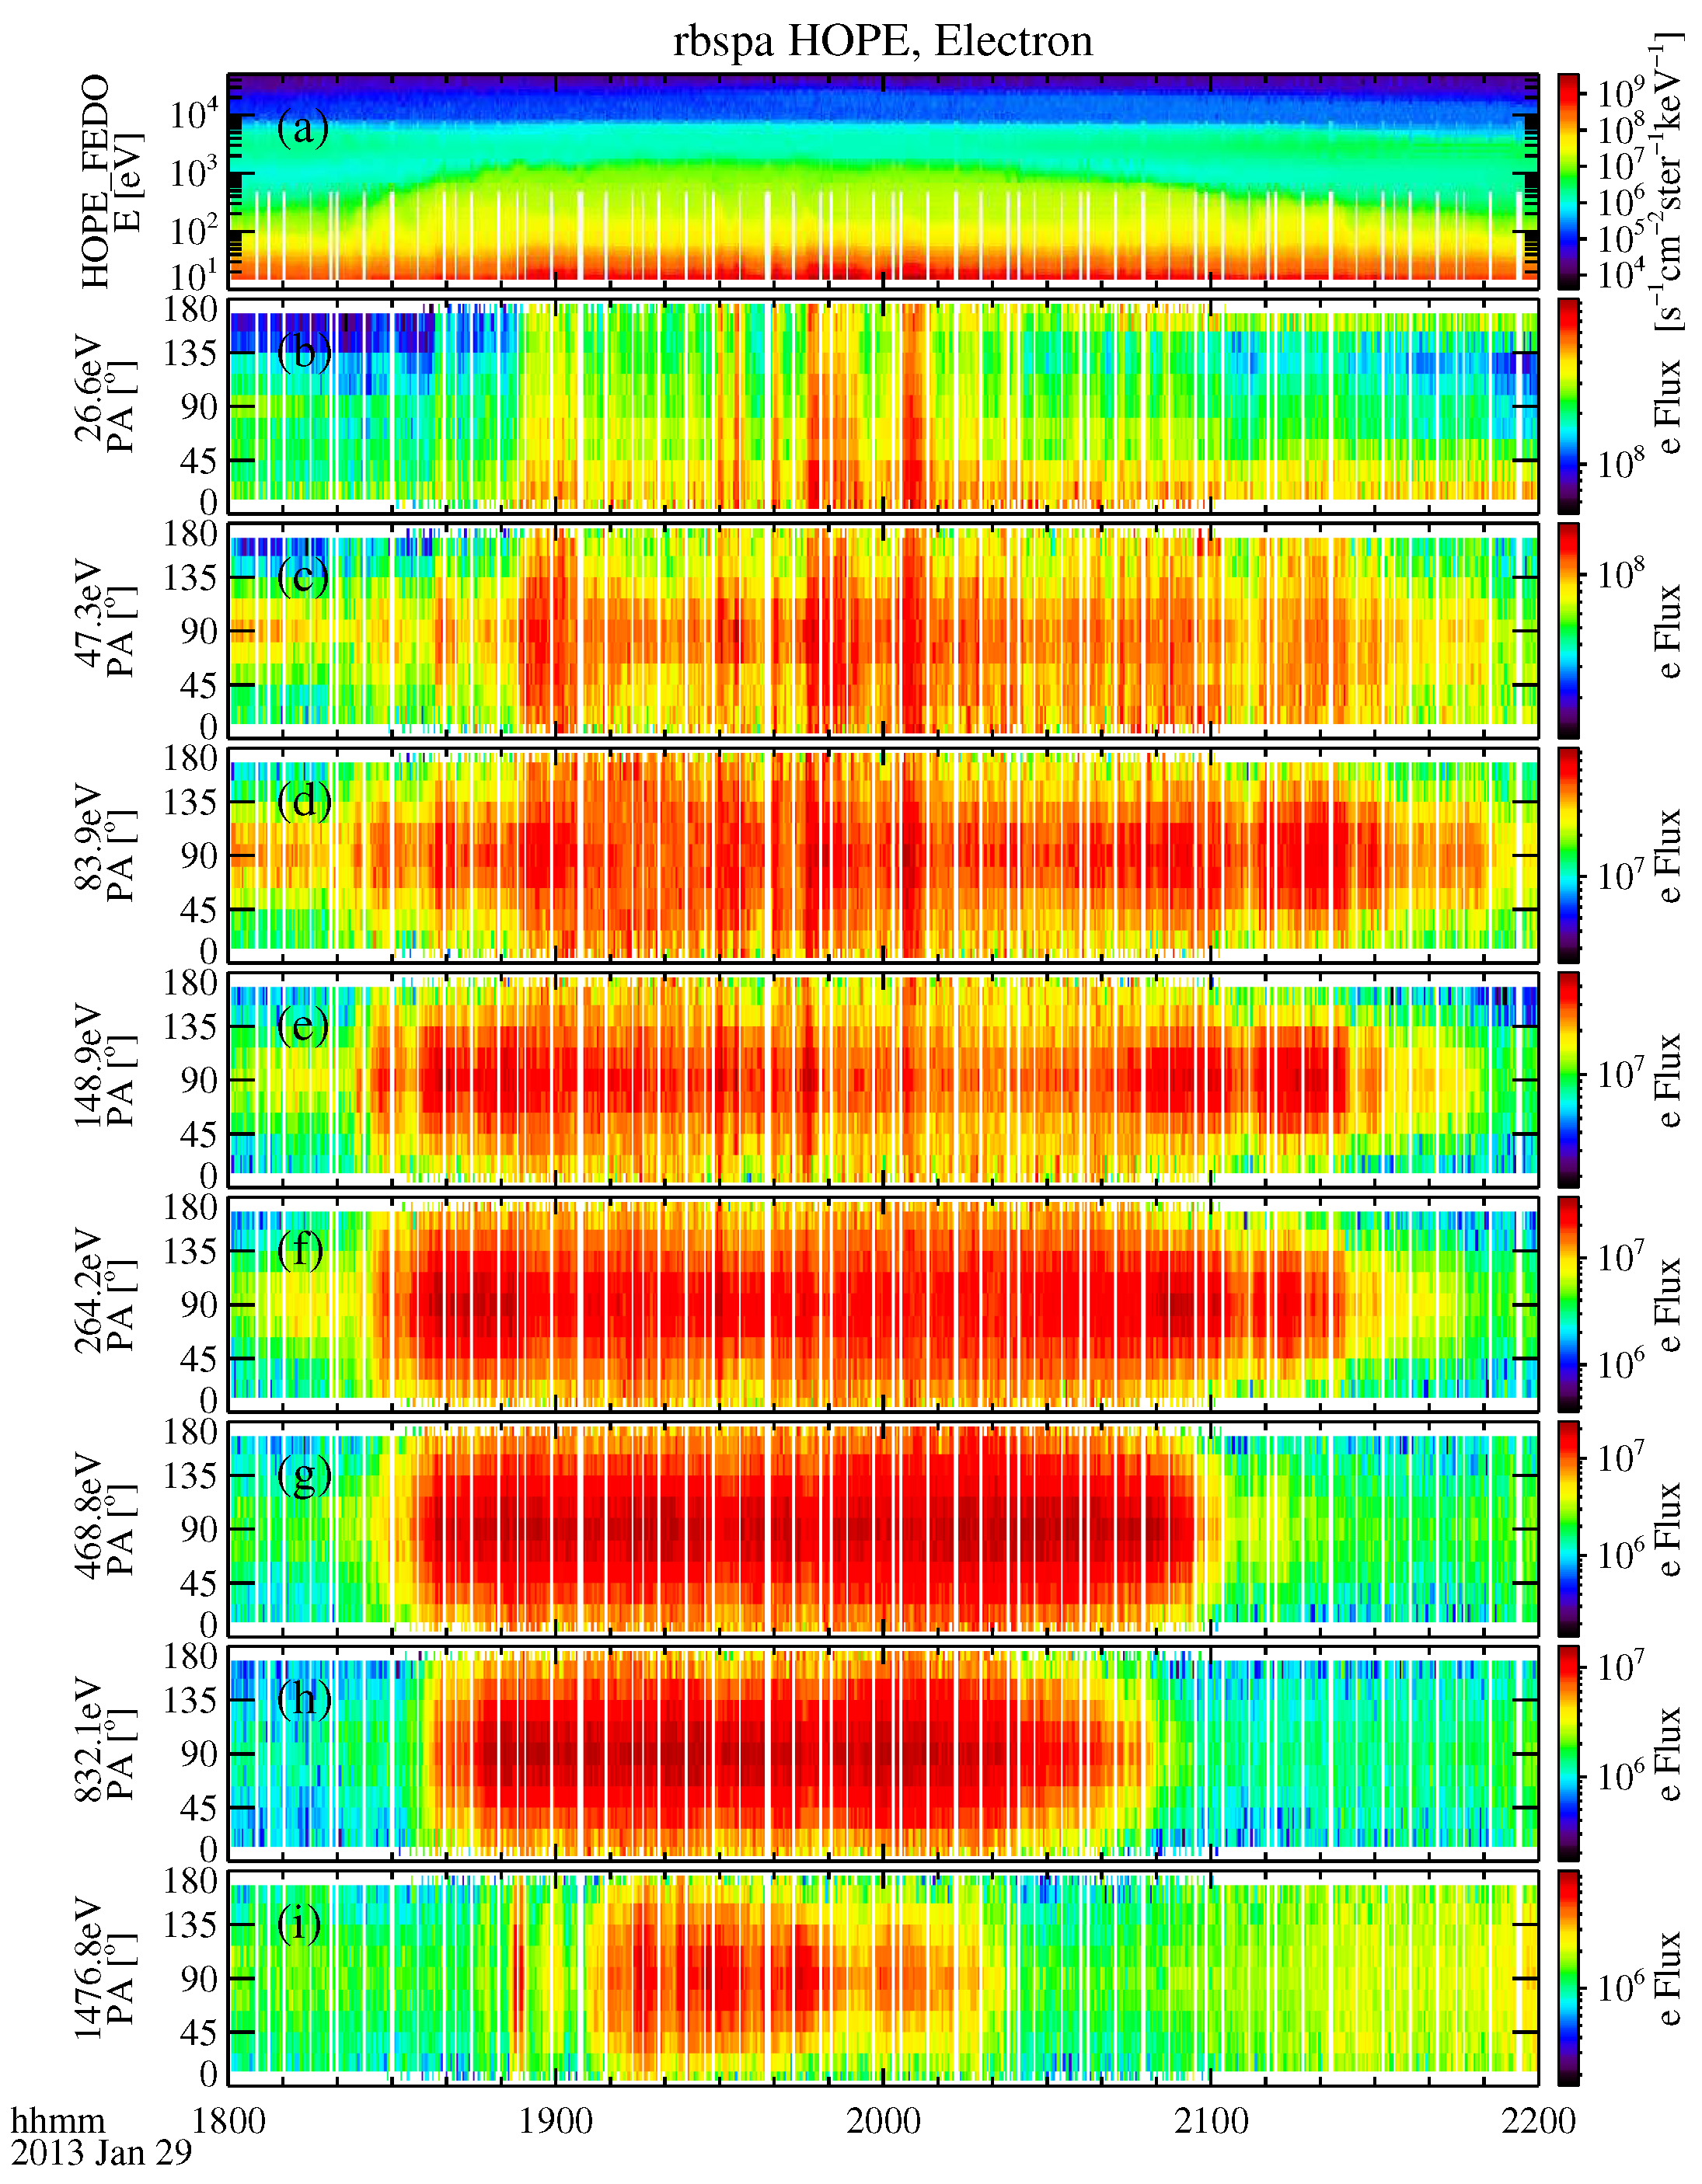
3.1. Example Event: 29 January 2013
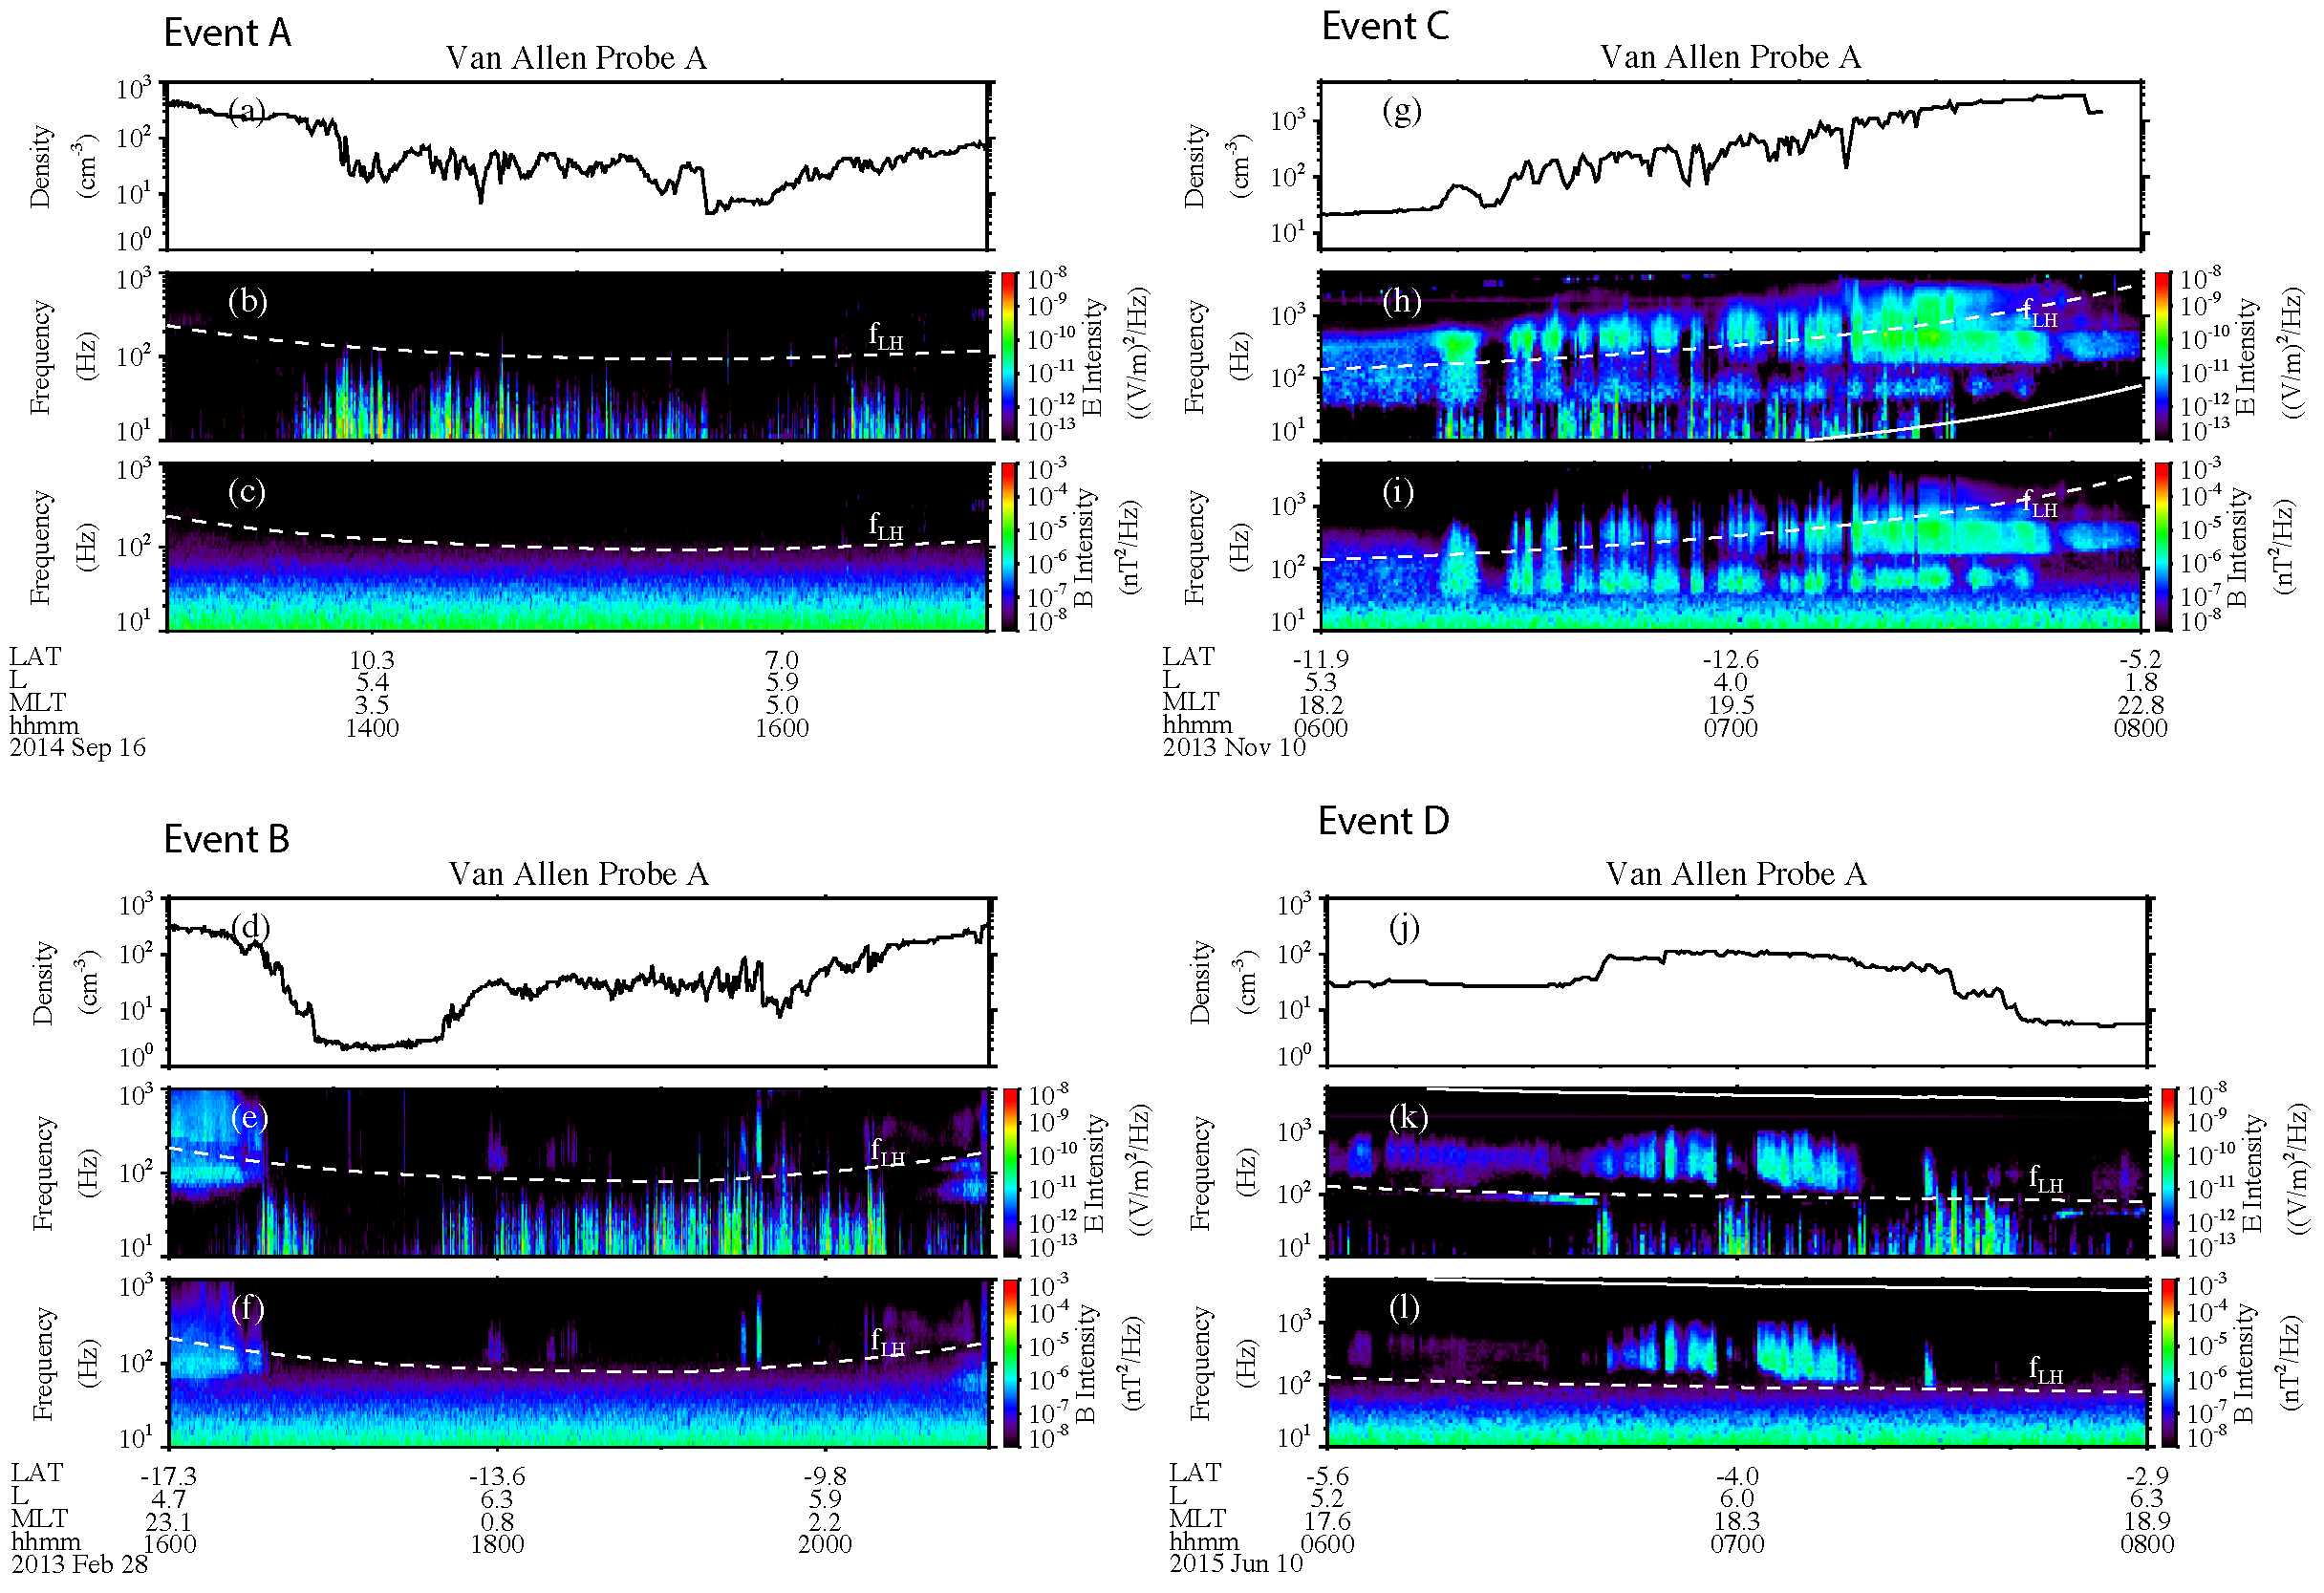
Figure 1 presents an overview of the time-domain structures observed in the plasmaspheric plume region on 29 January 2013. Van Allen Probe A (VAP-A) was inside the high-density plasmasphere before 18:00 UT. VAP-A passed through a plasmaspheric plume with a sudden increase of the electron density during the time from 18:24 UT to 21:12 UT, denoted by the transparent block. A plume is identified as a region of localized density enhancement followed by a plasmapause location, which is adjacent to the main plasmasphere. The plasmapause location can be first identified as the innermost steep gradient of electron density [2], which requires the electron density to drop by a factor > 5 within a half L-shell. Outside the plasmapause, there are some regions where the observed electron density sharply increases and exceeds the density value calculated by Sheeley’s model [36] for several minutes.
n e = 1390 ( 3 L ) 4.83 240 ( 3 L ) 3.6
The identified plasmaspheric plume regions have been marked by blue transparent boxes in Figure 1a. Figure 1b,c shows the overview of the WFR electric and magnetic spectrogram in the frequency range of 10–1000 Hz. The horizontal dashed line in Figure 1b,c denotes the lower hybrid frequency. The wave spectrogram indicates that only electrostatic waves exist in this case. Figure 1d,e illustrates the magnetic spectrograms over the frequency range from 0.1 to 5 Hz, where the electric and magnetic field power spectra are obtained from the EFW and MAG measurements, respectively. In Figure 1d,e, the white dashed, dashed-dotted, and solid lines represent the proton gyrofrequency ( f cp ), helium gyrofrequency ( f He ), and oxygen gyrofrequency ( f o ), respectively. Additionally, only electrostatic waves were observed.
To identify the wave characteristics, we focus on the high-cadence (16,384 samples/s) measurements of the magnetic and electric field waveforms, which can be identified from the burst mode data of the EMFISIS instrument. Figure 2 provides a zoom-in interval of the magnetic (Figure 2a) and electric field (Figure 2b) perturbations in field-aligned coordinates at the time interval denoted by the white vertical dashed line in Figure 1. Three-component magnetic field data were rotated using a running average into local mean field-aligned coordinates, with x and y transverse components and a z parallel component. The black line shows the total magnitude of the magnetic and electric field. As can be seen, the magnetic field magnitude is very small (∼0.01 nT) and the magnetic field components are irregular. However, the electric field signal varies sinusoidally. The amplitudes of field-aligned electric field can reach ∼0.2 mV/m. This implies the electrostatic nature of the observed electric field spikes. The parallel and perpendicular components of the electric fields are comparable [21,37]. Mozer et al., (2015) [16] illustrates different types of TDS. Some structures contain not only net parallel electric potential but also perpendicular electric field components.
To understand the wave effects on protons and electrons, we evaluate proton and electron distribution in detail. Figure 3a shows the proton flux at energies up to 50 keV measured by HOPE, and Figure 3b–g provide pitch-angle distributions of protons at different energies. Plasmaspheric plumes usually occur during periods of geomagnetic disturbance. A typical feature of the substorm is the injection of ring current protons. As Figure 3a suggested, protons with the energy > 1 keV are freshly injected from the plasma sheet. The proton spectra demonstrate "nose-like" structures [38,39]. Accompanied by the proton injection, the low-energy proton population (<1 keV) shows an enhancement from 18:20 UT to 21:50 UT. The pitch-angle distribution of Figure 3b–g shows that these enhanced protons at energies from 0.1 to 1 keV present a field-aligned distribution, almost at the same time interval as TDS. We also checked proton pitch-angle distributions of higher energies measured by MagEIS (not shown here). Higher-energy protons do not exhibit a similar trend. Previous studies have shown that TDS can cause the acceleration of suprathermal electrons to ∼100 keV in the parallel direction. The close correlation between the suprathermal proton enhancement in the field-aligned direction and the TDS may imply the possible scattering effects on low-energy protons due to the TDS.
The temporal behavior of electrons in the same time interval is given in Figure 4. Figure 4 displays the same figure format as Figure 3 but for electrons. During the time interval from 18:20 UT to 21:50 UT, the low-energy (below several keV) electron flux shows a clear enhancement, mainly in the perpendicular direction. Electrons can be trapped by Landau resonance in the potential well formed by the parallel electric field of TDS [17,40,41]. In this case, TDS have a substantial electric field component transverse to the background magnetic field. The quasilinear diffusive scattering of these electrons might substantially increase the flux of electrons.

3.2. More events

Figure 5 shows the four events (Event A, B, C, and D) observed in the plasmaspheric plumes. In each case, the electron density data are presented in the top panels. The spectrograms of the electric wave and the magnetic field are shown in the two panels below. The four events represent different trends of density variation. According to the criteria above, the plasmaspheric plumes can be identified in these four events. In events A and B shown in the left column of Figure 5, WFR data suggest that only TDS were observed. In events C and D shown in the right column of Figure 5, besides the occurrence of TDS in the plume region, the density variation also modulates the growth of plasmaspheric hiss. Plasmaspheric hiss is an electromagnetic whistler-mode emission with a frequency range between 0.1 f ce to f ce [42]. Previous studies [10,14,43] have revealed that the intensity of plasmaspheric-hiss emission is strongly modulated by plasma density variation, with larger intensity in regions of higher density. Fine-density variations may also affect TDS generation. On the other hand, events with only TDS observed (events A and B) are located near the midnight and dawn sector. The events in which TDS and plasmaspheric hiss appear simultaneously (events C and D) are located near the duskside.
The cases above cannot represent all of the characteristics of TDS in plasmaspheric plumes. A visual inspection of waves in plasmaspheric plumes [7] shows that TDS in plumes are quite common. To identify the preferential region for such a phenomenon, a comprehensive survey of TDS in plasmaspheric plumes observed by Van Allen Probe A from 2013 to 2015 has been performed. The criteria for selecting these events include the following. (1) Plume regions were identified first with a technique mentioned above [2,7,11]. (2) TDS were identified manually by the electric field spikes. We do not distinguish whether other wave modes were present at the same time. A total of 85 events have been selected and used in the statistics. Figure 6 displays the spatial distribution of these identified waves. Figure 6a,b shows their location on the meridian plane and equatorial plane, respectively. These events do not show a particular dependence on the latitudinal distribution. However, most waves occur from the dusk to dawn sector (18-24 and 00-03 MLT) over the L shell range between 4 and 6. The number of TDS in plasmaspheric plumes from the dusk side to the midnight side is the largest. The number of samples at different MLT is roughly uniform, so the preferential MLT region may not be affected by the satellite trajectory. However, the L shell range is limited by the orbital coverage.

4. Discussion and Conclusions

In this study, we present some representative events to report the close relationship between time-domain structures (TDS) and plasmaspheric plumes using Van Allen Probes data. The main findings are summarized below.
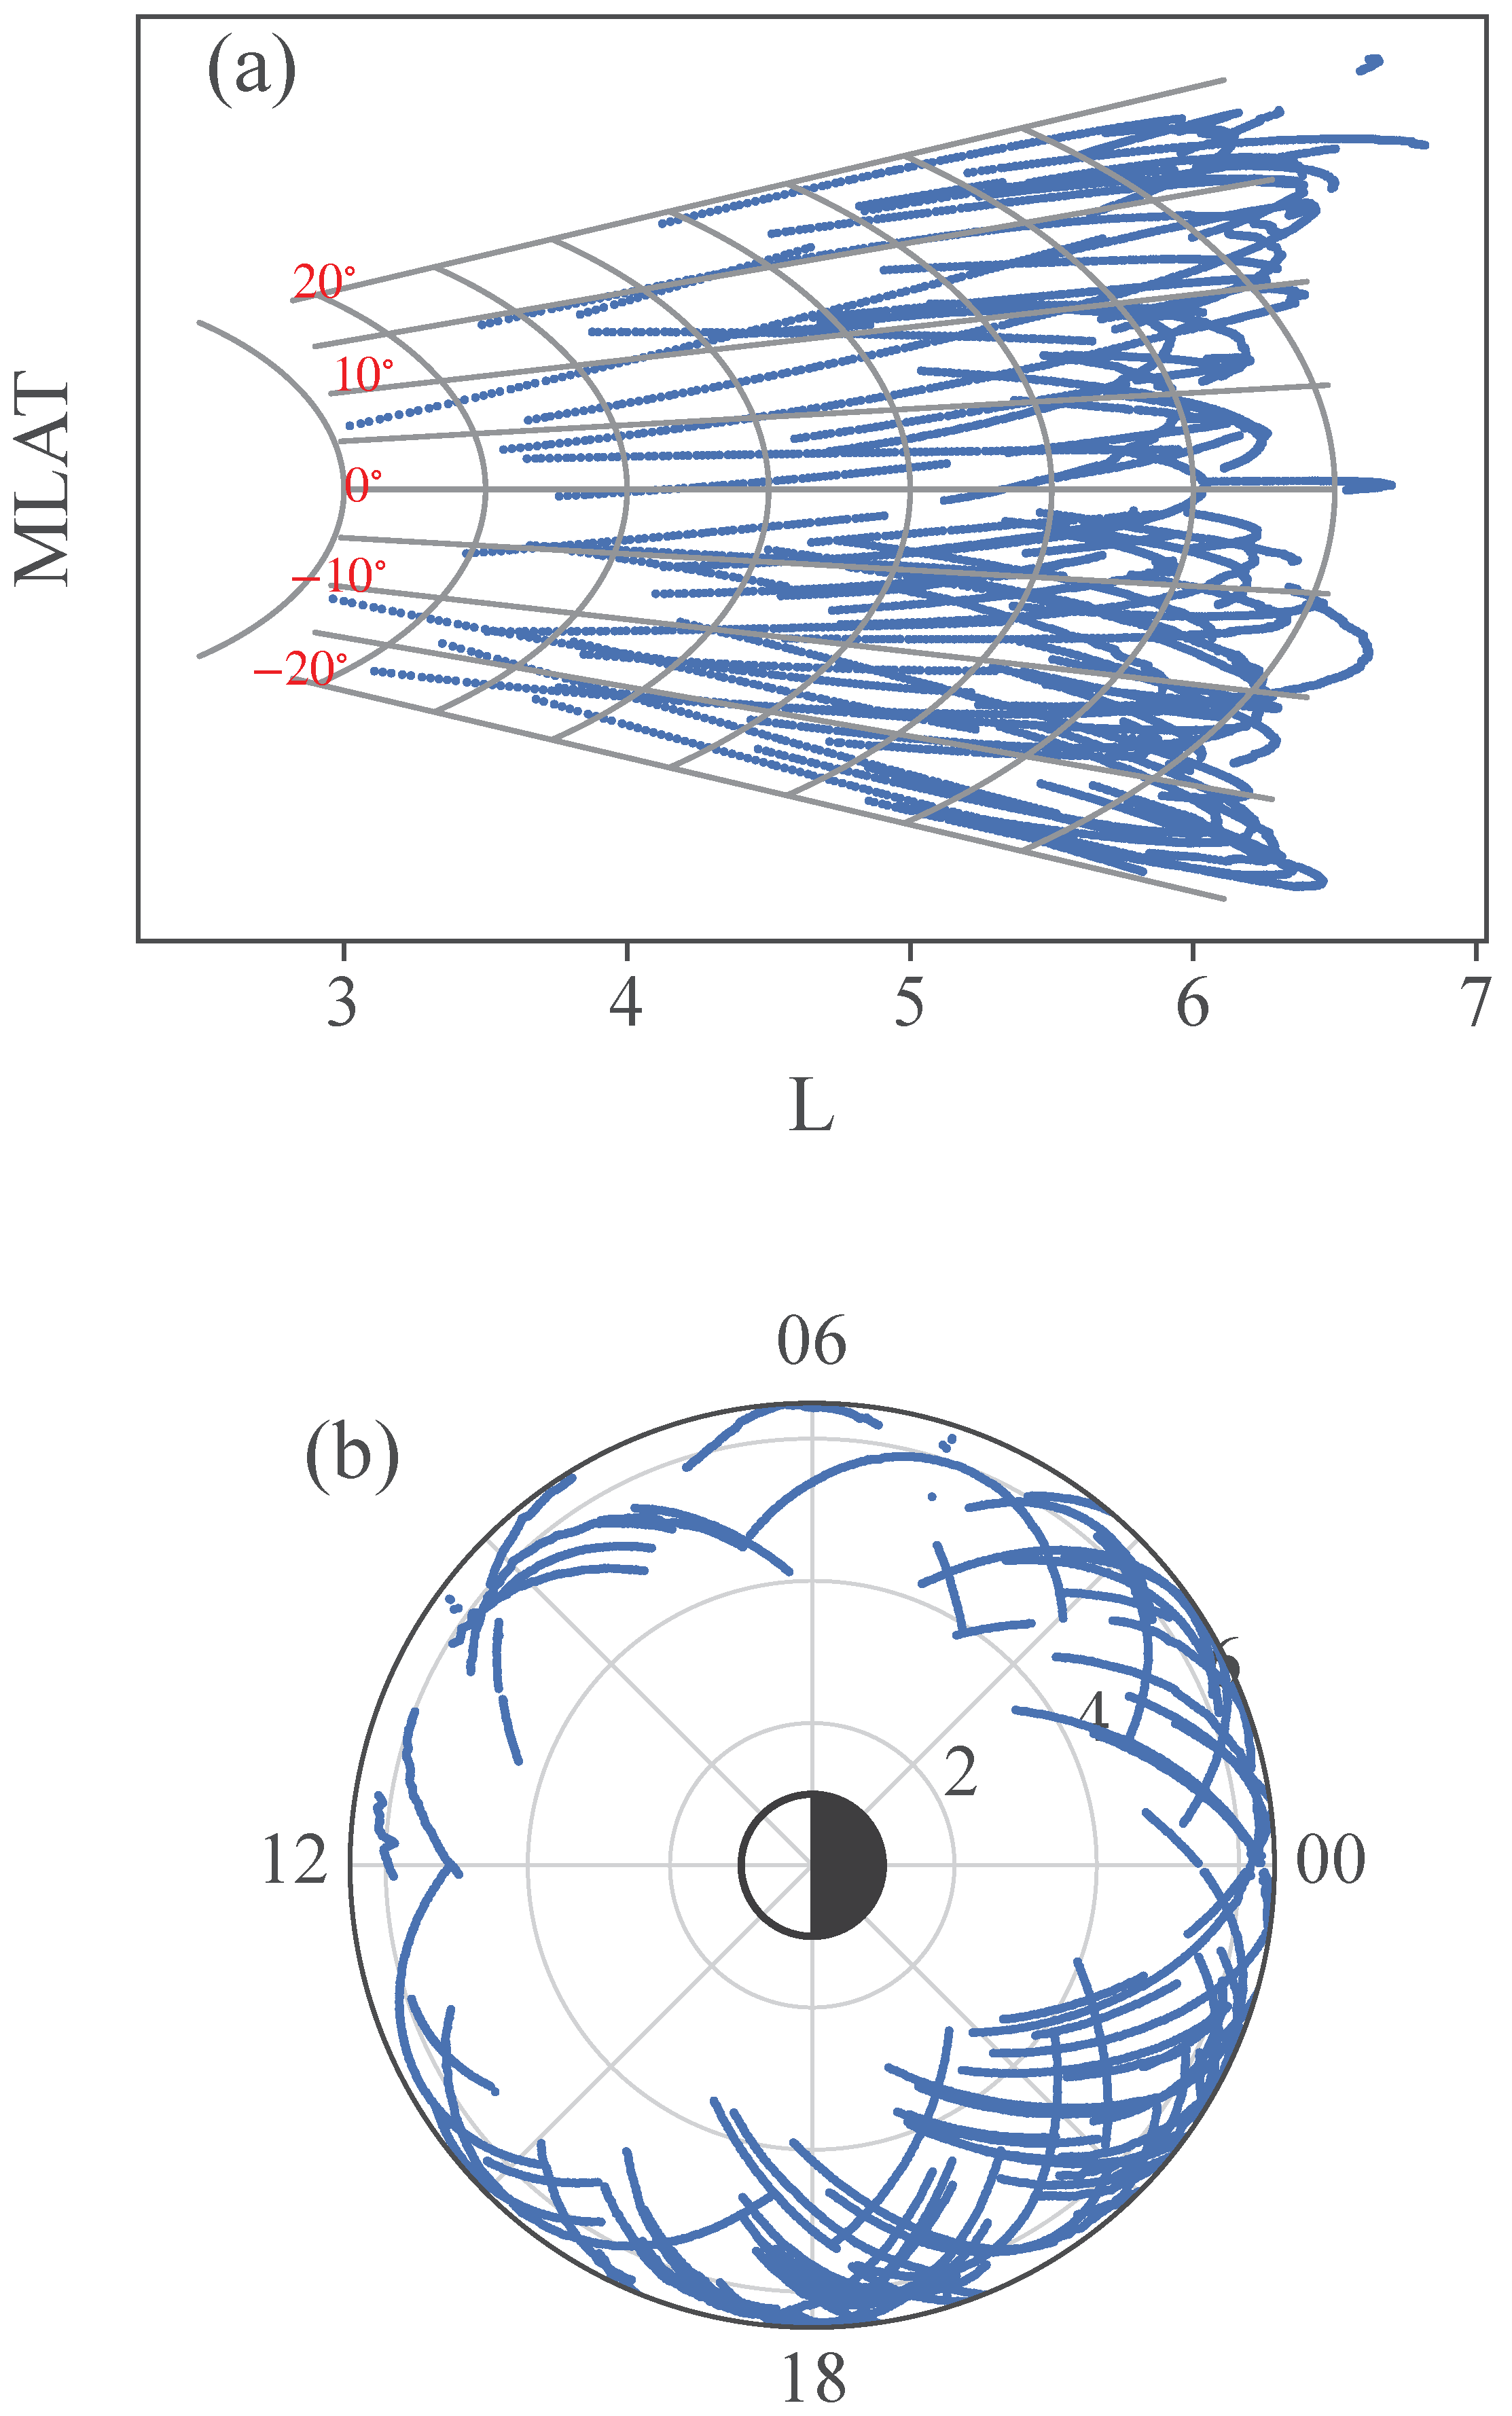
  • TDS are often observed inside the plasmaspheric plumes. Plasmaspheric plumes tend to occur from the duskside to the midnight sector during active geomagnetic conditions. The events shown here occur in similar regions from the duskside to the midnight sector and dawnside.
  • The generation mechanism of TDS has been discussed a lot in previous studies, such as current-driven and beam-related instabilities. The induced parametric interaction could also be one mechanism for quasiperiodic TDS generation [25]. The observation presented here suggests that density modulation may also affect the excitation of TDS.
  • The representative event shows that TDS in plasmaspheric plumes have different effects on protons and electrons. During the occurrence of TDS, the flux of low-energy protons is significantly enhanced. Moreover, these enhanced low-energy protons exhibit field-aligned pitch-angle distributions. The fluxes of electrons are also enhanced, but these are mainly in the perpendicular direction.
This study provides important information on the TDS characteristics. It should be helpful to better understand the generation mechanism of TDS and their potential roles in energetic particle dynamics in the Earth’s magnetosphere. As a next step, there are several directions worth further investigation in depth.
  • Plasmaspheric plumes in the inner magnetosphere are preferentially observed during moderate to strong geomagnetic storms. During periods of active geomagnetic activities, whether the cold plasma density and the fresh injection of energetic protons make it easier to generate the TDS generation remains to be discussed.
  • The characteristics of TDS, including the wave amplitudes, types, and spatial distribution, should be determined. Comprehensive statistics of events observed in plasmaspheric plumes should also be used to estimate the importance of TDS in the particle dynamics of the radiation belt. Plasmaspheric hiss emissions are believed to be the dominant mechanism for pitch-angle scattering and the ultimate loss of energetic radiation belt electrons [44,45]. When TDS and plasmaspheric hiss emissions appear simultaneously, but whether there will be additional effects on energetic particles is unknown.
  • Waves in plasmaspheric plumes may also have an influence on ionospheric irregularities. TDS can provide seed electrons that are further accelerated by whistler waves to relativistic energies [46]. It is necessary to determine the relative importance of each source on particle acceleration and on loss, as well as their contributions to auroras when more than one wave mode exists. Through a joint observation from magnetospheric and ionospheric satellites, and ground measurements, the quantitative evaluation of TDS in plasmaspheric plumes can be obtained.
TDS in plumes are important to reveal the mechanism of wave-particle coupling in the Earth radiation belt. Based on observations, more theoretical and comprehensive modeling will be studied in our future project.

Author Contributions

Conceptualization, S.T.; methodoly, S.T.; formal analysis, H.C. and Q.Z.; writing—original draft preparation, S.T.; writing—review and editing, H.C. and D.H.; and supervision, D.H. All authors have read and agreed to the published version of the manuscript.

Funding

The work is supported by the National Natural Science Foundation of China (42030101, 42204158) and the Fundamental Research Funds for the Central Universities.

Institutional Review Board Statement

Not applicable.

Informed Consent Statement

Not applicable.

Data Availability Statement

Van Allen Probes data are publicly available at https://emfisis.physics.uiowa.edu/Flight/ (accessed on 13 December 2022).

Acknowledgments

We acknowledge the Van Allen Probes EMFISIS, HOPE, and MAGEIS teams for providing high-quality data.

Conflicts of Interest

The authors declare no conflict of interest.

References

  1. Goldstein, J.; Pascuale, S.D.; Kletzing, C.; Kurth, W.; Genestreti, K.J.; Skoug, R.M.; Larsen, B.A.; Kistler, L.M.; Mouikis, C.; Spence, H. Simulation of Van Allen Probes plasmapause encounters. J. Geophys. Res. Space Phys. 2014, 119, 7464–7484. [Google Scholar] [CrossRef] [Green Version]
  2. Moldwin, M.B.; Downward, L.; Rassoul, H.; Amin, R.; Anderson, R. A new model of the location of the plasmapause: CRRES results. J. Geophys. Res. Space Phys. 2002, 107, SMP-2. [Google Scholar] [CrossRef]
  3. Chappell, C.R. Detached plasma regions in the magnetosphere. J. Geophys. Res. (1896–1977) 1974, 79, 1861–1870. [Google Scholar] [CrossRef]
  4. Carpenter, D.L.; Giles, B.L.; Chappell, C.R.; Décréau, P.M.E.; Anderson, R.R.; Persoon, A.M.; Smith, A.J.; Corcuff, Y.; Canu, P. Plasmasphere dynamics in the duskside bulge region: A new look at an old topic. J. Geophys. Res. Space Phys. 1993, 98, 19243–19271. [Google Scholar] [CrossRef] [Green Version]
  5. Darrouzet, F.; De Keyser, J.; Décréau, P.M.E.; El Lemdani-Mazouz, F.; Vallières, X. Statistical analysis of plasmaspheric plumes with Cluster/WHISPER observations. Ann. Geophys. 2008, 26, 2403–2417. [Google Scholar] [CrossRef] [Green Version]
  6. Lee, S.H.; Zhang, H.; Zong, Q.G.; Otto, A.; Rème, H.; Liebert, E. A statistical study of plasmaspheric plumes and ionospheric outflows observed at the dayside magnetopause. J. Geophys. Res. Space Phys. 2016, 121, 492–506. [Google Scholar] [CrossRef] [Green Version]
  7. Li, H.; Fu, T.; Tang, R.; Yuan, Z.; Yang, Z.; Ouyang, Z.; Deng, X. Statistical study and corresponding evolution of plasmaspheric plumes under different levels of geomagnetic storms. Ann. Geophys. 2022, 40, 167–177. [Google Scholar] [CrossRef]
  8. Laakso, H.; Santolik, O.; Horne, R.; Kolmasová, I.; Escoubet, P.; Masson, A.; Taylor, M. Identifying the source region of plasmaspheric hiss. Geophys. Res. Lett. 2015, 42, 3141–3149. [Google Scholar] [CrossRef] [Green Version]
  9. Su, Z.; Liu, N.; Zheng, H.; Wang, Y.; Wang, S. Large-Amplitude Extremely Low Frequency Hiss Waves in Plasmaspheric Plumes. Geophys. Res. Lett. 2018, 45, 565–577. [Google Scholar] [CrossRef]
  10. Yuan, Z.; Xiong, Y.; Pang, Y.; Zhou, M.; Deng, X.; Trotignon, J.G.; Lucek, E.; Wang, J. Wave-particle interaction in a plasmaspheric plume observed by a Cluster satellite. J. Geophys. Res. 2012, 117, A03205. [Google Scholar] [CrossRef]
  11. Teng, S.; Li, W.; Tao, X.; Shen, X.C.; Ma, Q. Characteristics of rising tone whistler mode waves inside the Earth’s plasmasphere, plasmaspheric plumes, and plasmatrough. Geophys. Res. Lett. 2019, 46, 7121–7130. [Google Scholar] [CrossRef]
  12. Grison, B.; Hanzelka, M.; Breuillard, H.; Darrouzet, F.; Santolík, O.; Cornilleau-Wehrlin, N.; Dandouras, I. Plasmaspheric Plumes and EMIC Rising Tone Emissions. J. Geophys. Res. Space Phys. 2018, 123, 9443–9452. [Google Scholar] [CrossRef] [Green Version]
  13. Yuan, Z.; Deng, X.; Lin, X.; Pang, Y.; Zhou, M.; Décréau, P.M.E.; Trotignon, J.G.; Lucek, E.; Frey, H.U.; Wang, J. Link between EMIC waves in a plasmaspheric plume and a detached sub-auroral proton arc with observations of Cluster and IMAGE satellites. Geophys. Res. Lett. 2010, 37. [Google Scholar] [CrossRef]
  14. Summers, D.; Ni, B.; Meredith, N.P.; Horne, R.B.; Thorne, R.M.; Moldwin, M.B.; Anderson, R.R. Electron scattering by whistler-mode ELF hiss in plasmaspheric plumes. J. Geophys. Res. 2008, 113, A04219. [Google Scholar] [CrossRef] [Green Version]
  15. Zhang, W.; Fu, S.; Gu, X.; Ni, B.; Xiang, Z.; Summers, D.; Zou, Z.; Cao, X.; Lou, Y.; Hua, M. Electron Scattering by Plasmaspheric Hiss in a Nightside Plume. Geophys. Res. Lett. 2018, 45, 4618–4627. [Google Scholar] [CrossRef]
  16. Mozer, F.S.; Agapitov, O.V.; Artemyev, A.; Drake, J.F.; Krasnoselskikh, V.; Lejosne, S.; Vasko, I. time-domain structures: What and where they are, what they do, and how they are made. Geophys. Res. Lett. 2015, 42, 3627–3638. [Google Scholar] [CrossRef] [Green Version]
  17. Malaspina, D.M.; Andersson, L.; Ergun, R.E.; Wygant, J.R.; Bonnell, J.W.; Kletzing, C.; Reeves, G.D.; Skoug, R.M.; Larsen, B.A. Nonlinear electric field structures in the inner magnetosphere. Geophys. Res. Lett. 2014, 41, 5693–5701. [Google Scholar] [CrossRef]
  18. Malaspina, D.M.; Wygant, J.R.; Ergun, R.E.; Reeves, G.D.; Skoug, R.M.; Larsen, B.A. Electric field structures and waves at plasma boundaries in the inner magnetosphere. J. Geophys. Res. Space Phys. 2015, 120, 4246–4263. [Google Scholar] [CrossRef]
  19. Mozer, F.S.; Carlson, C.W.; Hudson, M.K.; Torbert, R.B.; Parady, B.; Yatteau, J.; Kelley, M.C. Observations of paired electrostatic shocks in the polar magnetosphere. Phys. Rev. Lett. 1977, 38, 292–295. [Google Scholar] [CrossRef]
  20. Temerin, M.; Cerny, K.; Lotko, W.; Mozer, F.S. Observations of double layers and solitary waves in the auroral plasma. Phys. Rev. Lett. 1982, 48, 1175–1179. [Google Scholar] [CrossRef]
  21. Vasko, I.Y.; Agapitov, O.V.; Mozer, F.S.; Artemyev, A.V. Thermal electron acceleration by electric field spikes in the outer radiation belt: Generation of field-aligned pitch-angle distributions. J. Geophys. Res. Space Phys. 2015, 120, 8616–8632. [Google Scholar] [CrossRef] [Green Version]
  22. Mozer, F.; Artemyev, A.; Agapitov, O.; Mourenas, D.; Vasko, I. Near-relativistic electron acceleration by Landau trapping in time domain structures. Geophys. Res. Lett. 2016, 43, 508–514. [Google Scholar] [CrossRef] [Green Version]
  23. Shen, Y.; Artemyev, A.; Zhang, X.; Vasko, I.Y.; Runov, A.; Angelopoulos, V.; Knudsen, D. Potential Evidence of Low-Energy Electron Scattering and Ionospheric Precipitation by time-domain structures. Geophys. Res. Lett. 2020, 47. [Google Scholar] [CrossRef]
  24. Drake, J.F.; Agapitov, O.V.; Mozer, F.S. The development of a bursty precipitation front with intense localized parallel electric fields driven by whistler waves. Geophys. Res. Lett. 2015, 42, 2563–2570. [Google Scholar] [CrossRef]
  25. Agapitov, O.V.; Krasnoselskikh, V.; Mozer, F.S.; Artemyev, A.V.; Volokitin, A.S. Generation of nonlinear electric field bursts in the outer radiation belt through the parametric decay of whistler waves. Geophys. Res. Lett. 2015, 42, 3715–3722. [Google Scholar] [CrossRef] [Green Version]
  26. Matsumoto, H.; Kojima, H.; Miyatake, T.; Omura, Y.; Okada, M.; Nagano, I.; Tsutsui, M. Electrostatic solitary waves (ESW) in the magnetotail: BEN wave forms observed by GEOTAIL. Geophys. Res. Lett. 1994, 21, 2915–2918. [Google Scholar] [CrossRef]
  27. Ergun, R.E.; Andersson, L.; Tao, J.; Angelopoulos, V.; Bonnell, J.; McFadden, J.P.; Larson, D.E.; Eriksson, S.; Johansson, T.; Cully, C.M.; et al. Observations of double layers in earth’s plasma sheet. Phys. Rev. Lett. 2009, 102, 155002. [Google Scholar] [CrossRef]
  28. Cattell, C.A.; Crumley, J.; Dombeck, J.; Wygant, J.R.; Mozer, F.S. Polar observations of solitary waves at the Earth’s magnetopause. Geophys. Res. Lett. 2002, 29, 9-1–9-4. [Google Scholar] [CrossRef] [Green Version]
  29. Mauk, B.; Fox, N.J.; Kanekal, S.; Kessel, R.; Sibeck, D.; Ukhorskiy, a.A. Science objectives and rationale for the Radiation Belt Storm Probes mission. Space Sci. Rev. 2013, 179, 3–27. [Google Scholar] [CrossRef] [Green Version]
  30. Kletzing, C.; Kurth, W.; Acuna, M.; MacDowall, R.; Torbert, R.; Averkamp, T.; Bodet, D.; Bounds, S.; Chutter, M.; Connerney, J.; et al. The electric and magnetic field instrument suite and integrated science (EMFISIS) on RBSP. In The Van Allen Probes Mission; Springer: Berlin/Heidelberg, Germany, 2013; pp. 127–181. [Google Scholar] [CrossRef]
  31. Kurth, W.S.; De Pascuale, S.; Faden, J.B.; Kletzing, C.A.; Hospodarsky, G.B.; Thaller, S.; Wygant, J.R. Electron densities inferred from plasma wave spectra obtained by the Waves instrument on Van Allen Probes. J. Geophys. Res. Space Phys. 2015, 120, 904–914. [Google Scholar] [CrossRef] [Green Version]
  32. Wygant, J.; Bonnell, J.; Goetz, K.; Ergun, R.; Mozer, F.; Bale, S.; Ludlam, M.; Turin, P.; Harvey, P.; Hochmann, R.; et al. The Electric Field and Waves Instruments on the Radiation Belt Storm Probes Mission. Space Sci. Rev. 2013, 179, 183–220. [Google Scholar] [CrossRef] [Green Version]
  33. Funsten, H.; Skoug, R.; Guthrie, A.; MacDonald, E.; Baldonado, J.; Harper, R.; Henderson, K.; Kihara, K.; Lake, J.; Larsen, B.; et al. Helium, Oxygen, Proton, and Electron (HOPE) mass spectrometer for the Radiation Belt Storm Probes mission. In The Van Allen Probes Mission; Springer: Boston, MA, USA, 2013; pp. 423–484. [Google Scholar] [CrossRef] [Green Version]
  34. Blake, J.; Carranza, P.; Claudepierre, S.; Clemmons, J.; Crain, W.; Dotan, Y.; Fennell, J.; Fuentes, F.; Galvan, R.; George, J.; et al. The magnetic electron ion spectrometer (MagEIS) instruments aboard the radiation belt storm probes (RBSP) spacecraft. In The Van Allen Probes Mission; Springer: Boston, MA, USA, 2013; pp. 383–421. [Google Scholar] [CrossRef] [Green Version]
  35. Baker, D.N.; Kanekal, S.; Hoxie, V.; Batiste, S.; Bolton, M.; Li, X.; Elkington, S.; Monk, S.; Reukauf, R.; Steg, S.; et al. The Relativistic Electron-Proton Telescope (REPT) instrument on board the Radiation Belt Storm Probes (RBSP) spacecraft: Characterization of Earth’s radiation belt high-energy particle populations. Space Sci. Rev. 2013, 179, 337–381. [Google Scholar] [CrossRef]
  36. Sheeley, B.W.; Moldwin, M.B.; Rassoul, H.K.; Anderson, R.R. An empirical plasmasphere and trough density model: CRRES observations. J. Geophys. Res. Space Phys. 2001, 106, 25631–25641. [Google Scholar] [CrossRef] [Green Version]
  37. Vasko, I.Y.; Agapitov, O.V.; Mozer, F.S.; Bonnell, J.W.; Artemyev, A.V.; Krasnoselskikh, V.V.; Reeves, G.; Hospodarsky, G. Electron-acoustic solitons and double layers in the inner magnetosphere. Geophys. Res. Lett. 2017, 44, 4575–4583. [Google Scholar] [CrossRef] [Green Version]
  38. Smith, P.H.; Hoffman, R.A. Direct observations in the dusk hours of the characteristics of the storm time ring current particles during the beginning of magnetic storms. J. Geophys. Res. (1896–1977) 1974, 79, 966–971. [Google Scholar] [CrossRef] [Green Version]
  39. Vallat, C.; Ganushkina, N.; Dandouras, I.; Escoubet, C.P.; Taylor, M.G.G.T.; Laakso, H.; Masson, A.; Sauvaud, J.A.; Rème, H.; Daly, P. Ion multi-nose structures observed by Cluster in the inner Magnetosphere. Ann. Geophys. 2007, 25, 171–190. [Google Scholar] [CrossRef] [Green Version]
  40. Mozer, F.S.; Agapitov, O.; Krasnoselskikh, V.; Lejosne, S.; Reeves, G.D.; Roth, I. Direct observation of radiation-belt electron acceleration from electron-volt energies to megavolts by nonlinear whistlers. Phys. Rev. Lett. 2014, 113, 035001. [Google Scholar] [CrossRef]
  41. Artemyev, A.V.; Vasiliev, A.A.; Mourenas, D.; Agapitov, O.V.; Krasnoselskikh, V.; Boscher, D.; Rolland, G. Fast transport of resonant electrons in phase space due to nonlinear trapping by whistler waves. Geophys. Res. Lett. 2014, 41, 5727–5733. [Google Scholar] [CrossRef] [Green Version]
  42. Thorne, R.M.; Smith, E.J.; Burton, R.K.; Holzer, R.E. Plasmaspheric Hiss. J. Geophys. Res. 1973, 78, 1581–1596. [Google Scholar] [CrossRef]
  43. Chen, L.; Thorne, R.M.; Li, W.; Bortnik, J.; Turner, D.; Angelopoulos, V. Modulation of plasmaspheric hiss intensity by thermal plasma density structure. Geophys. Res. Lett. 2012, 39. [Google Scholar] [CrossRef]
  44. Lyons, L.R.; Thorne, R.M.; Kennel, C.F. Pitch-angle diffusion of radiation belt electrons within the plasmasphere. J. Geophys. Res. (1896–1977) 1972, 77, 3455–3474. [Google Scholar] [CrossRef]
  45. Meredith, N.P.; Horne, R.B.; Glauert, S.A.; Thorne, R.M.; Summers, D.; Albert, J.M.; Anderson, R.R. Energetic outer zone electron loss timescales during low geomagnetic activity. J. Geophys. Res. 2006, 111, A05212. [Google Scholar] [CrossRef] [Green Version]
  46. Ma, Q.; Mourenas, D.; Artemyev, A.; Li, W.; Thorne, R.M.; Bortnik, J. Strong enhancement of 10–100 keV electron fluxes by combined effects of chorus waves and time-domain structures. Geophys. Res. Lett. 2016, 43, 4683–4690. [Google Scholar] [CrossRef]
Figure 1. Van Allen Probe A observations from 18:00 UT to 22:00 UT on 29 January 2013. (a) The electron density was measured by the EMFISIS instrument in cm 3 . (b) Frequency-time spectrogram of the electric field power spectral density measured by WFR. (c) Frequency-time spectrogram of the magnetic field power spectral density measured by WFR. The white dashed line in Figure 1b,c denotes the lower hybrid frequency ( f LH ). (d) A Fourier spectrogram of the electric field measured by the EFW instrument. (e) A Fourier spectrogram of the magnetic field measured by the MAG instrument. The white lines in Figure 1d,e from top to bottom represent the local proton gyrofrequency ( f cp ), helium gyrofrequency ( f He ) and oxygen gyrofrequency ( f O ). The transparent block represents the time interval between 18:24 UT and 21:12 UT. The white vertical dashed line denotes the time analyzed in Figure 2. The magenta arrows denote the occurrence of TDS.
Magnetochemistry 09 00022 g001
Figure 2. The waveform of the identified time-domain structures. (a) The magnetic field signature. (b) Electric field signature. The electric and magnetic fields are in field-aligned coordinate. In this coordinate, both x and y are transverse components, and the z axis is the direction along the background magnetic field. This moment is marked with a white vertical line in Figure 1.
Magnetochemistry 09 00022 g002
Figure 3. (a) Energy spectrogram of spin-averaged proton flux. (bg) pitch-angle distributions of proton fluxes at energies from ∼10 eV to 1000 eV. The energy channel is marked on the left side of each panel.
Magnetochemistry 09 00022 g003
Figure 4. (a) Energy spectrogram of spin-averaged electron flux. (bi) pitch-angle distributions of electron fluxes at energies from ∼26 eV to 1476 eV. The energy channel of each panel is marked on the left.
Magnetochemistry 09 00022 g004
Figure 5. Four examples (Events A, B, C, and D) of TDS in plasmaspheric plumes. (a,d,g,j) Plasma density is inferred from the upper hybrid resonance line. (b,e,h,k) Power spectral density of the electric field. (c,f,i,l) Power spectral density of the magnetic field. In these spectrograms, the dashed line denotes the lower hybrid frequency.
Magnetochemistry 09 00022 g005
Figure 6. (a) Distribution of events in magnetic latitudes and L shell. (b) Spatial distribution of events in magnetic local time and L shell.
Magnetochemistry 09 00022 g006
Disclaimer/Publisher’s Note: The statements, opinions and data contained in all publications are solely those of the individual author(s) and contributor(s) and not of MDPI and/or the editor(s). MDPI and/or the editor(s) disclaim responsibility for any injury to people or property resulting from any ideas, methods, instructions or products referred to in the content.

