Article

Pressure–Temperature Phase Diagram of Multiferroic TbFe2.46Ga0.54(BO3)4

1
Kirensky Institute of Physics, Federal Research Center KSC SB RAS, 660036 Krasnoyarsk, Russia
2
Ioffe Institute, Politekhnicheskaya 26, 194021 St. Petersburg, Russia
3
Institute of Engineering Physics and Radio Electronics, Siberian Federal University, 660041 Krasnoyarsk, Russia
4
State Key Laboratory of Material Processing and Die and Mould Technology, School of Materials Science and Engineering, Huazhong University of Science and Technology, Wuhan 430074, China
*
Author to whom correspondence should be addressed.
Magnetochemistry 2022, 8(6), 59; https://doi.org/10.3390/magnetochemistry8060059
Submission received: 15 April 2022 / Revised: 7 May 2022 / Accepted: 9 May 2022 / Published: 1 June 2022
(This article belongs to the Special Issue Multiferroic Materials 2021)

Abstract

:
The pressure–temperature phase diagram of the multiferroic TbFe 2.46 Ga 0.54 (BO 3 ) 4 was studied for hydrostatic pressures up to 7 GPa and simultaneously with temperatures up to 400 K by the Raman spectroscopy technique. The structural phase transition from the R 32 phase to the P 3 1 21 phase was determined by observing the condensation of soft modes and the appearance of new lines. An increase in pressure leads to an increase in the temperature of the structural phase transition. These phases are stable over the entire investigated temperature and pressure range. No other phases have been found.

1. Introduction

Ferroborates crystals with rare-earth elements in the structure and similar to the natural mineral huntite are still considered as a budding materials for optoelectronic devices and applications [1]. Some of them demonstrate rather high magnetoelectric effects [2,3]. The applications can be optimized by full or partial replacement of ions of rare earth elements or iron atoms in the structure [4,5,6,7,8,9]. In particular, it was found that the temperature of the structural phase transition in the HoFe 3 (BO 3 ) 4 crystal can shift significantly when Fe is replaced by Ga ions [9].
The growth of these crystals and their initial characteristization are presented in several publications [7,8,9]. It turned out that their R 32 phase is built of spiral chains of FeO 6 octahedra directed along the c-axis. The phase transition in terbium ferroborate from the structure with R 32 symmetry to the P 3 1 21 symmetry group structure was detected by the Raman spectroscopy techniques at 198 K [10]. Later, this temperature was refined by other methods up to 192 K [11,12,13].
The magnetic phase transition in the TbFe 3 (BO 3 ) 4 crystal was observed at 40 K [7] and was studied by several methods [14,15]. It was found that the magnetic properties of a crystal are determined by the interaction between two magnetic sublattices of Fe and Tb ions. Antiferromagnetic ordering occurs in the Fe sublattice with the magnetic moments of the ions directed along the third-order axis. The interaction of these two sublattices leads to the same ordering of the Tb magnetic moments along one axis. In this crystal, one more spin-reorientation transition of the first order was discovered with H c = 35 Oe at 4.2 K [11,12,16]. NMR studies of TbFe 3 (BO 3 ) 4 revealed six nonequivalent magnetic sublattices of Fe ions [17]. Functional density modeling was performed for TbFe 3 (BO 3 ) 4 [11,12], NdFe 3 (BO 3 ) 4 , NdGa 3 (BO 3 ) 4 [18], HoGa 3 (BO 3 ) 4 crystals [19].
The Raman spectroscopy technique has been repeatedly used to study structural and magnetic transitions in single crystals and ferroborates solid solutions (Ho,Nd)Fe 3 (BO 3 ) 4 [5,6], Ho(Fe,Ga) 3 (BO 3 ) 4 [9], GdFe 3 (BO 3 ) 4 [20], (Sm,La)Fe 3 (BO 3 ) 4 [8], TbFe 2.5 Ga 0.5 (BO 3 ) 4 [21], SmFe 3 (BO 3 ) 4 [22]. The temperature dependence of the Raman spectra in a pure TbFe 3 (BO 3 ) 4 single crystal was studied early by optical spectroscopy [23], Raman spectroscopy [10,24], magnetodielectric and magnetoelastic coupling properties [25], and the Faraday effect [26]. Here, anomalies were found in the low-frequency range near the magnetic phase transition [10,24], as well as at medium frequencies near the structural phase transition [24,25].
The temperature structural phase transition was investigated by the method of Raman scattering also in the solid solution TbFe 2.5 Ga 0.5 (BO 3 ) 4 [21]. Experiments at high pressures were carried out in the HoFe 3 (BO 3 ) 4 and TbFe 3 (BO 3 ) 4 crystals [27,28]. In the same works, a phase diagram was obtained. Similar anomalies can be expected in the Raman spectra of other TbFe 3 x Ga x (BO 3 ) 4 solutions [9].
The gallium is a non-magnetic atom. When iron atom is replaced by gallium atom, the effect of the magnetic iron sublattice on the magnetic terbium sublattice decreases. However, this requires a concentration of gallium so as not to break the symmetry of the host crystal. TbFe 2.46 Ga 0.54 (BO 3 ) 4 is one of the samples in the series from pure iron to supposed pure gallium, close to the phase existence limit.
Possible transitions in the TbFe 2.46 Ga 0.54 (BO 3 ) 4 solid solution with increasing pressure have not been studied. Among the possible external parameters, hydrostatic pressure has such specificity that it allows for changing the interatomic distances, and thus the interactions, to a much larger extent than any other parameter like temperature or magnetic field. In spite of many investigations with other termodinamic parameters, a broad overview of the effect of hydrostatic pressure on rare-earth ferroborates is still lacking. Information about of the temperature-pressure phase diagram is important for materials applying for practical use. The purpose of this work is to study the p-T phase diagram in a crystal. For this purpose, we plan to carry out polarized Raman experiments at various angles, assign experimental modes to irreducible representations based on symmetry analysis, carry out studies with temperature and pressure changes, and construct a temperature–pressure phase diagram.

2. Materials and Methods

Single crystals of TbFe 2.46 Ga 0.54 (BO 3 ) 4 were grown from a solution-melt based on (Bi 2 Mo 3 O 12 –B 2 O 3 –Tb 2 O 3 ). Solution-melts weighing P = 150 g were prepared in a platinum cylindrical crucible (D = 40 mm, H = 50 mm) by sequential fusion at T = 1100 C of the oxides Bi 2 O 3 , MoO 3 , B 2 O 3 , Fe 2 O 3 , Ga 2 O 3 . At the stage of dissolution at the same temperature, the stirred solution-melt was kept for 8–10 h. This time is sufficient for its complete homogenization. The saturation temperature was determined with an accuracy of ± 2 °C using test crystals, which were preliminarily obtained on a rod crystal holder in the spontaneous nucleation mode.
After the final homogenization, the temperature of the solution-melt was reduced to T = T s a t + 7 °C (T s a t temperature of saturation), the rod with a seed was immersed in the solution-melt, and its reverse rotation was switched on at a rate of ω = 30 rpm. After 10 h, the temperature was lowered to T = T s a t 10 °C and then smoothly according to the program with an increasing rate d T / d t = 1 3 °C/day. The growth continued up to 14 days. During this time, high-quality crystals with sizes up to 4–12 mm grew. The crystal holder with the grown crystals was raised above the molten solution, and the furnace was cooled to room temperature with the power turned off.
Raman spectra were collected in backscattering geometry by Horiba Jobin-Yvon T64000 triple spectrometer (Horiba, France) operating in the dispersion subtraction mode. Resolution of the low-frequency region in the study of the soft mode was improved to 1.2 cm 1 . We used a Spectra-Physics Excelsior-532-300-CDRH (USA) 532 nm diode-pumped visible CW solid-state single-mode laser with a power of 5 mW on sample as a source of exciting light. The samples were optically transparent unoriented greenish single crystals less than 3 mm in size with natural faceting and did not contain defects and inclusions visible under a microscope. The temperature of the structural phase transition was determined from the temperatures of the anomalies in the spectra, including the appearance of new lines in the Raman spectrum, and by analyzing the behavior of the soft modes. High-temperature gas membrane-driven diamond anvil cell (HT-DAC) device Diacell μ Scope DAC HT(G) type (EasyLab, Kent, UK) was used for Raman study of processes at simultaneously high pressure and temperature. The stainless steel gasket with an initial thickness of 250 μ m pre-indented to 80 μ m was used in the experiment. The pressure was monitored by the shift of the 5 D 0 7 F 0 fluorescence band of Sm 2 + ion in a small SrB 4 O 7 :Sm 2 + crystal placed in the sample’s vicinity within the experimental error of about 0.05 GPa [29,30]. The experimental temperature was monitored using a type K thermocouple in contact with the gasket and diamond anvil. The most commonly used mixture 4:1 of methanol and ethanol alcohols has been used as a hydrostatic pressure transmission media.

3. Results and Discussion

3.1. Symmetry Analysis

The analysis of the structural transition of TbFe 3 (BO 3 ) 4 using the Bilbao Crystallographic Server [31,32] showed that the phase transition is due to the instability of the R 32 phase at Λ point of the Brillouin zone. Mode Λ 3 at Λ point of the Brillouin zone in R 32 phase goes to mode Γ 1 with A 1 symmetry (soft mode) at the Γ point of the Brillouin zone in the P 3 1 21 phase. The existence of a soft mode with an energy minimum at the Λ point in the Brillouin zone, at the critical temperature (192.5 K), was experimentally confirmed by inelastic neutron scattering [13].
In the high-temperature R 32 phase of the TbFe 3 (BO 3 ) 4 crystal, the representation of vibrations active in Raman scattering at the center of the Brillouin zone is
G R a m ( R 32 ) = 7 A 1 + 19 E
At the center of the Brillouin zone, the vibrational representation active in Raman scattering for the P 3 1 21 phase can be decomposed as
G R a m ( P 3 1 21 ) = 27 A 1 + 59 E
An unoriented sample is used in the experiment at high hydrostatic pressures. This is due to the microscopic dimensions of the sample—usually, the size does not exceed 70–100 μ m. Through the analysis in a laboratory coordinate system that differs from the crystallographic one by rotations to Euler’s angles, the following transformations can be performed.
The relative Raman modes intensity can be presented by:
I     | e i R e s | 2
where I is the scattered Raman intensity; R is the Raman tensor, e i and e s represent the polarized unit vectors of the incident and scattered lights [33,34,35]. The Raman tensors R depend on the D 3 point group for both space groups [36]. The Raman tensor components for the R 32 (No. 155) and P 3 1 21 (No. 155) space groups in which the corresponding vibrations are active are presented in Table 1, where a, b, c, d represent the Raman tensors element.
The e i and e s in parallel configuration in Cartesian coordinates can be defined as
e i = ( 0 , 1 , 0 )
e s = ( 0 , 1 , 0 )
The e s in cross configuration in Cartesian coordinates can be defined as
e s = ( 1 , 0 , 0 )
Considering the Euler matrix, Φ x y z (and its inverse Φ ˜ x y z ) and presented in Appendix A as (A1), which transforms the crystal coordinates into the experimental ones, the Raman tensor is given by:
R x y z = Φ x y z R Φ ˜ x y z
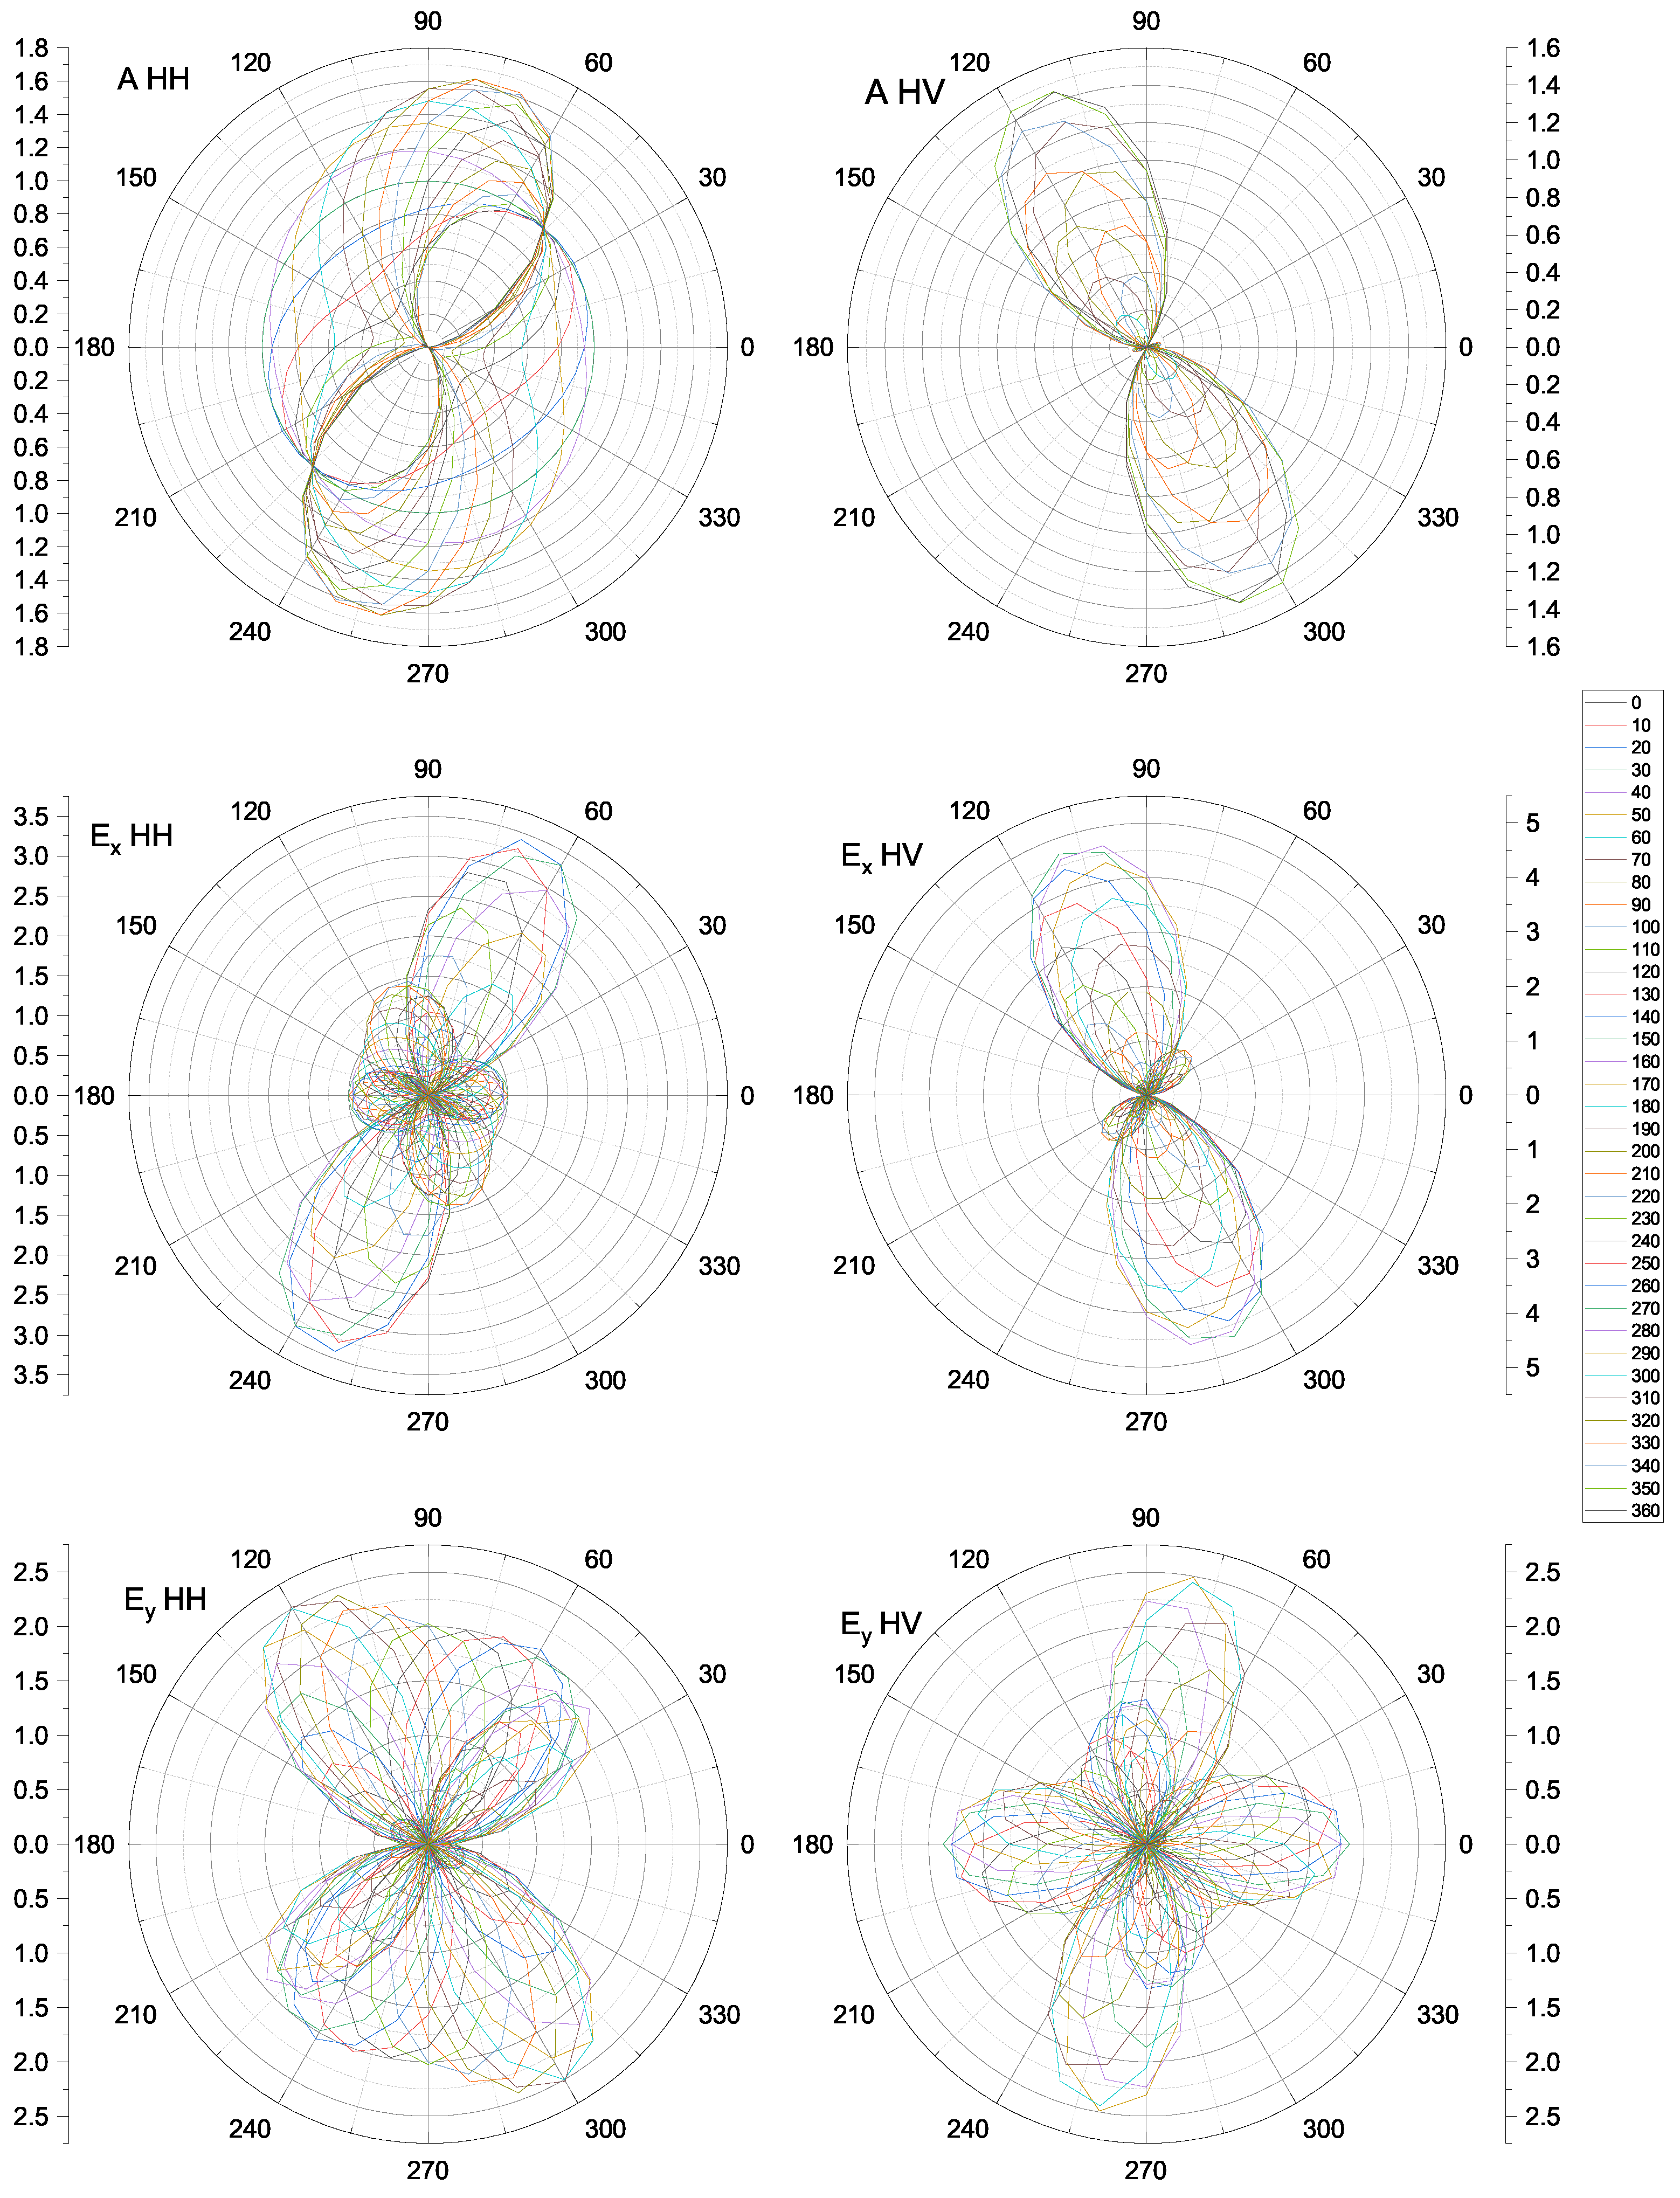
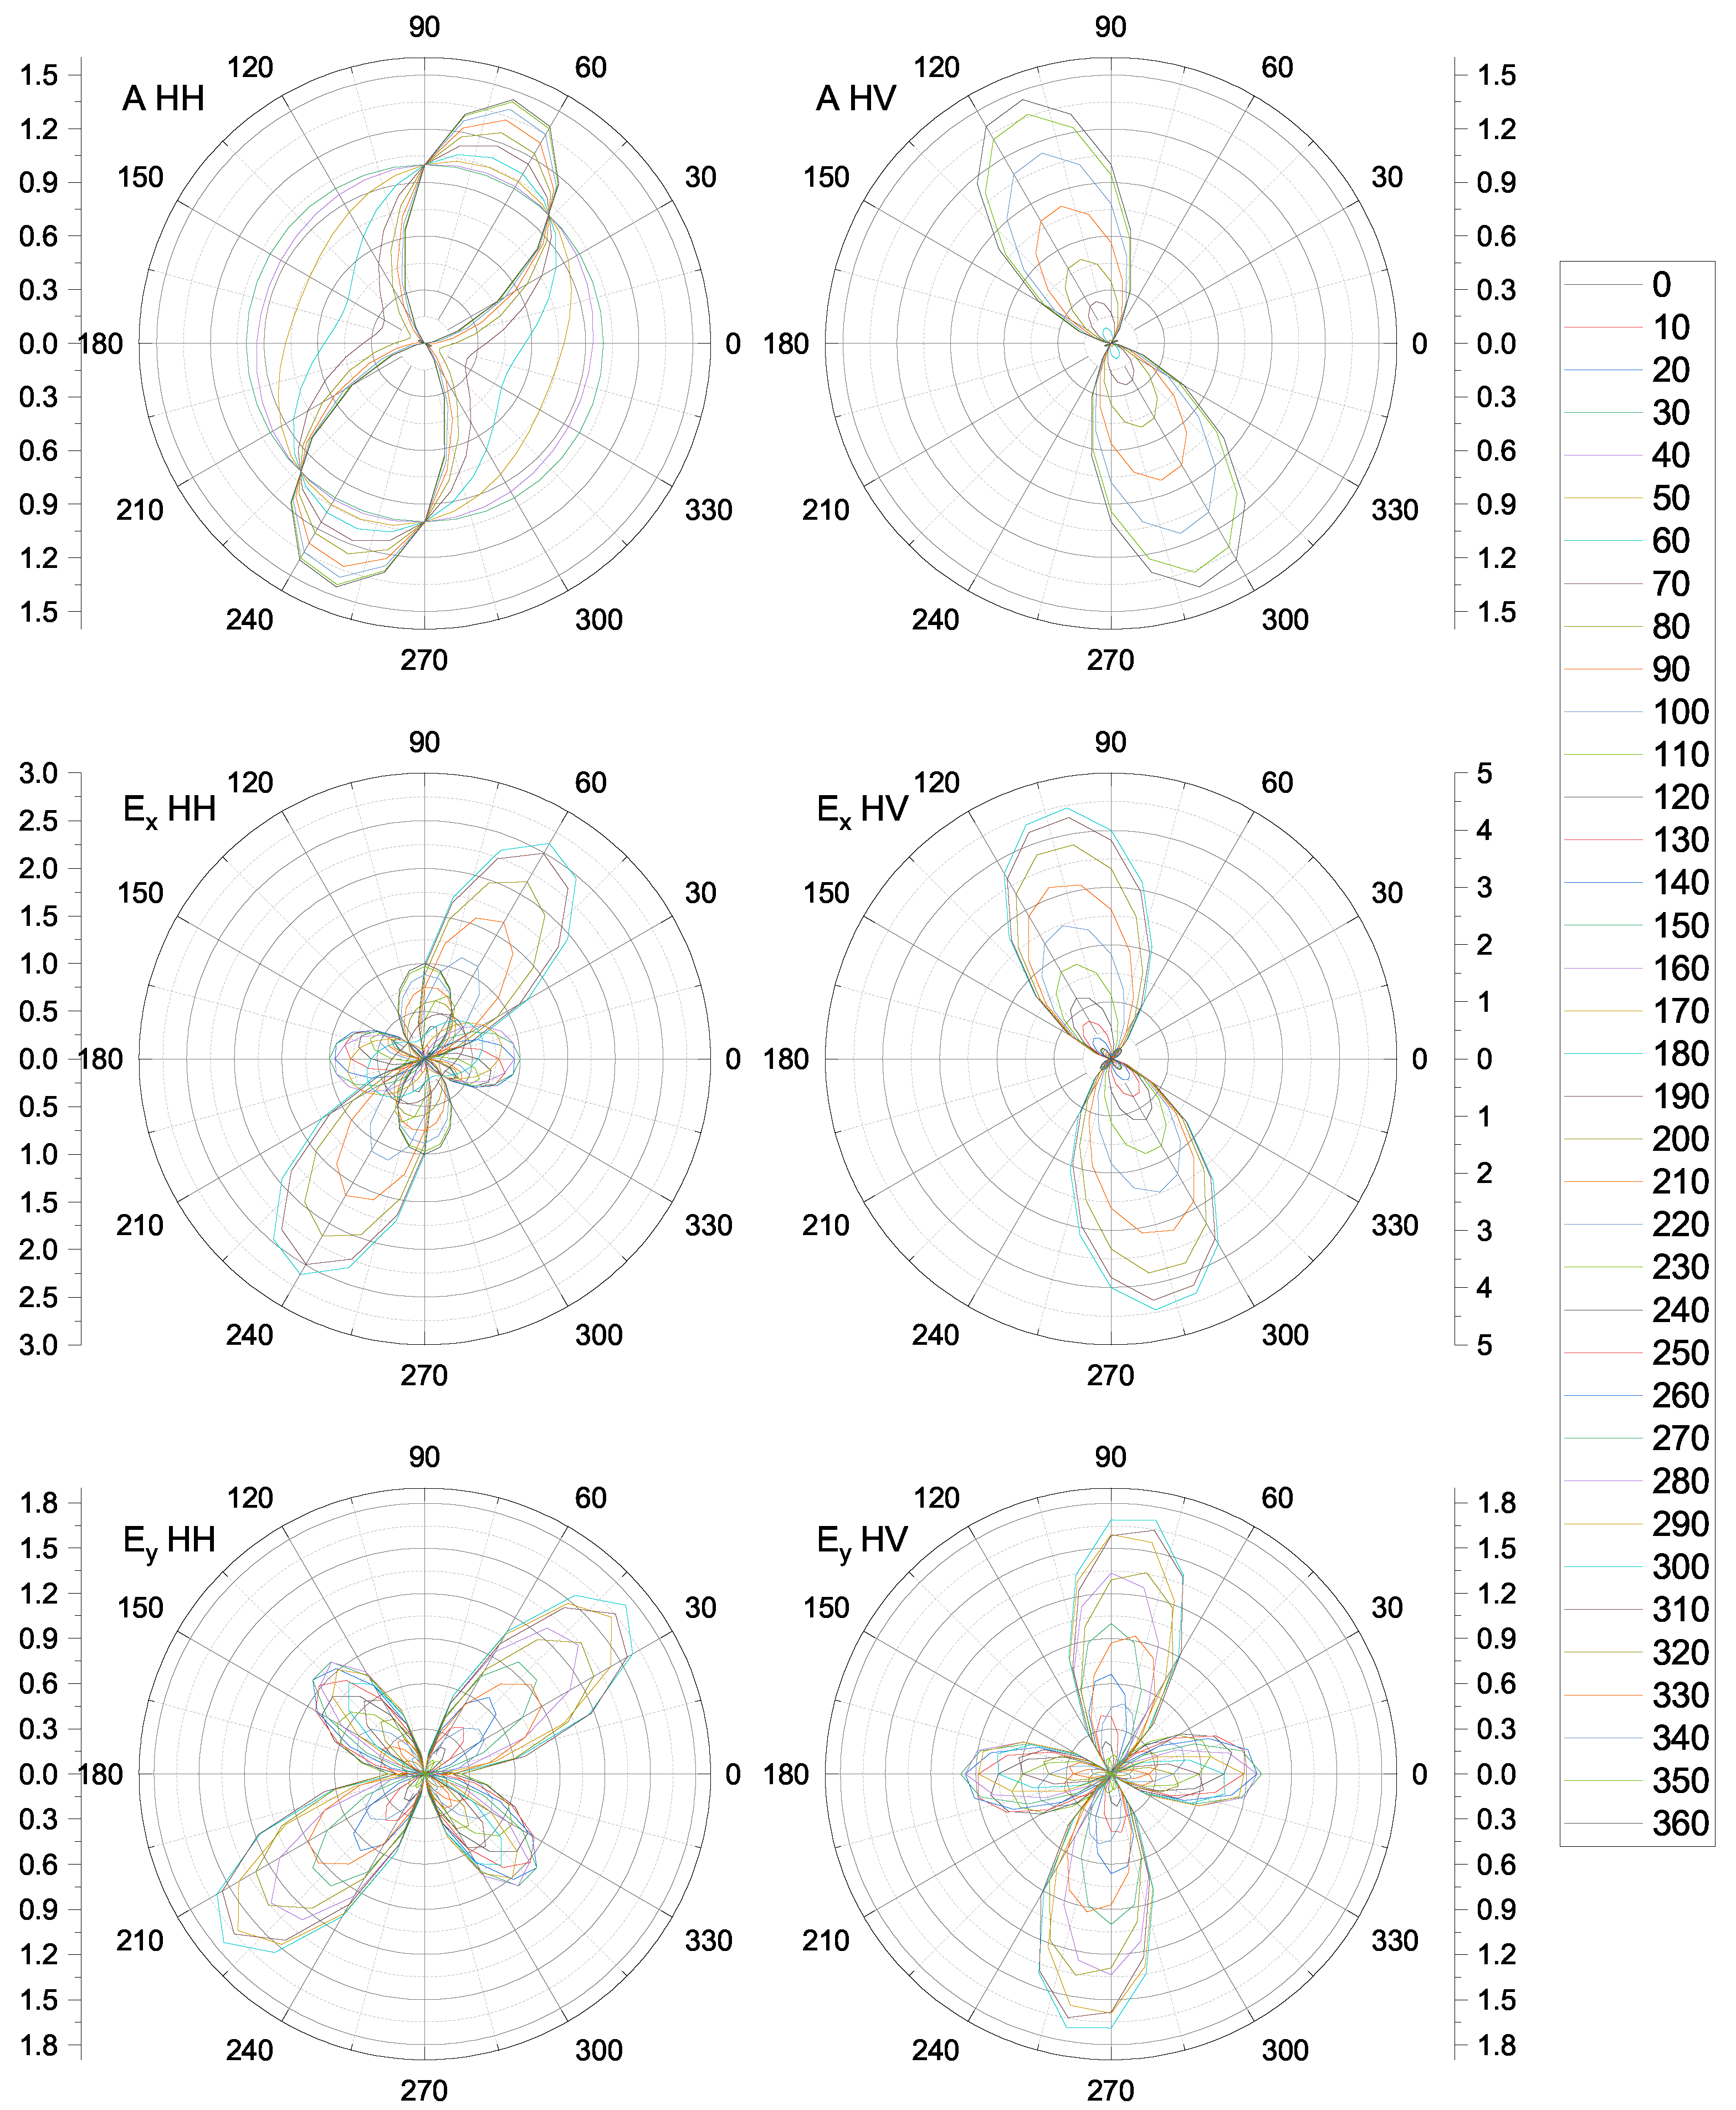
The calculated by formula (3) Raman modes are presented in Figure A1Figure A3. The rotation angle intensity map of calculated Raman modes in HH and HV polarisation is presented in Figure A4.
The TbFe 3 (BO 3 ) 4 crystal includes two magnetic subsystems of Fe and Tb ions. The analysis of the magnetic ordering in the crystal showed that the magnetic transition in the low-temperature P 3 1 21 phase is possible from paramagnetic P 3 1 211 phase (152.2.1264) phase to probable P 2 c 3 2 21 (152.4.1266) antiferromagnetic phase. Notations correspond to [37,38,39]. In the experimental work [11], it is assumed that the magnetic transition occurs in the P c 3 2 21 (154.44) phase in Belov–Neronova–Smirnova notation [40,41]. It is the same P 2 c 3 2 21 (152.4.1266) phase as we find using the Bilbao Crystallographic Server but in Opechowski–Guccione notation [39].
One can assume some changes will occur in the spectra of TbFe 3 (BO 3 ) 4 crystal when some of the Fe ions will be replaced by Ga ions. We expect a shift in the structural phase transition temperature, a shift in the temperature of the magnetic ordering, and small changes in line positions. For example, in the work [9], it is shown that the temperature of the structural phase transition at atmospheric pressure in HoFe 3 x Ga x (BO 3 ) 4 crystals decreases with an increase in the concentration of gallium. We suggest that the proximity of the structural and magnetic transitions in this crystal can cause a strong interaction of the structural and magnetic order parameters.

3.2. Angular-Dependent Raman Spectra

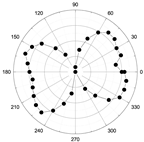
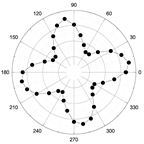
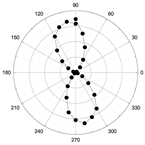
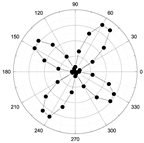
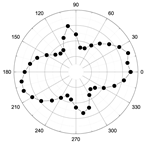
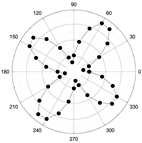
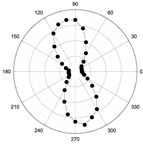
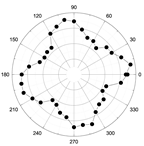
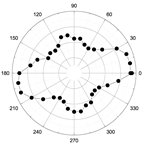
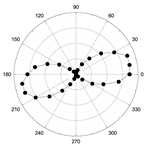
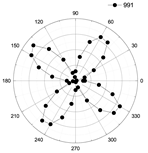
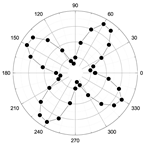
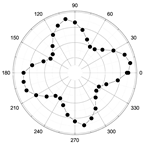
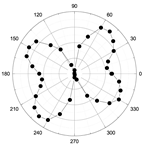
The angular dependencies of the Raman spectra were measured for an unoriented piece of a single crystal. This was done for two reasons. First, in the Raman spectra of an unoriented crystal, all lines of the spectrum are present; in certain components of the scattering tensor, some lines can be forbidden by the selection rules. The presence of all possible lines in the spectrum simplifies the detection of anomalies associated with structural and magnetic transitions. Second, in experiments under high hydrostatic pressures, the orientation is difficult to control. Even a correctly placed sample can turn into a position during the pressurization process, the spectra of which will be the same as those of non-oriented samples. The angular dependencies of the intensities of the spectral lines were analyzed according to the theoretical dependencies presented in the appendix. Lines with different types of symmetry give different patterns. Theoretically calculated patterns for various angles are shown in Figure A1Figure A3. The performed assignment by vibration types together with the experimentally obtained patterns is presented in Table 2.
The low-frequency modes (93, 181 cm 1 ) are due to lattice vibrations and displacement of heavy atoms of Tb. The 200–250 cm 1 modes are attributed to the vibrations of the BO 3 triangles and the displacements of the iron atoms. The region from 400 to 500 cm 1 is attributed with bending of BO 3 triangles and oxygen displacements in FeO 6 octahedra. The range 600–750 cm 1 includes modes of bending of BO 3 triangles and oxygen atoms’ vibrations in FeO 6 octahedra, TbO 6 prisms. The region of 950–1000 cm 1 includes the displacements of the vertices of the planar BO 3 triangles and the shifts of oxygen atoms in the FeO 6 octahedra. The vibration modes in the region of about 1200–1300 cm 1 are associated with the stretching of the B–O bond inside the BO 3 triangles [10,24,28].

3.3. Phase Transitions at Atmospheric Pressure

The temperature dependence of Raman spectra of TbFe 2.46 Ga 0.54 (BO 3 ) 4 crystal were studied in the temperature range from 8 to 400 K. The full Raman spectra of TbFe 2.46 Ga 0.54 (BO 3 ) 4 at some temperatures are shown in Figure 1. The concentration of gallium is not enough to change the R 32 symmetry of the crystal under normal conditions. If the symmetry of the crystal were to change, we would see changes in the spectrum associated with the change in symmetry compared to previously published spectra of the TbFe 3 (BO 3 ) 4 crystal [10,24,25].
The appearance of new bands with decreasing temperature has been observed in the region of about 1000 cm 1 , 390 cm 1 and lowest wavenumber (soft mode) as it was predicted according to group-theoretical analysis for isostructural materials [9,29].
Raman spectra transformation with temperature of TbFe 2.46 Ga 0.54 (BO 3 ) 4 in the mid-wavenumber region is presented in Figure 2. The appearance of new lines at 374 and 276 cm 1 have been observed (Figure 2). The presence of these lines in the spectra can be an indicator of belonging to a phase with P 3 1 21 symmetry and the absence of lines indicating belonging to the R 32 symmetry phase.
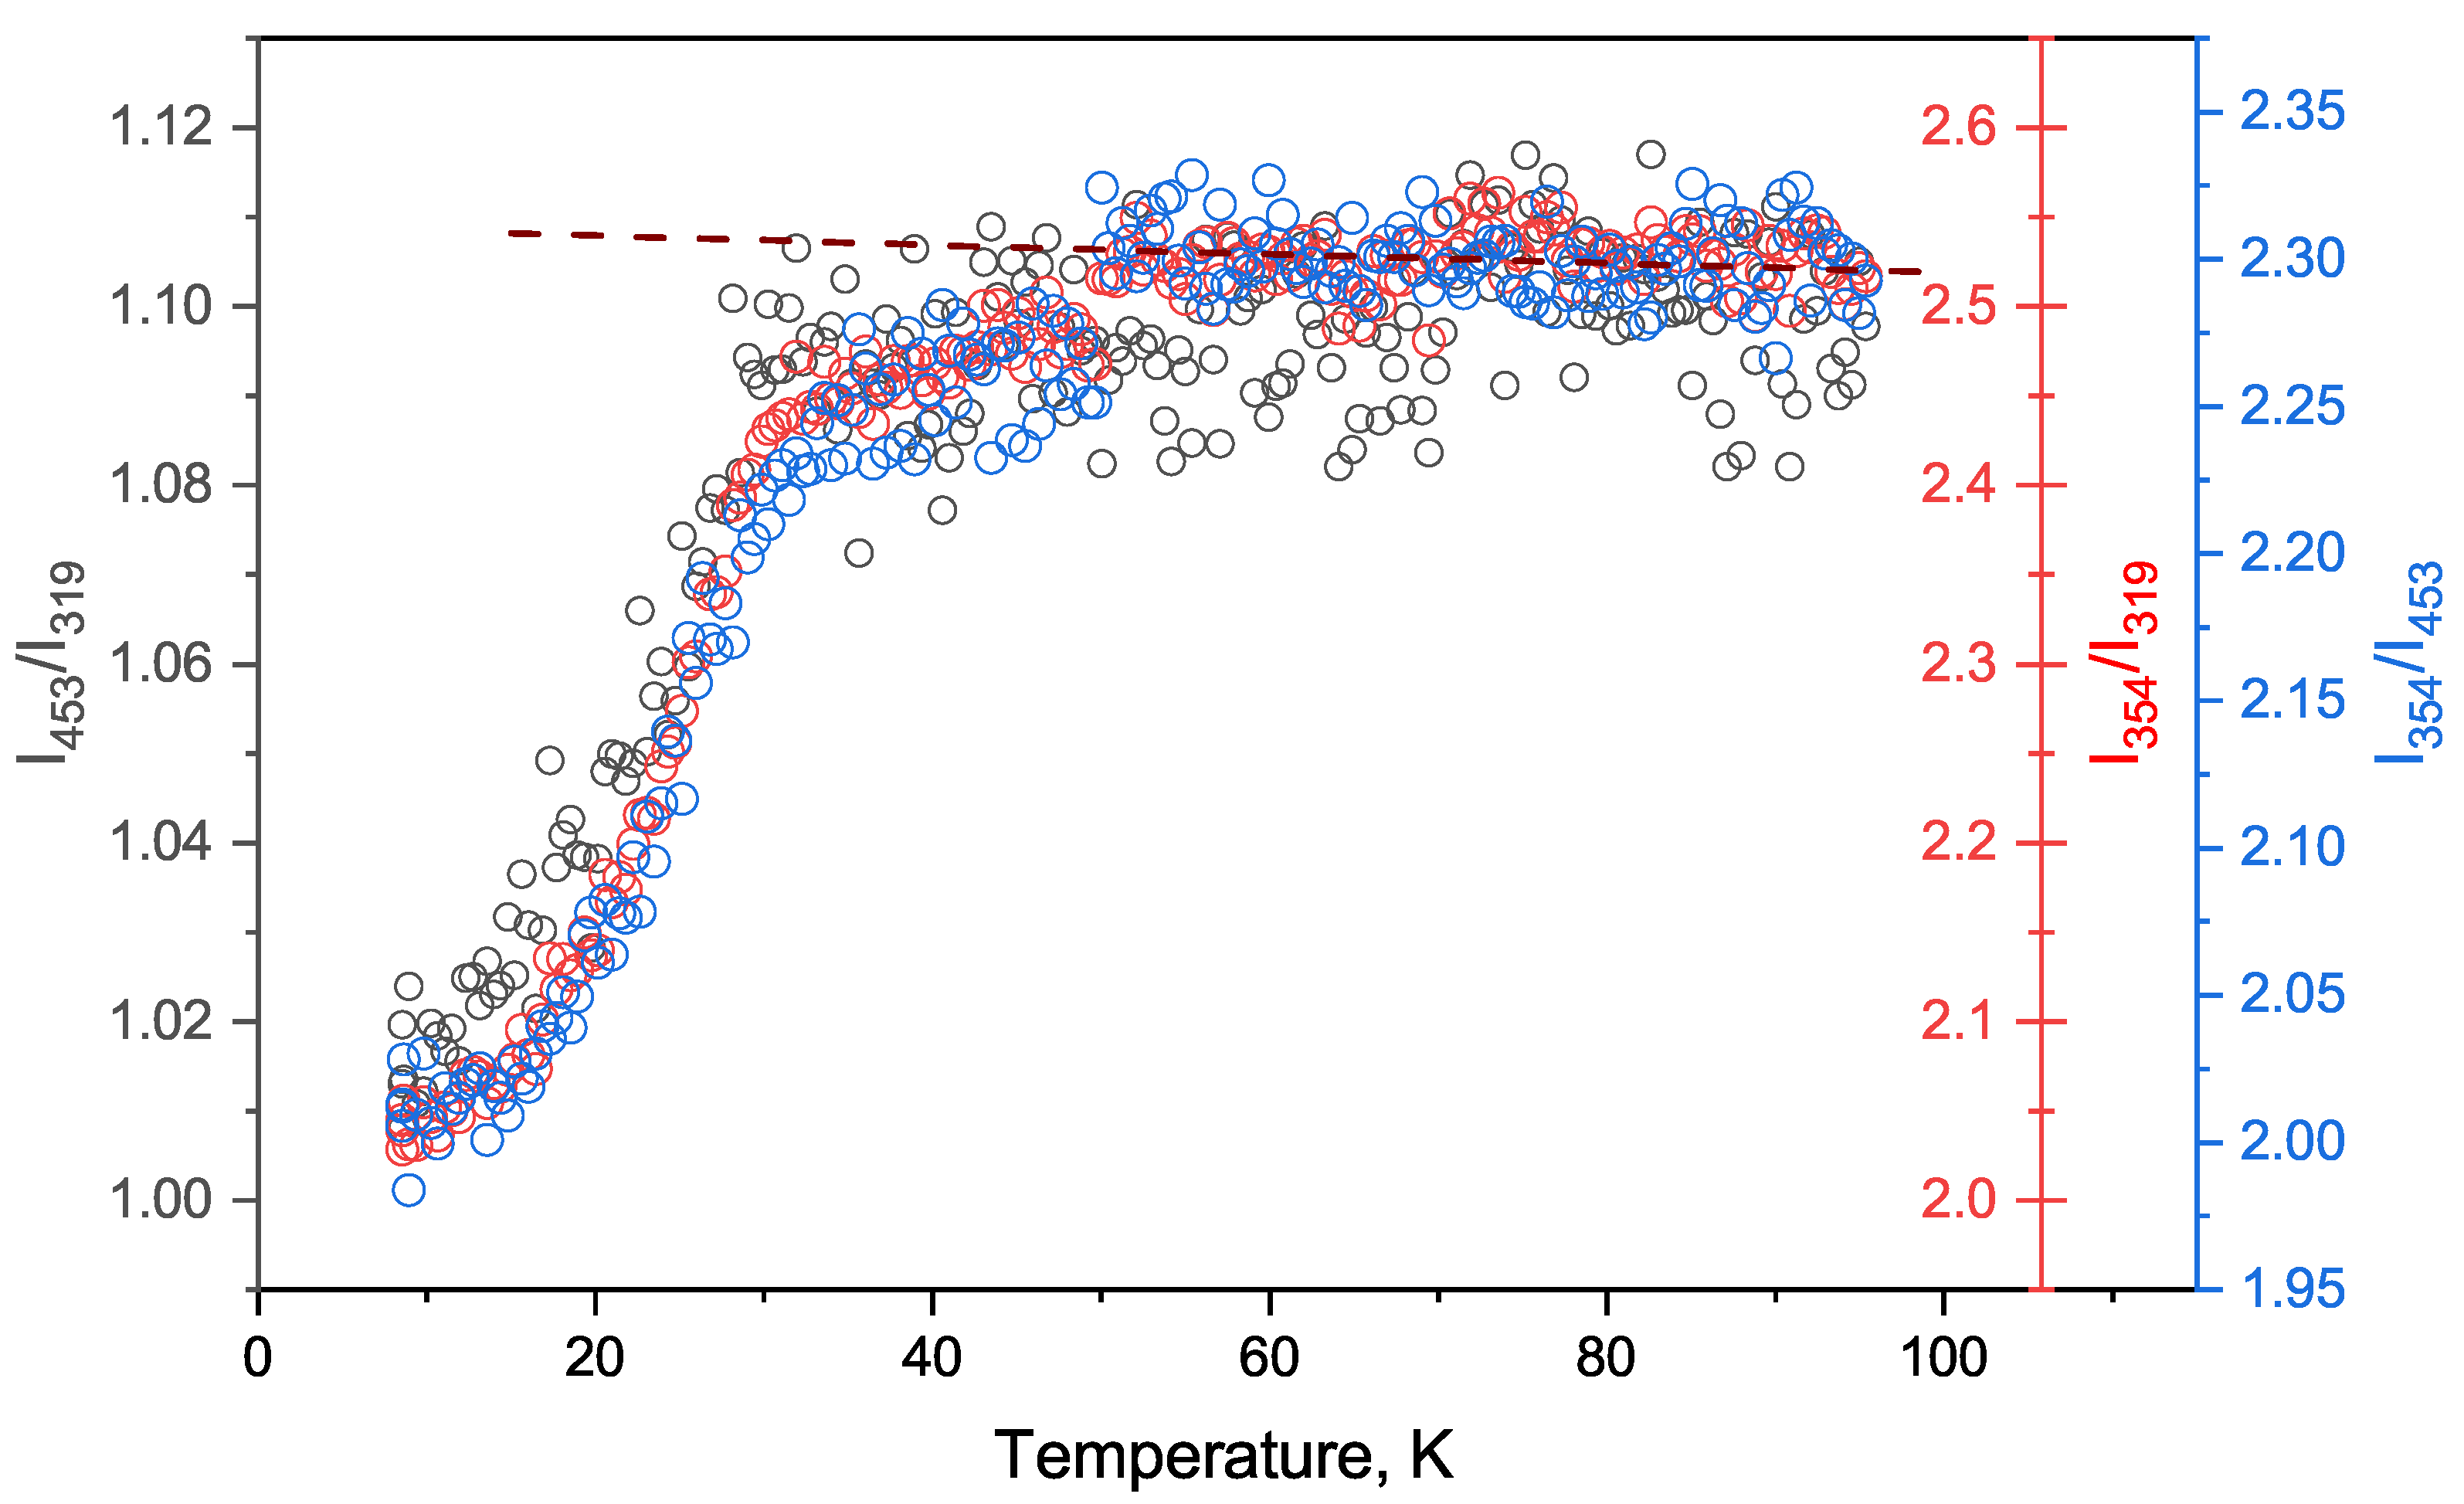
An article was previously published about “soft” (low-frequency) temperature modes in this crystal [42]. Therefore, we did not consider them in this work. We found some anomalies in the behavior of the hard modes below 50 K. Hard modes are optically active phonons which show systematic changes of their Raman spectra when the structural properties of a material are changed—heating or application of pressure. This feature is a great advantage for the analysis of materials. The relative changes of the phonon frequencies are usually below several percent of their total energies, which is why “hard modes” instead of “soft modes” [43,44]. New modes at 370 and 970 cm 1 appear close to 33 K (Figure 1 and Figure 2). The splitting hard mode peaks are attributed to the structural phase transition [45,46]. The new modes appear according to the selection rules. In Figure 3, one can see the dependence of the ratio of the integral intensities of several pairs of hard modes on the temperature. The slope of the curve of this dependence sharply changes near 33 K. This behavior is characteristic of a structural phase transition. It is the fine manifestation of fluctuations of the structural order parameter at low temperatures. An additional break is visible at a temperature of about 50 K. It is clearly seen from the deviation from the dependence at high temperatures, the approximation of which is indicated by a dotted line. We attribute this behavior to the transition of magnetic ordering.
The crystal TbFe 2.46 Ga 0.54 (BO 3 ) 4 undergoes a structural phase transition at T c = 33 K. The temperature of the structural phase transition is close to the magnetic ordering temperature. The changes observed in the spectra point to the structural ordering arises.
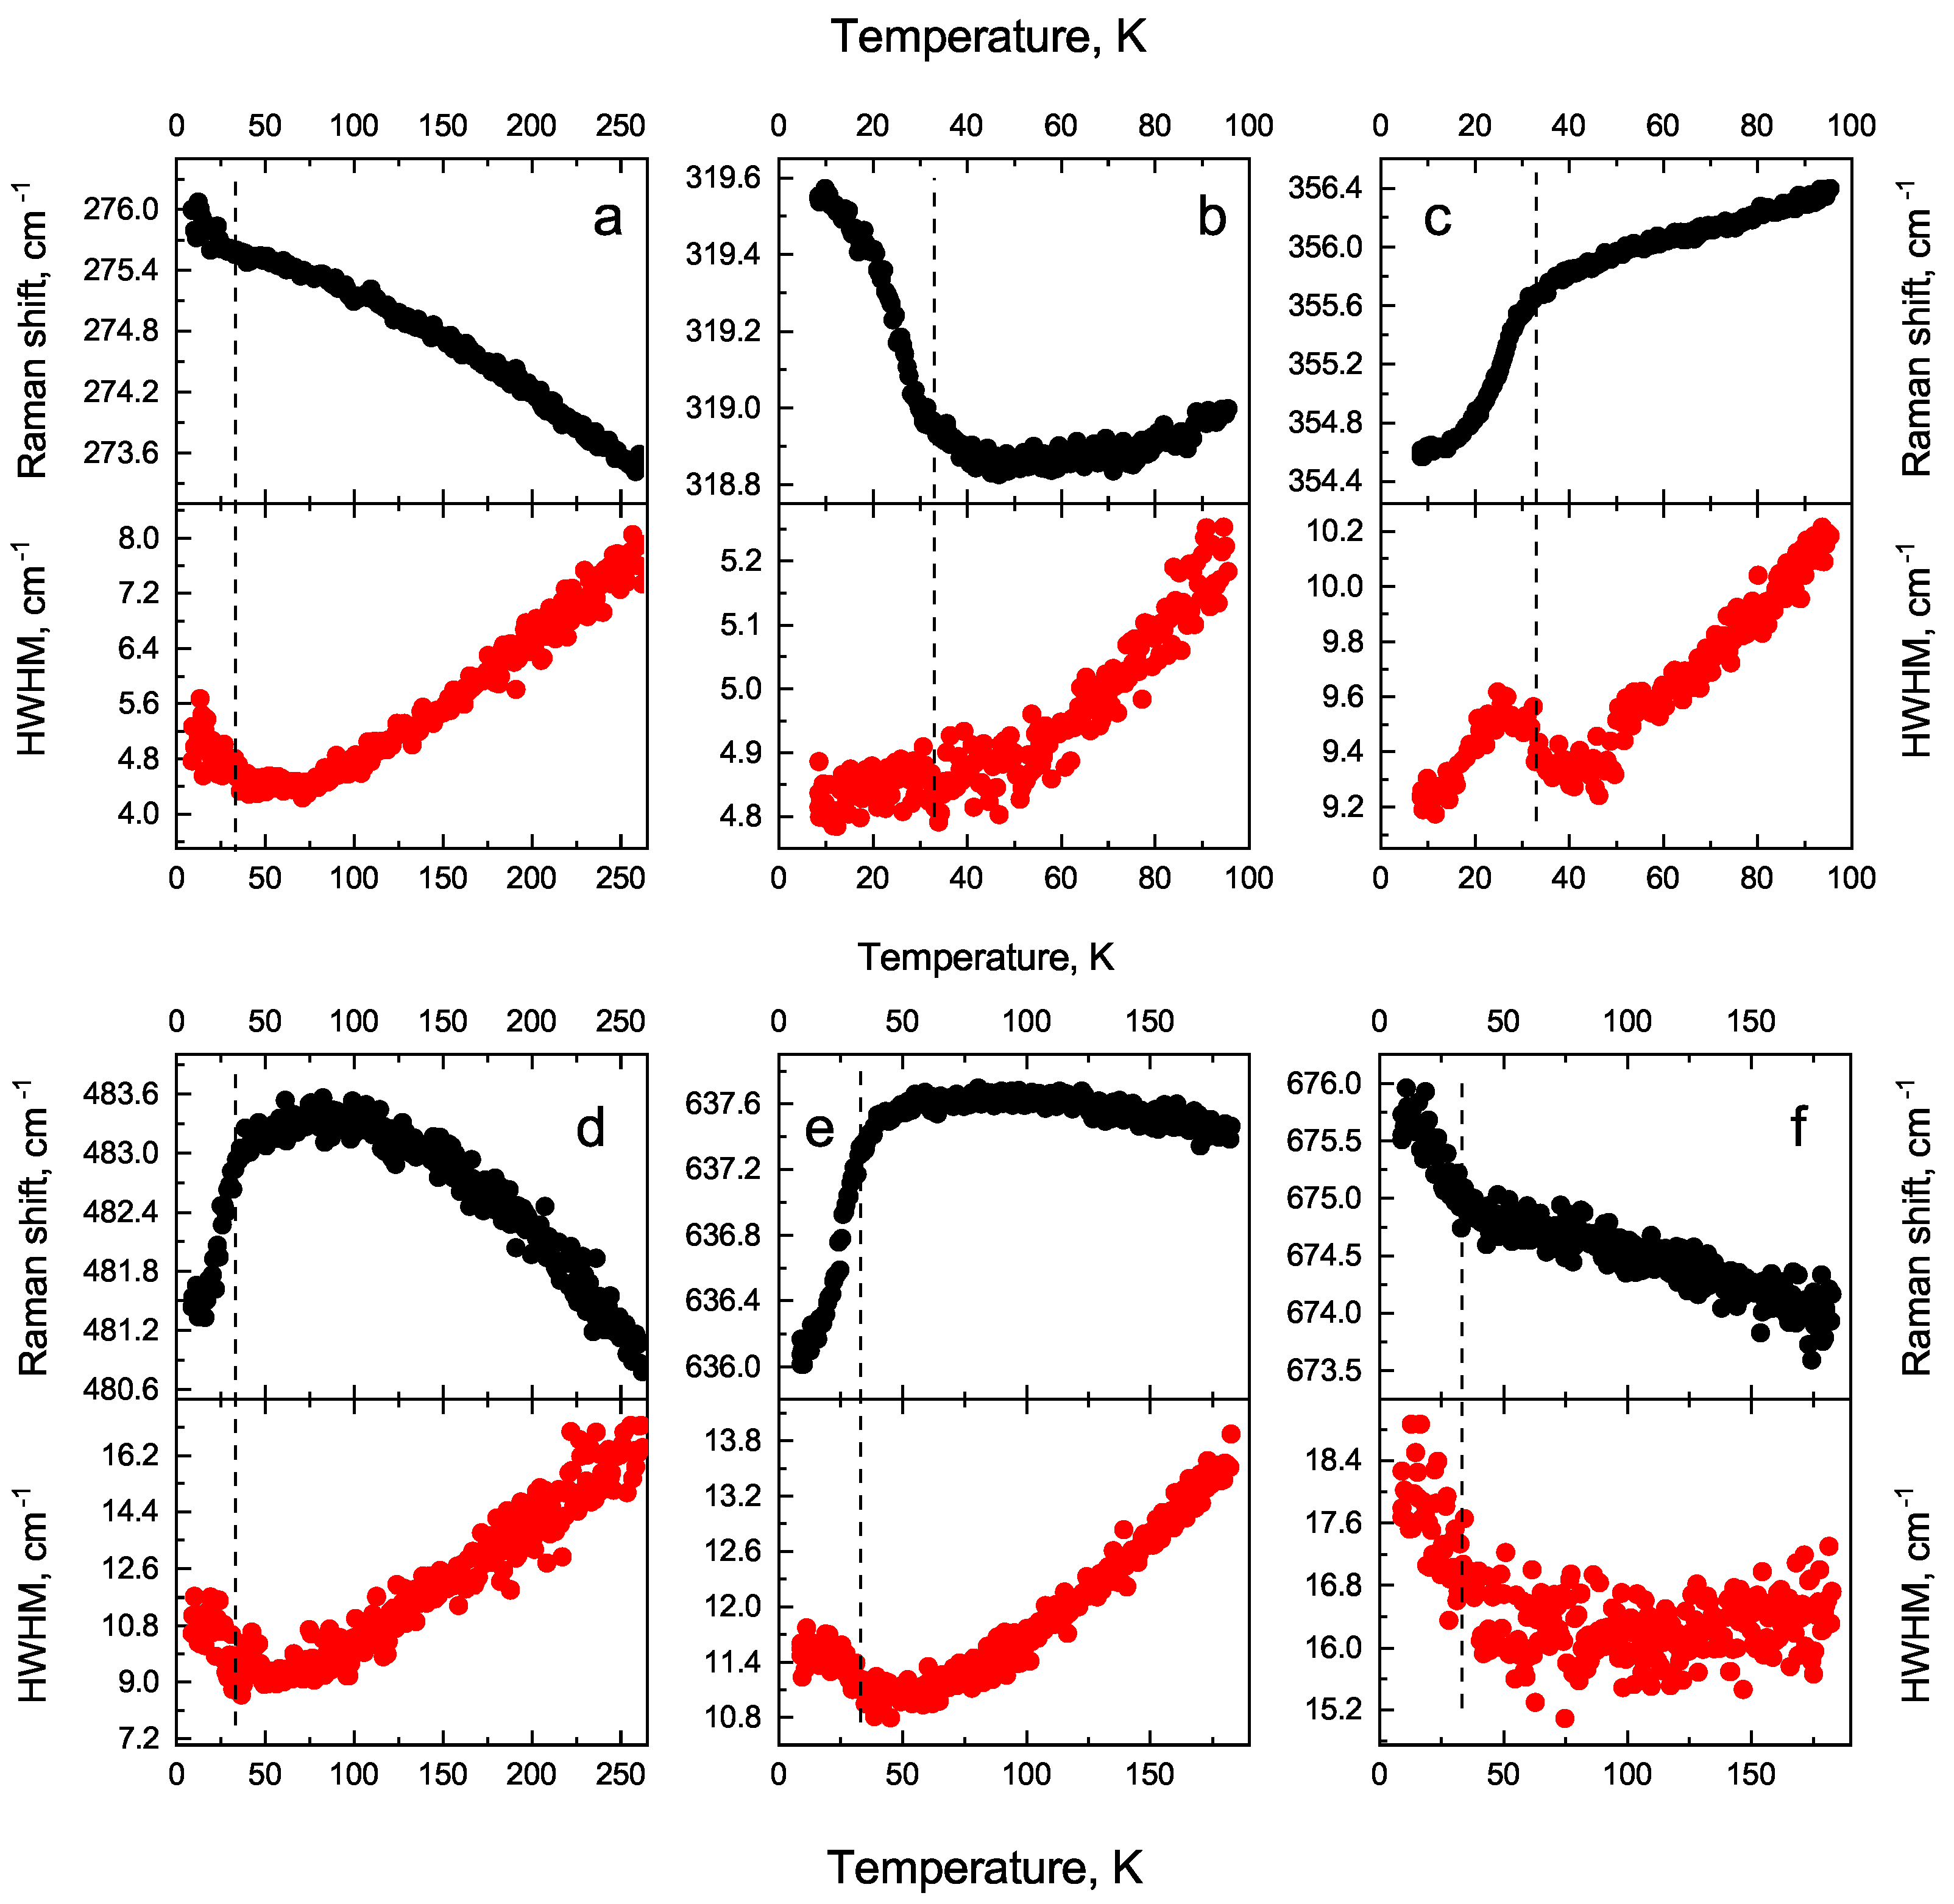
Temperature dependence of 273 cm 1 internal mode position is given in Figure 4a. Width of this line reveals some transitional effects as well. The temperature dependencies of the 319 cm 1 line position and its width is given in Figure 4b. The slope of the 319 cm 1 line position dependence changes below the transition temperature Figure 4b. Figure 4c shows temperature dependence of the 356 cm 1 internal mode. A small additional shift of the line width appears in a narrow (about 0.4 K) region below 40 K. The shift decreases in the R 32 phase under cooling, then sharply changes the direction in the second phase. Temperature dependencies of 480 cm 1 (A 1 ) line position and width are shown in Figure 4d. After the transition point (33 K), line position goes down with cooling. The temperature of transition is shown by the dashed lines in Figure 4. Temperature dependencies of the 637 cm 1 line position and the width are given in Figure 4e. Positions of the 674 cm 1 line and width change slightly under cooling (Figure 4f).

3.4. p–T Phase Diagram

Thermocouple in contact with the gasket measures the experimental temperature within the diamond anvil cell. Sample temperature could differ from the values given from the thermocouple. We performed experiments with two pressure sensors for calibrating thermocouple reading. We used a small SrB 4 O 7 :Sm 2 + crystal as a pressure sensor independent from the temperature and the ruby chip as a sensor reading which depends both on the pressure and the temperature [47,48]. With the shift of the ruby luminescence band, consisting of independent contributions of temperature and pressure, and using the reading of the second sensor as pressure data, we could calculate the temperature inside the pressure chamber. We got a calibration curve for temperature correction comparing the thermocouple data and the calculated ones,. The temperature correction method is described in detail in the article [27].
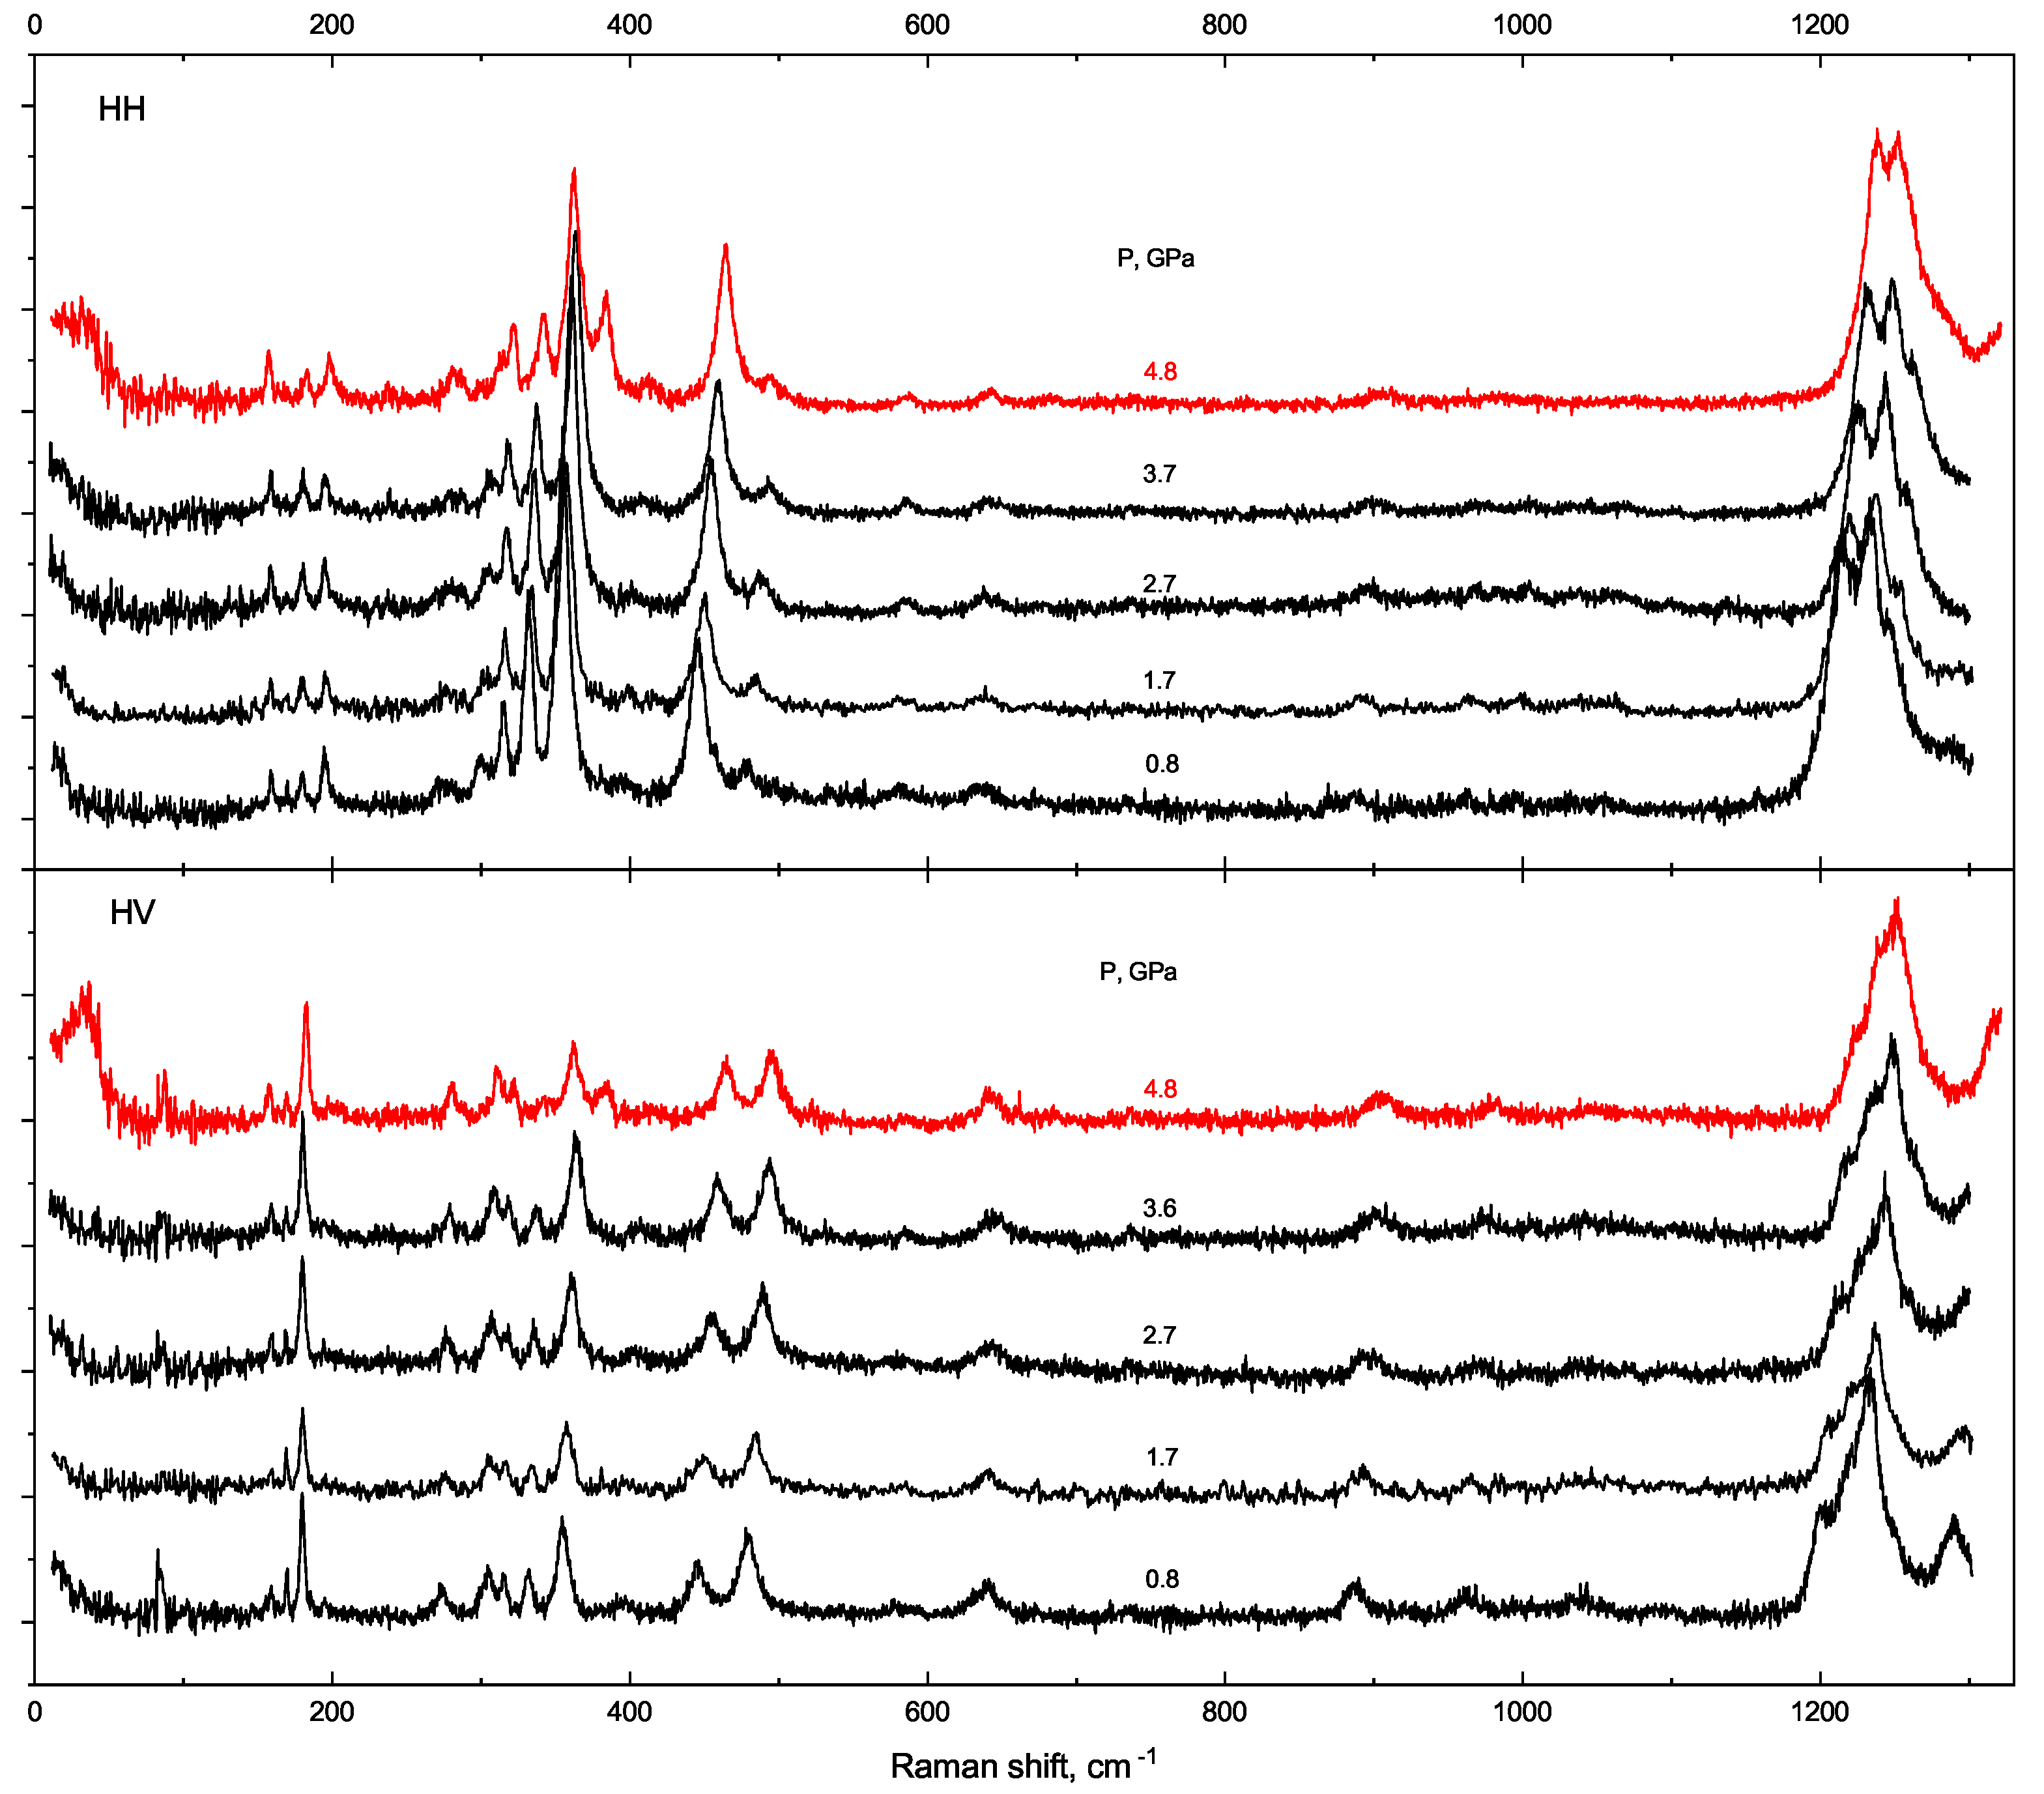
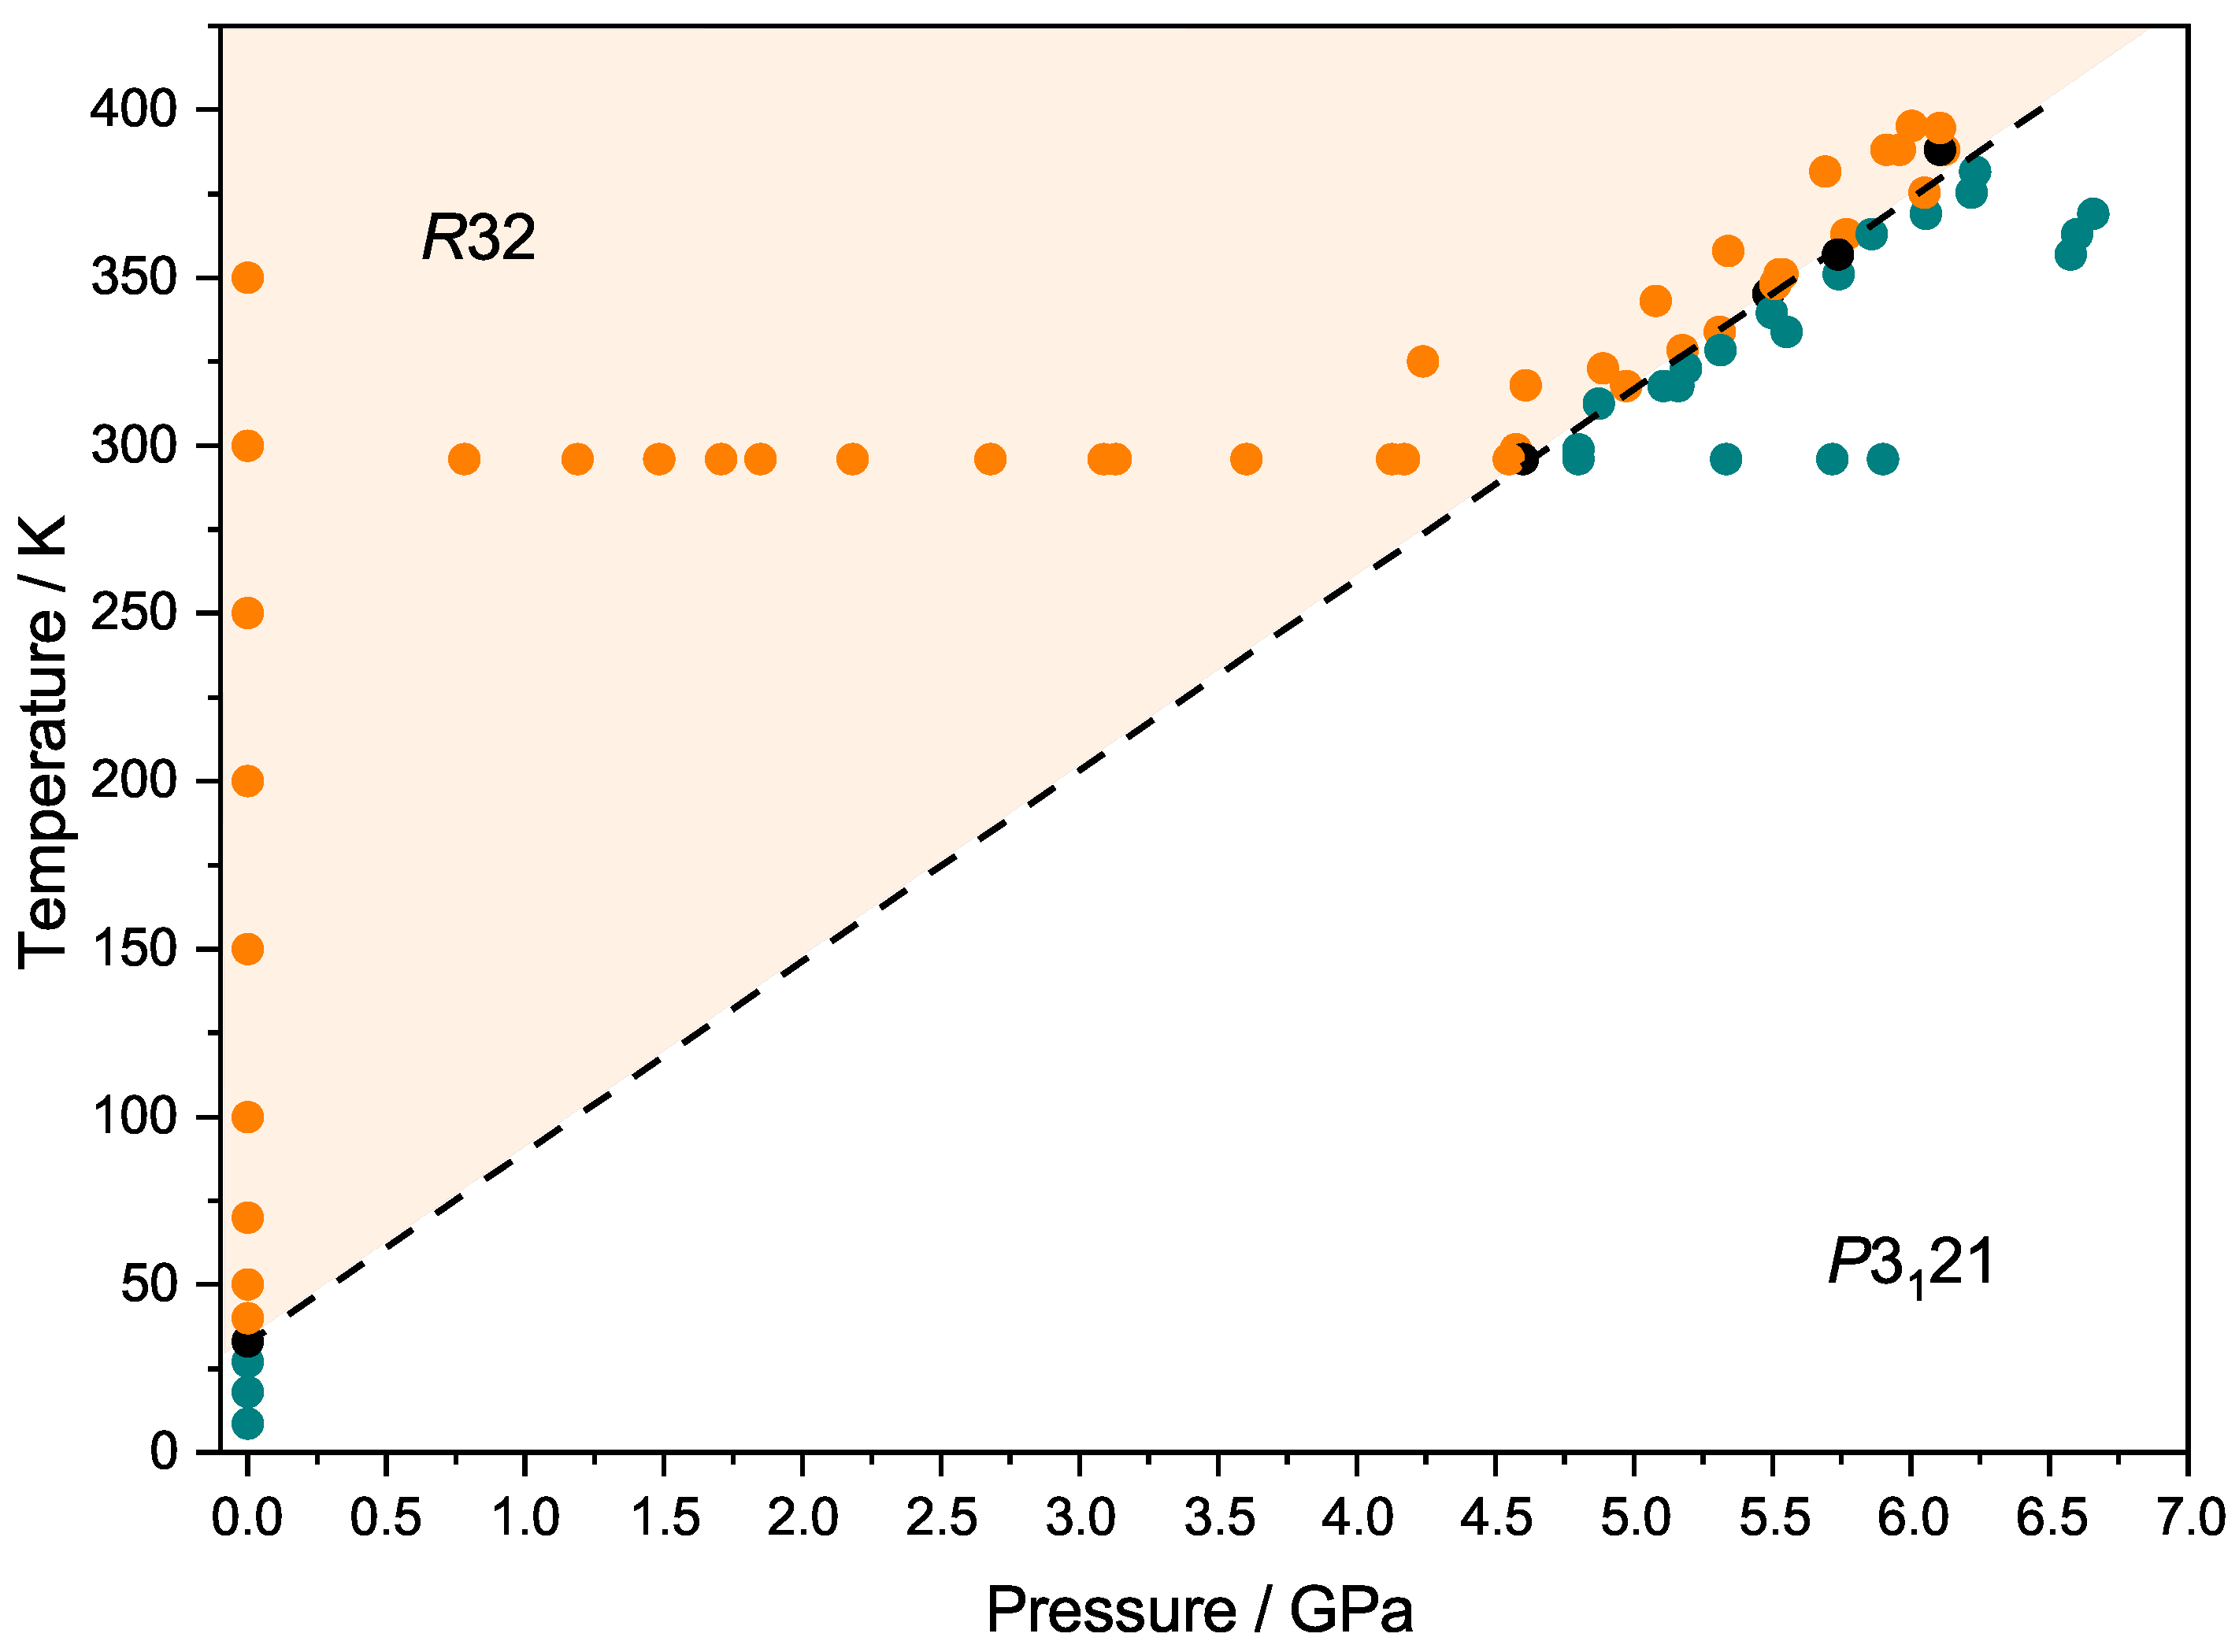
All changes of the Raman spectrum of the TbFe 2.46 Ga 0.54 (BO 3 ) 4 crystal at the temperature of phase transition point are well known and described early. Raman spectra transformation with pressure and constant ambient temperatures are presented in Figure 5. The phase transition point could be determined by analyzing the sequence of Raman spectra acquired during sample temperature changes at quasi constant pressure by varying the temperature of the resistive DAC heater. During the experiment, we set up some pressure value and then incrementally vary solely the temperature; consequently, the pressure in the DAC chamber slightly increases because of liquid media volume expansion with temperature increment. Spectral features indicate what the phase transition occurred: first, feature is a soft-mode condensation accompanying the structural phase transition in low-wavenumber region of Raman spectra sequence. Second, features have new lines appearing in the middle and high wavenumber regions, all of them corresponding to vibration of BO 3 groups. All experimental pressure–temperature points after the analysis mentioned above, according to the assignment to one of phases, are presented in Figure 6. Points belonging to the phase R 32 are located lower on the pressure scale, whereas phase P 3 1 21 spread far to the right on the pressure scale to the high-pressure region. Acquired Raman spectra for any thermodynamical parameters (temperature and pressure) could be assigned to phase R 32 , or to the phase P 3 1 21 , or to the phase boundary. There were no spectra found that do not meet any of the phases mentioned previously and possibly belong to the new high-pressure high-temperature phase.
The p–T phase diagram of the TbFe 3 (BO 3 ) 4 crystal after applying temperature correction is presented in Figure 6. The temperatures of structural transition increase with pressure, and the dependencies T ( p ) of the boundary between the R 32 phase and P 3 1 21 phase are described by linear equation T ( p ) = a + b p , where a = 32.53 ± 4.11 K and b = 57.31 ± 0.833 K·GPa 1 . Therefore, the temperature ranges of the P 3 1 21 phases increase under pressure. No triple points were revealed in the phase diagram. Photos of the sample crystal in the DAC at several p T conditions are presented in Figure A5.

4. Conclusions

The experimental study of the angular dependencies of the mode intensity of the Raman scattering spectra made it possible to determine the types of vibrations and interpret the spectra. The crystal TbFe 2.46 Ga 0.54 (BO 3 ) 4 undergoes a structural phase transition from the R 32 phase to the P 3 1 21 phase at T 1 = 33 K, and the transition is accompanied by soft modes restoration and condensation. The temperature of the structural phase transition is close to the likeliest magnetic ordering temperature. The changes in the spectra are observed in the low-wavenumber region (up to 300 cm 1 ) and the middle part of the spectra (up to 1100 cm 1 ): the modes related to structural ordering arise. We suggest that the proximity of the structural and magnetic transitions in this crystal can cause a strong interaction of the structural and magnetic order parameters. Theoretical angular dependences of the intensities of lines of various symmetries are obtained. The assignment of the experimental lines of the Raman spectrum according to the types of vibrations is made based on an analysis of theoretical dependencies.
The internal magnetic field leads to magnetic ordering of the sublattices of the sample, which respectively affect the behavior of the crystal phonon modes in the low-temperature region. Peculiarities of the Raman spectra manifested in anomalous shifts in the positions of the lines in the spectrum indicating the magnetic ordering in crystal were detected. The temperature of the magnetic ordering was estimated as T n = 50 K.
The Raman spectroscopy study of the TbFe 2.46 Ga 0.54 (BO 3 ) 4 crystal has been performed in the methanol–ethanol alcohol medium at simultaneously high pressure and temperature (up to 6.7 GPa and 390 K). The pressure–temperature phase diagram has been obtained up to pressure–temperature conditions, causing destruction of the sample. The phase boundary equation was obtained, and it remains linear at all investigated pressures and temperature ranges.

Author Contributions

Conceptualization, A.K.; methodology, A.K. and I.G.; software, E.G. and A.K.; formal analysis, S.K. and Y.K.; investigation, A.K. and E.G.; writing—original draft preparation, A.K., S.K., I.G., Y.K., E.G. and H.Z.; writing—review and editing, H.Z. and A.V.; visualization, A.K., E.G. and S.K.; supervision, A.V. All authors have read and agreed to the published version of the manuscript.

Funding

The research of Krylov A. and Gudim I. was funded by RFBR, Krasnoyarsk Territory and Krasnoyarsk Regional Fund of Science, project number 20-42-240009. This work of Vtyurin A., Krylova S. was financially supported by the Russian Foundation for Basic Research and DFG (Deutsche Forschungsgemeinschaft) project number No 21-52-12018.

Institutional Review Board Statement

Not applicable.

Informed Consent Statement

Not applicable.

Data Availability Statement

The data presented in this study are available on request from the corresponding author.

Acknowledgments

The experiments were performed in the Krasnoyarsk Regional Center of Research Equipment of Federal Research Center “Krasnoyarsk Science Center SB RAS”.

Conflicts of Interest

The authors declare no conflict of interest. The funders had no role in the design of the study; in the collection, analyses, or interpretation of data; in the writing of the manuscript, or in the decision to publish the results.

Abbreviations

The following abbreviations are used in this manuscript:
MDPIMultidisciplinary Digital Publishing Institute
FWHMFull width at half maximum
HHParallel polarisation of incident and scattered light
HVCross polarisation of incident and scattered light

Appendix A. Calculated Intensities of Raman Modes
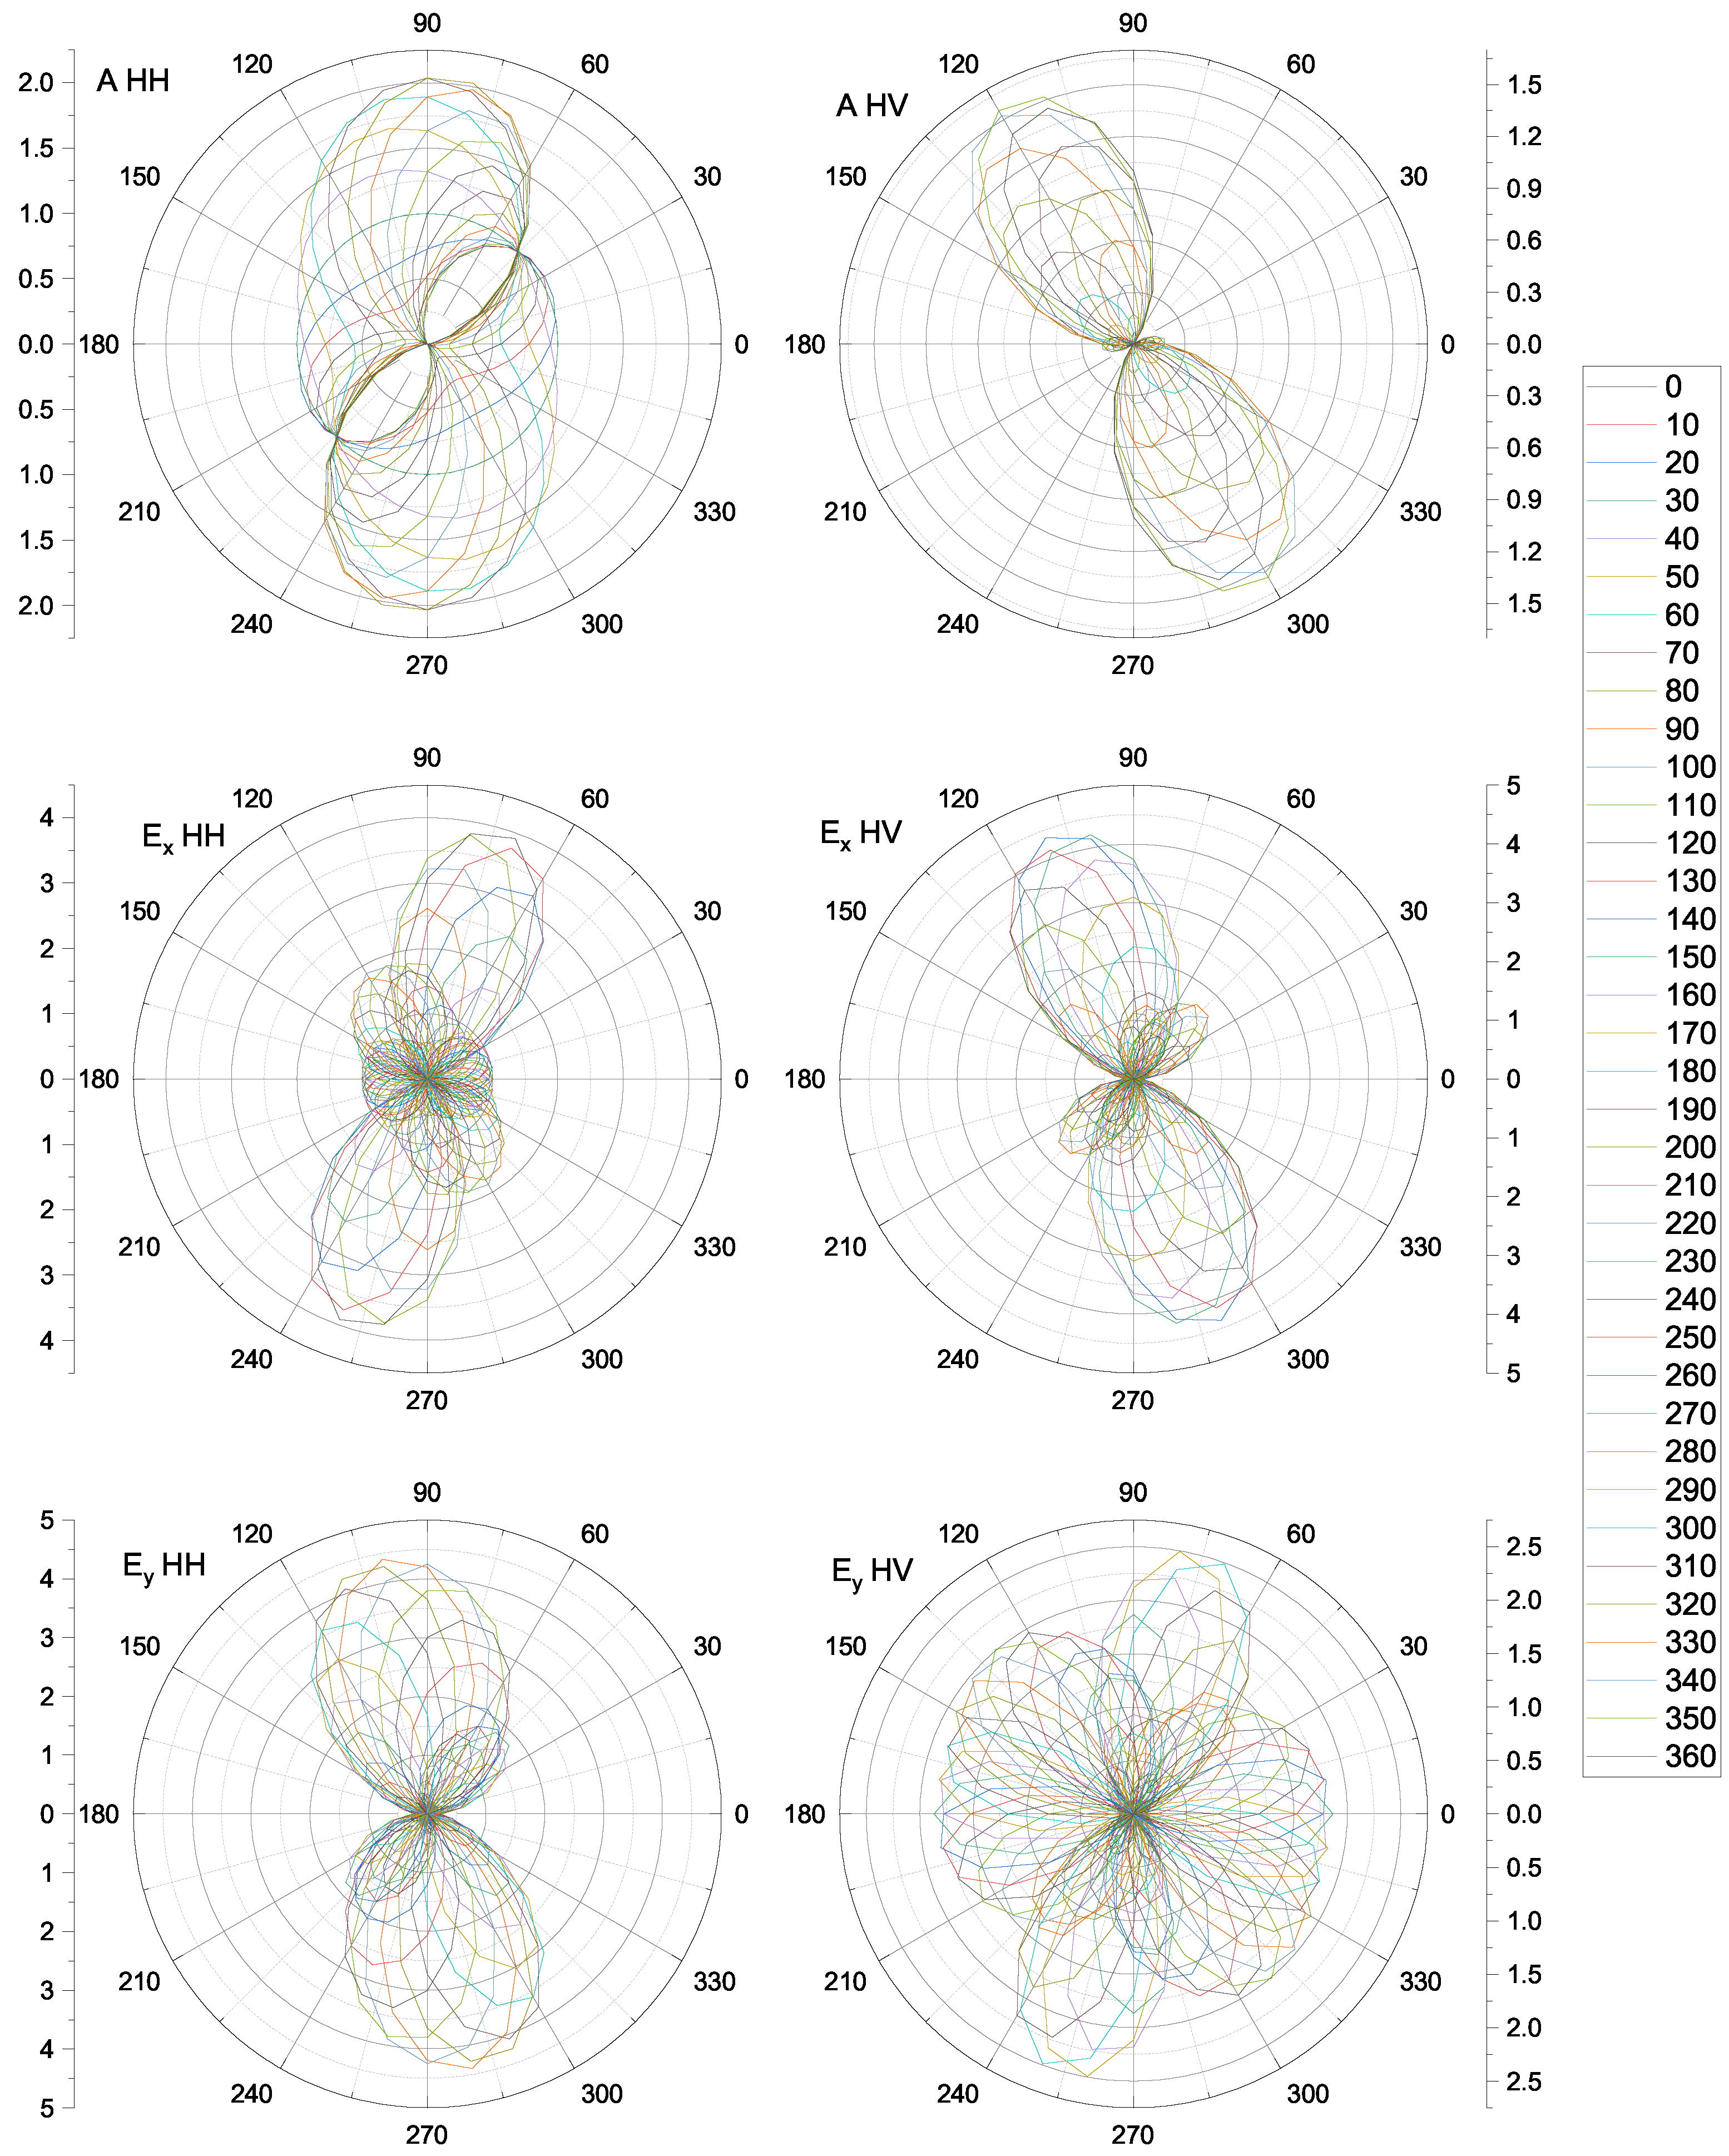
The calculation of Raman intensity has been done by formula (3). The Raman tensor parameters a , b , c , d were taken as equal to 1. The calculated modes are presented in Figure A1Figure A3. Figure A1 was made for an angle of 30 degrees with the z-axis. Figure A2 shows the intensities of the Raman modes for an angle of 60 degrees with the z-axis. In Figure A3, the angle with the 3-axis is 90 degrees.
In order to find the intensity of the Raman mode at any angle, intensity maps were obtained for each of the three Raman modes in two polarizations. The rotation angle intensity map of calculated Raman modes in HH and HV polarisation is presented in Figure A4.
Figure A1. Calculated intensity dependence of Raman modes in the HH and HV polarisation on rotation angle in plane. The angle to z-axis is 30 degrees.
Magnetochemistry 08 00059 g0a1
Figure A2. Calculated intensity dependence of Raman modes in the HH and HV polarisation on rotation angle in the plane. The angle to z-axis (vertical) is 60 degrees.
Magnetochemistry 08 00059 g0a2
Figure A3. Calculated intensity dependence of Raman modes in the HH and HV polarisation on rotation angle in plane. The angle to z-axis is 90 degrees.
Magnetochemistry 08 00059 g0a3
Figure A4. Rotation angle intensity map of calculated Raman modes in HH and HV polarisation.
Magnetochemistry 08 00059 g0a4
Φ x y z = cos ( α ) cos ( γ ) sin ( α ) cos ( β ) sin ( γ ) sin ( α ) ( cos ( γ ) ) cos ( α ) cos ( β ) sin ( γ ) sin ( β ) sin ( γ ) sin ( α ) cos ( β ) cos ( γ ) + cos ( α ) sin ( γ ) cos ( α ) cos ( β ) cos ( γ ) sin ( α ) sin ( γ ) sin ( β ) ( cos ( γ ) ) sin ( α ) sin ( β ) cos ( α ) sin ( β ) cos ( β )
I A 1 [ a ( sin ( α ) cos ( β ) cos ( γ ) + cos ( α ) sin ( γ ) ) 2 + a ( cos ( α ) cos ( β ) cos ( γ ) sin ( α ) sin ( γ ) ) 2 + b sin 2 ( β ) cos 2 ( γ ) ] 2
I A 1 = ( a b ) 2 sin 4 ( β ) sin 2 ( γ ) cos 2 ( γ )
I E x [ c cos 2 ( α ) sin 2 ( γ ) cos 2 ( β ) cos 2 ( γ ) + + sin ( α ) c sin ( α ) cos 2 ( β ) cos 2 ( γ ) c sin ( α ) sin 2 ( γ ) + d sin ( β ) sin ( 2 γ ) + 2 cos ( α ) cos ( β ) cos ( γ ) ( d sin ( β ) cos ( γ ) 2 c sin ( α ) sin ( γ ) ) ] 2
I E x [ c ( sin ( α ) cos ( β ) cos ( γ ) + cos ( α ) sin ( γ ) ) ( cos ( α ) cos ( γ ) sin ( α ) cos ( β ) sin ( γ ) ) + + ( cos ( α ) cos ( β ) sin ( γ ) + sin ( α ) cos ( γ ) ) ( c cos ( α ) cos ( β ) cos ( γ ) c sin ( α ) sin ( γ ) + + d sin ( β ) cos ( γ ) ) + d sin ( β ) sin ( γ ) ( cos ( α ) cos ( β ) cos ( γ ) sin ( α ) sin ( γ ) ) ] 2
I E y 4 [ sin ( α ) cos ( β ) cos ( γ ) + cos ( α ) sin ( γ ) ) 2 ( c cos ( α ) cos ( β ) cos ( γ ) + + c sin ( α ) sin ( γ ) + d sin ( β ) cos ( γ ) ] 2
I E y = [ c ( cos ( α ) cos ( β ) sin ( γ ) + sin ( α ) cos ( γ ) ) ( sin ( α ) cos ( β ) cos ( γ ) + cos ( α ) sin ( γ ) ) + + ( cos ( α ) cos ( γ ) sin ( α ) cos ( β ) sin ( γ ) ) ( c cos ( α ) cos ( β ) cos ( γ ) + c sin ( α ) sin ( γ ) + + d sin ( β ) cos ( γ ) ) d sin ( β ) sin ( γ ) ( sin ( α ) cos ( β ) cos ( γ ) + cos ( α ) sin ( γ ) ) ] 2

Appendix B. Photos of the TbFe2.46Ga0.54(BO3)4 Crystal in the DAC
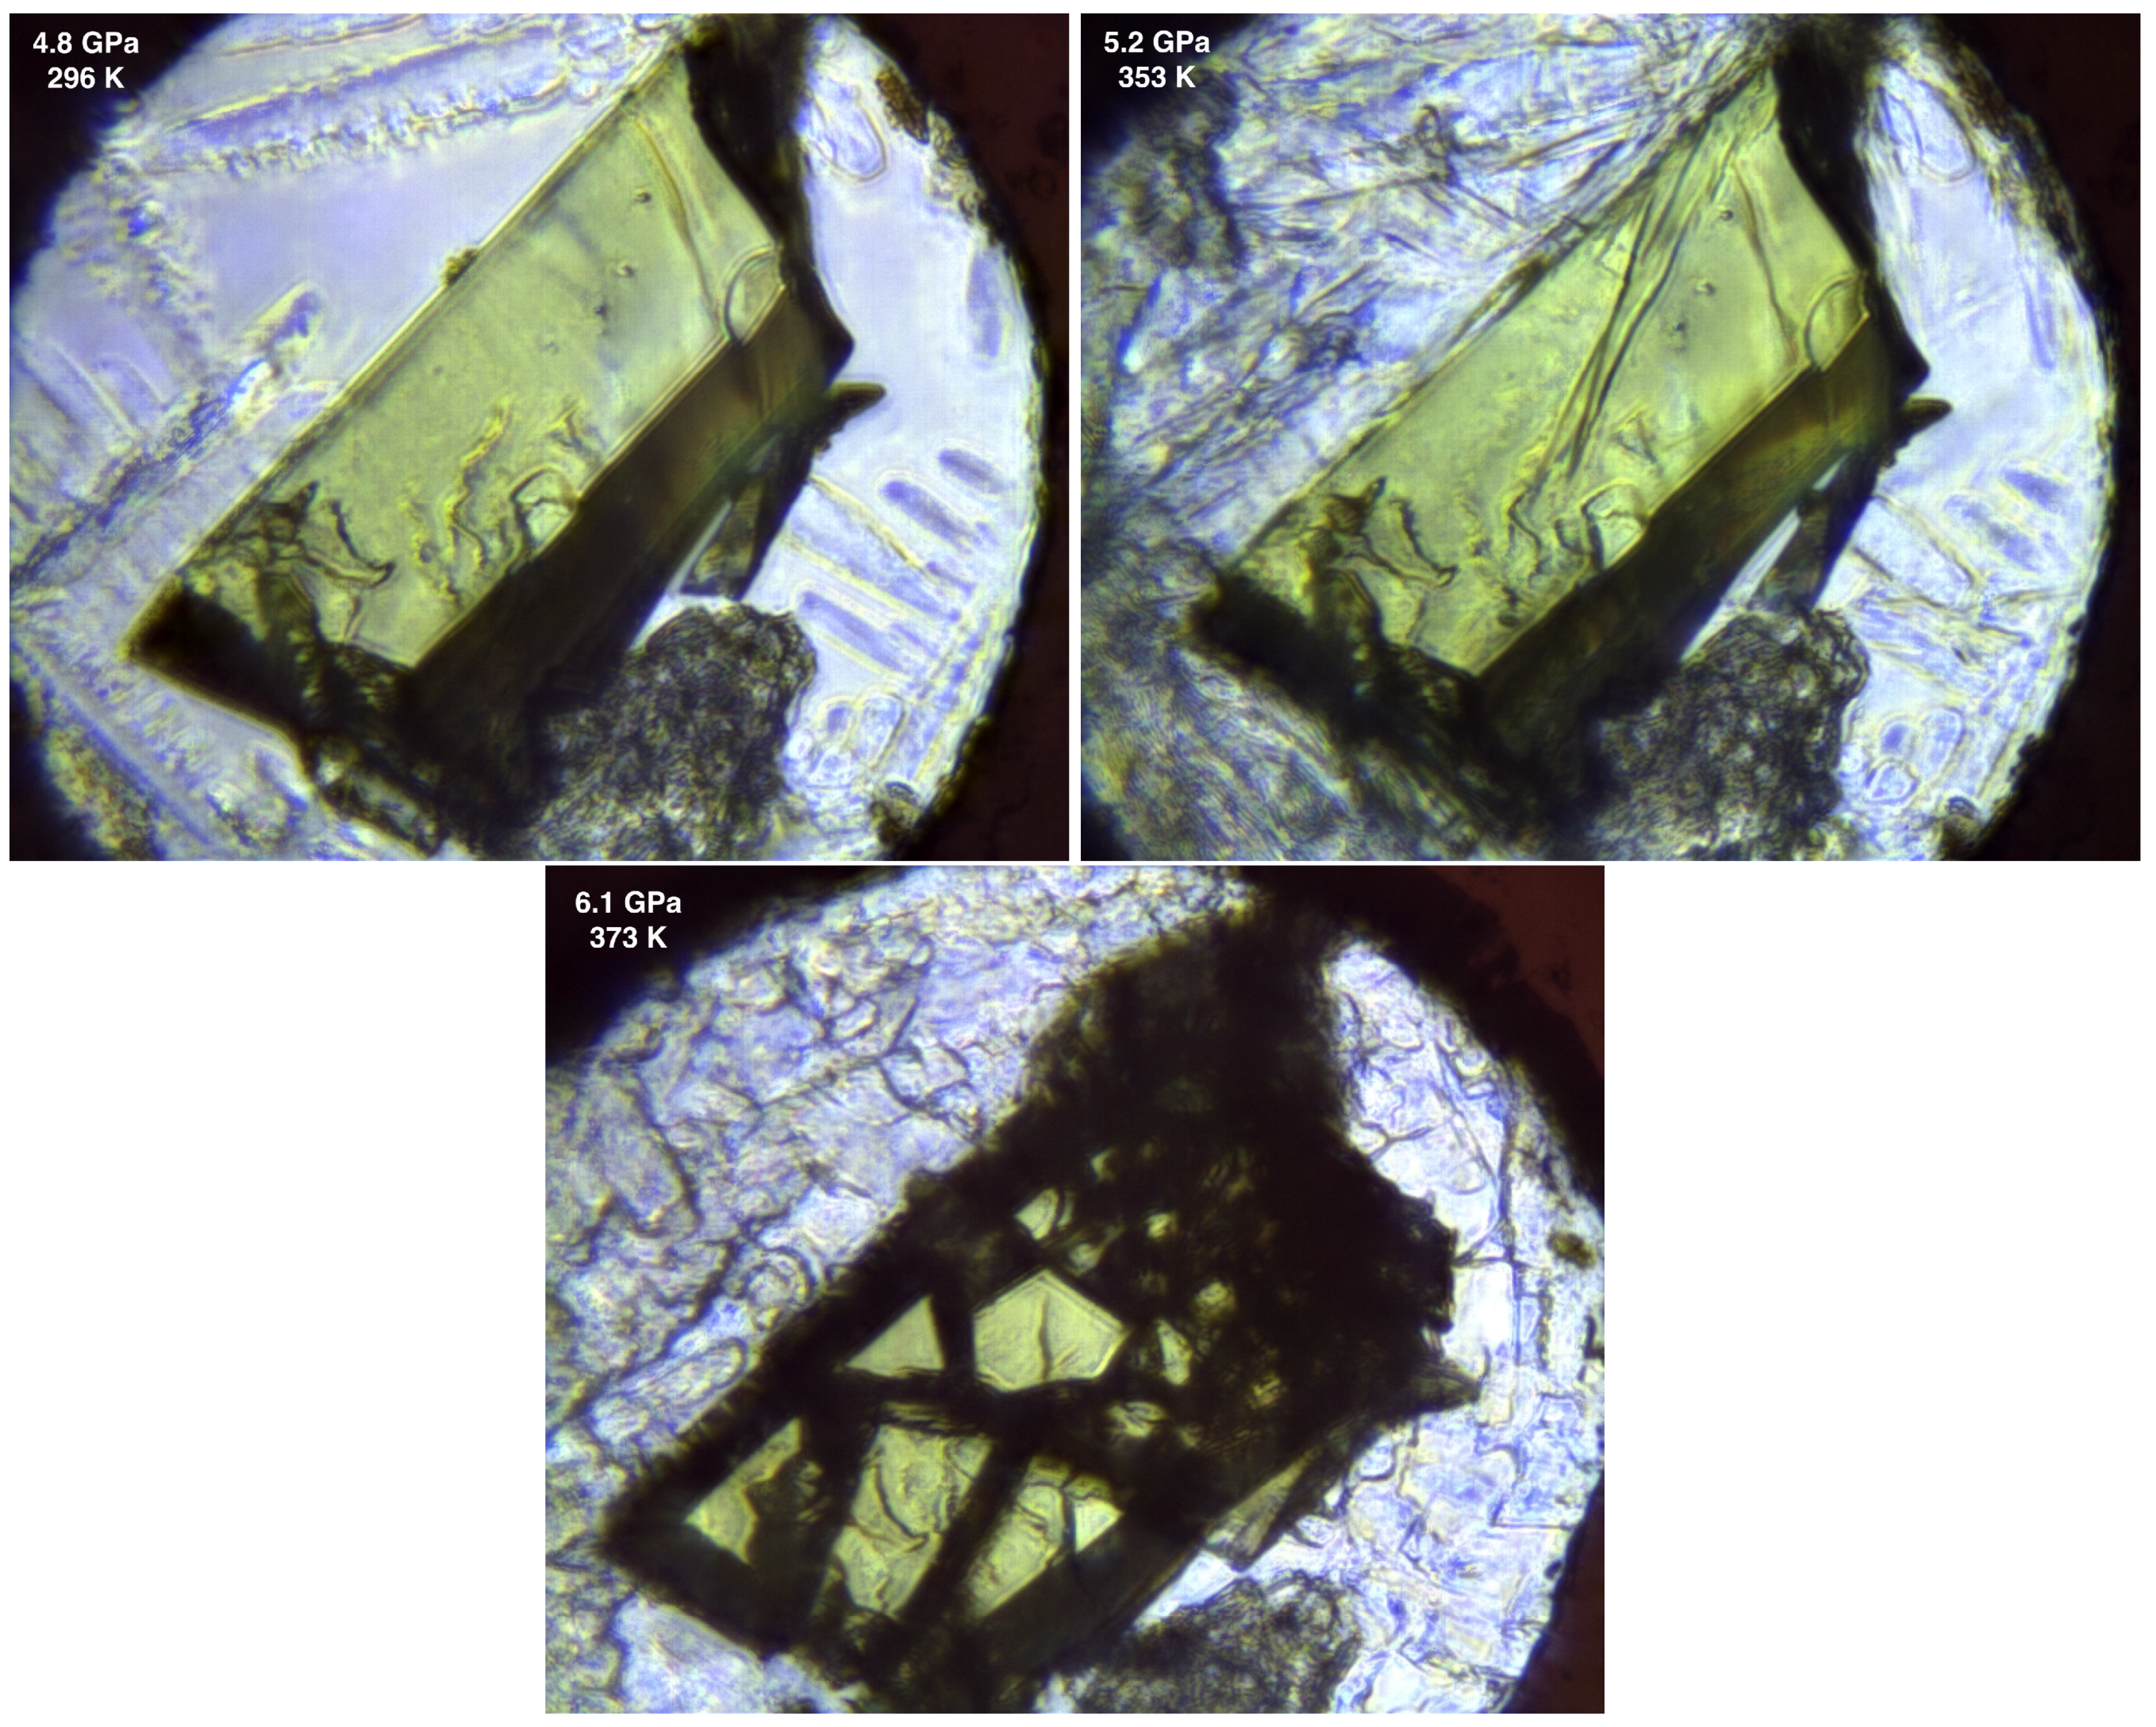
Figure A5. Sample and high-pressure sensor in the high-pressure diamond anvil cell (DAC) at different pressure–temperature conditions; 4:1 methanol–ethanol alcohol mixture as a pressure transmitting media.
Magnetochemistry 08 00059 g0a5

References

  1. Vopson, M.M. Fundamentals of Multiferroic Materials and Their Possible Applications. Crit. Rev. Solid State Mater. Sci. 2015, 40, 223–250. [Google Scholar] [CrossRef] [Green Version]
  2. Fiebig, M. Revival of the magnetoelectric effect. J. Phys. D Appl. Phys. 2005, 38, R123–R152. [Google Scholar] [CrossRef]
  3. Eerenstein, W.; Mathur, N.D.; Scott, J.F. Multiferroic and magnetoelectric materials. Nature 2006, 442, 759–765. [Google Scholar] [CrossRef] [PubMed]
  4. Hinatsu, Y.; Doi, Y.; Ito, K.; Wakeshima, M.; Alemi, A. Magnetic and calorimetric studies on rare-earth iron borates LnFe3(BO3)4 (Ln = Y, La–Nd, Sm–Ho). J. Solid State Chem. 2003, 172, 438–445. [Google Scholar] [CrossRef]
  5. Krylov, A.S.; Sofronova, S.N.; Gudim, I.A.; Vtyurin, A.N. Magnetoelastic interactions in Raman spectra of Ho1−xNdxFe3(BO3)4 crystals. Solid State Commun. 2013, 174, 26–29. [Google Scholar] [CrossRef]
  6. Krylov, A.S.; Sofronova, S.N.; Gudim, I.A.; Krylova, S.N.; Kumar, R.; Vtyurin, A.N. Manifestation of magnetoelastic interactions in Raman spectra of HoxNd1−xFe3(BO3)4 crystals. J. Adv. Dielectr. 2018, 8, 1850011. [Google Scholar] [CrossRef] [Green Version]
  7. Leonyuk, N.I.; Leonyuk, L.I. Growth and characterization of RM3(BO3)4 crystals. Prog. Cryst. Growth. Charact. 1995, 31, 179–278. [Google Scholar] [CrossRef]
  8. Moshkina, E.; Krylov, A.; Sofronova, S.; Gudim, I.; Temerov, V. Crystal Growth and Raman Spectroscopy Study of Sm1−xLaxFe3(BO3)4 Ferroborates. Cryst. Growth Des. 2016, 16, 6915–6921. [Google Scholar] [CrossRef]
  9. Moshkina, E.; Krylova, S.; Gudim, I.; Molokeev, M.; Temerov, V.; Pavlovskiy, M.S.; Vtyurin, A.; Krylov, A. Gallium Composition-Dependent Structural Phase Transitions in HoFe3−xGax(BO3)4 Solid Solutions: Crystal Growth, Structure, and Raman Spectroscopy Study. Cryst. Growth Des. 2020, 20, 1058–1069. [Google Scholar] [CrossRef]
  10. Fausti, D.; Nugroho, A.A.; van Loosdrecht, P.H.; Klimin, S.A.; Popova, M.N.; Bezmaternykh, L.N. Raman scattering from phonons and magnons in RFe3(BO3)4. Phys. Rev. B 2006, 74, 024403. [Google Scholar] [CrossRef] [Green Version]
  11. Ritter, C.; Balaev, A.; Vorotynov, A.; Petrakovskii, G.; Velikanov, D.; Temerov, V.; Gudim, I. Magnetic structure, magnetic interactions and metamagnetism in terbium iron borate TbFe3(BO3)4: A neutron diffraction and magnetization study. J. Phys. Condens. Matter 2007, 19, 196227. [Google Scholar] [CrossRef]
  12. Popova, E.A.; Volkov, D.V.; Vasiliev, A.N.; Demidov, A.A.; Kolmakova, N.P.; Gudim, I.A.; Bezmaternykh, L.N.; Tristan, N.; Skourski, Y.; Büchner, B.; et al. Magnetization and specific heat of TbFe3(BO3)4: Experiment and crystal-field calculations. Phys. Rev. B 2007, 75, 224413. [Google Scholar] [CrossRef] [Green Version]
  13. Pavlovskiy, M.S.; Shaykhutdinov, K.A.; Wu, L.S.; Ehlers, G.; Temerov, V.L.; Gudim, I.A.; Shinkorenko, A.S.; Podlesnyak, A. Observation of soft phonon mode in TbFe3(BO3)4 by inelastic neutron scattering. Phys. Rev. B 2018, 97, 054313. [Google Scholar] [CrossRef] [Green Version]
  14. Volkov, D.V.; Popova, E.A.; Kolmakov, N.P.; Demidov, A.A.; Tristan, N.; Skourski, Y.; Buechner, B.; Gudim, I.A.; Bezmaternykh, L.N. Magnetic properties of TbFe3(BO3)4). JMMM 2007, 316, e717–e720. [Google Scholar] [CrossRef]
  15. Stanislavchuk, T.N.; Chukalina, E.P.; Bezmaternykh, L.N. Study of magnetic phase transitions and magnetic structures in a number of rare-earth ferroborates using an erbium spectroscopic probe. J. Opt. Technol. 2007, 74, 139–143. [Google Scholar] [CrossRef]
  16. Gnatchenko, S.L.; Kachur, I.S.; Piryatinskaya, V.G.; Bedarev, V.A.; Pashchenko, M.I. Spectroscopic and magnetooptical investigations of spin-reorientation phase transition in TbFe3(BO3)4. Low Temp. Phys. 2011, 37, 693–698. [Google Scholar] [CrossRef]
  17. Szaller, D.; Kocsis, V.; Bordács, S.; Fehér, T.; Rõõm, T.; Nagel, U.; Engelkamp, H.; Ohgushi, K.; Kézsmárki, I. Magnetic resonances of multiferroic TbFe3(BO3)4. Phys. Rev. B 2017, 95, 024427. [Google Scholar] [CrossRef] [Green Version]
  18. Krylova, S.; Gudim, I.; Aleksandrovsky, A.; Vtyurin, A.; Krylov, A. Electronic band structures of NdFe3(BO3)4 and NdGa3(BO3)4 crystals: Ab initio calculations. Ferroelectrics 2021, 575, 11–17. [Google Scholar] [CrossRef]
  19. Krylova, S.N.; Aleksandrovsky, A.S.; Roginskii, E.M.; Krylov, A.A.; Gudim, I.A.; Vtyurin, A.N. Optical properties of the HoGa3(BO3)4 crystal: Experiment and ab initio calculation. Ferroelectrics 2020, 559, 135–140. [Google Scholar] [CrossRef]
  20. Klimin, S.A.; Fausti, D.; Meetsma, A.; Bezmaternykh, L.N.; Van Loosdrecht, P.H.M.; Palstra, T.T.M. Evidence for differentiation in the iron-helicoidal chain in GdFe3(BO3)4. Acta Cryst. B 2005, 61, 481–485. [Google Scholar] [CrossRef] [Green Version]
  21. Krylov, A.S.; Gudim, I.A.; Krylova, S.N.; Krylov, A.A.; Vtyurin, A.N. Structural phase transition in TbFe2.5Ga0.5(BO3)4 single crystal. Ferroelectrics 2020, 559, 128–134. [Google Scholar] [CrossRef]
  22. Moshkina, E.; Gudim, I.; Temerov, V.; Krylov, A. Temperature-dependent absorption lines observation in Raman spectra of SmFe3(BO3)4 ferroborate. J. Raman Spectrosc. 2018, 49, 1732–1735. [Google Scholar] [CrossRef]
  23. Popova, M.N.; Stanislavchuk, T.N.; Malkin, B.Z.; Bezmaternykh, L.N. Phase transitions and crystal-field and exchange interactions in TbFe3(BO3)4 as seen via optical spectroscopy. J. Phys. Condens. Matter 2012, 24, 196002. [Google Scholar] [CrossRef]
  24. Peschanskii, A.V.; Yeremenko, A.V.; Fomin, V.I.; Bezmaternykh, L.N.; Gudim, I.A. Raman scattering under structural and magnetic phase transitions in terbium ferroborate. Low Temp. Phys. 2014, 40, 171–178. [Google Scholar] [CrossRef]
  25. Adem, U.; Wang, L.; Fausti, D.; Schottenhamel, W.; van Loosdrecht, P.H.M.; Vasiliev, A.; Bezmaternykh, L.N.; Büchner, B.; Hess, C.; Klingeler, R. Magnetodielectric and magnetoelastic coupling in TbFe3(BO3)4. Phys. Rev. B 2010, 82, 064406. [Google Scholar] [CrossRef] [Green Version]
  26. Bedarev, V.; Pashchenko, M.; Merenkov, D.; Savina, Y.; Pashchenko, V.; Gnatchenko, S.; Bezmaternykh, L.; Temerov, V. The Faraday effect in TbFe3(BO3)4 and TbAl3(BO3)4 borates. J. Magnet. Magnet. Mater. 2014, 362, 150–153. [Google Scholar] [CrossRef]
  27. Krylov, A.S.; Gudim, I.A.; Nemtsev, I.; Krylova, S.N.; Shabanov, A.V.; Krylov, A.A. Raman study of HoFe3(BO3)4 at simultaneously high pressure and high temperature: p–T phase diagram. J. Raman Spectrosc. 2017, 48, 1406–1410. [Google Scholar] [CrossRef]
  28. Krylov, A.; Pavlovskiy, M.; Kitaev, Y.; Gudim, I.; Andryshin, N.; Vtyurin, A.; Jiang, Q.; Krylova, S. Phase transitions and p–T phase diagram of the multiferroic TbFe3(BO3)4 crystal. J. Raman Spectrosc. 2022. [Google Scholar] [CrossRef]
  29. Datchi, F.; Dewaele, A.; Loubeyre, P.; Letoullec, R.; Godec, Y.L.; Canny, B. Optical pressure sensors for high-pressure–high-temperature studies in a diamond anvil cell. High Press. Res. 2007, 27, 447–463. [Google Scholar] [CrossRef]
  30. Rashchenko, S.V.; Kurnosov, A.; Dubrovinsky, L.; Litasov, K.D. Revised calibration of the Sm:SrB4O7 pressure sensor using the Sm-doped yttrium-aluminum garnet primary pressure scale. J. Appl. Phys. 2015, 117, 145902. [Google Scholar] [CrossRef]
  31. Orobengoa, D.; Capillas, C.; Aroyo, M.I.; Perez-Mato, J.M. AMPLIMODES: Symmetry-mode analysis on the Bilbao Crystallographic Server. J. Appl. Crystallogr. 2009, 42, 820–833. [Google Scholar] [CrossRef]
  32. Perez-Mato, J.M.; Orobengoa, D.; Aroyo, M.I. Mode crystallography of distorted structures. Acta Crystallogr. Sect. A 2010, 66, 558–590. [Google Scholar] [CrossRef] [Green Version]
  33. Choi, Y.; Kim, K.; Lim, S.Y.; Kim, J.; Park, J.M.; Kim, J.H.; Lee, Z.; Cheong, H. Complete determination of the crystallographic orientation of ReX2 (X = S, Se) by polarized Raman spectroscopy. Nanoscale Horiz. 2020, 5, 308–315. [Google Scholar] [CrossRef] [Green Version]
  34. Peticolas, W.L.; Nafie, L.; Stein, P.; Fanconi, B. Quantum Theory of the Intensities of Molecular Vibrational Spectra. J. Chem. Phys. 1970, 52, 1576–1584. [Google Scholar] [CrossRef]
  35. Chang, Y.; He, S.; Sun, M.; Xiao, A.; Zhao, J.; Ma, L.; Qiu, W. Angle-Resolved Intensity of In-Axis/Off-Axis Polarized Micro-Raman Spectroscopy for Monocrystalline Silicon. J. Spectrosc. 2021, 2860007. [Google Scholar] [CrossRef]
  36. Aroyo, M.I. (Ed.) International Tables for Crystollography. Vol. A. Space Group Symmetry, 6th ed.; Wiley: Hoboken, NJ, USA, 2016. [Google Scholar]
  37. Litvin, D.B. Magnetic space-group types. Acta Crystallogr. Sect. A 2001, 57, 729–730. [Google Scholar] [CrossRef] [Green Version]
  38. Wills, A. Magnetic structures and their determination using group theory. J. Phys. IV France 2001, 11, Pr9-133–Pr9-158. [Google Scholar] [CrossRef]
  39. Litvin, D. Magnetic Group Tables: 1-, 2-, and 3-Dimensional Magnetic Subperiodic Groups and Magnetic Space Groups; International Union of Crystallography: Chester, UK, 2013. [Google Scholar] [CrossRef]
  40. Cracknell, A.P. Space-Group Selection Rules for Magnetic Crystals. Prog. Theoret. Phys. 1967, 38, 1252–1269. [Google Scholar] [CrossRef] [Green Version]
  41. Shubnikov, A.V.; Belov, N. Colored Symmetry, 6th ed.; Pergamon Press: Oxford, UK, 1964. [Google Scholar]
  42. Krylov, A.; Vtyurin, A.; Gudim, I.; Nemtsev, I.; Krylova, S. Phase diagram and soft modes behaviour TbFe3−XGaX(BO3)4 solid solutions with huntite structures. Opt. Spectrosc. 2022, 130, 84–91. [Google Scholar]
  43. Salje, E.K.; Bismayer, U. Hard mode spectroscopy: The concept and applications. Phase Transit. 1997, 63, 1–75. [Google Scholar] [CrossRef]
  44. Bismayer, U. Hard Mode Spectroscopy of Phase Transitions. Rev. Mineral. Geochem. 2000, 39, 265–283. [Google Scholar] [CrossRef]
  45. Bismayer, U. Hard mode Raman spectroscopy and its application to ferroelastic and ferroelectric phase transitions. Phase Transit. 1990, 27, 211–267. [Google Scholar] [CrossRef]
  46. Salje, E.K.H. Hard mode Spectroscopy: Experimental studies of structural phase transitions. Phase Transit. 1992, 37, 83–110. [Google Scholar] [CrossRef]
  47. Piermarini, G.J.; Block, S.; Barnett, J.D.; Forman, R.A. Calibration of the pressure dependence of the R1 ruby fluorescence line to 195 kbar. J. Appl. Phys. 1975, 46, 2774–2780. [Google Scholar] [CrossRef]
  48. Ragan, D.D.; Gustavsen, R.; Schiferl, D. Calibration of the ruby R1 and R2 fluorescence shifts as a function of temperature from 0 to 600 K. J. Appl. Phys. 1992, 72, 5539–5544. [Google Scholar] [CrossRef] [Green Version]
Figure 1. Full Raman spectra transformation with temperature of TbFe 2.46 Ga 0.54 (BO 3 ) 4 . Color code: black— R 32 phase, red— P 3 1 21 phase.
Magnetochemistry 08 00059 g001
Figure 2. Raman spectra transformation with temperature of TbFe 2.46 Ga 0.54 (BO 3 ) 4 in the mid-wavenumber region. Color code: black— R 32 phase, red— P 3 1 21 phase.
Magnetochemistry 08 00059 g002
Figure 3. The relation of the integral intensities of several strongest hard modes.
Magnetochemistry 08 00059 g003
Figure 4. (af) Temperature dependencies of Raman line positions (black color) and halfwidths (red color). The dashed line denotes the temperature of structural phase transition 33 K.
Magnetochemistry 08 00059 g004
Figure 5. Raman spectra transformation with pressure of TbFe 2.46 Ga 0.54 (BO 3 ) 4 at 296 K. Color code: black— R 32 phase, red— P 3 1 21 phase.
Magnetochemistry 08 00059 g005
Figure 6. p–T phase diagram of TbFe 2.46 Ga 0.54 (BO 3 ) 4 crystal. Color code: orange—phase R 32 , dark cyan—phase P 3 1 21 , black—phase boundary.
Magnetochemistry 08 00059 g006
Table 1. Raman tensors for the D 3 (32) point group.
A 1 E(x) E(y)
a00c000−c−d
0a00−cd−c00
00b0d0−d00
Table 2. Dependence of the peak position of the vibrational mode on the angle of rotation. Back scattering geometry at 296 K ( R 32 phase) in TbFe 2.46 Ga 0.54 (BO 3 ) 4 crystal.
Raman Shift, cm 1 HHHVIrred. Repres.
93 Magnetochemistry 08 00059 i001 Magnetochemistry 08 00059 i002E
181 Magnetochemistry 08 00059 i003 Magnetochemistry 08 00059 i004A 1
199 Magnetochemistry 08 00059 i005 Magnetochemistry 08 00059 i006A 1
448 Magnetochemistry 08 00059 i007 Magnetochemistry 08 00059 i008E
482 Magnetochemistry 08 00059 i009 Magnetochemistry 08 00059 i010A 1
736 Magnetochemistry 08 00059 i011 Magnetochemistry 08 00059 i012E
961 Magnetochemistry 08 00059 i013 Magnetochemistry 08 00059 i014E
991 Magnetochemistry 08 00059 i015 Magnetochemistry 08 00059 i016A 1
1237 Magnetochemistry 08 00059 i017 Magnetochemistry 08 00059 i018E
1413 Magnetochemistry 08 00059 i019 Magnetochemistry 08 00059 i020E
Publisher’s Note: MDPI stays neutral with regard to jurisdictional claims in published maps and institutional affiliations.