Article

A Low-Spin CoII/Nitroxide Complex for Distance Measurements at Q-Band Frequencies

by
Angeliki Giannoulis
1,*,
David B. Cordes
2,
Alexandra M. Z. Slawin
2 and
Bela E. Bode
2,3,*
1
Department of Chemical and Biological Physics, Weizmann Institute of Science, Rehovot 76100, Israel
2
EaStCHEM School of Chemistry, University of St Andrews, North Haugh, St Andrews KY16 9ST, UK
3
Biomedical Sciences Research Complex, Centre of Magnetic Resonance, University of St Andrews, North Haugh, St Andrews KY16 9ST, UK
*
Authors to whom correspondence should be addressed.
Magnetochemistry 2022, 8(4), 43; https://doi.org/10.3390/magnetochemistry8040043
Submission received: 26 February 2022 / Revised: 31 March 2022 / Accepted: 5 April 2022 / Published: 11 April 2022
(This article belongs to the Special Issue EPR Spectroscopy in Chemistry and Biology)

Abstract

:
Pulse dipolar electron paramagnetic resonance spectroscopy (PDS) is continuously furthering the understanding of chemical and biological assemblies through distance measurements in the nanometer range. New paramagnets and pulse sequences can provide structural insights not accessible through other techniques. In the pursuit of alternative spin centers for PDS, we synthesized a low-spin CoII complex bearing a nitroxide (NO) moiety, where both the CoII and NO have an electron spin S of 1/2. We measured CoII-NO distances with the well-established double electron–electron resonance (DEER aka PELDOR) experiment, as well as with the five- and six-pulse relaxation-induced dipolar modulation enhancement (RIDME) spectroscopies at Q-band frequencies (34 GHz). We first identified challenges related to the stability of the complex in solution via DEER and X-ray crystallography and showed that even in cases where complex disproportionation is unavoidable, CoII-NO PDS measurements are feasible and give good signal-to-noise (SNR) ratios. Specifically, DEER and five-pulse RIDME exhibited an SNR of ~100, and while the six-pulse RIDME exhibited compromised SNR, it helped us minimize unwanted signals from the RIDME traces. Last, we demonstrated RIDME at a 10 μM sample concentration. Our results demonstrate paramagnetic CoII to be a feasible spin center in medium magnetic fields with opportunities for PDS studies involving CoII ions.

1. Introduction

Pulse dipolar electron paramagnetic resonance (EPR) spectroscopy (PDS) allows measuring the distance between two or more electron spins in the nanometer range by exploiting their magnetic dipole moment [1,2,3]. Typically, PDS measures the dipolar coupling, ω A Β , between two spins, which has an inverse cube root dependence on their distance ( r A B ), according to equation [4]:
ω A Β = μ 0 β e 2 g A g B 4 π ħ r A B 3 ( 1 3 cos 2 ϑ )
where μ 0 is the permeability of the vacuum, β e is the Bohr magneton, g A , g B are the g factors of the two electron spins, ħ is the reduced Planck constant, and ϑ is the angle between the vector connecting the two spin centers and the external magnetic field. In this work, we focus on two PDS techniques, the double electron–electron resonance [2,5,6,7] (DEER/PELDOR) and relaxation-induced dipolar modulation enhancement [8] (RIDME) experiments (pulse sequences in Figure 1), to measure the distance between two different spin centers: that of paramagnetic CoII and a nitroxide (NO) radical placed on a chemical model system.
In DEER and RIDME, the dipolar coupling is measured with pulses applied at two or one microwave (mw) frequencies, respectively. In DEER, one set of spins is monitored on the observe frequency (νobs), while another set of spins is flipped on the pump frequency (νpump) (Figure 1a). If the distance to be measured involves two different types of spin centers, e.g., one paramagnetic metal ion (CuII, GdIII, MnII with electron spin S = 1/2, 7/2, 5/2, respectively) and one organic radical (nitroxide or trityl radical, S = 1/2) the pulses are placed to observe one type of spin, while flipping the other type of spin. In order to obtain high effective sensitivity, one typically pumps the NO or trityl spin that exhibits narrow EPR spectrum, while observing the paramagnetic metal ion (see a comparison of their EPR linewidths in Table S1, Supplementary Materials). In RIDME, one type of spin is observed in the frequency νobs, while the other type of spin is let to flip spontaneously by its longitudinal relaxation during the time interval Tmix [9] (Figure 1b,c). Therefore, RIDME performs well in systems involving a slow and a fast relaxing spin, such as a fast relaxing paramagnetic metal ion and a slower relaxing organic radical [10,11,12,13,14,15,16,17,18], but it has also been expanded to two paramagnetic metal centers [16,19,20,21,22,23,24,25,26,27], as well as between organic radicals [28,29,30]. The increased sensitivity of RIDME in such mixed systems stems from the inherent increased modulation depth (Δ) of the experiment as a result of a large amount of spontaneously flipped spins, in contrast to the limited excitation bandwidth by mw pulses in DEER [31]. Additionally, during RIDME, one can exploit working under close to critically coupling conditions as only one frequency needs to be accommodated in the resonator profile, in contrast to DEER, where an over-coupled resonator is required in order to accommodate two frequencies. Another advantage of RIDME is that it is free of orientation selection (OS) effects with respect to the flipped spin, assuming a homogeneous longitudinal relaxation of the paramagnetic metal center along the EPR spectrum, simply because spins from the entire EPR spectrum are flipped during Tmix. It should be also noted that in contrast to high-spin GdIII [23,25,26] and MnII [15,24] ions, where RIDME affords overtone frequencies due to the excitation of EPR transitions between multiple spin manifolds, this is not the case for 1/2 spin metal ions, such as of CoII studied here. Low-spin CoII, like CuII, exhibits only one spin transition (−1/2 +1/2); therefore, the analysis and interpretation of data is straightforward and similar to DEER. The major limitation of RIDME is the steep background signal decay that is particularly relevant for protonated samples [11,32] and, to a lesser extent, some systematic signals (artifacts) [16,30] appearing in the RIDME traces. While the first are related to sample concentration and the matrix used, the latter are related primarily to experimental parameters. Recently, Abdullin et al. introduced the six-pulse RIDME sequence (Figure 1c), which was shown to significantly minimize these unwanted signals [30].
DEER has been extensively used in structural biology in order to measure distances between two sites in a protein, a nucleic acid, or complexes thereof. In the majority of cases, the sites are site-specifically labeled with a paramagnetic center (most typically NO, GdIII or CuII labels), or there are cases where naturally occurring paramagnets have been explored (e.g., in metalloproteins) [33,34,35,36,37]. RIDME is far less explored for structural studies of biomolecules; however, methodological reports [11,12,15,16,18,20,21,23,24,25,26,27,29,30,32,38,39,40,41,42,43] involving various spin pairs, together with a few applications [14,19,22,44,45] on proteins, have been published.
In the present work, we report on the use of DEER and RIDME with a pair of CoII/NO spins engineered into a chemical model system. Low-spin CoII is a less explored metal ion than CuII, GdIII or MnII, even though its favorable spectroscopic properties (S = 1/2 and not very fast relaxation [46]) make it suitable for PDS. Surprisingly, even though there have been developed ligands that bind to CuII [47,48,49], GdIII [37] or MnII [50,51] ions serving as spin labels, no such ligand has been developed for CoII for PDS. One challenge of CoII is its broad EPR spectrum of ~75 mT at the X-band, though it is comparable to that of CuII (see Table S1, Supplementary Materials), whereas the synthesis of ligands that afford low-spin CoII is probably the most challenging part. Additionally, CoII with terpyridine ligands is known to behave as a spin crossover system above temperatures of 30 K [52,53]. So far, PDS studies on CoII are sparse and involve methodological developments. The first report on CoII demonstrated, for the first time, the use of broadband (wideband uniform rate smooth truncation, WURST) pulses to improve the signal-to-noise ratio (SNR) of CoII-NO DEER at the X-band by increasing the number of pumped CoII spins [54]. In another report, three spin effects were deliberately manifested in a NO-spacer-CoII-spacer-NO chemical model using WURST pulses that excited the entire NO EPR spectrum at X-band DEER measurements [46]. Additionally, OS effects in a CoII/NO system were studied with W-band DEER and RIDME, where the g-anisotropy of NO was resolved and only the low g component of CoII could be observed due to bandwidth limitations [10]. On the other hand, CoII has been taken up by paramagnetic nuclear magnetic resonance (NMR) studies involving high-spin CoII (S = 3/2) bound to a protein via a thio-reactive EDTA ligand [55,56], via the doubleHis motif [57], via a ligand that binds with click chemistry to RNA [58] or by replacing their diamagnetic counterparts in metal-dependent proteins [59,60].
Here, we expand the methodology to CoII-NO PDS at Q-band frequencies on a well-characterized CoII/NO chemical model. Specifically, we employ and discuss the performance of the standard five-pulse RIDME, as well as its six-pulse variant, and of DEER. We show that five-pulse RIDME and DEER have comparable SNR, whereas the SNR of six-pulse RIDME is somewhat compromised. We further show that the artifacts of the five-pulse RIDME are minimized in the six-pulse experiment also for the CoII/NO pair. Last, we show CoII-NO RIDME measurements to be feasible on a 10 μM sample.

2. Results and Discussion

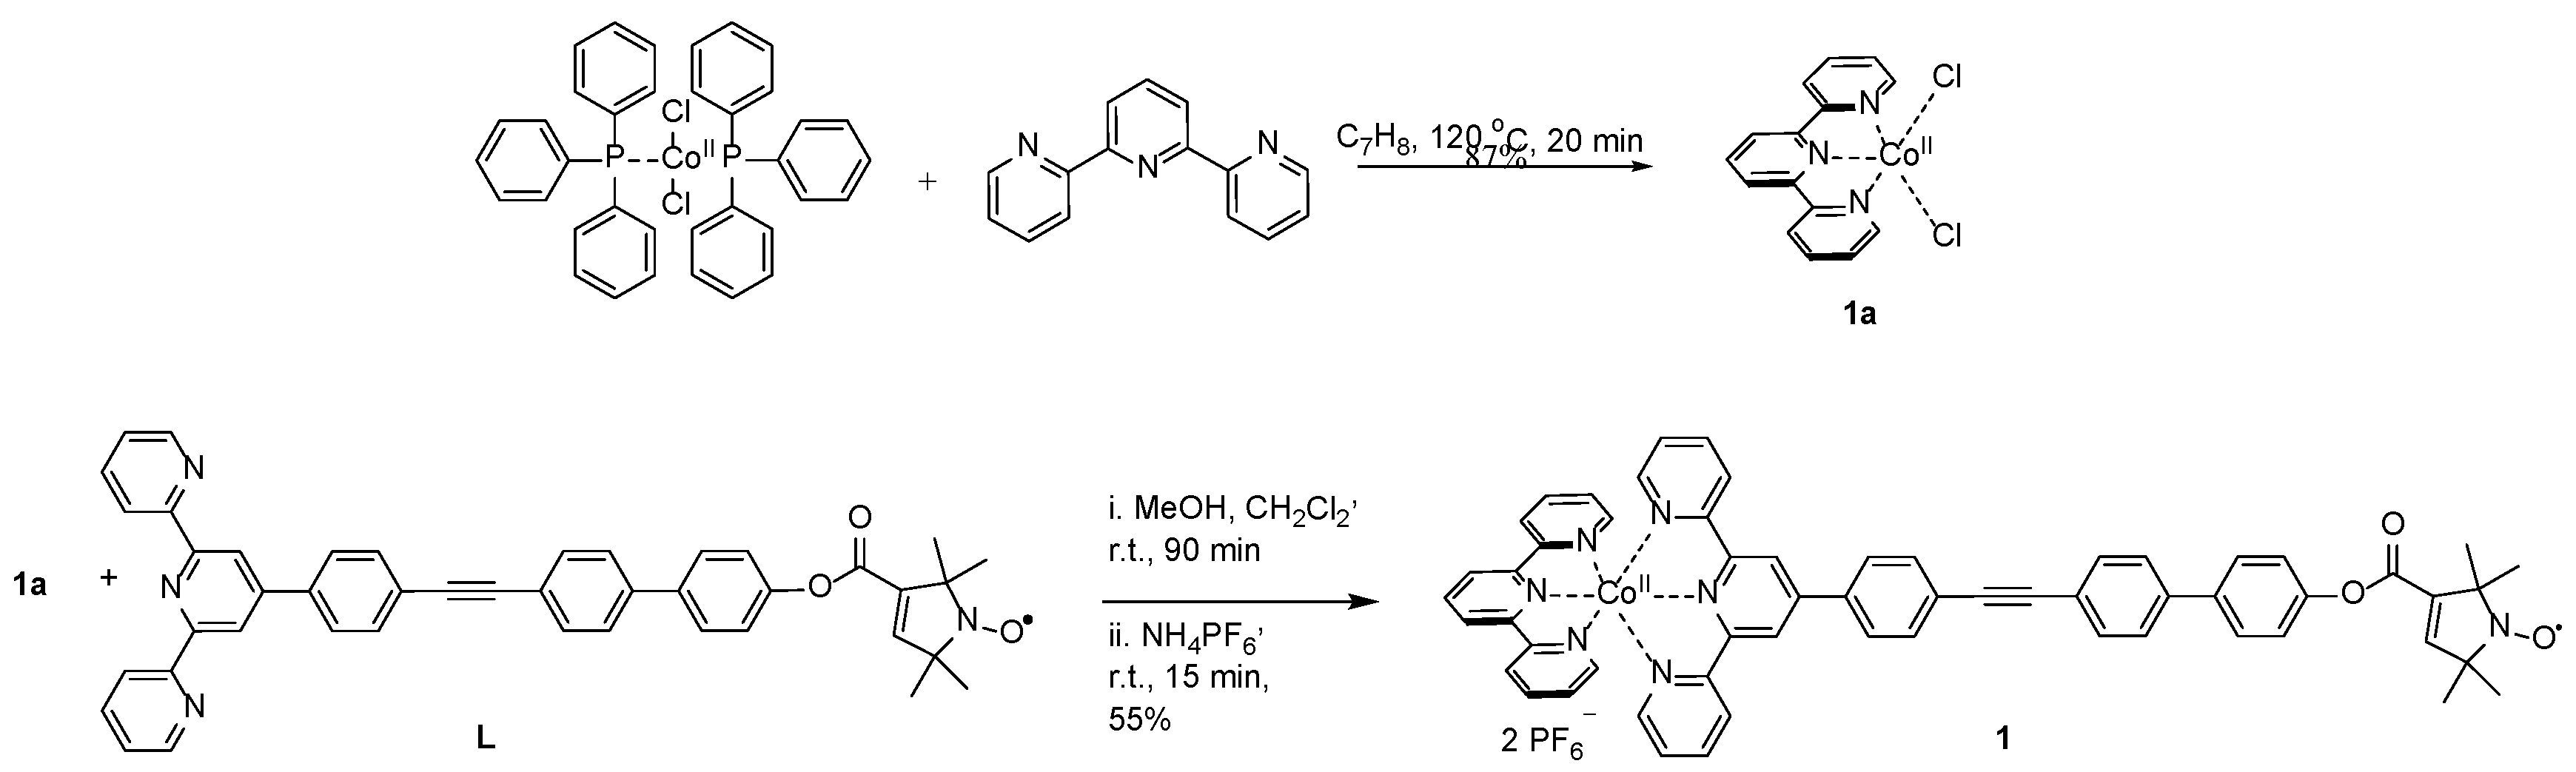
2.1. Synthesis of the Chemical Model

The aim was to synthesize a chemical model system that bears a low-spin CoII and a NO with the distance between NO and CoII in the accessible distance range for PDS, minimizing through bond communication between the two spins, i.e., the spacer between the NO and CoII should not feature extended conjugation. Low-spin CoII is afforded by an octahedral geometry around the metal center with strong-field ligands, such as terpyridine. Thus, we coordinated the metal with two terpyridine-based ligands, one of which is functionalized with an NO at its end. To do so, we first synthesized a precursor, (terpyridine)CoIICl2, from terpyridine and dichlorobis(triphenylphosphine)CoII (1a, see reaction in Scheme 1 and Figure S1, Supplementary Materials), in which CoII has a mononuclear pseudo-square pyramidal geometry found previously from X-ray structure determination [61]. Then, 1a was reacted with a previously characterized NO-labeled terpyridine ligand L [62] to form the target complex 1, which was isolated as a solid after precipitation with PF6 counter ions and characterized by mass spectrometry and elemental analysis (see Section 4 and Figure S2, Supplementary Materials). The ester bond in L is expected to disrupt the conjugation between NO and CoII spins, as it was shown previously that the introduction of an ester bond afforded negligible conjugation between NO and CuII spins [63]. Additionally, in L2CoII complex, DEER [46] and RIDME [10] did not show through-bond communication between the spins.

2.2. PDS on 1

Initial attempts to perform PDS distance measurements on 1 in various organic solvents or their mixtures failed due to poor solubility of the complex in organic media as well as ‘bad glass’ formation upon sample freezing and, subsequently, fast relaxation properties of the paramagnetic species [64]. Generally, we found that dissolving the complex in a small percentage of coordinating solvent and then adding the non-polar organic solvent improved solubility and helped the formation of ‘good glass’ upon sample freezing. The solvents that worked well here were DMF-d7/C7D8 (1/9) for RIDME and DMF/2-MeTHF (1/9) for DEER samples. Deuteration in RIDME is necessary, as protons can significantly affect the background decay of the experiment, complicating data analysis [32]. Additionally, we found that weakly coordinating anions further improve the relaxation properties of the CoII. Therefore, we proceeded to in situ exchanging the PF6 ions with the more weakly coordinating anion BPh4 [65] by adding excess of NaBPh4 salt before addition of the solvents (see Section 4).
We performed CoII-NO DEER at 15 K at Q-band frequencies in 1 mM solution of 1 (Figure 2). Slowing down the CoII relaxation is crucial, as a fast transverse relaxation of CoII would disfavor DEER when observing CoII (see Figures S4–S6, Supplementary Materials for X- and Q-band relaxation data on 1). We initially performed the DEER by pumping NO and observing CoII with the setup shown in Figure 2a, where the blue and red lines indicate the observe and pump positions, respectively, and Δν is the pump–probe frequency offset of 150 MHz (5.3 mT). The experiment exhibited a steep background decay due to pumping NO spins, which are in high concentrations, affording a modulation depth, Δ, of ~26% and a CoII-NO distance of ~2.6 nm when using the DeerAnalysis [66] software. The distance is in agreement with the X-ray structure of L [62] and previous distance measurements on similar compounds [10,11,46], and Δ is close to the value on bis-nitroxide-labeled protein samples [67] under our spectrometer and experimental conditions, indicating that the majority of chemical species in the solution are complex 1. The sensitivity (often synonymous with the SNR) was calculated (see Section 4 and Supplementary Materials, Table S4) to be 103. Throughout the text we refer to the SNR as the modulation-to-noise ratio, whereas the sensitivity corrected for different numbers of accumulated echoes and repetition rates is referred to as St (sensitivity per unit time, given in the Supplementary Materials, Table S4). We additionally performed a DEER measurement by pumping CoII and observing NO spins using the same setup as in Figure 2a, with the pump–probe positions exchanged. In this case, the pump pulse excited only a small fraction of the broad CoII EPR spectrum, affording a less pronounced background decay and a Δ of ~0.6%. Using this setup, the SNR was 11, i.e., 10 times lower than when pumping NO, as expected. Nonetheless, the measurement afforded again a ~2.6 nm CoII-NO distance with high reliability. It should be mentioned that while CoII-NO DEER is feasible at the Q-band, the corresponding CuII-NO measurements are challenging due to the large spectral separation of CuII and NO spins of ~20 mT exceeding the bandwidth of most setups [46].
Here, we also tested directly whether the ligands exchange in solution by performing NO-NO DEER (Figure S7, SI). If ligand exchange occurs, the species expected to form in solution are L2CoII, (terpyridine)2CoII and 1 (in 1:1:2 ratio) and we should recover a NO-NO DEER oscillation, originating from L2CoII complexes. The NO-NO DEER was performed by observing and pumping NO with Δν = 80 MHz (2.9 mT) at 20 K under conditions optimized for the NO, i.e., with a repetition time of 20 ms. NO-NO DEER is known to perform optimally at 40–60 K [68,69]; however, here, a lower measurement temperature was necessary due to the paramagnetic relaxation enhancement of the NO spins by CoII. Previously, we found that a temperature of 10–20 K is optimal for measuring NO-NO DEER in the presence of CoII [46], in agreement with the X-band NO relaxation data (Supplementary Materials, Figure S5). The NO-NO DEER trace featured again a steep background decay due to the high concentration of NO spins and a Δ of ~17%. The NO-NO distance was found to be 5.2 nm, which is double the CoII-NO distance originating from L2CoII complexes, suggesting that partial ligand mixing occurred before freezing the sample. Moreover, ligand mixing was also observed on a similar CoII complex that does not bear a NO group using X-ray structure determination (see details in Supplementary Materials). Both NO-NO DEER and the X-ray demonstrate the kinetic lability of terpyridine ligands with CoII ions that might affect the performance of PDS on 1.
We then proceeded to perform CoII-NO RIDME measurements on 1 mM solution of 1 at 15 K. The experiment was performed by observing at the maximum of the NO EPR spectrum (indicated with the green line on Figure 2a) to minimize OS effects and to obtain maximum sensitivity, whereas the CoII spin flip was achieved spontaneously during the Tmix. We performed both the five-pulse and the newly introduced six-pulse sequence. The most commonly used five-pulse RIDME is known to exhibit artifacts that alter the background and might affect the shape of the distance distribution [16,30]. These artifacts were found to appear at times t = τ1 and t = τ2 − τ1 [30], and the six-pulse RIDME was shown to significantly minimize them. On the downside, six-pulse RIDME can feature artifacts at t = τ2 − 2τ1, which, however, can be truncated during data analysis. As we worked at Q-band and the sample was dissolved in a deuterated matrix, each RIDME experiment was recorded as a unique measurement with τ-averaging over one period of the inverse deuterium Larmor frequency proving sufficient to remove unwanted electron spin echo envelope modulation (ESEEM), without the need to perform a reference measurement. The estimation of the Tmix was performed by the inversion recovery profile of CoII spins, as well as from our previous data on a similar CoII complex [10]. The primary RIDME data were analyzed by fitting a fifth-order polynomial background function due to the pronounced background decay of RIDME. Δ was found to be ~36% and ~32% and the SNR to be 114 and 73 for the five- and six-pulse sequences, respectively. The modulation depth was less than the 45% expected for quantitative metal-NO pairs [11,16,44], indicating again partial ligand mixing in agreement with the CoII-NO and NO-NO DEER data. The SNR of the five-pulse RIDME was similar to that of the DEER pumping NO (see Table S4, Supplementary Materials), whereas the six-pulse RIDME measurement exhibited lower SNR. The five-pulse sequence exhibited an artifact at 1.4–1.6 μs, which we assign to the τ2 − τ1 artifact observed by Abdullin et al. [30]. This artifact was significantly smaller in the six-pulse RIDME measurement. The CoII-NO distance distribution was again found to be centered at ~2.6 nm, in agreement with the DEER experiments and similar metal complexes [10,15,39,46].
Lastly, we proceeded to test the performance of CoII-NO RIDME on a sample two orders of magnitude lower in concentration, i.e., on a 10 μM sample of 1 (Figure 3). Again, the five- and six-pulse RIDME sequences were performed on the maximum of the NO spectrum (green line on Figure 2a). As the sample concentration was significantly lower, we found the longitudinal relaxation (T1) and other T1-related relaxation effects to be significantly slower, and we performed RIDME at 30 K, as we also did not see significant modulation at 15 K. In this sample, the RIDME experiment exhibited a reduced Δ of ~18% and ~13%, with SNR values of 29 and 1 for the five- and six-pulse sequences, respectively. The lower Δ of the 10 μM sample might be due to the coordination of DMF-d7 on the CoII ion upon sample dilution or due to a suboptimal Tmix. The SNR of five-pulse RIDME on the 10 μM sample was approximately four times lower than the 1 mM sample. Partially, the lower SNR can be attributed to the lower Δ of the 10 μM sample. The rest of the loss in SNR comes from the lower sample concentration itself. Again, the five-pulse RIDME exhibited an artifact at short times (300 ns), as well as at ~1.1–1.5 μs, which we tentatively assign to those observed by Abdullin et al. [30], as both were reduced in the six-pulse experiment. Overall, we could measure CoII-NO RIDME on a 10 μM sample of 1, the SNR of which was compromised by the sample properties, nonetheless not affecting the reliable determination of the distance distribution, which is in agreement with the PDS data on the higher concentration sample.

3. Conclusions

In this work, we reported the synthesis of a new CoII/nitroxide complex for DEER and RIDME measurements at Q-band frequencies. The tailor-made complex geometry afforded a low-spin CoII with favorable spectroscopic properties for DEER and RIDME. Particularly, CoII-NO RIDME was employed on a 10 μM sample and the application of the six-pulse sequence helped us eliminate unwanted signals from the time traces. The overall SNR of five-pulse RIDME and DEER measurements were similar; however, CoII-NO RIDME did not reach the potential of the CuII-NO pair, where applications down to 500 nM have been reported [22,44]. One limitation of the SNR comes from the sample properties. We have shown using X-ray crystallography on a similar CoII complex, as well as with NO-NO DEER on 1, that a fraction of the complex disproportionates in coordinating solvents. The issue of complex disproportionation becomes resolved in a scenario where water-soluble ligands would be designed that bind CoII tighter than terpyridine. This would, in turn, allow improved RIDME performance. As reports on CoII ions in PDS are sparse, measurements at Q-band frequencies, becoming widely adopted by most EPR laboratories, allow further establishing CoII for PDS. We further revealed some of the challenges that have to be met before this metal ion becomes a promising candidate for applications in biomolecular samples.

4. Methods

4.1. General Synthesis Conditions

All commercially available reagents were used as purchased: dichlorobis(triphenylphosphine)CoII (Sigma Aldrich, St. Louis, MO, USA), terpyridine (Alfa Aesar, Haverhill, MA, USA) and NH4PF6 (Acros Organics, Geel, Belgium), while the synthesis of ligand L has been reported previously [62]. Solvents were of laboratory-grade purity, reactions were performed in open air and rt refers to room temperature (20–25 °C). Infrared (IR) spectra were acquired on a Shimadzu Fourier transform IR Affinity-1 Infrared spectrometer. Nuclear magnetic resonance (NMR) spectra were acquired on a 500 MHz Bruker Ascend spectrometer in the deuterated solvent stated. Chemical shifts are quoted in parts per million (ppm) and referenced to the residual solvent peak(s). Mass spectrometric data were acquired via atmospheric pressure chemical ionization (APCI) and matrix-assisted laser desorption/ionization (MALDI) at the EPSRC National Facility for Mass Spectrometry, Swansea. Elemental analysis was performed in London Metropolitan University, where the solid samples were weighed using a Mettler Toledo high-precision scale and analyzed using ThermoFlash 2000.

4.2. Syntheses

(terpyridine)CoIICl2 (1a): Dichlorobis(triphenylphosphine)CoII (0.665 g, 1.02 mmol) was suspended in toluene (150 mL) and stirred at 60 °C for 10 min, before a solution of terpyridine (0.246 g, 1.05 mmol) in toluene (50 mL) was added. The reaction mixture was stirred at 120 °C under reflux conditions for 20 min, and 1a was isolated via filtration (0.32 g, 0.89 mmol, 87%) as an intense green-blue solid. IR (vmax, neat) 638, 770, 1016, 1448, 1595 cm−1; 1H NMR (500 MHz, D2O) δ 7.31 (2H, d), 8.18 (1H, s), 8.61 (1H, s), 9.05 (1H, s), 9.73 (4H, s); 13C NMR (500 MHz, D2O) δ 55.11, 100.99, 110.05, 127.04, 127.32, 130.45, 143.13, 151.30, 156.12; HRMS (ASAP, +p APCI) C15H11Cl1CoN3 ([M − Cl]+): found 326.9961; calculated 326.9968 (−2.1 ppm); C15H11Cl2CoN3 ([M]+): found 361.9647; calculated 361.9657 (−2.6 ppm); C15H11Cl2CoN3: found C, 49.59; H, 3.15; N, 11.43%; calculated C, 49.62; H, 3.05; N, 11.57%.
[(terpyridine)CoII(L)](PF6)2 (1): 1a (0.015 g, 0.04 mmol) was dissolved in CH3OH (5 mL) and stirred at rt for 10 min before a solution of L [62] (0.02 g, 0.03 mmol) in CH2Cl2 (1 mL) was added at once. The reaction mixture was left stirring at rt for 1.5 h and addition of excess NH4PF6 (0.018 g, 0.11 mmol) precipitated 1, which was isolated via filtration (0.02 g, 0.016 mmol, 55%) as a dark-brown powder. IR (vmax, neat) 795, 1002, 1166, 1240, 1288, 1473, 1490, 1600, 1730 cm−1; MS (MALDI – DCTB) C59H46N7CoO3 [(M – 2PF6)+]: found 959.3; calculated 959.3; C59H46N7CoO3P2F6 [(M − PF6)+]: found 1104; calculated 1104.3; C59H46N7CoO3P2F12: found C, 56.67; H, 3.83; N, 7.88%; calculated C, 56.70; H, 3.71; N, 7.84%.
BrPhTerpyridine: was synthesized according to procedures in the literature [70]. Here, mp 158–159 °C; Lit. [71] 158–160 °C; HRMS (FTMS, + p NSI) C21H15Br1N3 ([M + H]+): found 388.0448; calculated 388.0444 (+1.1 ppm).
[(terpyridine)CoII(terpyridinePhBr)](BPh4)2 (2): 1a (0.01 g, 0.03 mmol) was dissolved in CH3OH (3 mL) and stirred at rt for 10 min before a solution of BrPhTerpyridine (0.01 g, 0.03 mmol) in CH2Cl2 (1 mL) was added at once. The reaction mixture was left stirring at rt 16 h and the addition of excess NaBPh4 (0.028 g, 0.08 mmol) precipitated 2, which was isolated via filtration (0.02 g, 0.015 mmol, 50%) as a dark-brown powder. C84H65BrCoB2N6: found C, 76.35; H, 4.90; N, 6.51%; calculated C, 76.49; H, 4.97; N, 6.37%.

4.3. X-ray Crystallography

X-ray diffraction data for compound 2′ (see structure in Supplementary Materials) were collected at 173 K using a Rigaku MM-007HF High Brilliance RA generator/confocal optics with XtaLAB P100 diffractometer (Cu Kα radiation (λ = 1.54187 Å)). Intensity data were collected using both ω and φ steps, accumulating area detector images spanning at least a hemisphere of a reciprocal space. Data were collected and processed (including correction for Lorentz, polarization and absorption) using CrystalClear [72]. The structure was solved using charge-flipping methods (Superflip [73]) and refined using full-matrix least-squares against F2 (SHELXL-201/3 [74]). Non-hydrogen atoms were refined anisotropically, and hydrogen atoms were refined using a riding model. The thin, platy crystals diffracted weakly at higher angles, even with long exposures. This weaker high-resolution data lead to elevated values of Rint, poor observed-to-unique data ratios and minor discrepancies in some bond lengths. The structure could nevertheless be unambiguously determined. All calculations were performed using the CrystalStructure [75] interface. Deposition number 2152412 contains the supplementary crystallographic data for this paper. These data are provided free of charge by the joint Cambridge Crystallographic Data Centre and Fachinformationszentrum Karlsruhe Access Structures service www.ccdc.cam.ac.uk/structures.
Crystal data. C90H68B2Br2CoN6, M = 1473.93, monoclinic, a = 10.964(3), b = 16.030(4), c = 20.240(5) Å, β = 94.417(4)°, U = 3546.7(16) Å3, T = 173 K, space group P21 (no. 4), Z = 2, 35733 reflections measured, 10694 unique (Rint = 0.2457), which were used in all calculations. The final R1 [I > 2σ(I)] was 0.1015 and wR2 (all data) was 0.3191.

4.4. EPR Sample Preparation

10 equivalents of NaBPh4 were added to solid 1, the solids were taken up in DMF (or DMF-d7) and mixed thoroughly via pipetting until everything was dissolved, forming a transparent brown solution. Then, C7D8 or 2-MeTHF was added, the mixture was again mixed thoroughly, transferred to the EPR tube (3 mm outer diameter, OD) and frozen in liquid nitrogen. The final sample volume was 75 μL. The 10 μM sample was prepared by thawing the 1 mM sample and diluting it with a pre-mixed solution of DMF-d7/C7D8 (1/9).

4.5. EPR Spectroscopy

All EPR data were recorded on a Bruker ELEXSYS E580 pulsed X-band (9.7 GHz) or Q-band (34.0 GHz) spectrometer including the second frequency option (E580–400U). Pulses were amplified by travelling wave tube (TWT) amplifiers (1 kW at X-band and 150 W at Q-band) from Applied Systems Engineering. An MD5 dielectric ring resonator (X-band) and a 3 mm cylindrical resonator ER 5106QT-2w in TE012 mode (Q-band) and standard flex line probe heads were used. The temperature was stabilized using a continuous flow via a variable temperature helium flow cryostat from Oxford Instruments (X-band) or a cryogen-free variable temperature cryostat from Cryogenic Ltd. (Q-band).

4.5.1. Echo-Detected EPR Spectrum

The echo-detected EPR (ED-EPR) spectrum was recorded at 15 K and optimized for the CoII spin using the (π/2 − τ − π − τ – echo) sequence monitoring the echo intensity while sweeping the magnetic field. Here, π/2, π pulses were set to 12, 24 ns, τ to 400 μs and repetition rate to 407 μs.

4.5.2. Inversion Recovery Data

Inversion recovery (I.R.) data were collected using the (π − T − π/2 − τ − π − τ – echo) sequence monitoring the echo intensity as a function of the interval T. CoII and NO X-band I.R. data were recorded in the temperature range 5–50 K at 340.0 mT and 345.3 mT, respectively, using π/2, π pulses of 20, 40 ns, inversion pulse of 20 ns and τ of 200 μs; the time increment and repetition time varied with the temperature. CoII Q-band I.R. was recorded at 1160 mT at 30 K using π/2, π pulses of 12, 24 ns, respec-tively, 24 ns inversion pulse and τ of 800 μs, repetition time 1 ms and time increment 250 ns (see Figures S4–S6, Supplementary Materials).

4.5.3. Phase Memory Time Data

Phase memory time data were collected using a Hahn echo (π/2 − τ − π − τ – echo) sequence monitoring the echo intensity as a function of the interval τ. CoII and NO X-band phase memory time data were recorded in the temperature range 5-50 K at 340.0 mT and 345.3 mT, respectively using π/2, π pulses of 16, 32 ns, a starting τ of 120 μs and time increment of 12 ns; the repetition time varied with the temperature. CoII phase memory time data exhibited strong CoII ESEEM due to interaction of the un-paired electron with the nuclear spin of CoII (I = 7/2), whereas NO data exhibited 1H ESEEM. NO and CoII Q-band phase memory times were recorded at 1213 and 1196 mT at 15 K using π/2, π pulses of 12, 14 ns (NO), 16, 32 ns (CoII), a starting τ of 380 μs and time increment of 20 ns and repetition time 5 ms (see Figures S4–S6, Supplementary Materials).

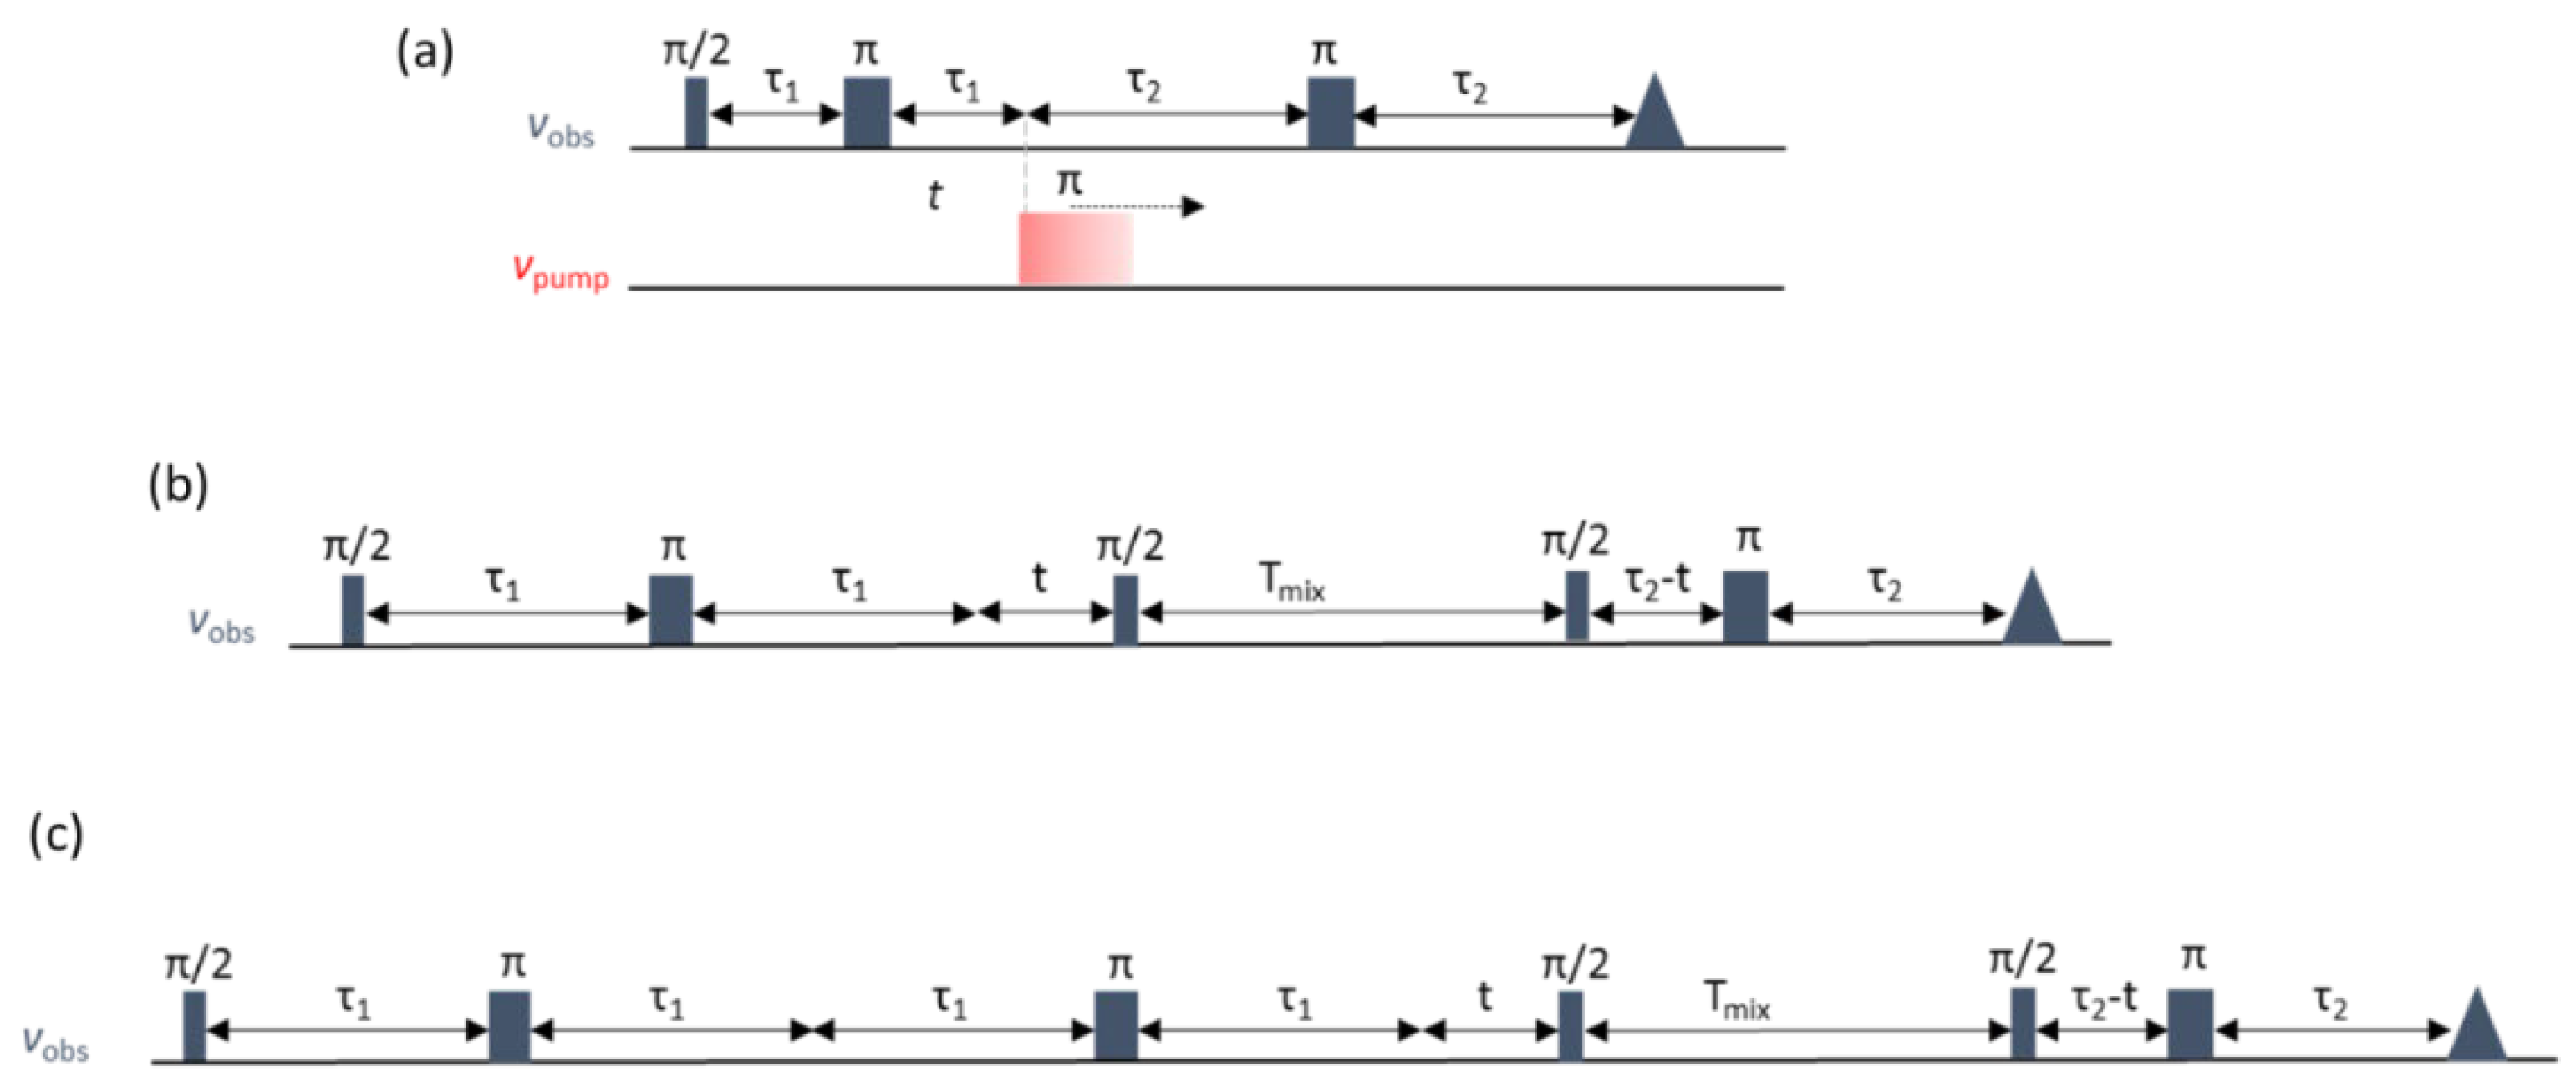
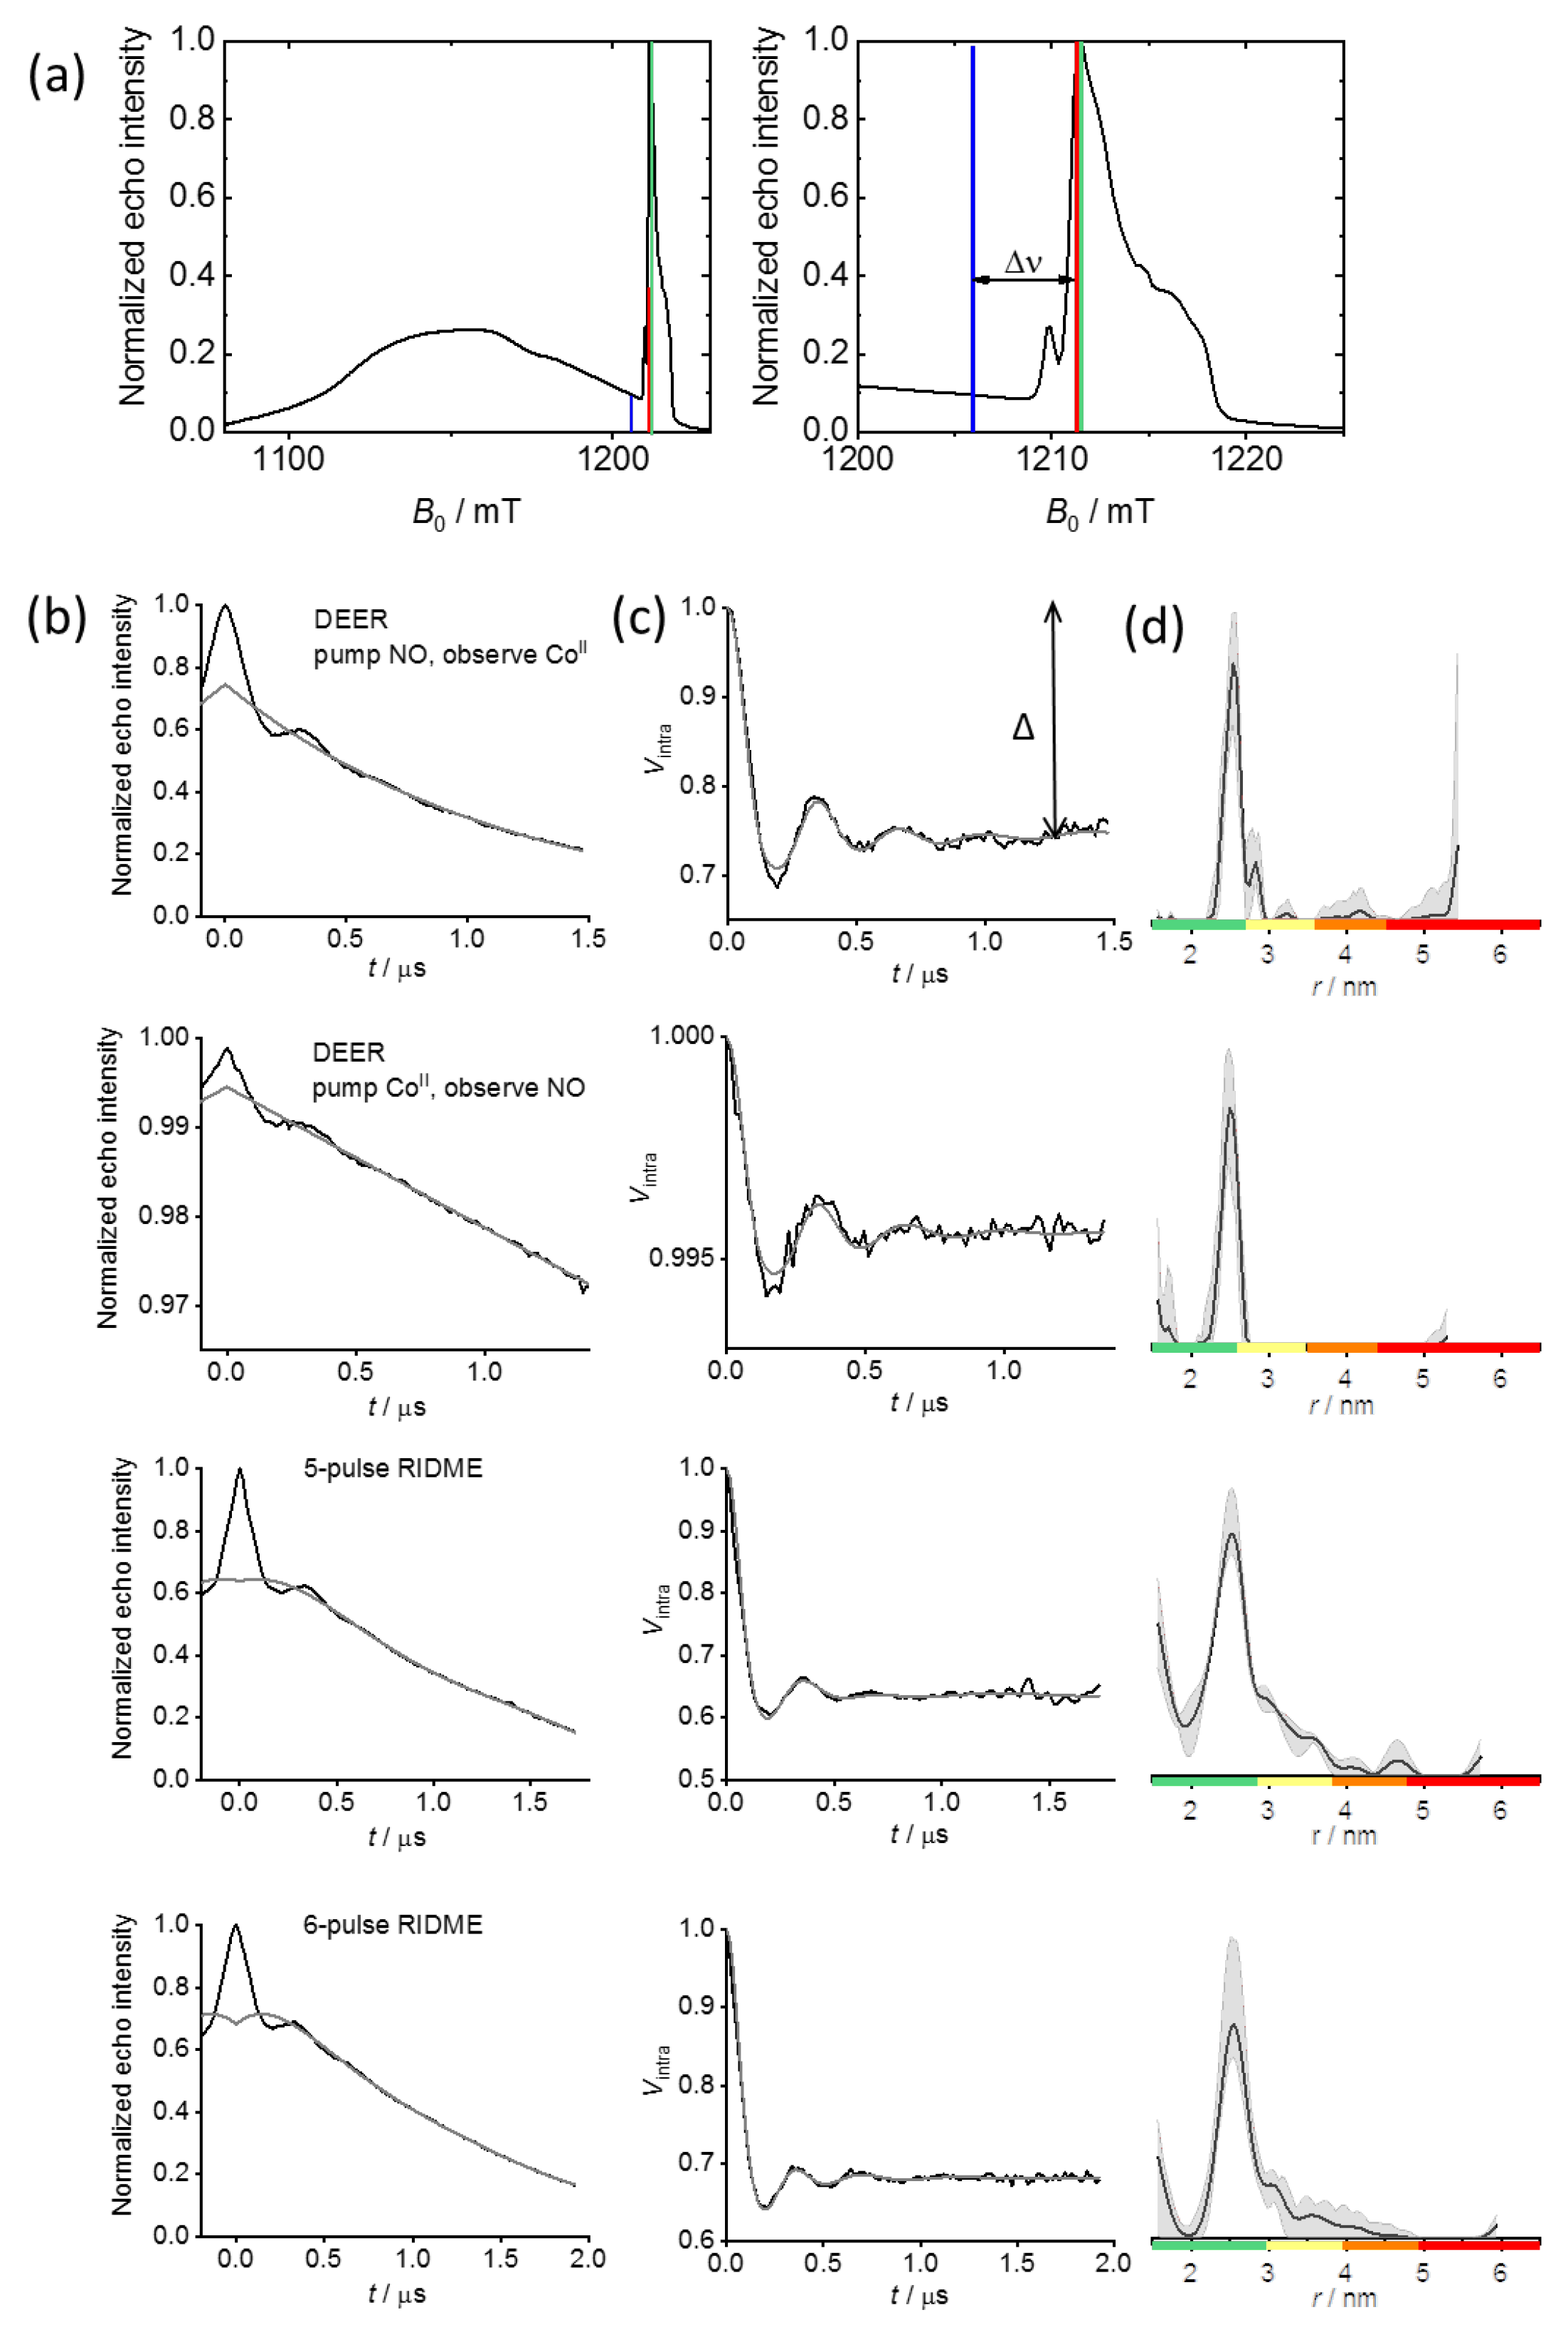
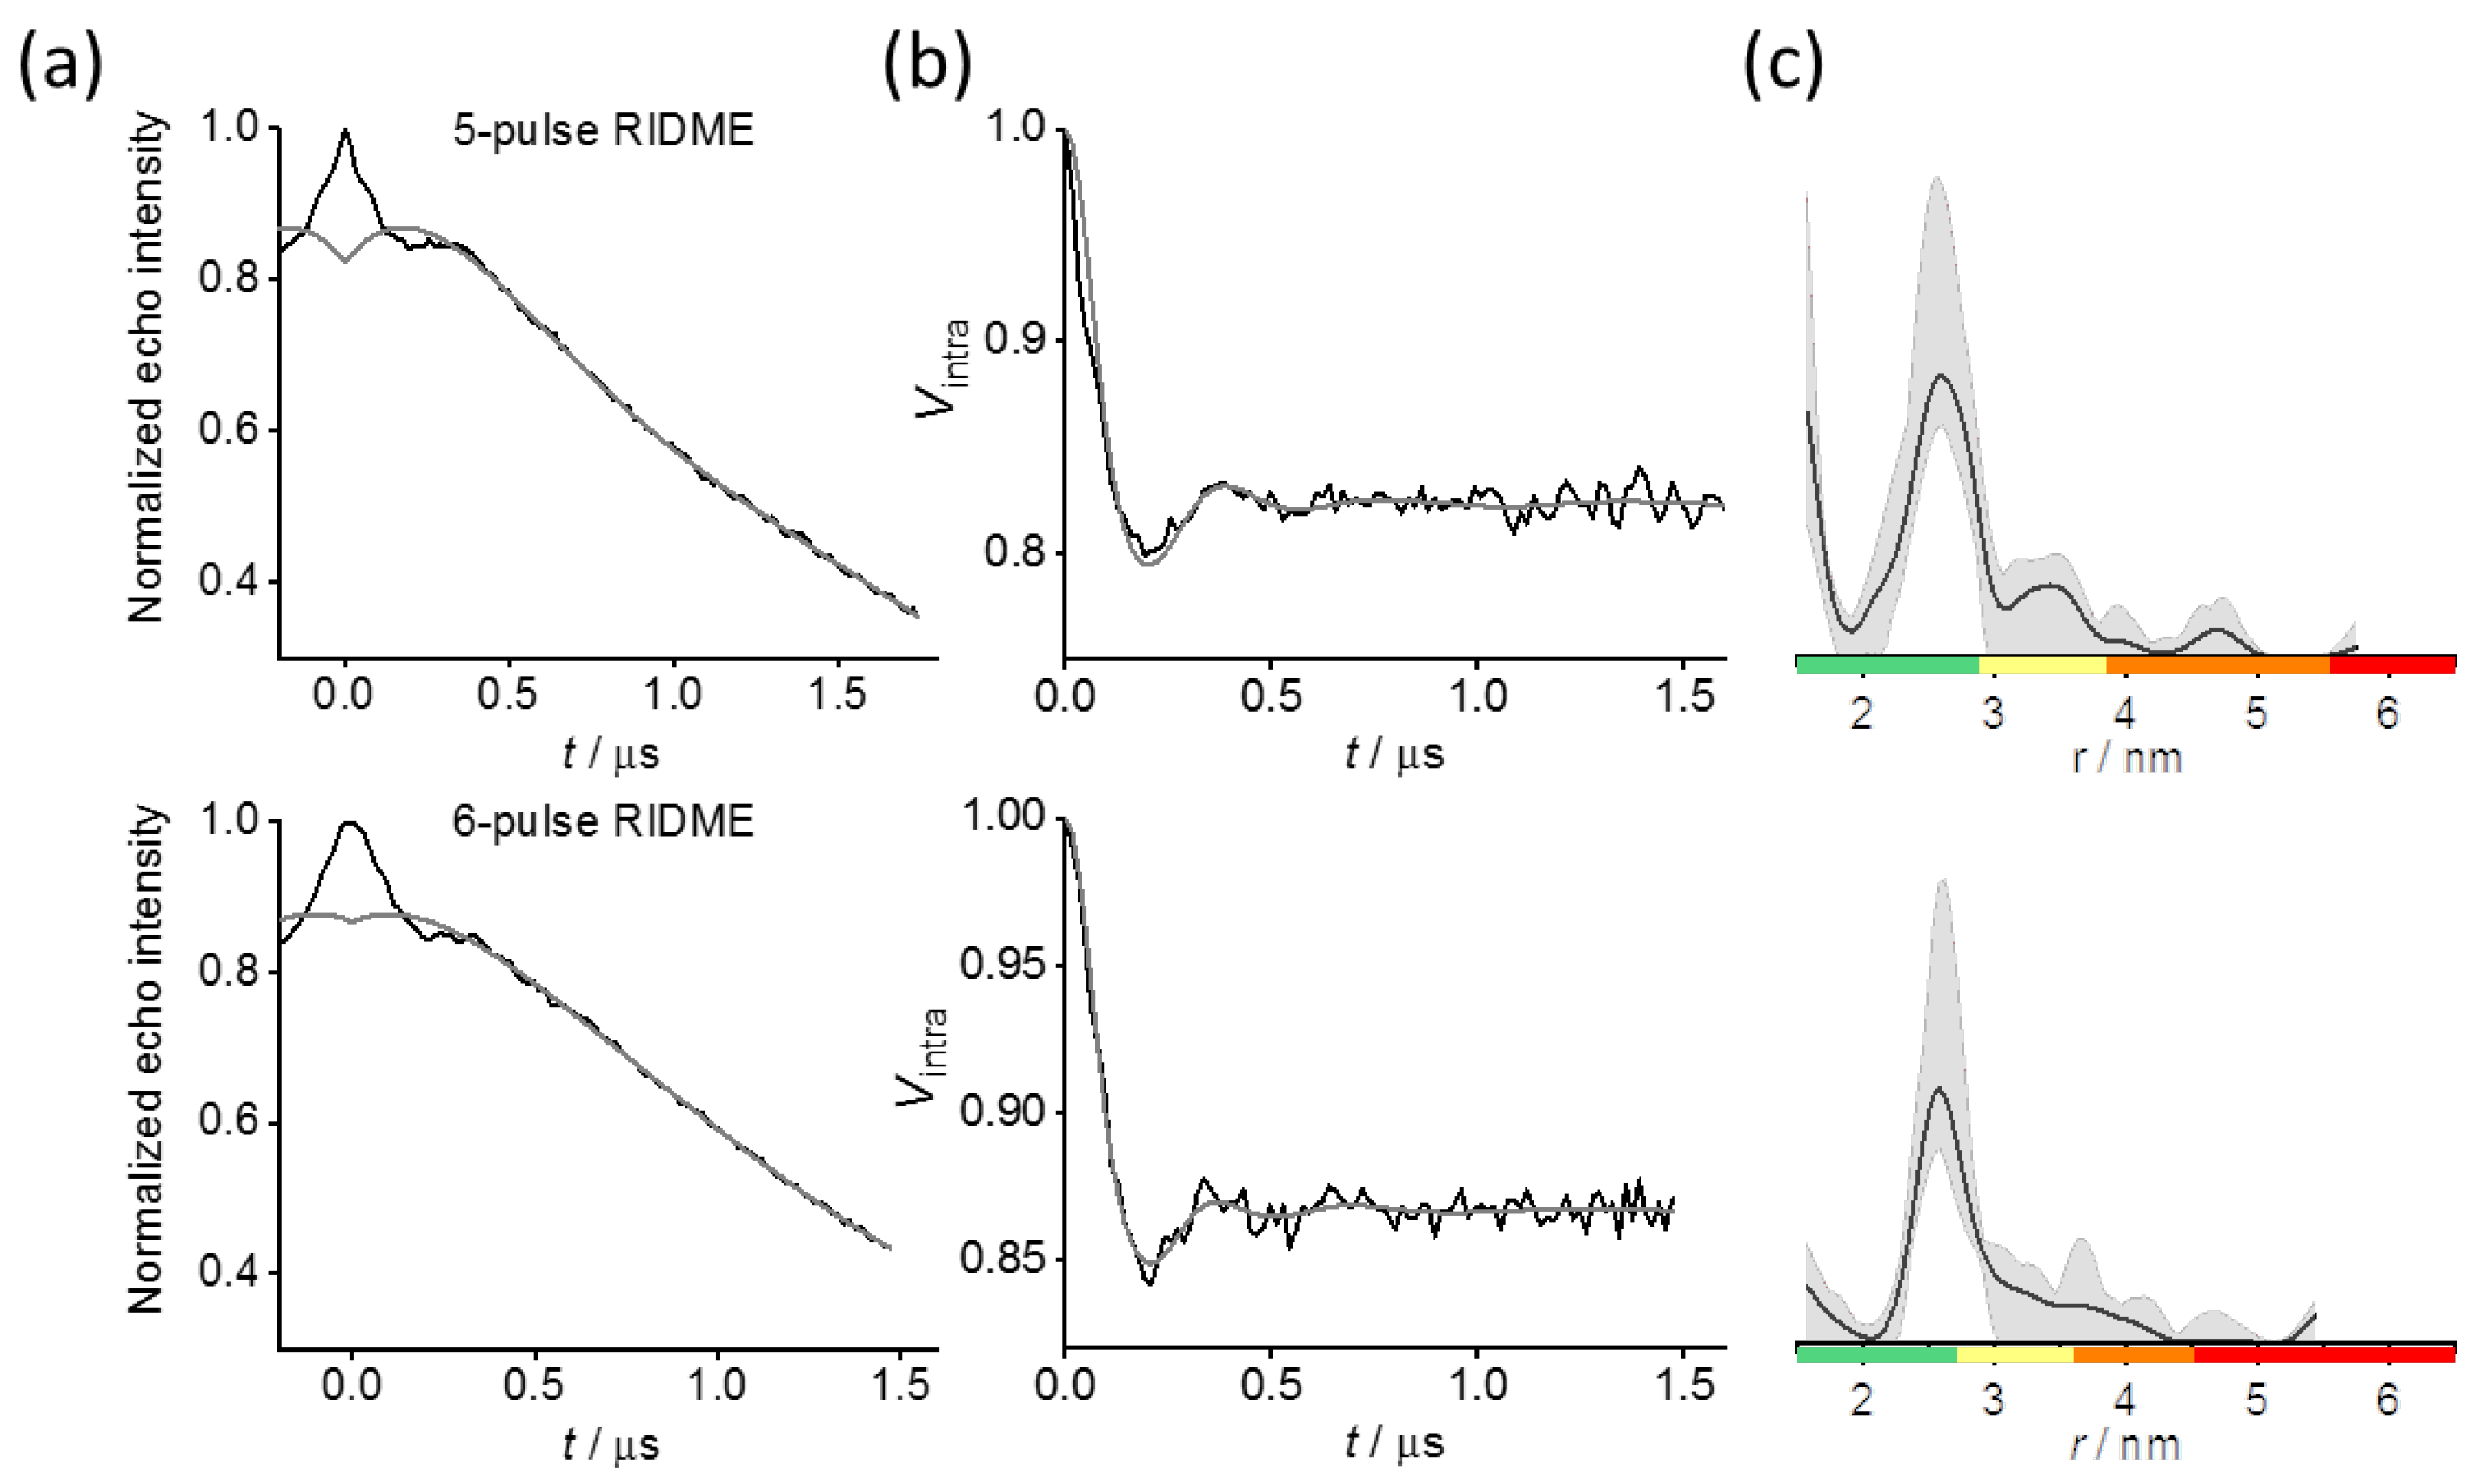
4.5.4. Q-Band DEER and RIDME

All data were collected at the Q-band. CoII-NO and NO-NO DEER were performed at 15 K and 20 K, respectively, with the 4-pulse sequence (π/2(νobs) − τ1 − π(νobs) − (τ1 + t) − π(νpump) − (τ2-t) − π(νobs) − τ2 − echo) [1,2,5], and RIDME was performed at 15 K (1 mM sample) and 30 K (10 μM sample) with the 5- (π/2 − τ1 − π − (τ1 + t) − π/2 − Tmix − π/2 − (τ2 − t) − π − τ2 − echo) [3] and 6- (π/2 − τ1 − π − 2τ1 − π − (τ1 + t) − π/2 − Tmix − π/2 − (τ2 − t) − π − τ2 − echo) [30] pulse sequences. RIDME was performed at the maximum intensity of the NO EPR spectrum. In RIDME, 2H ESEEM was suppressed with a 16-step τ averaging cycle [38], and 8-step or 32-step phase cycling (for 5- and 6-pulse RIDME, respectively) was used to eliminate unwanted echoes. All experimental parameters are given in Supplementary Materials, Tables S2 and S3.

4.5.5. Data Analysis

The primary DEER and RIDME data were transformed into distance distributions using the DeerAnalysis2018 [66] software and Tikhonov regularization with the L-curve [76] criterion. The background contributions to the primary DEER data were removed by fitting a background homogeneous to three dimensions for the DEER and fifth order polynomial function for the RIDME data using the default background start value giving the Δ values reported herein. An exception is the 5-pulse RIDME of 1 mM sample, where the background start was set manually to 100 ns, as default background start was unrealistic. In general, the RIDME data on 1 mM sample could also be fitted by fitting the dimensionality of the background or with different order polynomial functions, but as the 10 μM data could only be fitted with fifth order polynomial function, we analyzed all RIDME data similarly. The regularization parameter was 10 for the RIDME and 1 and for the DEER data, respectively. The contributions of the background signal were evaluated within the validation tool of the DeerAnalysis2018 program. The validation was performed from 5% to 80% of the time traces for DEER and from 5% to 15% for RIDME, respectively, in 16 trials, and a white noise of level 1.5 in 10 trials was added. In the NO-NO DEER measurements, no noise was added during validation. For all validation procedures, only datasets within 15% of the best root-mean–square deviation were retained (i.e., default prune level 1.15), affording the confidence intervals (gray shadowed areas) of the plotted distance distributions. The color bars below the distance distributions denote the reliability of the distance as follows: green = shape reliable; yellow = mean and width reliable; orange = mean reliable; red = non-reliable. The data were also analyzed with two user-unbiased methods; first, DEERNet, which utilizes neuronal networks to predict the distance distribution [77] within Spinach [78] software in MATLAB R2020b. Second, with simultaneous comparative treatment employing neuronal network analysis and Tikhonov regularization (ComparativeDeerAnalyzer, CDA), which computes the distance distribution and its uncertainty using DeerAnalysis2021b in MATLAB R2020b. The DEERNet and CDA analysis results are given in Supplementary Materials, Figures S8–S20, respectively. CDA could not run for the 5-pulse RIDME measurement on the 10 μM sample. The modulation depth values as calculated automatically from DEERNet and CDA are reported in Table S4, Supplementary Materials. All data are available in reference [79].

4.5.6. Calculation of Sensitivity

The sensitivity was calculated similarly to what was described previously [44]. Briefly, it was first calculated as modulation-to-noise ratio, i.e., Δ/noise level, where Δ was calculated automatically in CDA and the noise level was estimated using the imaginary part of phase-corrected and normalized time domain data, again calculated in CDA or, where mentioned, with a self-written MATLAB script. Then, this value was divided by the square root (sqrt) of (number of scans × shots-per-point × τ-averaging × phase cycle) to give the modulation-to-noise ratio normalized for the number of echoes, Se. To account for different repetition rates, Se was multiplied with the sqrt of the inverse repetition rate to yield the sensitivity per unit time (St). The sensitivity values are mentioned throughout the texts and are summarized in Supplementary Materials, Table S4.

Supplementary Materials

The following are available online at https://www.mdpi.com/article/10.3390/magnetochemistry8040043/s1, Mass spectra, relaxation times data, experimental parameters, additional analysis. References [80,81,82,83,84,85,86,87,88,89] are cited in the supplementary materials.

Author Contributions

Synthesis, A.G.; sample preparation and EPR measurements, B.E.B. and A.G.; data analysis, B.E.B. and A.G.; X-ray structure determination, D.B.C. and A.M.Z.S.; manuscript writing, A.G. and B.E.B. All authors have read and agreed to the published version of the manuscript.

Funding

AG was supported by the EPSRC-funded Centre for Doctoral Training in ‘integrated magnetic resonance’, iMR-CDT (EP/J500045/1) the time the research was conducted. BEB is supported by the Leverhulme Trust (RPG-2018–397) and equipment funding from BBSRC (BB/R013780/1 and BB/T017740/1).

Institutional Review Board Statement

Not applicable.

Informed Consent Statement

Not applicable.

Data Availability Statement

Digital data underpinning the results presented in this manuscript.

Acknowledgments

We thank the EPSRC National Mass Spectrometry Service Centre, Swansea, for mass spectra and Steven Boyer for Elemental Analyses.

Conflicts of Interest

There are no conflict of interest to report.

References

  1. Milov, A.D.; Ponomarev, A.B.; Tsvetkov, Y.D. Electron Electron Double-Resonance in Electron-Spin Echo—Model Biradical Systems and the Sensitized Photolysis of Decalin. Chem. Phys. Lett. 1984, 110, 67–72. [Google Scholar] [CrossRef]
  2. Milov, A.D.; Salikhov, K.M.; Shirov, M.D. Application of Eldor in Electron-Spin Echo for Paramagnetic Center Space Distribution in Solids. Fiz. Tverd. Tela 1981, 23, 975–982. [Google Scholar]
  3. Kulik, L.V.; Dzuba, S.A.; Grigoryev, I.A.; Tsvetkov, Y.D. Electron dipole-dipole interaction in ESEEM of nitroxide biradicals. Chem. Phys. Lett. 2001, 343, 315–324. [Google Scholar] [CrossRef]
  4. EPR Spectroscopy: Fundamentals and Methods; Goldfarb, D.; Stoll, S. (Eds.) Wiley: Hoboken, NJ, USA, 1988. [Google Scholar]
  5. Pannier, M.; Veit, S.; Godt, A.; Jeschke, G.; Spiess, H.W. Dead-time free measurement of dipole-dipole interactions between electron spins. J. Magn. Reson. 2000, 142, 331–340. [Google Scholar] [CrossRef] [PubMed] [Green Version]
  6. Larsen, R.G.; Singel, D.J. Double electron-electron resonance spin-echo modulation—Spectroscopic measurement of electron-spin pair separations in orientationally disordered solids. J. Chem. Phys. 1993, 98, 5134–5146. [Google Scholar] [CrossRef] [Green Version]
  7. Martin, R.E.; Pannier, M.; Diederich, F.; Gramlich, V.; Hubrich, M.; Spiess, H.W. Determination of End-to-End Distances in a Series of TEMPO Diradicals of up to 2.8 nm Length with a New Four-Pulse Double Electron Electron Resonance Experiment. Angew. Chem. Int. Ed. Engl. 1998, 37, 2833–2837. [Google Scholar] [CrossRef]
  8. Milikisyants, S.; Scarpelli, F.; Finiguerra, M.G.; Ubbink, M.; Huber, M. A pulsed EPR method to determine distances between paramagnetic centers with strong spectral anisotropy and radicals: The dead-time free RIDME sequence. J. Magn. Reson. 2009, 201, 48–56. [Google Scholar] [CrossRef]
  9. Konov, K.B.; Knyazev, A.A.; Galyametdinov, Y.G.; Isaev, N.P.; Kulik, L.V. Selective Hole-Burning in RIDME Experiment: Dead-Time Free Measurement of Dipolar Modulation. Appl. Magn. Reson. 2013, 44, 949–966. [Google Scholar] [CrossRef]
  10. Giannoulis, A.; Motion, C.L.; Oranges, M.; Buhl, M.; Smith, G.M.; Bode, B.E. Orientation selection in high-field RIDME and PELDOR experiments involving low-spin CoII ions. Phys. Chem. Chem. Phys. 2018, 20, 2151–2154. [Google Scholar] [CrossRef] [Green Version]
  11. Giannoulis, A.; Oranges, M.; Bode, B.E. Monitoring Complex Formation by Relaxation-Induced Pulse Electron Paramagnetic Resonance Distance Measurements. Chemphyschem 2017, 18, 2318–2321. [Google Scholar] [CrossRef] [Green Version]
  12. Abdullin, D.; Duthie, F.; Meyer, A.; Muller, E.S.; Hagelueken, G.; Schiemann, O. Comparison of PELDOR and RIDME for distance measurements between nitroxides and low-spin Fe(III) ions. J. Phys. Chem. B 2015, 119, 13534–13542. [Google Scholar] [CrossRef] [PubMed]
  13. Jassoy, J.J.; Berndhauser, A.; Duthie, F.; Kuhn, S.P.; Hagelueken, G.; Schiemann, O. Versatile Trityl Spin Labels for Nanometer Distance Measurements on Biomolecules In Vitro and within Cells. Angew. Chem. Int. Ed. Engl. 2017, 56, 177–181. [Google Scholar] [CrossRef] [PubMed]
  14. Russell, H.; Stewart, R.; Prior, C.; Oganesyan, V.S.; Gaule, T.G.; Lovett, J.E. DEER and RIDME Measurements of the Nitroxide-Spin Labelled Copper-Bound Amine Oxidase Homodimer from Arthrobacter Globiformis. Appl. Magn. Reson. 2021, 52, 995–1015. [Google Scholar] [CrossRef] [PubMed]
  15. Meyer, A.; Schiemann, O. PELDOR and RIDME Measurements on a High-Spin Manganese(II) Bisnitroxide Model Complex. J. Phys. Chem. A 2016, 120, 3463–3472. [Google Scholar] [CrossRef]
  16. Ritsch, I.; Hintz, H.; Jeschke, G.; Godt, A.; Yulikov, M. Improving the accuracy of Cu(ΙΙ)-nitroxide RIDME in the presence of orientation correlation in water-soluble Cu(ΙΙ)-nitroxide rulers. Phys. Chem. Chem. Phys. 2019, 21, 9810–9830. [Google Scholar] [CrossRef] [Green Version]
  17. Abdullin, D.; Brehm, P.; Fleck, N.; Spicher, S.; Grimme, S.; Schiemann, O. Pulsed EPR Dipolar Spectroscopy on Spin Pairs with one Highly Anisotropic Spin Center: The Low-Spin FeIII Case. Chem. Eur. J. 2019, 25, 14388–14398. [Google Scholar] [CrossRef] [Green Version]
  18. Boulon, M.E.; Fernandez, A.; Pineda, E.M.; Chilton, N.F.; Timco, G.; Fielding, A.J.; Winpenny, R.E.P. Measuring Spin…Spin Interactions between Heterospins in a Hybrid [2] Rotaxane. Angew. Chem. Int. Ed. Engl. 2017, 56, 3876–3879. [Google Scholar] [CrossRef]
  19. Astashkin, A.V.; Rajapakshe, A.; Cornelison, M.J.; Johnson-Winters, K.; Enemark, J.H. Determination of the Distance between the Mo(V) and Fe(III) Heme Centers of Wild Type Human Sulfite Oxidase by Pulsed EPR Spectroscopy. J. Phys. Chem. B 2012, 116, 1942–1950. [Google Scholar] [CrossRef] [Green Version]
  20. Azarkh, M.; Bieber, A.; Qi, M.; Fischer, J.W.A.; Yulikov, M.; Godt, A.; Drescher, M. Gd(III)-Gd(III) Relaxation-Induced Dipolar Modulation Enhancement for In-Cell Electron Paramagnetic Resonance Distance Determination. J. Phys. Chem. Lett. 2019, 10, 1477–1481. [Google Scholar] [CrossRef]
  21. Breitgoff, F.D.; Keller, K.; Qi, M.; Klose, D.; Yulikov, M.; Godt, A.; Jeschke, G. UWB DEER and RIDME distance measurements in Cu(II)-Cu(II) spin pairs. J. Magn. Reson. 2019, 308, 106560. [Google Scholar] [CrossRef]
  22. Ackermann, K.; Wort, J.L.; Bode, B.E. Nanomolar Pulse Dipolar EPR Spectroscopy in Proteins: CuII-CuII and Nitroxide-Nitroxide Cases. J. Phys. Chem. B. 2021, 125, 5358–5364. [Google Scholar] [CrossRef] [PubMed]
  23. Razzaghi, S.; Qi, M.; Nalepa, A.I.; Godt, A.; Jeschke, G.; Savitsky, A.; Yulikov, M. RIDME Spectroscopy with Gd(III) Centers. J. Phys. Chem. Lett. 2014, 5, 3970–3975. [Google Scholar] [CrossRef] [PubMed]
  24. Akhmetzyanov, D.; Ching, H.Y.; Denysenkov, V.; Demay-Drouhard, P.; Bertrand, H.C.; Tabares, L.C.; Policar, C.; Prisner, T.F.; Un, S. RIDME spectroscopy on high-spin Mn2+ centers. Phys. Chem. Chem. Phys. 2016, 18, 30857–30866. [Google Scholar] [CrossRef] [Green Version]
  25. Collauto, A.; Frydman, V.; Lee, M.D.; Abdelkader, E.H.; Feintuch, A.; Swarbrick, J.D.; Graham, B.; Otting, G.; Goldfarb, D. RIDME distance measurements using Gd(III) tags with a narrow central transition. Phys. Chem. Chem. Phys. 2016, 18, 19037–19049. [Google Scholar] [CrossRef] [PubMed] [Green Version]
  26. Keller, K.; Mertens, V.; Qi, M.; Nalepa, A.I.; Godt, A.; Savitsky, A.; Jeschke, G.; Yulikov, M. Computing distance distributions from dipolar evolution data with overtones: RIDME spectroscopy with Gd(III)-based spin labels. Phys. Chem. Chem. Phys. 2017, 19, 17856–17876. [Google Scholar] [CrossRef] [PubMed]
  27. Salvadori, E.; Fusco, E.; Chiesa, M. Long-Range Spatial Distribution of Single Aluminum Sites in Zeolites. J. Phys. Chem. Lett. 2022, 13, 1283–1289. [Google Scholar] [CrossRef]
  28. Kuzhelev, A.A.; Krumkacheva, O.A.; Shevelev, G.Y.; Yulikov, M.; Fedin, M.V.; Bagryanskaya, E.G. Room-temperature distance measurements using RIDME and the orthogonal spin labels trityl/nitroxide. Phys. Chem. Chem. Phys. 2018, 20, 10224–10230. [Google Scholar] [CrossRef]
  29. Savitsky, A.; Dubinskii, A.A.; Zimmermann, H.; Lubitz, W.; Mobius, K. High-Field Dipolar Electron Paramagnetic Resonance (EPR) Spectroscopy of Nitroxide Biradicals for Determining Three-Dimensional Structures of Biomacromolecules in Disordered Solids. J. Phys. Chem. B 2011, 115, 11950–11963. [Google Scholar] [CrossRef]
  30. Abdullin, D.; Suchatzki, M.; Schiemann, O. Six-Pulse RIDME Sequence to Avoid Background Artifacts. Appl. Magn. Reson. 2021, 1–16. [Google Scholar] [CrossRef]
  31. Astashkin, A.V. Mapping the Structure of Metalloproteins with RIDME. Methods Enzymol. 2015, 563, 251–284. [Google Scholar]
  32. Keller, K.; Qi, M.; Gmeiner, C.; Ritsch, I.; Godt, A.; Jeschke, G.; Savitsky, A.; Yulikov, M. Intermolecular background decay in RIDME experiments. Phys. Chem. Chem. Phys. 2019, 21, 8228–8245. [Google Scholar] [CrossRef] [PubMed] [Green Version]
  33. Goldfarb, D. Metal-Based Spin Labeling for Distance Determination. Struct. Inf. Spin Labels Intrinsic Paramagn. Cent. Biosci. 2012, 152, 163–204. [Google Scholar]
  34. Ji, M.; Ruthstein, S.; Saxena, S. Paramagnetic metal ions in pulsed ESR distance distribution measurements. Acc. Chem. Res. 2014, 47, 688–695. [Google Scholar] [CrossRef] [PubMed]
  35. Schiemann, O.; Prisner, T.F. Long-range distance determinations in biomacromolecules by EPR spectroscopy. Q. Rev. Biophys. 2007, 40, 1–53. [Google Scholar] [CrossRef] [PubMed]
  36. Abdullin, D.; Schiemann, O. Pulsed Dipolar EPR Spectroscopy and Metal Ions: Methodology and Biological Applications. Chempluschem 2020, 85, 353–372. [Google Scholar] [CrossRef] [PubMed] [Green Version]
  37. Giannoulis, A.; Feintuch, A.; Unger, T.; Amir, S.; Goldfarb, D. Monitoring the Conformation of the Sba1/Hsp90 Complex in the Presence of Nucleotides with Mn(II)-Based Double Electron-Electron Resonance. J. Phys. Chem. Lett. 2021, 12, 12235–12241. [Google Scholar] [CrossRef]
  38. Keller, K.; Doll, A.; Qi, M.A.; Godt, A.; Jeschke, G.; Yulikov, M. Averaging of nuclear modulation artefacts in RIDME experiments. J. Magn. Reson. 2016, 272, 108–113. [Google Scholar] [CrossRef] [Green Version]
  39. Meyer, A.; Abdullin, D.; Schnakenburg, G.; Schiemann, O. Single and double nitroxide labeled bis(terpyridine)-copper(II): Influence of orientation selectivity and multispin effects on PELDOR and RIDME. Phys. Chem. Chem. Phys. 2016, 18, 9262–9271. [Google Scholar] [CrossRef]
  40. Meyer, A.; Jassoy, J.J.; Spicher, S.; Berndhauser, A.; Schiemann, O. Performance of PELDOR, RIDME, SIFTER, and DQC in measuring distances in trityl based bi- and triradicals: Exchange coupling, pseudosecular coupling and multi-spin effects. Phys. Chem. Chem. Phys. 2018, 20, 13858–13869. [Google Scholar] [CrossRef]
  41. Dal Farra, M.G.; Richert, S.; Martin, C.; Larminie, C.; Gobbo, M.; Bergantino, E.; Timmel, C.R.; Bowen, A.M.; Di Valentin, M. Light-Induced Pulsed EPR Dipolar Spectroscopy on a Paradigmatic Hemeprotein. Chemphyschem 2019, 20, 931–935. [Google Scholar] [CrossRef] [Green Version]
  42. Doll, A.; Qi, M.; Godt, A.; Jeschke, G. CIDME: Short distances measured with long chirp pulses. J. Magn. Reson. 2016, 273, 73–82. [Google Scholar] [CrossRef] [Green Version]
  43. Wort, J.L.; Arya, S.; Ackermann, K.; Stewart, A.J.; Bode, B.E. Pulse Dipolar EPR Reveals Double-Histidine Motif Cu(II)-NTA Spin-Labeling Robustness against Competitor Ions. J. Phys. Chem. Lett. 2021, 12, 2815–2819. [Google Scholar] [CrossRef] [PubMed]
  44. Wort, J.L.; Ackermann, K.; Giannoulis, A.; Stewart, A.J.; Norman, D.G.; Bode, B.E. Sub-Micromolar Pulse Dipolar EPR Spectroscopy Reveals Increasing CuII-labelling of Double-Histidine Motifs with Lower Temperature. Angew. Chem. Int. Ed. Engl. 2019, 58, 11681–11685. [Google Scholar] [CrossRef] [PubMed] [Green Version]
  45. Astashkin, A.V.; Elmore, B.O.; Fan, W.H.; Guillemette, J.G.; Feng, C.J. Pulsed EPR Determination of the Distance between Heme Iron and FMN Centers in a Human Inducible Nitric Oxide Synthase. J. Am. Chem. Soc. 2010, 132, 12059–12067. [Google Scholar] [CrossRef] [PubMed] [Green Version]
  46. Giannoulis, A.; Ackermann, K.; Spindler, P.E.; Higgins, C.; Cordes, D.B.; Slawin, A.M.Z.; Prisner, T.F.; Bode, B.E. Nitroxide-nitroxide and nitroxide-metal distance measurements in transition metal complexes with two or three paramagnetic centres give access to thermodynamic and kinetic stabilities. Phys. Chem. Chem. Phys. 2018, 20, 11196–11205. [Google Scholar] [CrossRef] [Green Version]
  47. Wort, J.L.; Ackermann, K.; Norman, D.G.; Bode, B.E. A general model to optimise Cu(II) labelling efficiency of double-histidine motifs for pulse dipolar EPR applications. Phys. Chem. Chem. Phys. 2021, 23, 3810–3819. [Google Scholar] [CrossRef]
  48. Cunningham, T.F.; Putterman, M.R.; Desai, A.; Horne, W.S.; Saxena, S. The double-histidine Cu2+-binding motif: A highly rigid, site-specific spin probe for electron spin resonance distance measurements. Angew. Chem. Int. Ed. Engl. 2015, 54, 6330–6334. [Google Scholar] [CrossRef] [Green Version]
  49. Ghosh, S.; Lawless, M.J.; Rule, G.S.; Saxena, S. The Cu2+-nitrilotriacetic acid complex improves loading of alpha-helical double histidine site for precise distance measurements by pulsed ESR. J. Magn. Reson. 2018, 286, 163–171. [Google Scholar] [CrossRef]
  50. Yang, Y.; Gong, Y.J.; Litvinov, A.; Liu, H.K.; Yang, F.; Su, X.C.; Goldfarb, D. Generic tags for Mn(II) and Gd(III) spin labels for distance measurements in proteins. Phys. Chem. Chem. Phys. 2017, 19, 26944–26956. [Google Scholar] [CrossRef]
  51. Martorana, A.; Yang, Y.; Zhao, Y.; Li, Q.F.; Su, X.C.; Goldfarb, D. Mn(II) tags for DEER distance measurements in proteins via C-S attachment. Dalton Trans. 2015, 44, 20812–20816. [Google Scholar] [CrossRef]
  52. Pfrunder, M.C.; Whittaker, J.J.; Parsons, S.; Moubaraki, B.; Murray, K.S.; Moggach, S.A.; Sharma, N.; Micallef, A.S.; Clegg, J.; McMurtrie, J.C. Controlling Spin Switching with Anionic Supramolecular Frameworks. Chem. Mater. 2020, 32, 3229–3234. [Google Scholar] [CrossRef]
  53. Pavlov, A.A.; Denisov, G.L.; Kiskin, M.A.; Nelyubina, Y.V.; Novikov, V.V. Probing Spin Crossover in a Solution by Paramagnetic NMR Spectroscopy. Inorg. Chem. 2017, 56, 14759–14762. [Google Scholar] [CrossRef] [PubMed]
  54. Spindler, P.E.; Glaser, S.J.; Skinner, T.E.; Prisner, T.F. Broadband inversion PELDOR spectroscopy with partially adiabatic shaped pulses. Angew. Chem. Int. Ed. Engl. 2013, 52, 3425–3429. [Google Scholar] [CrossRef] [PubMed]
  55. Gaponenko, V.; Altieri, A.S.; Li, J.; Byrd, R.A. Breaking symmetry in the structure determination of (large) symmetric protein dimers. J. Biomol. NMR 2002, 24, 143–148. [Google Scholar] [CrossRef]
  56. Dvoretsky, A.; Gaponenko, V.; Rosevear, P.R. Derivation of structural restraints using a thiol-reactive chelator. FEBS Lett. 2002, 528, 189–192. [Google Scholar] [CrossRef] [Green Version]
  57. Bahramzadeh, A.; Huber, T.; Otting, G. Three-Dimensional Protein Structure Determination Using Pseudocontact Shifts of Backbone Amide Protons Generated by Double-Histidine Co2+-Binding Motifs at Multiple Sites. Biochemistry 2019, 58, 3243–3250. [Google Scholar] [CrossRef] [PubMed]
  58. Seebald, L.M.; DeMott, C.M.; Ranganathan, S.; Asare-Okai, P.N.; Glazunova, A.; Chen, A.; Shekhtman, A.; Royzen, M. Cobalt-based paramagnetic probe to study RNA-protein interactions by NMR. J. Inorg. Biochem. 2017, 170, 202–208. [Google Scholar] [CrossRef] [Green Version]
  59. Zehnder, J.; Cadalbert, R.; Terradot, L.; Ernst, M.; Bockmann, A.; Guntert, P.; Meier, B.H.; Wiegand, T. Paramagnetic Solid-State NMR to Localize the Metal-Ion Cofactor in an Oligomeric DnaB Helicase. Chem. Eur. J. 2021, 27, 7745–7755. [Google Scholar] [CrossRef]
  60. Balayssac, S.; Bertini, I.; Bhaumik, A.; Lelli, M.; Luchinat, C. Paramagnetic shifts in solid-state NMR of proteins to elicit structural information. Proc. Natl. Acad. Sci. USA 2008, 105, 17284–17289. [Google Scholar] [CrossRef] [Green Version]
  61. Sato, Y.; Nakayama, Y.; Yasuda, H. Controlled vinyl-addition-type polymerization of norbornene initiated by several cobalt complexes having substituted terpyridine ligands. J. Organomet. Chem. 2004, 689, 744–750. [Google Scholar] [CrossRef]
  62. Ackermann, K.; Giannoulis, A.; Cordes, D.B.; Slawin, A.M.Z.; Bode, B.E. Assessing dimerisation degree and cooperativity in a biomimetic small-molecule model by pulsed EPR. Chem. Commun. 2015, 51, 5257–5260. [Google Scholar] [CrossRef] [PubMed] [Green Version]
  63. Bode, B.E.; Plackmeyer, J.; Prisner, T.F.; Schiemann, O. PELDOR measurements on a nitroxide-labeled Cu(II) porphyrin: Orientation selection, spin-density distribution, and conformational flexibility. J. Phys. Chem. A 2008, 112, 5064–5073. [Google Scholar] [CrossRef] [PubMed]
  64. Eaton, G.R.; Eaton, S.S.; Barr, D.P.; Weber, R.T. Quantitative EPR. Quant. Epr. 2010, 1–185. [Google Scholar] [CrossRef]
  65. Diaz-Torres, R.; Alvarez, S. Coordinating ability of anions and solvents towards transition metals and lanthanides. Dalton Trans. 2011, 40, 10742–10750. [Google Scholar] [CrossRef] [PubMed]
  66. Jeschke, G.; Chechik, V.; Ionita, P.; Godt, A.; Zimmermann, H.; Banham, J.; Timmel, C.R.; Hilger, D.; Jung, H. DeerAnalysis2006—A comprehensive software package for analyzing pulsed ELDOR data. Appl. Magn. Reson. 2006, 30, 473–498. [Google Scholar] [CrossRef]
  67. Ackermann, K.; Chapman, A.; Bode, B.E. A Comparison of Cysteine-Conjugated Nitroxide Spin Labels for Pulse Dipolar EPR Spectroscopy. Molecules 2021, 26, 7534. [Google Scholar] [CrossRef]
  68. Jeschke, G. DEER distance measurements on proteins. Annu. Rev. Phys. Chem. 2012, 63, 419–446. [Google Scholar] [CrossRef] [Green Version]
  69. Jeschke, G.; Polyhach, Y. Distance measurements on spin-labelled biomacromolecules by pulsed electron paramagnetic resonance. Phys. Chem. Chem. Phys. 2007, 9, 1895–1910. [Google Scholar] [CrossRef]
  70. Siemeling, U.; Vor der Bruggen, J.; Vorfeld, U.; Stammler, A.; Stammler, H.G. Large scale synthesis of 4′-(4-bromophenyl)-2,2′: 6′,2″-terpyridine and nature of the mysterious green by-product. Z. Naturforsch. B 2003, 58, 443–446. [Google Scholar] [CrossRef]
  71. Mutai, T.; Arita, S.; Araki, K. Phenyl-substituted 2,2′: 6′,2″-terpyridine as a new series of fluorescent compounds—Their photophysical properties and fluorescence tuning. J. Chem. Soc. Perkin Trans. 2 2001, 7, 1045–1050. [Google Scholar] [CrossRef]
  72. CrystalClear-SM Expert v2.1; Rigaku Americas: The Woodlands, TX, USA; Rigaku Corporation: Tokyo, Japan, 2015.
  73. Palatinus, L.; Chapuis, G. SUPERFLIP—A computer program for the solution of crystal structures by charge flipping in arbitrary dimensions. J. Appl. Crystallogr. 2007, 40, 786–790. [Google Scholar] [CrossRef] [Green Version]
  74. Sheldrick, G.M. Crystal structure refinement with SHELXL. Acta Crystallogr. Sect. C Struct. Chem. 2015, 71, 3–8. [Google Scholar] [CrossRef] [PubMed]
  75. CrystalStructure v4.3.0; Rigaku Americas: The Woodlands, TX, USA; Rigaku Corporation: Tokyo, Japan, 2018.
  76. Chiang, Y.W.; Borbat, P.P.; Freed, J.H. The determination of pair distance distributions by pulsed ESR using Tikhonov regularization. J. Magn. Reson. 2005, 172, 279–295. [Google Scholar] [CrossRef] [PubMed]
  77. Worswick, S.G.; Spencer, J.A.; Jeschke, G.; Kuprov, I. Deep neural network processing of DEER data. Sci. Adv. 2018, 4, eaat5218. [Google Scholar] [CrossRef] [Green Version]
  78. Hogben, H.J.; Krzystyniak, M.; Charnock, G.T.; Hore, P.J.; Kuprov, I. Spinach-a software library for simulation of spin dynamics in large spin systems. J. Magn. Reson. 2011, 208, 179–194. [Google Scholar] [CrossRef]
  79. Giannoulis, A.; Cordes, D.B.; Slawin, A.M.Z.; Bode, B.E. A Low-Spin Co(II)/Nitroxide Complex for Distance Measurements at Q-Band Frequencies (Dataset); University of St Andrews Research Portal: St Andrews, UK, 2022. [Google Scholar] [CrossRef]
  80. Scarpelli, F.; Bartucci, R.; Sportelli, L.; Guzzi, R. Solvent effect on librational dynamics of spin-labelled haemoglobin by ED- and CW-EPR. Eur. Biophys. J. 2011, 40, 273–279. [Google Scholar] [CrossRef]
  81. Kuzhelev, A.A.; Krumkacheva, O.A.; Ivanov, M.Y.; Prikhod’ko, S.A.; Adonin, N.Y.; Tormyshev, V.M.; Bowman, M.K.; Fedin, M.V.; Bagryanskaya, E.G. Pulse EPR of Triarylmethyl Probes: A New Approach for the Investigation of Molecular Motions in Soft Matter. J. Phys. Chem. B 2018, 122, 8624–8630. [Google Scholar] [CrossRef]
  82. Bahrenberg, T.; Rosenski, Y.; Carmieli, R.; Zibzener, K.; Qi, M.; Frydman, V.; Godt, A.; Goldfarb, D.; Feintuch, A. Improved sensitivity for W-band Gd(III)-Gd(III) and nitroxide-nitroxide DEER measurements with shaped pulses. J. Magn. Reson. 2017, 283, 1–13. [Google Scholar] [CrossRef]
  83. Bretschneider, M.; Spindler, P.E.; Rogozhnikova, O.Y.; Trukhin, D.V.; Endeward, B.; Kuzhelev, A.A.; Bagryanskaya, E.; Tormyshev, V.M.; Prisner, T.F. Multiquantum Counting of Trityl Radicals. J. Phys. Chem. Lett. 2020, 11, 6286–6290. [Google Scholar] [CrossRef]
  84. Reginsson, G.W.; Kunjir, N.C.; Sigurdsson, S.T.; Schiemann, O. Trityl Radicals: Spin Labels for Nanometer-Distance Measurements. Chem. Eur. J. 2012, 18, 13580–13584. [Google Scholar] [CrossRef]
  85. Akhmetzyanov, D.; Schops, P.; Marko, A.; Kunjir, N.C.; Sigurdsson, S.T.; Prisner, T.F. Pulsed EPR dipolar spectroscopy at Q- and G-band on a trityl biradical. Phys. Chem. Chem. Phys. 2015, 17, 24446–24451. [Google Scholar] [CrossRef] [PubMed]
  86. Giannoulis, A.; Yang, Y.; Gong, Y.J.; Tan, X.; Feintuch, A.; Carmieli, R.; Bahrenberg, T.; Liu, Y.; Su, X.C.; Goldfarb, D. DEER distance measurements on trityl/trityl and Gd(III)/trityl labelled proteins. Phys. Chem. Chem. Phys. 2019, 21, 10217–10227. [Google Scholar] [CrossRef] [PubMed]
  87. van Amsterdam, I.M.; Ubbink, M.; Canters, G.W.; Huber, M. Measurement of a Cu-Cu distance of 26 A by a pulsed EPR method. Angew. Chem. Int. Ed. Engl. 2003, 42, 62–64. [Google Scholar] [CrossRef] [PubMed]
  88. Sameach, H.; Ghosh, S.; Gevorkyan-Airapetov, L.; Saxena, S.; Ruthstein, S. EPR Spectroscopy Detects Various Active State Conformations of the Transcriptional Regulator CueR. Angew. Chem. Int. Ed. Engl. 2019, 58, 3053–3056. [Google Scholar] [CrossRef] [Green Version]
  89. Henderson, I.M.; Hayward, R.C. Kinetic stabilities of bis-terpyridine complexes with iron(II) and cobalt(II) in organic solvent environments. J. Mater. Chem. 2012, 22, 21366–21369. [Google Scholar] [CrossRef]
Figure 1. PDS sequences used in the study: (a) 4-pulse DEER, (b) 5-pulse and (c) 6-pulse RIDME.
Magnetochemistry 08 00043 g001
Scheme 1. Synthetic procedure of precursor 1a and of target complex 1.
Magnetochemistry 08 00043 sch001
Figure 2. Q-band CoII-NO DEER and RIDME on 1 mM solutions of 1 at 15 K. (a) Echo-detected EPR spectrum of 1 at 15 K optimized for the CoII (left) and a zoom-in on the spectral region where pulses were applied (right). The red and blue lines denote the position of the pump and observe pulses of the DEER experiment (setup: observe CoII and pump NO) and the green line denotes the position where RIDME was performed; (b) primary PDS data with the gray line indicating the background decay, (c) background-corrected PDS data with the gray line indicating the fit and (d) distance distributions (black lines) with confidence intervals (gray shadowed areas) and reliability (colored bar below the distance distributions). The various experiments are indicated in the first row and the experimental parameters are given in Tables S2 and S3, Supplementary Materials. The Δ is indicated in (c) top row. Number of scans from top to bottom 15, 44, 1 and 1.
Magnetochemistry 08 00043 g002
Figure 3. Q-band RIDME on 10 μM solution of 1 at 30 K. (a) Primary data with the gray line indicating the background decay, (b) background-corrected data with the gray line indicating the fit, (c) distance distributions (black lines) with confidence intervals (gray shadowed areas) and reliability (colored bar below the distance distributions). The experiments are indicated in the first row and the experimental parameters are given in Table S3, Supplementary Materials. Number of scans from top to bottom 141 and 90.
Magnetochemistry 08 00043 g003
Publisher’s Note: MDPI stays neutral with regard to jurisdictional claims in published maps and institutional affiliations.

