Abstract
We use density functional theory (DFT) calculations to show that oxygen vacancies () and mobility induce noncentrosymmetric polar structures in SrTiFeCoO (STFC, ) with , enhance the saturation magnetization, and give rise to large changes in the electric polarization . We present an intuitive set of rules to describe the properties of STFC, which are based on the interplay between (Co/Fe)- defects, magnetic cation coordination, and topological vacancy disorder. STFC structures consist of layered crystals with sheets of linearly organized O-coordinated Fe–Co pairs, sandwiched with layers of O-coordinated Ti. (Co/Fe)- defects are the source of crystal distortions, cation off-centering and bending of the oxygen octahedra which, considering the charge redistribution mediated by and the cations’ electronegativity and valence states, triggers an effective electric polarization. Oxygen migration for leads to >∼10 µC/cm due to quantum-of-polarization differences between structures. Increasing the oxygen deficiency to yields , the O migration of which resolved polarization for is 3 µC/cm. Magnetism is dominated by the Fe,Co spin states for , and there is a contribution from Ti magnetic moments (∼1 ) for . Magnetic and electric order parameters change for variations of or oxygen migration for a given oxygen deficiency. Our results capture characteristics observed in the end members of the series SrTi(Co,Fe)O, and suggest the existence of a broader set of rules for oxygen-deficient multiferroic oxides.
1. Introduction
Materials that simultaneously possess at least two ferroic orders (ferroelectricity, ferroelasticity, and/or ferro/ferri/antiferromagnetism) are described as multiferroic [1]. The search for such materials has expanded to several classes of systems, of which the magnetic perovskites provide outstanding examples with a wide range of cation compositions and oxygen stoichiometries [1,2,3]. Among transition metal (TM) perovskites, SrTiFeO (STF) and SrTiCoO (STC) both display magnetization that depends on their oxygen content, with typically higher magnetization at higher levels of oxygen deficiency () [4,5,6]. On the other hand, at room temperature, stoichiometric SrTiO (STO) is a nonmagnetic paraelectric. At low temperatures, it presents an antiferrodistortive structural change that suppresses the ferroelectric (FE) ordering, as well as quantum fluctuations that forbid the FE phase transition [7,8,9]. Several mechanisms promote a FE phase in STO [10,11]. For example, the application of electric fields, A-site cation substitution, strain in thin films [12,13] and nonstoichiometric solid solutions have all been proposed to lead to a ferroelectric response [14,15]. Defects such as coupled Sr () and O () vacancies, with interstitial I, anti-site Ti and Sr and their coupling with [16,17,18] have been suggested to promote ferroelectricity in STO with Sr/Ti atomic ratio close to 1 [19]. A-site defects such as can also mediate polar effects in (111)-oriented and (001)-bulk-terminated perovskites based on SrTiO [20,21].
Oxygen deficiency has been used to enhance multiferroicity in PbTiO [22] and ferroelectric switching in Si-doped HfO [23]. Ferroic parameters in YMnO [24] and strained SrMnO [25] could be manipulated by using as well as the ferroelectric response in perovskite-structured relaxors [26]. Multiferroism in oxygen-deficient SrFeO nanoparticles was also studied [27], and the magnetic ordering followed the tendencies of the -modulated magnetism in STF [4], whereas the FE parameter was not clearly associated with the . STF also displays ferroelectricity in nanocrystalline thin-film form with a polarization up to 6 µC/cm depending on the Fe concentration [28]. In addition, a comparable field-driven polarization of up to ∼1 µC/cm was realized in Fe-doped, Ti-rich STO multiferroics at room temperature [29]. In the case of STC, although its FE properties have not been reported, preliminary work [30] suggests that STC could share some FE characteristics with O-deficient STO. STC presents a relatively large band gap and room temperature magnetization [31,32] as well as off-centering features induced by the incorporation of Co [33] or through the Co––Ti distortions [34], which are ingredients of the STO-like ferroicity discussed in this work.
The use of oxygen deficiency as a tool with which to tailor ferroic order parameters requires a profound knowledge of the roles of the defect density and vacancy distributions, ABO cation symmetry and ratio, as well as of the TM electronic features such as valence states, radii, electronegativity, stabilizing hybridizations, and occupancies [4,5,34]. Although physical/chemical synthesis is able to control several of these factors [4,34], obtaining specific polarization/magnetization values requires theoretical and simulation insights that can help both to narrow the large parameter space of stoichiometries and compositions to achieve useful properties and to understand the microscopic mechanisms that underlie the origin of such ferroic orders in oxygen-deficient perovskites. In this work, we theoretically explore the perovskite SrTiFeCoO (STFC) [34] from three perspectives: the effect of different values with several distributions for each ; substituting B cations with Fe and Co in distinct configurations, and modulating the TM spin states among the possible valance states and spin polarizations. STFC-based systems have been experimentally studied in the context of oxygen transport in membranes [35], electrical conductivity in energy applications and memristors [36], as well as oxygen electrodes for solid oxide cells [36,37]. The ferroelectric features of STFC have not been addressed, although there are indications of multiferroicity in this versatile material as we shall show here.
In Fe-substituted STO, the saturation magnetization can be modulated, and ferroelectric properties are induced for low x values (Fe, ) [4,29]. STF tends toward stable antiferromagnetic solutions for low and high values, whereas Co-substituted STO is predominantly ferromagnetic for low O deficiencies without a Fe substitution (Co, ) [4,5,6,38]. The STC band gap increases with , with presumably small but finite electric polarizations [5,30]; STFC presents an oxygen deficiency-modulated band gap that is maximum at intermediate along with the saturation magnetization [34]. On the other hand, SrFeCoO, without the nonmagnetic role of Ti, is able to display voltage-tuned magnetic response [39], which for low z values also displays multiferroicity [27]. All these factors suggest that Fe/Co-substituted STO could combine magnetic and ferroelectric order parameters within a realizable range of oxygen deficiency. Moreover, STFC could help to better understand the role of in the triggering of multiferroic behavior. That is, mechanisms known so far for proper or/and improper ferroelectricity [1,2,3] do not seem to completely account for several features of oxygen-deficient ABO. Therefore, computational engineering of oxygen-deficient compositions could show us one path toward designing room-temperature multiferroics. Furthermore, studies of order and coordination of TM cations have recently given new insights into multiferroic properties [4,5,34,39,40], voltage decay in Li-ion batteries [41,42], oxygen diffusion in strained oxides [43], and ordering in niobium–tungsten complex oxides [44], pointing to the importance of the local cation order in these materials.
In this work, we primarily focus on the ferroelectric and magnetic response of oxygen-deficient STFC. We demonstrate this by using density functional theory (DFT) calculations that oxygen vacancies () in SrTiFeCoO with induce noncentrosymmetric polar structures, which support large electric polarization changes through migration and/or O-deficiency changes that are compatible with a robust magnetization. We explore a variety of configurations and show how varies within ∼23 µC/cm for the lowest-energy structures, with systems displaying the highest resolved polarization differences. Our results capture key aspects of recent results on Fe–Co-substituted STO, and give a further insight into the electronic and structural mechanisms that would enable the realization of multiferroics by using specific defects and/or cation distributions in ABO.
2. DFT Modeling
Spin-polarized DFT calculations were performed by using the Vienna Ab-initio Simulation Package (VASP 5.4) [45] within the projector-augmented wave (PAW) method [46] and with an energy cutoff of 500 eV. k-point grids of for relaxation calculations as well as k-points for static calculations were used. The valence electrons included in the chosen pseudopotentials for Sr, Ti, Fe, Co, and O are , , , , and , respectively.
All ions and supercell parameters were relaxed until atomic forces were below 0.05 and 0.01 eV/Å, for large and intermediate values, respectively. Oxygen-migration barriers were computed by using the nudged elastic band (NEB) method [47], with forces converged below 100 meV/Å and energies below eV. The generalized gradient approximation (GGA) within the Dudarev approach for the -corrected Hubbard model (GGA+U) was used for the d electrons of the TM [48].
The U values used here for Fe, Co, and Ti are 3, 9, and 8 eV, respectively, and were chosen based on an extensive search for lattice parameters, local magnetic moments, and band-gap behaviors that would best represent end members SrTiO, SrFeO and SrCoO, as well as the intermediate solutions SrTiFeO and SrTiCoO with [4,5] (Figure A2, Figure A3 and Figure A4); such U values also partially capture distinctive features concluded from hybrid calculations for STFC [34], and are used here to also calculate the oxygen-migration barriers and paths. For the purpose of validating our ferroelectric calculations with GGA+U, we performed additional calculations by using the screened hybrid Heyd– Scuseria–Ernzerhof (HSE06) functional [49] with and k-points grids, for a selected set of states, and results are presented in Appendix E.
The electric polarization was calculated by using the Berry phase approach [50]. In this work, we do not consider the ferroelectric response if the systems are metallic systems [51,52]. Instead, screening based on the formation energy of the defective structures is used to narrow the configurations to the more interesting insulating states. The calculations involving the Berry phase theory were done with the implementation provided by VASP [50], and the quantum-of-polarization space analysis, which is discussed in section IV, was performed with homemade software. The pre- and post-processing of data required for this work were performed with VESTA [53], CrystalMaker® [54], and pymatgen-based programs [55].
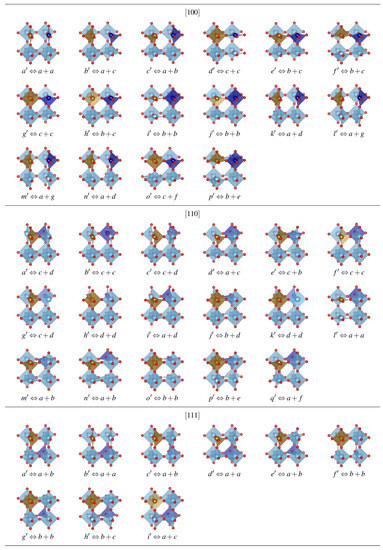
SrTiFeCoO prototypes were modeled by using supercells, with the pair of Fe–Co ions aligned along [100], [110], and [111] directions, as shown in the upper panel of Figure 1a. Once the three configurations were analyzed, which is done by testing all the valence states admissible for the TM stoichiometry and the possible spin polarizations, are created by removing one () or two () oxygen atoms out of the relaxed systems, and the resulting structures are grouped following a symmetry analysis of the configuration space with a tolerance of between 10–10Å. For , such an analysis leads to seven nonequivalent O-deficient configurations for [100] and [110] TM alignments. The [111] alignment has three configurations, all of them shown in Figure 1a. In the case of , there exists a total of 156 nonequivalent double-vacancy structures. For each configuration, we have again considered all the atomic valence states, which are reflected in several possible high and low Pauli states for the TM, as well as the possible combinations for the ferromagnetic (FM) or antiferromagnetic (AFM) Co–Fe exchange coupling. This FM/AFM notation that we have used is plausible in the sense that our DFT methodology uses periodic boundary conditions to construct the crystal out of the supercells in Figure 1; however, for nonuniform distributions of Fe and Co ions, these orderings would be just locally correct. Fe and Co magnetic moments generally differ in magnitude, such that in the AFM alignment the system has a finite magnetization (i.e., it is strictly speaking ferrimagnetic); nonetheless, we retain the notation AFM for sake of simplicity. The valences of the cations are such that we maintain a neutral supercell for a given oxygen deficiency, and charged defects are not considered because our calculations suggest spontaneous charging of the is negligible, even for an excess or deficiency of electrons, in agreement with hybrid simulations [34]; therefore, a charge background is not used [56]. We initialized the systems with those combinations, and then relaxations without magnetic constraints were performed [5].
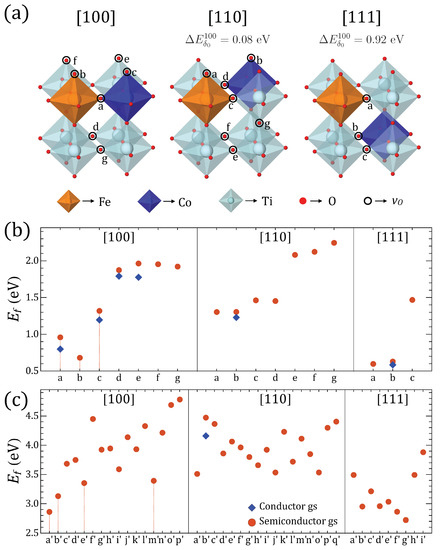
Figure 1.
(a) Fe–Co arrangements in a perovskite cell and positions for . difference with [100] configuration. (b) Formation energies for the ground state (GS) found for all in the three Fe–Co configurations for , and (c) for ; positions are labeled with letters as defined in Figure A1 of the Appendix A. Solutions marked with vertical lines, a, b, c (), and , , , and () are used for subsequent analysis.
Although O deficiency is commonly observed in experiments, a path to use it to selectively enhance ferroic parameters is still unknown. The data obtained in this work provides insight into a general approach. We consider materials that favour large local magnetic moments, which implies states with at least one coordinating either a Fe or Co cation, as this favors high-spin states [5,34] and therefore a larger magnetization per unit cell. This constraint narrowed our configurations down to 59 structures which are displayed in Figure 1 and Figure A1. We then analyze their formation energies, remembering that although for STC and STF the , , and alignments of the Co or Fe ions display energetically distinct states for the same magnetic saturation [4,5,6,34], and that for most cations the chemical potentials are equal to the DFT ground-state energies, for some elements at T = 0 the ground state (GS) is inadequate as a reference state and corrections to the energies should be made (e.g., to elements with structural phase transitions below room temperature (Ti, Na, Sn), diatomic gases (O), and elements subjected to +U corrections [57]). Moreover, different coordination numbers due to vacancy distributions are related to the ionic radii, which in turn can be related to various valence states; therefore, comparing the Equation (1) results is more appropriate than total energy comparisons. The expression for the formation energy is
where is the total energy of the defective crystal after relaxation, and is the total energy of the crystal corresponding to . is the number of removed oxygen atoms, and the chemical potential with respect to [58]. The energies obtained with Equation (1) are also corrected by using the fitted experimental enthalpies, as GGA/PBE calculations for tend to suffer from overbinding errors [59,60]. The resulting energies are presented in Figure 1 according to the respective orientations of the Fe–Co pairs i.e., along [100], [110], and [111] crystalline axes.
In what follows, we use the data in Figure 1 to evaluate the ferroic order parameters of STFC by using a representative set of states that are selected as described below. The ferroic order parameters are compared in terms of the oxygen deficiency , and for each an oxygen-migration analysis connecting the lowest-energy vacancy states is performed in search of those insights that lead us to further understand how to design a multiferroic perovskite by controlling its oxygen content.
3. Results
3.1. Representative Configurations
The results of the evaluation of Equation (1) for the remaining ground states (GSs) described in the previous section are depicted in Figure 1 panel (b) for and panel (c) for . Although most of the GSs are semiconductors, there are few configurations which posses a slightly lower energy semi-metallic solution among the several possible initializations mentioned above. In those cases, we have shown both solutions for the sake of illustration, although the lowest energy solution for what turned out to be the most representative Fe–Co crystal arrangement is a semiconductor state in either or cases. Moreover, TM cations, such as the magnetic Fe and Co, are able to accommodate a wider range of spin states than their diamagnetic counterparts; therefore, any response of the valence states to oxygen content could also lead to hopping conductivity [61]. Mobile charges would screen out the electric polarization, limiting the ferroelectric response; therefore, we focus on the semiconductor states, which were also compared to the GSs from hybrid DFT calculations [34], and allow us to evaluate the electric polarization within the Berry phase approach.
Considering the results of Figure 1, a preference for the to be coordinated by [100]- and [111]-oriented Fe–Co pairs is observed, as Ti–Ti coordinated vacancies tend to have significantly higher . This is consistent with the preference for at least one O uncompleted octahedral site hosting Co and Fe ions, reducing the number of configurations to be analysed. However, the total energy differences between configurations with [100]-oriented Co–Fe and the other two orientations for and deficiencies is at least ∼ 0.6 eV and ∼ 0.7 eV, respectively, when comparing [100] and [110], with even larger differences for [111]. Moreover, the energy differences between Fe–Co pairs favor [100]-configurations by ∼0.1 vs. [110] and ∼0.9 eV vs. [111], as Figure 1a shows.
We comprehensively analyzed the magnetic/electric order parameters of the three lowest-energy GSs of O-deficient structures with the [100] Fe–Co arrangement and as pointed out in Figure 1 (vertical lines). In the case of the same cation arrangement for , we analyzed the three lowest GSs plus a fourth GS that is energetically closest to the other three states, as also depicted in Figure 1. The structural and magnetic properties of these perovskites are described in Table 1. The system relaxes to FM ordering in the global GS with spin gaps below ∼20 meV of AFM orderings in P1 and P4/mmm symmetries for and , respectively. P1 has the lowest symmetry due to the oriented perpendicular to the Fe–Co alignment, which is responsible for the larger unit cell (UC) volume with respect to P4/mmm. The Fe and Co ions are stable as high spin states for and , and the magnetic moment/UC slightly increases from to , as both Fe and Co are sandwiched by a vacancies in . The band gap also increases significantly for any compared to any solution. FM and AFM orderings compete among GS solutions depending on the number and location of with respect to the Fe–Co pair. These results are in partial agreement with hybrid calculations [4,5,34].

in our analysis is not significantly affected by magnetic interactions between vacancies and the periodic boundary conditions images as suggested by HSE calculations in STC and STFC [5,34] i.e., as we shall discuss later, distributions of interest seem to promote ferroelectric states partially because of the tendency of the (d-p) orbitals to localize into lower symmetry structures while the degeneracies are broken principally by breaking Hund’s rules [62,63], as suggested by the predominance of high spin states. Oxygen-mediated phase separation and nonnegligible defect interactions have been observed in similar materials and have been associated with negative or negligible [64]; the stoichiometry and defect configurations analysed here do not suggest the occurrence of that phenomena in STFC.
The rest of this paper is focused on the differences in electrical polarization between the structures illustrated in Figure 2. Global GSs, as well as higher energy solutions, are considered so that magnetization and structural changes can be compared more generally along with the electrical polarization behavior.
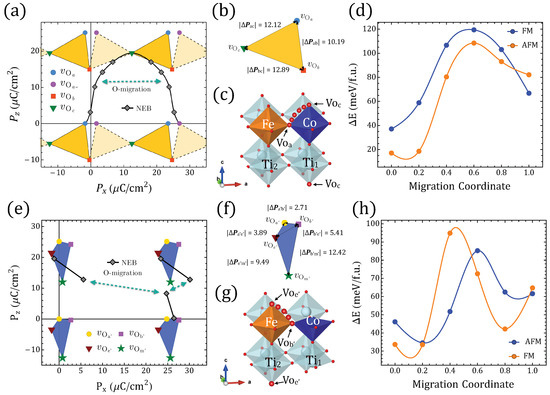
Figure 2.
differentiated polarization within the Berry phase approach. (a) between in Table 1. Symmetrical x-axis for (dashed) is also shown. (b) The sides of the triangles represent the minimal for the respective end-states in the inset frame; the values are shown on each side. (c) STFC supercell with O migration between ⇔ ( fingerprint shown in (a)). (d) Energies relative to the gs along the ⇔ migration for FM/AFM alignments ( migration coordinate ; migration coordinate ). (e–h) The same information as presented in (a–d) but involving instead in Table 1 and the migration ⇔ ( migration coordinate ; migration coordinate ).
3.2. Electric Polarization and O Migration
The electric polarization order parameter is defined as follows:
with and the ionic and electronic contributions respectively, which are given by
where we have summed over the occupied n bands, and the ionic contribution is defined by the charges of the atomic nuclei and their positions in the UC. The are the reduced polarizations, i.e., the components of the polarization along the primitive lattice vectors, which in terms of the reciprocal lattice vectors have the form
However, as the Bloch functions used to evaluate the Berry connections are not unique [65,66,67,68], two different sets of periodic functions follow the relation
where is an integer. Hence, the electric polarization can be expressed as
with a lattice vector. This result implies that the polarization is well-defined just up to the modulus of the quantity (i.e., all the points defined by Equation (7) are valid solutions to Equation (2)). The quantity separating two different polarization values is called the quantum of polarization
This quantum is subject to the indeterminacy introduced by the freedom to choose the atomic base for a periodic lattice of point charges. Moreover, is invariant to unitary unit cell translations for which moving the origin of coordinates is not generally a way to resolve the multiple polarization values as would be the case if the total polarization was a well-defined basal property. This leaves us with a property that can be found from a lattice of polarization, the different components of which along the lattice vectors are expanded by , such that . is only determined within such a quantum uncertainty; hence, the process of resolving the polarization requires evaluation at intermediate steps connecting the end structures of interest; this will result in branches of polarization separated by quanta as displayed in Figure 2 [65,66,67,68]. Some of the processes that can be used to generate intermediate linking structures are ionic displacements, defect migration, applying strain, and/or inducing structural changes with pressure or external fields [65,66].
Let us discuss now the evaluation of for the systems in Table 1. Figure 2a,e reveal the values of the electrical polarization lattices in STFC for and , correspondingly. In order to obtain the change in the polarization, which is the more meaningful quantity from an experimental point of view, we compared the lowest GS by using the lattice of polarization given by the different solutions, and in that lattice the figures formed by joining the points associated with each defect configuration will have sides of magnitude equivalent to . Our first observation is very promising: Figure 2a for shows that O-deficient STFC perovskites can have sufficiently noncentrosymmetric polar structures to yield outstanding values. Figure 2b enlarges the smallest possible changes in polarization, within uncertainty, which occurs when the system transitions from to (i.e., 10.19 µC/cm); by comparing - or -, we obtain 12.89 µC/cm and 12.12 µC/cm, respectively. These values are in the range of the polarization of known ferroelectrics [1,2,69].
To resolve , we find the values of the polarization between the end points defining two different structures in Table 1. Those values connect two vertices that might be separated by different , in which case values would be larger than the ones mentioned above, and would capture features associated with electronic structure changes that differentiate those ground states. Structural deformation due to oxygen diffusion could lower the symmetry and lead to large lattice-parameter changes as in strained/pressure-induced ferroic transitions, and charge transfer and redistribution could be mediated by migrating oxygen [4,6,70]. Hence, we analyze the effects of adiabatic oxygen migration by following NEB-relaxed paths [71,72] between selected sites. Figure 2 displays two representative migrations, and Figure A5, Figure A6, Figure A7, Figure A8, Figure A9 and Figure A10 contain additional examples.
Symmetry-equivalent configurations lead to symmetric barriers, whereas migrations connecting energetically different configurations are represented by asymmetric barriers as seen in Figure 2, Figure A5, Figure A6, Figure A7, Figure A8, Figure A9 and Figure A10, which resemble, for example, oxygen diffusion along different O-defined NaBiTiO planes [73]. In our case, for instance, symmetric have the z–y plane defining as does not change in that rotation, but the local magnetic moments do not change either because neither Fe nor Co coordinations are being modified (Figure A7). The migration barriers for symmetric cases are in general comparable or even larger than nonsymmetric ones, and in the process of tuning the ferroelectric and/or magnetic order parameters, energetically different are most likely to be involved in an oxygen-driven structural accommodation, which leaves us with the migrations to/from or if we restrict for sake of comparison to approximated to the separation between the lowest and the second-lowest GS. We display in Figure 2a the continuous polarization footprint of a system in which an oxygen moves from the Fe–O–Co position to the in and back to the in along the path illustrated in Figure 2c. Moreover, in Figure A8 the results for migration between a and b are shown.
In the migration from to the semiconducting character of the system is preserved throughout the intermediate migration states independently of the spin polarization, and it has a y-reflection symmetry and thence provides -centered solutions for the polarization. The FM path requires slightly more energy than the AFM one although it is lower in the vicinity of the end point Figure 2d, which means it would require around the spin-gap energy difference to maintain the material as a semiconductor throughout the whole path. The magnetization/UC would decrease because of the change in magnetic order rather than due to a decrease in the local magnetic moments observed in the FM path (Figure A5), which is also related to the steepest decrease of the energy band gap in this last path as TM orbital occupancy is slightly increased; such magnetization is nonetheless of considerable magnitude ∼1 . The electric polarization on the other hand is now not restricted to the closest values within the lattice, such that for - vacancy switching would reach ∼24 µC/cm.
Figure 2e presents the values of the electric polarization components as well as the values between the structures in the same way that Figure 2a does for but using instead the four structures in Table 1. We can also see the electric polarization fingerprint for the adiabatic O migration of the Fe–O–Ti oxygen perpendicular to the Fe–Co line in to the Fe––Co in , leading to , as Figure 2g illustrates. As we compare figures (b) and (f), it is clear that lowest energy GS for provides a smaller than those obtained with . We have to take into account an energetically expensive fourth GS in order to reach similar polarization values with two vacancies (e.g., differences between the first two GS configurations for and are 10.19 µC/cm and 2.71 µC/cm, respectively); this is a persistent trend among O-deficient perovskites in Figure 1. This leads to the observation that connected polar end structures for yield larger than those obtained for .
A second observation is that crystals with such increased yield differences that are more sensitive to the symmetry and are consistently larger when, among the three energetically lowest , the two compared configurations share a c vacancy. In contrast, sharing no vacancies or sharing a vacancies leads to lower changes of polarization. The inclusion of g vacancies always increases the changes of the polarization but, unlike the result for the lowest three GSs, it will favor the duplicity of the a defects. The energy barrier for between and also shows an energy difference between FM and AFM polarizations, which favors the AFM polarization throughout the migration path in terms of energy, but the spin gap is again relevant in the vicinity of the Fe–O–Ti oxygen position. A third general observation that we can extract from Figure 2, Figure A5 and Figure A6 is that for it is possible to find an oxygen migration linking two distinct configurations in Table 1 (or their symmetrical representations), which could generate a finite through a continuous polarization footprint connecting the end states. For , however, such a polarization footprint presents a nonmonotonic path due to polarization jumps of magnitude comparable to the differences in polarization between the GS configurations for and within the first . Whereas for , uncompleted paths could be found (e.g., when some of the intermediate states turned out to be metallic), in the case not just all the end states are semiconductors, but they remained as such when disturbed by the vacancy relocation. Therefore, the polarization can always be defined but not always be fully resolved. A change in the branch separating the available end solutions of the electric polarization should always consider at least the closest one as is evident, for instance, in Figure 2e, where the migration path suggests two different that are different from the one in Figure 2f (i.e., C/cm and ∼21 µC/cm, as seen in Figure 3 at ). In the following section, we will discuss these jumps of polarization along with several other features of the magnetic/electric response of our oxygen-deficient perovskites.
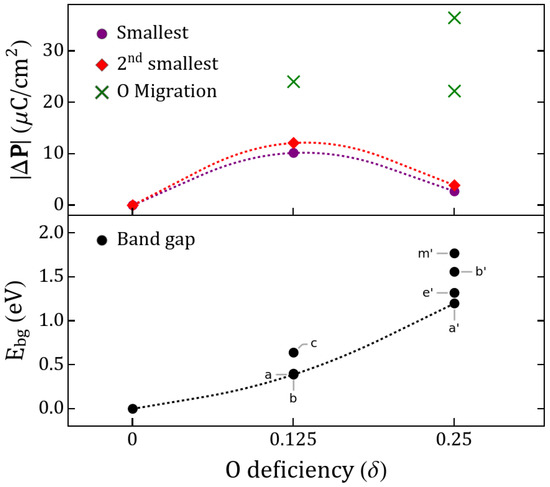
Figure 3.
(Top panel) Polarization changes between studied configurations and (bottom panel) band gap. The lowest two at each (dashed lines) are shown. obtained from migrations shown in Figure 2a,b are marked with crosses. Band gaps shown for and correspond to the lowest-energy semiconductor states of Table 1.
The results so far show that the O-deficient STFC is indeed electrically polarized, as well as magnetic, and can display a significant change of electric polarization by tuning the oxygen vacancy content and/or transporting oxygen while maintaining the crystal among the stable solid solutions along paths with various energy barriers depending on the magnetic configuration of the end states. Furthermore, we have shown that FM or AFM ground states have a different saturation magnetization that provides the material with two field-tunable order parameters. The relation between the magnetic and ferroelectric behavior according to the role of TM cations (Co/Fe), migration paths and the structural and electronic trends will be discussed in the next section along with an intuitive picture of the effect of varying oxygen pressure during growth to obtain a specific multiferroic response of the material.
4. Discussion
The polarization changes have been discussed in terms of oxygen diffusion, which may be controlled electrochemically (e.g., by ionic liquid gating or oxygen pumping), or it may be driven by temperature fluctuations or strain effects. This provides the possibility of direct control over the polarizability of such materials post-growth, as well as via the oxygen pressure during growth. In Figure 3 we show that although the centrosymmetric stoichiometric solutions do not predict a switchable polarization, increasing the deficiency of the perovskite yields polarization changes that are larger for and decrease for . However, in both cases a migration mechanism can improve upon such a value, providing us with at least twice the initial response for one and up to ∼4–6 times for two . The largest attainable, according to our calculations, likely requires vacancy migration. This mechanism has been widely studied in solid perovskite fuel cells, perovskite-based capacitors, solid electrolytes and all-oxide electronics [74,75]; however, its use in multiferroics as a mechanism to assist ferroic-order is unexplored.
Considering the GS, Figure 4 suggests the magnetization follows a similar behavior as the changes of the electric polarization when increases. However, if migration occurs, for instance for between a and c, the magnetization would decrease considerably while the electric polarization switches. On the other hand, when oxygen migrates between a and b sites, the magnetization will slightly decrease while the change of the polarization cannot be determined as the system becomes metallic at intermediate points of the migration. For the migration in Figure 2e,f at , we will have an inverse change in , increasing when relaxing from to , while the magnetization/UC decreases. This magnetization behavior qualitatively replicates the experimental magnetization trends of STF [4]. The maximization of both polarization and magnetic moment in some of the cases is intriguing considering the effect of 3D occupancy in perovskites, i.e., partly filled 3D orbitals promote magnetism but disfavor FE [1,2].
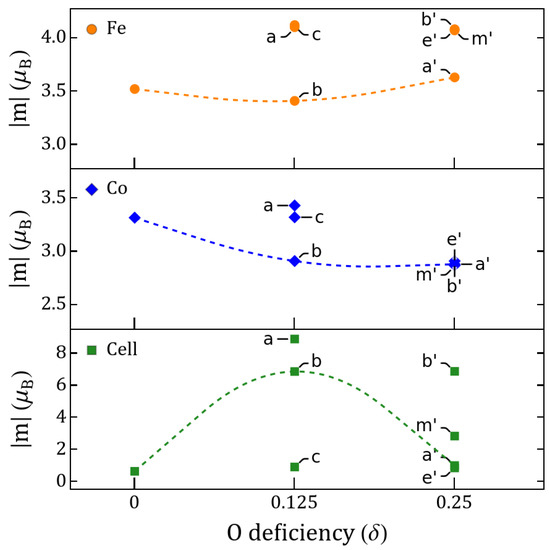
Figure 4.
Fe/Co and cell magnetic moment vs. . Values shown for and correspond to the lowest-energy semiconductor states of Table 1.
Let us now analyze the roles of Co and Fe during oxygen migration. Comparing vacancies a and c for , Figure 4 shows that the largest change of the magnetic order parameter is not due to a change in the electronic occupancy of the TMs as the vacancy moves between Fe–O/Fe–O and Co–O, but to the magnetic switching between the two energetically close GSs. The Co has a very small change of its magnetic moment compared to solutions, whereas Fe has increased more appreciably for , being then responsible for any effective saturation magnetization of the c solution. Figure 5 displays the differences between the electronic occupancy of Co/Fe and the cation polarization, which is driven by the rotation of the in the Co–O with respect to the Fe–Co line as Figure 6 also illustrates. In Figure 7, we can see that such vacancy interchange will modify the total and d-orbital charges of the Co even though it remains in an uncompleted oxygen octahedral coordination, due to the larger electronegativity of Co with respect to Fe. In addition, the smaller changes for Fe still give rise to a slightly larger increase of the local magnetic moment, which is a sign of an intrinsic charge reorganization among the hybridized orbitals of the Fe–O–Co bonding.
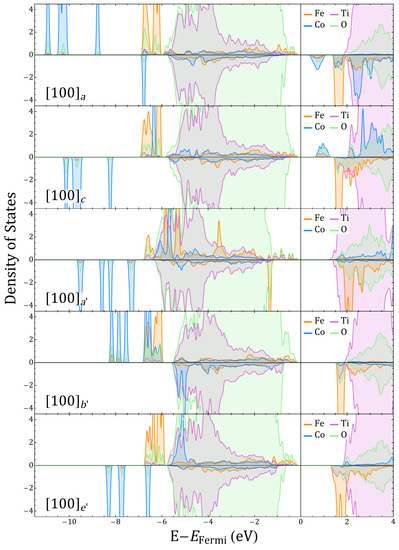
Figure 5.
Fe, Co, Ti, and O projected density of states (DOS) for and corresponding to and , respectively.
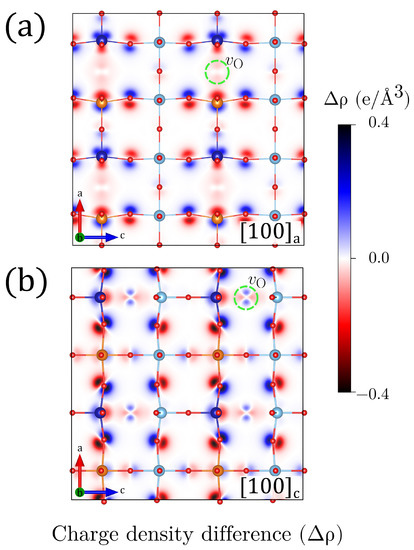
Figure 6.
Projected charge density difference (in a unit cells projection), with the respective charge densities, for (a) and (b) configurations. Charge accumulation/depletion (positive/negative ) is represented by using blue/red colors. A green-dashed circle has been used to highlight the local position (one out of four is displayed).
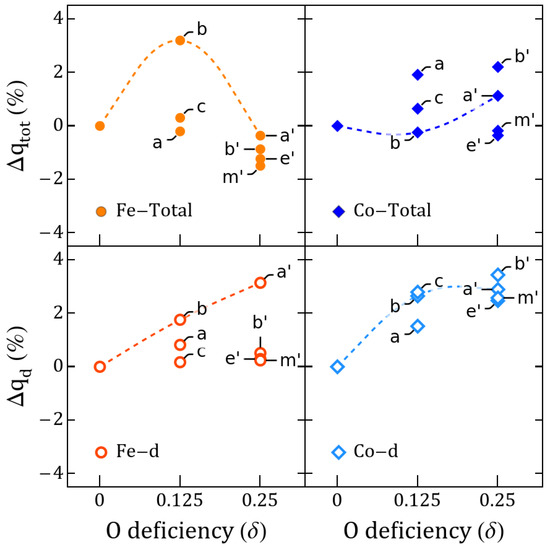
Figure 7.
Total and d-orbital Fe/Co charge variation vs. with respect to perovskites. Values shown for and correspond to the lowest-energy semiconductor states of Table 1.
Figure 6 shows density charge differences of a and c for with respect to the nonoxygen-deficient system. These representations, which are calculated for defective structures with the same symmetry as in Table 1, provide a simple but powerful insight about the origin of the electric polarization in the perovskites. The resulting structures are noncentrosymmetric and have off-centered Co and Fe cations as well as Ti ions. The uncompleted Fe/Co–O octahedra present local bending with respect to the plane perpendicular to the Fe––Co and Ti––Co directions that is reflected in tetrahedral lattice distortions.
The symmetry of the charge density suggests that the creation of the oxygen vacancy has promoted a subtle charge redistribution that is more evident in the case of Co cations as they present a larger change of local charge. Fe and Co coordinations also show distinct characteristics beyond the ionic radii changes that are triggered by the 3d-2p hybridization of the TM at the Fe–O and Co–O centers, as also suggested by the projected density of states in Figure 5 and Figure A11. One of the signatures of the Fe and Co behavior can be seen in Figure 5. For Co, hybridization defines the acceptor-like states delimiting the band gap whereas half-filled Fe states form the Fermi limit of the valence band. For , the additional electrons partially occupy the acceptor states, increasing the gap and proving the propensity of Co to fill 3D orbitals under variations of charge, whereas Fe orbitals tends to reach high-spin states so that the closest empty state has always opposed polarization to the majority populated states. These features are useful ingredients for the generation of a material whose ferroic degrees of freedom do not exclude each other.
With the introduction of a second vacancy, which for the sake of comparison is either a, b, or c, we know that the minimal electric polarization changes tend to decrease. could maintain an FM magnetization, whereas presents an AFM coupling with nonzero magnetization as the Co and Fe local moments change. Figure 7 shows that the additional c- mimics what happens with , and Fe decreases its charge even further, whereas Co does the opposite for . This is consistent with the fact that we have Co–O and Fe–O octahedra (b and c are the second and third GSs for as well as and for , respectively, these last differing in the vacancy switching ). The change in Co d-occupancy are favored, but, unexpectedly, the change for Fe is negligible. Comparing c to , Fe–O converts to a Fe–O without a Fe-n–Co, which for favors a change in d-occupancy of Co. Compared with Figure 4 and the projected density of states in Figure A11, it is clear then that the Fe/Co te electron population is no longer defining the saturation magnetization alone. The previously magnetically neutral Ti are able now to play a role by contributing with a magnetization equivalent to one electron, as seen in Figure A6, where the magnetization originates on the O-coordinated Ti for Co––Ti in and Ti for Fe––Ti in .
Ti for instance, as seen in Figure 2 and Figure A6 for migrations between and , passes from zero to a finite halfway along the migration path; Ti behaves in the opposite manner. This happens when the Co coordination passes from O to O whereas the Fe coordination remains O. In this last configuration, a Co–O–Ti 3d-2p hybridization turns Ti off with that additional Co charge as Figure 7 and Figure 5 show. When oxygen migrates to form a, the Ti octahedra can intuitively be thought of as having a charge transfer process in which Ti now has a similar hybridization to that described for Fe–O–Ti, with the Ti now in an uncompleted Ti–O. This magnetization process of Ti ions through hybridised orbitals represents a process in which an electron is given and received due to the different electronegativities and electronic valences, as well as to the local defect topology with respect to the neighboring TM cations. It differs from what happens in vacancy-induced magnetism in SrTiO [7], as in that case nonfilled 3d-Ti orbitals can locally define the magnetization. The Ti magnetic activation in and is then due to a superexchange-like mechanism between those ions that is dominated by the Co and Fe electronic environmental response to the .
Figure 8 gives a pictorial description of the charge transfer due to the relocation of the vacancies, which is equivalent to the change in the TM octahedral coordinations. In the case of the migration in Figure 2 the Fe and Ti remain in 5 coordination but Co and Ti change from 4 to 5 and 6 to 5 coordination, respectively. A Ti coordination changed by 1 means that an effective electron charge loss or gain, which means a change in Ti magnetization. On the other hand, the change in the local magnetic TM will change the TM valence spin state. An effective variation in the Ti will result from the hybridizations, as the covalent character of the Co/Fe–O–Ti persists. The initial polarization of the Ti ions with respect to the magnetic cations follows the magnetic description here and in references [4,5,34], which puts the Ti ions with a different polarization with respect to Co–Fe FM coupling and the opposite of that for AFM coupling. The magnetic solutions for the crystal images in between the end states will simply switch, as can be seen in Figure A5 for all the migrations. This behavior just described is common among all the systems we handled in this investigation.
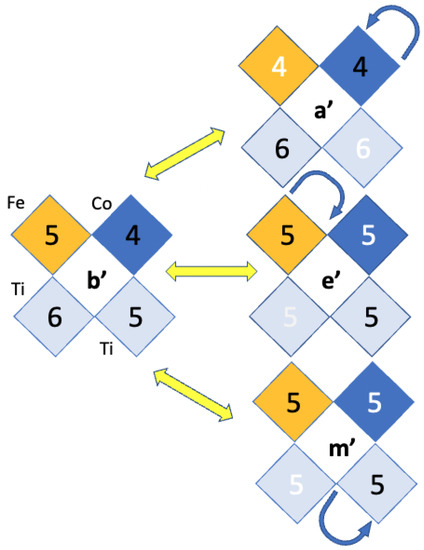
Figure 8.
Coordinations of the Ti, Co, and Ti ions as the migrations connecting with , , and occur. Arrows point out the vertex between which the oxygen move starting in this case, e.g., from . Black numbers represents O coordinations that do not change from to any other configuration whereas white ones have changed by 1.
Figure A5, Figure A6, Figure A7, Figure A8, Figure A9 and Figure A10 show that migration barriers in STFC range between ∼40–130 meV/f.u., with the lowest values obtained for migrations involving “excited” vacancies coordinating Ti ions. Comparatively, some of the previously calculated barriers for STO are around ∼50 meV/f.u. [76]. Our energy barriers indicate the possible costs of an oxygen mobility process. They are measured with respect to the global GS in Table 1 and connect end states that can have slightly different symmetries. Features such as the small well-like steps separating the large barrier from the stable GS are attributed mostly to the relaxation of the O uncompleted octahedra, whose bending with respect to the Co/Fe- line changes during the migration. O undergoes an initial rigid rotation before the planes perpendicular to the (Fe/Co)- bend. This asymmetric energy landscape resembles the trapping effect in Gd-doped CeO [77] which, however, can be tuned through oxygen vacancy migration. Pronounced features, which reach negative energy in a few cases, represent the instability of the intermediate states when a conductor–semiconductor transition is possible, as Figure A8 shows. Although the final path of the oxygen could lead the ions into otherwise interoctahedral space, as displayed by the z-(x, y) solutions for the NEB coordinates in Figure A7, this is not really an interstitial diffusion phenomenon, as observed in electrolytes under strain [78] or in promotion of TM shifting/diffusion through migration in bulk LiNiO [79]. In this last case, and in our STFC, there is always a spin polarization solution that keeps the system semiconducting. In general, oxygen migration between O sites depends on the pathway and the coordinating A(B) ions for the end-. We have three different B ions stabilized in different spin states, so we expect our systems to mimic a variety of features for the migration barriers as described for O diffusion in NaBiTiO [73]. The changes in ferroic order parameters still depend upon the full relaxed GS.
Lattice distortions in Figure 6 and Table 1 suggest that for configurations could be enhanced by lattice strain, which is useful if we were to use strain mechanisms to tune the migration barriers while conserving specific symmetries for the defective end structures [78]. The structural effect of vacancies can itself produce or suppress polar structures, e.g., has a P4mm structure without inversion symmetry along the Fe–Co direction whereas has a Pmm2 orthorhombic structure. They both represent a finite change of the electric polarization as seen in Figure 2. In the GS case for , the inclusion of a second in O–Fe––Co reestablishes the inversion symmetry and as a consequence the polarization decreases. Nonetheless, any still requires a nonzero band gap. Although systems are semiconductors, the migration paths in Figure 2, Figure A9 and Figure A10 seem to be unable to completely resolve , even when such semiconductor behavior remains in the intermediate structures. This is because of the jumps in the polarization fingerprint, which follow the charge transfer that separates the two end states, as Figure 5 and supplementary figures illustrate. A denser grid of intermediate structures would still have some jumps in the path as charge is redistributed into ions that are in generally not symmetrically equivalent, which are responsible for the largest part of the polarization change. The magnetization could be used to narrow the structural region of imminent electronic transfer by using, for instance, a climbing point technique, but this is beyond the scope of this work.
In our search for the STFC electric order parameter, we have used a semi-local functional that is adapted to the TM nature of the solid solution through the , which, in turn, we fixed to a plausible value after a systematic analysis of the GS and experimental properties of several STO-based magnetic solutions. Nonetheless, it is pertinent to check the robustness of the electric polarization behavior in Figure 2 when we modify . To do this, we have chosen the configurations, as they display similar changes of electric polarization for a given . Then, we tune of Co because among the TM studied here, Co is the species associated with more possible U values. Figure A15 displays the triangles of electric polarization changes as calculated for several . We have kept 5 eV, because lower values can render the system conductive, as suggested in Figure A14. Figure A15a shows that the electric polarization changes do not depend, importantly, on the U value for Co within that range, independently of the vacancy location. Figure A15b displays the same calculations, but in this case using both an HSE functional constrained to the same conditions as in Figure A15a, and a total HSE relaxation, which is then also constrained magnetically. These last figures show a decent agreement between the GGA+U predictions and the HSE ones. That is, the magnitude of the changes of the polarization are similar, and the major differences do not seem to come primarily from the improvements that HSE does by capturing the spin occupancy more precisely, but from its ability to capture slightly better some of those subtle structural changes created by the , which converge differently than the magnetism. A study of the possible magneto-electric coupling in these tentative multiferroic materials would require more sophisticated methods that could provide us with more precise U values for every vacancy distribution, for instance, by using cRPA calculations [80]. On the other hand, the use of oxygen deficiency as a trigger to multiferroic behavior requires us to classify accurately the metallic or semiconductor characteristics of systems that relax to energetically close GSs corresponding to different spin states. Although HSE and similar hybrid methods are useful in that respect, new methodologies such as occupation matrix control (OMC) [81] could offer an opportunity to deal with these oxygen-deficient perovskites improving upon hybrid methods with respect to computational times, screening parametrization and spin initializations.
The concepts discussed here to modulate the order parameters by tuning the oxygen deficiency as well as promoting oxygen mobility in O-deficient structures should be capable of experimental demonstration. Engineering of O-deficient TM-based magnets/ferroelectrics is now within reach. Stable three-state nonvolatile memory devices were realized by combining both ferroelectricity and oxygen vacancy migration in Pt/BTO/STO, where oxygen vacancies modify the switching properties [82]. Combined in situ scanning probe and transmission electron microscopy has been used to study the field-induced migration of oxygen vacancies in thin films of PrCaMnO. The oxygen vacancies in the material have been imaged in situ and are found to migrate under an external electric field [83]. Measurements of thermally stimulated and pyroelectric currents were performed in STO single crystals subjected to an electric field. A dielectric-to-pyroelectric phase transition in an originally centrosymmetric crystal structure with an inherent dipole moment is found, which is induced by oxygen migration [84]. Moreover, changes in oxygen content are achievable, e.g., by ionic liquid gating, so one has a path to modulating the properties in real time [85]. For instance, it has been recently shown that a redox-driven reversible topotactic transformation in epitaxial SrFeCoO thin films can be achieved at room temperature and at atmospheric pressure. This transformation triggers changes in electronic structures as well. Reversible redox reactions and/or associated changes at low temperature and under atmospheric pressure are particularly valuable to develop a cathode for solid-oxide fuel cells [86].
5. Conclusions
We demonstrated that STFC is a magnetic semiconductor capable of sustaining electric polar structures for a range of TM orderings and O deficiencies. Variations of and O migration are effective mechanisms by which to tune magnetic and electric polarization changes and therefore engineer perovskites by using O deficiency and cation arrangement. The Fe and Co TM contribute differently to the order parameters according to their electronegativity, radii, and spin valences, which allows us to design a variety of vacancy densities and cation and vacancy distributions such that both magnetic and ferroelectric orderings can be enhanced.
The preferred ground states of STFC consist of layered perovskites with sheets of linearly organized O-coordinated Fe–Co pairs, separated by Ti ions, and sandwiched with layers of O-coordinated Ti, which provides a first suggestion for the engineering of a STFC-based multiferroic. The model suggests that are not uniformly spread all over the crystal but they stabilize at the Fe–Co octahedra, resulting in a layered STFC in which the magnetic TM are locally undercoordinated in contrast to the Ti layers that are mostly not defective. The Co,Fe- defects are the source of the crystal symmetry distortions, off-centering of cations and bending of the oxygen octahedra.
Oxygen deficiency of one /UC yielded the largest values for the changes of the magnetic and electric parameters between different arrangements, although there are several stabilized structures that in the worst case scenario would always display a small but finite saturation magnetization, whereas the polarization changes are very similar among those structures. On the other hand, O deficiency of two /UC usually provides smaller electric polarization changes as well as smaller saturation magnetization, but there are several stabilized structures with increased magnetization, and Ti can also provide a second source of magnetization.
Oxygen migration for yields C/cm due to quantum-of-polarization differences between structures. Increasing the deficiency to yields the O migration of which resolved polarization for is C/cm. These predicted values of electric polarization changes are large compared to TM-substituted STO multiferroics, motivating experimental synthesis and demonstration.
The results have been presented in the form of an intuitive set of rules for STFC to be multiferroic, but these rules are expected to be a particular case of a broader set for magnetic oxides based on the interplay between (Co/Fe)- defects, TM-cation coordination, and topological vacancy disorder. The manipulation of electronic properties according to such rules could facilitate applications such as nonvolatile magnetoelectric memory or logic, or phase-change materials driven by oxygen content.
Author Contributions
Conceptualization, E.A.C.E., S.P.O., C.A.R. and J.M.F.; methodology, E.A.C.E., S.P.O. and J.M.F.; software, E.A.C.E. and J.M.F.; validation, E.A.C.E., S.P.O., C.A.R. and J.M.F.; formal analysis, E.A.C.E., S.P.O., C.A.R. and J.M.F.; investigation, E.A.C.E., S.P.O., C.A.R. and J.M.F.; resources, E.A.C.E. and J.M.F.; data curation, E.A.C.E. and J.M.F.; writing—original draft preparation, E.A.C.E., S.P.O., C.A.R. and J.M.F.; writing—review and editing, E.A.C.E., S.P.O., C.A.R. and J.M.F.; visualization, E.A.C.E.; supervision, S.P.O., C.A.R. and J.M.F. All authors have read and agreed to the published version of the manuscript.
Funding
This research was funded by Agencia Nacional de Investigación y Desarrollo: FONDECYT Regular 1221301; DGIIE-USM: PI_LIR_2021_100; National Science Foundation: DMR 1419807; National Science Foundation: DMR 2132623; United States Department of Energy: DE-AC02-05-CH11231: Materials Project program KC23MP.
Institutional Review Board Statement
Not applicable.
Informed Consent Statement
Not applicable.
Data Availability Statement
Not applicable.
Acknowledgments
J. M. Florez thanks project PILIR2021100 from DGIIE-USM and FONDECYT Regular 1221301; E. A. Cortés Estay thanks DGIIE-USM Master scholarship and PIIC-031. S. P. Ong acknowledges support from the Materials Project, funded by the U.S. Department of Energy, Office of Science, Office of Basic Energy Sciences, Materials Sciences and Engineering Division under contract no. DE-AC02-05-CH11231: Materials Project program KC23MP. C. A. Ross acknowledges support from NSF awards DMR 1419807 and 2132623.
Conflicts of Interest
The authors declare no conflict of interest.
Abbreviations
The following abbreviations are used in this manuscript:
| STFC | SrTiFeCoO |
| STF | SrTiFeO |
| STC | SrTiCoO |
| STO | SrTiO |
| TM | Transition Metal |
| FE | Ferroelectric |
| FM | Ferromagnetic |
| AFM | Antiferromagnetic |
| DFT | Density Functional Theory |
| PAW | Projector-augmented-wave |
| GGA | Generalized Gradient Approximation |
| GGA+U | Generalized Gradient Approximation with Hubbard-like correction |
| PBE | Perdew-Burke-Ernzerhof |
| HSE | Heyd–Scuseria–Ernzerhof |
| NEB | Nudged Elastic Band |
Appendix A. Configurations of Oxygen Vacancies for
Appendix B. GGA+U: Selection of Hubbard +U Parameters
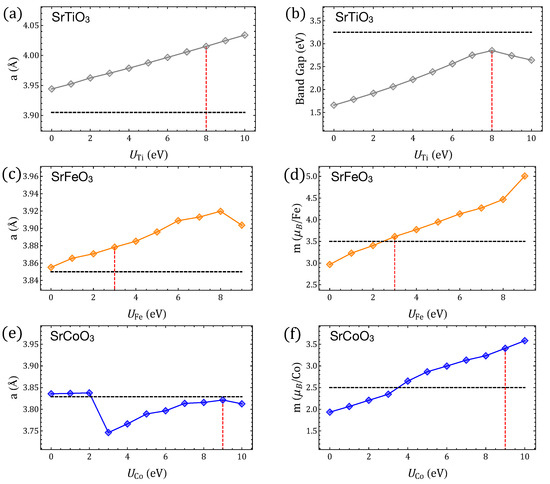
Figure A2.
Properties of SrTiO, SrFeO and SrCoO perovskites calculated with GGA+U by using different Hubbard parameters for Ti, Fe, and Co. (a,b) Lattice parameter and band gap of SrTiO. (c–f) Lattice parameter and magnetic moment per Fe/Co ion of SrFeO and SrCoO, respectively. Horizontal lines indicate the respective experimental values (from Refs. for SrTiO [7], SrFeO [87,88], SrCoO [89]) whereas vertical lines indicate the U values chosen for this work.

Figure A3.
Properties of SrTiFeO perovskites () calculated with GGA+U by using different Hubbard paramterers for Ti and Fe. takes values of 2, 4, 6, and 8 eV, represented by orange, blue, green, and purple diamonds, respectively. (a) Lattice parameter of SrTiFeO compared with experimental parameters for (from Refs. a [90] and b [38]). (b) Magnetic moment per Fe ion for compared with HSE results (Ref. c [4]).
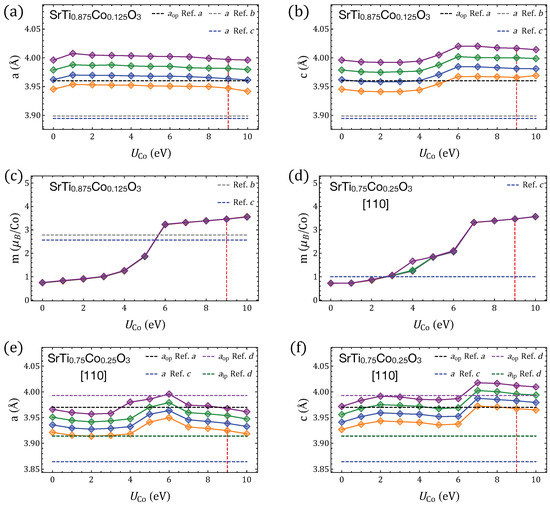
Figure A4.
Properties of SrTiCoO perovskites () calculated with GGA+U by using different Hubbard parameters for Ti and Co. takes values of 2, 4, 6, and 8 eV, represented by orange, blue, green, and purple diamonds, respectively. (a,b) Lattice parameters of SrTiCoO compared with experimental parameters for (from Refs. a [91] and b [92]) and HSE results (Ref. c [5]). (c,d) Magnetic moment per Co ion for and . (e,f) Lattice parameters for and -aligned Co–Co, compared with experimental values for (Refs. a and d [90]) and HSE calculations for (Ref. c).
Appendix C. Oxygen-Vacancy Migration
In this section we present complementary information associated with the oxygen migrations shown in Figure 2 of the article main text as well as the results for two additional migration paths for systems. In all cases, the intermediate structural images representing the migration are obtained through: (i) a linear interpolation, between the end structures, of the atomic coordinates and lattice vectors; (ii) a relaxation of such interpolation by using the nudged elastic band method (NEB). Depending on the end states magnetic ordering for and respectively, which are detailed in Table 1 of the article, the migration images were annotated FM or AFM.
Appendix C.1. Migration Path between δ01 Vacancies in Figure 2: [100]a and [100]c

Figure A5.
(a) Band gap along the migration path between (migration coordinate ) and (migration coordinate ) for FM and AFM NEB-relaxed structures. (b,c) Magnetic moment “m” of the TM labeled in Figure 2 of the main text, and of the whole perovskite supercell for the relaxed FM and AFM migration paths. End-state values are associated with the GS reported in Table 1.
Appendix C.2. Migration Path between δ02 Vacancies in Figure 2: and

Figure A6.
(a) Band gap along the migration path between (migration coordinate ) and (migration coordinate ) for FM and AFM NEB-relaxed structures. (b,c) Magnetic moment “m” of the TM labeled in Figure 2 of the main text, and of the whole perovskite supercell for the relaxed FM and AFM migration paths. End-state values are associated with the GS reported in Table 1.
Appendix C.3. Other Migration Paths for δ01
Appendix C.3.1. Migration Connecting Symmetry-Equivalent Vacancies: The Case of [100]c
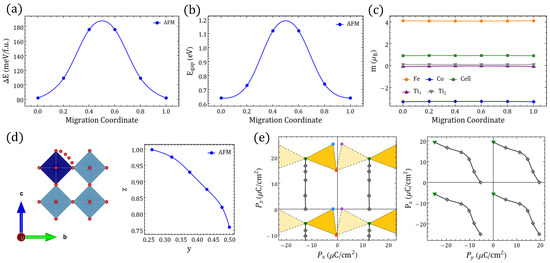
Figure A7.
(a) Energy relative to the gs, (b) band gap and (c) magnetic moments “m” along the migration path between (migration coordinate ) and a symmetrically equivalent structure (migration coordinate ). (d) Oxygen-migration path in which Co––Ti switches from the c direction to the b direction, and the corresponding relaxed fractional position of the migrating oxygen. (e) Electric polarization lattices along NEB-relaxed paths.
Appendix C.3.2. Migration Connecting Nonequivalent Vacancies: The Case of [100]a and [100]b
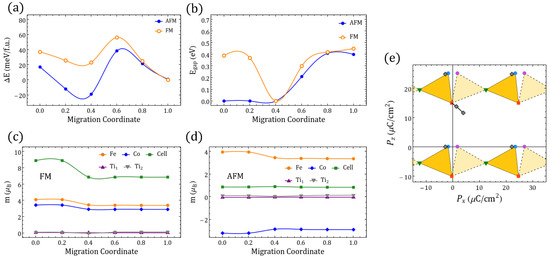
Figure A8.
(a) Energy relative to the gs, (b) band gap and (c,d) magnetic moments “m” along the migration path between (migration coordinate ) and (migration coordinate ), for AFM and FM NEB-relaxed structures. (e) Electric polarization lattices corresponding to the FM NEB-relaxed path.
Appendix C.4. Other Migration Paths for δ02
Appendix C.4.1. Migration Path between δ02 Vacancies: and
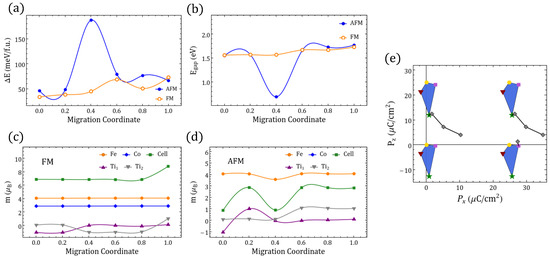
Figure A9.
(a) Energy relative to the gs, (b) band gap and (c,d) magnetic moments “m” along the migration path between (migration coordinate ) and (migration coordinate ), for AFM and FM NEB-relaxed structures. (e) Electric polarization lattices corresponding to the FM NEB-relaxed path.
Appendix C.4.2. Migration Path between δ02 Vacancies: and
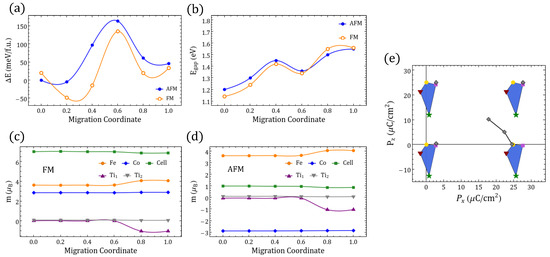
Figure A10.
(a) Energy relative to the gs, (b) band gap and (c,d) magnetic moments “m” along the migration path between (migration coordinate ) and (migration coordinate ), for AFM and FM NEB-relaxed structures. (e) Electric polarization lattices corresponding to the FM NEB-relaxed path.
Appendix D. Projected Density of States
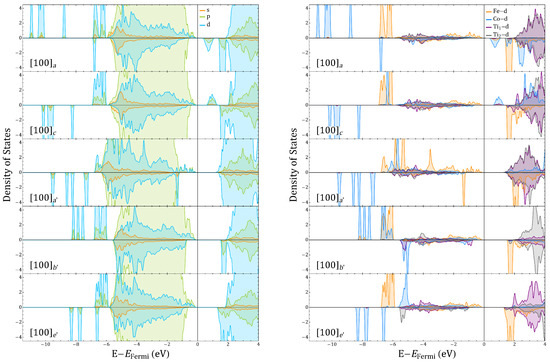
Figure A11.
-decomposed density of states (left panel) and Fe, Co, Ti, and Ti d-orbital projected density of states (right panel) for and vacancies corresponding to and , respectively.
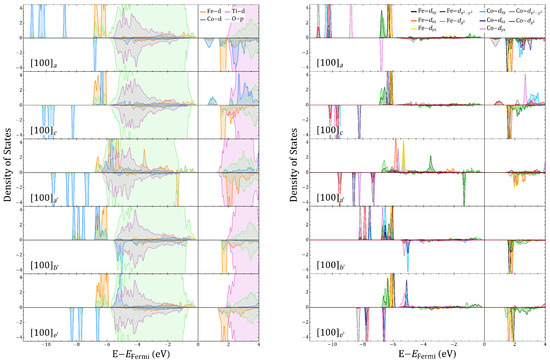
Figure A12.
Fe, Co, Ti d-orbita,l and O p-orbital (left panel) and Fe, Co d-suborbital (right panel) projected density of states for and vacancies corresponding to and , respectively.
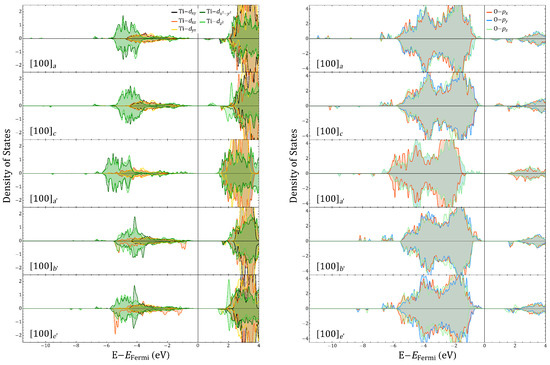
Figure A13.
Ti d-suborbital (left panel) and O p-suborbital (right panel) projected density of states for and vacancies corresponding to and , respectively.
Appendix E. Robustness against Different Functionals

Figure A14.
Fe/Co magnetic moments magnitude and band gap of configurations for different parameters. was tuned down to 3 eV while keeping .
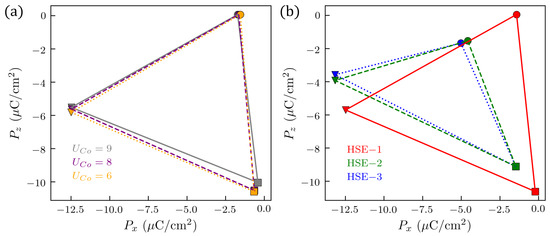
Figure A15.
Polarization of configurations tested against (a) different parameters and (b) the HSE06 hybrid functional. is represented by circles, by squares, and by triangles, following the same scheme as in Figure 2a,b. For a clear comparison, we show a region corresponding to only one of the “polarization triangles” of Figure 2a. was decreased from 9 to 3 eV while keeping . Hybrid calculations were carried starting from the GGA+U structures; HSE-1 maintains the structure rigid while constraining magnetization to the values presented in Table 1; in HSE-2, the structure is allowed to relax, followed by a constrained magnetization calculation. For HSE-3, both structure and magnetization are relaxed.
References
- Spaldin, N.A.; Ramesh, R. Advances in magnetoelectric multiferroics. Nat. Mater. 2019, 18, 203. [Google Scholar] [CrossRef] [PubMed]
- Fiebig, M.; Lottermoser, T.; Meier, D.; Trassin, M. The evolution of multiferroics. Nat. Rev. Mater. 2016, 1, 16046. [Google Scholar] [CrossRef]
- Marthinsen, A.; Faber, C.; Aschauer, U.; Spaldin, N.A.; Selbach, S.M. Coupling and competition between ferroelectricity, magnetism, strain, and oxygen vacancies in AMnO3 perovskites. MRS Commun. 2016, 6, 182. [Google Scholar] [CrossRef]
- Goto, T.; Kim, D.H.; Sun, X.; Onbasli, M.C.; Florez, J.M.; Ong, S.P.; Vargas, P.; Ackland, K.; Stamenov, P.; Aimon, N.M.; et al. Magnetism and Faraday Rotation in Oxygen-Deficient Polycrystalline and Single-Crystal Iron-Substituted Strontium Titanate. Phys. Rev. Appl. 2017, 7, 024006. [Google Scholar] [CrossRef]
- Florez, J.M.; Ong, S.P.; Onbasli, M.C.; Dionne, G.F.; Vargas, P.; Ceder, G.; Ross, C.A. First-principles insights on the magnetism of cubic SrTi1−xCoxO3−δ. Appl. Phys. Lett. 2012, 100, 252904. [Google Scholar] [CrossRef]
- Tang, A.S.; Onbasli, M.C.; Sun, X.; Ross, C.A. Thickness-Dependent Double-Epitaxial Growth in Strained SrTi0.7Co0.3O3−δ Films. ACS Appl. Mater. Interfaces 2018, 10, 7469. [Google Scholar] [CrossRef]
- Pai, Y.; Tylan-Tyler, A.; Irvin, P.; Levy, J. Physics of SrTiO3-based heterostructures and nanostructures: A review. Rep. Prog. Phys. 2018, 81, 036503. [Google Scholar] [CrossRef]
- Aschauer, U.; Spaldin, N.A. Competition and cooperation between antiferrodistortive and ferroelectric instabilities in the model perovskite SrTiO3. J. Phys. Condens. Matter 2014, 26, 122203. [Google Scholar] [CrossRef]
- Shin, D.; Latini, S.; Schäfer, C.; Sato, S.A.; Giovannini, U.D.; Hübener, H.; Rubio, A. Quantum Paraelectric Phase of SrTiO3 from First Principles. Phys. Rev. B 2021, 104, L060103. [Google Scholar] [CrossRef]
- Latini, S.; Shin, D.; Sato, S.A.; Schäfer, C.; Giovannini, U.D.; Hübener, H.; Rubio, A. The Ferroelectric Photo Ground State of SrTiO3: Cavity Materials Engineering. Proc. Natl. Acad. Sci. USA 2021, 118, e2105618118. [Google Scholar] [CrossRef]
- Xu, T.; Shimada, T.; Mori, M.; Fujimoto, G.; Wang, J.; Kitamura, T. Defect Engineering for Nontrivial Multiferroic Orders in SrTiO3. Phys. Rev. Mater. 2020, 4, 124405. [Google Scholar] [CrossRef]
- Hemberger, J.; Lunkenheimer, P.; Viana, R.; Böhmer, R.; Loidl, A. Electric-field-dependent dielectric constant and nonlinear susceptibility in SrTiO3. Phys. Rev. B 1995, 52, 13159. [Google Scholar] [CrossRef] [PubMed]
- Haeni, J.H.; Irvin, P.; Chang, W.; Uecker, R.; Reiche, P.; Li, Y.L.; Choudhury, S.; Tian, W.; Hawley, M.E.; Craigo, B.; et al. Room-temperature ferroelectricity in strained SrTiO3. Nature 2004, 430, 758. [Google Scholar] [CrossRef] [PubMed]
- Kim, Y.S.; Kim, D.J.; Kim, T.H.; Noh, T.W.; Choi, J.S.; Park, B.H.; Yoon, J.-G. Observation of room-temperature ferroelectricity in tetragonal strontium titanate thin films on SrTiO3 (001) substrates. Appl. Phys. Lett. 2007, 91, 042908. [Google Scholar] [CrossRef]
- Jang, H.W.; Kumar, A.; Denev, S.; Biegalski, M.D.; Maksymovych, P.; Bark, C.W.; Nelson, C.T.; Folkman, C.M.; Baek, S.H.; Balke, N.; et al. Ferroelectricity in Strain-Free SrTiO3 Thin Films. Phys. Rev. Lett. 2010, 104, 197601. [Google Scholar] [CrossRef]
- Choi, M.; Oba, F.; Tanaka, I. Role of Ti Antisitelike Defects in SrTiO3. Phys. Rev. Lett. 2009, 103, 185502. [Google Scholar] [CrossRef]
- Kim, Y.S.; Kim, J.; Moon, S.J.; Choi, W.S.; Chang, Y.J.; Yoon, J.-G.; Yu, J.; Chung, J.-S.; Noh, T.W. Localized electronic states induced by defects and possible origin of ferroelectricity in strontium titanate thin films. Appl. Phys. Lett. 2009, 94, 202906. [Google Scholar] [CrossRef]
- Klyukin, K.; Alexandrov, V. Effect of intrinsic point defects on ferroelectric polarization behavior of SrTiO3. Phys. Rev. B 2017, 95, 035301. [Google Scholar] [CrossRef]
- Yang, F.; Zhang, Q.; Yang, Z.; Gu, J.; Liang, Y.; Li, W.; Wang, W.; Jin, K.; Gu, L.; Guo, J. Room-temperature ferroelectricity of SrTiO3 films modulated by cation concentration. Appl. Phys. Lett. 2015, 107, 082904. [Google Scholar] [CrossRef]
- Sokolovic, I.; Schmid, M.; Diebold, U.; Setvin, M. Incipient ferroelectricity: A route towards bulk-terminated. Phys. Rev. Mater. 2019, 3, 034407. [Google Scholar] [CrossRef]
- Hallsteinsen, I.; Nord, M.; Bolstad, T.; Vullum, P.-E.; Boschker, J.E.; Longo, P.; Takahashi, R.; Holmestad, R.; Lippmaa, M.; Tybell, T. Effect of Polar (111)-Oriented SrTiO3 on Initial Perovskite Growth. Cryst. Growth Des. 2016, 16, 2357. [Google Scholar] [CrossRef]
- Xu, T.; Shimada, T.; Araki, Y.; Wang, J.; Kitamura, T. Multiferroic Domain Walls in Ferroelectric PbTiO3 with Oxygen Deficiency. Nano Lett. 2015, 16, 454–458. [Google Scholar] [CrossRef] [PubMed]
- Lee, K.; Park, K.; Lee, H.J.; Song, M.S.; Lee, K.C.; Namkung, J.; Lee, J.H.; Park, J.; Chae, S.C. Enhanced ferroelectric switching speed of Si-doped HfO2 thin film tailored by oxygen deficiency. Sci. Rep. 2021, 11, 6290. [Google Scholar] [CrossRef] [PubMed]
- Cheng, S.; Li, M.; Deng, S.; Bao, S.; Tang, P.; Duan, W.; Ma, J.; Nan, C.; Zhu, J. Manipulation of Magnetic Properties by Oxygen Vacancies in Multiferroic YMnO3. Adv. Funct. Mater. 2016, 26, 3589–3598. [Google Scholar] [CrossRef]
- Agrawal, P.; Guo, J.; Yu, P.; Hebert, C.; Passerone, D.; Erni, R.; Rossell, M.D. Strain-driven oxygen deficiency in multiferroic SrMnO3 thin films. Phys. Rev. B 2016, 94, 104101. [Google Scholar] [CrossRef]
- Glinchuk, M.D.; Eliseev, E.A.; Li, G.; Zeng, J.; Kalinin, S.V.; Morozovska, A.N. Ferroelectricity induced by oxygen vacancies in relaxors with perovskite structure. Phys. Rev. B 2018, 98, 094102. [Google Scholar] [CrossRef]
- Abd El-Naser, A.; Abdel-Khalek, E.K.; Nabhan, E.; Rayan, D.A.; Gaafar, M.S.; Abd El-Aal, N.S. Study the influence of oxygen-deficient (δ = 0.135) in SrFeO3−δ nanoparticles perovskite on structural, electrical and magnetic properties. Philos. Mag. 2020, 101, 710–728. [Google Scholar] [CrossRef]
- Wang, Y.-G.; Tang, X.-G.; Liu, Q.-X.; Jiang, Y.-P.; Jiang, L.-L. Room Temperature Tunable Multiferroic Properties in Sol-Gel-Derived Nanocrystalline Sr(Ti1−xFex)O3−δ Thin Films. Nanomaterials 2017, 7, 264. [Google Scholar] [CrossRef]
- Wang, X.; Wang, Z.; Hu, Q.; Zhang, C.; Wang, D.; Li, L. Room temperature multiferroic properties of Fe-doped nonstoichiometric SrTiO3 ceramics at both A and B sites. Solid State Commun. 2019, 289, 22. [Google Scholar] [CrossRef]
- Florez, J.M.; Onbasli, M.C.; Kim, D.H.; Ong, S.P.; Ceder, G.; Vargas, P.; Ross, C.A. Abstract: M32.00014, APS March Meeting 2015. 2015, Volume 60. Number 1. Available online: http://meetings.aps.org/link/BAPS.2015.MAR.M32.14 (accessed on 31 December 2021).
- Mitra, C.; Lin, C.; Posadas, A.B.; Demkov, A.A. Role of Oxygen Vacancies in Room-Temperature Ferromagnetism in Cobalt-Substituted SrTiO3. Phys. Rev. B 2014, 90, 125130. [Google Scholar] [CrossRef]
- Posadas, A.B.; Mitra, C.; Lin, C.; Dhamdhere, A.; Smith, D.J.; Tsoi, M.; Demkov, A.A. Oxygen Vacancy-Mediated Room-Temperature Ferromagnetism in Insulating Cobalt-Substituted SrTiO3 Epitaxially Integrated with Silicon. Phys. Rev. B 2013, 87, 144422. [Google Scholar] [CrossRef]
- Sluchinskaya, I.A.; Lebedev, A.I. Cobalt in Strontium Titanate as a New Off-Center Magnetic Impurity. Phys. Solid State 2019, 61, 390. [Google Scholar] [CrossRef]
- Opazo, M.A.; Ong, S.P.; Vargas, P.; Ross, C.A.; Florez, J.M. Oxygen-vacancy tuning of magnetism in SrTi0.75Fe0.125Co0.125O3−δ perovskite. Phys. Rev. Mater. 2019, 3, 014404. [Google Scholar] [CrossRef]
- Liu, Y.; Baumann, S.; Schulze-Küppers, F.; Mueller, D.N.; Guillon, O. Co and Fe co-doping influence on functional properties of SrTiO3 for use as oxygen transport membranes. J. Eur. Ceram. Soc. 2018, 38, 5058. [Google Scholar] [CrossRef]
- Phoon, B.L.; Lai, C.W.; Juan, J.C.; Show, P.L.; Chen, W.H. A review of synthesis and morphology of SrTiO3 for energy and other applications. Int. J. Energy Res. 2019, 43, 5151. [Google Scholar] [CrossRef]
- Mroziński, A.; Molin, S.; Karczewski, J.; Miruszewski, T.; Jasiński, P. Electrochemical properties of porous Sr0.86Ti0.65Fe0.35O3 oxygen electrodes in solid oxide cells: Impedance study of symmetrical electrodes. Int. J. Hydrogen Energy 2019, 44, 1827. [Google Scholar] [CrossRef]
- Kim, D.H.; Aimon, N.M.; Bi, L.; Florez, J.M.; Dionne, G.F.; Ross, C.A. Magnetostriction in epitaxial SrTi1-xFexO3-delta perovskite films with x = 0.13 and 0.35. J. Phys. Condens. Matter 2013, 25, 026002. [Google Scholar] [CrossRef]
- Ning, S.; Zhang, Q.; Occhialini, C.; Comin, R.; Zhong, X.; Ross, C.A. Voltage Control of Magnetism above Room Temperature in Epitaxial SrCo1−xFexO3−δ. ACS Nano 2020, 14, 8949. [Google Scholar] [CrossRef]
- Inkinen, S.; Yao, L.; van Dijken, S. Reversible Thermal Strain Control of Oxygen Vacancy Ordering in an Epitaxial La0.5Sr0.5CoO3−δ Film. Phys. Rev. Mater. 2020, 4, 046002. [Google Scholar] [CrossRef]
- Assat, G.; Tarascon, J.-M. Fundamental understanding and practical challenges of anionic redox activity in Li-ion batteries. Nat. Energy 2018, 3, 373. [Google Scholar] [CrossRef]
- Myeong, S.; Cho, W.; Jin, W.; Hwang, J.; Yoon, M.; Yoo, Y.; Nam, G.; Jang, H.; Han, J.-G.; Choi, N.-S.; et al. Understanding voltage decay in lithium-excess layered cathode materials through oxygen-centred structural arrangement. Nat. Commun. 2018, 9, 3285. [Google Scholar] [CrossRef] [PubMed]
- Rawat, K.; Fong, D.D.; Aidhy, D.S. Breaking Atomic-Level Ordering via Biaxial Strain in Functional Oxides: A DFT Study. J. Appl. Phys. 2021, 129, 095301. [Google Scholar] [CrossRef]
- Iijima, S.; Yang, W.; Matsumura, S.; Ohnishi, I. Atomic Resolution Imaging of Cation Ordering in Niobium–Tungsten Complex Oxides. Commun Mater 2021, 2, 1. [Google Scholar] [CrossRef]
- Kresse, G.; Furthmüller, J. Efficient iterative schemes for ab initio total-energy calculations using a plane-wave basis set. Phys. Rev. B 1996, 54, 11169. [Google Scholar] [CrossRef]
- Kresse, G.; Joubert, D. From ultrasoft pseudopotentials to the projector augmented-wave method. Phys. Rev. B 1999, 59, 1758. [Google Scholar] [CrossRef]
- Jonsson, H.; Mills, G.; Jacobsen, K.W. Nudged elastic band method for finding minimum energy paths of transitions. In Classical and Quantum Dynamics in Condensed Phase Simulations; Berne, B.J., Ciccotti, G., Coker, D.F., Eds.; World Scientific: Singapore, 1998. [Google Scholar]
- Rohrbach, A.; Hafner, J.; Kresse, G. Electronic correlation effects in transition-metal sulfides. J. Phys. Condens. Matter 2003, 15, 979. [Google Scholar] [CrossRef]
- Heyd, J.; Scuseria, G.E.; Ernzerhof, M. Hybrid functionals based on a screened Coulomb potential. J. Chem. Phys. 2003, 118, 8207. [Google Scholar] [CrossRef]
- Resta, R. Macroscopic polarization in crystalline dielectrics: The geometric phase approach. Rev. Mod. Phys. 1994, 66, 899. [Google Scholar] [CrossRef]
- Zhou, W.X.; Ariando, A. Review on Ferroelectric/Polar Metals. Jpn. J. Appl. Phys. 2020, 59, SI0802. [Google Scholar] [CrossRef]
- Hadjimichael, M.; Li, Y.; Zatterin, E.; Chahine, G.A.; Conroy, M.; Moore, K.; Connell, E.N.O.; Ondrejkovic, P.; Marton, P.; Hlinka, J.; et al. Metal–Ferroelectric Supercrystals with Periodically Curved Metallic Layers. Nat. Mater. 2021, 20, 4. [Google Scholar] [CrossRef] [PubMed]
- Momma, K.; Izumi, F. VESTA 3 for Three-Dimensional Visualization of Crystal, Volumetric and Morphology Data. J. Appl. Cryst. 2011, 44, 1272. [Google Scholar] [CrossRef]
- Palmer, D.C. CrystalMaker; CrystalMaker Software Ltd.: Oxfordshire, UK, 2014; Available online: www.crystalmaker.com (accessed on 31 December 2021).
- Ong, S.P.; Richards, W.D.; Jain, A.; Hautier, G.; Kocher, M.; Cholia, S.; Gunter, D.; Chevrier, V.L.; Persson, K.A.; Ceder, G. Python Materials Genomics (pymatgen): A robust, open-source python library for materials analysis. Comput. Mater. Sci. 2013, 68, 314. [Google Scholar] [CrossRef]
- Makov, G.; Payne, M.C. Periodic boundary conditions in ab initio calculations. Phys. Rev. B 1995, 51, 4014. [Google Scholar] [CrossRef] [PubMed]
- Emery, A.A.; Wolverton, C. High-Throughput DFT Calculations of Formation Energy, Stability and Oxygen Vacancy Formation Energy of ABO3 Perovskites. Sci. Data 2017, 4, 1. [Google Scholar] [CrossRef] [PubMed]
- Tahini, H.A.; Tan, X.; Schwingenschlögl, U.; Smith, S.C. Formation and Migration of Oxygen Vacancies in SrCoO3 and Their Effect on Oxygen Evolution Reactions. ACS Catal. 2016, 6, 5565. [Google Scholar] [CrossRef]
- Wang, L.; Maxisch, T.; Ceder, G. Oxidation energies of transition metal oxides within the GGA+U framework. Phys. Rev. B 2006, 73, 195107. [Google Scholar] [CrossRef]
- Lee, Y.-L.; Kleis, J.; Rossmeisl, J.; Morgan, D. Ab initio energetics of LaBO3 (001) (B = Mn, Fe, Co, and Ni) for solid oxide fuel cell cathodes. Phys. Rev. B 2009, 80, 224101. [Google Scholar] [CrossRef]
- Hombo, J.; Matsumoto, Y.; Kawano, T. Electrical conductivities of SrFeO3−δ and BaFeO3−δ perovskites. J. Solid State Chem. 1990, 84, 138. [Google Scholar] [CrossRef]
- Jahn, H.A.; Teller, E. Stability of Polyatomic Molecules in Degenerate Electronic States-I—Orbital Degeneracy, Proceedings of the Royal Society of London. Ser.-Math. Phys. Sci. 1937, 161, 220. [Google Scholar]
- Tkacz-Śmiech, K.; Koleżyński, A.; Ptak, W.S. Chemical Bond in Ferroelectric Perovskites. Ferroelectrics 2000, 237, 57. [Google Scholar] [CrossRef]
- Xu, S.; Jacobs, R.; Morgan, D. Factors Controlling Oxygen Interstitial Diffusion in the Ruddlesden-Popper Oxide La2−xSrxNiO4+δ. Chem. Mater. 2018, 30, 7166. [Google Scholar] [CrossRef]
- Resta, R.; Vanderbilt, D. Theory of Polarization: A Modern Approach. Top. Appl. Phys. 2007, 105, 31–61. [Google Scholar]
- Vanderbilt, D. Berry Phases in Electronic Structure Theory: Electric Polarization, Orbital Magnetization and Topological Insulators; Cambridge University Press: Cambridge, UK, 2018. [Google Scholar]
- Jadaun, P.; Xiao, D.; Niu, Q.; Banerjee, S.K. Topological classification of crystalline insulators with space group symmetry. Phys. Rev. B 2013, 88, 085110. [Google Scholar] [CrossRef]
- Raeliarijaona, A.; Fu, H. Persistence of strong and switchable ferroelectricity despite vacancies. Sci. Rep. 2017, 7, 41301. [Google Scholar] [CrossRef] [PubMed]
- Zhang, B.H.; Liu, X.Q.; Chen, X.M. Review of experimental progress of hybrid improper ferroelectricity in layered perovskite oxides. J. Phys. D Appl. Phys. 2022, 55, 113001. [Google Scholar] [CrossRef]
- Reyes-Lillo, S.E.; Rabe, K.M.; Neaton, J.B. Ferroelectricity in [111]-oriented epitaxially strained SrTiO3 from first principles. Phys. Rev. Mater. 2019, 3, 030601. [Google Scholar] [CrossRef]
- Ritzmann, A.M.; noz-García, A.B.M.; Pavone, M.; Keith, J.A.; Carter, E.A. Ab Initio DFT+U Analysis of Oxygen Vacancy Formation and Migration in La1−xSrxFeO3−δ (x = 0, 0.25, 0.50). Chem. Mater. 2013, 25, 3011. [Google Scholar] [CrossRef]
- Tahini, H.A.; Tan, X.; Lou, S.N.; Scott, J.; Amal, R.; Ng, Y.H.; Smith, S.C. Mobile Polaronic States in α-MoO3: An ab Initio Investigation of the Role of Oxygen Vacancies and Alkali Ions. ACS Appl. Mater. Interfaces 2016, 8, 10911. [Google Scholar] [CrossRef]
- He, X.; Mo, Y. Accelerated materials design of Na0.5Bi0.5TiO3 oxygen ionic conductors based on first principles calculations. Phys. Chem. Chem. Phys. 2015, 17, 18035. [Google Scholar] [CrossRef]
- Chroneos, A.; Vovk, R.V.; Goulatis, I.L.; Goulatis, L.I. Oxygen transport in perovskite and related oxides: A brief review. J. Alloys Compd. 2010, 494, 190. [Google Scholar] [CrossRef]
- Souza, R.A.D. Oxygen Diffusion in SrTiO3 and Related Perovskite Oxides. Adv. Funct. Mater. 2015, 25, 6326. [Google Scholar] [CrossRef]
- Mayeshiba, T.T.; Morgan, D.D. Factors controlling oxygen migration barriers in perovskites. Solid State Ion. 2016, 296, 71. [Google Scholar] [CrossRef]
- Vives, S.; Meunier, C. Defect cluster arrangements and oxygen vacancy migration in Gd doped ceria for different interatomic potentials. Solid State Ion. 2015, 283, 137. [Google Scholar] [CrossRef]
- Souza, R.A.D.; Ramadan, A.; Hörner, S. Modifying the barriers for oxygen-vacancy migration in fluorite-structured CeO2 electrolytes through strain: A computer simulation study. Energy Environ. Sci. 2012, 5, 5445. [Google Scholar] [CrossRef]
- Kong, F.; Liang, C.; Wang, L.; Zheng, Y.; Perananthan, S.; Longo, R.C.; Ferraris, J.P.; Kim, M.; Cho, K. Kinetic Stability of Bulk LiNiO2 and Surface Degradation by Oxygen Evolution in LiNiO2-Based Cathode Materials. Adv. Energy Mater. 2019, 9, 1802586. [Google Scholar] [CrossRef]
- Goikoetxea, J.; Friedrich, C.; Bihlmayer, G.; Blügel, S.; Arnau, A.; Blanco-Rey, M. Multiplet effects in the electronic correlation of one-dimensional magnetic transition metal oxides on metals. Phys. Rev. B 2022, 106, 035130. [Google Scholar] [CrossRef]
- Allen, J.P.; Watson, G.W. Occupation matrix control of d- and f-electron localisations using DFT + U. Phys. Chem. Chem. Phys. 2014, 16, 21016. [Google Scholar] [CrossRef]
- Lü, W.; Li, C.; Zheng, L.; Xiao, J.; Lin, W.; Li, Q.; Wang, X.R.; Huang, Z.; Zeng, S.; Han, K.; et al. Multi-Nonvolatile State Resistive Switching Arising from Ferroelectricity and Oxygen Vacancy Migration. Adv. Mater. 2017, 29, 1606165. [Google Scholar] [CrossRef]
- Liao, Z.; Gao, P.; Bai, X.; Chen, D.; Zhang, J. Evidence for electric-field-driven migration and diffusion of oxygen vacancies in Pr0.7Ca0.3MnO3. J. Appl. Phys. 2012, 111, 114506. [Google Scholar] [CrossRef]
- Hanzig, J.; Mehner, E.; Jachalke, S.; Hanzig, F.; Zschornak, M.; Richter, C.; Leisegang, T.; Stöcker, H.; Meyer, D.C. Dielectric to pyroelectric phase transition induced by defect migration. New J. Phys. 2015, 17, 023036. [Google Scholar] [CrossRef]
- Leighton, C. Electrolyte-based ionic control of functional oxides. Nat. Mater. 2019, 18, 13. [Google Scholar] [CrossRef] [PubMed]
- Lee, J.; Ahn, E.; Seo, Y.-S.; Kim, Y.; Jeon, T.-Y.; Cho, J.; Lee, I.; Jeen, H. Redox-Driven Nanoscale Topotactic Transformations in Epitaxial SrFe0.8Co0.2O3−x under Atmospheric Pressure. Phys. Rev. Appl. 2018, 10, 054035. [Google Scholar] [CrossRef]
- Ishiwata, S.; Tokunaga, M.; Kaneko, Y.; Okuyama, D.; Tokunaga, Y.; Wakimoto, S.; Kakurai, K.; Arima, T.; Taguchi, Y.; Tokura, Y. Versatile helimagnetic phases under magnetic fields in cubic perovskite SrFeO3. Phys. Rev. B 2011, 84, 5. [Google Scholar] [CrossRef]
- Kinoshita, M.; Sakai, H.; Hayashi, N.; Tokura, Y.; Takano, M.; Ishiwata, S. Contrasting Magnetic Behaviors in Rhodium- and Ruthenium-Doped Cubic Perovskite SrFeO3: Nearly Ferromagnetic Metal versus Spin-Glass Insulator. Angew. Chem. Int. Ed. 2016, 55, 49. [Google Scholar] [CrossRef] [PubMed]
- Long, Y.; Kaneko, Y.; Ishiwata, S.; Taguchi, Y.; Tokura, Y. Synthesis of cubic SrCoO3 single crystal and its anisotropic magnetic and transport properties. J. Phys. Condens. Matter 2011, 23, 24. [Google Scholar] [CrossRef]
- Kim, D.H.; Bi, L.; Jiang, P.; Dionne, G.F.; Ross, C.A. Magnetoelastic effects in SrTi1−xMxO3 (M = Fe, Co, or Cr) epitaxial thin films. Phys. Rev. B 2011, 84, 014416. [Google Scholar] [CrossRef]
- Bi, L.; Kim, H.-S.; Dionne, G.; Gerald, F.; Ross, C.A. Structure, magnetic properties and magnetoelastic anisotropy in epitaxial Sr(Ti1−xCox)O3 films. New J. Phys. 2010, 12, 4. [Google Scholar] [CrossRef]
- Pascanut, C.; Dragoe, N.; Berthet, P. Magnetic and transport properties of cobalt-doped perovskites SrTi1−xCoxO3 (x ≤ 0.5). J. Magn. Magn. Mater. 2006, 305, 1. [Google Scholar] [CrossRef]
Publisher’s Note: MDPI stays neutral with regard to jurisdictional claims in published maps and institutional affiliations. |
© 2022 by the authors. Licensee MDPI, Basel, Switzerland. This article is an open access article distributed under the terms and conditions of the Creative Commons Attribution (CC BY) license (https://creativecommons.org/licenses/by/4.0/).
