Article

FMR Damping in Thin Films with Exchange Bias

Skobeltsyn Institute of Nuclear Physics, Lomonosov Moscow State University, 1/2, Leninskie Gory, 119991 Moscow, Russia
*
Author to whom correspondence should be addressed.
Magnetochemistry 2021, 7(5), 70; https://doi.org/10.3390/magnetochemistry7050070
Submission received: 1 April 2021 / Revised: 13 May 2021 / Accepted: 14 May 2021 / Published: 17 May 2021

Abstract

:
Ferromagnetic resonance (FMR) linewidth (LW) is a tool for studying the high frequency properties of magnetic materials for their application in high-speed devices. Here, we investigate different mechanisms which determine FMR damping in bilayer ferromagnetic/antiferromagnetic (F/AF and AF/F) exchange bias systems. Variations of FMR LW with the thickness and deposition order of the F and AF layers were studied, as well as their correlation with the exchange bias field and roughness of the sample surface. We observed much larger LW in AF/F structures compared with F/AF samples. It was found that neither the exchange bias nor surface/interface roughness in the samples could explain the difference in LW for F/AF and AF/F samples. Instead, the different underlayer microstructure influenced the grainsize, leading to different angular dispersion of magnetization and different internal stray field in F-layers, promoting a different intensity of magnon scattering and FMR damping in F/AF and AF/F samples.

1. Introduction

The high frequency properties of ferromagnetic materials and multilayer structures are of primary importance for applications in magnetic storage devices with nanoseconds and smaller overwriting information bits. The ferromagnetic resonance (FMR) is a well-recognized instrument for investigating the dynamics and damping of magnetization by measuring FMR linewidth (LW). Magnetization dynamics are described by the Landau–Lifshitz (LL) equation [1]
dM/dt = −γ(M × Heff) + (αef/Ms)(M × dM/dt),
where γ =gμb ≈ 1.76 × 10⁷ (G∙s)−1 is the gyromagnetic constant. The first term in the right side of (1) describes a uniform precession of the magnetic moment M in an effective magnetic field Heff. The second term is a dissipative term in the Gilbert form [2], with an effective phenomenological damping parameter αef. It describes the energy dissipation with a helical trajectory of the precessing magnetic moment. The effective magnetic field is a combination of several contributions
Heff = HD + H + HK + HEB + HMS,
where HD is a demagnetizing field, H is an applied DC-field, HK is an anisotropy field, HEB is an exchange bias field, and HMS is a field related to the microstructure of the ferromagnetic layer. The HMS is usually neglected when considering collective spin dynamics. Here, we show that microstructure can be a dominating factor in damping FMR dynamics.
In our case, the ferromagnetic (F) layer is a component of a multilayer thin film structure, including an antiferromagnetic (AF) layer in contact with F-layer. The geometry of the FMR experiment is shown in Figure 1.
We assume that due to the demagnetizing factor in the ferromagnetic layer being thinner than 100 nm, the magnetization vector MS is confined to in-plane motion; the easy axis (EA) is oriented along x-axis (i.e., η = 0) and noncollinearity angle β is small, though often non-zero [3]. Then, an approximate solution of the LL equation for weak fields |HEB + HK + HMS| < H << 4πMs gives the relation between the FMR frequency ω and the applied magnetic field in resonance H = Hr, and can be written as
(ω/γ)24πMS [Hr + HEB cos(φH − β) + HKcos2φH]
or
Hr= (ω/γ)2/(4πMS) − HEB cos(φH − β) − HKcos2φH
A similar relation was obtained in [4] without the noncollinearity between HK and HEB.
The damping term in (1) leads to a broadening of the FMR line. The line width (LW), ΔH, in experiments with scanning magnetic field H, or Δω in the frequency scanning setup, is phenomenologically connected with damping term and damping parameter α in (1). The nature of FMR damping has been widely studied for more than a half a century. In summary, it has been found that:
(1)
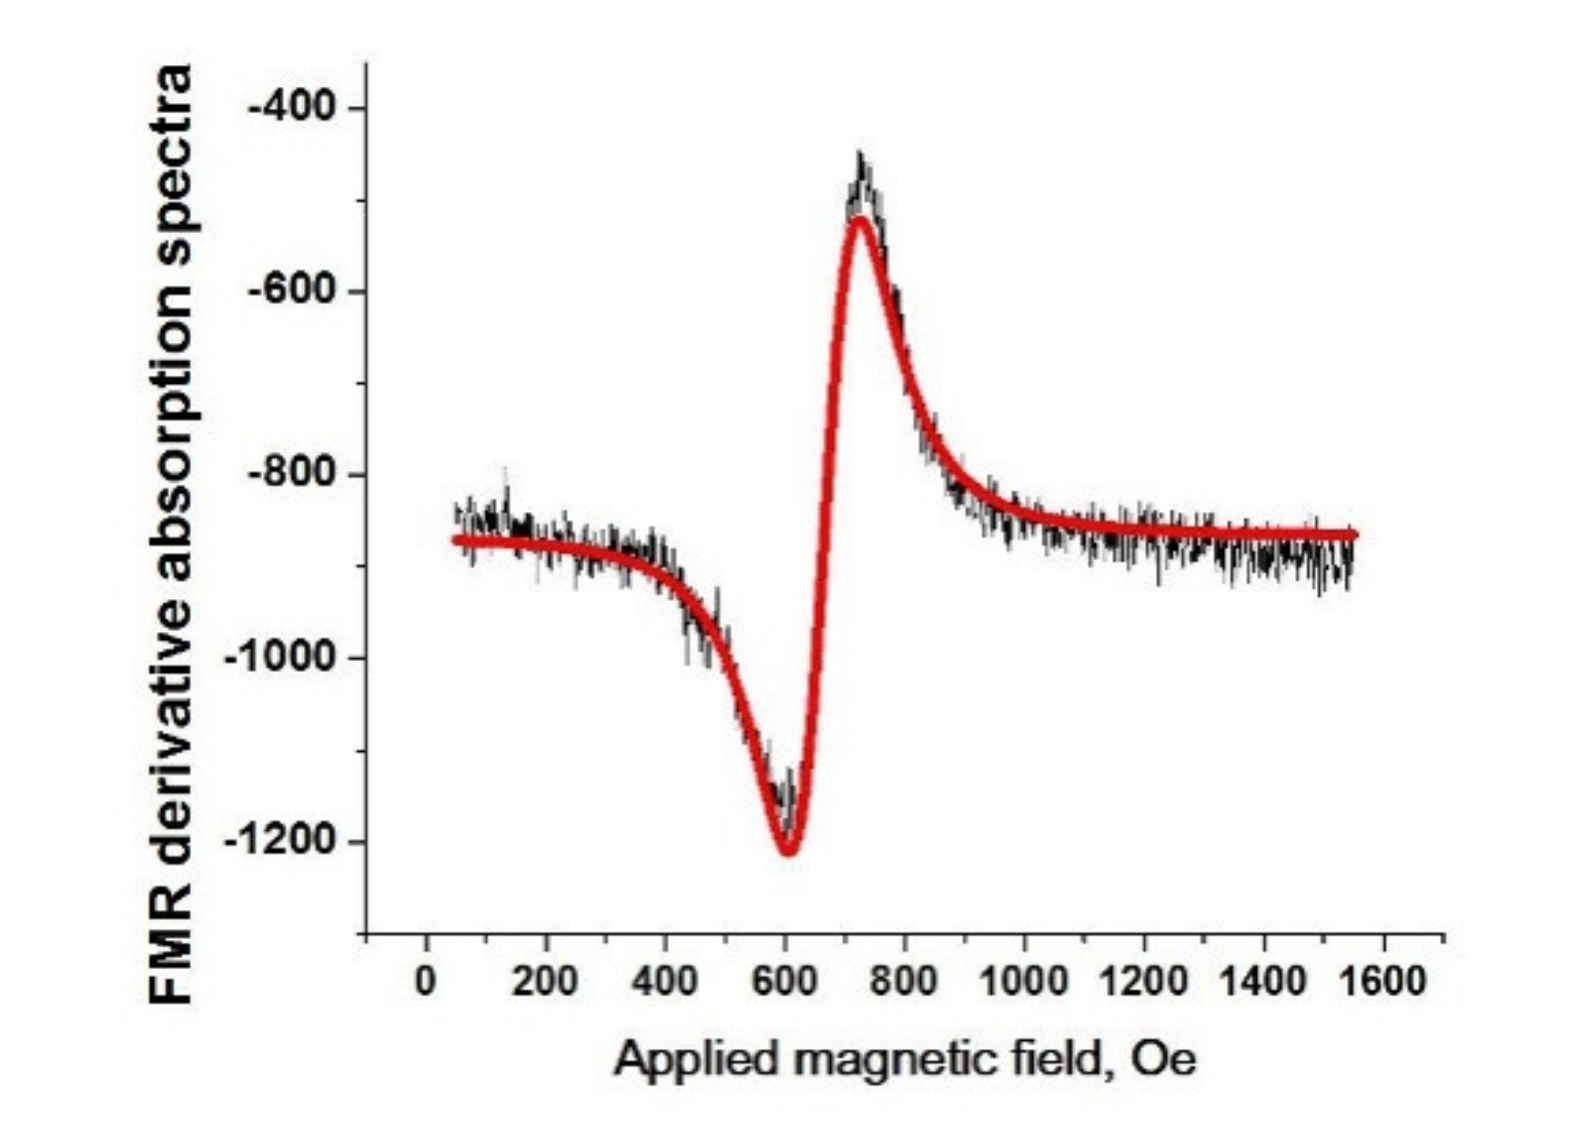
LW can be considered as a sum of a term proportional to the frequency of exiting microwave radiation ΔHin(ω) and a term ∆Hex(0) independent of the frequency. Following [5,6,7], it can be written as
∆HFMR(ω) = ∆Hin(ω) + ∆Hex(0) = 2αinωr/γ + ∆Hex (0)
The first term is insensitive to the method of the sample preparation and reflects the intrinsic interaction of exiting microwave radiation with an electronic band structure, leading to so-called intrinsic or Gilbert damping. The damping parameter can be estimated as a derivative of LW ΔHFMR via [8]
αin = (√3/2) γ (dΔHFMR/dω)
The second term in (5), the so-called extrinsic contribution, reflects an additional LW broadening due to defects and inhomogeneities in crystal structures. It can be obtained as an intercept of the plot of LW vs. ω at zero frequency.
(2)
W is low for a perfect bulk single crystalline ferromagnetic but drastically increases when a surface is rough, as shown in classical experiments of LeCraw [9], where single crystalline YAG spherical samples were polished with a variety of grit size polishing paper, introducing different morphological defects on the samples’ surfaces.
(3)
The FMR LW in thin films can be much larger than in bulk ferromagnetics, increasing proportionally to inverse square of the thickness, ∆HFMR ~ 1/tFp, with p = 2 in polycrystalline NiO/NiFe in exchange bias films [10] and 1.75 ± 0.2 in epitaxial Fe films [11]. Being able to separate intrinsic and extrinsic contributions, as described above, it is possible to obtain extrinsic damping parameter αex, which does depend on sample thickness and preparation. Thus, in NiFe film, αex was determined to be equal to 0.03 for the thickness tF = 4.3 nm, and decreased to 0.008 at 50 nm [10].
(4)
LW for epitaxial films is narrower than in polycrystalline. The damping parameter in epitaxial Fe film was estimated to be αin = 3 × 10⁻³[11], while, for polycrystalline films, it is normally larger than 5 × 10⁻³.
Most of the observations have been successfully interpreted within the model of two-magnon scattering. A detailed theory is presented by Arias and Mills [12]. The magnetic moments of the ferromagnetic atoms in a uniform media with applied magnetic field make a uniform precession with wave vector k = 0, coupled with the microwave excitation field and manifold spin wave modes, which are not directly excited. Magnetic nonuniformities in two-magnon models are considered as perturbations, initiating a coupling between the normal modes. Magnon scattering with the creation of two magnons k1, k2 ≠ 0, conserves the energy but not the momentum, resulting in a dynamic magnetic moment damping and a broadening of the FMR line.
The motivation of this paper was to compare the properties of two sets of samples with ferromagnetic/antiferromagnetic layers with the opposite order of F and AF layer depositions. A single variable of deposition was the thickness of the AF layers. In spite of identical other conditions of deposition, we could expect different growth mechanisms and different resulting magnetic and structural properties of the F-layers, even for the same layer thickness. The FMR is an excellent probe to test these properties. Below, we present the results and the analysis of the data. Specifically, we concentrate on the variation of LW because it contains important information on the dynamics of the high frequency response of the tested structure, and important information about the influence of different factors on the FMR LW.

2. Results and Discussion

Multilayer structures Ta(30 nm)/Ni80Fe20(10 nm)/IrMn(tAF)/Ta(30 nm), (F/AF or TS samples), and Ta(30 nm)/IrMn(tAF)/Ni80Fe20(10 nm)/Ta(30 nm) (AF/F or BS samples) on silicon substrate were investigated with tAF = 10, 20, 30, and 40 nm of AF thickness. Sample surface morphology was investigated by atomic force microscopy to obtain the mean square roughness σrms. The magnetic characteristics were studied by FMR with the frequency ω/2π = 9.65 GHz. A scanning FMR magnetic field H up to 6 kOe was applied along the sample surface. The resonance magnetic field, Hr, LW, and ΔHFMR, were obtained from the Lorentzian function fit of a derivative of the microwave absorption spectra; a representative curve is given in Figure 2. The other magnetic characteristics of the samples entered in Equation (4) are the uniaxial anisotropy field, the exchange bias field, and the geometry angles shown in Figure 1. These characteristics were obtained from the fitting of the angular dependences (AD) of the resonant magnetic field, Hr(φH). A more complete account of the results is given in [13].
The topography of the sample surface was measured using an atomic-force microscope. The representative picture of the surface scan is given in Figure 3.
Here, we report on strongly divergent LW values, as presented in Figure 4a, for different thicknesses of AF layers in BS and TS samples, and discuss the possible origins of the divergence. It would be reasonable to assume that the intrinsic contribution to the FMR damping—see right-hand-side in Equation (5)—is the same for BS and TS; thus, the divergence is due to extrinsic factors. We start with a discussion of the contributions of traditional extrinsic factors of influence on FMR damping, the effect of exchange bias, and roughness. The AF-thickness dependencies on these factors are shown in Figure 4b,c, respectively.

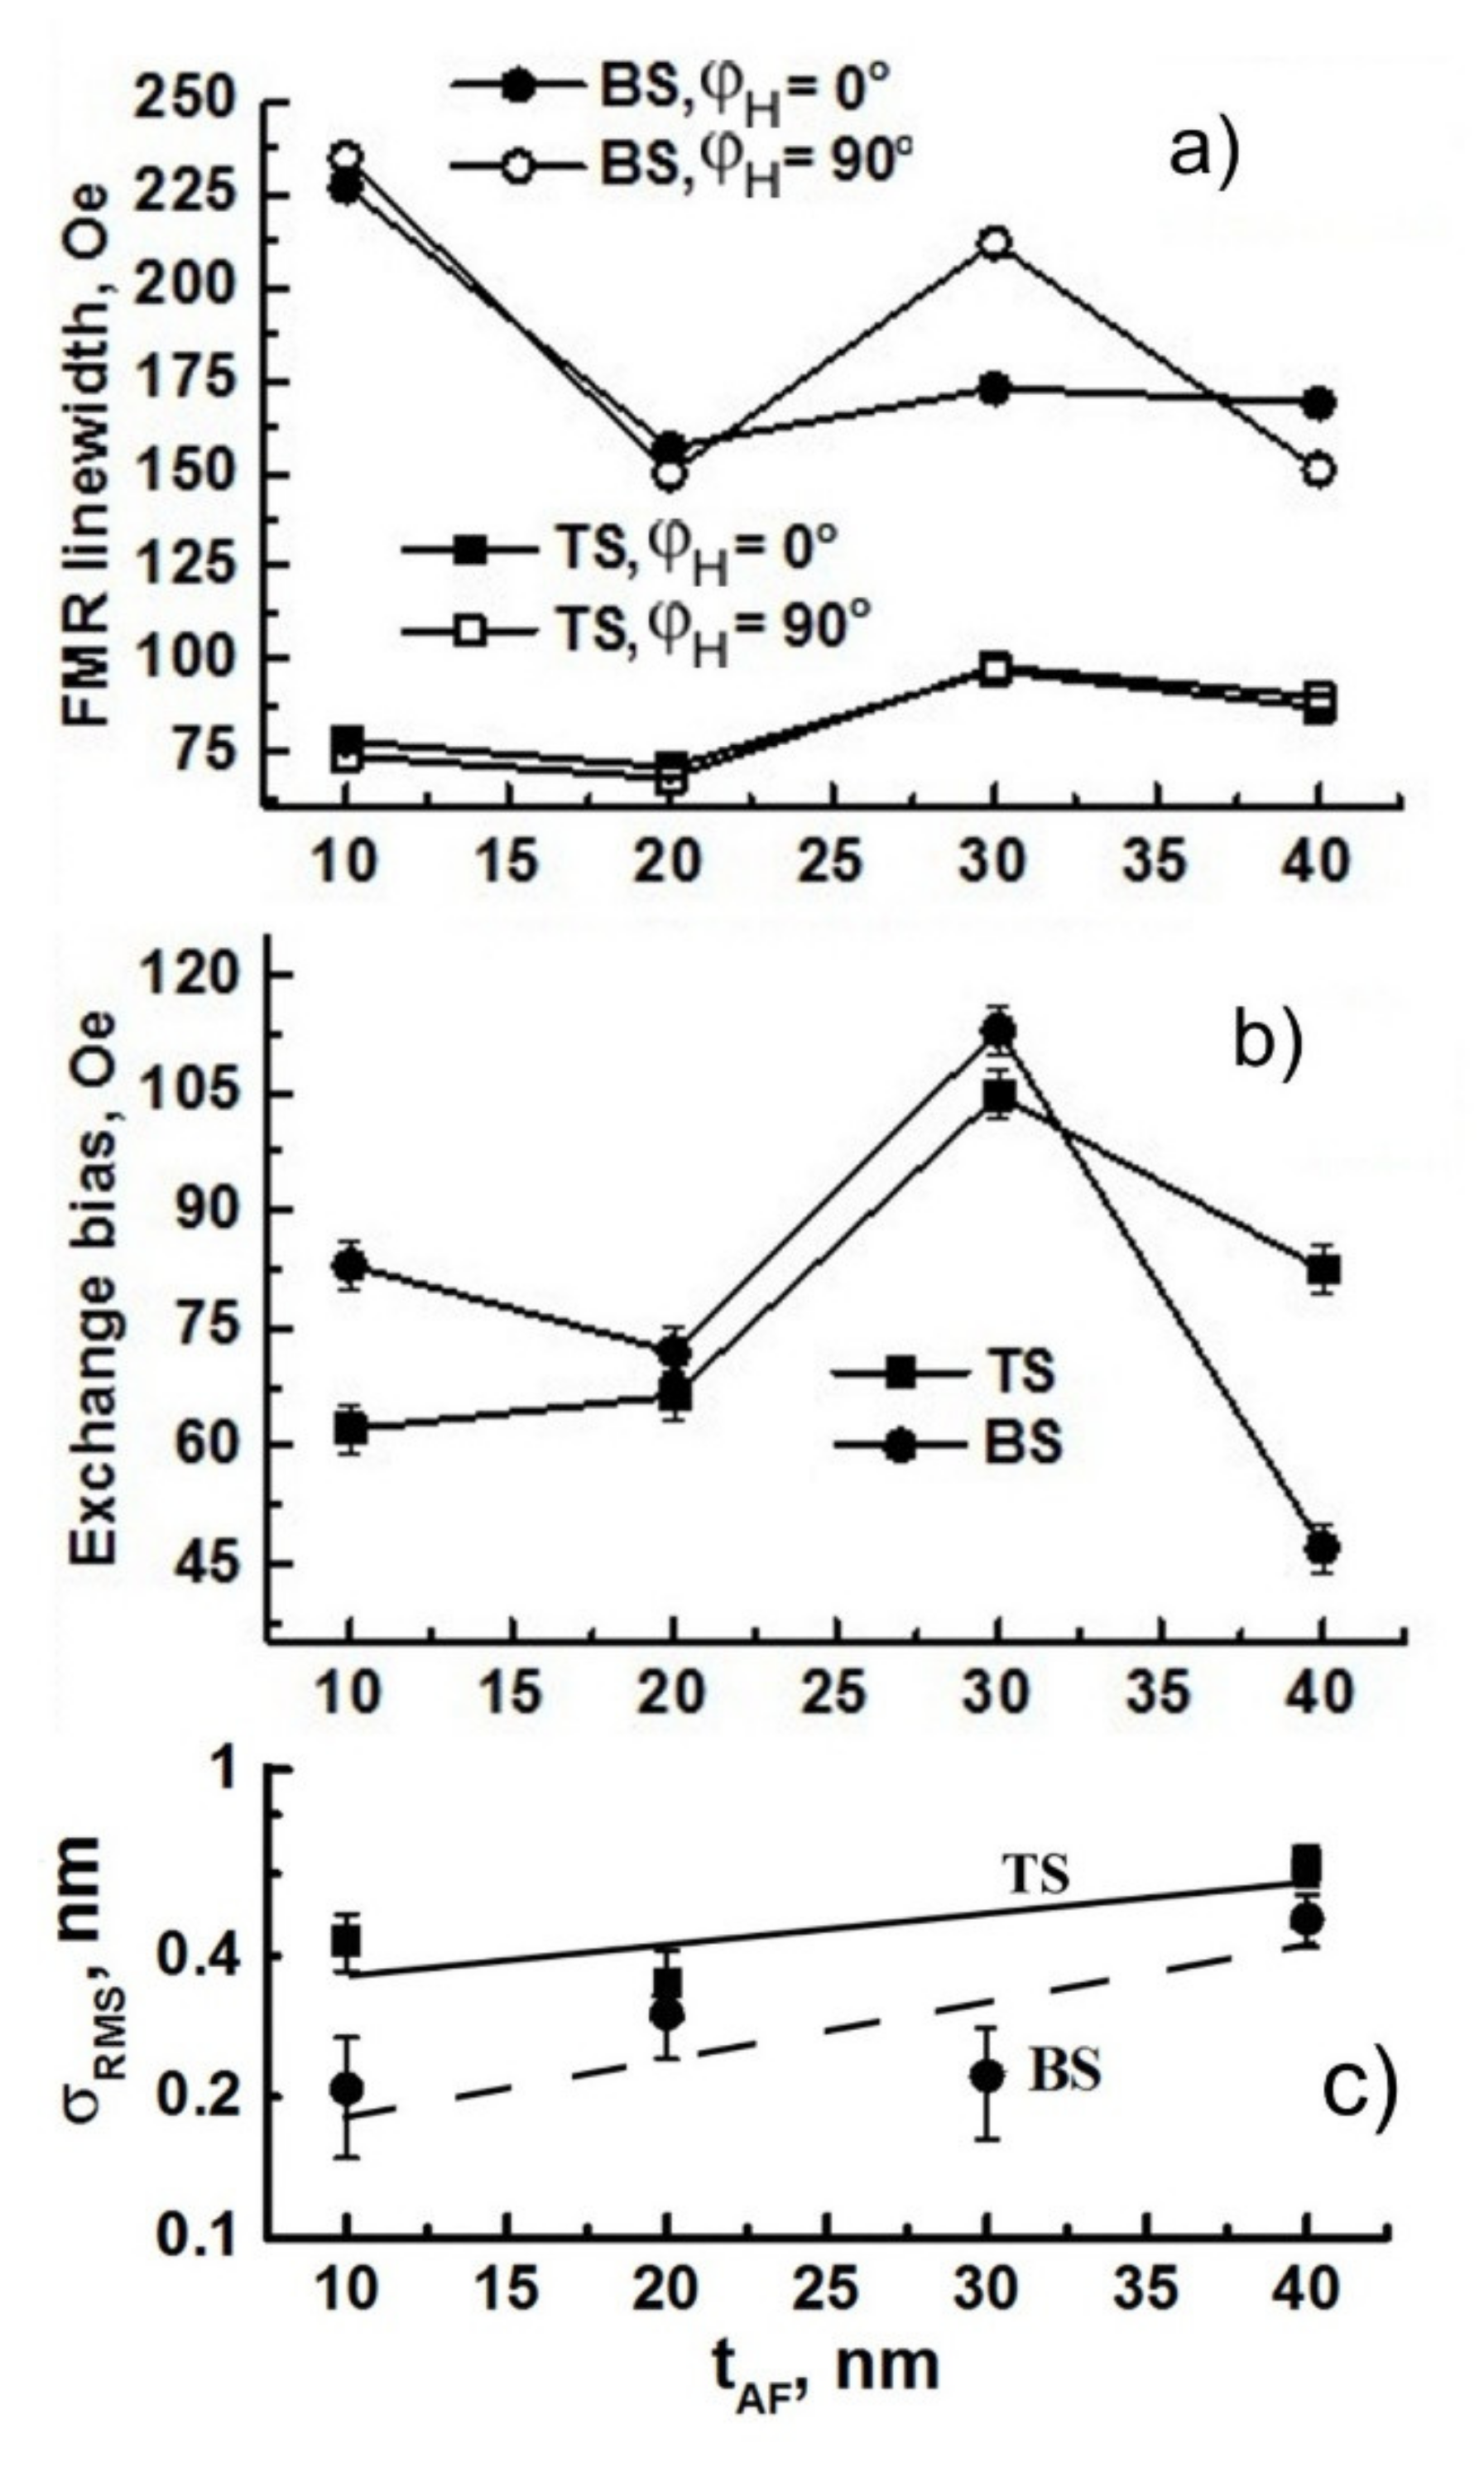
2.1. Analysis of Exchange Bias Effect on FMR LW

The correlation between the LW and exchange bias has been demonstrated in a number of papers [10,14,15,16]. In [10], the authors showed much larger LW in the exchange biased NiFe(37 < tF <137 Å)/NiO(860 Å) binary F/AF structure than in the NiFe(t)/Si(100) single F-layer. The effect was qualitatively interpreted within the model of two-magnon scattering processes, based on the Arias–Mills approach [12], due to the local fluctuation of the exchange coupling caused by uneven interface topology.
As follows from Figure 4b, our observations do not support the cited results. In our case, the variation of HEB for BS and TS samples is too weak and cannot explain more than two times difference in ∆H. Thus, another reason is to be found to explain our observation.

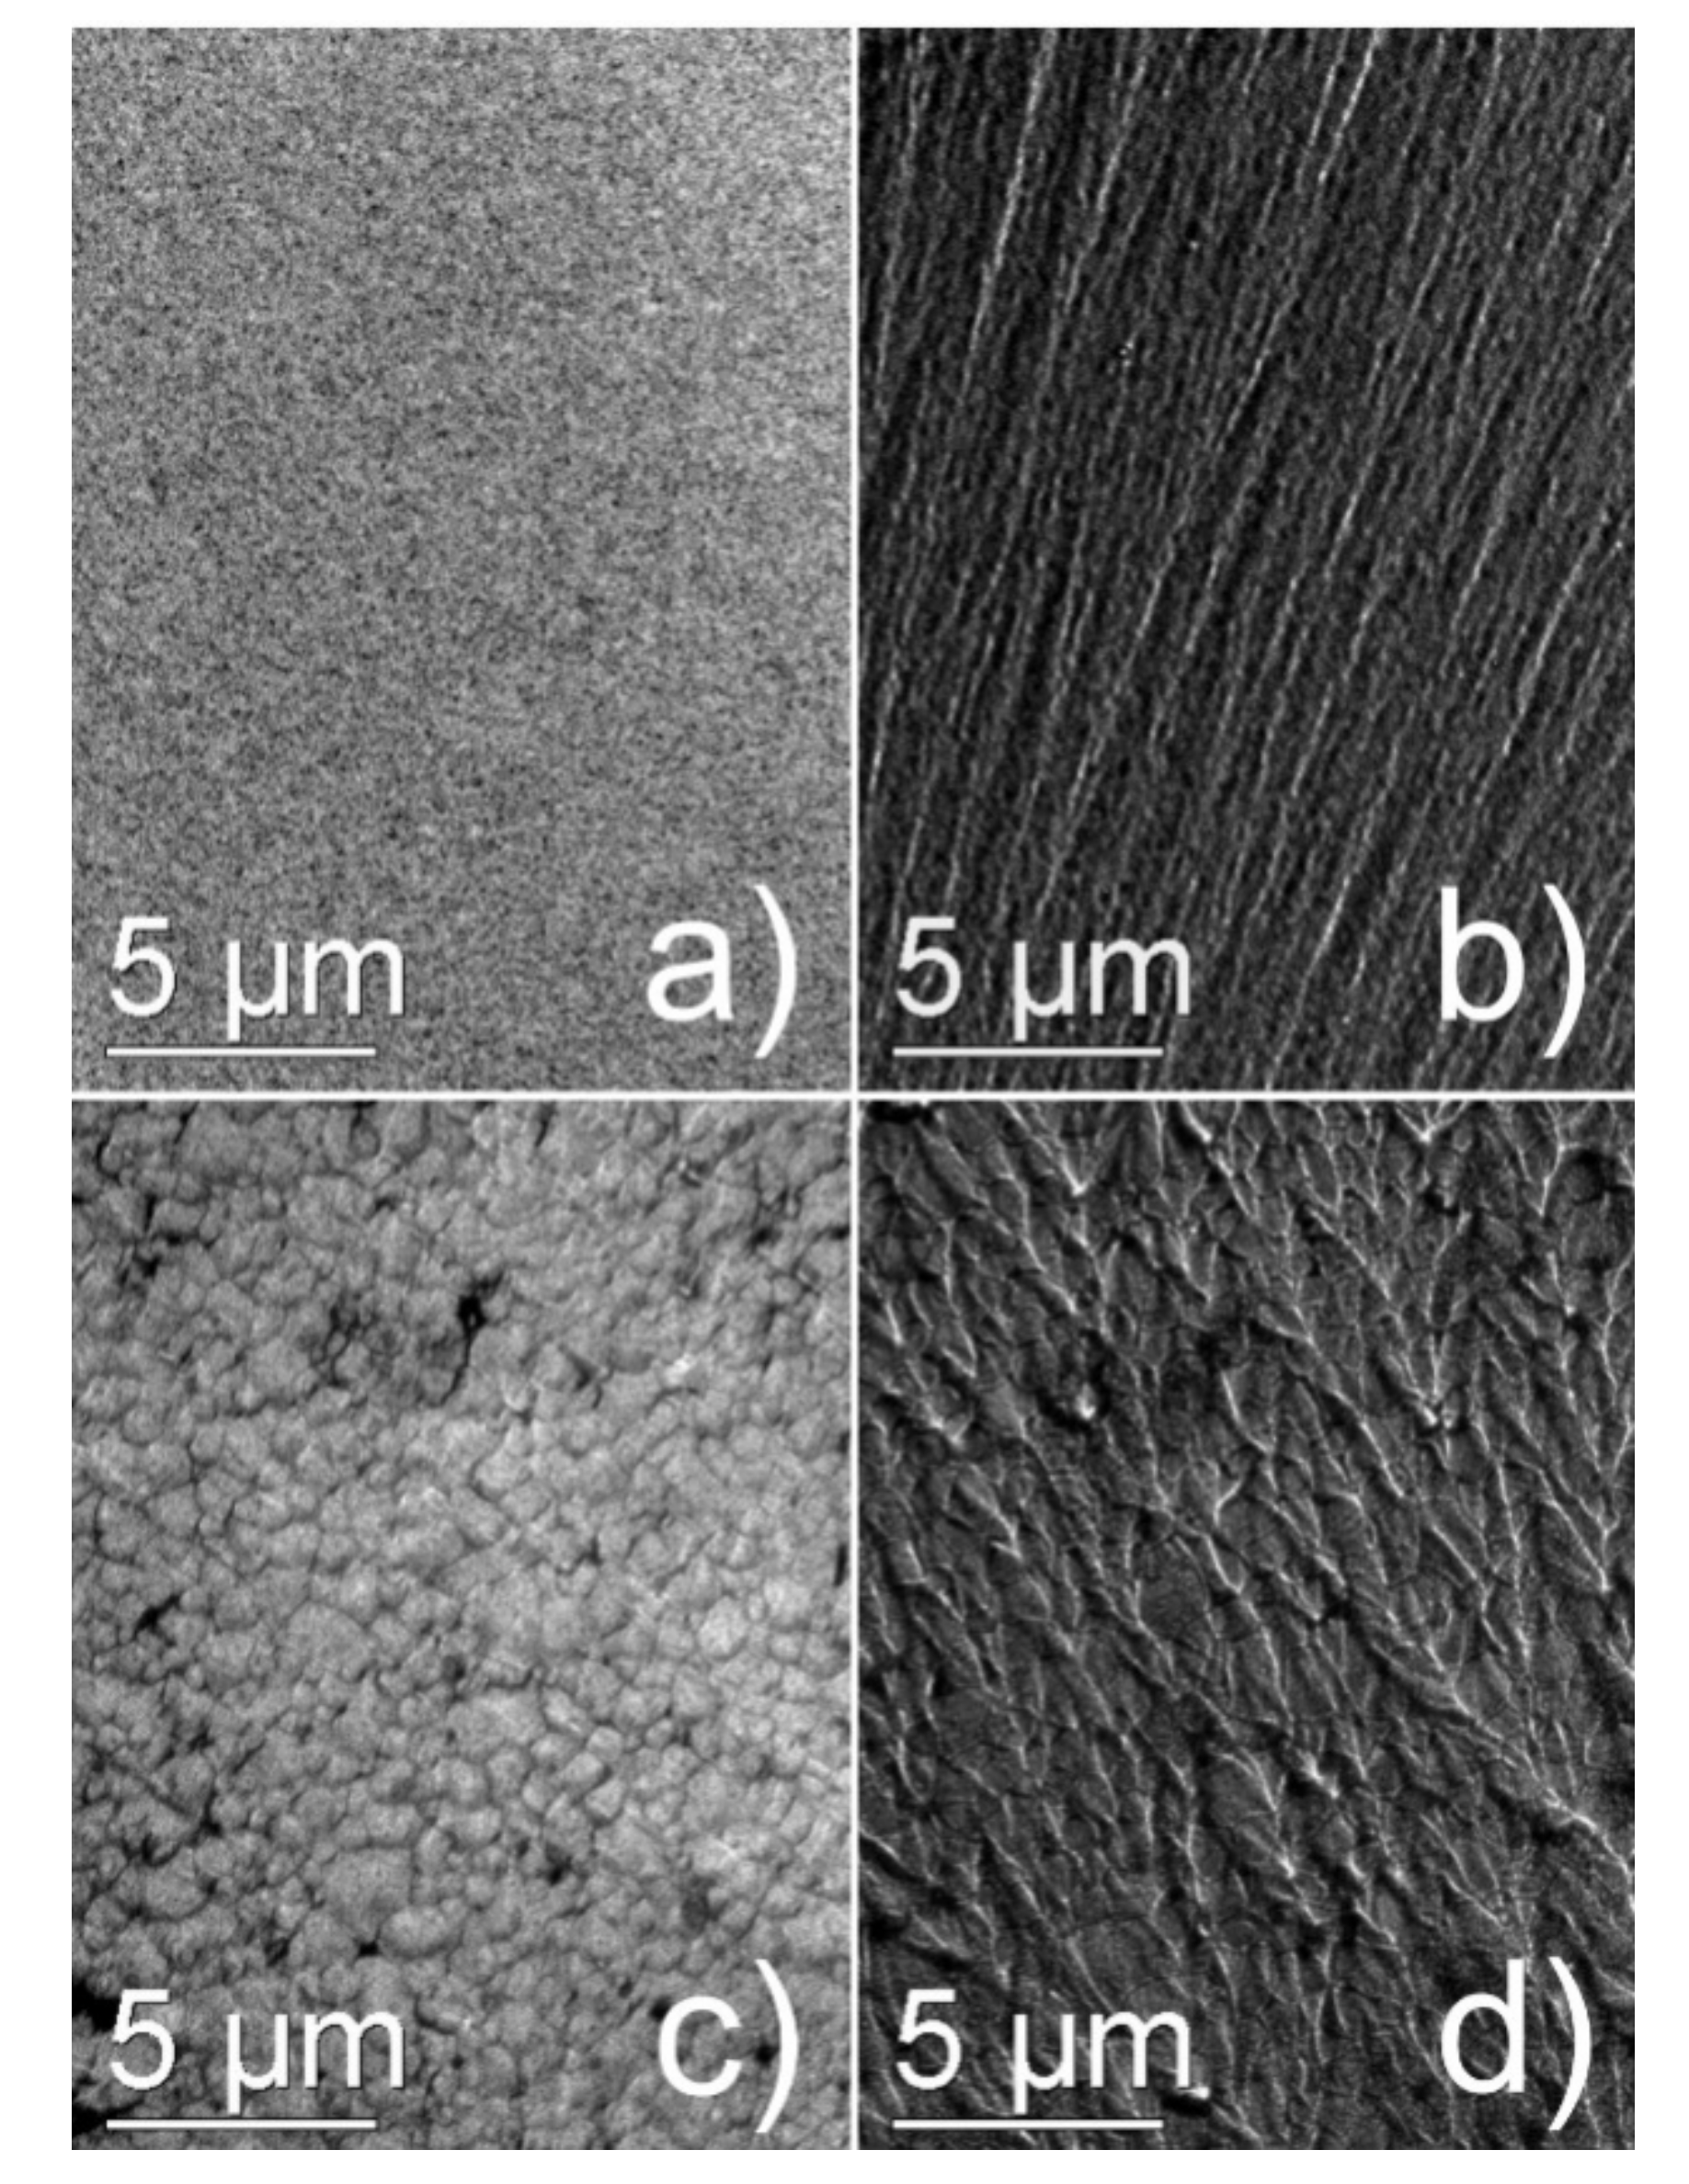
2.2. Roughness Effect on LW

Surface or interface roughness is considered as a possible source of LW broadening. Magnetic fluctuations due to nonhomogeneities in the form of pits, bumps, and scratches on the surface of the bulk crystals lead to LW broadening [9]. A linear dependence of LW on the radius of the pit was predicted in [17]. Other works predict a proportionality of ΔH to specific volume of pores [18] and the area of defects on the surface [11,12,19,20]. The effect of surface or interface inhomogenieties increases for thin ferromagnetic samples. In most of the publications for damping in thin films, following [12], the two-magnon scattering mechanism is considered on local magnetic inhomogenieties with topographic step-like or parallelepiped-like shapes, with the long side parallel to the magnetization directions [10,11,16]. Unfortunately, experimental evidence supporting the predictions of FMR LW dependence with topological defects on the surface or interface in thin multilayered structures is almost absent.
An AFM study of our samples revealed that most of inhomogenieties are peaks or bumps without a preferred elongation on the surface (Figure 3) and, hence, should not contribute to FMR LW within a two-magnon mechanism. The rms-roughness of TS and BS samples, as a function of AF-layer thickness, is shown in Figure 4. Comparing Figure 4a,c, we note that, having a larger roughness, TS demonstrates smaller ∆H and vice versa for BS samples. This observation is in contrast with expectations and proves that roughness is not a dominating mechanism of LW broadening.

2.3. Influence of Microstructure on FMR Damping

The analysis reported in previous sections indicates that none of the analyzed mechanisms can explain the difference in LW for BS and TS structures. The only item which we missed in our consideration is microstructure issue. We analyzed the possible effects of surface roughness on LW, but not a possible effect of microstructure in the film body.
To this point, we assumed that the sample was homogeneous, with a definite direction of the EA and anisotropy field HK. However, in a poly- and nanocrystalline sample, this is not so. The presence of grains with different crystallographic orientations leads to an averaging of the magnetocrystalline anisotropy of crystallites with some residual uncompensated local variation of magnetocrystalline anisotropy, perturbing the uniaxial anisotropy and causing smooth spatial oscillations of magnetization. Spatially fluctuating magnetization, so-called “micromagnetic ripple”, correlates with grain size, and can be an additional, if not major, source of LW broadening [21]. Below we consider the effect of micromagnetic ripple on FMR LW.

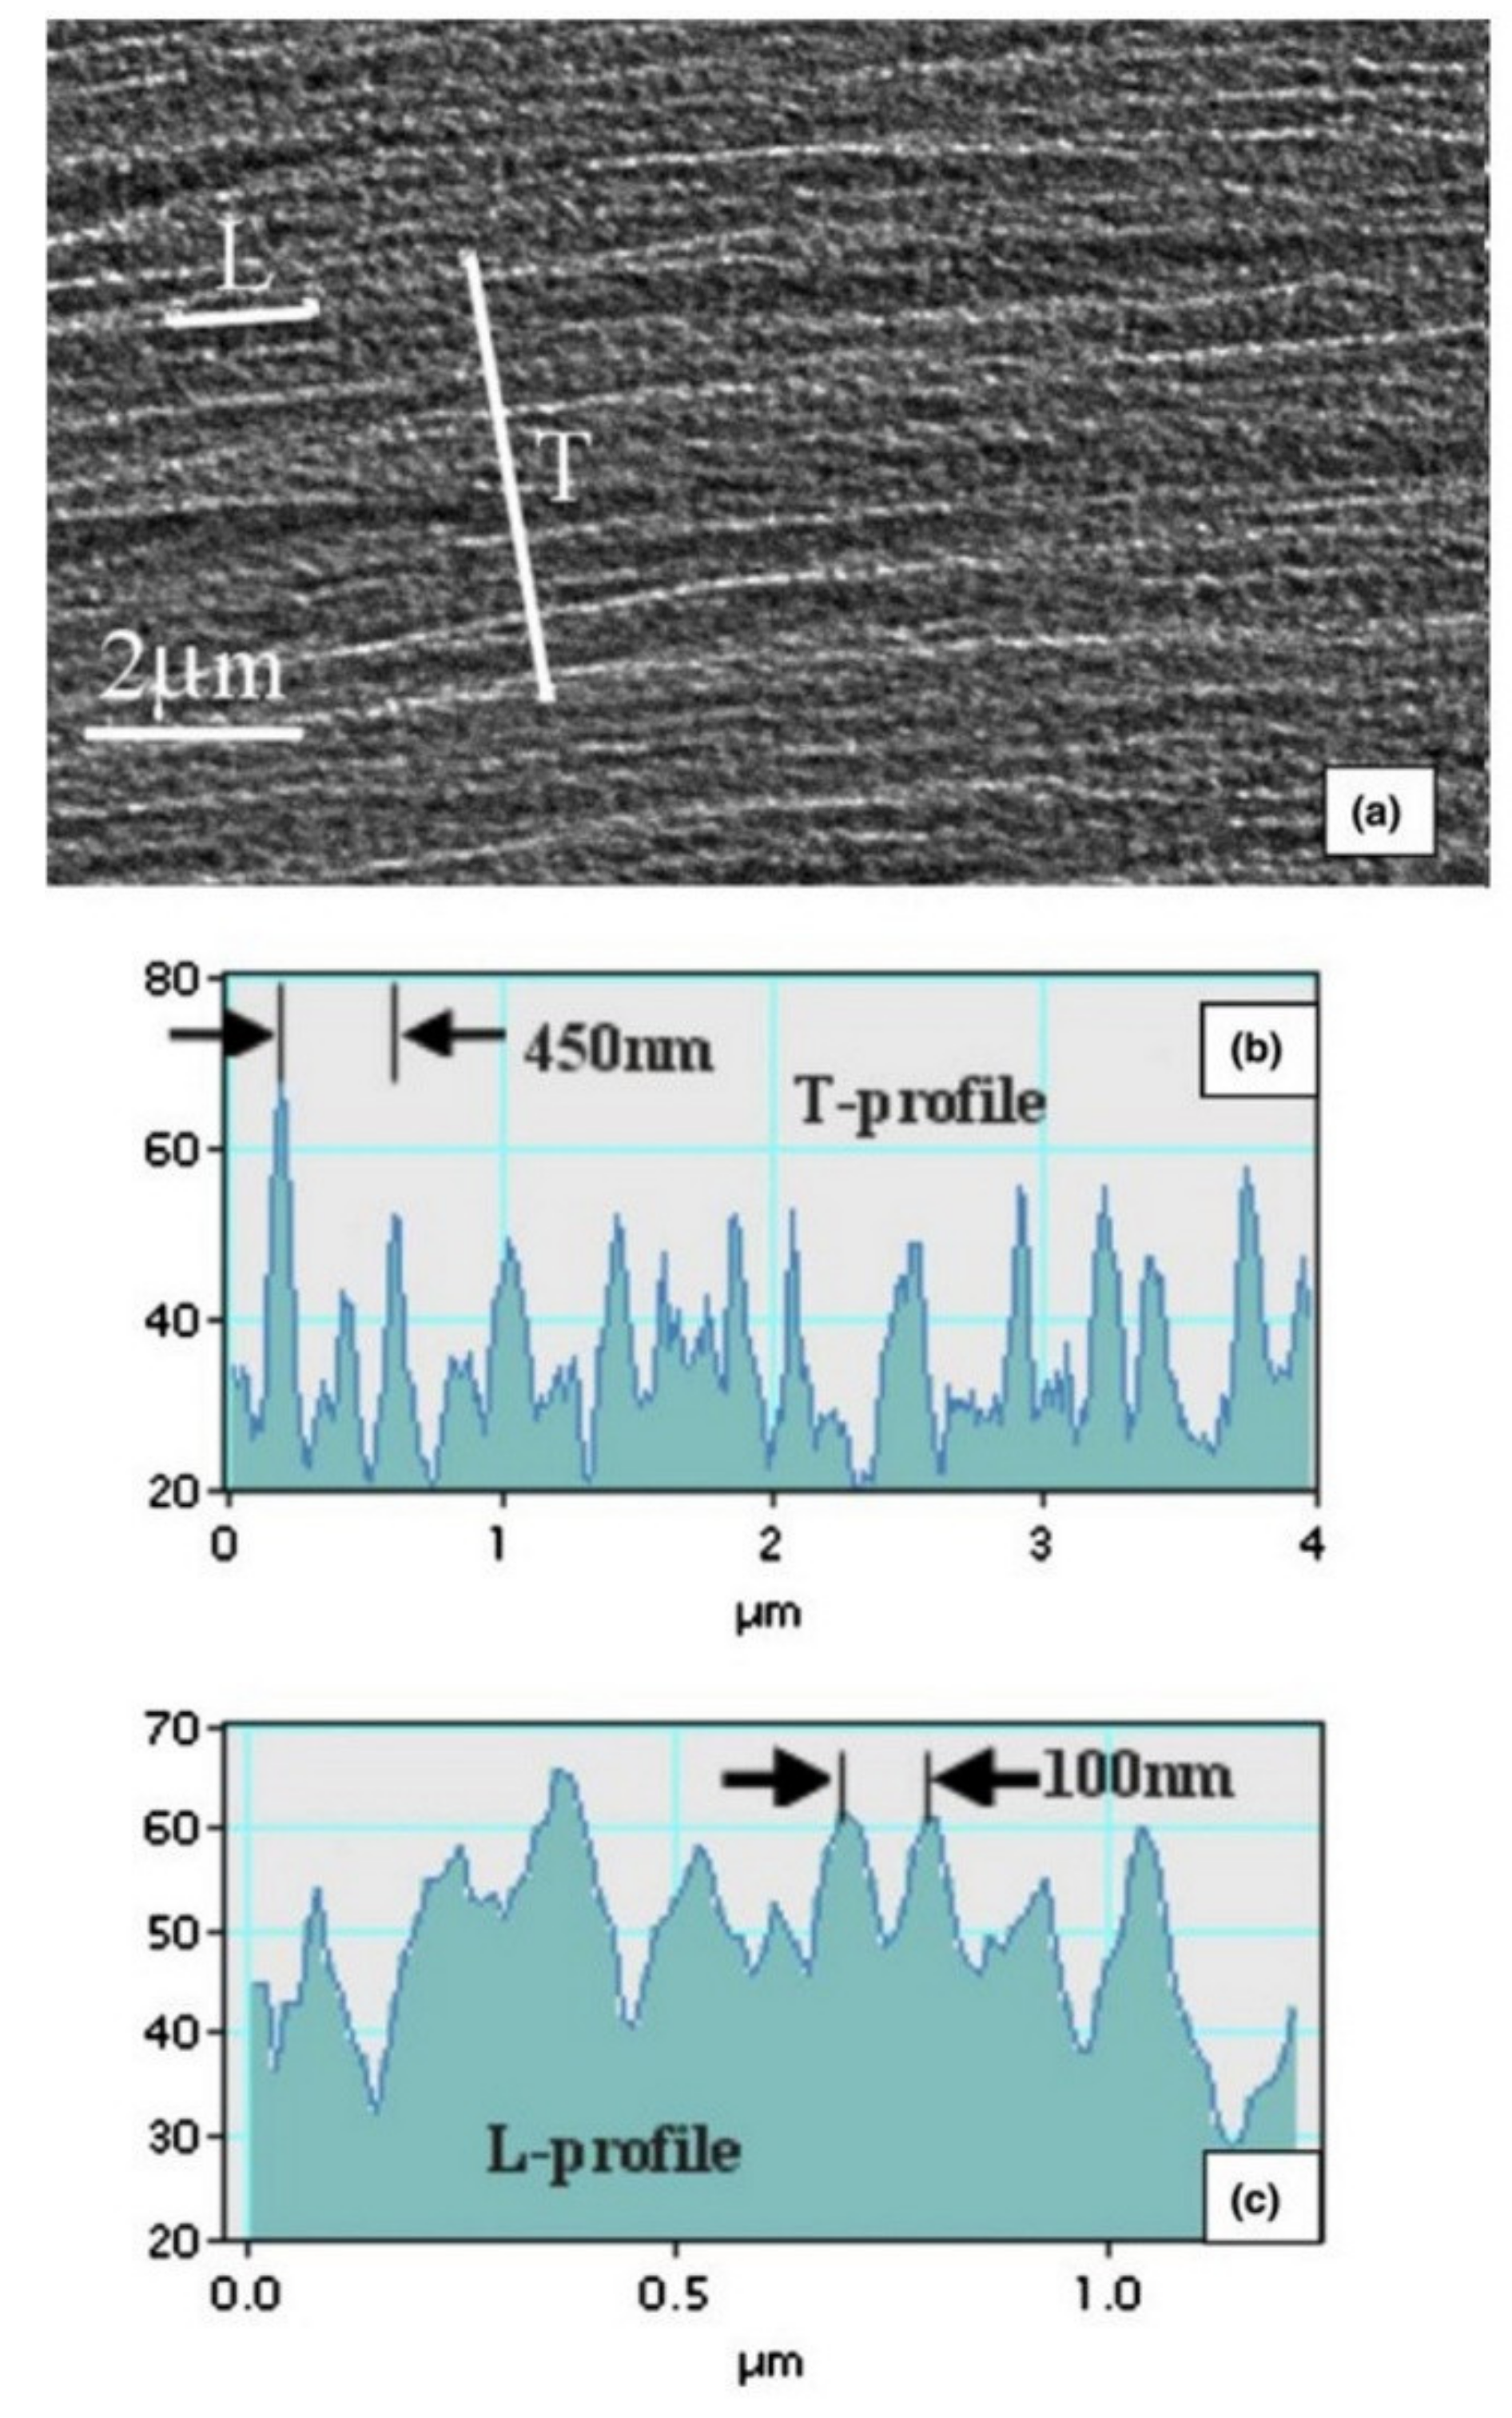
2.3.1. Microstructure and Micromagnetic Ripple

It has been shown that non-complete averaging out of the magnetocrystalline anisotropy in polycrystalline samples leads to a local deviation of the easy axis (EA) from the average direction to an angular spread of the magnetization, and a stray field predominantly oriented along the EA [22,23]. The local oscillation of the magnetization is observed as a ripple structure in a defocused film image in the Lorentz Transmission Electron Microscopy (LTEM) in the Fresnel mode [24,25,26] (Figure 5). The ripple lines of the LTEM contrast image are oriented along the EA of the ferromagnetic film, and the dotted contrast of the ripple lines reflects the variation of magnetization along them.
Due to the exchange interaction, the oscillations become smooth and are approximated by a single period harmonic function
My(x) = Mϕ0 sin(2πx/λx);
where x,y are axis along and perpendicular to the average EA, and ϕ0, λx are the amplitude and period of the angular oscillations (wiggling). It is shown experimentally and supported by a theoretical analysis that, besides the oscillation of the transverse component of magnetization (TCM), there is also periodical oscillation of a longitudinal component of magnetization (LCM), leading to a dot-like contrast in the LTEM ripple image (L-profile in Figure 5c) [27].
It is important to underline that the microstructure correlates with the ripple micromagnetic structures, as illustrated in Figure 6. For small grain size below 20 nm and with smooth, flat surfaces, the ripples are almost parallel (Figure 6a,b); however, for films with large roughness, grain size, porosity, or other type of defects, as well as being 1 μm or larger, the LTEM ripples start branching (Figure 6c,d), or form a disordered structure [28]. This observation is in qualitative agreement with so-called linear theory of magnetization dispersion, or linear theory of ripple (LTR), developed by Hoffmann [29,30] Harte [31], and Rother [32], where the magnetization dispersion angle can be approximately expressed as [33]
2> 1/2 = S/[27/4 (MstF1/2)1/2(AKu)3/8h3/8H)],
where Ms is saturation magnetization, tF is the film thickness, A is the exchange constant, Ku is the uniaxial anisotropy, h(φH)= h cos(φH − φ0) + cos2φ0, φH is the angle between the EA and the applied field, φ0—the angle between the EA and the mean magnetization (φ0 = φ − β, according to notations in Figure 1), and h = H/Hk is the normalized field. The most essential parameter is the structure constant, S, which determines the ripple properties of the film.
S = (KDσ1)/n1/2,
where K is the local anisotropy, D is the mean diameter of the crystallites, σ1 is the standard deviation of angular functions (1/6 < σ1 < 1/√2), and n = tF/D is the number of the crystallites through the film thickness.
The prediction of the LTR was supported qualitatively by our observations, illustrated in Figure 6, and quantitatively by numerical micromagnetic simulations [34]. The grain-size effects on the dispersion angle, as well as dependencies of the dispersion angle on the film thickness tF, exchange constant A, and local anisotropy, were in a reasonable agreement between computer simulations [34,35,36] and the LTR at a small dispersion angle, (<2°) and the deviation increased at larger 2> 1/2. The limitation of the LTR by a small dispersion angle was originally recognized by Hoffmann [33], so deviation at 2>1/2 > 2° can be assigned to nonlinear effects. Some of them were also analyzed by Hoffmann [33]. The effect of grain-size induced broadening of the FMR LW will be discussed in the following section.

2.3.2. Stray Field Effect on FMR Line Position and Width

Hoffman showed that the oscillation of EA and wiggling of the magnetization creates a so-called internal demagnetizing or stray field [33,35]
Hst = S2tF1/2/[25/4πA5/4Ms1/4h1/4H)],
Thus, in accordance with (9), the stray field is proportional to the square of the size of the grains in polycrystalline film. The influence of the stray field on the FMR line position and width is discussed in [36,37]. Following the approach developed in these works, the FMR frequency can be written as
ω02 = γ2NzMs (Heff +Hst),
where Nz = 4π is the demagnetizing factor for thin film, Heff can be generalized for the films with exchange bias as
Heff = H + HEB + HKcos2φ0.
The line width broadening due to stray field is written as [38]
(<Δω02>)1/2 = γ (NzMs<Hst2>1/2)1/2 = γ Ms ϕ0 (21/2πNz)1/2
Applying (6)–(8) for FMR measurements with constant frequency and scanning magnetic field, the resonance line width
ΔH = 2ω0Δω0/(γ2NzMs)) ≈ 2[Hst (Heff + Hst)]1/2,
where (9) can be applied for Hst in (13). Following (8), (9), (13), the LW depends as a square of structure constant S and the size of the grains D in poly- or nanocrystalline film. Using (13), one could estimate that the stray fields in BS and TS layers are of 7.5 Oe and 2.5 Oe, respectively. Following (8), (9), it corresponds to the size of grains in BS about two times larger than in TS. This conclusion is important to keep in mind while discussing the origin of the FMR LW broadening.

3. Conclusions

In the paper we discussed possible extrinsic sources of FMR damping in multilayer structures Ta(30 nm)/Ni80Fe20(10 nm)/IrMn(tAF)/Ta(30 nm) (TS) and Ta(30 nm)/IrMn(tAF)/Ni80Fe20(10 nm)/Ta(30 nm) (BS), with alternative order of deposition F/AF and AF/F. We have demonstrated that the FMR linewidth of BS samples is much larger than in TS samples. The difference cannot be explained by traditionally considered effects. It cannot be due to exchange bias, since the difference in HEB for TS and BS samples is small. It cannot originate from surface/interface roughness, since TS samples, having narrower LW, showed more rough surfaces. We proposed that the TS and BS samples have a different LW because of a significant difference in the microstructure of the F-layer. The F-layer in TS is grown on structureless (amorphous or tiny-nano-grained) buffer Ta layer, and inherited a small size of (nano) grains. On the contrary, the F-layer in BS samples is grown on the top of the AF layer, which can form grains with a larger size and translate this grainsize to the F-layer. A larger grainsize leads to a larger magnetization ripple in the F-layer and to an internal stray field, which could be an origin of intense spinwave scattering and the enhancement of FMR damping.

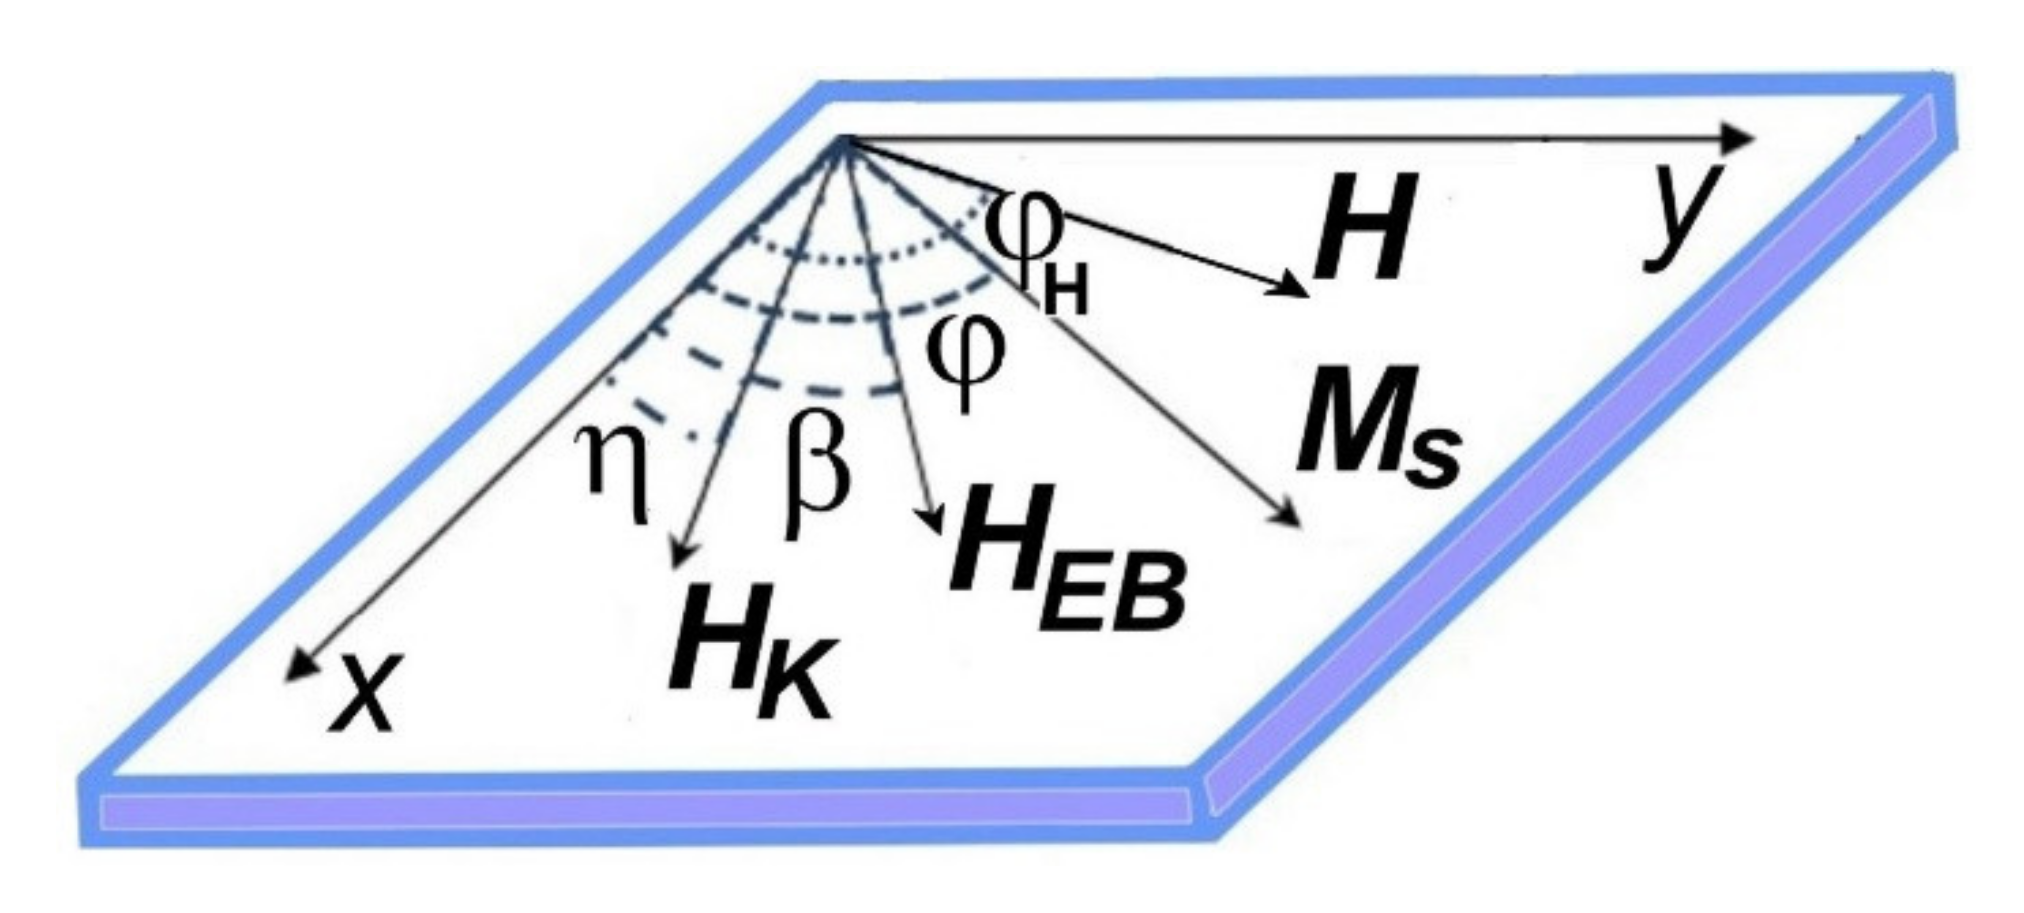
4. Materials and Methods

Using DC magnetron sputtering, multilayer structures Ta(30 nm)/Ni80Fe20(10 nm)/IrMn(tAF)/Ta(30 nm) (TS) and Ta(30 nm)/IrMn(tAF)/Ni80Fe20(10 nm)/Ta(30 nm) (BS) on silicon substrate were prepared with tAF = 10, 20, 30, and 40 nm of the AF thickness. The choice of tAF thickness was dictated by an interest in practical devices, such GMR sensors. Smaller tAF normally provides a lower exchange bias. Besides, our experience shows much more frustrated properties of the F/AF system at a tAF below 10 nm [3]. A permanent in-plane magnetic field of 420 Oe was applied during the deposition to induce the uniaxial and unidirectional magnetic anisotropy The magnetic properties of the samples were obtained from the shape of FMR absorption lines and from measurements of angular dependence of FMR absorbtion spectra, as described elsewhere [3,13].

Author Contributions

Conceptualization, N.G.C. and I.O.D.; methodology, N.G.C., I.O.D. and G.V.B.; validation, A.V.M., I.O.D.; investigation, N.G.C., I.O.D., G.V.B., M.G.K., I.L.R. and A.V.M.; writing—original draft preparation, N.G.C.; writing—review and editing, M.G.K. and I.L.R. All authors have read and agreed to the published version of the manuscript.

Funding

This research was subsided for fulfilling state task #01201255521 by SINP MSU.

Acknowledgments

Part of the work was performed using the equipment of the MSU User Facilities Centre.

Conflicts of Interest

The authors declare no conflict of interest.

References

  1. Landau, L.; Lifshitz, E. On the theory of the dispersion of magnetic permeability in ferromagnetic bodies. Phys. Z. Sowjetunion 1935, 8, 153–166. [Google Scholar] [CrossRef]
  2. Gilbert, T.L. A Lagrangian formulation of the gyromagnetic equation of the magnetic field. Phys. Rev. 1995, 100, 1243. [Google Scholar]
  3. Dzhun, I.O.; Babaytsev, G.V.; Chechenin, N.G.; Gritsenko, C.A.; Rodionova, V.V. FMR investigations of exchange biased NiFe/IrMn/NiFe trilayers with high and low Ni relative content. JMMM 2019, 470, 151–155. [Google Scholar] [CrossRef]
  4. Smit, H.J.; Beljers, H.G. Ferromagnetic resonance absorbtion in BaFe12O19, a highly anisotropic crystall. Phillips. Res. Rep. 1955, 10, 113–130. [Google Scholar]
  5. Heinrich, B.; Cochran, J.F.; Hasegawa, R. FMR linebroadening in metals due to two-magnon scattering. J. Appl. Phys. 1985, 57, 3690–3692. [Google Scholar] [CrossRef]
  6. Celinski, Z.; Heinrich, B. Ferromagnetic resonance line width of Fe ultrathin films grown on a bcc-Cu substrate. J. Appl. Phys. 1991, 70, 5935–5937. [Google Scholar] [CrossRef]
  7. Kalarickal, S.S.; Krivosik, P.; Wu, M.; Patton, C.E.; Schneider, M.L.; Kabos, P.; Silva, T.J.; Nibarger, J.P. Ferromagnetic resonance linewidth in metallic thin films: Comparison of measurement methods. J. Appl. Phys. 2006, 99, 1–7. [Google Scholar] [CrossRef] [Green Version]
  8. Okumura, H.; Twisselmann, D.J.; McMichael, R.D.; Huang, M.J.; Hsu, Y.N.; Laughlin, D.E.; McHenry, M.E. Magnetic and structural characterization and ferromagnetic resonance study of thin film HITPERM soft magnetic materials for data storage, applications. J. Appl. Phys. 2003, 93, 6529–6530. [Google Scholar] [CrossRef] [Green Version]
  9. LeCraw, R.C.; Spencer, E.G.; Porter, C.S. Ferromagnetic resonance line widths in yttrium iron garnet. Phys. Rev. 1958, 110, 1311–1313. [Google Scholar] [CrossRef]
  10. Kuanr, B.K.; Camley, R.E.; Celinski, Z. Exchange bias of NiO/NiFe: Linewidth broadening and anomalous spin-wave damping. J. Appl. Phys. 2003, 93, 7723–7725. [Google Scholar] [CrossRef]
  11. Kuanr, B.K.; Camley, R.E.; Celinski, Z. Relaxation in epitaxial Fe films measured by ferromagnetic resonance. J. Appl. Phys. 2004, 95, 6610–6612. [Google Scholar] [CrossRef]
  12. Arias, R.; Mills, D.L. Extrinsic contributions to the ferromagnetic resonance response of ultrathin films. Phys. Rev. B 1999, 60, 7395–7409. [Google Scholar] [CrossRef]
  13. Dzhun, I.O.; Babaytsev, G.V.; Kozin, M.G.; Romashkina, I.L.; Shanova, E.I.; Chechenin, N.G. The effect of extrinsic factors on the line width of ferromagnetic resonance in structures with exchange bias. Fiz. Tverd. Tela 2021, 63, 693–698. (In Russian) [Google Scholar] [CrossRef]
  14. Speriosu, V.; Parkin, S.; Wilts, C. Standing spinwaves in FeMn/NiFe/FeMn exchange-bias structures. IEEE Trans. Magn. 1987, 23, 2999–3001. [Google Scholar] [CrossRef]
  15. Stoecklein, W.; Parkin, S.S.P.; Scott, J.C. Ferromagnetic resonance studies of exchange-biased Permalloy films. Phys. Rev. B 1988, 38, 6847–6853. [Google Scholar] [CrossRef]
  16. McMichael, R.D.; Stiles, M.D.; Chen, P.J.; Egelhoff, W.F. Ferromagnetic resonance line width in thin films coupled to NiO. J. Appl. Phys. 1998, 83, 7037–7039. [Google Scholar] [CrossRef]
  17. Sparks, M.; Loudon, R.; Kittel, C. Ferromagnetic Relaxation. I. Theory of the Relaxation of the Uniform Precession and the Degenerate Spectrum in Insulators at Low Temperatures. Phys. Rev. 1961, 122, 791–803. [Google Scholar] [CrossRef]
  18. Gurevich, A.G.; Melkov, G.A. Magnetization Oscillation and Waves; CRC Press, Inc: New York, NY, USA, 1996. [Google Scholar]
  19. Mills, D.L.; Rezende, S.M. Spin Dynamics in Confined Magnetic Structures II (Topics Appl. Phys., 87); Springer: Berlin/Heidelberg, Germany, 2003; pp. 27–59. [Google Scholar]
  20. Rezende, S.M.; Azevedo, A.; Lucena, M.A.; de Aguiar, F.M. Anomalous spin-wave damping in exchange-biased films. Phys. Rev. B 2001, 63, 214418. [Google Scholar] [CrossRef]
  21. Chechenin, N.G. Ultrasoft magnetic films: Micromagnetism and high-frequency properties. Microelectron. Eng. 2005, 81/2–4, 303–309. [Google Scholar] [CrossRef]
  22. Hoffmann, H. Magnetic properties of thin ferromagnetic films in relation to their structure. Thin Solid Film. 1979, 58, 223–233. [Google Scholar] [CrossRef]
  23. Herzer, G. Soft magnetic nanocrystalline materials. Scr. Metall. Mater. 1995, 33, 1741–1756. [Google Scholar] [CrossRef]
  24. Fuller, H.W.; Hale, M.E. Determination of Magnetization Distribution in Thin Films Using Electron Microscopy. J. Appl. Phys. 1960, 31, 238–348. [Google Scholar] [CrossRef]
  25. Wohlleben, D. Diffraction Effects in Lorentz Microscopy. J. Appl. Phys. 1967, 38, 3341–3352. [Google Scholar] [CrossRef]
  26. Chechenin, N.G.; Chezan, A.R.; Craus, C.B.; Vystavel, T.; Boerma, D.O.; De Hosson, J.; Niesen, L. Microstructure of nanocrystalline FeZr(N)-films and their soft magnetic properties. J. Magn. Magn. Mater 2002, 42–245 Pt 1, 180–182. [Google Scholar] [CrossRef] [Green Version]
  27. Chechenin, N.G. Micromagnetism and high-frequency properties of soft magnetic films. J. Magn. Magn. Mater. 2006, 300, 198–201. [Google Scholar] [CrossRef]
  28. Chechenin, N.G.; Craus, C.B.; Chezan, A.; Vystavel, T.; Boerma, D.O.; De Hosson, J.; Niesen, L. Relation between observed micromagnetic ripple and FMR width in ultrasoft magnetic films. IEEE Trans. Magn. 2002, 38, 3027–3029. [Google Scholar] [CrossRef]
  29. Hoffmann, H. Quantitative calculation of the magnetic ripple of uniaxial thin permalloy films. J. Appl. Phys. 1964, 35, 1790–1798. [Google Scholar] [CrossRef]
  30. Hoffmann, H. Influence of local inhomogeneities on the magnetic properties of thin ferromagnetic films and nanostructures. Thin Solid Film. 1980, 373, 107–112. [Google Scholar] [CrossRef]
  31. Harte, K.J. Theory of magnetization ripple in ferromagnetic films. J. Appl. Phys. 1968, 39, 1503–1524. [Google Scholar] [CrossRef]
  32. Rother, H. Berechnung des Magnetisierungs-“Ripple” in ferromagnetischen dünnen Schichten. Z. Phys. 1964, 179, 229–232. [Google Scholar] [CrossRef]
  33. Hoffmann, H. Theory of Magnetization Ripple. IEEE Trans. Magn. 1968, 4, 32–38. [Google Scholar] [CrossRef]
  34. Yuan, L.; Jiang, J.; Di, Y.; Bie, S.; He, H. Micromagnetic simulation of the magnetic dispersion angle and effective damping factor for the single-phase soft magnetic films. J. Magn. Magn. Magn. 2008, 320, 1393–1397. [Google Scholar] [CrossRef]
  35. Izotov, A.V.; Belyaev, B.A.; Solovev, P.N.; Boev, N.M. Grain-size dependence of magnetic microstructure and high-frequency susceptibility of nanocrystalline thin films: A micromagnetic simulation study. J. Magn. Magn. Magn. 2021, 529, 167856. [Google Scholar] [CrossRef]
  36. Belyaev, B.A.; Boev, N.M.; Izotov, A.V.; Solovev, P.N. Study of peculiarities of the microwave absorption spectrum of nanocrystalline thin magnetic films. Russ. Phys. J. 2019, 61, 1798–1805. [Google Scholar] [CrossRef] [Green Version]
  37. Hoffmann, H. Stray fields in thin magnetic films. IEEE Trans. Magn. 1966, 2, 566–570. [Google Scholar] [CrossRef]
  38. Chechenin, N.G. Effect of Internal Stray Fields on the High-Frequency Properties of Magnetic thin Films. Phys. Solid State 2004, 46, 479–483. [Google Scholar] [CrossRef]
Figure 1. The geometry of the FMR experiment considered here.
Magnetochemistry 07 00070 g001
Figure 2. FMR derivative absorption line (black) fitted with Lorenzian function (red line).
Magnetochemistry 07 00070 g002
Figure 3. A representative AFM scan of the sample surface.
Magnetochemistry 07 00070 g003
Figure 4. FMR LW: (a) exchange bias, (b) roughness, (c) in BS and TS samples.
Magnetochemistry 07 00070 g004
Figure 5. (a) LTEM image of micromagnetic ripple; (b) intensity profile in the transverse direction T; (c) intensity profile along the ripple in the longitudinal direction L [27] (reproduced with permission from Chechenin N. G., J. Magn. Magn. Mater.; published by Elsevier, 2006).
Magnetochemistry 07 00070 g005
Figure 6. TEM (a,c) and LTEM (b,d) images, showing the ripples (b,d) for two ferromagnetic films with different grainsizes and with a thickness of 110 nm for both cases [21] (reproduced with permission from Chechenin N. G. et al. IEEE Trans. Magn.; published by IEEE, 2002).
Magnetochemistry 07 00070 g006
Publisher’s Note: MDPI stays neutral with regard to jurisdictional claims in published maps and institutional affiliations.

