Article

Oscillatory Copper Deposition on Conical Iron Electrodes in a Nonuniform Magnetic Field

1
Institute of Process Engineering and Environmental Technology, Technische Universität Dresden, 01069 Dresden, Germany
2
Institute of Fluid Dynamics, Helmholtz-Zentrum Dresden-Rossendorf (HZDR), 01328 Dresden, Germany
*
Author to whom correspondence should be addressed.
Magnetochemistry 2021, 7(4), 46; https://doi.org/10.3390/magnetochemistry7040046
Submission received: 4 March 2021 / Revised: 22 March 2021 / Accepted: 24 March 2021 / Published: 28 March 2021
(This article belongs to the Special Issue Advances in Computational Electromagnetics)

Abstract

:
We report the effect of a magnetic field on the deposition of copper ions on a conically shaped iron probe. In our setup, the magnetic forces and buoyancy are the key factors influencing the electrolyte flow and the mass transfer. Without external current, a spontaneous reduction of copper on the iron cone occurs, known as electroless deposition. Mach–Zehnder and differential interferometry indicate a variation in the concentration of copper ions near the cone. After an initial transient of about 60 s, temporal oscillations in the copper concentration are found under the effect of a magnetic field. In galvanostatic conditions, a similar oscillatory behavior of the concentration of the electrolyte is observed. Numerical simulations show that the oscillations are caused by the magnetic gradient, Lorentz force, and buoyancy force counteracting one another, and the oscillation frequency is estimated analytically based on this mechanism. Furthermore, we present a study on the oscillation frequency for both electroless and galvanostatic conditions with different current densities. The results of this study may stimulate future research aimed at the local control of the deposition rate and the realization of miniaturized, regularly structured deposits using magnetic fields.

1. Introduction

Rapid developments in nanotechnology in recent years have produced different nanostructured materials and nanoparticle types in an active area of research with full expansion into many domains of use. These materials have acquired a crucial role in technological advancements because of their physico-chemical properties such as catalytic activity, light absorption, light scattering (resulting in an enhanced electric field), wettability, electrical conductivity, and so on. The function of nanostructured materials is connected to the structure itself, and ways of designing and realizing nanostructured materials and nanoparticles are often inspired by nature, e.g., in the form of self-assembly techniques, structural hierarchy, and fractals [1,2,3,4]. Their outstanding properties make nanoparticles and nanostructured materials suitable for use in optoelectronics, self-cleaning, and molecular sensors [5,6,7,8,9]. Nanostructured materials and their fractal properties have also been shown to improve focal adhesions of cultured neuronal cells with respect to flat surfaces such as a Petri dish [10,11]. The techniques to create nanomaterials range from bottom-up to top-down approaches. The first approach exploits some materials’ ability to self-organize and self-assembly and often utilizes electrochemical methods. The second approach is defined by the intervention of a designer, who often utilizes techniques from lithography to convert geometries to physical elements [12]. Due to the high resolution required for structures at the nanoscale, electron beam lithography (EBL) or a focused ion beam (FIB) are absolutely necessary. Another relevant difference between the two approaches is the cost of realization; for instance, a bottom-up approach is cheaper than a top-down approach, but it is restricted to a small number of processes that are often not fully optimized because of physical limitations. That requires further effort regarding new methods of bottom-up nanofabrication. Top-down approaches are suited to basic research, but not to the mass production that many companies require. Examples of nanostructures which can be realized with the bottom-up approach are porous silicon, porous alumina, and the self-assembling structures of atoms growing on surfaces of different materials, such as the atomic packaging structure of some semiconductors in specific regions [13,14]. Although the nanostructures that can be obtained using the bottom-up approach range from cylinders, cones, and wires to hollow elements such as nanotubes and nanopores, there is still a lack of control to limit shape defects. Porous alumina is one of the templates most commonly used to prepare 3D nanostructures. Its main advantage is the possibility to adjust the size of nanostructures by changing the setup conditions, such as the pH, current, and temperature of anodization [15]. The regular hexagonal pattern of porous alumina makes it suitable to use in templates for the nanofabrication of nanowires and nanorods through the electrochemical deposition of metals in the pores, but it is still difficult to control the height of all the growing nanoelements inside the pores. Porous alumina has also been used to prepare nanotubes and nanocones by varying the etching processes or alternating between different etching conditions. Nonetheless, it is still difficult to control the final shape, which often results in defects such as truncated nanocones. The direction to follow for controlling electrodeposition processes is one that leads to a complete understanding of mass transport under different electrodeposition conditions, for example, when hydrodynamic effects are introduced. In such cases, the magnetic fields and their gradients have proven a contactless and efficient way of manipulating the fluid and thus the mass transport [16,17,18,19,20,21,22].
One notable aspect of how the magnetic field affects electrochemical processes is the oscillation behavior which has already been reported in previous works [23,24,25]. In Yang et al. [23], when magnetic fields are applied, the Lorentz force drives oscillatory flows during potentiostatic current oscillations around an iron electrode immersed in H 2 SO 4 . When a constant potential is applied, the oscillation period is reported to be in the order of a few seconds (3.64 s) when the magnetic field is directed from a position perpendicular to the electrode surface. This is slightly longer than it is without a magnetic field (2.85 s). On the other hand, when the magnetic field is applied parallel to the electrode surface, the period decreases to 2.5 s. The different oscillation periods are attributed to different orientations of the Lorentz force, i.e., the passivation phase is prolonged when the natural convection is suppressed by the Lorentz force, and is shortened when Lorentz-force-driven and natural convection are reinforced. The shape of the electrode is crucial as the direction of the flow generated by the Lorentz force is determined by the direction of the surface with respect to the direction of the magnetic field, especially if the material can be magnetized. For the electrodeposition system, oscillations in the concentration boundary layer at a current density of 10 mA / cm 2 were found on a vertical planar cathode [26], caused by the opposing directions of the Lorentz force and buoyancy force. Furthermore, the Lorentz force was also found to affect the oscillatory bubble release on a vertical electrode during the hydrogen evolution reaction for H 2 SO 4 and an acidic Cu / CuSO 4 system [25]. It was found that the oscillation period is reduced when the Lorentz force reinforces the buoyancy, and is enhanced when the Lorentz force counteracts the buoyancy.
The magnetic field effects, as mentioned above, are often attributed to the action of the Lorentz force, which is given by the vector product of the current density j and the magnetic flux density B :
f L   =   j   × B .
In a previous work [27], we investigated the mass transport and the flow velocity near a conically shaped copper cone in a homogeneous magnetic field directed parallel to the cone axis, and demonstrated the beneficial influence of the Lorentz force on the cone growth. The Lorentz force creates a horizontal azimuthal flow around the cone, which further generates the centrifugal force that gives rise to a secondary flow. This, in turn, brings fresh bulk electrolyte enriched with metal ions towards the tip of the cone. Therefore, the local mass transfer is enhanced and cone growth is supported. However, when we consider an electrochemical cell where the conical cathode is placed at the bottom, concentration variations near the cathode give rise to solutal buoyancy, which may counteract the Lorentz force during deposition:
f g   =   ρ 0 g i β i ( c i c i , bulk ) ,
with ρ 0 ,   g , β i c i , c i , bulk being the bulk density, the gravitational acceleration, the volume expansion coefficient, the concentration and the bulk concentration of species i , respectively. The buoyancy force tends to bring lighter electrolyte upward from the conical cathode, and thus hampers the beneficial downward flow generated by the Lorentz force. As shown in [27], the Lorentz force is surpassed by buoyancy after a few seconds of deposition.
In this new analysis, to further enhance the structuring effect of the magnetic field during deposition, we additionally include the magnetic gradient force by considering a ferromagnetic iron cone. This also enables us to study—for the first time—the possible influence of the magnetic gradient force on oscillation behavior during electrochemical processes. Although we still apply a homogeneous external magnetic field in this case, the magnetization of the iron cone modifies the local magnetic field and yields high magnetic gradients near the sharp tip of the cone. This gives rise to the magnetic gradient force, which, for paramagnetic solutions (e.g., containing Cu 2 + ions), may drive a flow towards regions of high magnetic field gradient [28,29]:
f B   =   χ sol μ 0 ( B · ) B ,   χ sol   =   i χ i mol c i + χ H 2 O .
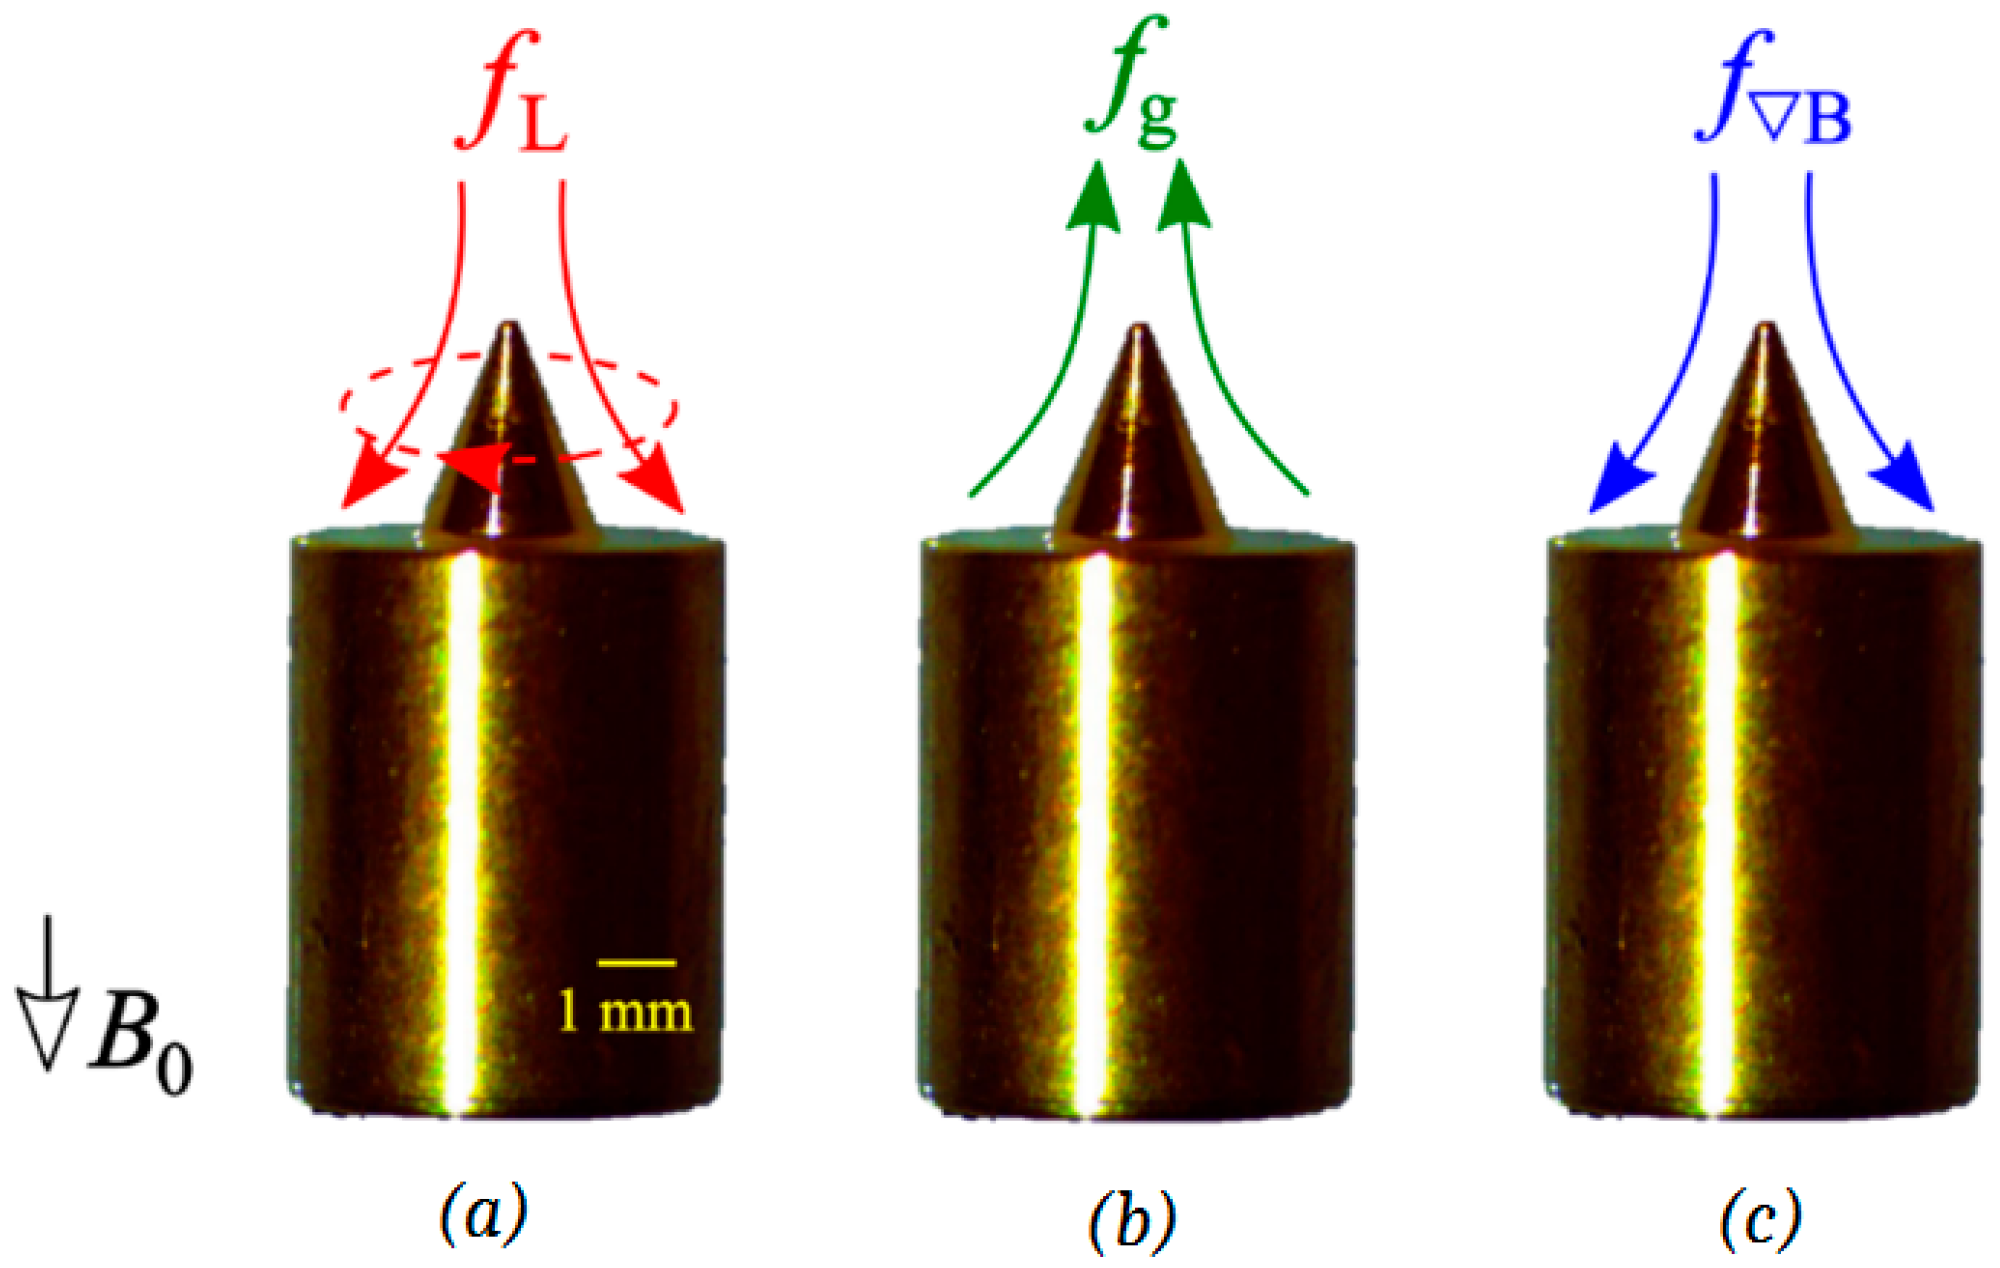
Here, μ 0 is the vacuum permeability and χ sol is the magnetic susceptibility of the solution, which is related to the molar susceptibility χ i mol and the concentration of ionic species i , and the susceptibility of water, χ H 2 O . As defined by Equation (3), the magnetic gradient force is strongly related to the concentration distribution of metal ions near the cone. Therefore, as the deposition proceeds, the magnitude and direction of the flow caused by the magnetic gradient force can change dynamically as the concentration boundary layer develops. A schematic view of the flow caused by each volume force is shown in Figure 1.
In this work, we investigated magnetic field effects during electrodeposition on an iron cone on a millimeter length scale. In comparison to smaller length scales, this facilitates the cone manufacture, the assembling in the cell and the species measurements, but is still able to deliver a fundamental understanding of the mechanisms behind the process. The concentration measurements in a magnetic field have also been performed by Chao Wang et al. and Kei Nishikawa et al. [30,31]. We measured the concentration with a Mach–Zehnder interferometer and analyzed the mass transfer near the cone in detail. We observed oscillations of the concentration boundary layer for electroless and galvanostatic deposition with current densities ranging from 2 to 14 mA / cm 2 . In the case of the galvanostatic deposition, all three forces are operating—the Lorentz force, the field gradient force, and buoyancy—whereas electroless deposition is affected only by the latter two. This paves the way to understanding the origin of the oscillations, in particular, by conducting complementary numerical simulations which make it possible to consider the action of these forces individually.

2. Materials and Methods

Cone-shaped iron cathodes were fabricated using a computerized numerical control (CNC) technique. The cone diameter is 2 mm, and the tip angle is 45 degrees. The cathode surface exposed to the electrolyte is 25 mm2 and it also includes a side surface with a diameter of 5 mm. The cone was electrochemically polished and sputtered with a protective film of gold (100 nm), see Figure 2.
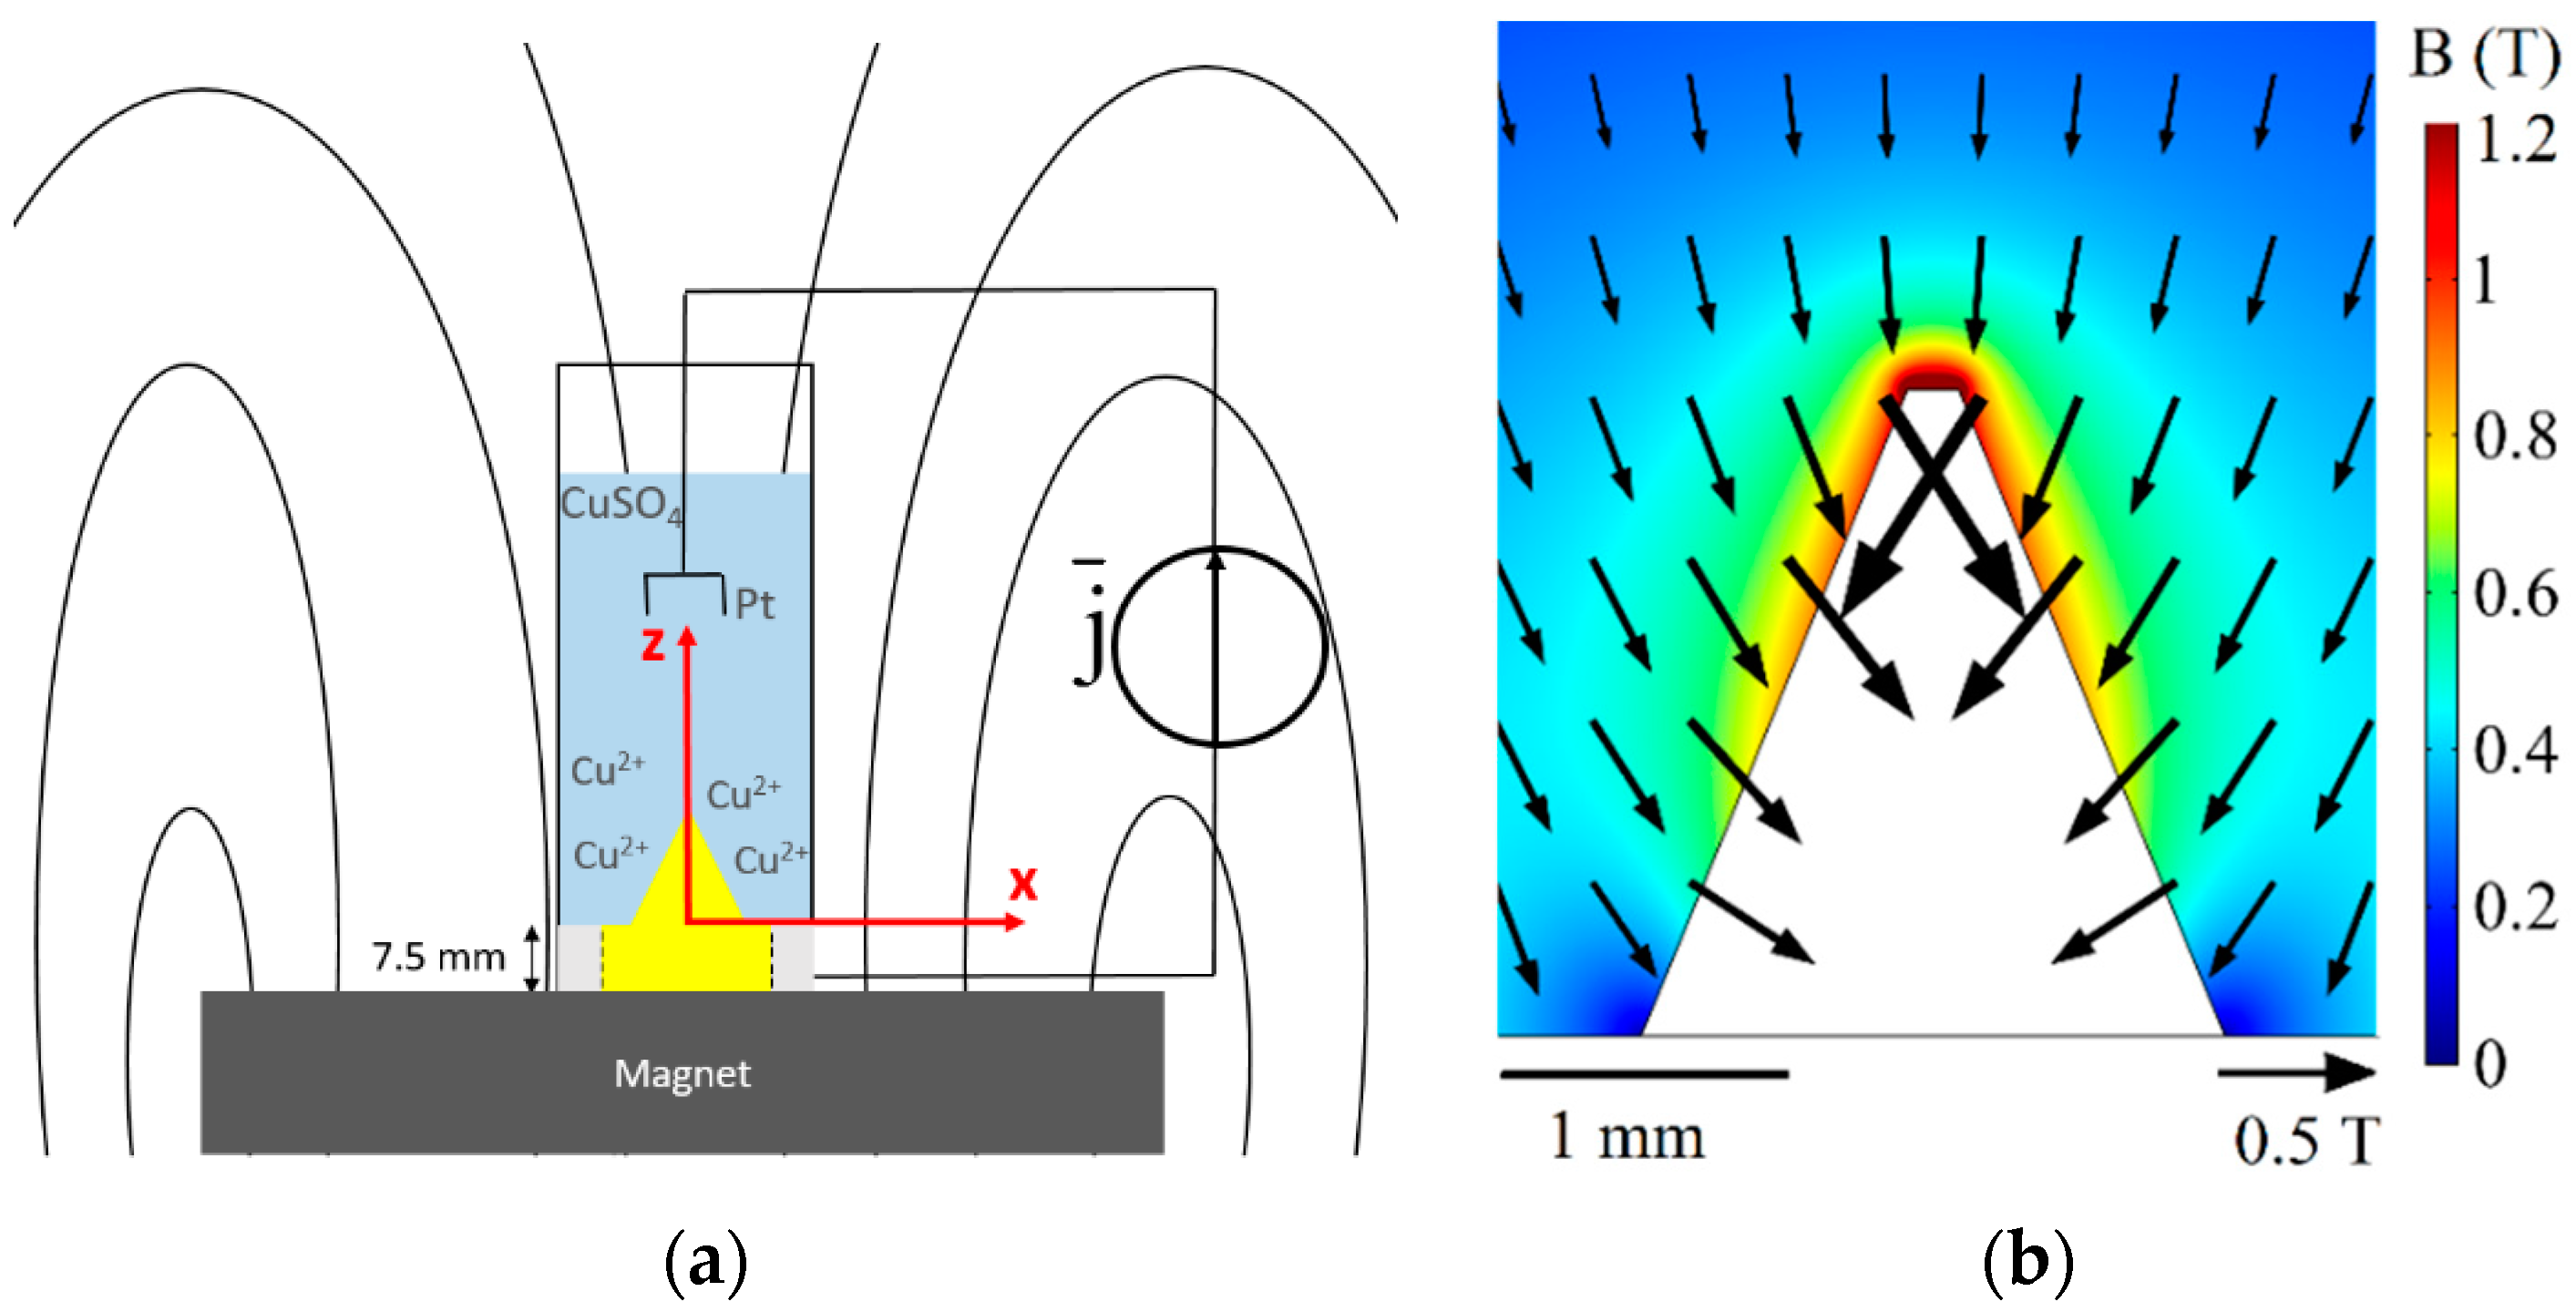
The entire height of the cone was 2.15 mm. This already included the truncation of a small part of the tip (height = 0.13 mm) due to fabrication issues. The impact of this imperfection is minor; no relevant difference was found to an ideal conical shape with a sharp tip [27]. Cuvettes were purchased from Hellma and made of Quartz SUPRASIL (Figure 2a). The height was 45 mm and the inner cross section was 10 × 10 mm2. A cylindrical NdFeB magnet (height = 20 mm, diameter = 20 mm), magnetization antiparallel to gravity, was used to generate the magnetic field. As measured with a Gaussmeter (Fieldmeter H2 type from MAGMESS Magnet-Messtechnik Jurgen Ballanyi e.K.), the magnet provided a field of 0.22 T at a distance of 7.5 mm above its upper surface, where the probe was placed. After the magnet was placed below the iron probe, magnetization of the cone modified the local field, causing high magnetic field of about 1 T near the cone tip (Figure 2b). Therefore, a modified Lorentz force and a strong magnetic gradient force can be expected there.
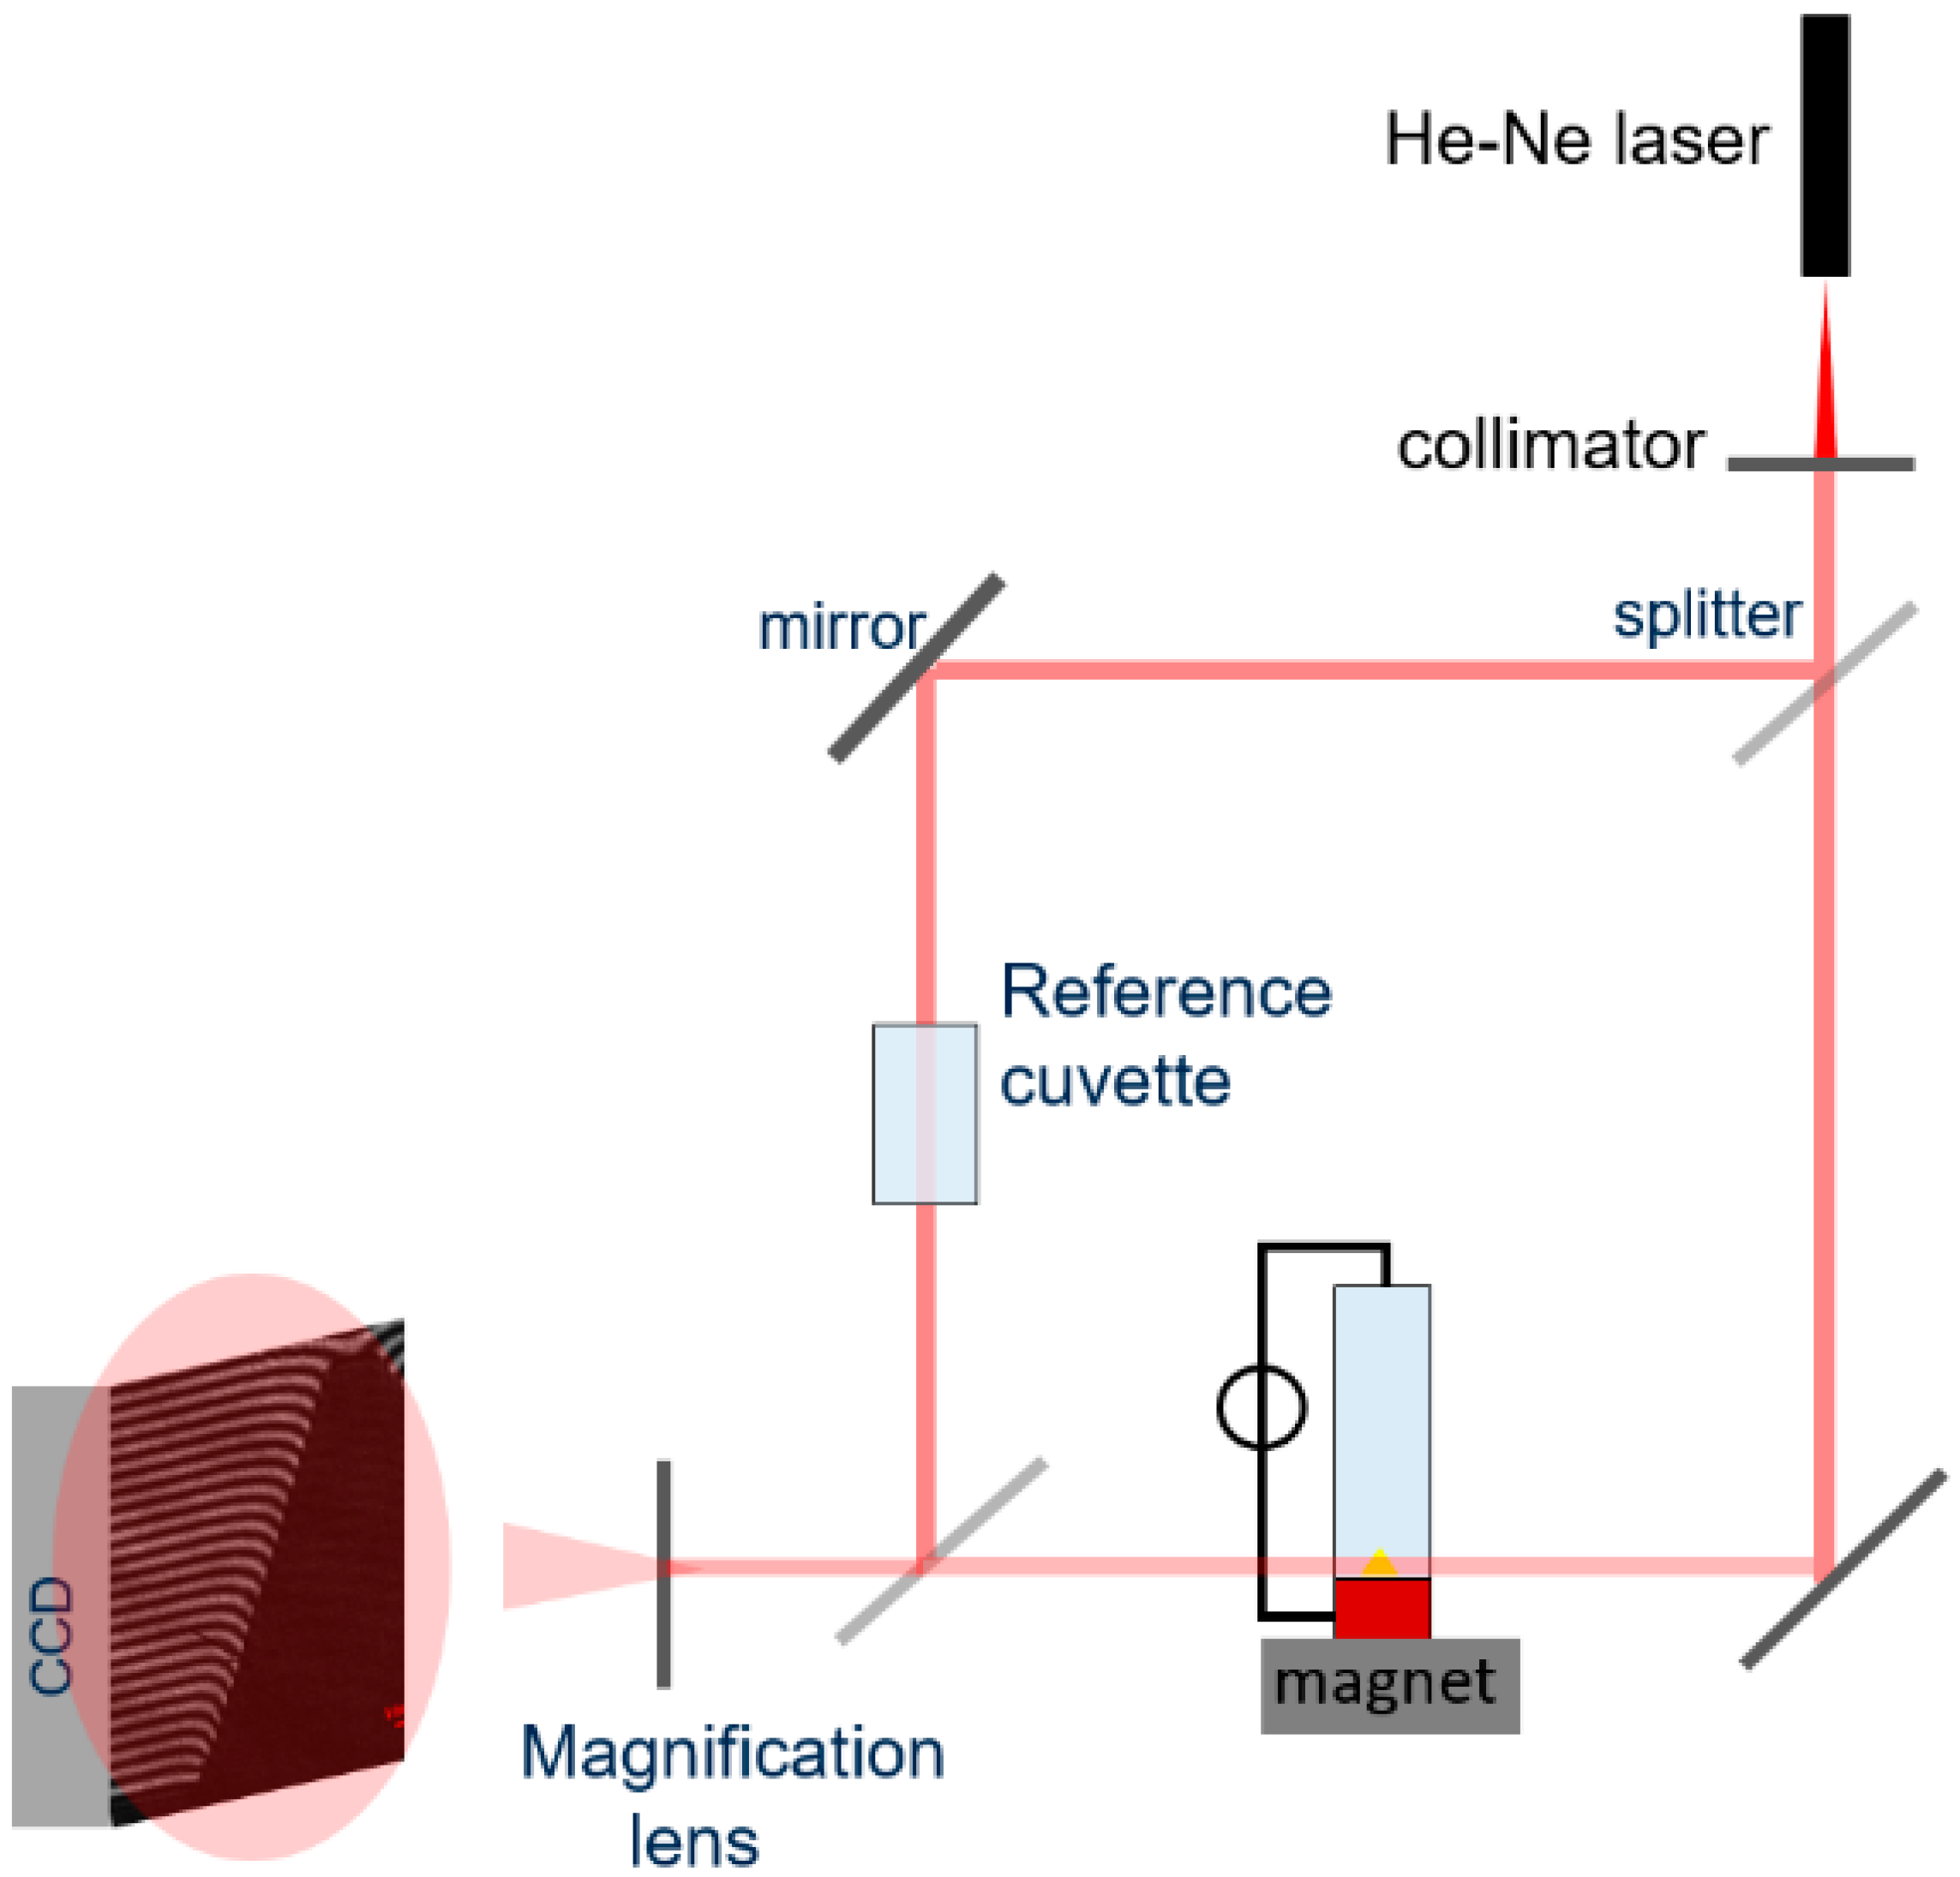
An aqueous solution of 0.1 M CuSO4 (pH = 4.2) was prepared as an electrolyte. A potentiostat (CH Instruments) was operated in galvanostatic mode for the electrodeposition. A platinum wire (ALS Co., Salt Lake City, UT, USA) with a diameter of 0.5 mm was used as a counter-electrode, placed vertically in the upper part of the cell, which was filled with the electrolyte. The concentration field formed during copper deposition was measured using a Mach–Zehnder interferometer and a differential interferometer (a video is provided in the Supplementary Materials). The setup is illustrated in Figure 3.
Interferograms were acquired using a COHU CMOS camera (Model 7812-2000, 1200 × 1000 effective pixels) at a speed of 5 and 10 frames per second and a field of view of about 7 × 7 mm2. In all experiments, a constant cell current ranging from 0.5 to 3.5 mA was applied, corresponding to a mean current density ranging between 2 and 14 mA/cm2 at the cathode.
During the experiments, as soon as the electrolyte stirring stopped and a current density was applied, interferograms near the boundary layer were recorded with both obliques and horizontal fringes.
The fringe pattern variations obtained were analyzed using the C language source code files listed in Appendix A of the book in reference [32] and reassembled in an in-house program implementing the wavelet transform and the Ghiglia–Goldstein algorithm to solve the phase shift variation [33,34,35]. The maps of the refractive index variation were analyzed using an in-house code written in MatLab. The Cu 2 + concentration was calculated from the refractive index through constant proportionality with respect to the refractive index, computed by fitting experimental data from the refractive index for given values of copper sulphate concentration. For electroless deposition, this proportionality needs to be corrected because the refractive index is influenced by the variations in the concentration of both copper and iron ions. The reaction during the electroless deposition is the following [36,37]:
Fe + C u 2 +   =   F e 2 + + Cu .
It could therefore be assumed that Δ C C u 2 + = Δ C F e 2 + = Δ C . The concentration dependency of the refractive index for both Cu2+ and Fe2+ is linear. The refractive index change for Cu2+ is ΔnC = 0.02616 M−1, and for Fe2+ it holds ΔnC = 0.04413 M−1 [38,39]. When neglecting diffusion, the overall refractive index change Δn in the electroless mode can then be written as Δ n = ( 0.04413 + 0.02616 ) · Δ C = 0.01797   · Δ C .
The accuracy of the concentration data obtained by the measurements with the Mach Zehnder interferometer and the subsequent calculations is subject to small uncertainties resulting from Joule heating of the electrolyte during the electrolysis, additional species existing in the solution, and the algorithm of the wavelet transformation itself. An exact error is difficult to estimate under these conditions. However, earlier works [40,41] on copper deposition have shown that the differences between measured and simulated concentration fields are about 30% in the thin concentration boundary layers but less than 10% in the bulk. The agreement in the present work is quite acceptable as well.
The variation in the concentration was calculated with respect to the reference image of the electrolyte without copper plating for the electroless deposition and to the reference frame at which the first oscillation starts for the galvanostatic deposition. The image maps of the electrolyte concentration were then imported into MatLab and analyzed to correct any phase artefacts still persisting in the sequence of the images. Given the averaged concentration values of a region of interest with respect to time, the phase shift error was corrected by iteratively applying a criteria until the error was reduced to values below a defined threshold as follows:
| Δ C i + 1 Δ C i |   ε   ,   i   =   1 ,   2 ,   ,   n ,
where n is the total number of frames, ε is the threshold, and Δ C is the variation in the concentration.
ε is assigned by evaluating the degree of discontinuity. If (5) is not satisfied, the phase shift at frame i + 1 is eliminated. Since the error is conservative, the correction is applied to all datasets. The correction process is applied iteratively until condition (5) is satisfied for all the concentration difference values.
The concentration data obtained by the algorithms introduced above enable us to study the oscillatory structure of the concentration boundary layer in detail. Images were acquired during 130 s of electroless deposition and 60 s of galvanostatic deposition. We selected regions of interest (ROIs) near the cone surface and investigated the concentration variations averaged in ROIs as a function of time. The distribution of the concentration variations near the cone is also studied. The resolution was calibrated using a transparent glass ruler, resulting in 175 pix/mm.
In order to provide more detailed information on the flow and mass transfer during the deposition, numerical simulations were performed for galvanostatic deposition with an averaged cathode current density ranging between 2 and 8 mA/cm2. We followed the methodology applied in the study on the copper cone where the Lorentz force and the buoyancy force were involved [27]. Additionally, we calculated the magnetization of the iron cone expressed by the Maxwell equations and implemented the magnetic gradient force in the momentum equations complemented by the incompressibility constraint [29,42]:
ρ [ u t + ( u · ) u ]   =   p + η Δ u + f L + f g + f B , · u = 0 .
Here, ρ , u , p , and η denote the density, the electrolyte velocity, the dynamic pressure, and the dynamic viscosity of the electrolyte, respectively. The convective, migrative, and diffusive transport of the ionic species are implemented in the Nernst–Planck equation of dilute solutions [43]:
c i t + ( u · ) c i   =   z i F D i R T · ( c i ϕ ) + D i Δ c i ,
where F ,   R ,   T ,   ϕ ,   z i , D i denote the Faraday constant, the universal gas constant, the temperature, the electric potential, the charge number, and the diffusion coefficient of species i, respectively. The electric field is obtained by assuming electroneutrality in the electrolyte and applying the conservation of charge:
j   =   F 2 ϕ   i z i 2 D i R T c i F i z i D i c i ,         · j   =   0 .
Furthermore, the electrode kinetics are considered, and the Butler–Volmer equations [44] are implemented as boundary conditions on the electrodes. The coupled equation system is solved in the finite element software COMSOL [45]. By virtue of the axial symmetry of the cone, 2D axisymmetric simulations are conducted. The cylindrical coordinate system ( r ,   θ ,   z ) originates at the bottom center of the cone [27]. The geometry of the computational domain and other simulation parameters were chosen to correspond to the experimental setup, and the material parameters were taken from the literature [27,36,46]. Mesh and time step studies have been conducted to ensure the accuracy of the numerical results.

3. Results

3.1. Experimental Section

Copper deposition on iron cones is studied both without a current, i.e., in electroless mode, and in galvanostatic mode with cathode current densities between 2 and 14 mA/cm2. In both cases, the concentration boundary layer starts to oscillate after an initial transient. These oscillations, which form the focus of this work, are described in the following. An explanation of the mechanism is given using numerical and analytical results, based on the different forces acting in the electrolyte.

3.1.1. Variation of Concentration during Electroless Plating

We first focus on the electroless copper deposition on the iron cones ( C u 2 + + Fe F e 2 + + Cu ), which takes place under the influence of buoyancy and the magnetic field gradient force.
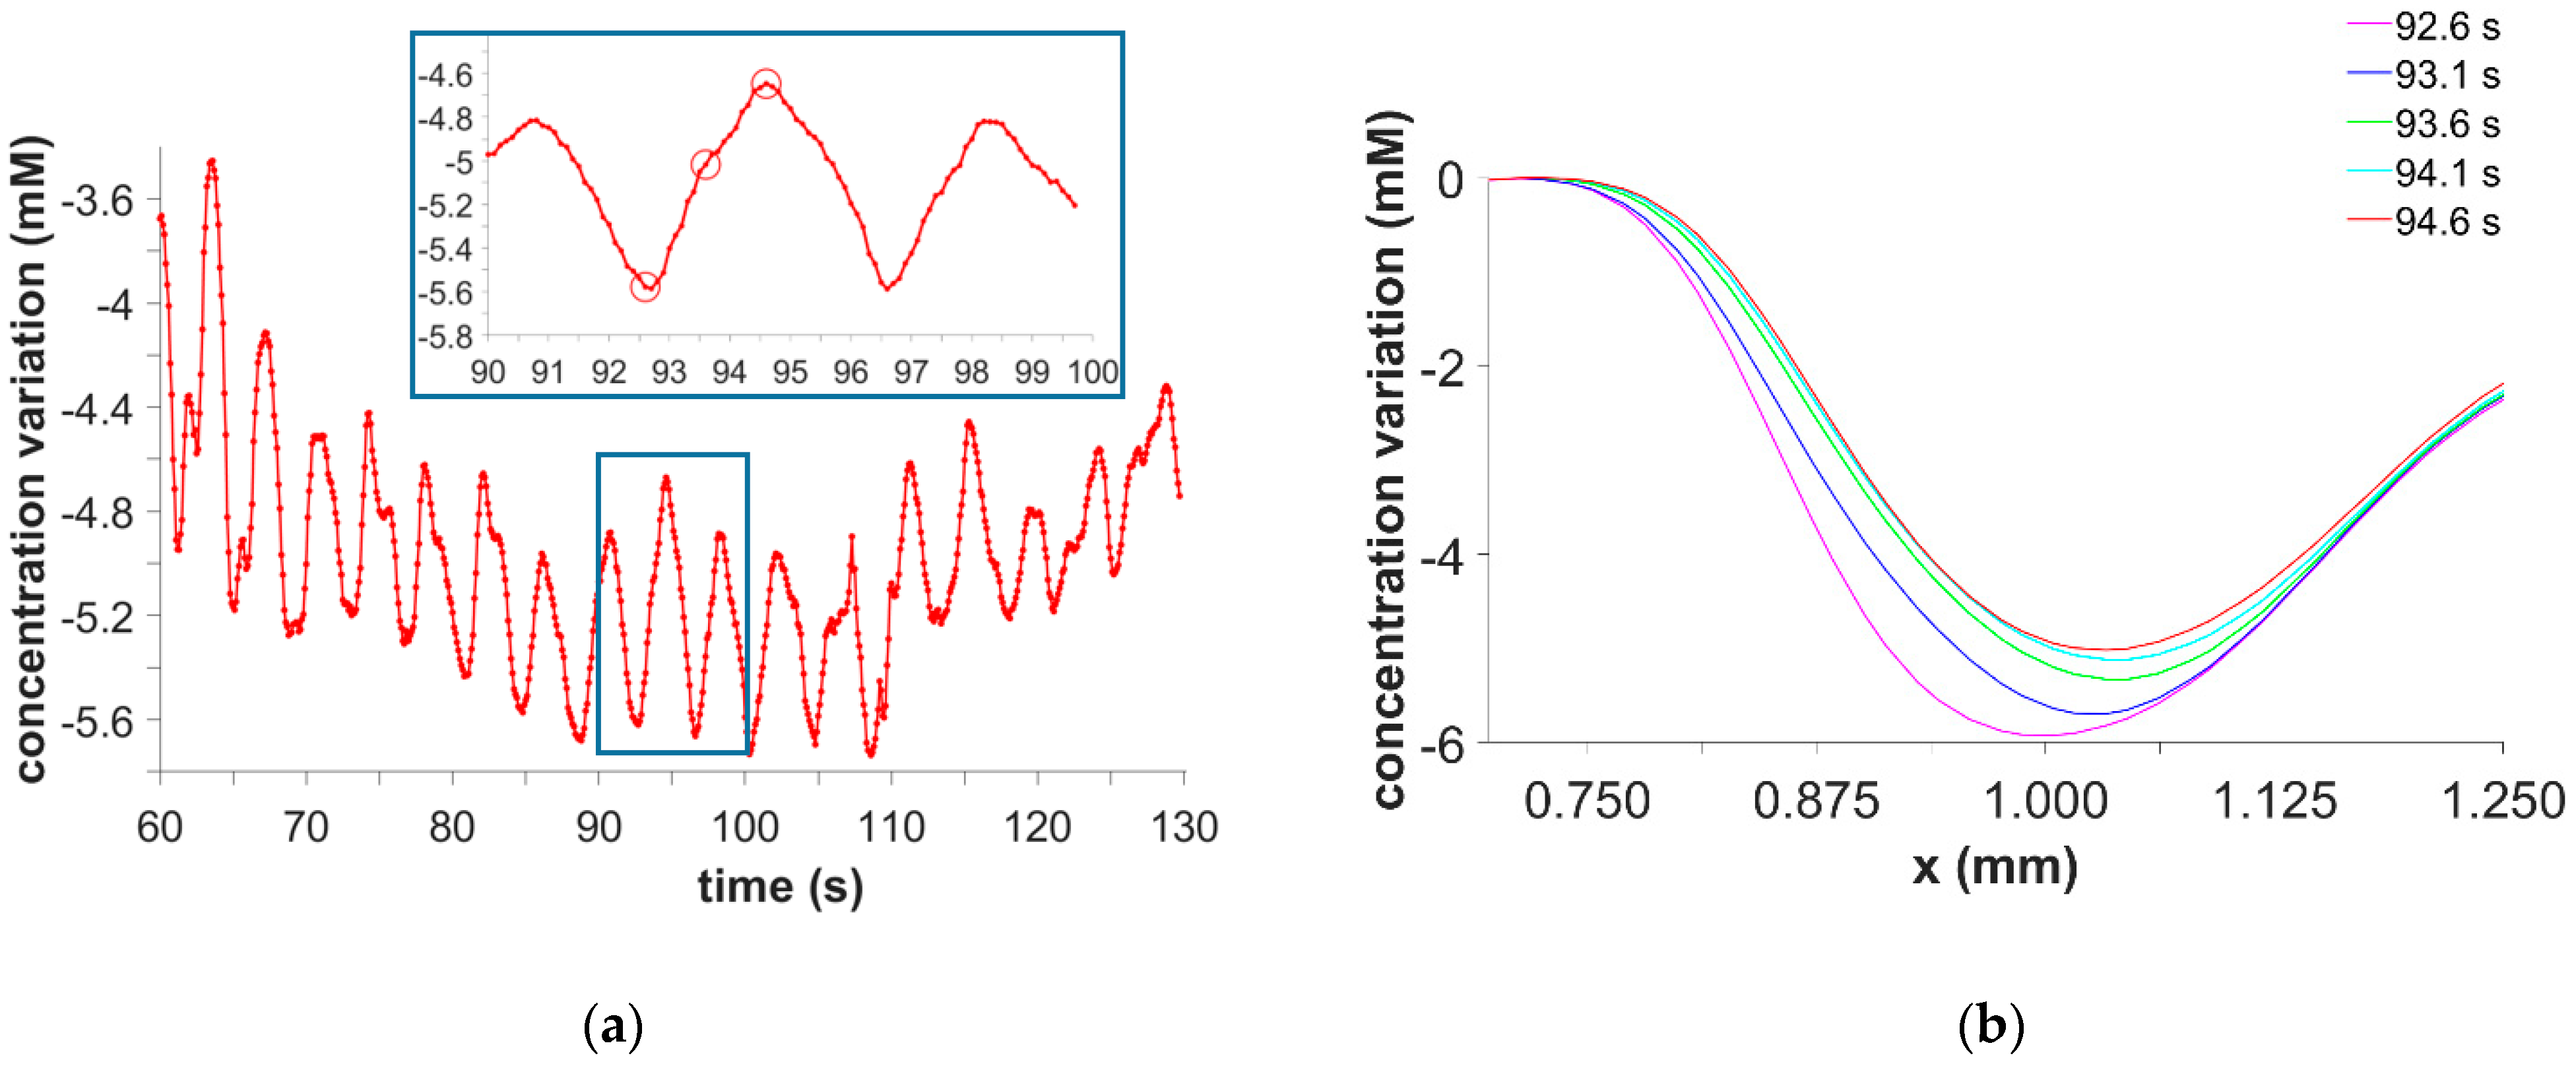
After pouring the electrolyte into the cuvette and gently stirring with a pipette, the zero interferogram was taken, which was free from any bending of the interference fringes. This was taken as the background (free from refractive index, hence density variation) to be applied to the wavelet transform and the Ghiglia–Goldstein algorithm. The concentration evolution over time was analyzed in Figure 4 by averaging the concentration in a region of interest (ROI) which was selected next to the side of the cone (x = 1 mm; z = 0.9 mm, see black rectangle in Figure 5). Electroless deposition is characterized by an initial transient of about 60 s before the concentration differences, Δ c = c c bulk , run into stable oscillatory behavior, as shown in Figure 4. The oscillations are nearly sinusoidal and have an averaged frequency of 0.21 Hz after the transient has passed. The frequency was computed by averaging the peak-to-peak difference of the oscillation and computing the reciprocal. Measurements by differential interferometer confirm a frequency value of about 0.2 Hz (video provided in supplementary information).
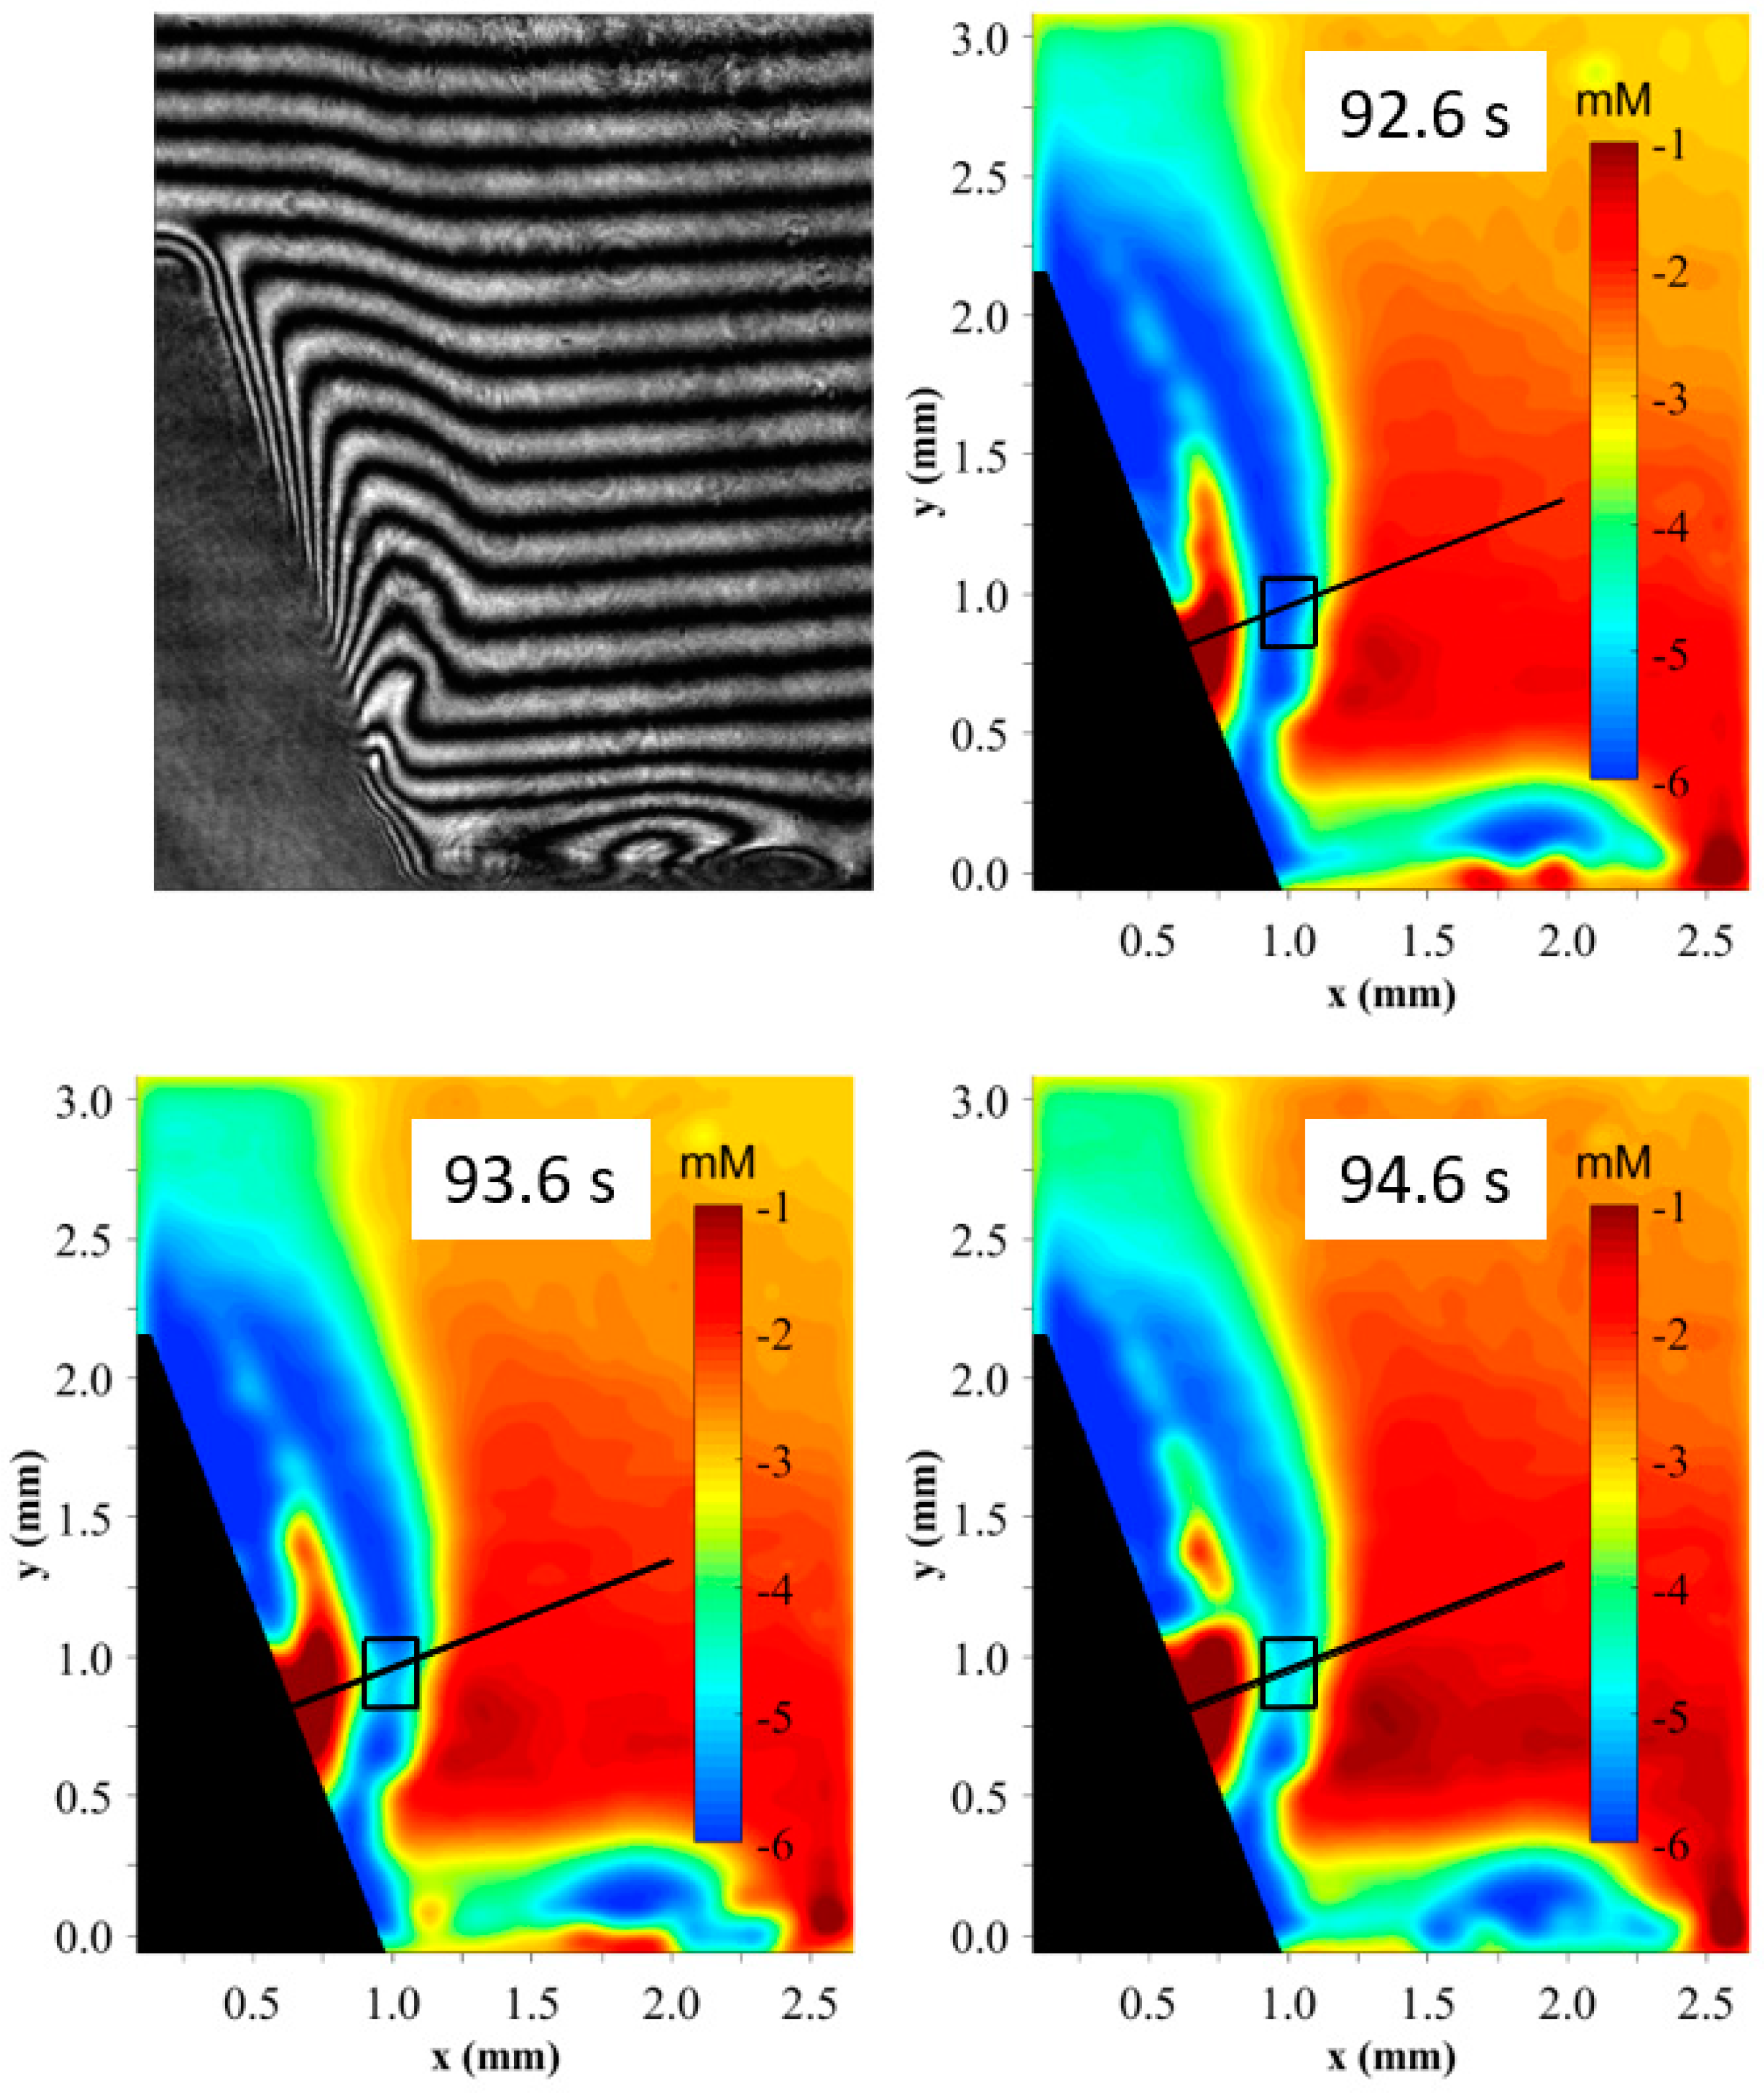
We zoom into an oscillation period (see inset in Figure 4a), then Figure 5 shows the spatial concentration distribution, computed from the interferogram, at different stages of the oscillations. These stages are marked by red circles in the inset and extend from a minimum of t = 92.6 s to a maximum of t = 94.6 s. Figure 5 reveals the complex structure of the concentration boundary layer. In the upper part and near the bottom of the cone, the characteristic boundary layer structure of a deposition process is visible, characterized by a low C u 2 + concentration (blue) near the iron cone surface. At the middle part of the cone, a zone of high concentration (red) instead remains. The variation in the concentration of frames over a wider range of time is included in Figure S1 of the supporting information.
Our results show that the electroless deposition of copper occurs at the tip and bottom of the cone, whereas the situation is different in the middle part of the cone. Here, oxidation products may have formed, locally blocking the deposition, which is difficult to avoid in this experiment.
The nature of the oscillations consists in periodic variation in the concentration. This periodic variation is also reflected in the profiles of the concentration boundary layer shown in Figure 4b, which originate at the center part of the cone surface and follow the surface-normal direction, marked as a black line in Figure 5. The minimum value of the averaged ROI concentration shown in Figure 4a occurs at 92.6 s and corresponds to the smallest concentration value found in the boundary layer profiles. As no concentration change is found directly at the cone surface, this gives further support to the blockage effect mentioned above. The maximum value of the averaged ROI concentration shown in Figure 4a occurs at 94.6 s and corresponds to the weakest local minimum in the boundary layer profiles shown in Figure 4b. At the same point in time, a break-off and an upward motion of the upper part of the red concentration plume is observed in Figure 5. This red region is surrounded by the boundary layer of reduced copper concentration, marked in blue. The resulting solutal buoyancy is expected to create an upward motion of this concentration boundary layer. As can be seen, the boundary layer rising from the bottom of the cone departs from the cone surface near the blockage region due to inertia, leading to a much thicker blue region above. Due to friction, the enclosed red region of bulk electrolyte near the center of the cone surface deforms, which eventually leads to the detachment of the tip region of the plume at 94.6 s.
The blue regions near the cone surface suggest that the electroless deposition of copper is occurring at a high rate. The related concentration gradient in combination with the inhomogeneous magnetic field might also give rise to a magnetic gradient force. However, it seems to be of only minor influence compared to the strong impact of buoyancy discussed above. Besides, the related diffusion current of copper ions also only seems to create a negligible impact on the Lorentz force.
As further shown in Figure 5, there is a drop-shaped blue region of low concentration close to the outer edge of the cone base at 2.5 mm, which is likely to result from enhanced mass transfer, usually occurring at the edges. This blue region experiences upward forcing by buoyancy, which is partially balanced by an inward force originating from the concentration boundary layer, which rises vertically near the cone. Consequently, small amounts of enriched electrolyte may be seen to temporarily enter the bottom part of the electrode from outside. Due to the strong magnetic field values and related gradients close to the bottom edge of the iron cone, the magnetic forces may also have some influence. However, this is difficult to quantify from the concentration measurements only.
The oscillatory variation in the concentration shown in Figure 4a remains in the negative range until about 130 s, which indicates that the electrolyte at lower concentrations is continuously transported from cone bottom towards the upper region of the cone, as shown in Figure 5. Near the tip of the cone, light fluid leaves the cone in a vertical upward direction, as also observed earlier near a conically shaped copper cathode. It is also noticeable that, after a period of about 110 s in Figure 4a, the concentration continues to oscillate but shows a monotonic trend to reduce the negative mean concentration value over time.
In order to explain the origin of oscillations, the reader has to take into account the fact that while the diffusion current and the related Lorentz force are negligible, the magnetic gradient force can drive electrolyte flow, counteracting the buoyancy as long as the concentration gradient and the magnetic field gradient have orthogonal components [47]. Furthermore, both the magnetic gradient force and the buoyancy force depend on the temporal change in the concentration boundary layer. As the concentration oscillates, both forces may oscillate in amplitude as well, and a dynamic equilibrium may be reached which sustains the oscillatory behavior. However, we would like to add that the detachment of the concentration boundary layer caused by oxide blocking at half the height of the cone may also contribute to oscillatory behavior. For more details, we refer to the Discussion section.

3.1.2. Variation of Concentration in Electrolyte in Galvanostatic Mode

We next examine how the oscillations change when the copper deposition is performed in galvanostatic mode, in the case of oscillations with a current density ranging from 2 to 10 mA/cm2. As an extension of electroless deposition, where only buoyancy and field gradient force are operating, the electric current brings a third force into play: the Lorentz force.
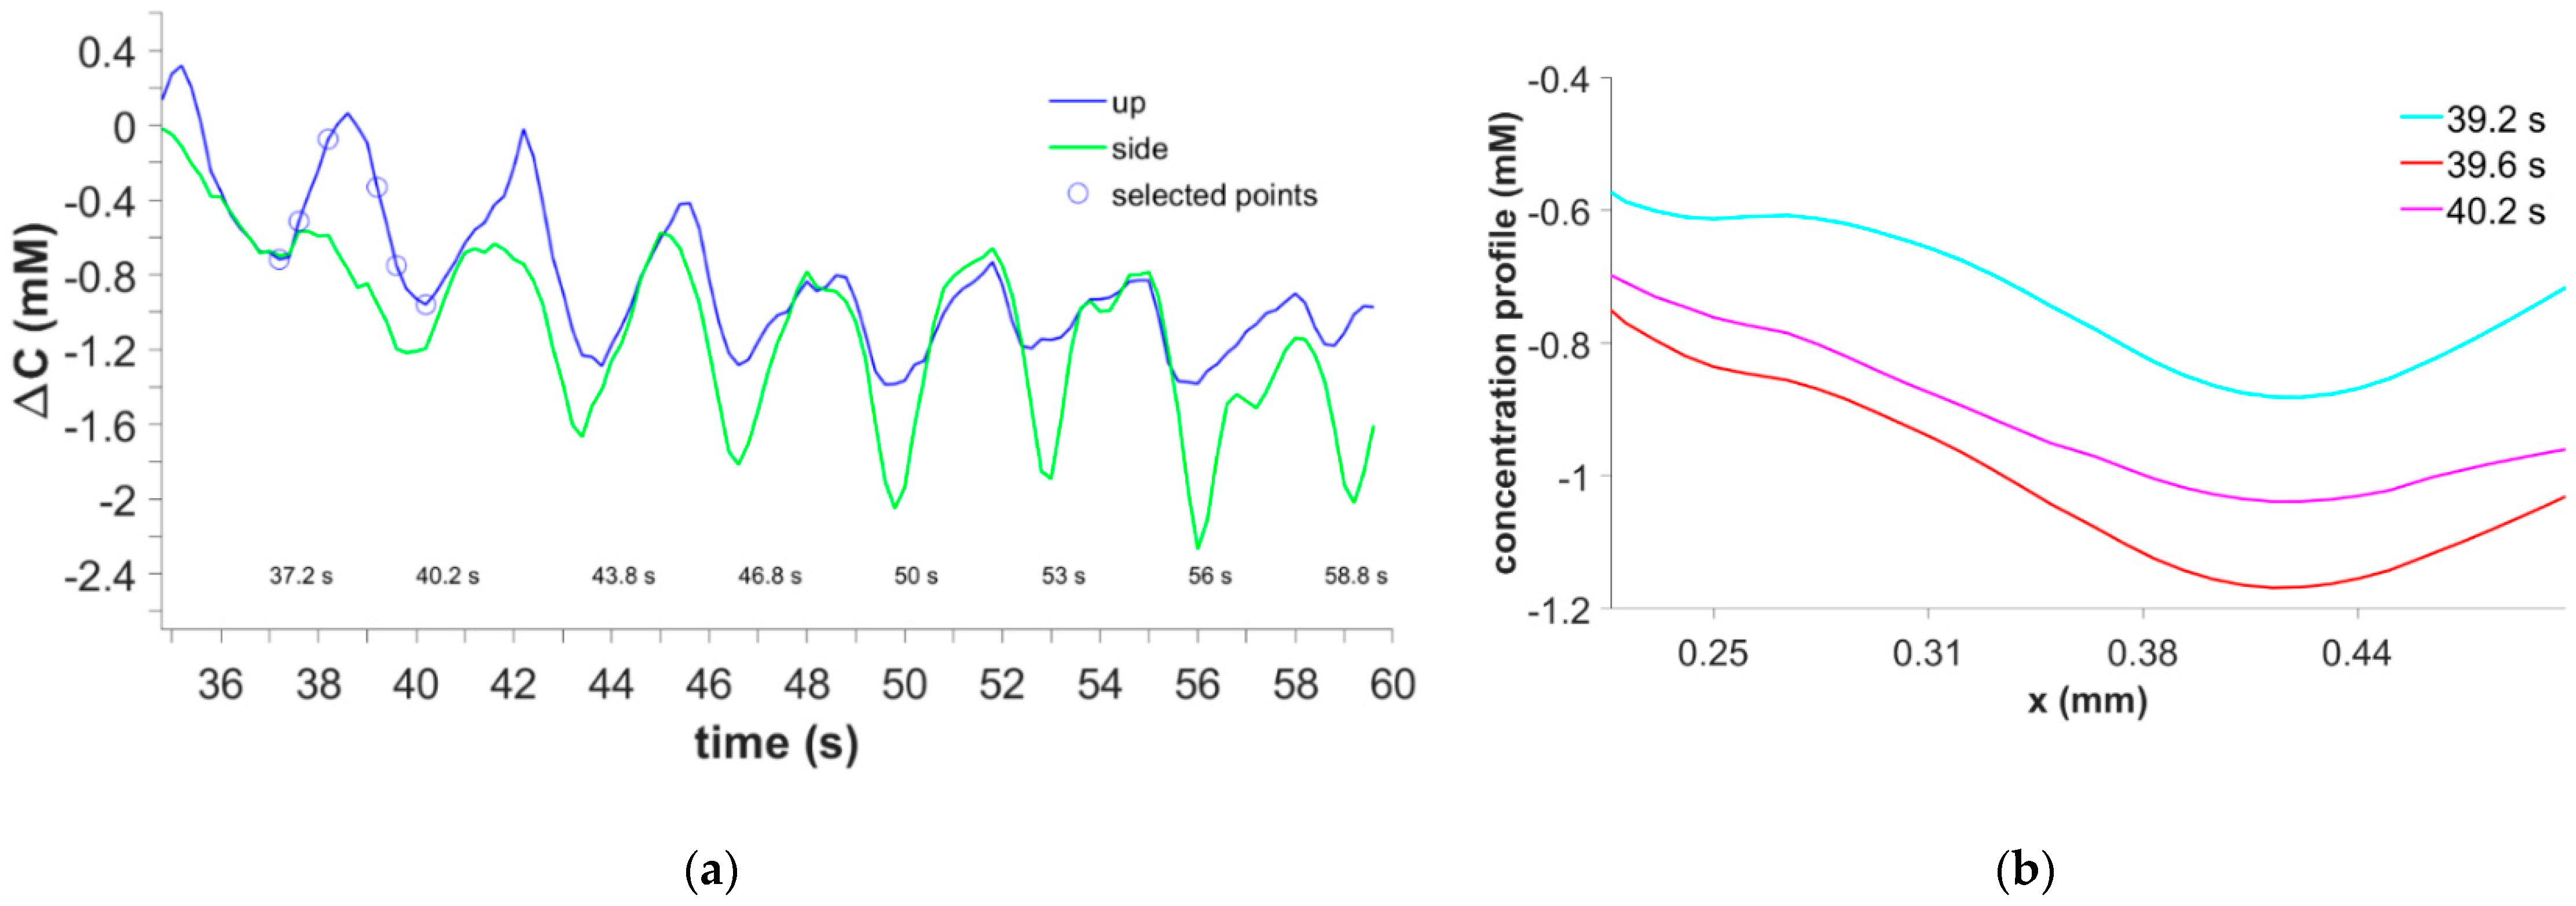
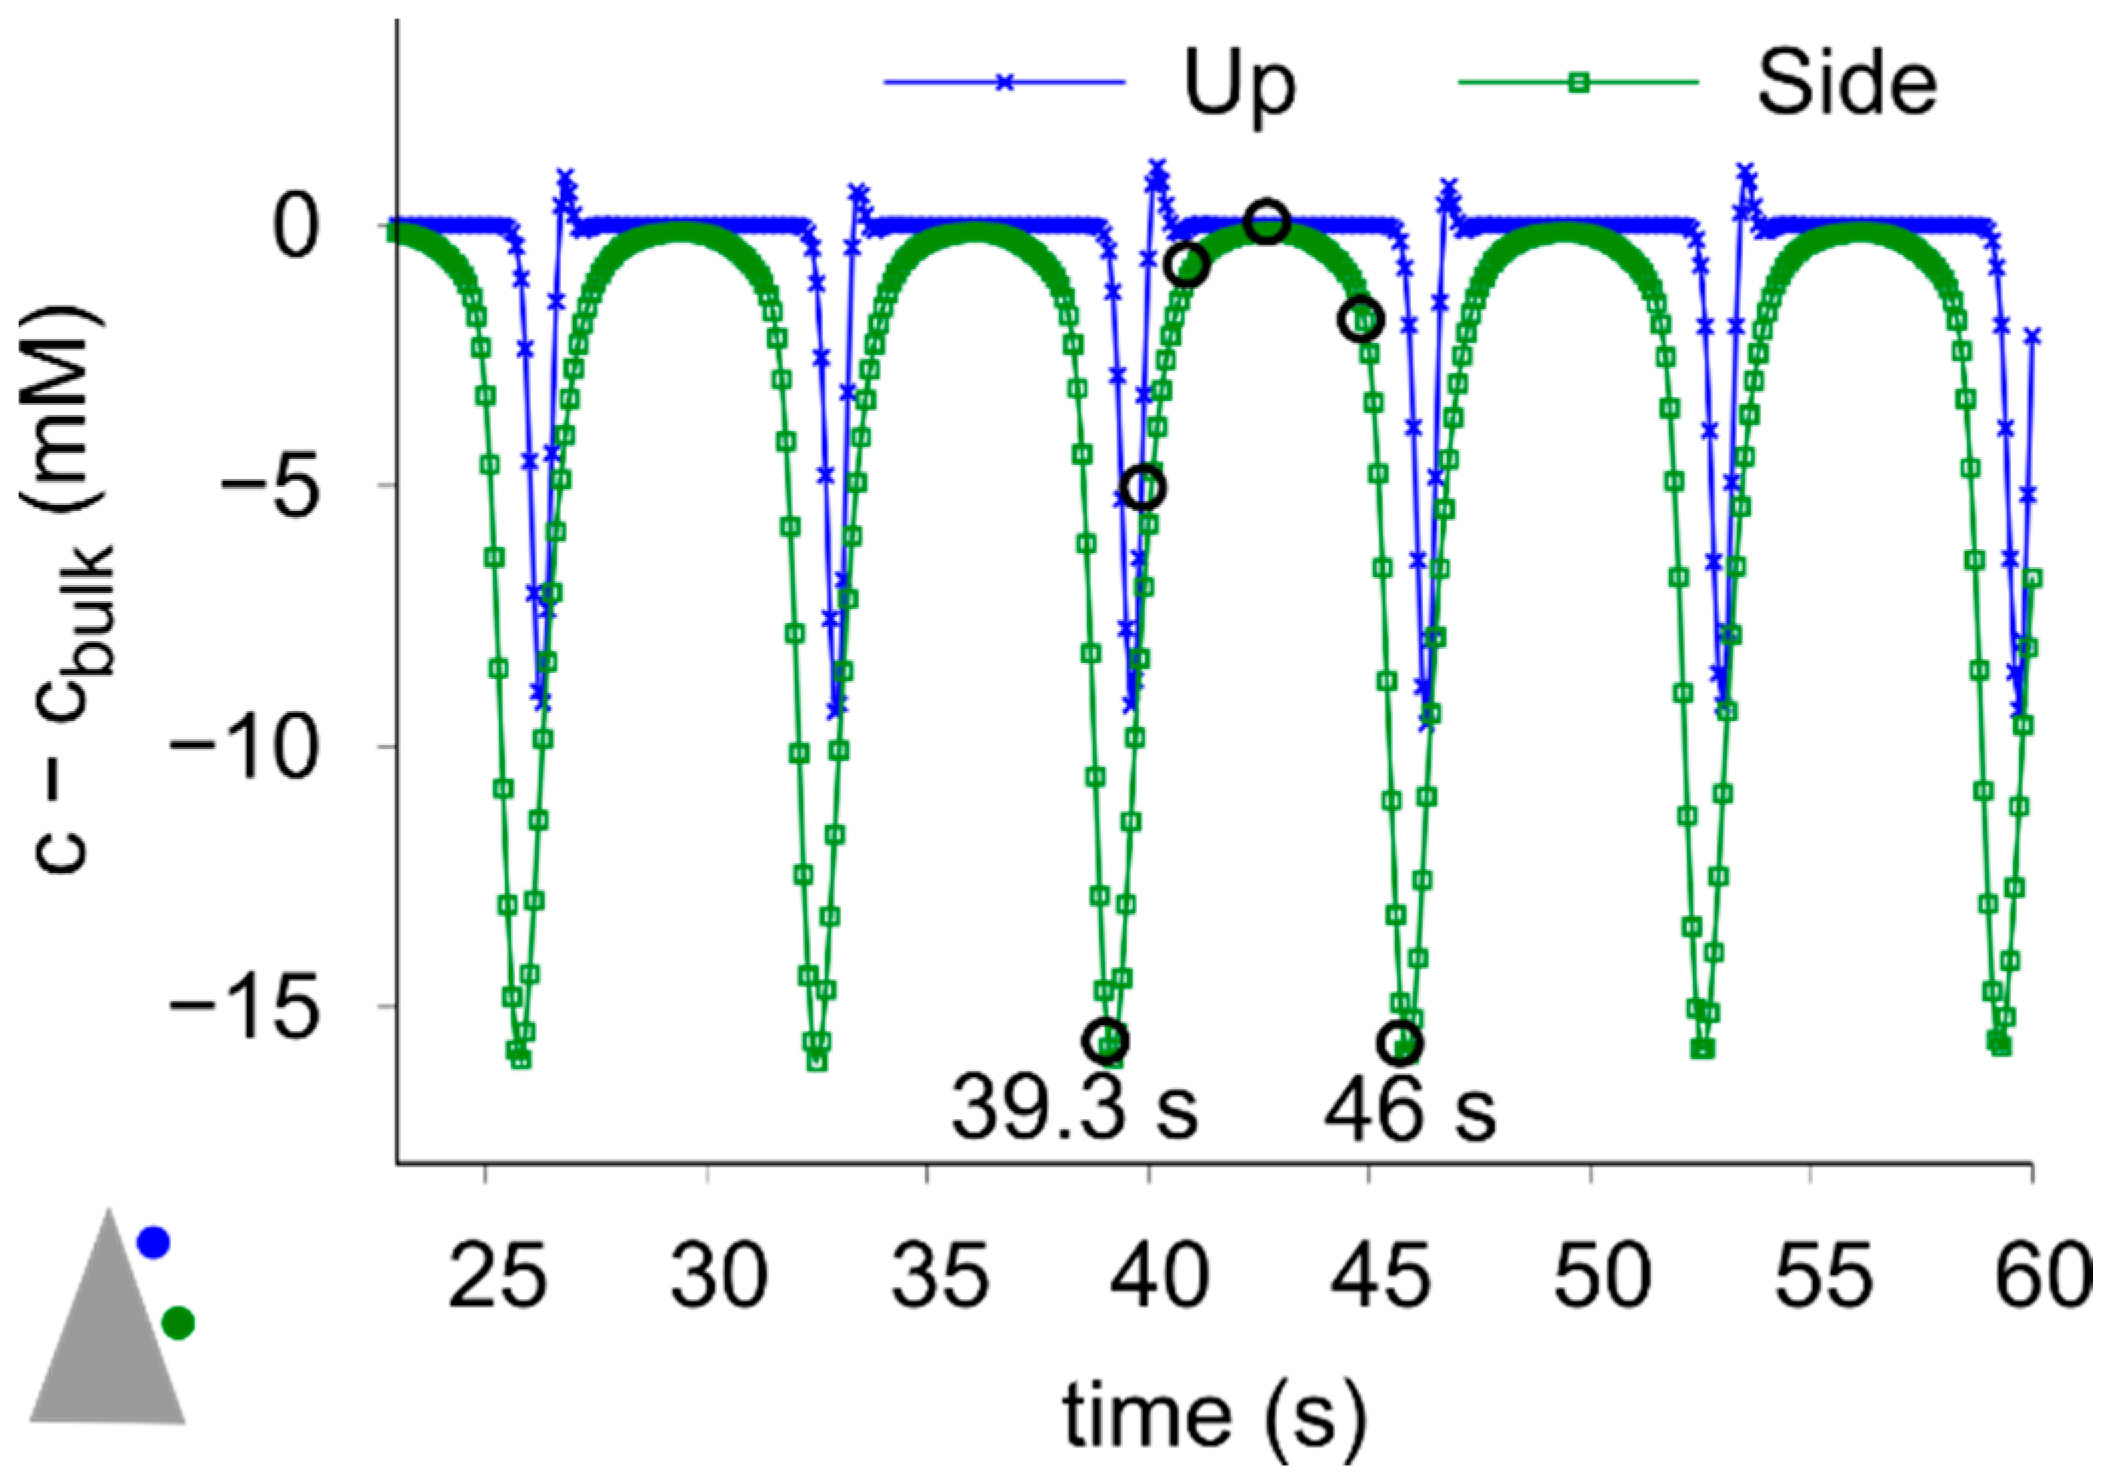
We consider the concentration variation next to the cone when a current density of 8 mA/cm2 is applied. It should be noted that the experimental data were averaged in the laser direction, and the concentration variation was computed with respect to the frame at t = 36.4 s, when the bending of the fringes indicates the start of the oscillations. This provides a qualitative description of the oscillation phenomena during electrodeposition and enables accurate information on the oscillation frequencies. Two regions of interest (ROIs) of 0.021 × 0.0192 mm2 were selected near the tip and the middle part of the cone, the coordinates of the center of the ROIs with respect to our assigned reference system are x1 = 0.57 mm; z1 = 1.93 mm (upper point) and x2 = 0.77 mm; z2 = 1.02 mm (side point). We plotted the concentration variation averaged in two regions of interest as a function of time in Figure 6a. These regions are marked as black rectangles in Figure 7b,d. Additionally, local profiles of the concentration variation at three different points in time are depicted in Figure 6b.
It should be noted that at the beginning of the deposition, the concentration gradients near the cone are weak, and the forces acting on the electrolyte are not strong enough to generate oscillations. As the deposition proceeds, low-concentrated electrolyte accumulates near the cone and the momentum caused by the buoyancy and the magnetic forces prevails over friction after a certain time depending on the current density [26], so that the stationary departure of the boundary layer becomes oscillatory. For the 8 mA/cm2 case, oscillations with a frequency of about 0.3 Hz are observed after about 35 s of deposition. An ongoing slow increase in the overall magnitude of natural convection with time may be responsible for the slight monotonic trend towards lower concentrations.
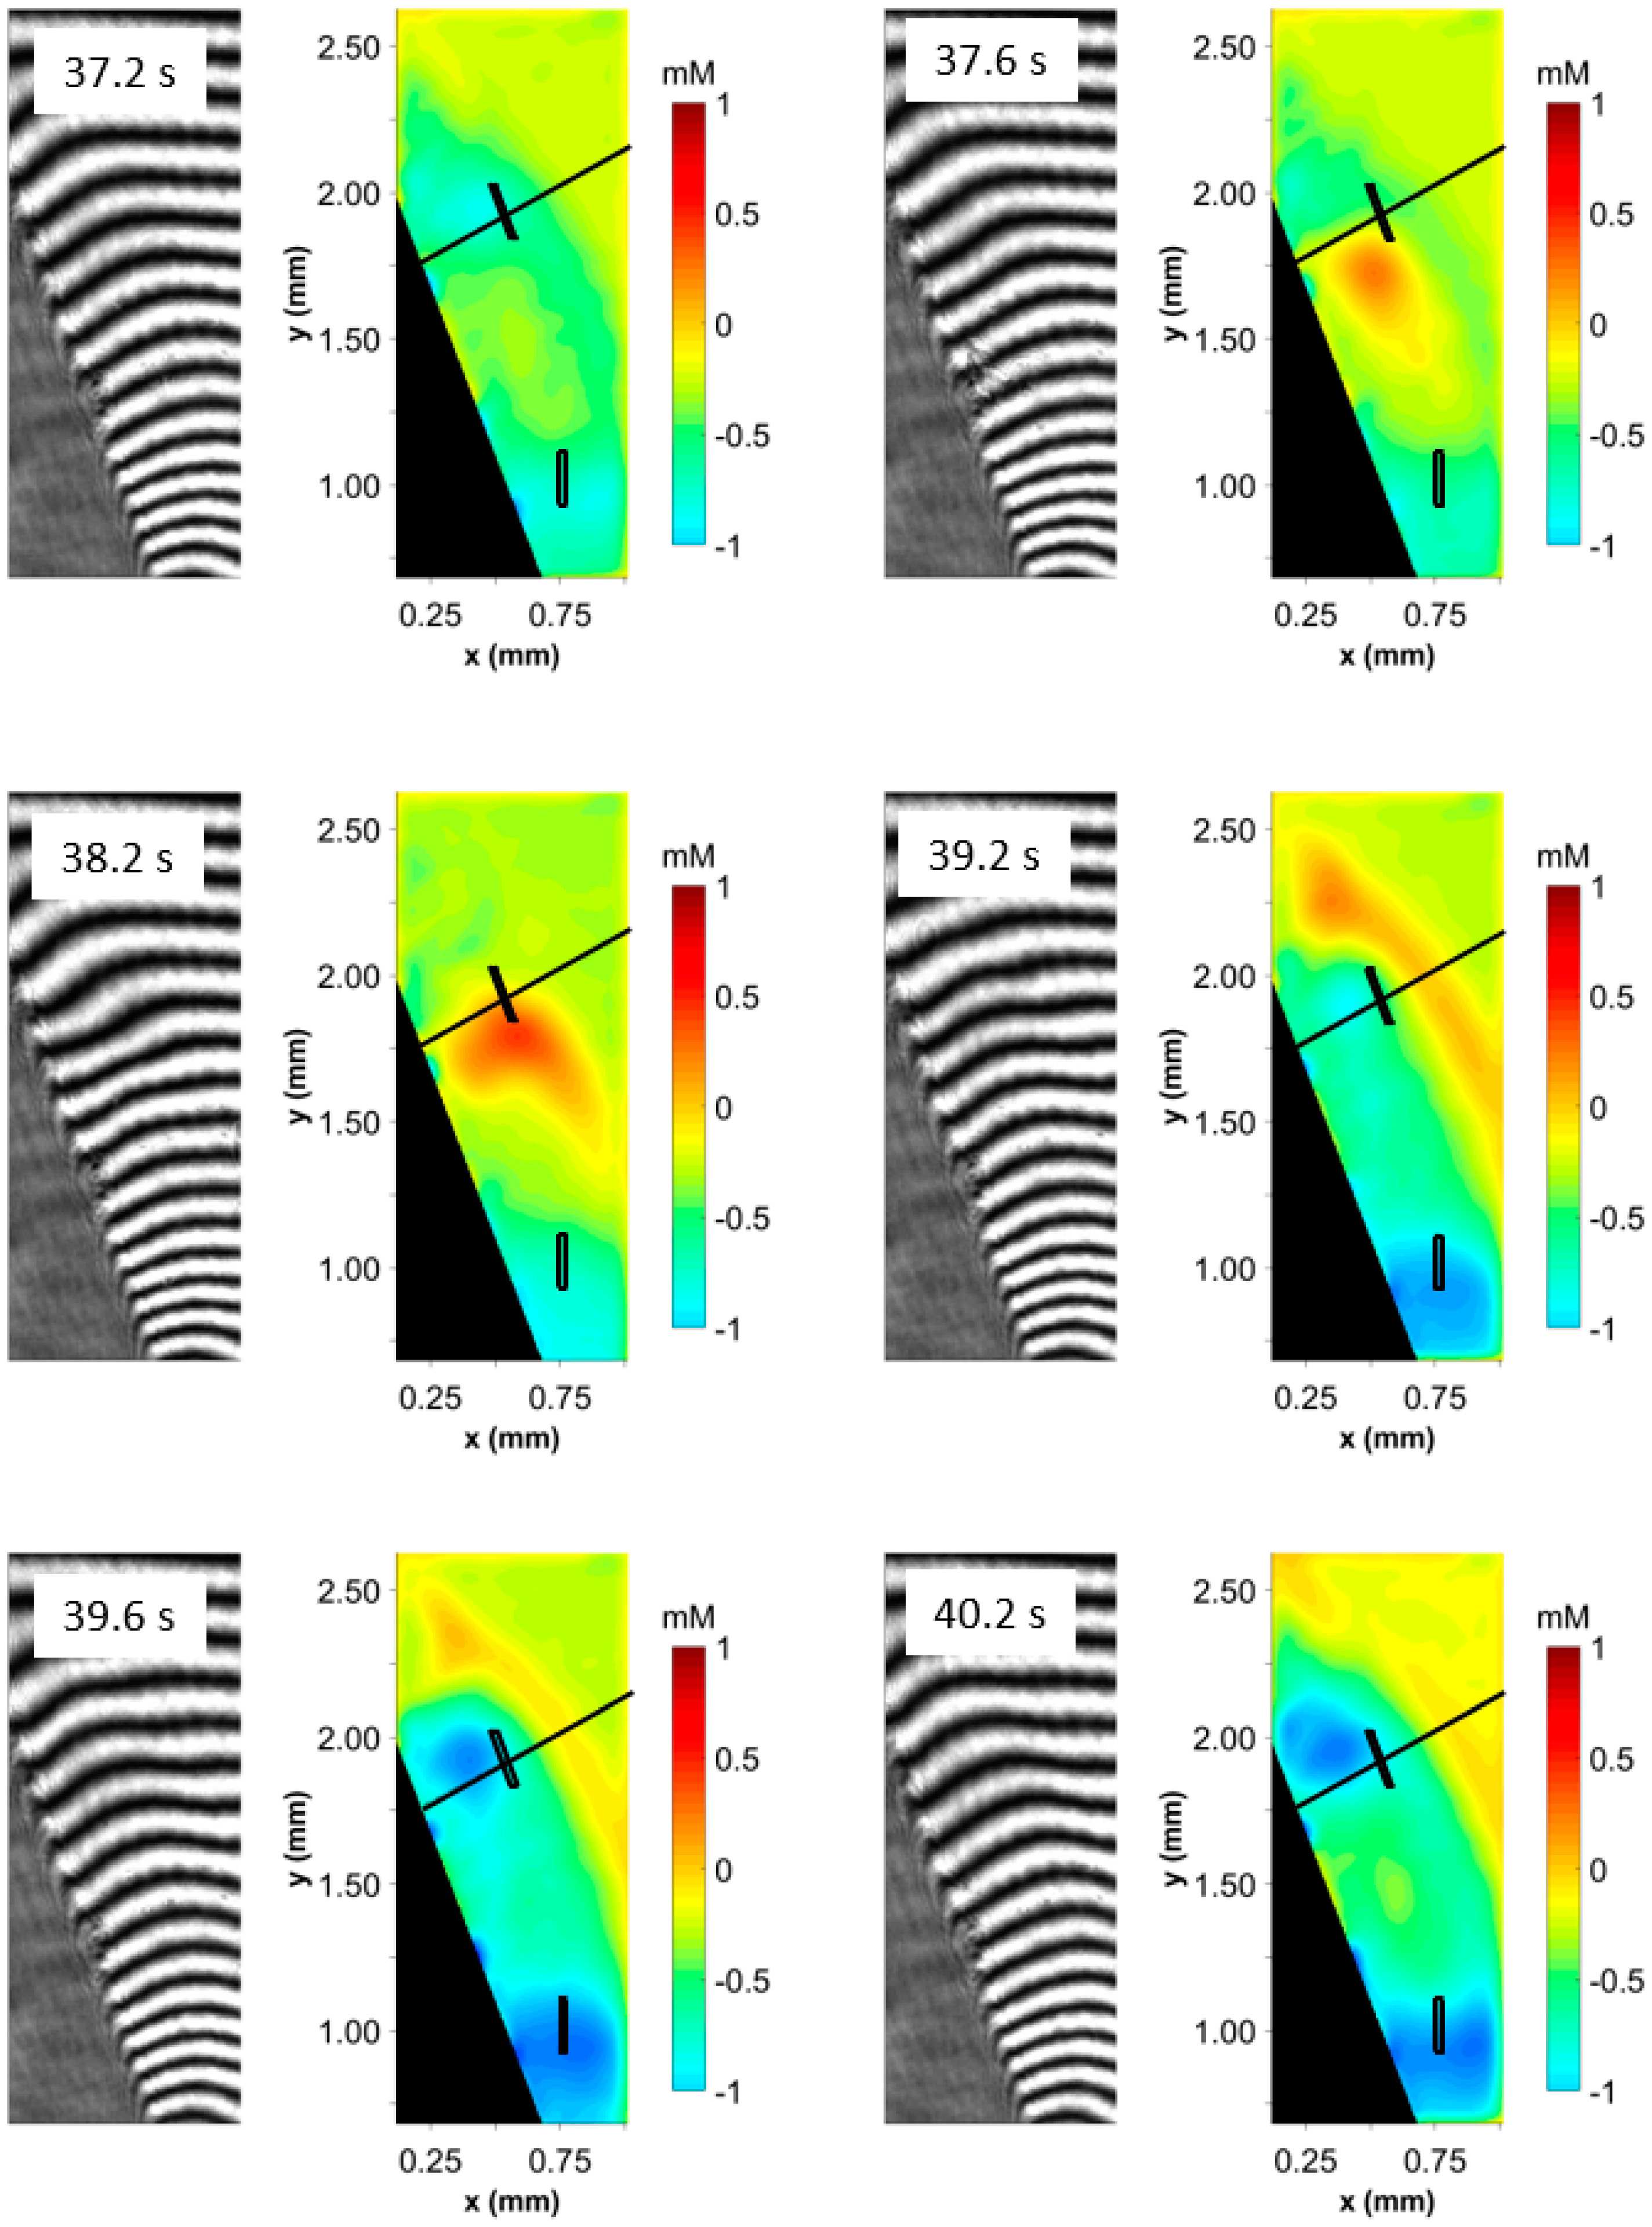
Figure 7 shows interferograms of copper sulfate and the concentration variations near the cone at several points in time, which correspond to values between two minima at the upper ROI, as shown by the blue curve in Figure 6a. The periodic variation shown there is also reflected in the profiles of the concentration boundary layer shown in Figure 6b, which originate at the center of the cone surface and follow the surface-normal direction, marked as a black line in Figure 7. When comparing the amplitude of the temporal oscillations in the ROIs shown in Figure 6a and Figure 4a, the concentration changes in the boundary layer over time are larger in the galvanostatic case compared to the electroless case. At 37.2 s, the buoyancy plume containing low-concentrated electrolyte is clearly visible near the upper part of the cone, indicated by the light-green region. At 37.6–38.2 s, the plume is lifted up due to the buoyancy force, causing the boundary layer in the ROI to recover. Meanwhile, the concentration in the ROI reaches a maximum as shown in Figure 6a. As the deposition proceeds and low-concentrated fluid continues to accumulate near the cone, a new buoyancy plume starts to develop from 39.2 s. It originates at the foot of the cone and is responsible for the blue region near the middle part of the cone ( y 1   mm ). Due to friction, the red region seems to be lifted up by the upward motion of the lighter fluid surrounding it. Meanwhile, another low-concentration region begins to become visible near the cone tip. This may be related to the last buoyancy plume rising up and separating from the cone tip. More details are discussed in the numerical section. The concentration in the ROI continues to decrease until 40.2 s, at which the next minimum is reached. After that, this buoyancy plume, similarly to the previous one, can be expected to start to rise up, and the local boundary layer tends to recover, so that the local concentration increases again (Figure 6a). Therefore, the periodic development and rise of the buoyancy plumes is responsible for the oscillation in the concentration observed in the ROIs.
Another trend we observed was that the concentration maxima are associated with a blown-up, convexly curved boundary layer shape. By contrast, in the concentration minima, the boundary layer becomes wavy, associated with the start of the buoyancy plume. The concentration variation in the case of 4 mA/cm2 is additionally shown in Figure S2a,g of the supporting information.

3.2. Numerical Section

In order to deepen our understanding of the oscillatory boundary layer, in the following we analyze the concentration with respect to the bulk concentration for the galvanostatic deposition of j cathode = 8 mA / cm 2 . Please note that the numerical results shown are not averaged in the laser direction. Figure 8 shows the concentration variation at two monitoring points on the vertical plane across the center of the cone. The coordinates of the points correspond to the ROIs selected in the experiments (marked as white circles in Figure 9).
Compared to the experimental results shown in Figure 6, in the simulations, the amplitude of the concentration variations is larger, reaching 15 mM for the point near the middle part of the cone and 9 mM for the upper point. Furthermore, in each oscillation period, the concentration drops below the bulk concentration c bulk only briefly, after which it recovers to c bulk and remains at that high level for a longer time. The main reason for the differences compared with the experimental results is that the concentration shown here obtained from the simulations is not averaged in the laser direction. Thus, a narrower region of the buoyancy plume with larger concentration variations is to be expected compared to the experimental results. The oscillation period T period for both monitoring points is about 6.7 s.
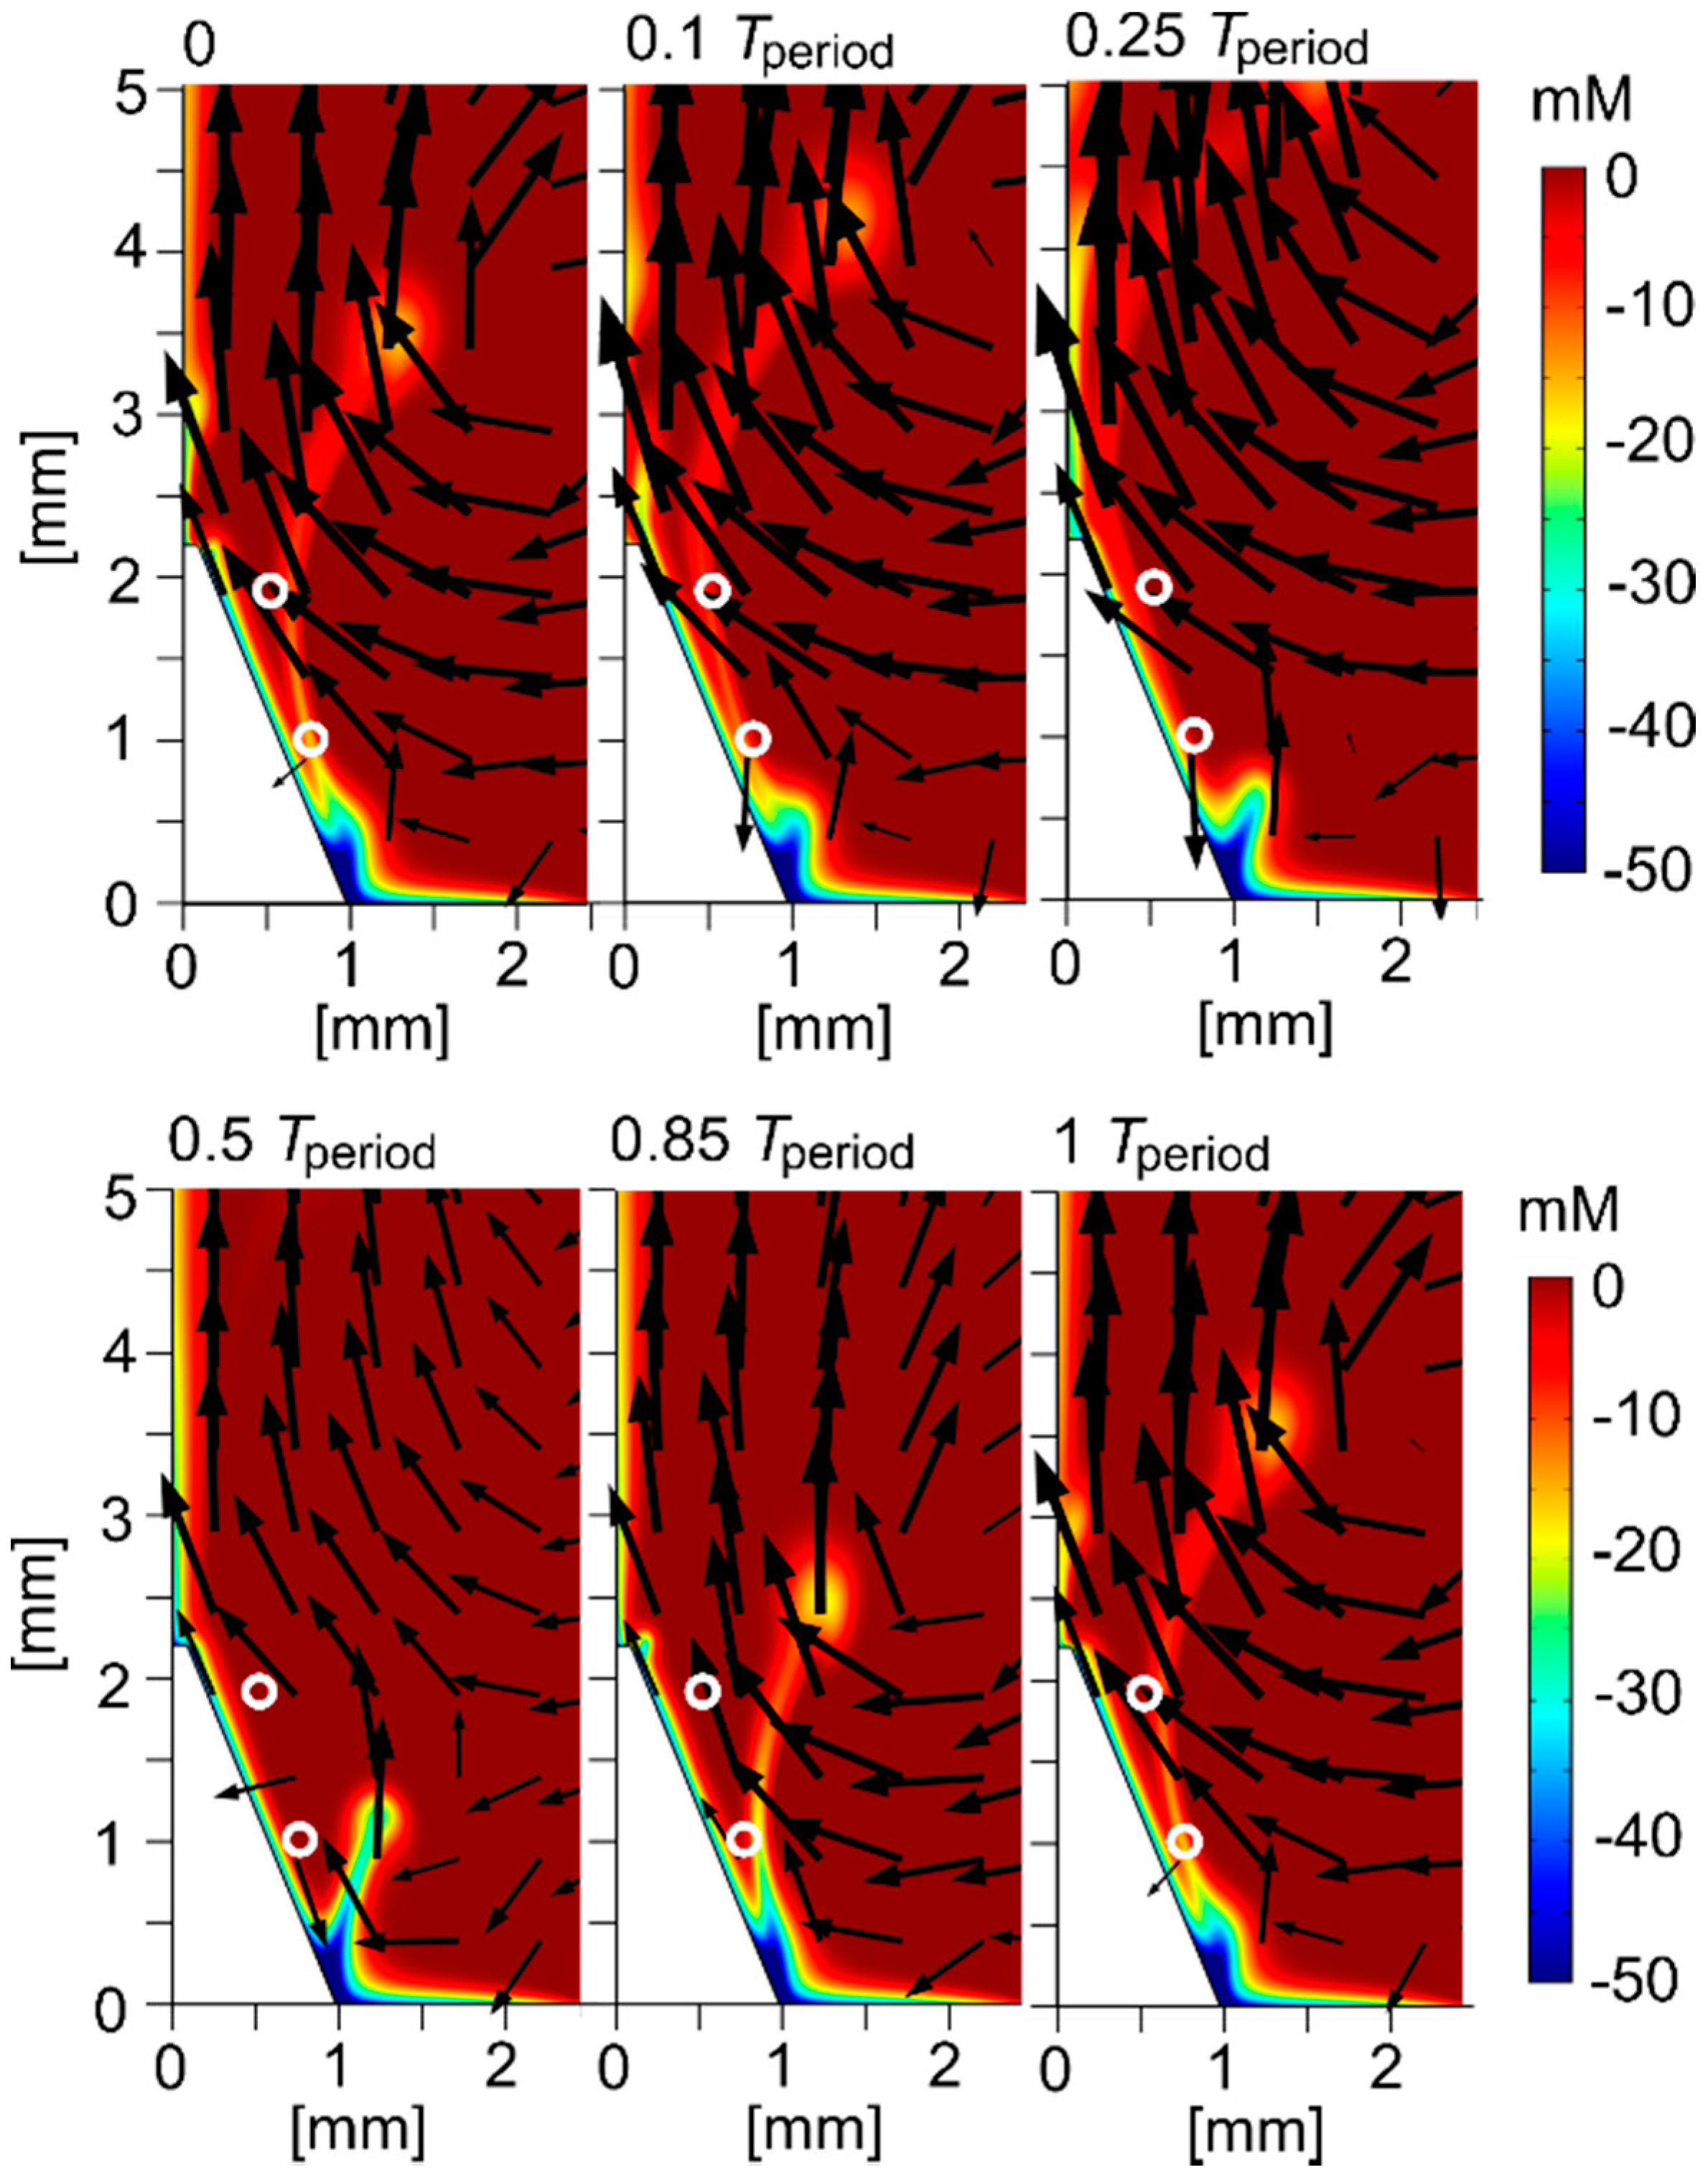
Figure 9 shows the concentration distribution and the vectors of the electrolyte velocity in the vertical plane across the center of the cone at different points in time within one oscillation period, as marked by black circles in Figure 8. Note that the region shown here is larger than the region of the interferometer measurements. Therefore, the buoyancy plume, with its blunted cap [48], is clearly visible. The plume-like shape is similar to the behavior of the temperature in natural thermal convection [48]. At the beginning of this oscillation period (39.3 s), the buoyancy plume sweeps over the lower monitoring point, causing a local minimum concentration, while the upper monitoring point remains at c bulk as shown in Figure 8. This buoyancy plume is responsible for the low-concentrated region found in the experimental results near the middle part of the cone, see Figure 7. After that, the plume continues rising up and also moves towards the cone surface, due to the action of the electrolyte flow. As shown by the velocity vectors, the flow is mainly directed upwards due to buoyancy, which also drives the fluid from the right side towards the cone due to the continuity of flow. After 0.1   T period , the plume sweeps over the upper monitoring point, in line with the low concentration shown in Figure 8. After 0.25   T period , the buoyancy plume has moved further to the left and joined the continuous boundary layer along the cone surface, causing a thick boundary layer near the cone tip. After that, the buoyancy plume continues to flow along the extended axis of the cone. Therefore, the concentration at both monitoring points recovers to c bulk . The attaching and the separation of the buoyancy plume may be the reason causing the low-concentrated region near the cone tip in Figure 7. Meanwhile, a downward flow caused by the magnetic field is found near the lower part of the cone, as represented by the black arrows directed downwards there. This flow counteracts the buoyancy flow driven from the right side to the foot of the cone and causes a separation of the boundary layer there. This separated boundary layer is rooted at the cone foot and continues to grow upwards, forming a new buoyancy plume at 0.5   T period . After that, the plume continues to grow and also to lean against the cone. The downward flow near the cone foot is no longer visible, indicating that the buoyancy force has surpassed the magnetic forces at this stage ( 0.85   T period ). At the end of the oscillation period, the buoyancy plume again reaches the lower monitoring point, and the same cycle starts again.
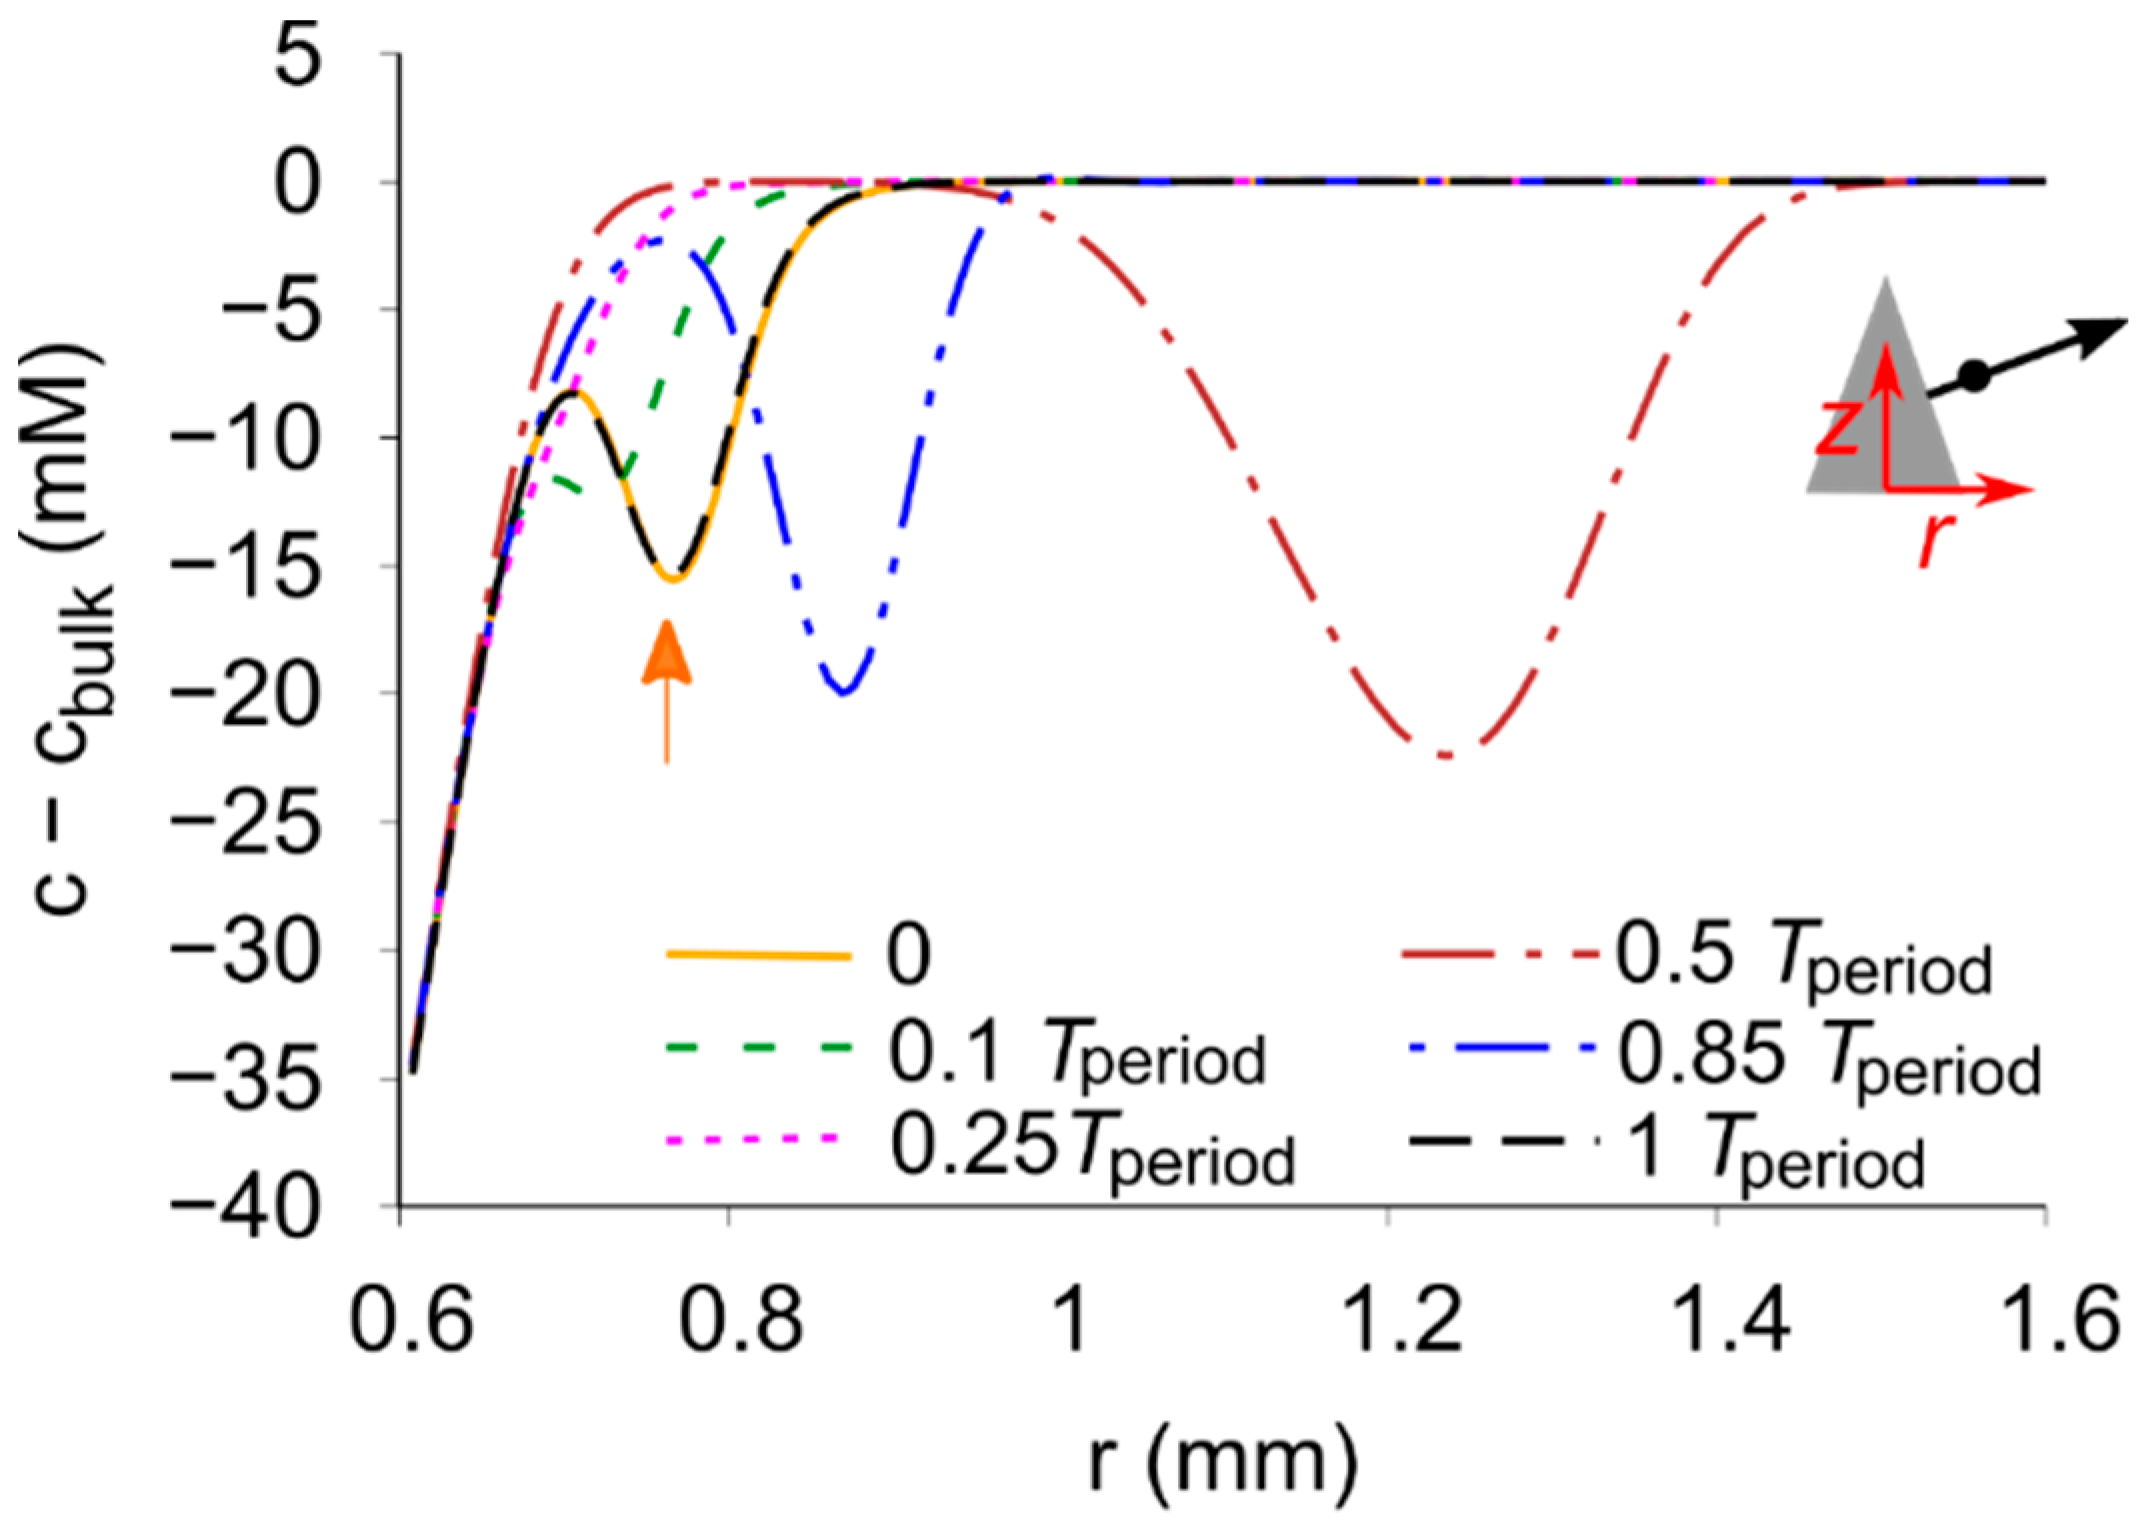
We further analyze the concentration boundary layer and in Figure 10 plot the concentration variations along the electrode-normal monitoring line which passes the lower monitoring point. At the beginning of the oscillation period, starting from the cone surface at r 0.6 mm, the concentration variation increases from −35 to −8 mM until r 0.68 mm, then decreases to a local minimum of approximately −16 mM at r 0.77 mm, i.e., at the monitoring point (indicated by the orange arrow). This shows that the monitoring point lies at the center of the plume, where the smallest concentration is to be expected. When r . further increases, the concentration increases monotonically until c bulk at r 0.9 mm. As the deposition proceeds, the plume moves towards the cone, and the lower monitoring point lies at the edge of the plume at 0.1   T period as shown in Figure 9. As a result, the concentration on the monitoring line increases and its local minimum moves slightly to the left side, as shown by the green dashed line in Figure 10. After 0.25   T period , the buoyancy plume has moved upwards and no longer disturbs the concentration at the monitoring line. Therefore, the concentration increases monotonically across the boundary layer of about 0.2 mm thickness. Meanwhile, the next buoyancy plume starts to develop from the cone foot, and already grows higher than the monitoring point at 0.5   T period . As shown by the brown dash-dotted line in Figure 10, this new plume causes a region of low concentration at 0.9 r 1.5 mm, while the concentration at the monitoring point stays at c bulk . At 0.85   T period , as represented by the blue dash-dotted line, the local minimum of the concentration moves towards smaller r , caused by the movement of the buoyancy plume towards the cone surface as discussed above. Finally, due to further ongoing growth and inward motion of the buoyancy plume, the concentration variation at the monitoring point again reaches the minimum value at the end of the oscillation period.
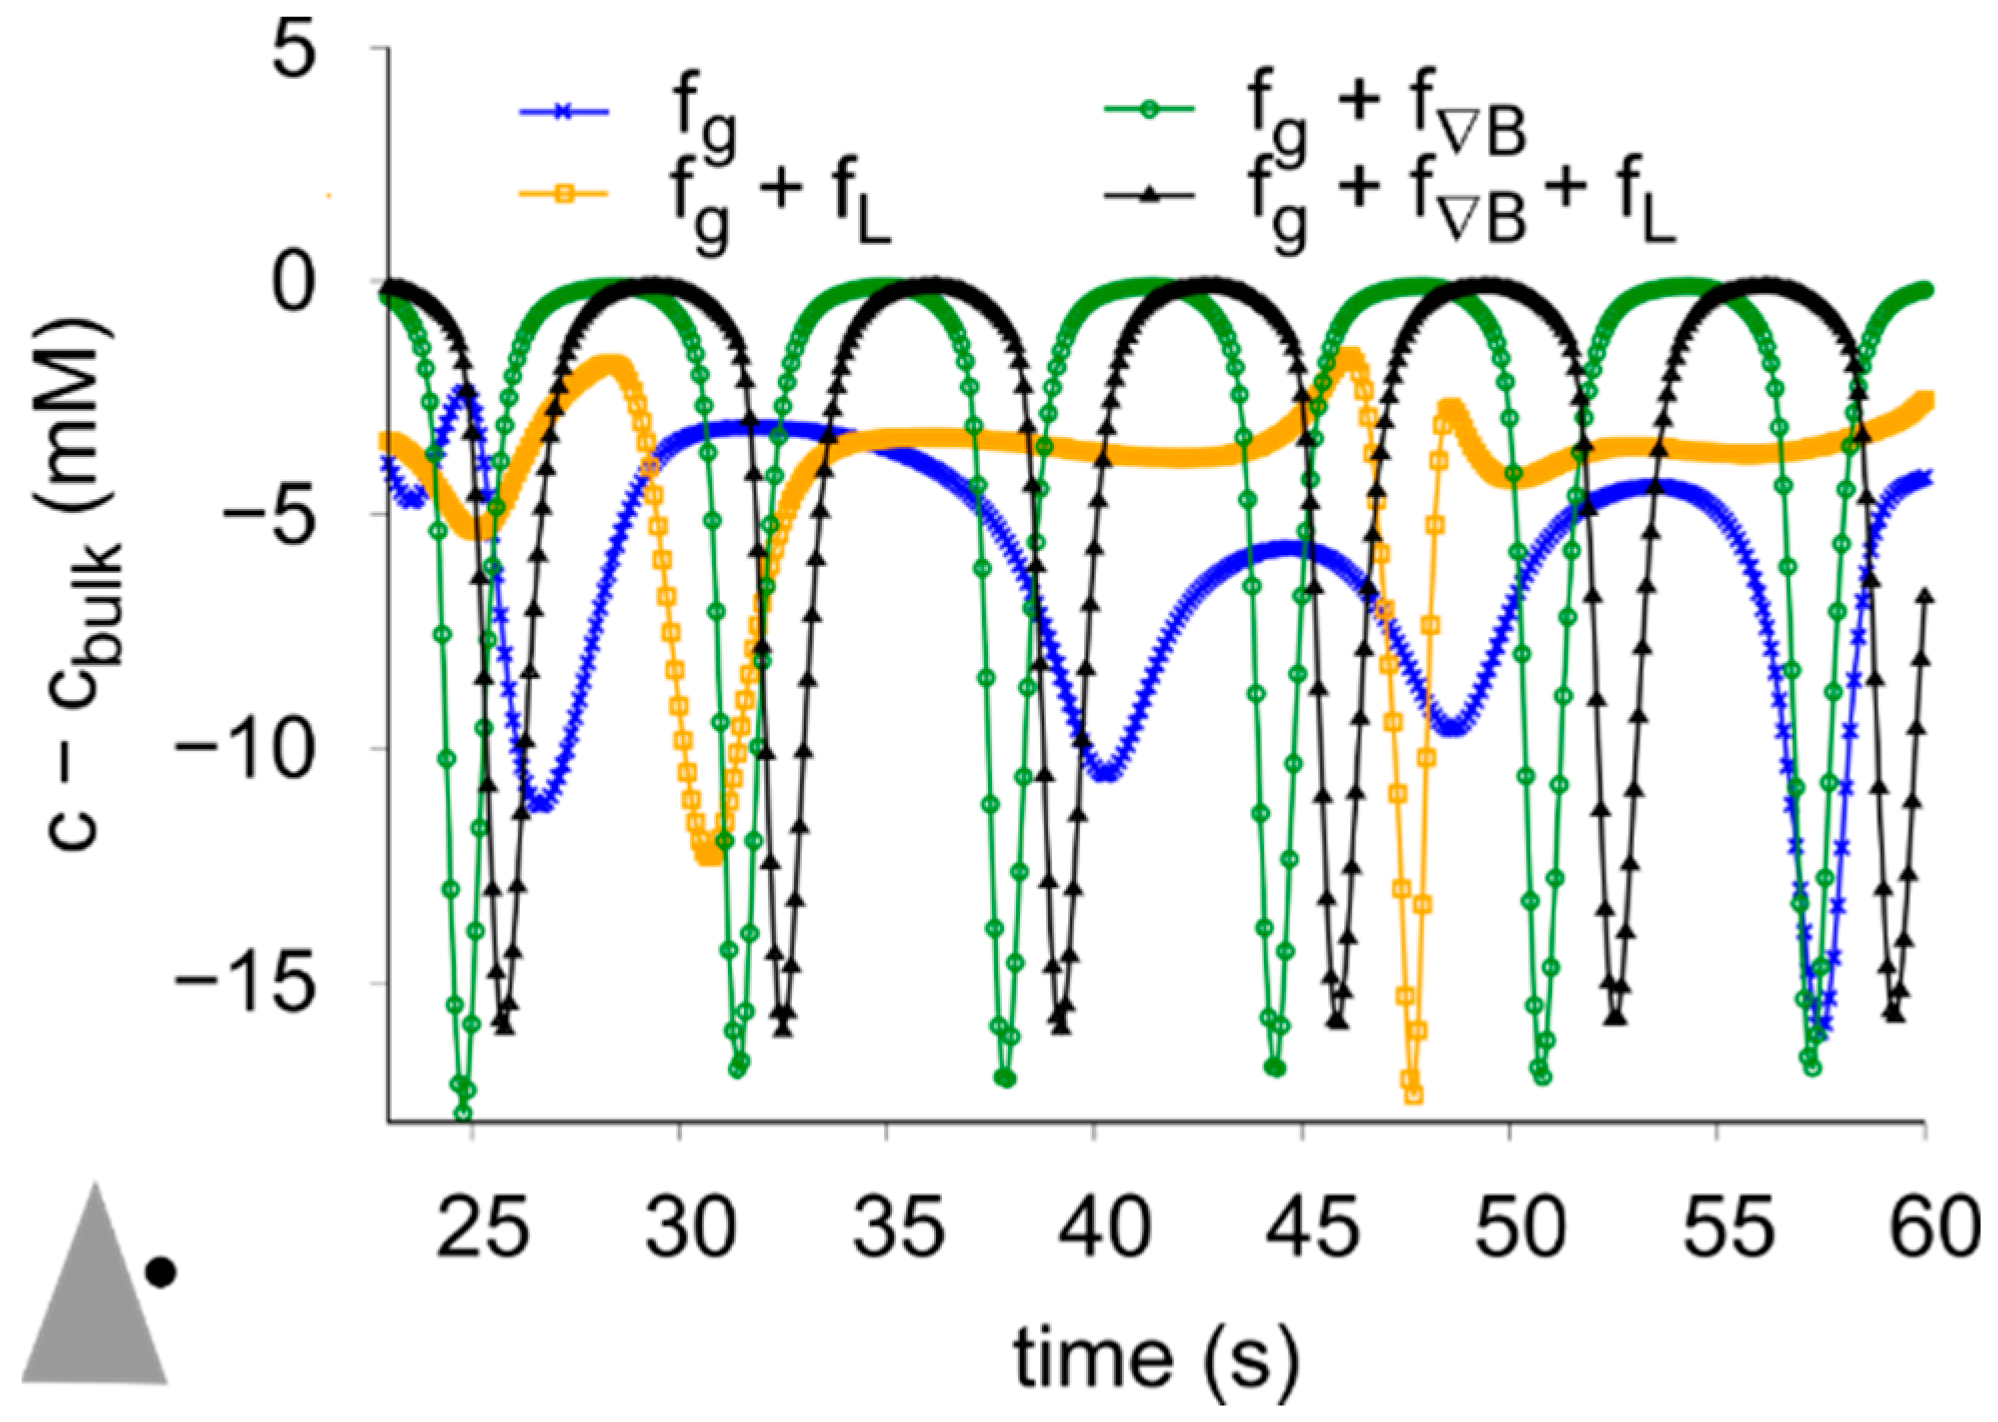
In order to gain more insight into how the magnetic field influences the oscillations, we further conducted simulations for the case of 8 mA / cm 2 . where individual volume forces are switched off in the numerical model. Figure 11 shows the concentration variation over time at the lower observation point. When only the buoyancy force is considered (no magnetic field), the concentration does not recover to the bulk level, suggesting that the observation point lies inside the concentration boundary layer. The weak temporal variations observed will be discussed in more detail later. If the Lorentz force is also added, these variations are stronger in amplitude but appear less frequently. This may be caused by the downward flow in the bulk electrolyte caused by the Lorentz force [42], which hinders the buoyancy plume from penetrating the bulk electrolyte. By contrast, the case with the buoyancy force and magnetic gradient force generates periodic oscillations with the same frequency as all the volume forces added. As can be seen, the additional action of the Lorentz force only shifts the phase of the oscillation. This may be related to the action of the Lorentz force in the initial phase of the deposition, when the concentration boundary layer has not yet fully built up and the other two forces are only weak. The secondary flow caused by the Lorentz force may therefore suppress buoyancy in the first few seconds of the deposition [27] and thus slightly postpone the start of the oscillations. Furthermore, the concentration recovers to the bulk concentration in each period after the buoyancy plume passes by, which indicates that the boundary layer is thinner compared to the case where only the buoyancy force is implemented. These results clearly show that, unlike the Lorentz force, the magnetic gradient force is essential for generating periodic oscillations.
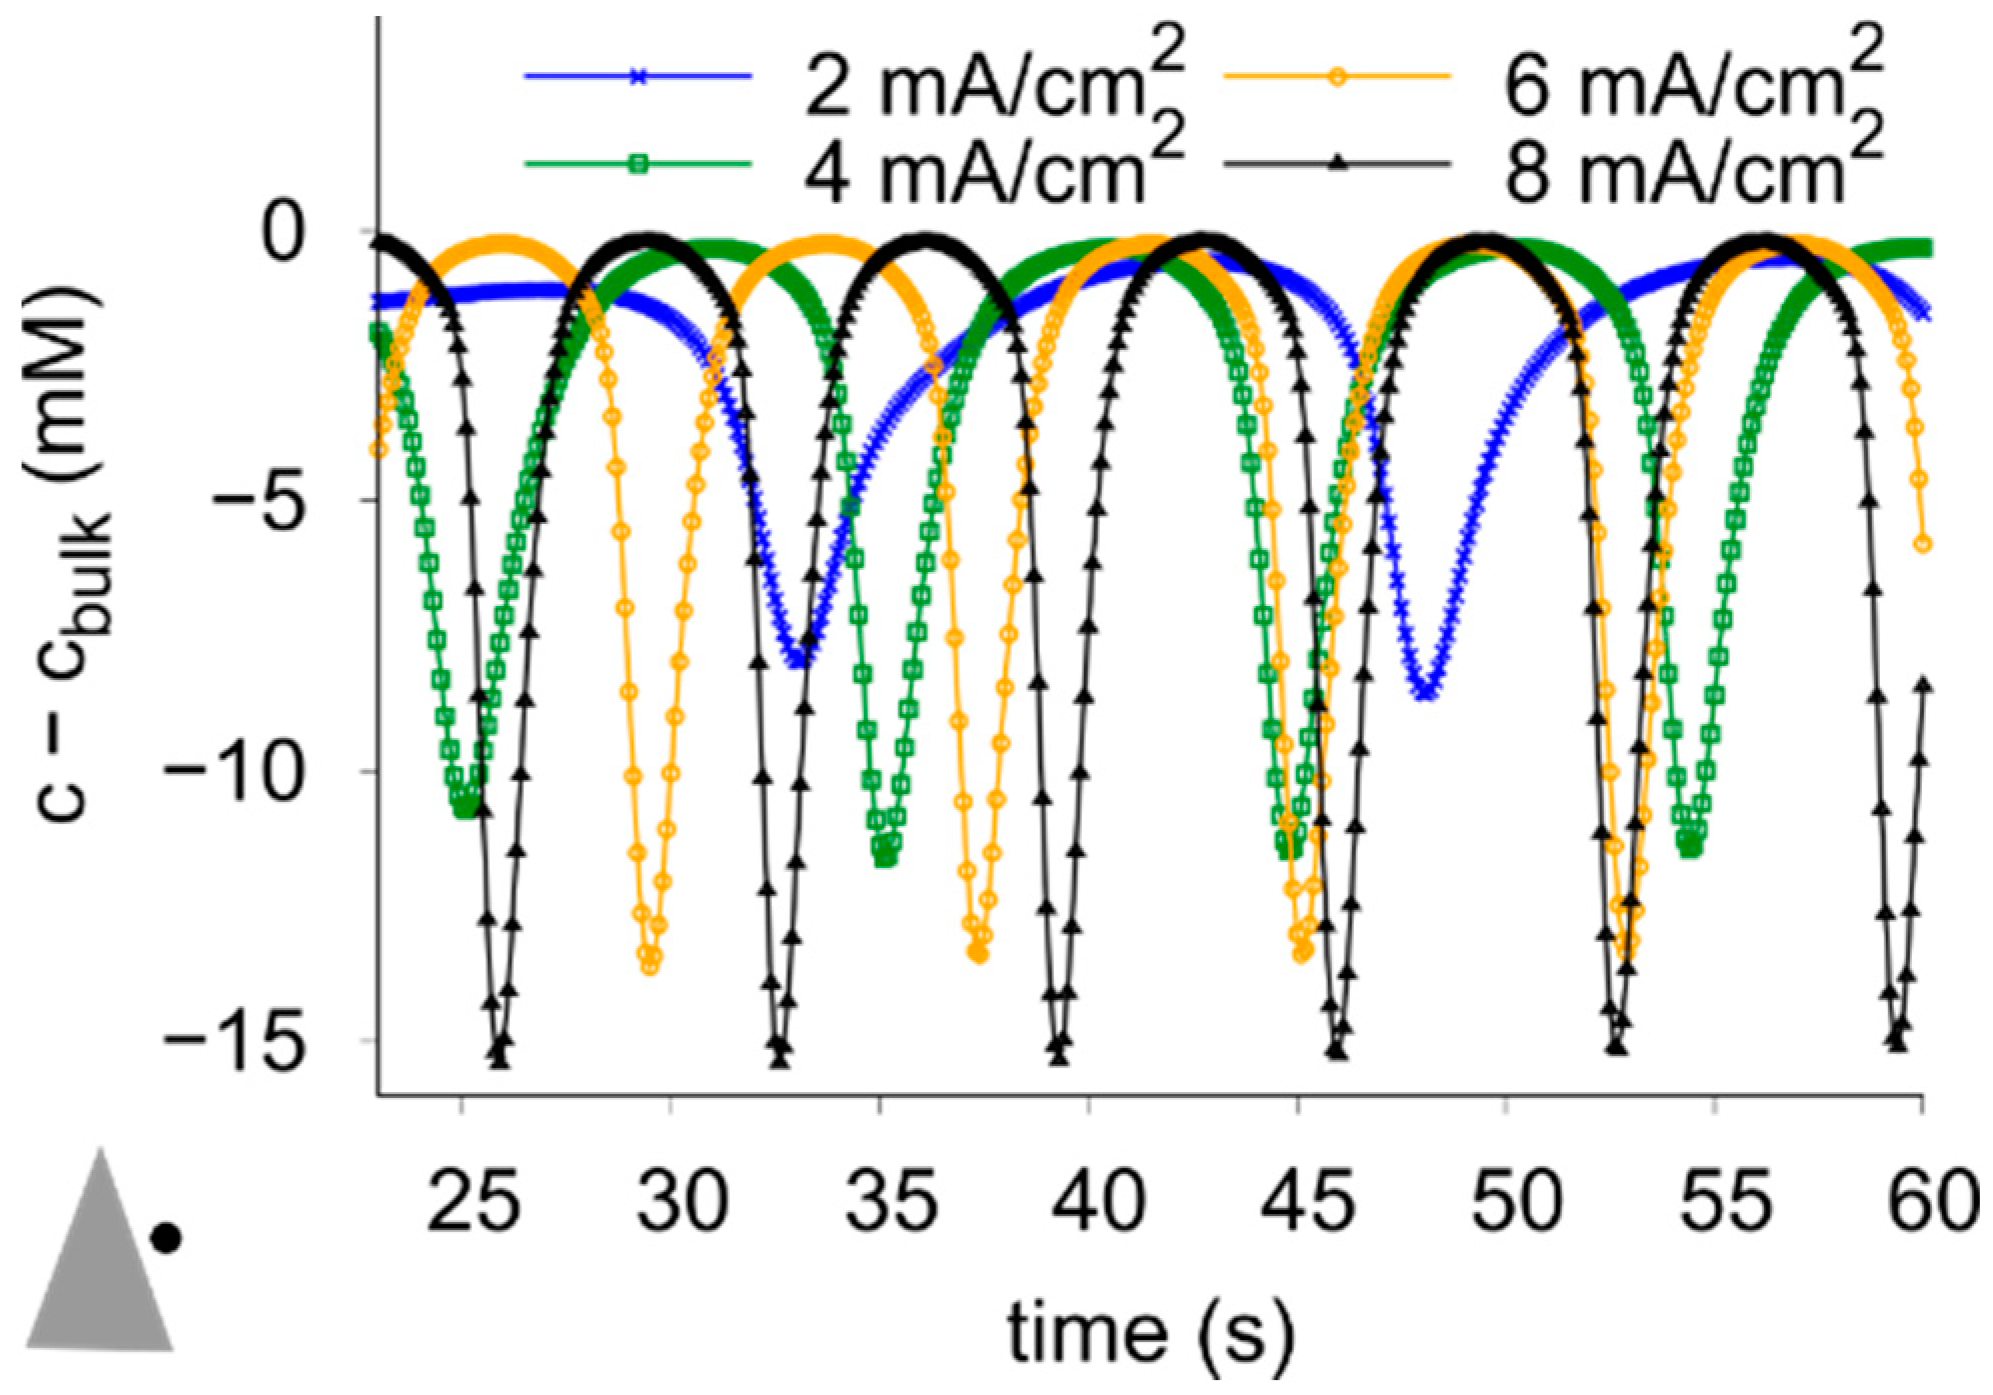
We next study the influence of the current density on the oscillation behavior. The temporal behavior of the concentration variations at the lower monitoring point is shown in Figure 12. Both the oscillation frequency and the amplitude show a clear trend to increase with the current density. Furthermore, the duration of lowered concentration in each period is shorter for a higher current density. This indicates that the buoyancy plume grows and moves faster with increasing current density. The reason is obviously the stronger electrolyte flow and the faster mass transfer caused by the larger concentration gradients. Moreover, no qualitative difference is found between these oscillation curves, and the oscillation mechanism discussed for 8 mA / cm 2 should also apply to the cases of the other current densities studied.
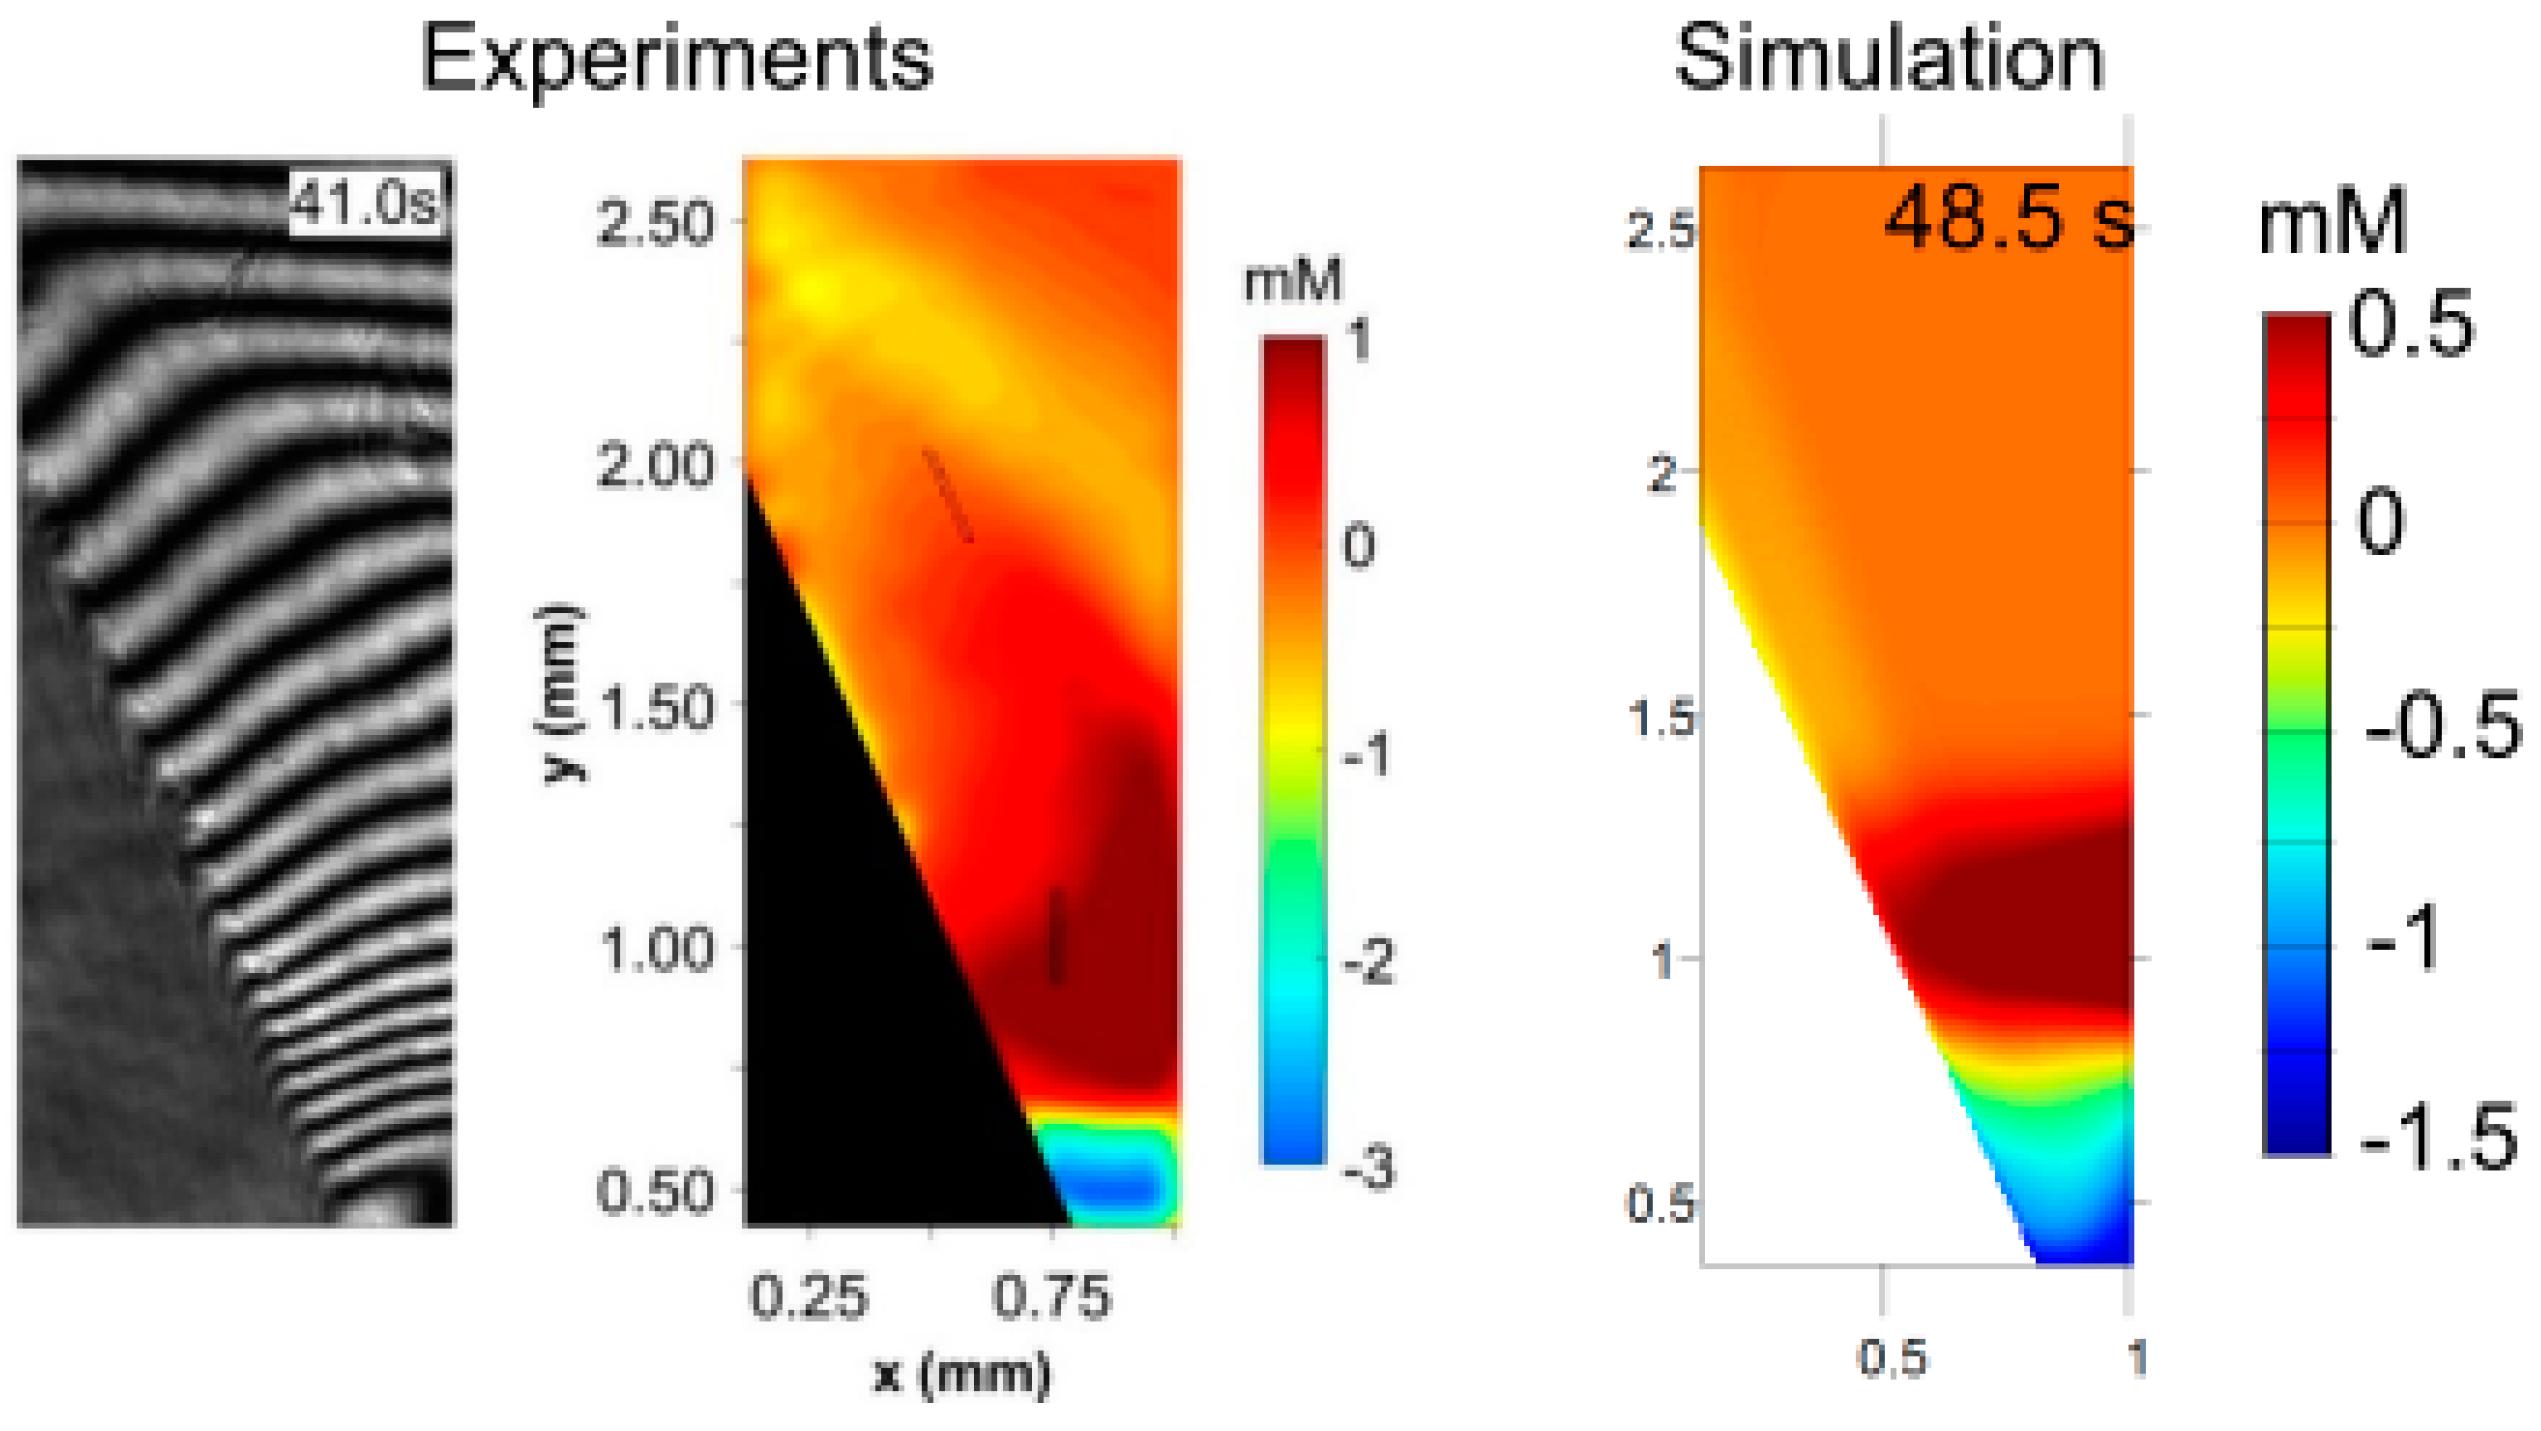
For better comparison with the experimental results which, due to the optical method applied, deliver concentration changes averaged in the laser direction, we finally postprocess our axisymmetric simulation results for the 4 mA/cm2 case. Similar to the experiment, the concentration variation is reported with respect to a reference frame before the first oscillation starts and averaged in the laser direction. The comparison is shown in Figure 13, where in both cases, a point in time is depicted when the concentration at the lower monitoring point reaches a maximum. The numerical and experimental results exhibit good qualitative agreement, as the recovery of the boundary layer near the cone tip and the buoyancy plume rooted in the bottom of the cone are clearly visible in both results. Therefore, the oscillations found in the experiments and simulations are expected to follow the same mechanism. Unavoidably, as can be further seen from a comparison with the non-averaged simulation results in Figure 9, some local details are lost during the averaging procedure. We would also like to mention that the selection of the particular reference frame may additionally affect the averaged concentration result.

4. Discussion

In the following, we add analytical reasoning for the oscillation frequency before comparing it with the experimental and the numerical results.
From the phase shift between the two monitoring points of 0.5 s shown in Figure 6 and Figure 8 and the distance between them of 1 mm, we obtain a characteristic buoyancy plume velocity of approximately 2 mm/s. The Reynolds number R e = U L / ν is estimated to be 5 when assuming the characteristic length L to be the slant side length of the cone (2.6 mm) and the kinematic viscosity ν to be 10 6 m 2 /s [36]. This indicates a laminar flow. Oscillatory fluid flow in the laminar range is known to occur between horizontal plates which are heated from below [49]. Thermal buoyancy causes the boundary layer to periodically leave the wall as a vertical plume. After a plume rises up, the boundary layer recovers, and the next plume starts to form, which is similar to the oscillation behavior discussed above. On inclined walls, depending on the density gradients on the surface, such intermittent buoyancy plumes may also appear [50]. On vertical walls, provided that the Reynolds number is low, a continuous, laminar boundary layer flow develops, which will not oscillate [49].
In the following, we apply the theory developed for thermal buoyancy to study the solutal buoyancy involved in our electrodeposition problem and analyze the oscillation frequencies depending on the external current density.
Our iron cathode consists of a part with an inclined surface (cone) and a horizontal part and can be regarded as an intermediate stage between the intermittent buoyancy plume regime (horizontal wall regime) and the continuous flow regime (vertical wall regime). As shown in Figure 11, in the absence of the magnetic field, weak instabilities in the concentration are observed, indicating an intermediate flow regime which has not yet fully developed into stable periodic oscillations. This is because the angle between the cone surface and vertical direction is quite small (22.5°) for the cone with a tip angle of 45°, and the flow tends to rise up along the cone surface, mainly following the vertical wall regime. When the magnetic field is applied, the magnetic forces generate an opposing downward flow, as also shown in Figure 9 (visible in 0.1 0.5   T period ). On one hand, the magnetic forces modify the buoyancy flow velocity; on the other hand, they help the boundary layer to detach from the inclined cone surface. Consequently, instead of a boundary layer flow developing on the surface (vertical wall regime), the flow on the inclined cone surface gets closer to the horizontal wall regime, and an intermittent buoyancy plume appears.
In the following, we consider the model proposed by Howard [51] and extended by Sparrow et al. [48] to estimate the oscillation frequency of the buoyancy plumes. We consider that the only effect of the magnetic field is to separate the buoyant flow from the inclined cone surface, so that the vertical wall regime changes into the horizontal wall regime. This way, the periodic rising of buoyancy plumes on the cone surface as a result of the magnetic forces and the buoyancy force counteracting one another is simplified to buoyancy plumes appearing from a horizontal surface in the absence of the magnetic field. It should be noted that for the electroless deposition and also for cases of high current density where hydrogen evolution cannot be avoided, the theoretical analysis introduced in the following does not apply.
The main idea of the theoretical model is that when the Rayleigh number R a δ based on the instantaneous thickness δ of the concentration boundary layer reaches a critical value, the layer will break up and a buoyancy plume will be produced. The Rayleigh number is defined as [48]:
R a δ   =   g β ( c s c 0 ) δ 3 D Cu 2 + ν .
Here, g ,   β ,   c s ,   c 0 ,   D Cu 2 + ,   ν represent the gravitational acceleration, the volume expansion of the electrolyte, the surface and the bulk concentration of C u 2 + ions, the diffusion coefficient of C u 2 + ions, and the kinematic viscosity of the 0.3 M CuSO 4 solution, respectively. During the “steady phase” until the buoyancy plume appears in each period, it can be expected that f B and f g are weak due to the slow development of the diffusion layer. Therefore, the influence of the fluid motion on the species transport is neglected in this stage, and the diffusion layer thickness before the diffusion layer breaks up is evaluated as follows [48]:
δ   =   2.77 D B t * ,
with t * denoting the duration of the “steady phase”, and D B = 7.19 · 10 10   m 2 / s denoting an effective diffusion coefficient which accounts for the diffusion and also the migration transport in the binary electrolyte [43]. The thus defined thickness δ corresponds to ( c c 0 ) / ( c s c 0 ) = 0.95 at the edge of the diffusion layer [48].
During galvanostatic deposition, the average concentration gradient on the cathode for the binary electrolyte is known as [43]:
c n   =   j cathode , avg 2 z F D C u 2 + .
Here, z and F denote the charge number of C u 2 + ions and the Faraday constant. As Δ c c n · δ , Equation (8) can be written as:
R a δ   =   g β | j cathode , avg | δ 4 2 z F D C u 2 + 2 ν .
Combining Equations (8)–(11), it is possible to calculate the critical time t * at which the layer breaks up and a buoyancy plume appears. Sparrow et al. [48] found that the duration of each oscillation period T period is related to t * in the form t * 0.7   T period . Therefore, the oscillation period of the buoyancy plumes is given as a function of the average current density:
T period =   0.263 D C u 2 + D B ( R a δ   z F ν   g β | j cathode , avg | ) 1 / 2 .
The critical Rayleigh number of 1100 was derived from theoretical analysis and was experimentally confirmed in Sparrow et al. [48]. We further take D C u 2 + = 5.6 · 10 10   m 2 / s , D B = 7.19 · 10 10   m 2 / s , ν = 10 6   m 2 / s , β = 1.6 · 10 4   m 3 / mol . [44]. Thus, using Equation (12), the oscillation frequencies f = 1 / T period . for the current densities 2, 4, 6, 8 mA / c m 2 can be calculated as 0.059, 0.084, 0.10, 0.12 Hz, respectively.
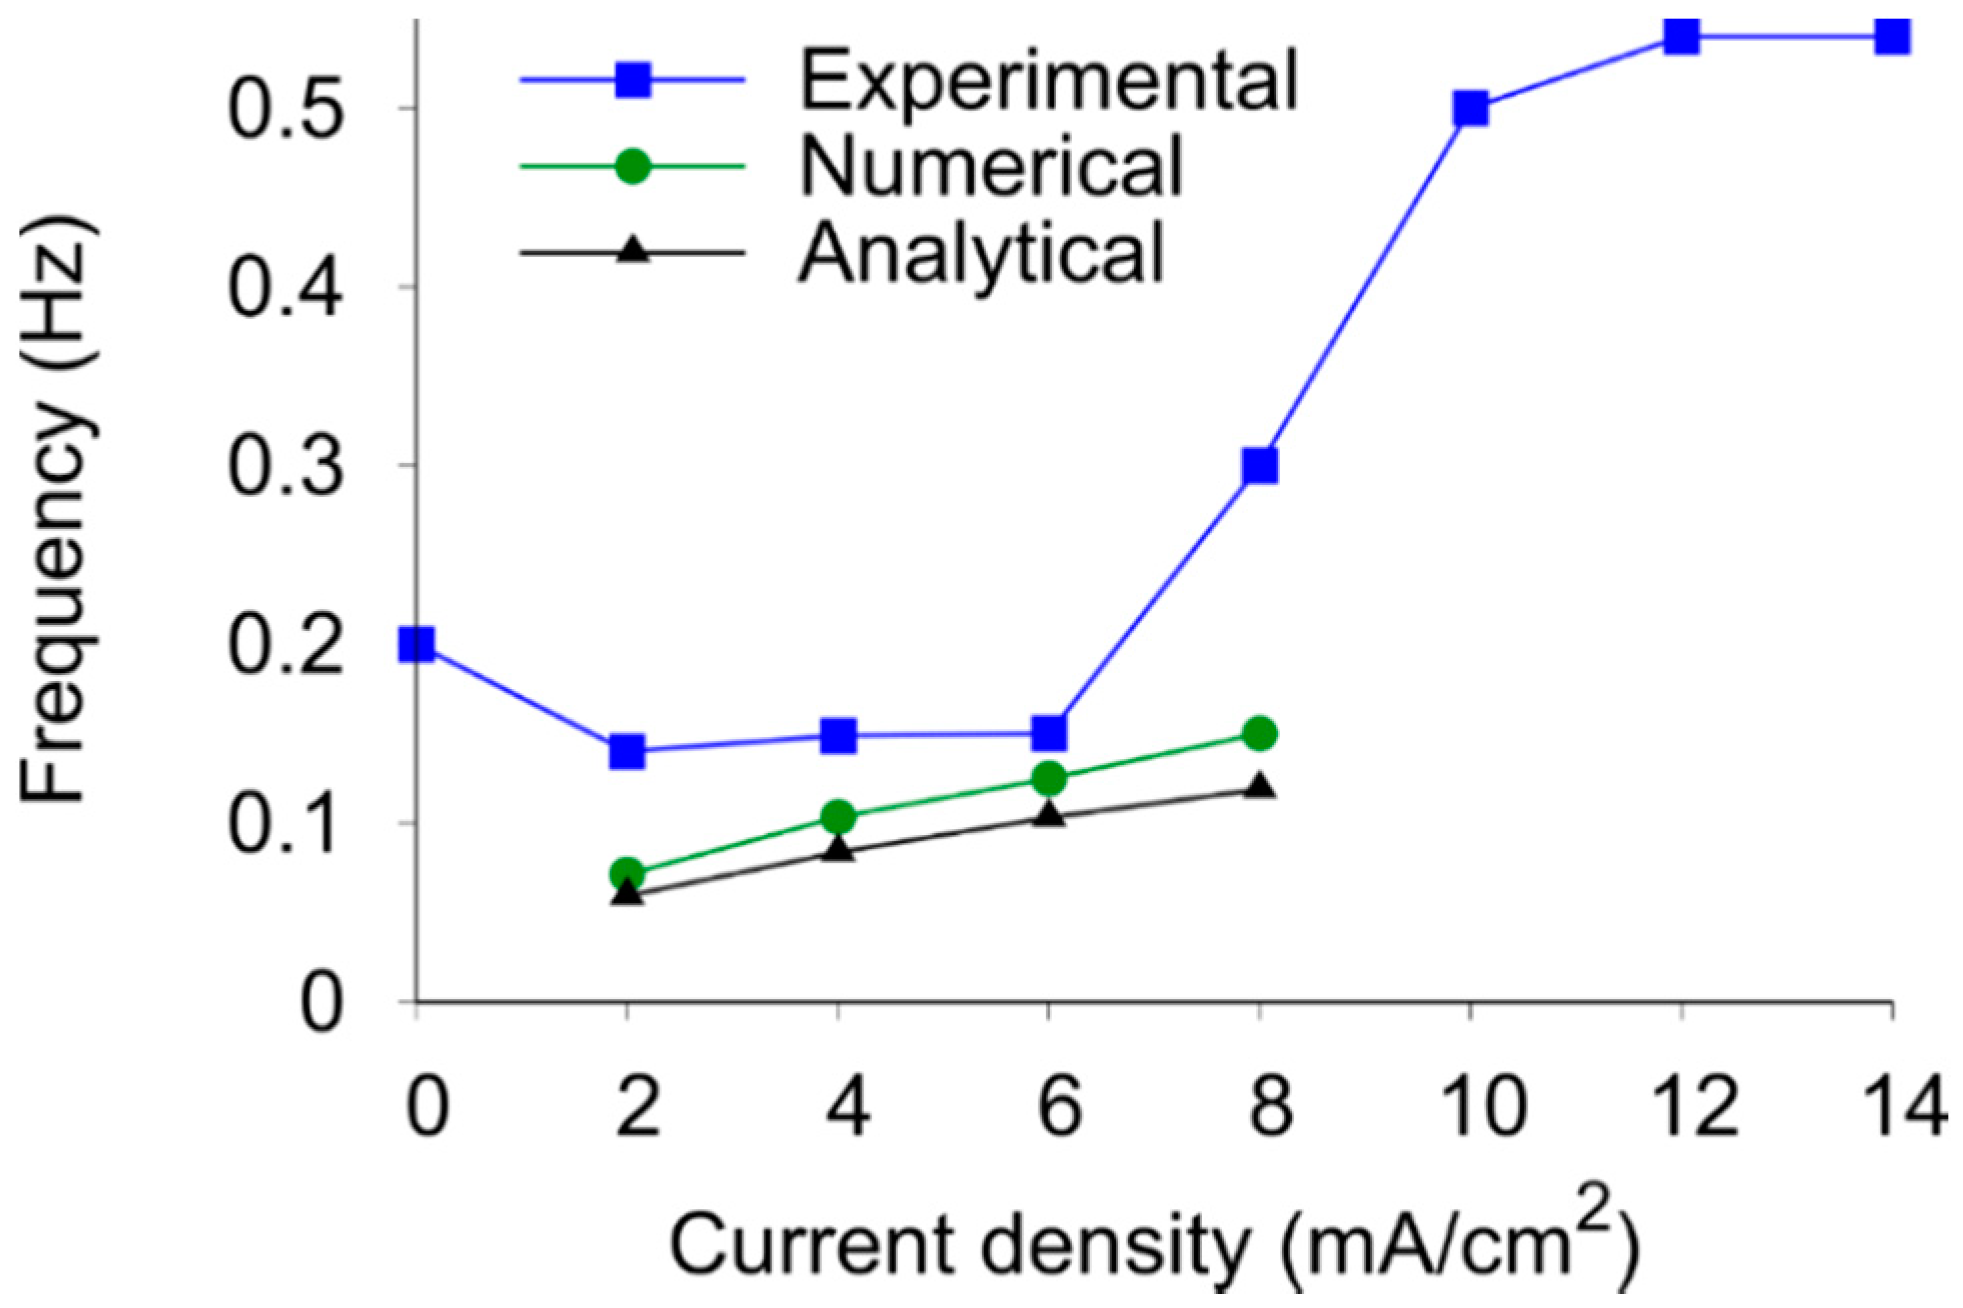
A comparison of the oscillation frequencies obtained experimentally, numerically, and analytically is shown in Figure 14. The experimental results range from the electroless case to large current densities up to 14 mA/cm2 of the galvanostatic deposition, whereas the numerical and analytical results are limited to the intermediate range 2 < j < 8 mA / c m 2 . In general, there is good agreement between all three approaches, and the frequency is found to increase slightly with the current density. The frequency of the analytical solution is slightly lower than the numerical solution, which may be due to simplifications in the analytical model. As the inclined wall can be regarded as halfway between the vertical and horizontal wall regimes, there is always an upward buoyancy flow along the surface, including in the phase where the boundary layer breaks up. This may accelerate the rise of the buoyancy plumes and increase the frequency, which has been neglected in the theoretical calculation and may be responsible for the lower frequencies calculated.
The frequencies found in the numerical simulations are also slightly lower than the ones observed in the experiments. The reason may be the unavoidable electroless deposition before the electric current is applied in the experiments. This may result in an initially non-uniform concentration distribution and thus larger buoyancy and magnetic gradient forces compared with the simulation results. The largest difference is found at 8 mA/cm2, when the frequency obtained from experiments jumps to a value much higher than the numerical and analytical results. This may be attributed to the additional instabilities caused by the onset of the hydrogen evolution observed in the experiments, which is not considered in the numerical and analytical models. Finally, the larger than expected oscillation frequency of 0.2 Hz found in the electroless mode might be caused by the partial oxide blockage of the conical cathode.
Finally, we analyze the ratio between the magnetic gradient force and the Lorentz force, in order to understand the impact of both forces. We estimate the force ratio defined in Mutschke et al. [29]:
f B f L =   χ C u 2 + mol B μ 0 z F D C u 2 + δ c L B .
Here, B is the characteristic magnetic field caused by the magnetisation of the iron cone, δ c is the characteristic thickness of the concentration boundary layer, and L B is the characteristic length scale of the magnetic gradient. As shown in Figure 1, we take B to be 1 T, and assume that L B is at the same scale as the cone ( ~ 1 mm). δ c is evaluated to be 0.2 mm, as shown in Figure 9 and Figure 10. This results in a force ratio of about 20, showing that the magnetic gradient force is much stronger than the Lorentz force. On the other hand, the magnetic gradient force mainly acts near the cone surface, where there are high gradients of the concentration and the magnetic field, which enables the separation of the boundary layer on the cone surface and thus the oscillations. By contrast, the Lorentz force tends to act at a greater distance from the surface [42], and its main influence is to hinder the buoyancy plume from penetrating the bulk electrolyte. Therefore, the oscillations observed in the experiments should mainly be attributed to the buoyancy and the magnetic gradient force counteracting one another.
This conclusion is also supported by the oscillatory behavior during the electroless deposition, where the Lorentz force is negligibly small. In this case, as the gold layer on the iron cone may not be dense enough to provide sufficient protection for the iron cone, a concentration boundary layer starts to build up after the cone is exposed to the copper sulphate solution. As the concentration of Cu2+ ions is high at the beginning of the electroless deposition, the reaction rate might be high even without a current. The resultant concentration gradients and the magnetic gradients near the iron cone surface enable the magnetic gradient force and the buoyancy force to drive oscillatory electrolyte flow. The main reason for the high electroless frequency could be related to the surface blockage found in Figure 5 about halfway up the cone, probably caused by local oxides covering the surface. This may support the separation of the boundary layer and therefore accelerate the formation of oscillatory buoyancy plumes.

5. Conclusions

In this work, electroless and galvanostatic deposition at an iron cathode of a conical shape is studied in an external magnetic field. The electroless deposition is driven by a mismatch between the lattice constants of the gold coating and the iron underneath which allows iron atoms to come into contact with Cu 2 + ions. The value of the standard electrode potential of Fe2+ (E° = −0.45 V) is negative, contrary to the positive one of copper (and also of gold). As a result, electroless oxidation of iron combined with the reduction of copper ions takes place all over the cone surface, leading to the Cu 2 + concentration boundary layer that is measured. If the protective gold coating has any small scratches or thickness variations, this leads to locally slightly inhomogeneous mass transfer. In addition, iron oxide may precipitate at the cone surface, as observed above, and locally block the further mass transfer.
For both electroless and galvanostatic mode, we measured the Cu 2 + concentration variations near the cone with a Mach–Zehnder interferometer. We found that at heights between 0.5 and 1 mm with respect to the base of the cone, the flow is clearly affected by the magnetic forces. As already shown in a previous work at a copper cone [27], an upward buoyant flow of the concentration boundary layer appears. However, in the present study, a superimposed oscillatory behavior develops. We were the first to systematically investigate this oscillatory behavior during electrodeposition in a magnetic field. We analyzed the oscillation frequencies of the concentration near the iron cone using experimental, numerical, and theoretical methods. We found that the oscillation is mainly caused by the magnetic gradient force and the buoyancy force counteracting one another. In detail, the temporal oscillation in the concentration that is observed is caused by the periodic rise of low-concentration plumes originating at the foot of the cone. This behavior further affects the thickness of the boundary layer at the cone locally and over time.
One point worth mentioning is that in general the oscillation frequency shows an increasing trend when the current density is enhanced, which is caused by a faster decrease in the concentration on the cathode, as confirmed by both numerical and theoretical analysis. At higher current densities ( 8 mA/cm2), the oscillation frequency rapidly increases to values much larger than in the numerical and theoretical results. This is related to hydrogen evolution, which was only observed in the experiments at such high current densities and was not accounted for in the numerical and theoretical studies.
The magnetic forces’ ability to modify the concentration near the conical cathode suggests that the mass transport of metal ions towards the cathode and, consequently, the deposition rate along the cathode can be controlled by the magnetic field. This can be applied to create deposits of metal with a non-uniformly distributed thickness. Thus, the application of the magnetic field could also open up new routes for the realization of nanostructured surfaces. Indeed, the direction to follow for controlling the electrodeposition processes is to adjust the competing forces involved to achieve the desired mass transport. Another future step in experiments is to quantify the flow velocity around the cone and to correlate the variation in the concentration and flow velocity with the topography of the metal deposit.
Supplementary Materials

The following are available online at https://www.mdpi.com/article/10.3390/magnetochemistry7040046/s1, Figure S1: Copper deposition on Fe cone: interferogram and variation of concentration. Initial CuSO4 concentration = 300 mM; J = 0 mA/cm2, S2: Copper electrodeposition on Fe cone: interferogram and variation of concentration. Initial CuSO4 concentration = 300 mM; J = 4 mA/cm2. Video S1: Electroless oscillations in a magnetic field.

Author Contributions

G.M. (Giovanni Marinaro) investigated the phenomenon, performed the measurements with Mach-Zehnder Interferometer (MZI), Differential Interferometer and Electrochemical Workstation, analyzed the experimental data and wrote the manuscript, M.H. performed the simulations, the theoretical frequency and force analysis and contributed to write the paper, G.M. (Gerd Mutschke) supervised the numerical part and contributed to write the paper, X.Y. supported the experimental setup and the interpretation of the results, K.E. conceived the idea, coordinated and supervised the entire work. All authors have read and agreed to the published version of the manuscript.

Funding

This research was funded by Deutsche Forschungsgemeinschaft, grant no. 381712986 (MU 4209/1-1, EC 201/8-1).

Institutional Review Board Statement

Not applicable.

Informed Consent Statement

Not applicable.

Data Availability Statement

The data that support the findings of this study are available from the corresponding author upon a reasonable request.

Acknowledgments

We would like to thank Margitta Uhlemann for her support with the probe microfabrication and Piotr Zabinski and Katarzyna Skibinska for fruitful discussions.

Conflicts of Interest

The authors declare no Conflict of Interest.

References

  1. Mitić, V.V.; Kocić, L.M.; Tidrow, S.; Fecht, H.-J. Nanotechnology, energy, and fractals nature. In Nanotechnology for Energy Sustainability; John Wiley & Sons, Ltd.: Hoboken, NJ, USA, 2017; pp. 781–808. ISBN 978-3-527-69610-9. [Google Scholar] [CrossRef]
  2. Martin-Martinez, F.J.; Jin, K.; López Barreiro, D.; Buehler, M.J. The rise of hierarchical nanostructured materials from renewable sources: Learning from nature. ACS Nano 2018, 12, 7425–7433. [Google Scholar] [CrossRef]
  3. Marinaro, G.; Burghammer, M.; Costa, L.; Dane, T.; De Angelis, F.; Di Fabrizio, E.; Riekel, C. Directed growth of virus nanofilaments on a superhydrophobic surface. ACS Appl. Mater. Interfaces 2015, 7, 12373–12379. [Google Scholar] [CrossRef] [PubMed]
  4. Marinaro, G.; Accardo, A.; De Angelis, F.; Dane, T.; Weinhausen, B.; Burghammer, M.; Riekel, C. A superhydrophobic chip based on SU-8 photoresist pillars suspended on a silicon nitride membrane. Lab. A Chip. 2014, 14, 3705–3709. [Google Scholar] [CrossRef] [Green Version]
  5. Zhang, J.; Liu, X.; Neri, G.; Pinna, N. Nanostructured materials for room-temperature gas sensors. Adv. Mater. 2016, 28, 795–831. [Google Scholar] [CrossRef] [PubMed]
  6. Moreno, J.A.; Khan, M.A.; Ivanov, Y.P.; Lopatin, S.; Holguín-Lerma, J.A.; Marinaro, G.; Ooi, B.S.; Idriss, H.; Kosel, J. Growth of Ordered Iron Oxide Nanowires for Photo-electrochemical Water Oxidation. ACS Appl. Energy Mater. 2019, 2, 8473–8480. [Google Scholar] [CrossRef]
  7. Masud, J.; Swesi, A.T.; Liyanage, W.P.R.; Nath, M. Cobalt selenide nanostructures: An efficient bifunctional catalyst with high current density at low coverage. ACS Appl. Mater. Interfaces 2016, 8, 17292–17302. [Google Scholar] [CrossRef] [PubMed]
  8. Zhuge, F.; Zheng, Z.; Luo, P.; Lv, L.; Huang, Y.; Li, H.; Zhai, T. Nanostructured Materials and Architectures for Advanced Infrared Photodetection. Adv. Mater. Technol. 2017, 2, 1700005. [Google Scholar] [CrossRef]
  9. Baraban, L.; Ibarlucea, B.; Baek, E.; Cuniberti, G. Hybrid silicon nanowire devices and their functional diversity. Adv. Sci. 2019, 6, 1900522. [Google Scholar] [CrossRef] [PubMed]
  10. Marinaro, G. Networks of neuroblastoma cells on porous silicon substrates reveal a small world topology. Integr. Biol. 2015, 7, 184–197. [Google Scholar] [CrossRef] [PubMed]
  11. Coluccio, M.L.; Onesto, V.; Marinaro, G.; Dell’Apa, M.; De Vitis, S.; Imbrogno, A.; Tirinato, L.; Di Fabrizio, G.P.E.; Candeloro, P.; Malara, N.; et al. Cell theranostics on mesoporous silicon substrates. Pharmaceutics 2020, 12, 481. [Google Scholar] [CrossRef]
  12. Marinaro, G.; Riekel, C.; Gentile, F. Size-exclusion particle separation driven by micro-flows in a quasi-spherical droplet: Modelling and experimental results. Micromachines 2021, 12, 185. [Google Scholar] [CrossRef] [PubMed]
  13. Smith, R.L.; Collins, S.D. Porous silicon formation mechanisms. J. Appl. Phys. 1992, 71, R1–R22. [Google Scholar] [CrossRef]
  14. Masuda, H.; Satoh, M. Fabrication of gold nanodot array using anodic porous alumina as an evaporation mask. Jpn. J. Appl. Phys. 1996, 35, L126–L129. [Google Scholar] [CrossRef]
  15. Marinaro, G.; Das, G.; Giugni, A.; Allione, M.; Torre, B.; Candeloro, P.; Kosel, J.; Di Fabrizio, E. Plasmonic nanowires for wide wavelength range molecular sensing. Materials 2018, 11, 827. [Google Scholar] [CrossRef] [Green Version]
  16. Dunne, P.; Mazza, L.; Coey, J. Magnetic structuring of electrodeposits. Phys. Rev. Lett. 2011, 107, 024501. [Google Scholar] [CrossRef]
  17. Uhlemann, M.; Tschulik, K.; Gebert, A.; Mutschke, G.; Fröhlich, J.; Bund, A.; Yang, X.; Eckert, K. Structured electrodeposition in magnetic gradient fields. Eur. Phys. J. Spec. Top. 2013, 220, 287–302. [Google Scholar] [CrossRef]
  18. Monzon, L.M.; Coey, J. Magnetic fields in electrochemistry: The Kelvin force. A mini-review. Electrochem. Commun. 2014, 42, 42–45. [Google Scholar] [CrossRef]
  19. Zhang, Y.; Yuan, B.; Li, L.; Wang, C. Edge electrodeposition effect of cobalt under an external magnetic field. J. Electroanal. Chem. 2020, 865, 114143. [Google Scholar] [CrossRef]
  20. Khan, M.A.; Hristovski, I.R.; Marinaro, G.; Mohammed, H.; Kosel, J. Laser printed graphene on polyimide electrodes for magnetohydrodynamic pumping of saline fluids. In Proceedings of the 2017 19th International Conference on Solid-State Sensors, Actuators and Microsystems (TRANSDUCERS), Kaohsiung, Taiwan, 18–22 June 2017; pp. 1387–1390. [Google Scholar] [CrossRef]
  21. Khan, M.; Hristovski, I.R.; Marinaro, G.; Kosel, J. Magnetic composite based magneto hydrodynamic pump. In Proceedings of the 2017 IEEE International Magnetics Conference (INTERMAG), Dublin, Ireland, 24–28 April 2017; pp. 1–2. [Google Scholar] [CrossRef]
  22. Marengo, M.; Marinaro, G.; Kosel, J. Flexible temperature and flow sensor from laser-induced graphene. In Proceedings of the 2017 IEEE SENSORS, Glasgow, UK, 29 October–1 November 2017; pp. 1–3. [Google Scholar] [CrossRef]
  23. Yang, X.; Eckert, K.; Odenbach, S. Oscillatory Lorentz-force-driven flows during potentiostatic current oscillations in magnetic fields. Electrochem. Commun. 2010, 12, 1576–1580. [Google Scholar] [CrossRef]
  24. Nagai, T.; Nakanishi, S.; Mukouyama, Y.; Ogata, Y.H.; Nakato, Y. Periodic and Chaotic Oscillations of the Electrochemical Potential of P-Si in Contact with an Aqueous (CuSO4+HF) Solution, Caused by Electroless Cu Deposition. Chaos Interdiscip. J. Nonlinear Sci. 2006, 16, 037106. [Google Scholar] [CrossRef]
  25. Fernández, D.; Diao, Z.; Dunne, P.; Coey, J.M.D. Influence of magnetic field on hydrogen reduction and co-reduction in the Cu/CuSO4 system. Electrochim. Acta 2010, 55, 8664–8672. [Google Scholar] [CrossRef]
  26. Yang, X.; Mühlenhoff, S.; Nikrityuk, P.A.; Eckert, K. The initial transient of natural convection during copper electrolysis in the presence of an opposing Lorentz force: Current dependence. Eur. Phys. J. Spec. Top. 2013, 220, 303–312. [Google Scholar] [CrossRef]
  27. Huang, M.; Marinaro, G.; Yang, X.; Fritzsche, B.; Lei, Z.; Uhlemann, M.; Eckert, K.; Mutschke, G. Mass transfer and electrolyte flow during electrodeposition on a conically shaped electrode under the influence of a magnetic field. J. Electroanal. Chem. 2019, 842, 203–213. [Google Scholar] [CrossRef]
  28. Tschulik, K.; Koza, J.A.; Uhlemann, M.; Gebert, A.; Schultz, L. Effects of well-defined magnetic field gradients on the electrodeposition of copper and bismuth. Electrochem. Commun. 2009, 11, 2241–2244. [Google Scholar] [CrossRef]
  29. Mutschke, G.; Tschulik, K.; Weier, T.; Uhlemann, M.; Bund, A.; Fröhlich, J. On the action of magnetic gradient forces in micro-structured copper deposition. Electrochim. Acta 2010, 55, 9060–9066. [Google Scholar] [CrossRef]
  30. Nishikawa, K.; Chassaing, E.; Rosso, M. In situ concentration measurements around the transition between two dendritic growth regimes. Electrochim. Acta 2011, 56, 5464–5471. [Google Scholar] [CrossRef]
  31. Li, L.; Wang, W.; Wang, C.; Chen, S. Effects of an applied magnetic field on the anodic dissolution of nickel in HNO3 + Cl solution. Electrochem. Commun. Electrochem. Commun. 2009, 11, 2109–2112. [Google Scholar] [CrossRef]
  32. Ghighia, D.C.; Pritt, M. Software Accompanying. “Two-Dimenstional Phase Umwrapping: Therory, Algorithm, and Software”; Wiley: New York, NY, USA, 1998. [Google Scholar]
  33. Lei, Z.; Yang, X.; Haberstroh, C.; Pulko, B.; Odenbach, S.; Eckert, K. Space- and time-resolved interferometric measurements of the thermal boundary layer at a periodically magnetized gadolinium plate. Int. J. Refrig. 2015, 56, 246–255. [Google Scholar] [CrossRef]
  34. Heinze, A.; Eckert, K.; Hauser, M.J.B.; Odenbach, S. A wavelet and Zernike-polynomial-based shearing interferometry approach to analyse hydrodynamic instabilities at interfaces. Acta Astronaut. 2011, 68, 707–716. [Google Scholar] [CrossRef]
  35. Yang, X.; Eckert, K.; Heinze, A.; Uhlemann, M. The concentration field during transient natural convection between vertical electrodes in a small-aspect-ratio cell. J. Electroanal. Chem. 2008, 613, 97–107. [Google Scholar] [CrossRef]
  36. Mallory, G.O.; Hajdu, J.B. Electroless Plating: Fundamentals and Applications; American Electroplaters and Surface Finishers Society: Orlando, FL, USA, 1990. [Google Scholar]
  37. Schlesinger, M.; Paunovic, M. Modern Electroplating, 4th ed.; Wiley: New York, NY, USA, 2000. [Google Scholar]
  38. Lide, D.R. CRC Handbook of Chemistry and Physics; CRC Press: Boca Raton, FL, USA, 2006; Volume 87. [Google Scholar]
  39. O’Brien, R.N. Electrolyte solution refractive indices at 5893 and 6328 A. J. Chem. Eng. Data 1968, 13, 2–5. [Google Scholar] [CrossRef]
  40. Mühlenhoff, S.; Mutschke, G.; Koschichow, D.; Yang, X.; Bund, A.; Fröhlich, J.; Odenbach, S.; Eckert, K. Lorentz-force-driven convection during copper magnetoelectrolysis in the presence of a supporting buoyancy force. Electrochim. Acta 2012, 69, 209–219. [Google Scholar] [CrossRef]
  41. Mühlenhoff, S.; Mutschke, G.; Uhlemann, M.; Yang, X.; Odenbach, S.; Fröhlich, J.; Eckert, K. On the homogenization of the thickness of Cu deposits by means of MHD convection within small dimension cells. Electrochem. Commun. 2013, 36, 80–83. [Google Scholar] [CrossRef]
  42. Huang, M.; Eckert, K.; Mutschke, G. Magnetic-field-assisted electrodeposition of metal to obtain conically structured ferromagnetic layers. Electrochim. Acta 2021, 365, 137374. [Google Scholar] [CrossRef]
  43. Newman, J.; Thomas-Alyea, K.E. Electrochemical Systems; John Wiley & Sons: Hoboken, NJ, USA, 2012. [Google Scholar]
  44. Koschichow, D.; Mutschke, G.; Yang, X.; Bund, A.; Fröhlich, J. Numerical simulation of the onset of mass transfer and convection in copper electrolysis subjected to a magnetic field. Russ. J. Electrochem. 2012, 48, 682–691. [Google Scholar] [CrossRef]
  45. Comsol, C. COMSOL Multiphysics Documentation Suite V 5.5; COMSOL Multiphysics Inc.: Burlington, MA, USA, 2019; p. 01803. [Google Scholar]
  46. Milazzo, G.; Caroli, S.; Braun, R.D. Tables of standard electrode potentials. J. Electrochem. Soc. 1978, 125, 261C. [Google Scholar] [CrossRef]
  47. Mutschke, G.; Tschulik, K.; Uhlemann, M.; Bund, A.; Fröhlich, J. Comment on magnetic structuring of electrodeposits. Phys. Rev. Lett. 2012, 109, 229401. [Google Scholar] [CrossRef]
  48. Sparrow, E.; Husar, R.; Goldstein, R. Observations and other characteristics of thermals. J. Fluid Mech. 1970, 41, 793–800. [Google Scholar] [CrossRef]
  49. Bejan, A. Convection Heat Transfer; John Wiley & Sons: Hoboken, NJ, USA, 2013. [Google Scholar]
  50. Lin, H.-T.; Chen, J.-J.; Kung, L.-W.; Yu, W.-S.; Chen, Y.-M. Inclined and horizontal wall plumes. Int. J. Heat Mass Transf. 1996, 39, 2243–2252. [Google Scholar] [CrossRef]
  51. Howard, L. Proceeding of the Eleventh International Congress of Applied Mechanics Munich (Germany). 1966. Available online: https://www.springer.com/jp/book/9783662278635 (accessed on 23 March 2021).
Figure 1. Photograph of the conically shaped iron cathode and the resulting fluid flows driven by the three forces in the system: (a) Lorentz force (primary and secondary flow indicated by dashed and solid lines, respectively), (b) buoyancy force, and (c) magnetic gradient force.
Magnetochemistry 07 00046 g001
Figure 2. (a) Schematic view of the experimental setup, in which the cone is embedded in a quartz cuvette which is filled with copper (II) sulfate placed on a cylindrical NdFeB magnet (diameter = 20 mm, height = 20 mm, magnetization direction antiparallel to gravity). (b) Numerical results of magnitude and vector of the magnetic flux density generated by magnetizing the iron cone, which creates strong magnetic gradients near the cone tip.
Magnetochemistry 07 00046 g002
Figure 3. Schema of the Mach–Zehnder interferometer used in the experiment. The position of the electrochemical cell is shown.
Magnetochemistry 07 00046 g003
Figure 4. (a) Oscillations of the concentration in electroless deposition (J = 0 mA/cm2) averaged in the region of interest (ROI) marked in Figure 5 (rectangle). The inset shows an expanded view of the oscillations. (b). Concentration variation profile along the black line marked in Figure 5.
Magnetochemistry 07 00046 g004
Figure 5. Electroless copper deposition on the Fe cone: variation of the bulk concentration, Δ c = c c bulk , at different stages of the oscillation period (see circles in the inset of Figure 4) at the ROI (marked here as a black rectangle). The bulk concentration of CuSO4 is 300 mM, J = 0 mA/cm2.
Magnetochemistry 07 00046 g005
Figure 6. (a) Oscillations in the concentration variation for J = 8 mA/cm2, averaged in the two ROIs marked as black rectangles in Figure 7. (b) Concentration variation profile along the black line marked in Figure 7.
Magnetochemistry 07 00046 g006
Figure 7. Copper electrodeposition on Fe cone (45°): interferogram and variation in the concentration of CuSO4 for the instants corresponding to t = 37.2, 37.6, 38.2, 39.2, 39.6, 40.2 s. The bulk concentration of CuSO4 is 300 mM, J = 8 mA/cm2.
Magnetochemistry 07 00046 g007
Figure 8. Numerical result of the concentration variation with respect to the bulk concentration for j cathode = 8 mA / cm 2 at the two monitoring points used in the experiments (Upper: (0.57, 1.93) mm; Side: (0.77, 1.02) mm, marked as white circles in Figure 9). The black circles indicate the points in time during the oscillation period discussed in Figure 9. ( 0 ,   0.1   T period ,   0.25   T period ,   0.5   T period ,   0.85   T period ,   1   T period ). The time interval shown starts at 23 s, after which a stable oscillation regime is observed.
Magnetochemistry 07 00046 g008
Figure 9. Numerical results of variation in concentration with respect to the bulk concentration on the vertical plane across the center of the cone for the instants marked with black circles in Figure 8, corresponding to 0 ,   0.1   T period ,   0.25   T period ,   0.5   T period ,   0.85   T period ,   1   T period during one oscillation period. The bulk concentration of CuSO4 is 300 mM, J = 8 mA/cm2. The black arrows represent vectors of the meridional velocity of the electrolyte (logarithmic scale for better visibility). The white circles represent the monitoring points in Figure 8.
Magnetochemistry 07 00046 g009
Figure 10. Concentration variation at the electrode-normal monitoring line passing the lower monitoring point (0.77, 1.02) mm for selected points in time within one oscillation period. The bulk concentration of CuSO4 is 300 mM, J = 8 mA/cm2. The horizontal axis r represents the radial coordinate of the cylindrical coordinate system which originates at the bottom center of the cone. The black arrow shows the position of the monitoring line and the orange arrow shows the radial position of the monitoring point.
Magnetochemistry 07 00046 g010
Figure 11. Concentration at point (0.77, 1.02) mm for the 8 mA / cm 2 case obtained from simulations where only selected volume forces are active. f g : Only the buoyancy force. f g + f L : Buoyancy and Lorentz force. f g + f B : Buoyancy and magnetic gradient force. f g + f L + f B : All three forces. Note that the concentration values are not averaged in the laser direction.
Magnetochemistry 07 00046 g011
Figure 12. Numerical results on the variation in the bulk concentration for j cathode = 2 ,   4 ,   6 ,   8 mA / cm 2 at the monitoring point (0.77, 1.02) mm. The left side of the time axis is set at 23 s, after which steady-state oscillations have developed.
Magnetochemistry 07 00046 g012
Figure 13. Comparison between experimental and numerical results for variation in the concentration at 41 s for experiments and 48.5 s for simulations for the case 4 mA/cm2, when the concentration at the lower monitoring point reaches a maximum. Both results are averaged in the laser direction.
Magnetochemistry 07 00046 g013
Figure 14. Experimental, numerical, and analytical results of the oscillation frequency as a function of the current density.
Magnetochemistry 07 00046 g014
Publisher’s Note: MDPI stays neutral with regard to jurisdictional claims in published maps and institutional affiliations.