2. Mn Complexes
The compounds we chose to study first were those containing Mn
III. This was for a number of reasons. At the beginning of our combined research efforts in 2006, we were making Mn
III-based Single-Molecule Magnets (SMMs) and had a large library of complexes from which to choose, many of which had very interesting structural/magnetic features [
32,
33]. Aligned to this was the presence of the Jahn–Teller (JT) axis of the octahedral Mn
III ion. Given the well-known dynamic JT effect observed in numerous coordination compounds [
34], we speculated that hydrostatic pressure would be capable of changing JT bond lengths/orientations, and that that would have a pronounced effect on both magnetic exchange interactions and magnetic anisotropy.
The compounds [Mn
6O
2(Et-sao)
6(O
2CPh(Me)
2)
2(EtOH)
6] (
1) and [Mn
6O
2(Et-sao)
6(O
2C-naphth)
2(EtOH)
4(H
2O)
2] (
2; sao
2− is the dianion of salicylaldoxime) are part of a well-studied family of SMMs for which detailed magneto-structural correlations under ambient conditions have been developed [
35,
36,
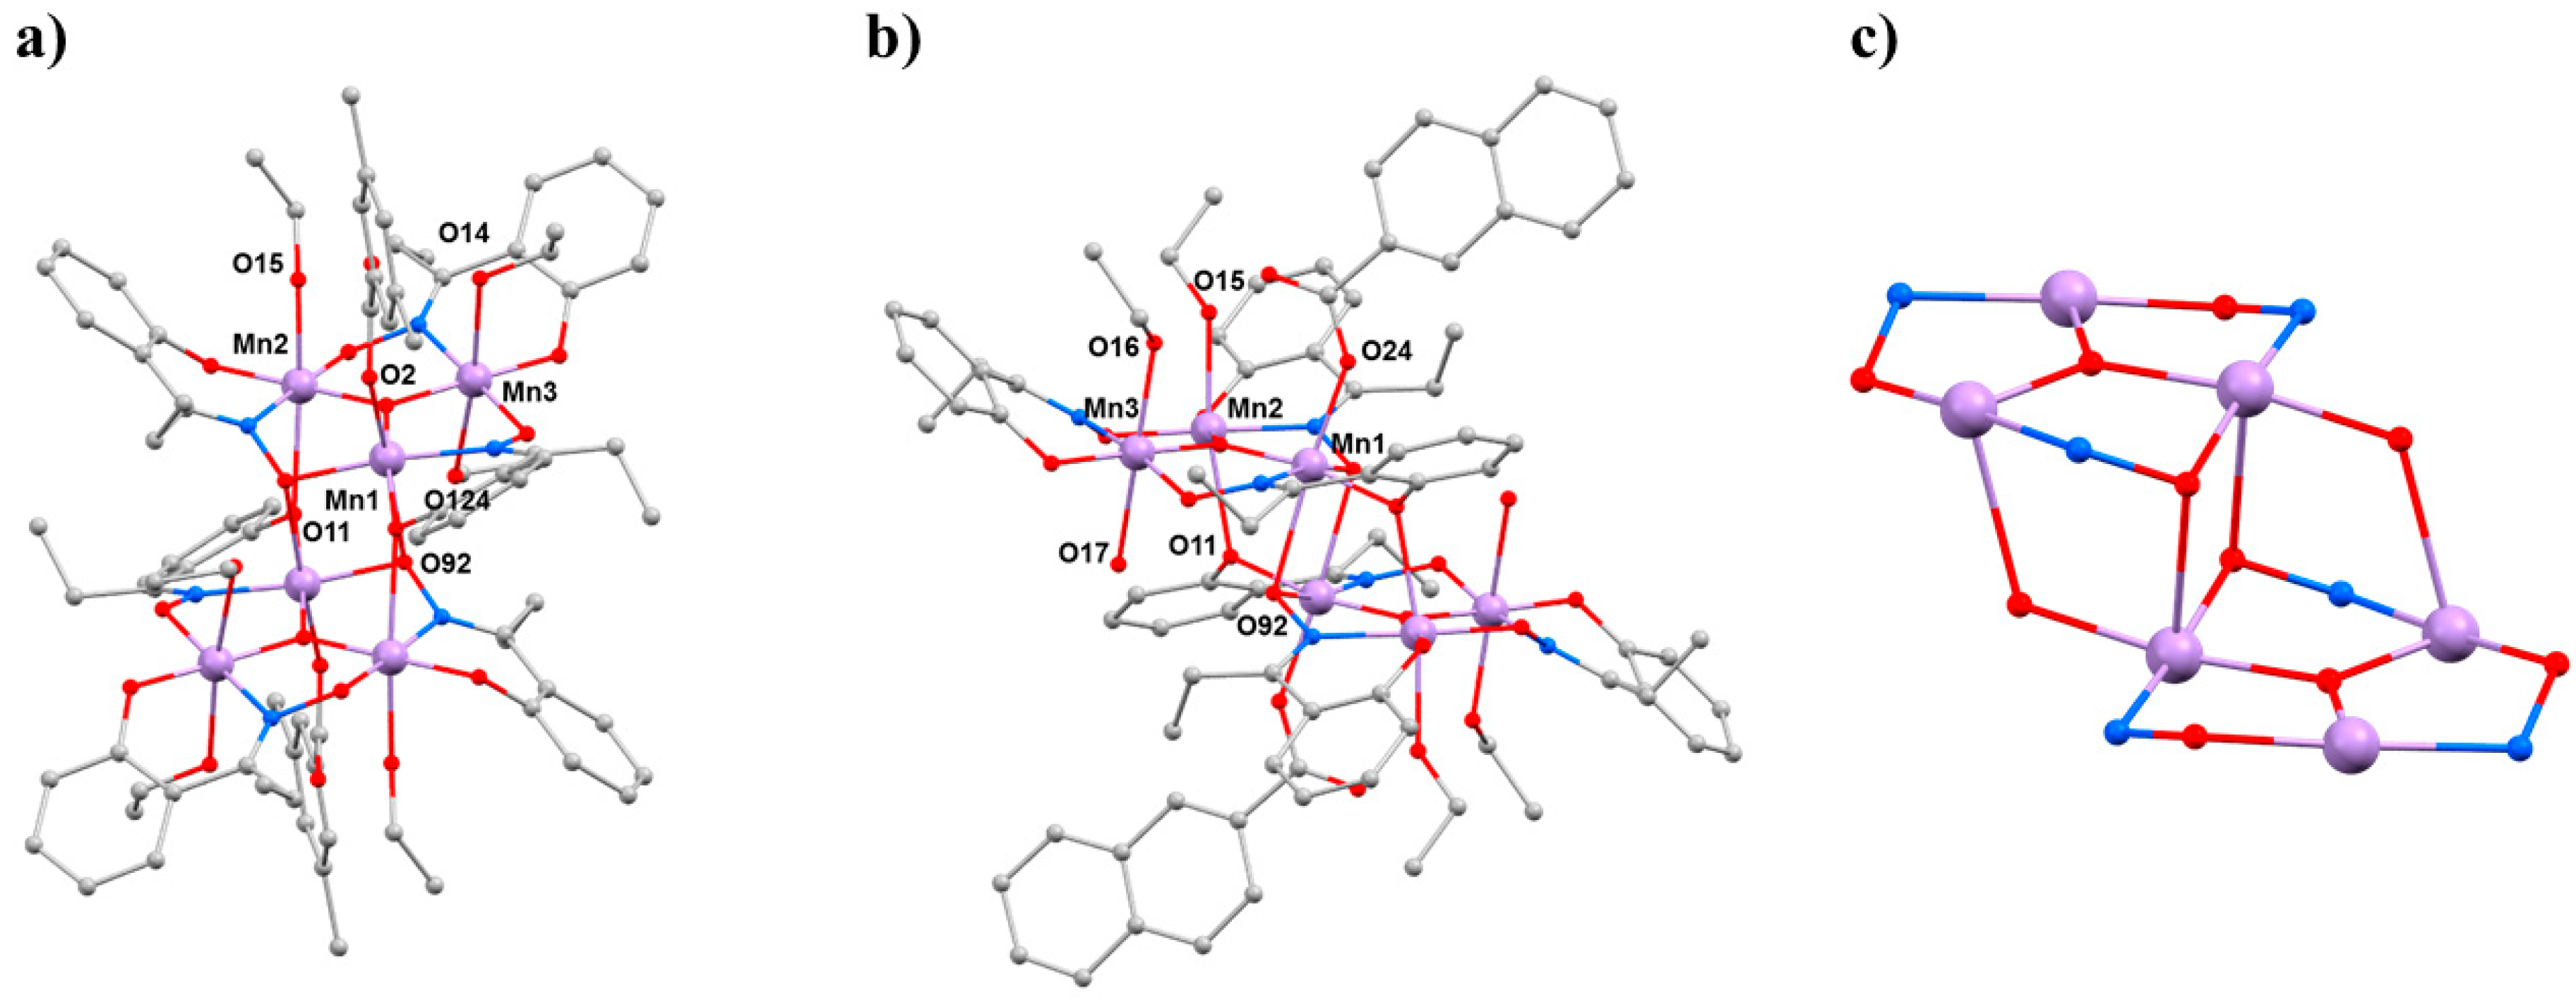
37]. The general structure of these complexes (
Figure 2) describes two parallel, off-set [Mn
III3(μ
3-O)]
7+ triangular subunits linked via two central oximate O-atoms and two peripheral phenoxide O-atoms, leading to a [Mn
III6(μ
3-O)
2(μ
3-ONR)
2(μ-ONR)
4]
8+ core. The bridging between neighbouring Mn ions within each triangle occurs through an NO oximate group, such that each Mn
2 pair forms a −Mn−N−O−Mn− moiety, and thus the Mn
3 triangle, a (−Mn−O−N−)
3 ring. The coordination spheres of the Mn ions are completed by two terminal carboxylates (one on each triangle) and by terminal solvent molecules. All Mn ions are in the 3+ oxidation state and are six-coordinate adopting distorted (pseudo) octahedral geometry, with their axially elongated JT axes approximately perpendicular to the [Mn
3O]
7+ planes [
38]. All family members can be categorised into two subsections according to their magnetic behaviour: those possessing intra-triangle antiferromagnetic exchange interactions, and those possessing intra-triangle ferromagnetic exchange interactions. All family members display inter-triangle ferromagnetic exchange. This results in compounds with
S = 12 ground states in the latter and 4 ≤
S < 12 ground states in the former. Interestingly, the sign and magnitude of the magnetic exchange is controlled through R-saoH
2 ligand design, with larger, non-rigid R (in the main, e.g., R = Me, Et) causing puckering of the −Mn−N−O−Mn− moiety. The change in torsion angle from near planar (when R = H for example) to non-planar decreases the antiferromagnetic contribution to the nearest-neighbour exchange, and at approximately 31°, the pairwise interaction switches to being ferromagnetic [
39]. Given that such enormous changes in magnetic behaviour are observed through very small changes in structure, aligned to the fact that the magnitude of the exchange (
J) is very small (and thus the absolute difference in
J is small) made compounds
1 and
2 ideal candidates for the first ever combined HP single crystal X-ray diffraction/HP magnetic study of a SMM.
Hydrostatic high-pressure (HP) single-crystal X-ray diffraction (XRD) measurements were performed on
1 and
2 in petroleum ether at
T = 300 K to a maximum pressure of 1.5 GPa [
40].
1 and
2 crystallise in the monoclinic space groups
P2
1/
n and
P2
1/
c, respectively, and remain so in the full pressure range. The most obvious initial effect for both is a compression of the unit cell, by approximately 6.5% (
1) and 10% (
2), which is assigned to a reduction of void space given the lack of significant intermolecular interactions (H-bonds or π–π stacking). The closest intermolecular interactions (H···H) reduce by a maximum of approximately 0.9 Å in
1 and just 0.07 Å in
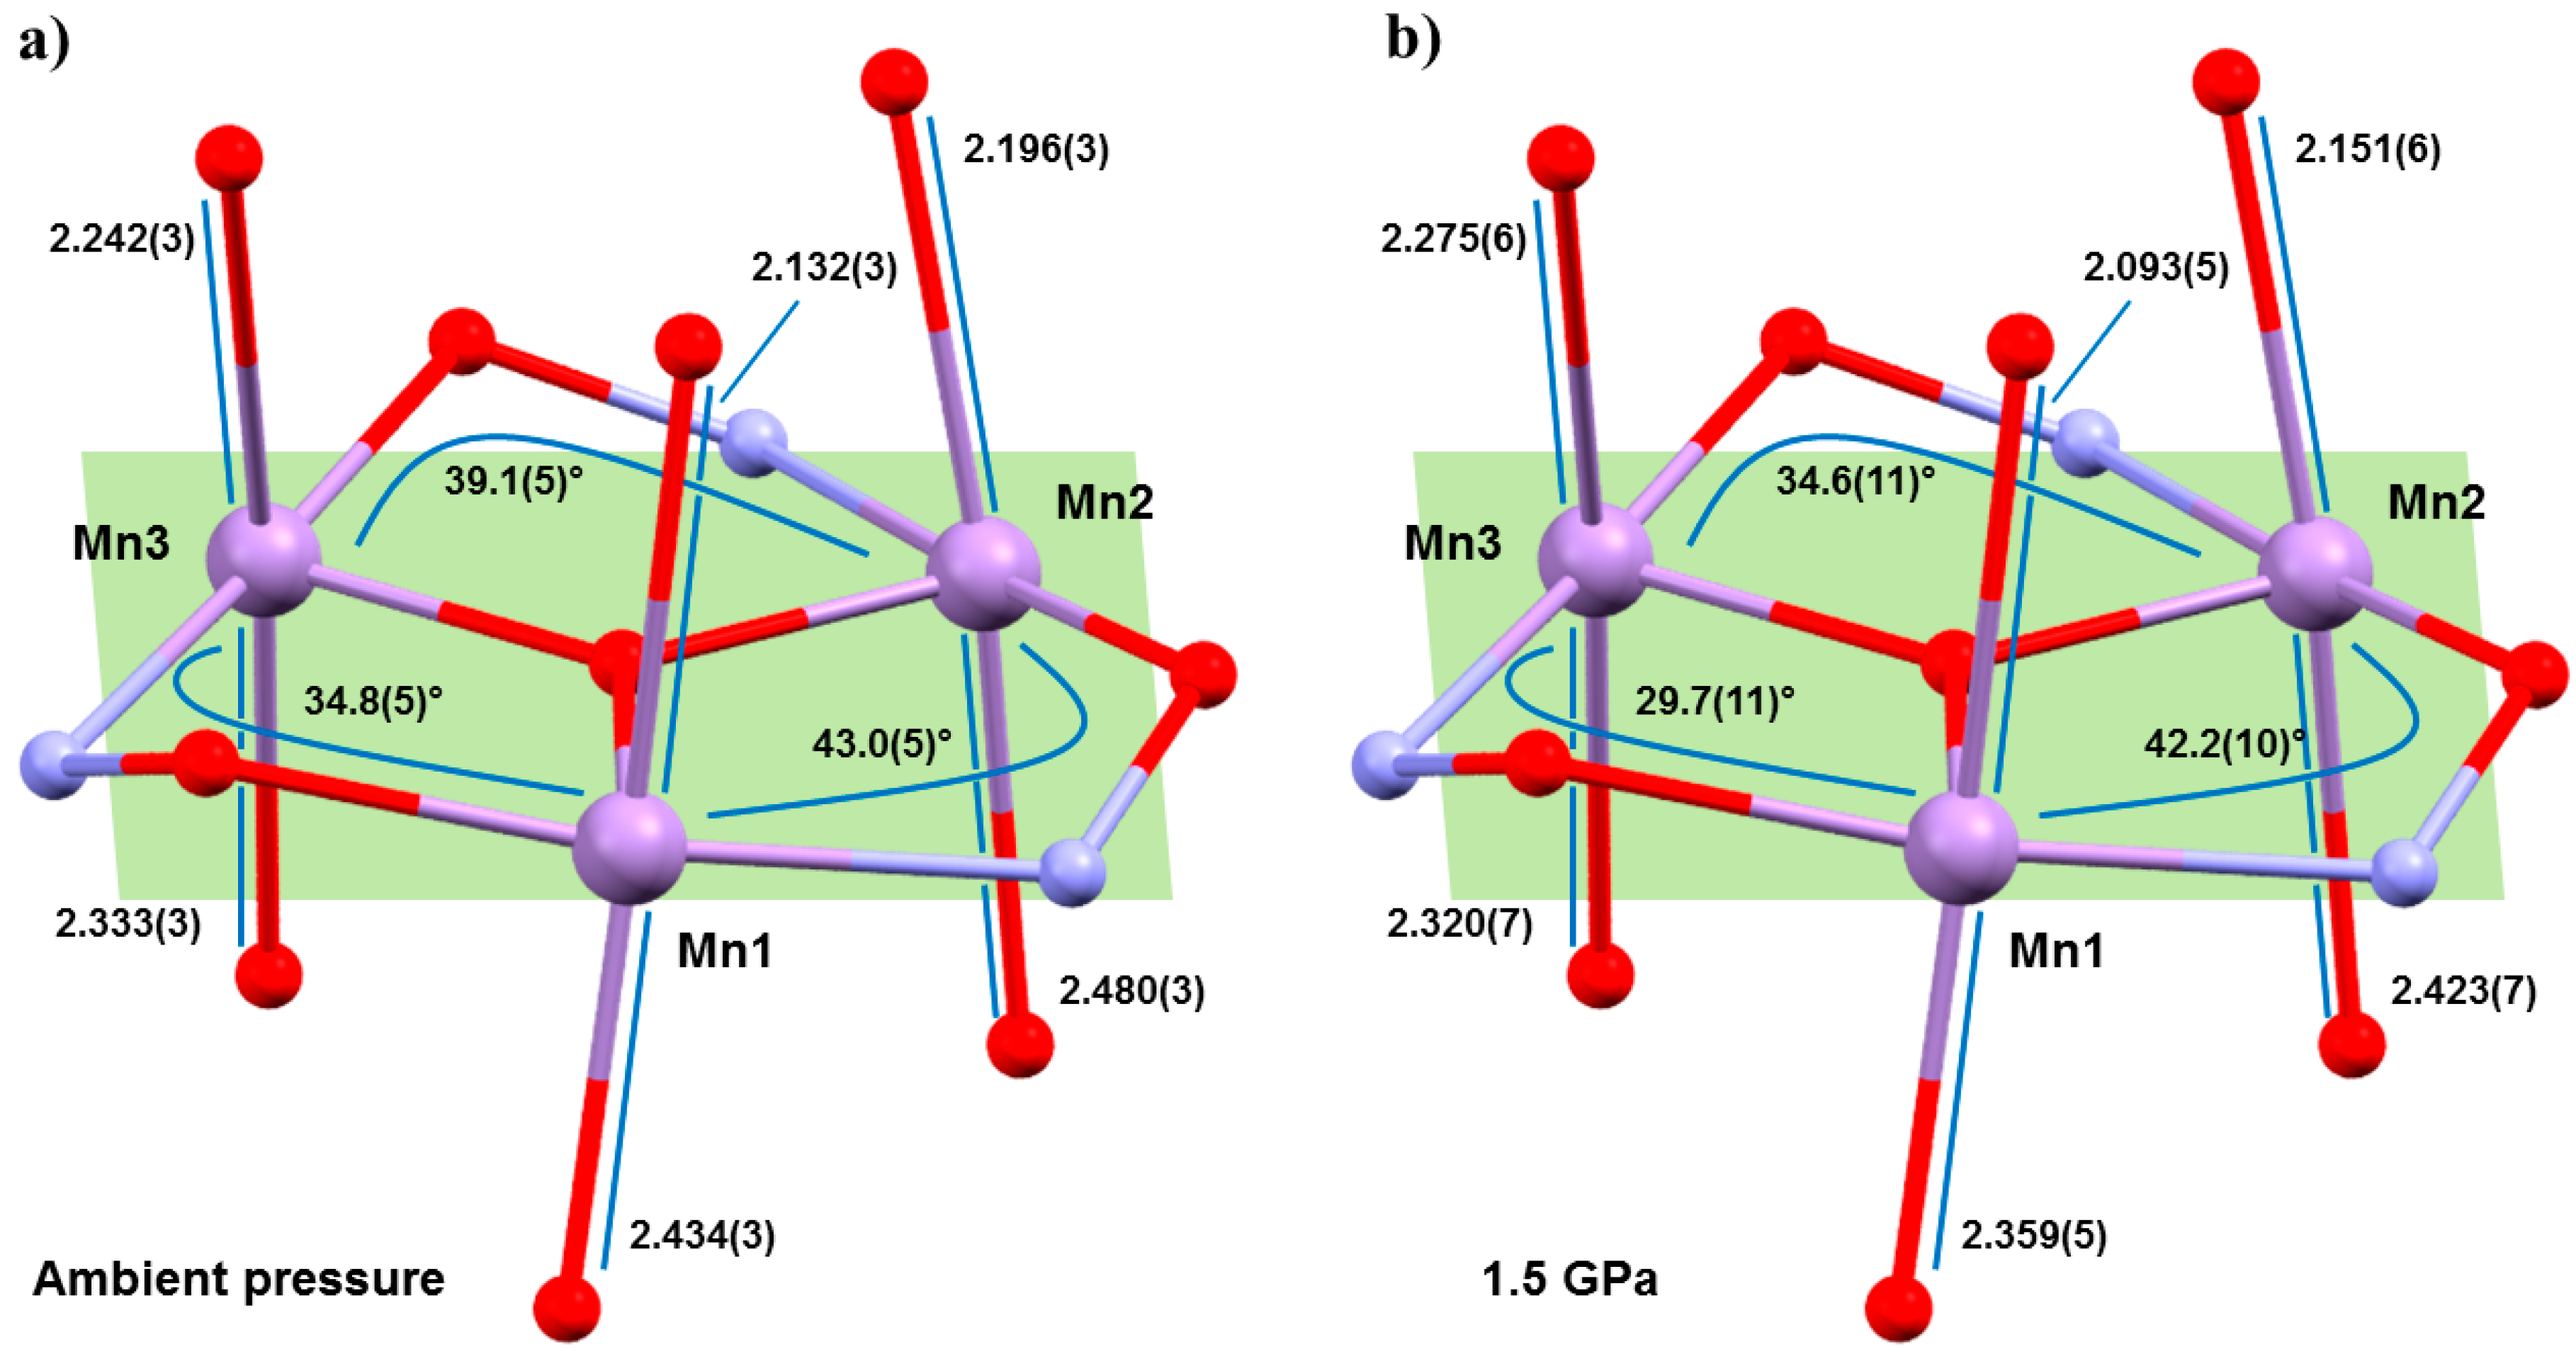
2. The intramolecular changes are more remarkable (
Figure 3), with the Mn–N–O–Mn torsion angles flattened considerably, and the JT axes compressing and re-aligning differently with respect to the plane of the three metal centres in the triangle (
Table 1 and
Table 2). The Mn–N–O–Mn torsion angles decrease by up to approximately 5.1° (
1), 5.7° (
2). Significantly, the Mn1–N–O–Mn3 torsion angle in both cases falls from above to below the angle expected to switch the pairwise exchange from ferromagnetic to antiferromagnetic; 34.8(5)→29.7(11)° (
1), 33.2(2)→27.5(17)° (
2). Note that Mn3 lies at the periphery of the molecule, away from the more structurally rigid core, and it is the only metal ion bonded to two solvent molecules, which sit on its JT axis. The changes in the JT axes with pressure are less consistent. For
1, the JT axes of Mn1 and Mn2 are compressed with pressure (2.132(2), 2.434(3) Å → 2.093(5), 2.359(5) Å; 2.196(3), 2.480(3) Å → 2.151(6), 2.423(7) Å, respectively). However, the JT of Mn3 actually elongates at 0.5 GPa, before compressing at all other (higher) pressures, resulting in a small overall compression of one bond and a small overall elongation of the other. All three JT axes move to become slightly more perpendicular to the mean plane of the [Mn
3] triangle, albeit by just approximately 0.9–1.6°. In
2, the JT axes all compress with pressure (Mn1, 2.102(3), 2.508(3) Å → 2.033(7), 2.486(9) Å; Mn2, 2.205(3), 2.397(3) Å → 2.141(9), 2.387(11) Å; Mn3, 2.395(3), 2.188(3) Å → 2.398(7), 2.107(7) Å) and variations in the alignment of the axes are within the statistical error, although the trend appears analogous to that seen for
1.
HP susceptibility and magnetisation data were collected to 2 GPa using Daphne 7373 oil as the pressure transmitting medium. The magnetic behaviour of
1 and
2 at ambient pressure has been described in detail previously [
32,
41]. In the following text, the numbers in brackets refer to complex
2. Data measured in the cell, but with zero applied pressure (
T = 300–5 K,
B = 0.1 T), can be simulated with the parameters
g = 1.99(2.03) and
J = +1.75 (+1.31) cm
−1 in a model assuming all exchange interactions are the same. With increasing pressure, the value of
χmT increases more slowly with decreasing temperature and has a much smaller maximum for both complexes, which is clearly indicative of a weaker (less positive) ferromagnetic exchange interaction, and/or the presence of antiferromagnetic exchange. Indeed, simulation of the susceptibility data for
1 at the highest pressures measured requires the introduction of a 2
J model in which the Mn1–Mn3 exchange interaction is antiferromagnetic (
J1 = +1.10 (+1.00) cm
−1,
JMn1−3 = −0.10 (−0.45) cm
−1), which is consistent with the structural changes in the torsion angles. Simulations suggest the spin ground state remains
S = 12 at lower pressures, but it switches to
S = 11 (or smaller) at higher pressures. A fit of the magnetisation data for compound
1 measured in the cell, but with zero applied pressure (
T = 2–7 K,
B = 0.5–5.0 T) to an axial zero-field splitting (
zfs) plus Zeeman Hamiltonian (Giant Spin Model) affords
S = 12,
g = 1.99, and
D = −0.38 cm
−1, which is consistent with that observed for all ferromagnetically coupled members of the family. At the highest pressures measured, these parameters become
S = 11,
g = 1.98, and
D = −0.34 cm
−1. The data for
2 could not be fitted, but qualitatively show a similar trend in behaviour. As expected with decreasing |
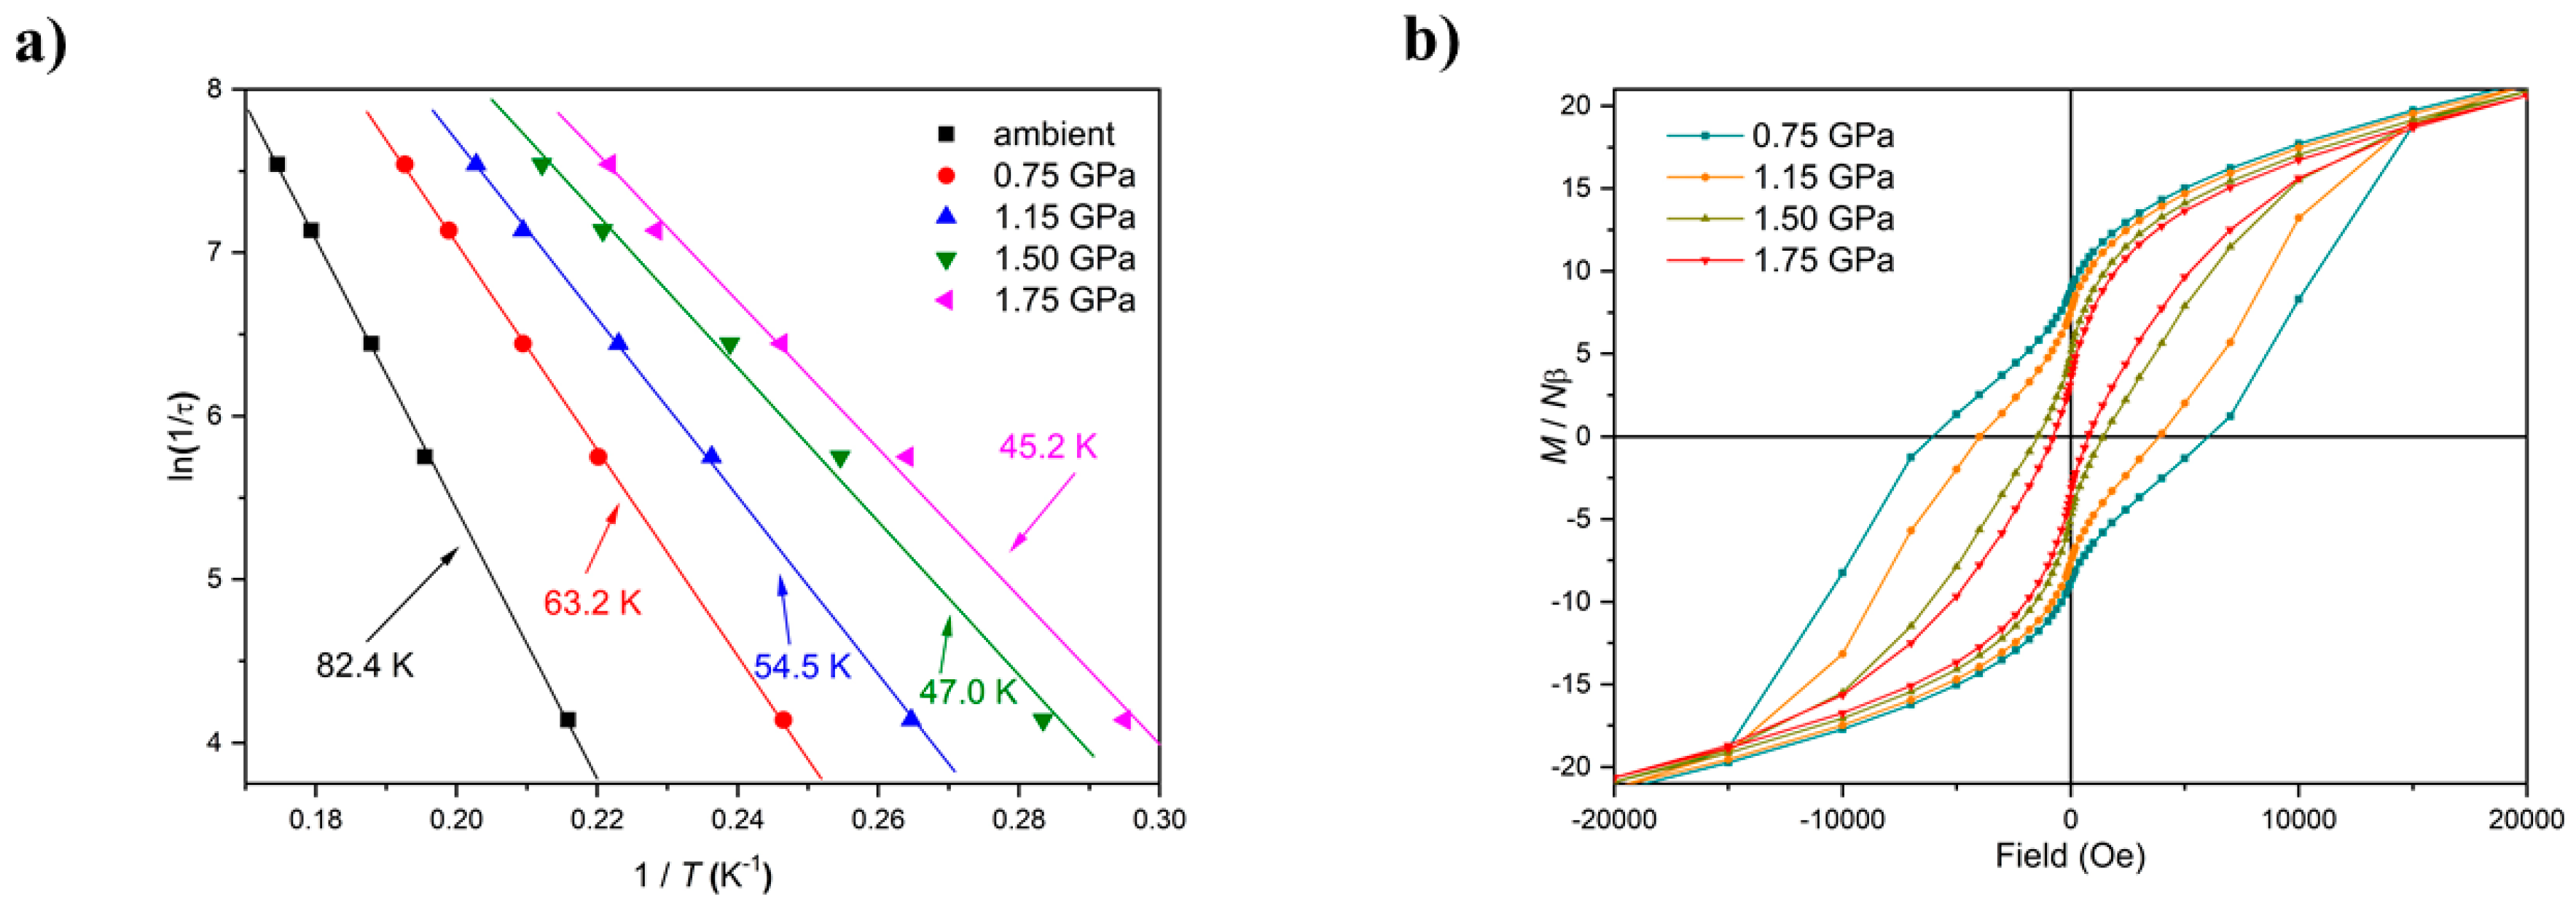
J| and the introduction of antiferromagnetic exchange, the barrier to magnetisation reversal in these SMMs is reduced dramatically (
Figure 4). There is a clear pressure and frequency-dependent decrease in the out-of-phase,
χM, peak positions in the ac susceptibility data from
T ≤ 6 K. For example, for
1, the peak at 300 Hz at 0(1.75) GPa occurs at approximately 6.3(4.8) K; for
2, the peak at 100 Hz at 0(1.4) GPa occurs at 3.9(3.0) K. A fit of the HP
χM″ data to the Arrhenius equation revealed a decrease in
Ueff in
1(
2) from 83(63) K to 63(47) K. This is also manifested in the change in the appearance of the magnetisation hysteresis loops that show a clear reduction in coercivity with increased pressure (
Figure 4).
The second SMM to be the focus of a combined HP crystallography/magnetism study was the compound [Mn
3(Hcht)
2(bpy)
4](ClO
4)
3·Et
2O·2MeCN (
3·Et
2O·2MeCN; Hcht
2− is the dianion of
cis,
cis-1,3,5-cyclohexanetriol and bpy is 2,2′-bipyridine) [
42,
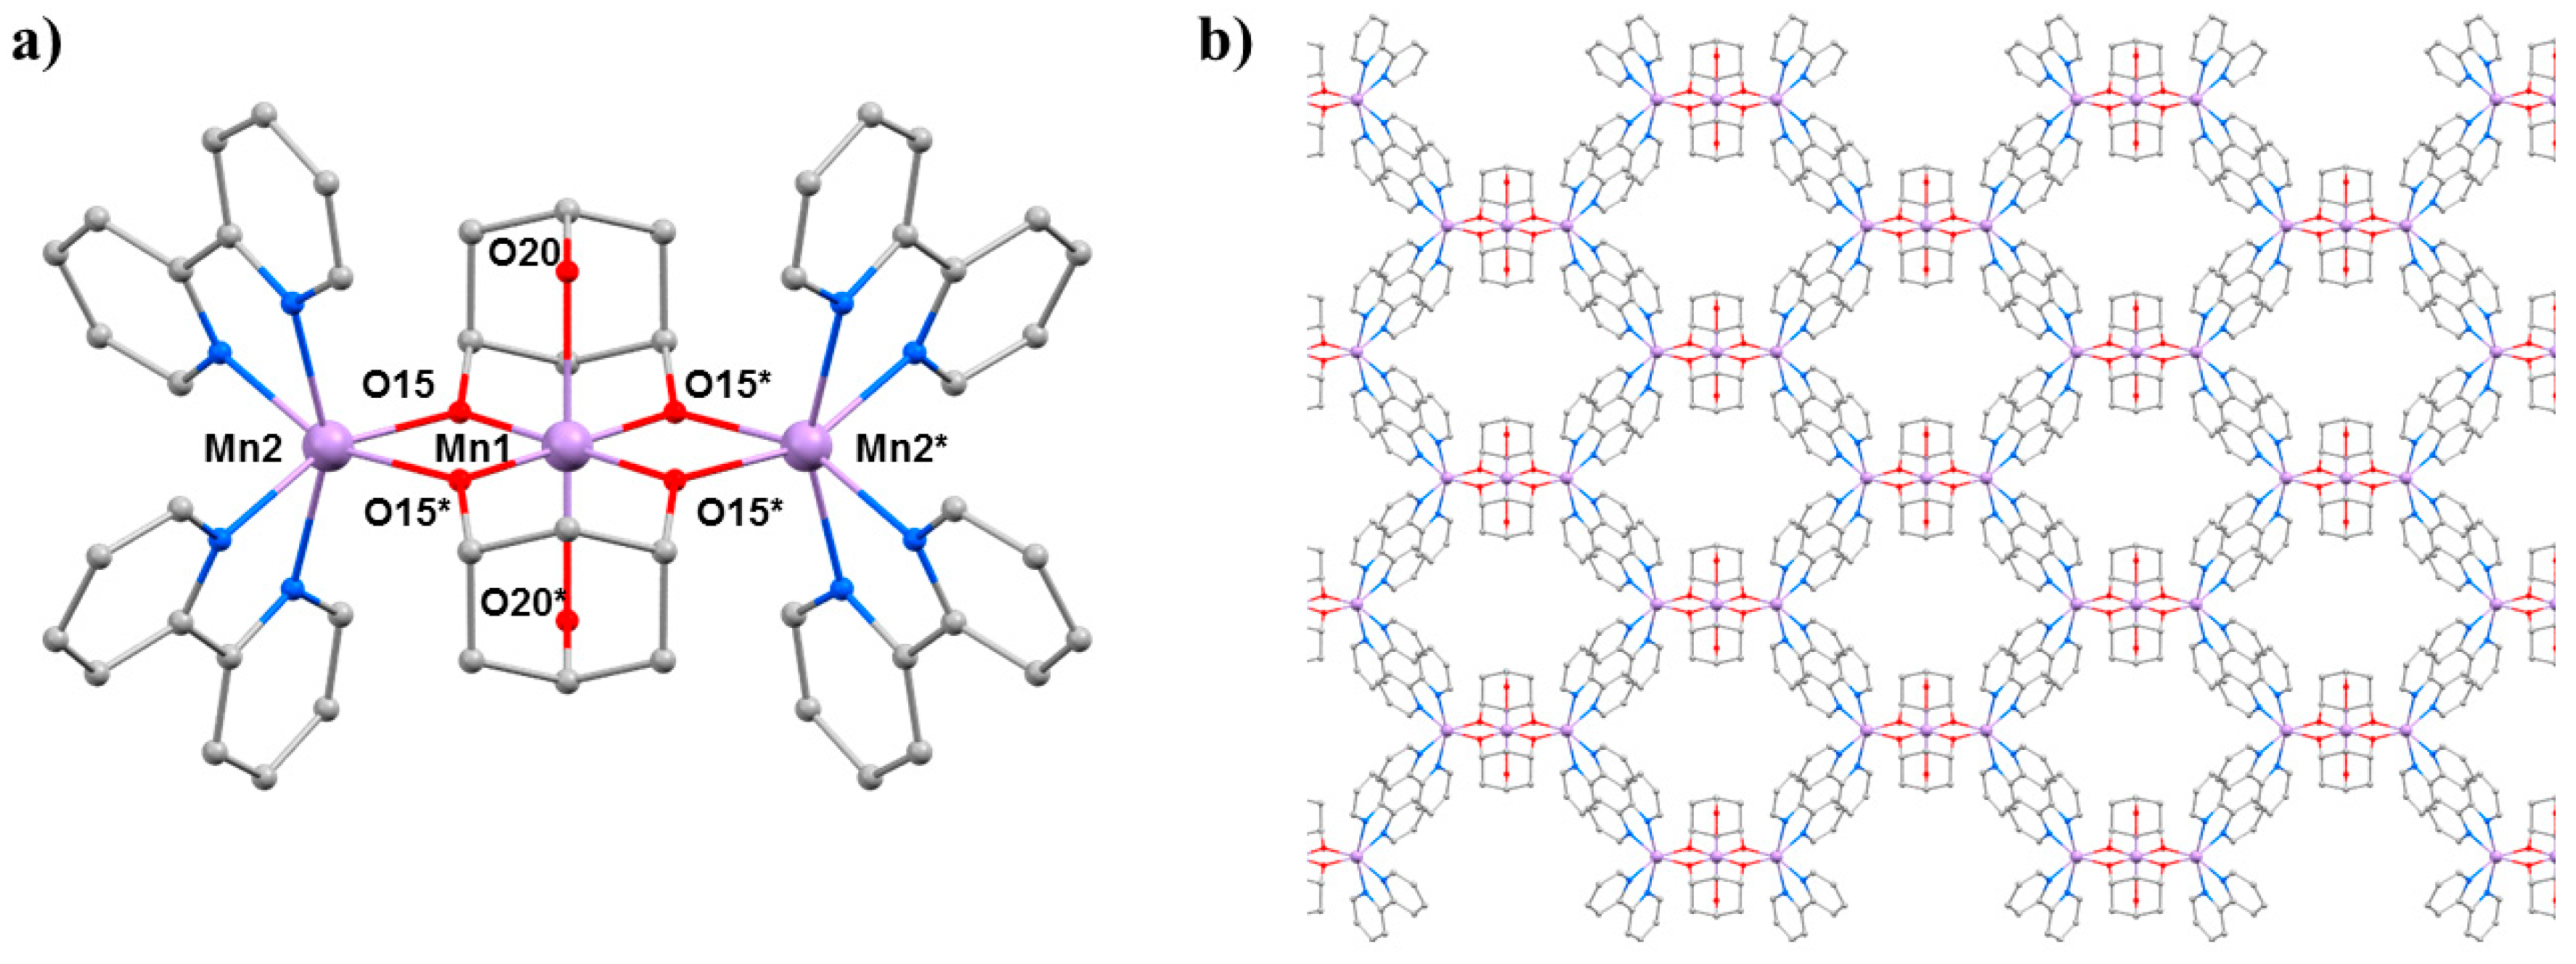
43]. The structure of
3 (
Figure 5) contains a linear [Mn
IIIMn
II2O
4]
3+ core with the central Mn
III centre (Mn1) bound to the peripheral Mn
II ions (Mn2 and symmetry equivalent, s.e.) by four alkoxide O-atoms (O15 and s.e.) provided by two Hcht
2− ligands, which are positioned one above and one below the trimetallic chain. One protonated oxygen atom (O20 and s.e.) from the tripodal alcohol defines the JT axis of Mn1. The Mn
III–O–Mn
II angle is approximately 102°, with the coordination sites of each Mn
II ion completed by four N-atoms from two 2,2′-bipyridine (bpy) ligands. Mn2 (and s.e) are in highly distorted octahedral geometries with
cis angles in the range 72.30(16)–105.65(15)° and
trans angles in the range 156.0(2)–158.17(14)°. When viewed perpendicular to the
bc plane, the disposition of the [Mn
3] cations resembles a honeycomb-type lattice where the MeCN molecules of crystallisation are H-bonded to the terminal bonded arm of the tripodal ligand (N···O, approximately 2.8 Å), while the perchlorate anions are H-bonded to the ring of carbon atoms (O···H–C, ≥2.3 Å) and lie between the bpy groups of adjacent [Mn
3] molecules. The closest intermolecular contacts between cations occur between off-set π-stacked bpy groups (C···C, approximately 3.5 Å).
HP single crystal XRD measurements were performed in petroleum ether at
T = 300 K and three different pressures to a maximum of 1.25 GPa [
44]. Complex
3 crystallises in the monoclinic space group
I2/
m and remains so in the full pressure range. Remarkably, by 0.16 GPa, there is complete elimination of the MeCN and Et
2O solvent of crystallisation. It has literally been squeezed out of the crystal, representing the very first example of pressure-induced solvent elimination to have been observed from the crystal structure of any molecular coordination compound. This leaves large void spaces in the structure, equating to approximately 9.3% of the total volume that are gradually reduced to approximately 5.5% at 1.25 GPa. The total change in volume over the entire pressure range is approximately 10.5%, resulting in intermolecular distances shortening by approximately 0.5 Å. For example, separations between Mn
III ions along the three dimensions shift from 11.919(2), 13.385(2), and 22.044(4) Å at ambient pressure to 11.331(3), 13.586(3), and 21.547(4) Å at 1.25 GPa, respectively. Despite significant changes in intermolecular interactions, there are only minor intramolecular changes. The Mn–O15 bonds contract from 1.898(3) Å at ambient pressure to 1.858(5) Å at the highest pressure measured, the Mn1···Mn2 separation decreases from 3.143(1) Å to 3.118(2) Å, and the planes of the bpy rings become a little more ‘twisted’ with respect to each other (15.4(1)°→16.6(2)°).
Direct current (dc) magnetic susceptibility data collected at ambient pressure (
T = 300–5 K,
B = 0.1 T) reveal weak ferromagnetic exchange between the Mn
III and Mn
II ions with
J = +1.15 cm
−1. Fitting of the magnetisation data (
T = 2–7 K,
B = 1–7 T) afforded the parameters
S = 7,
D = −0.17 cm
−1 with
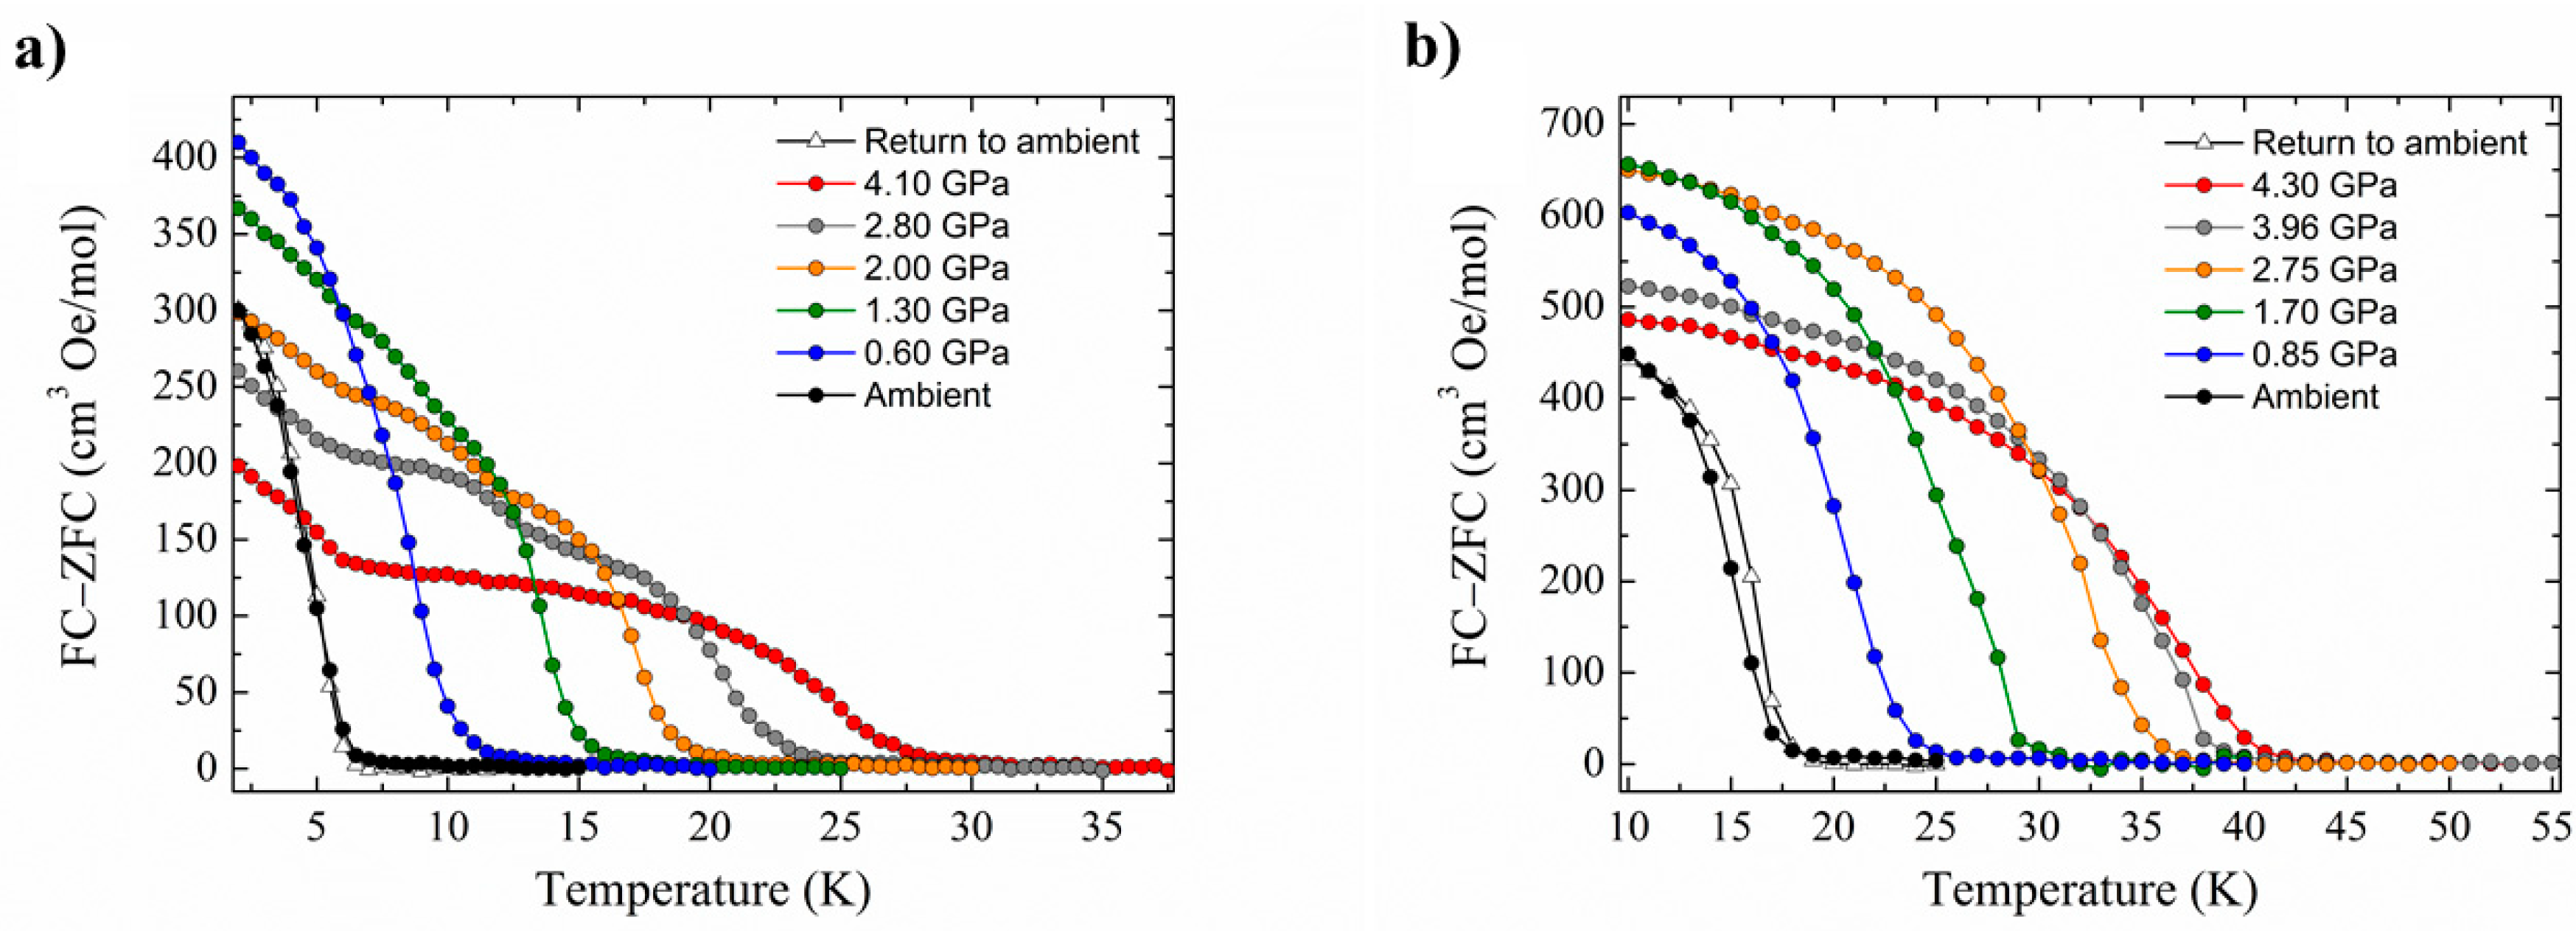
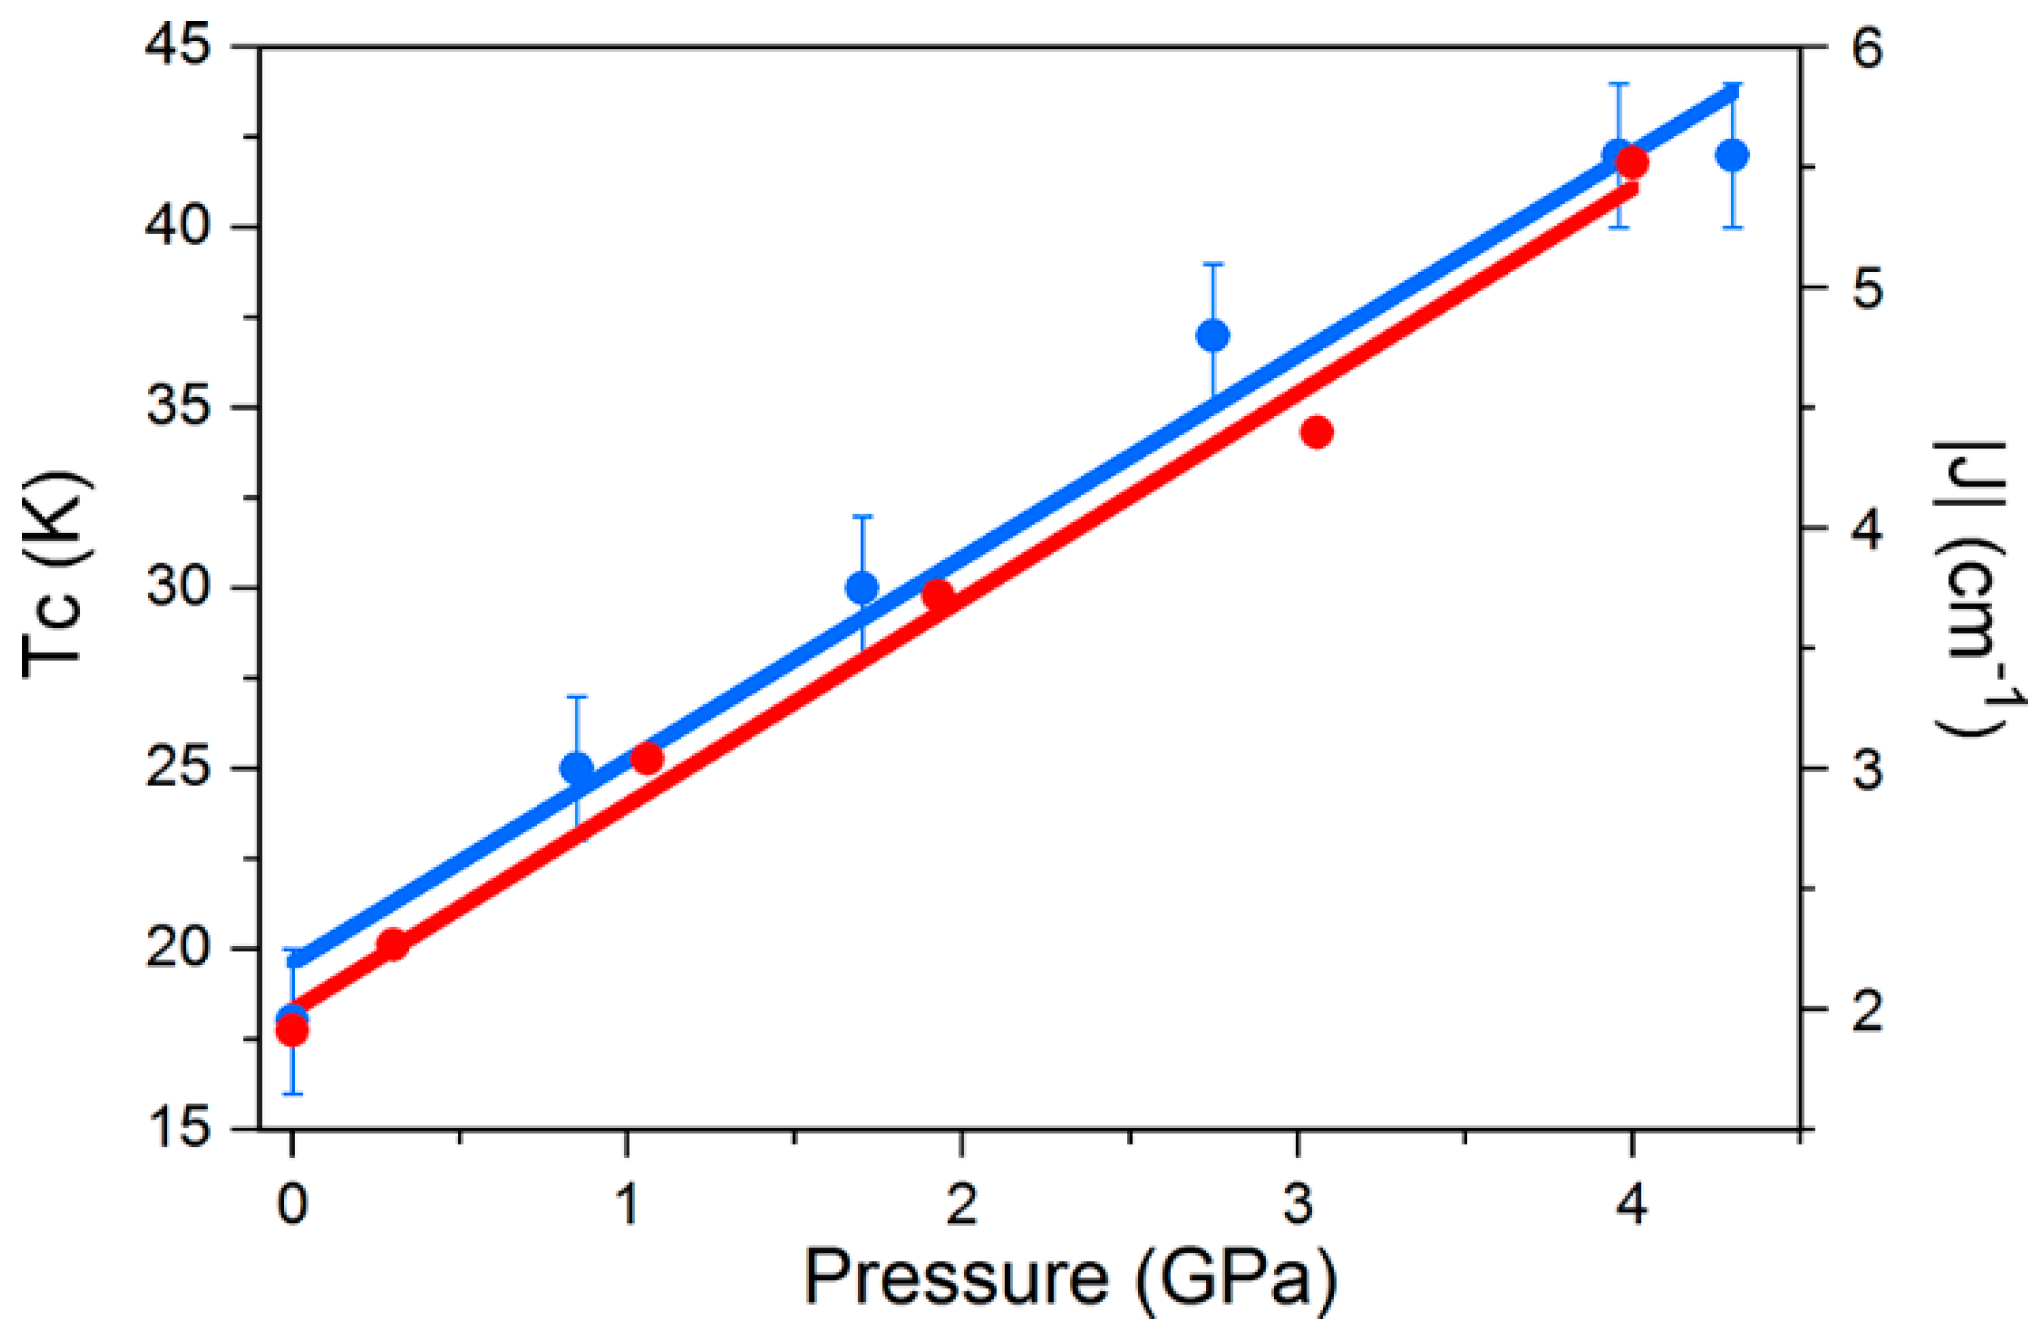
g = 1.99. With increasing pressure, the susceptibility data clearly indicate a weakening interaction,
χmT increases more slowly with the increasing pressure as the temperature decreases, reaching a smaller maximum at
T = 5 K. Simulation of the HP susceptibility data (
Table 3) shows that the exchange decreases by close to 50%, to a value of
J = +0.60 cm
−1 at 0.85 GPa. This behaviour is consistent with the observed shortening of the Mn1–O15 bond distance and Mn1···Mn2 separation, which would increase the antiferromagnetic contribution to the exchange. Magnetisation data at all pressures are super-imposable and can be fitted with the same parameter set as those obtained at ambient pressure, which is consistent with the lack of change in geometry at the JT distorted Mn
III site and the retention of ferromagnetic nearest neighbour exchange.
The complex [Mn
12O
12(O
2CCH
2tBu)
16(H
2O)
4]·CH
2Cl
2·MeNO
2 (
4·CH
2Cl
2·MeNO
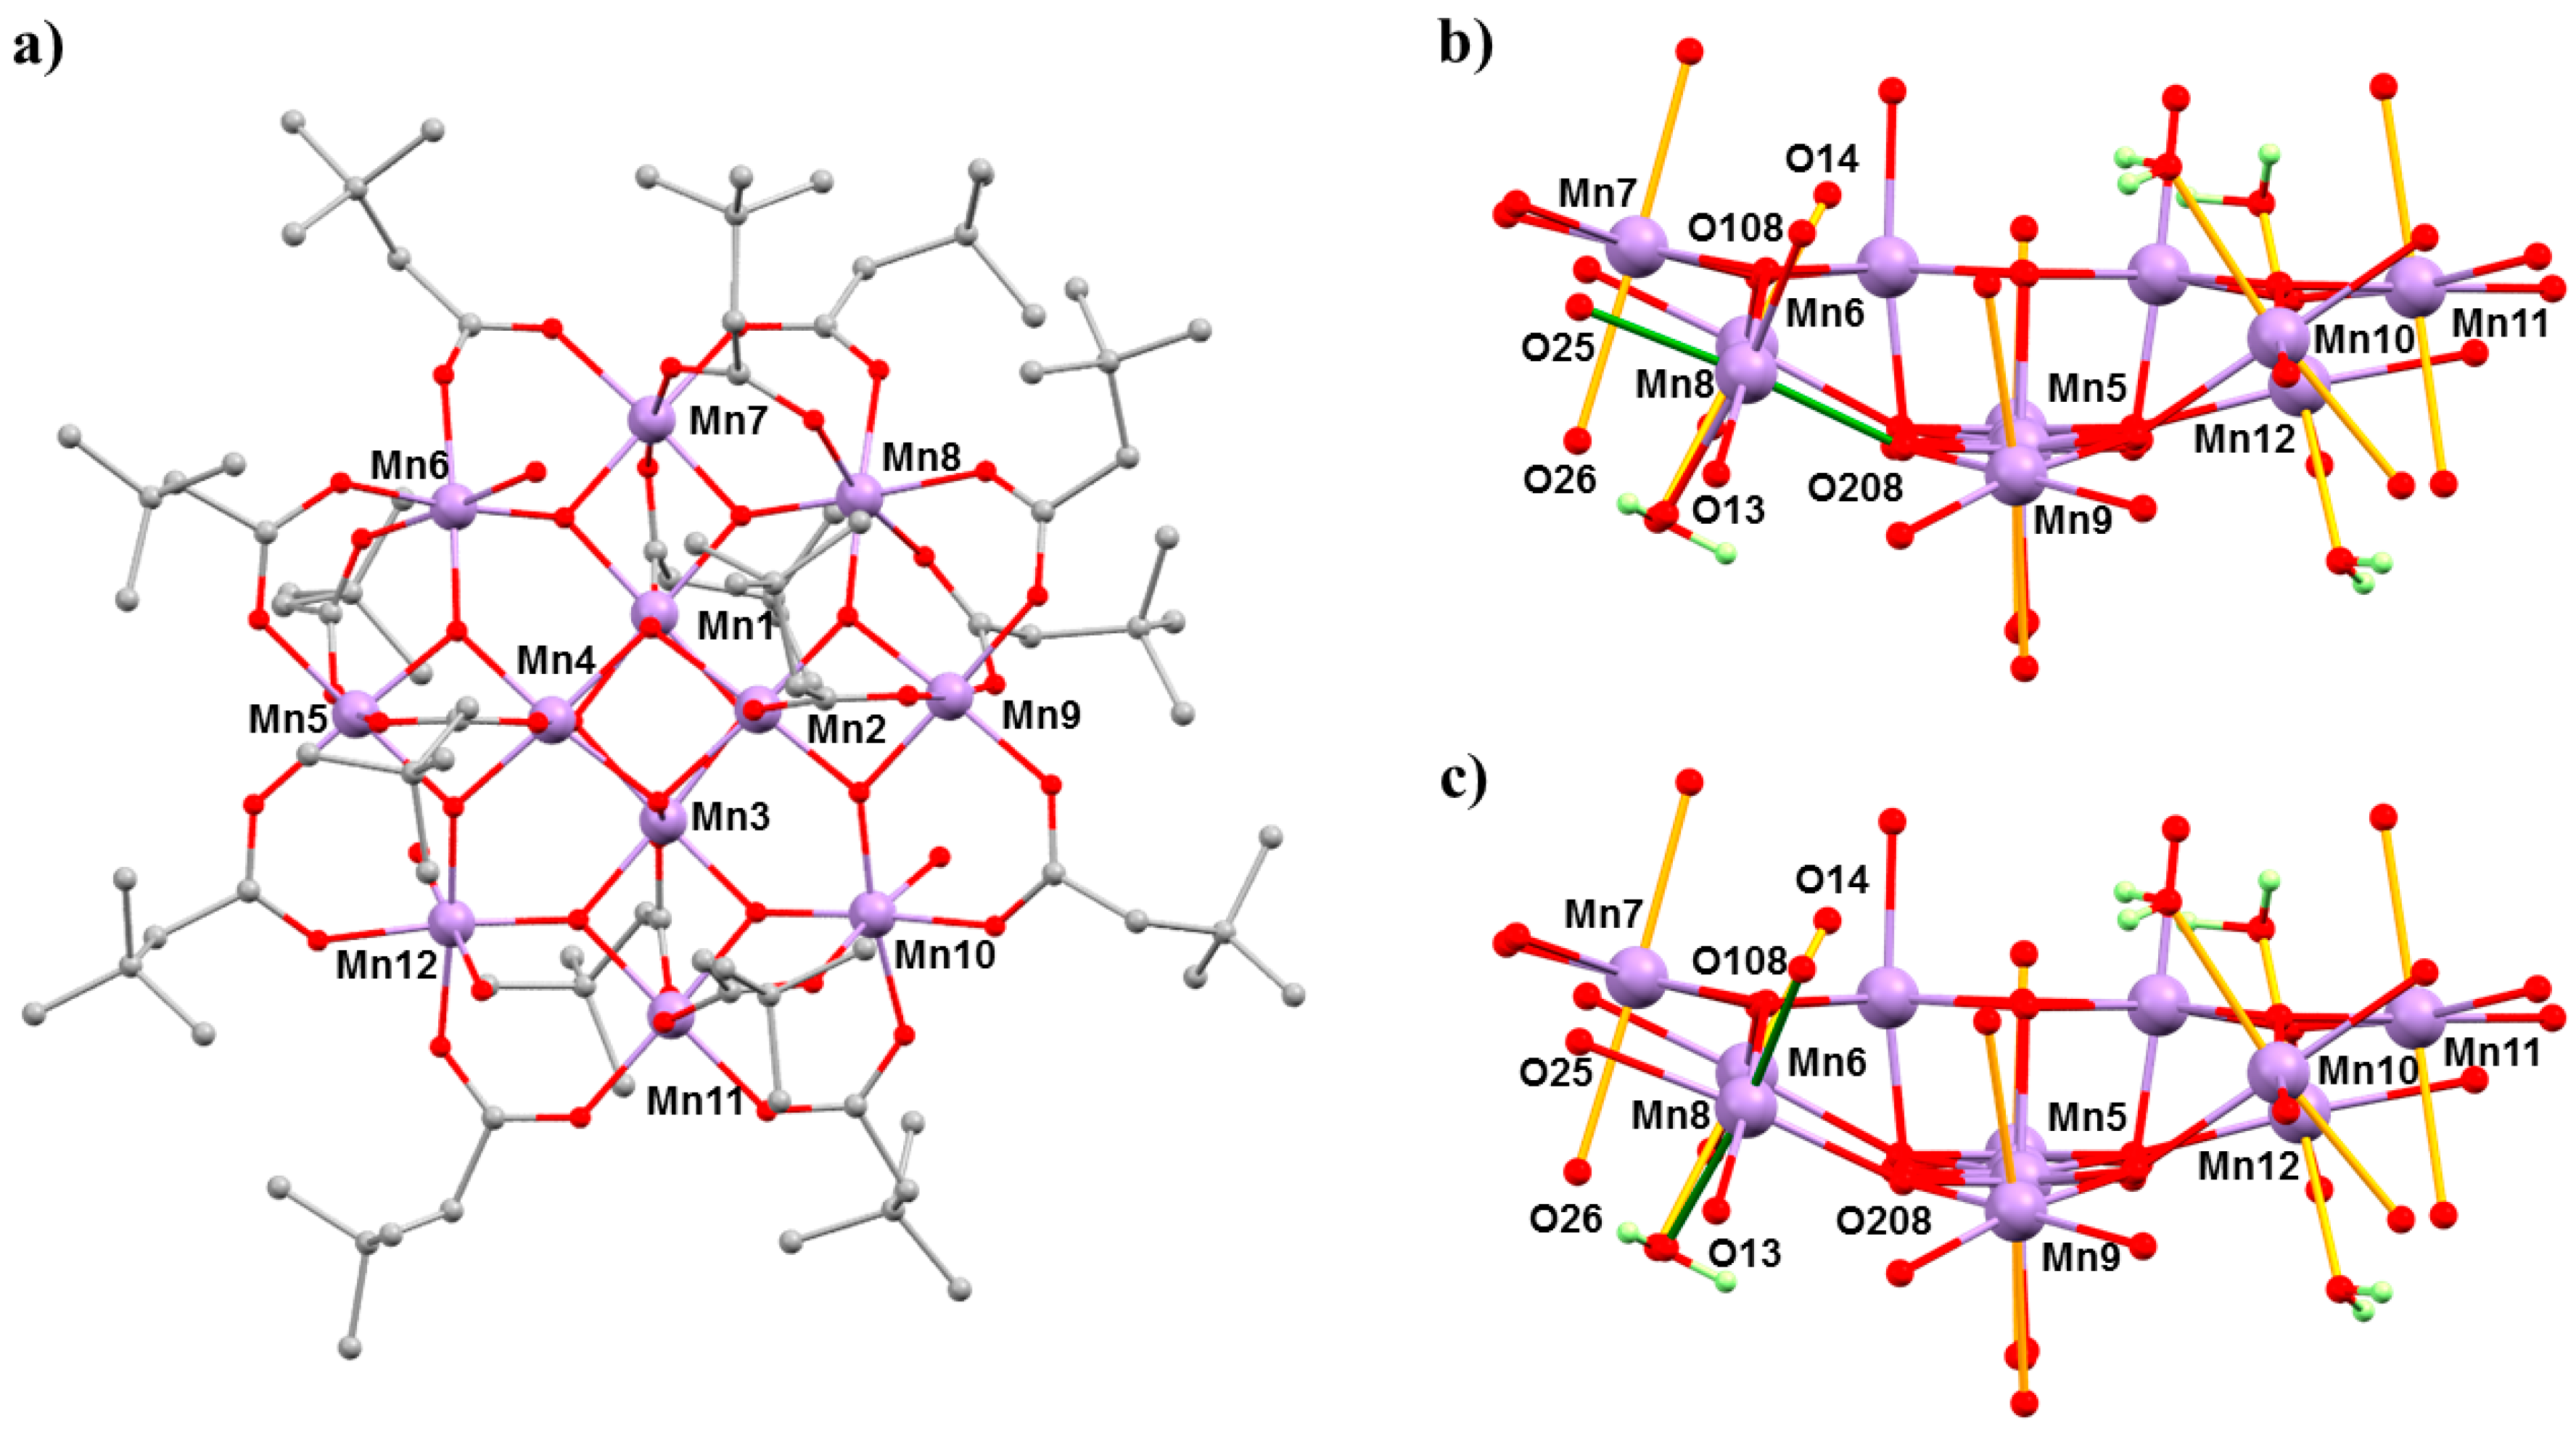
2) belongs to the prototype [Mn
12O
12(O
2CR)
16(H
2O)
4] family of SMMs [
45,
46]. The general structure of these complexes consists of a ring of eight Mn
III centres surrounding a central Mn
IV4O
4 cube, which is bridged by oxide and carboxylate ligands (
Figure 6). In the case of Mn
12acetate, the Mn
III ions occupy two crystallographically independent sites with the eight JT axes lying in near alignment with the magnetic easy axis, affording
D = −0.457(2) cm
−1. In combination with a
S = 10 spin ground state, this leads to an effective barrier to magnetisation reversal of approximately 60 K [
47]. However, bulk [Mn
12] samples often contain a small percentage of a fast-relaxing (FR) JT isomer, which display a misaligned/horizontal JT axis and a much lower barrier height,
Ueff ≈ 40 K, and initial HP studies of the static magnetic properties of Mn
12acetate at low temperatures, and HP inelastic neutron scattering (INS) measurements, had suggested some conversion of the slow relaxing (SR) isomer to the FR isomer with pressure [
48,
49,
50]. However, both studies lacked any crystallographic confirmation. In order to address this, we turned our attention to [Mn
12O
12(O
2CCH
2tBu)
16(H
2O)
4]·CH
2Cl
2·MeNO
2 (
4·CH
2Cl
2·MeNO
2) because it exists as the 100% FR isomer, with the JT axis on Mn8 oriented equatorially rather than axially (
Figure 6).
HP single crystal XRD measurements were performed in Daphne oil at
T = 298 K and at three different pressures up to 2.5 GPa [
51]. Complex
4 crystallises in the triclinic space group
P-1 and remains so in the full pressure range. At ambient pressure, the formula unit contains one MeNO
2 and CH
2Cl
2 of solvation. At 1.5 GPa, the occupancies of the solvent decreases to 0.75MeNO
2 and 0.5CH
2Cl
2 per formula unit, and at 2.5 GPa, the solvent is removed completely—suggesting that the solvent is released into the hydrostatic medium and reabsorbed on decompression. The main structural changes within the cluster occur at the Mn
III centres. At 1.5 GPa, the JT elongated bonds on Mn5, Mn6, and Mn12 become more asymmetric, while those on Mn7 and Mn9–Mn11 decrease, but only by approximately 0.02 Å on average. At Mn8, the JT bond (O208–Mn8–O25; 2.049(2) Å, 2.145(3) Å) lengths decrease, and at 1.5 GPa, the six Mn–O distances span the range 1.94(2) to 2.082(15) Å (
Table 4), suggesting that the disorder present at ambient pressure persists. At 2.5 GPa (
Figure 6), the horizontal JT bonds at Mn8 switch to vertical JT bonds, O14–Mn8–O26 (2.105(17) Å, 2.19(2) Å). Between 1.5 and 2.5 GPa, the JT bonds on the remaining Mn
III sites do not change significantly. Release of pressure re-establishes the coordination seen at ambient pressure. Note that FR→SR isomer conversion had been previously reported to be affected by solvent loss, which is consistent with this HP crystallographic data [
45,
46].
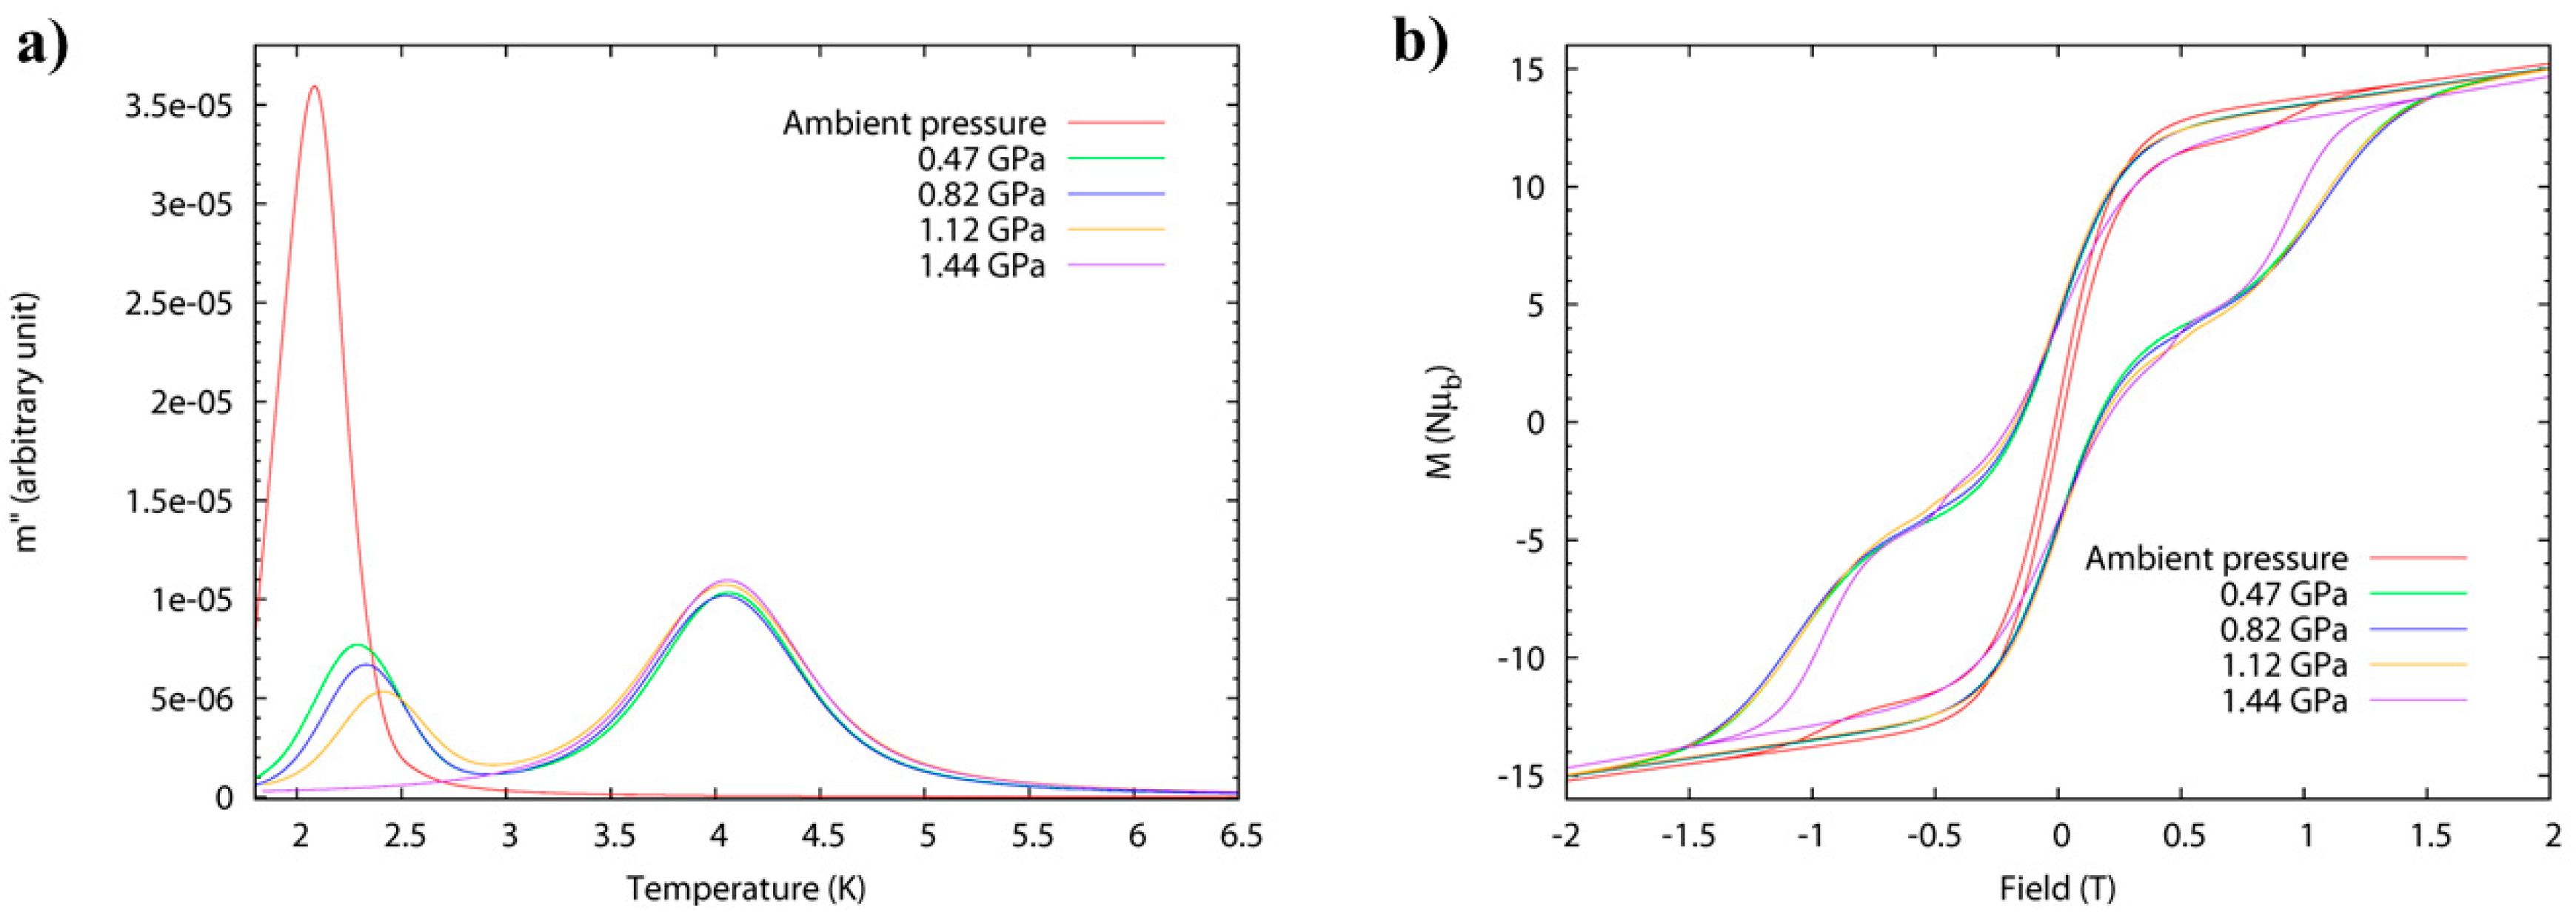
High-pressure alternating current (ac) susceptibility data (
Figure 7) from ambient pressure to a maximum of 1.44 GPa was collected in Daphne oil. The ambient pressure data reveals only one peak at low temperature (
Tmax = 2.1 K at 1 Hz) due to the FR species. At 0.47 GPa, the low temperature peak shifts to higher temperature (approximately 2.3 K) with a significant decrease in its intensity, and a new broader peak appears at approximately 4 K, i.e., both FR and SR isomers are now present. This trend continues to higher pressures, and at 1.44 GPa, the low temperature peak disappears and only the high temperature peak is observed (
Tmax = 4.1 K at 1 Hz) due to the exclusive presence of the SR species. The switch is fully reversible. Arrhenius analysis of the frequency dependence affords
Ueff(FR) = 41 K,
τ0 = 4 × 10
−10 s, increasing to
Ueff(FR) = 46 K,
τ0 = 8 × 10
−10 s at 1.12 GPa. The energy barrier of the pressure-induced SR species,
Ueff(SR) = 63 K, compares well to the value,
Ueff = 62 K, which was previously reported for the SR species [Mn
12O
12(O
2CCH
2tBu)
16(H
2O)
4]·CH
2Cl
2·MeCN. The switch from FR→SR isomer is also evidenced in the evolution of the hysteresis loop under pressure at 2 K (
Figure 7), whose coercive field increases with pressure. An estimation of the axial zero-field splitting (
zfs) from the 1.44 GPa magnetisation data affords,
D = −0.61 K, which is in excellent agreement with that obtained from single-crystal low-temperature hysteresis loops.
The compounds [Mn
2O
2(bpy)
4](ClO
4)
3·3MeCN (
5·3MeCN) and [Mn
2O
2(bpy)
4](PF
6)
3·2MeCN·H
2O (
6·2MeCN·H
2O) belong to a family of mixed-valence oxo-bridged Mn
III/Mn
IV dimers originally synthesised as models for metalloenzymes [
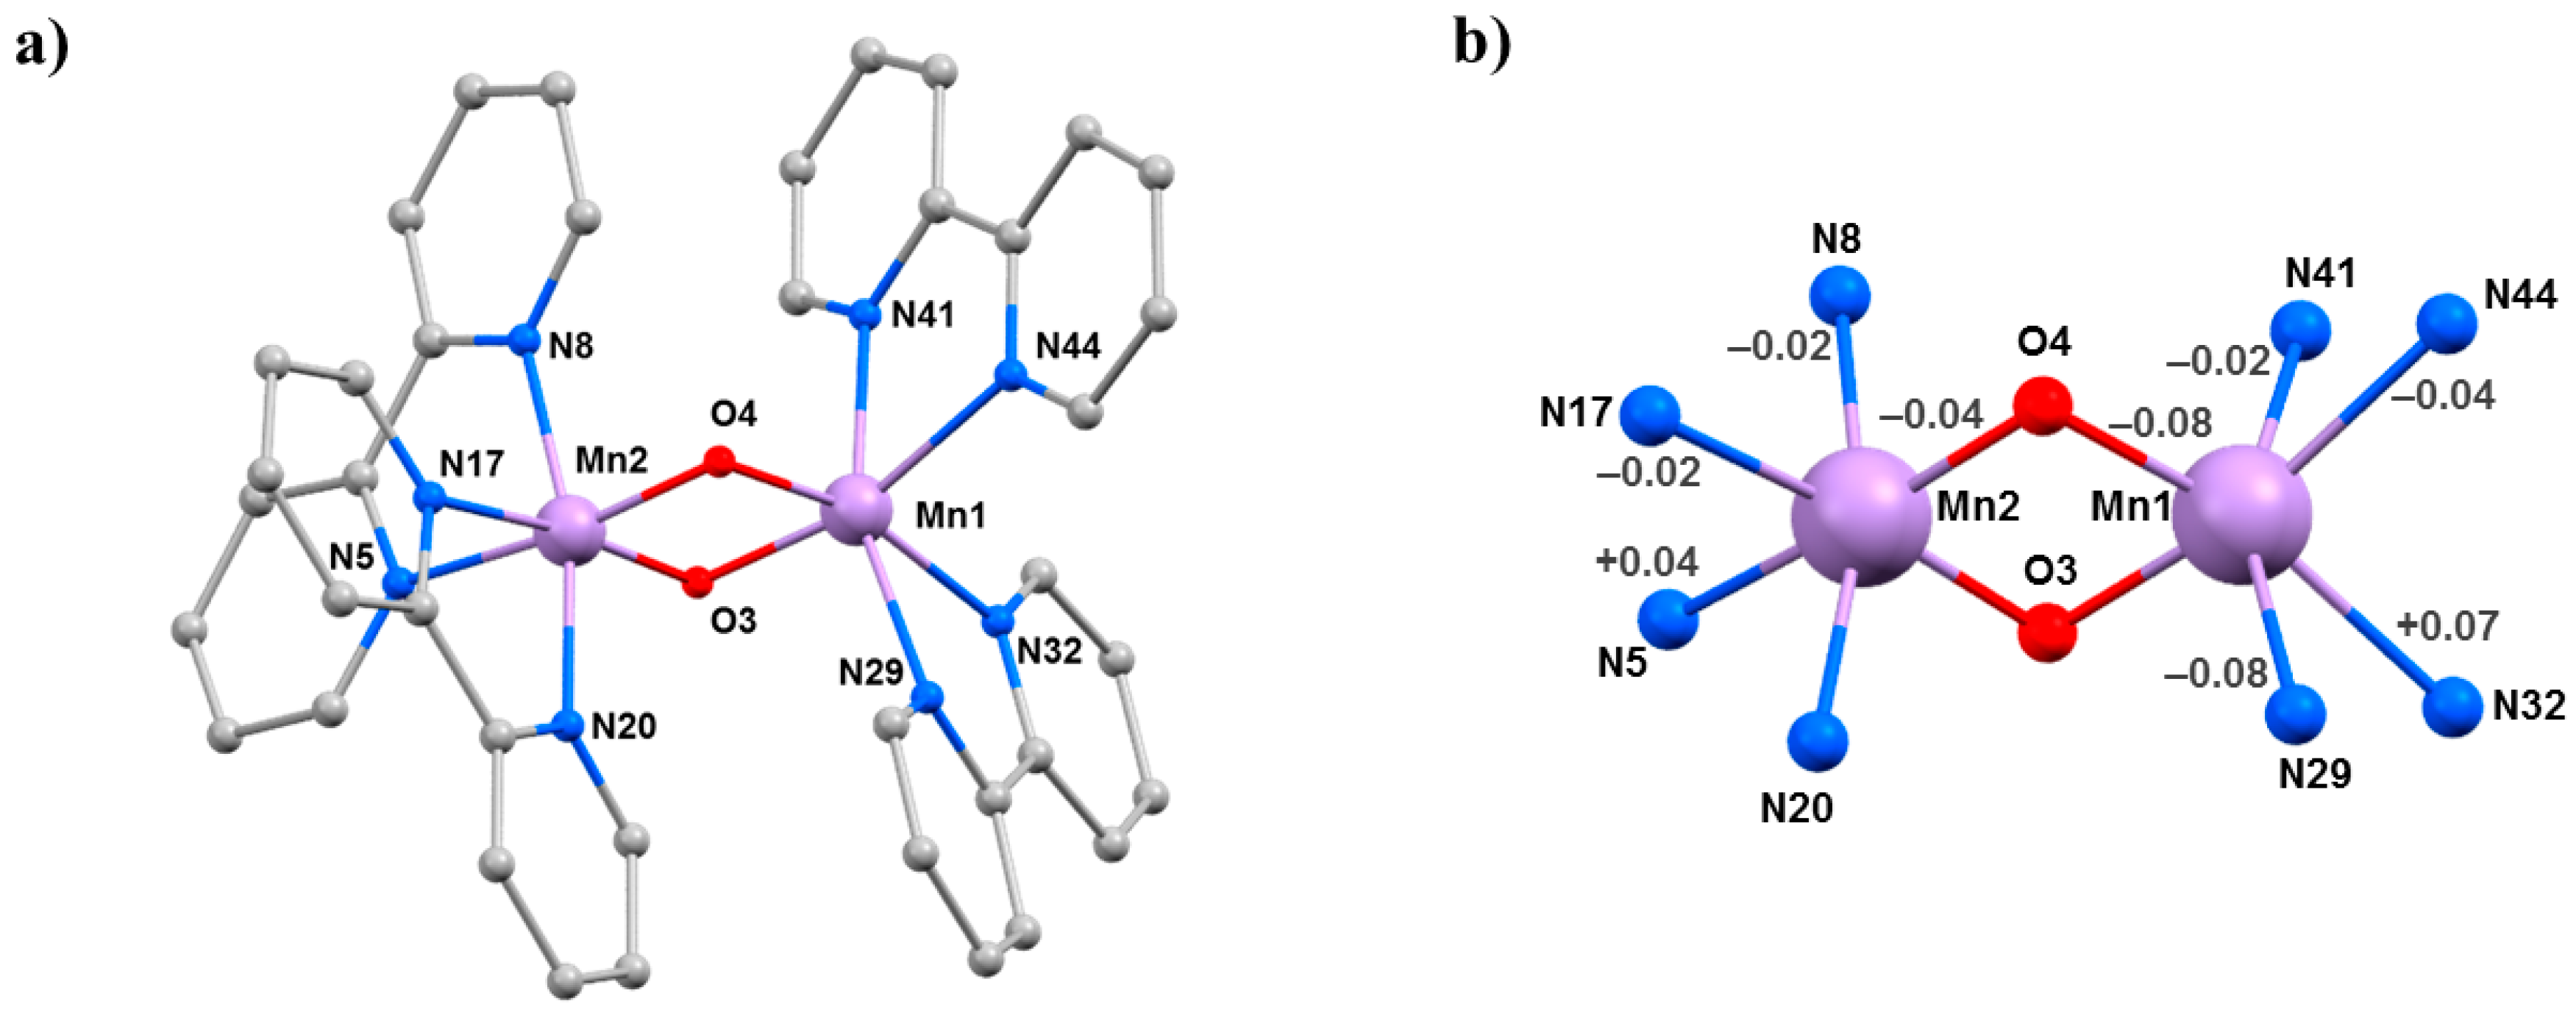
52]. Their structures (
Figure 8) contain a central [Mn
IIIMn
IVO
2]
3+ asymmetric core with two bridging
μ-O
2− ligands and two 2,2′-bipyridine (bpy) ligands completing the octahedral coordination around each Mn ion. Charge balance is maintained by the presence of three [ClO
4]
− (
5·3MeCN) or three [PF
6]
− (
6·2MeCN·H
2O) counter ions. Mn1 is in the 3+ oxidation state, with the JT axis defined by the N29–Mn1–N41 vector, which lies approximately perpendicular to the [Mn
2O
2] plane. The Mn–Mn separation and the Mn-O–Mn bridging angles are 2.7058(4) Å, 96.42(7)°, 96.09(7)° in
5·3MeCN and 2.7177(7) Å, 97.00(11)°, 96.97(11)° in
6·2MeCN·H
2O. In both cases, the solvent molecules and anions are hydrogen bonded to the protons of the bpy ligands, and the closest inter-cluster interaction is between staggered π–π stacked bpy rings.
HP single-crystal XRD measurements were performed in petroleum ether at room temperature [
53]. Data were collected at four different pressures to a maximum pressure of 2.00 GPa for
5 and six different pressures to a maximum pressure of 4.55 GPa for
6. Complex
5 crystallises in the triclinic space group
P-1, and complex
6 crystallises in the monoclinic space group
P2
1/
n; both remain in the same space groups in the full pressure range. The main effect of applying pressure is the contraction of the unit cell volume (2517.49(9) → 2239.1(11) Å
3; 5150.7(2) → 4207.5(6) Å
3, respectively), due to the reduction of void space and aided by the lack of any significant intermolecular interactions. The main intramolecular changes are to the Mn–Mn distance, which contracts from 2.7058(4) → 2.676(4) Å at 2.0 GPa in
5 and from 2.7177(7) → 2.672(3) Å at 4.55 GPa in
6. In the case of
5, this change is likely due to the contraction of both Mn–O4 bonds (
Table 5); however, for
6, the variations observed for the Mn–O distances and the Mn–O–Mn angles are not statistically significant. In
5, there are also significant changes in the Mn1–N bond lengths, which see two of the four decreasing and one (N32) increasing. The JT axis (N41–Mn1–N29) is significantly shortened, with the Mn1–N29 bond contracting from 2.2221(18) Å to 2.142(6) Å. For Mn2, the changes are less significant, except for the Mn2–N5 bond, which increases from 2.078(5) Å at 0.18 GPa to 2.144(8) Å at 2.00 GPa. A similar change is also seen in
6.
High pressure dc susceptibility data (T = 350–20 K, B = 0.1 T) were collected to a maximum pressure of 0.87(0.84) GPa for 5(6) using Daphne oil as hydrostatic medium. The behaviour of both complexes is analogous to that previously reported for 5(6) across the whole temperature and pressure regime, which is consistent with the lack of any significant intramolecular structural change at low pressures. Simulations of the susceptibility data afford J = −177 cm−1 and g = 1.96 for 5 and J = −185 cm−1 and g = 1.98 for 6.
3. Cu Complexes
The choice of investigating Cu
II complexes was partly influenced by our initial success in Mn
III chemistry where we repeatedly saw large structural changes associated with JT axes. Aligned with this was the well-known coordinative flexibility of the Cu
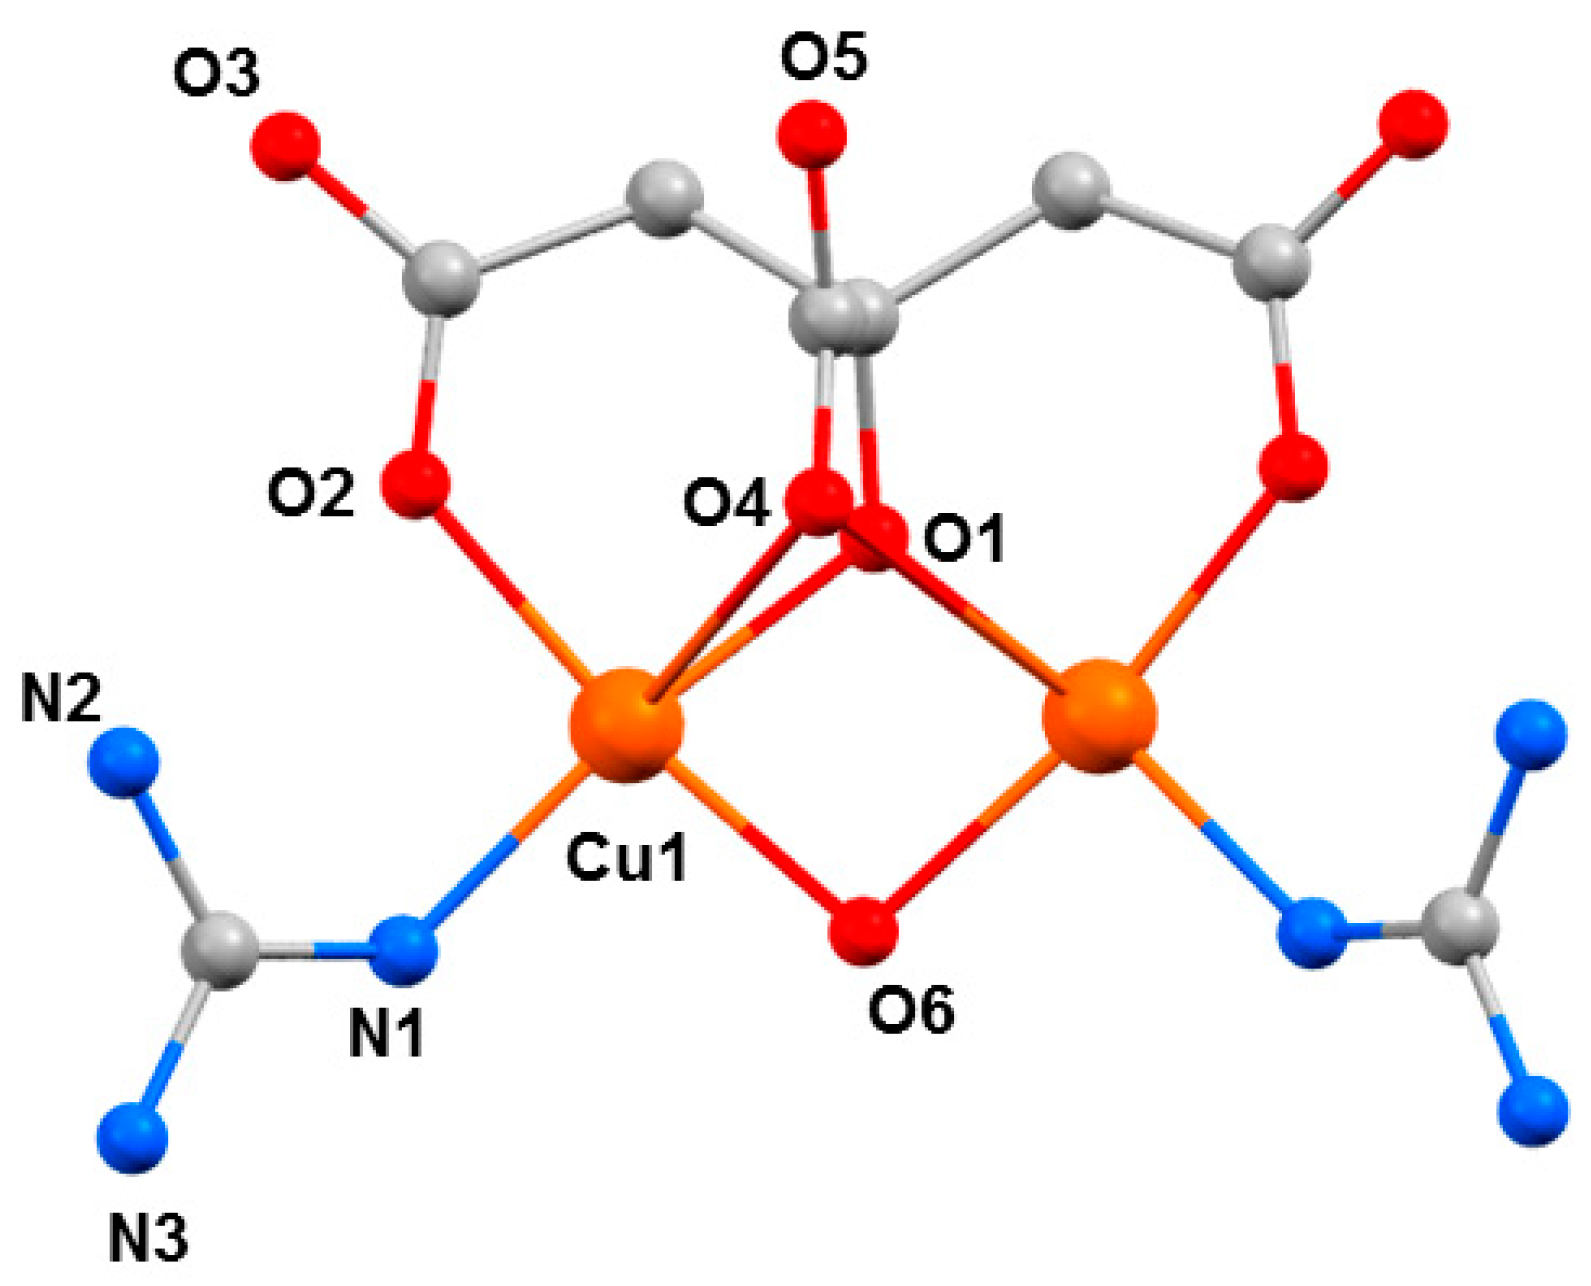
II ion, which is commonly four, five, or six coordinate, adopting a variety of geometries, and consequently, colours. Therefore, such species offered another potential variable to examine high-pressure absorption/emission spectroscopy, which would allow us to correlate changes in the metal coordination sphere to piezochromism. The Cu dimer [GuH][Cu
2(OH)(cit)(Gu)
2] (
7, H
4cit = citric acid, Gu = guanidine) is somewhat unusual, in that it was the first reported example of a coordination compound containing neutral guanidine ligands bonded to a transition metal ion (
Figure 9) [
54]. At ambient pressure, complex
7 crystallises in the orthorhombic space group
Pnma. The two Cu
II ions have a distorted square pyramidal [4 + 1] coordination environment. They are bridged by a µ-OH
− ligand (O6), the citrate alkoxide (O1), and the citrate α-carboxylate group (O4). The latter forms the long ‘axial’ bond (Cu1···O4, 2.740(4) Å). The coordination environment of each metal ion is completed by one citrate β-carboxylate (O2) and one neutral guanidine ligand (N1). The region of the sixth coordination site of the Cu
II ion is occupied by an uncoordinated β-carboxylate O-atom from a neighbouring molecule (Cu1···O3, 3.217(4) Å. The GuH
+ cation is located in a pocket between the two neutral Gu ligands and is H-bonded to the anion.
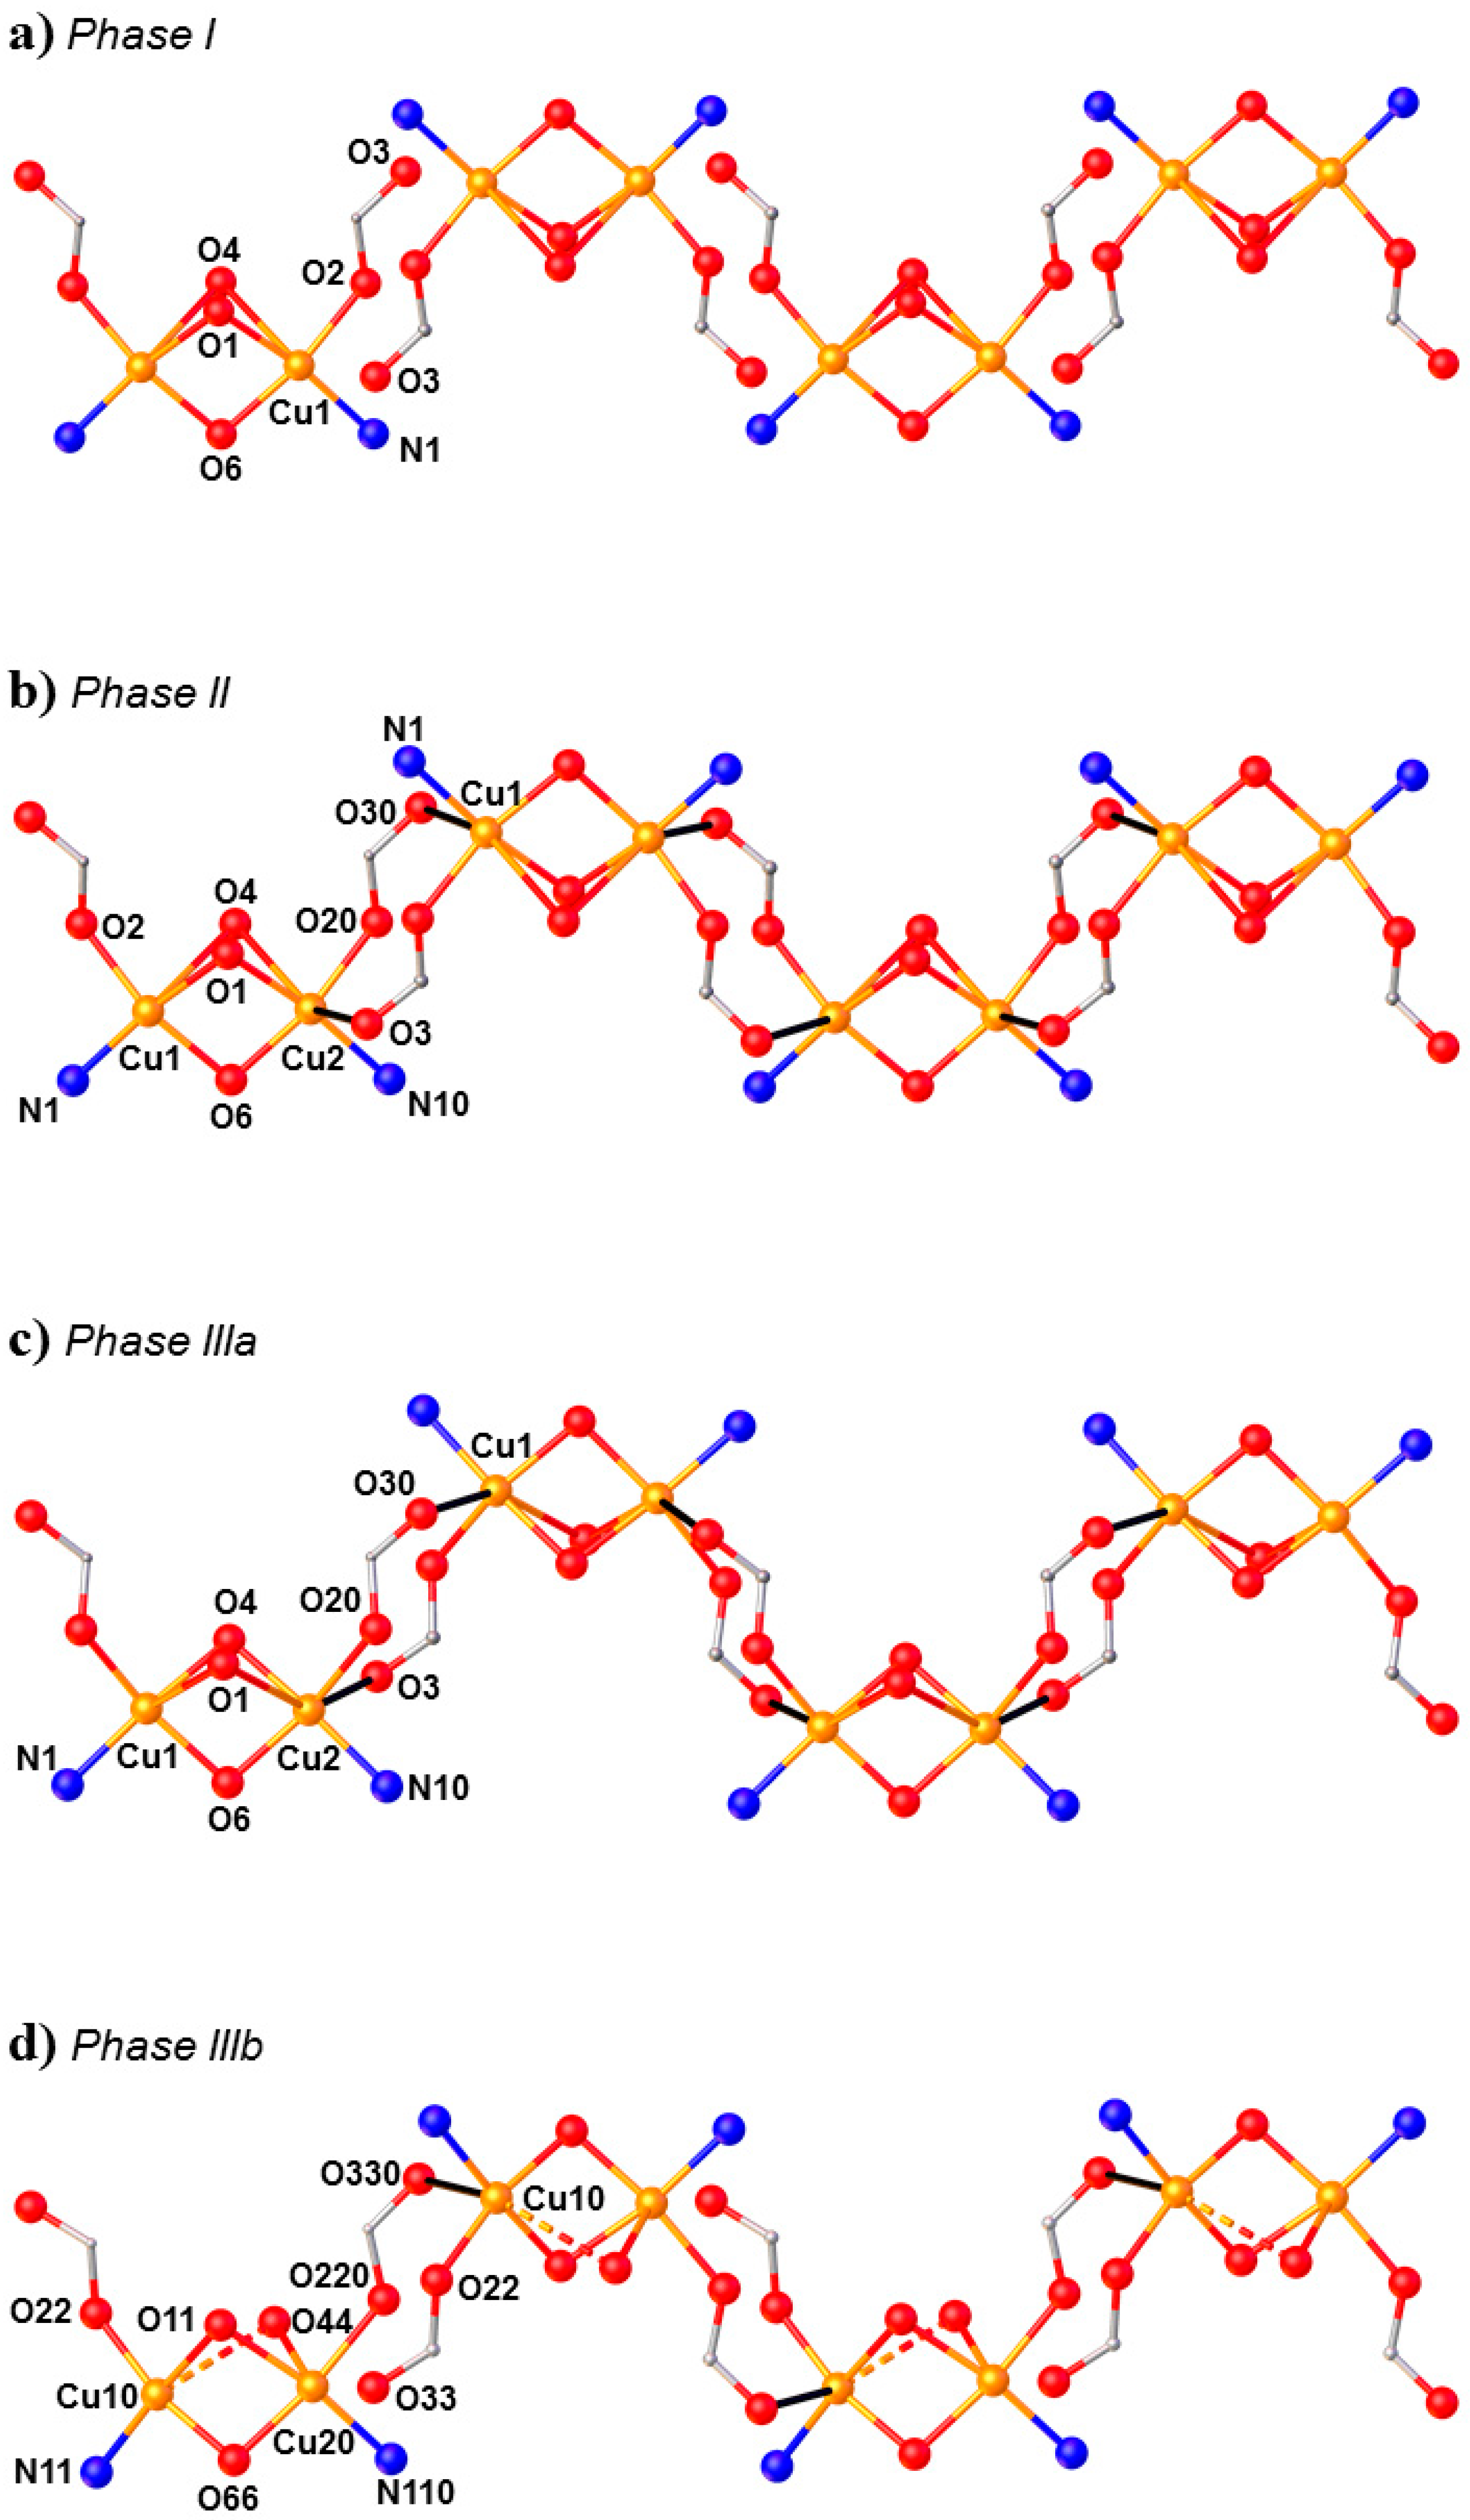
HP single-crystal XRD measurements were performed in pentane–isopentane at room temperature at four different pressures, to a maximum of 4.23 GPa. Little intramolecular changes are seen to 1.8 GPa, but one significant intermolecular change is observed: the Cu1···O3 distance shortens by 0.264 Å to 2.953(2) Å. On increasing the pressure to 2.9 GPa, complex
7 undergoes a single-crystal-to-single-crystal phase transition to the non-centrosymmetric space group
P2
12
12
1 (Phase II). The Cu1···O3 contact is now defined by two independent interactions, Cu1···O30 (2.879(7) Å) and Cu2···O3 (2.610(6) Å), and the metal coordination environment changes from [4 + 1] → [4 + 2] with the long contacts now defined by the intramolecular Cu–O4 bond and the intermolecular Cu1–O30 (Cu2–O3) contact. The result of these changes is the formation of a polymer via the conversion of intermolecular contacts to intramolecular bonds (
Figure 10): the first example of the polymerisation of a transition metal complex with pressure. A second single-crystal-to-single-crystal phase transition occurs between 2.95 GPa and 4.23 GPa, this time to the centrosymmetric monoclinic space group
P2
1/
c, forming Phase III, which consists of two crystallographically independent polymeric chains. One of these chains (based on Cu1, Cu2) remains largely unchanged, while the other (based on Cu10, Cu20) undergoes significant rearrangement. Specifically, the bridging α-carboxylate ligand twists, forcing the Cu–O–Cu moiety to be more asymmetric, the Cu10–O44 and Cu20–O44 bonds measuring 2.816(7) and 2.497(7) Å, respectively. Simultaneously, one polymer-forming bond, Cu10–O330, shortens to 2.449(6) Å, while the second (Cu20···O33, 3.098(6) Å) breaks. Thus, while the integrity of the second chain is retained, the polymerisation only involves only one Cu
II centre, i.e., half the Cu
II ions become [4 + 1] coordinate again.
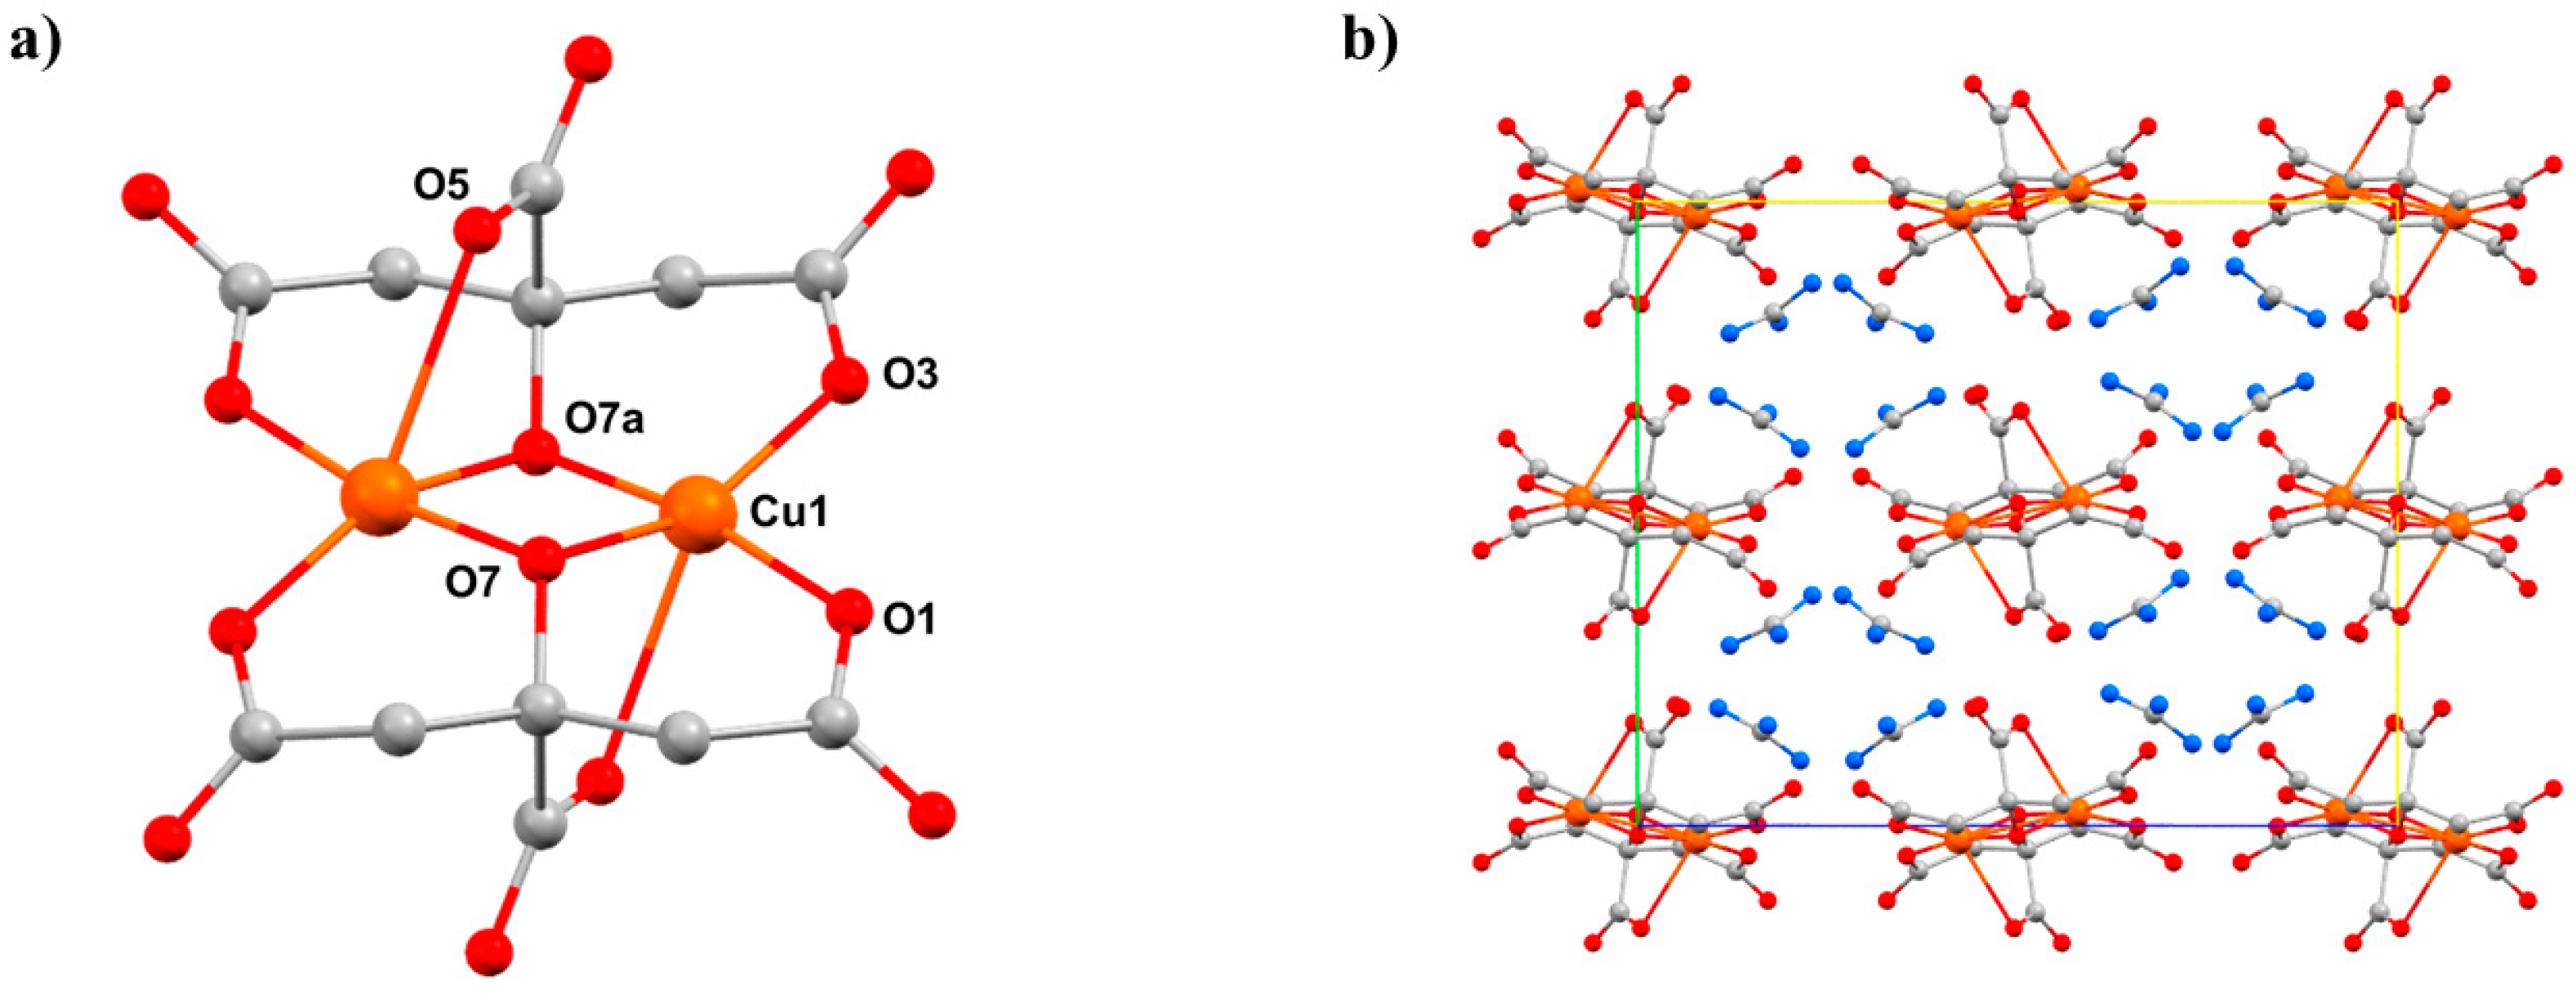
A second, structurally related citrate/guanidine-based Cu
II dimer, [GuH]
4[Cu
2(cit)
2]·2H
2O (
8), was also studied [
55]. Compound
8 (
Figure 11) crystallises in the orthorhombic space group
Pbca and consists of two symmetry equivalent Cu
II ions bridged by two alkoxide O-atoms (O7 and s.e.) from the citrate ligands, the metals being further coordinated by the β-carboxylate O-atoms from each ligand (O1, O3). The four-coordinate, pseudo-tetrahedral metal centre has approximate
D2d symmetry. In addition, each α-carboxylate group is oriented toward one of the Cu
II centres at a Cu1–O5 distance of 2.628(3) Å, with the O5–Cu–Cu angle being 73.05(6)°. Therefore, an alternative description of the coordination sphere of the metal centre is a highly distorted [4 + 1] geometry.
HP single-crystal XRD measurements were performed on
8 in a 1:1 mixture of pentane–isopentane to a maximum pressure of 2.20 GPa. The crystal packing of
8 consists of alternate layers of cations and anions (
Figure 11b), in which the GuH
+ ions direct an extensive hydrogen-bonding network with the citrate ligand O-atoms and lattice H
2O molecules. The main effect of applying pressure is a compression along the direction of the layer-stacking in the
b-axis (which also contains the largest voids), which decreases in length by 8.9% to 2.20 GPa (14.713(9) Å → 13.4098(7) Å). The shortening of the
a and
b axes allied to the diamond-like packing motifs formed by the guanadinium cations causes the
c axis to lengthen, which is an early example of negative linear compressibility in molecular solids. The most significant intramolecular change is in the Cu-O5 distance, which decreases from 2.628(3) Å at ambient pressure to 2.407(3) Å at 2.20 GPa. Therefore, the metal geometry is now 5-coordinate [4 + 1] with approximate
C4v symmetry. Interestingly, the Cu–O5 bonds also lie along the
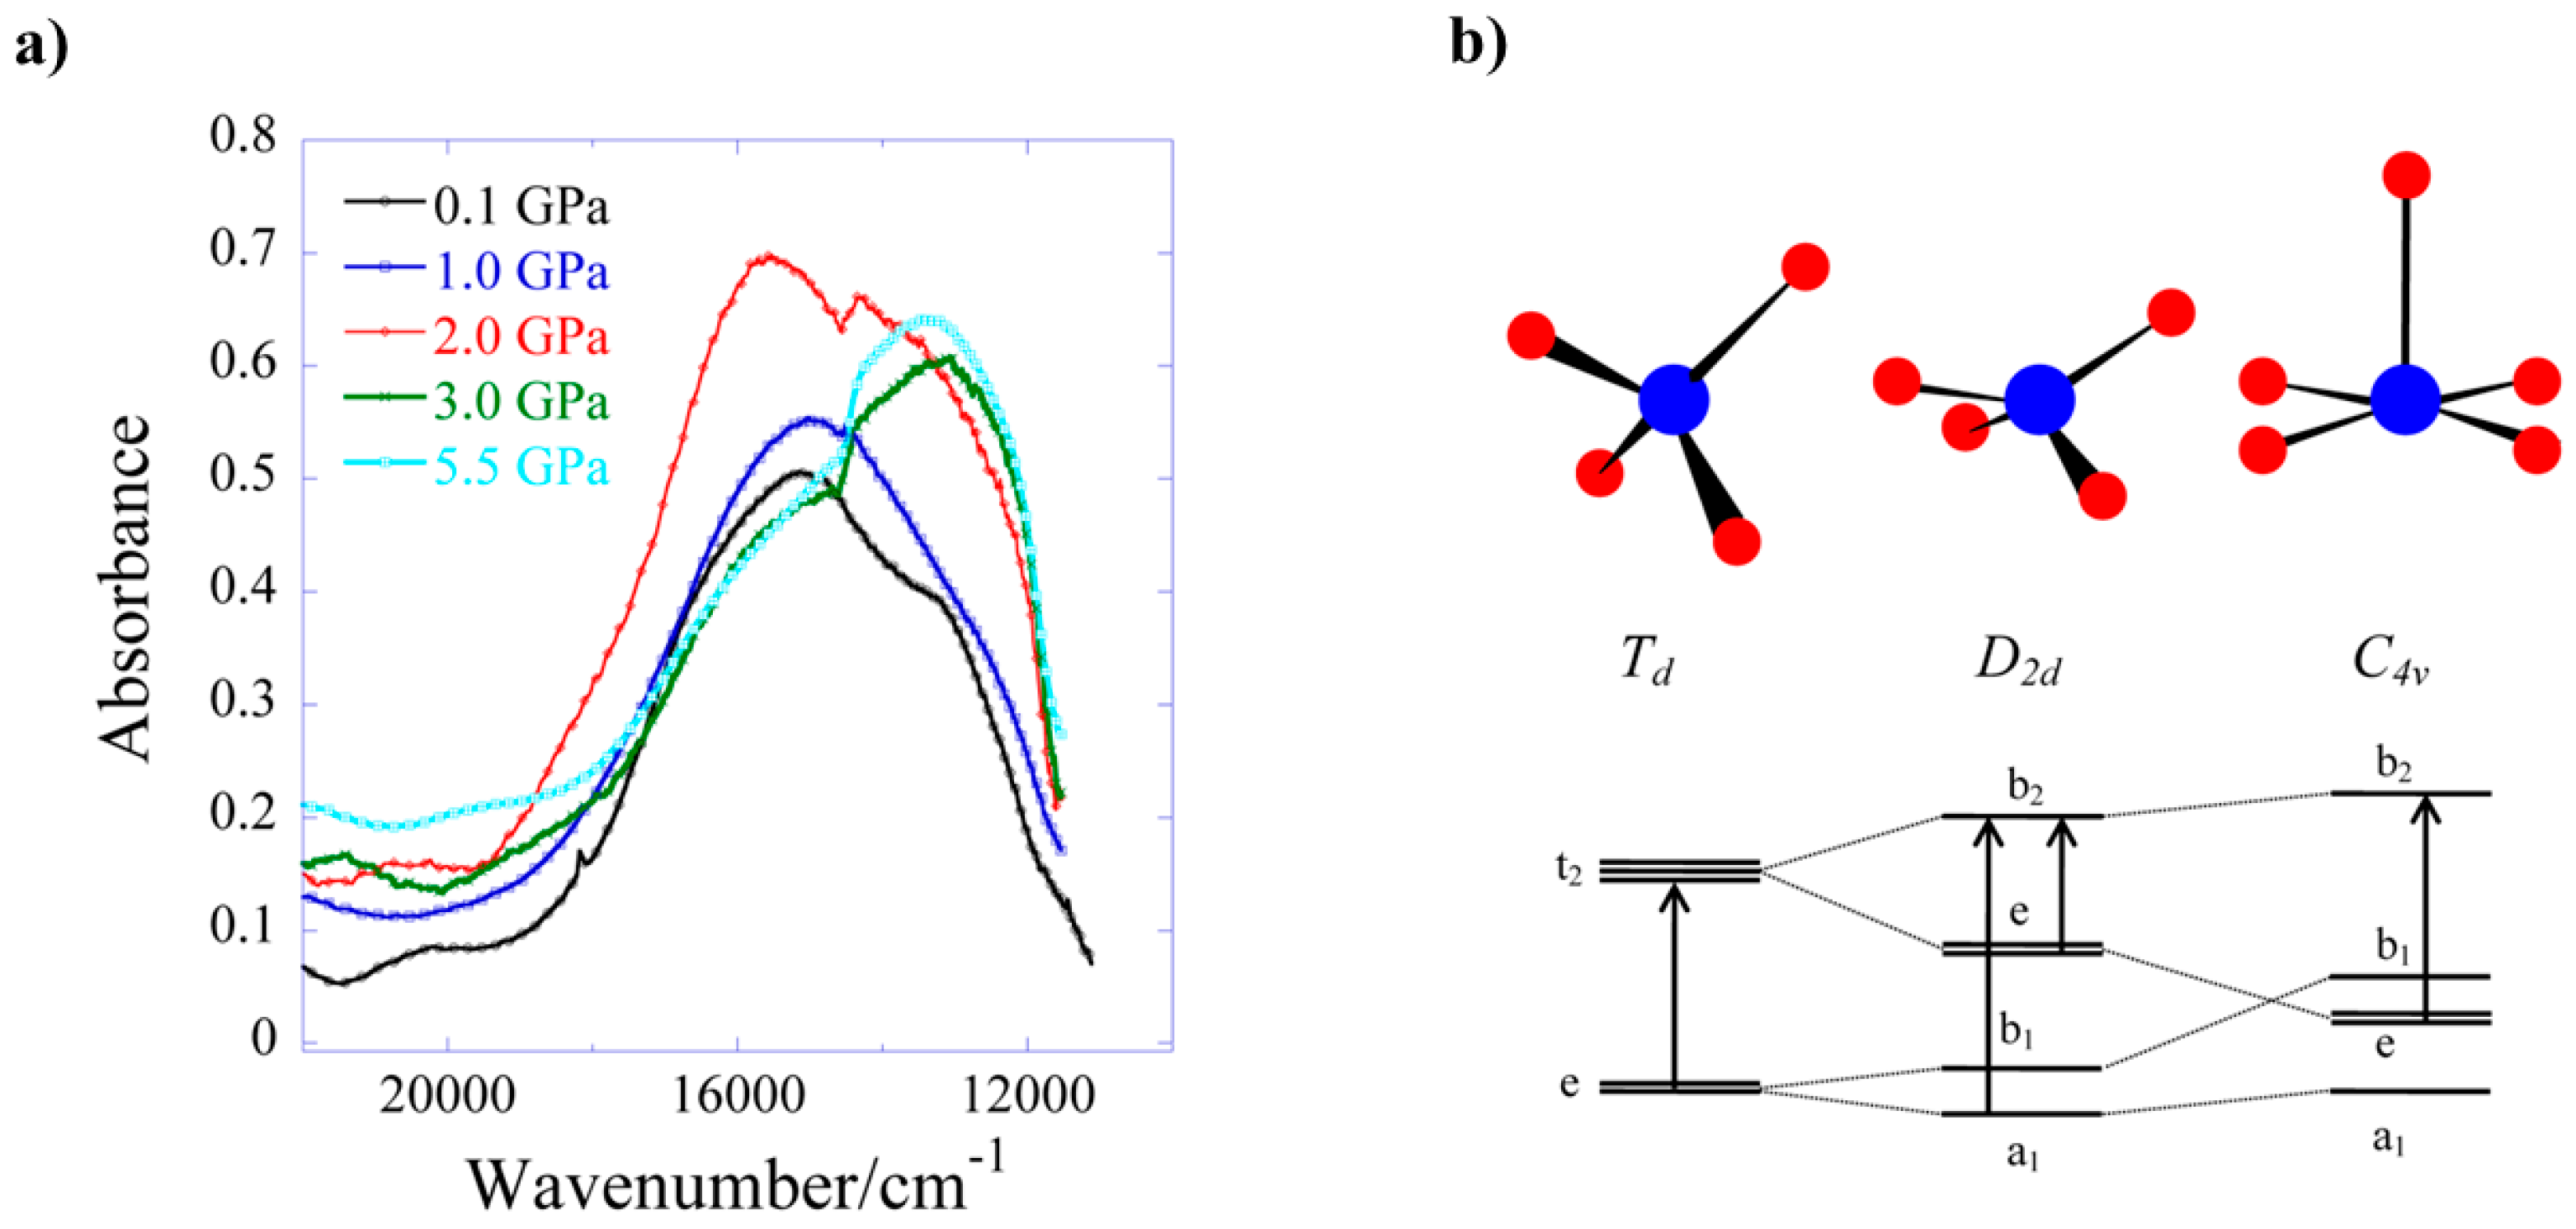
b-axis, meaning that the largest intramolecular compression correlates with the largest intermolecular compression. HP single-crystal electronic spectroscopy measurements reveal that
8 undergoes a colour change from blue to green, which is due to a reduction in absorption in the 18,500–14,000 cm
−1 region. This is directly related to the reduction in the Cu–O5 bond length and the rearrangement of the Cu coordination sphere. The d–d spectrum (
Figure 12) at ambient pressure consists of two bands at 15,300 and 12,800 cm
−1, which are observed in the full pressure range to a maximum of 5.5 GPa. Both bands blue shift linearly with pressure at a rate of 140 and 100 cm
−1 GPa
−1, respectively. The 15,300 cm
−1 band intensity decreases with pressure and almost disappears above 2.5 GPa. The intensity ratio in the 0–2.5 GPa range decreases in line with the reduction in the Cu–O5 distance, suggesting this to be chiefly responsible for the observed piezochromism. The main effects observed in the electronic spectra can be explained in terms of simple monomeric Cu
II units (
Figure 12b). At ambient pressure, the Cu–O5 interaction is weak, and though the Cu site symmetry is
C1, the spectrum can be interpreted by considering a pseudo-tetrahedral (
D2d) 4-coordinate Cu moiety, showing two allowed transitions (e → b
2 and a
1 → b
2). At higher pressures, the Cu–O5 interaction becomes much shorter, and the spectrum can be interpreted by considering a single allowed transition in the (
C4v) 5-coordinate Cu moiety (e → b
2). In short, the gradual reduction of the ‘axial’ Cu–O bond length induces a continuous transformation of the local Cu site symmetry from approximately
D2d at ambient pressure to approximately
C4v, in which e → b
2 is the only allowed transition.
The complexes [Cu
2(OH)
2(H
2O)
2(tmen)
2](ClO
4)
2 (
9, tmen = tetramethylethylenediamine), [Cu
2(OH)
2(tben)
2](ClO
4)
2 (
10, tben = di-
tbutylethylenediamine), and [Cu
2(OH)
2(bpy)
2](BF
4)
2 (
11, bpy = 2,2′-bipyridine) are part of a large family of hydroxo-bridged Cu
II dimers that have been studied since the 1970s when Hatfield and Hodgson first developed a quantitative magneto-structural correlation relating the bridging Cu
II–O–Cu
II angles in the diamond-shaped [Cu
2(µ-OH)
2] core to the magnitude of the exchange interaction [
56]. Complex
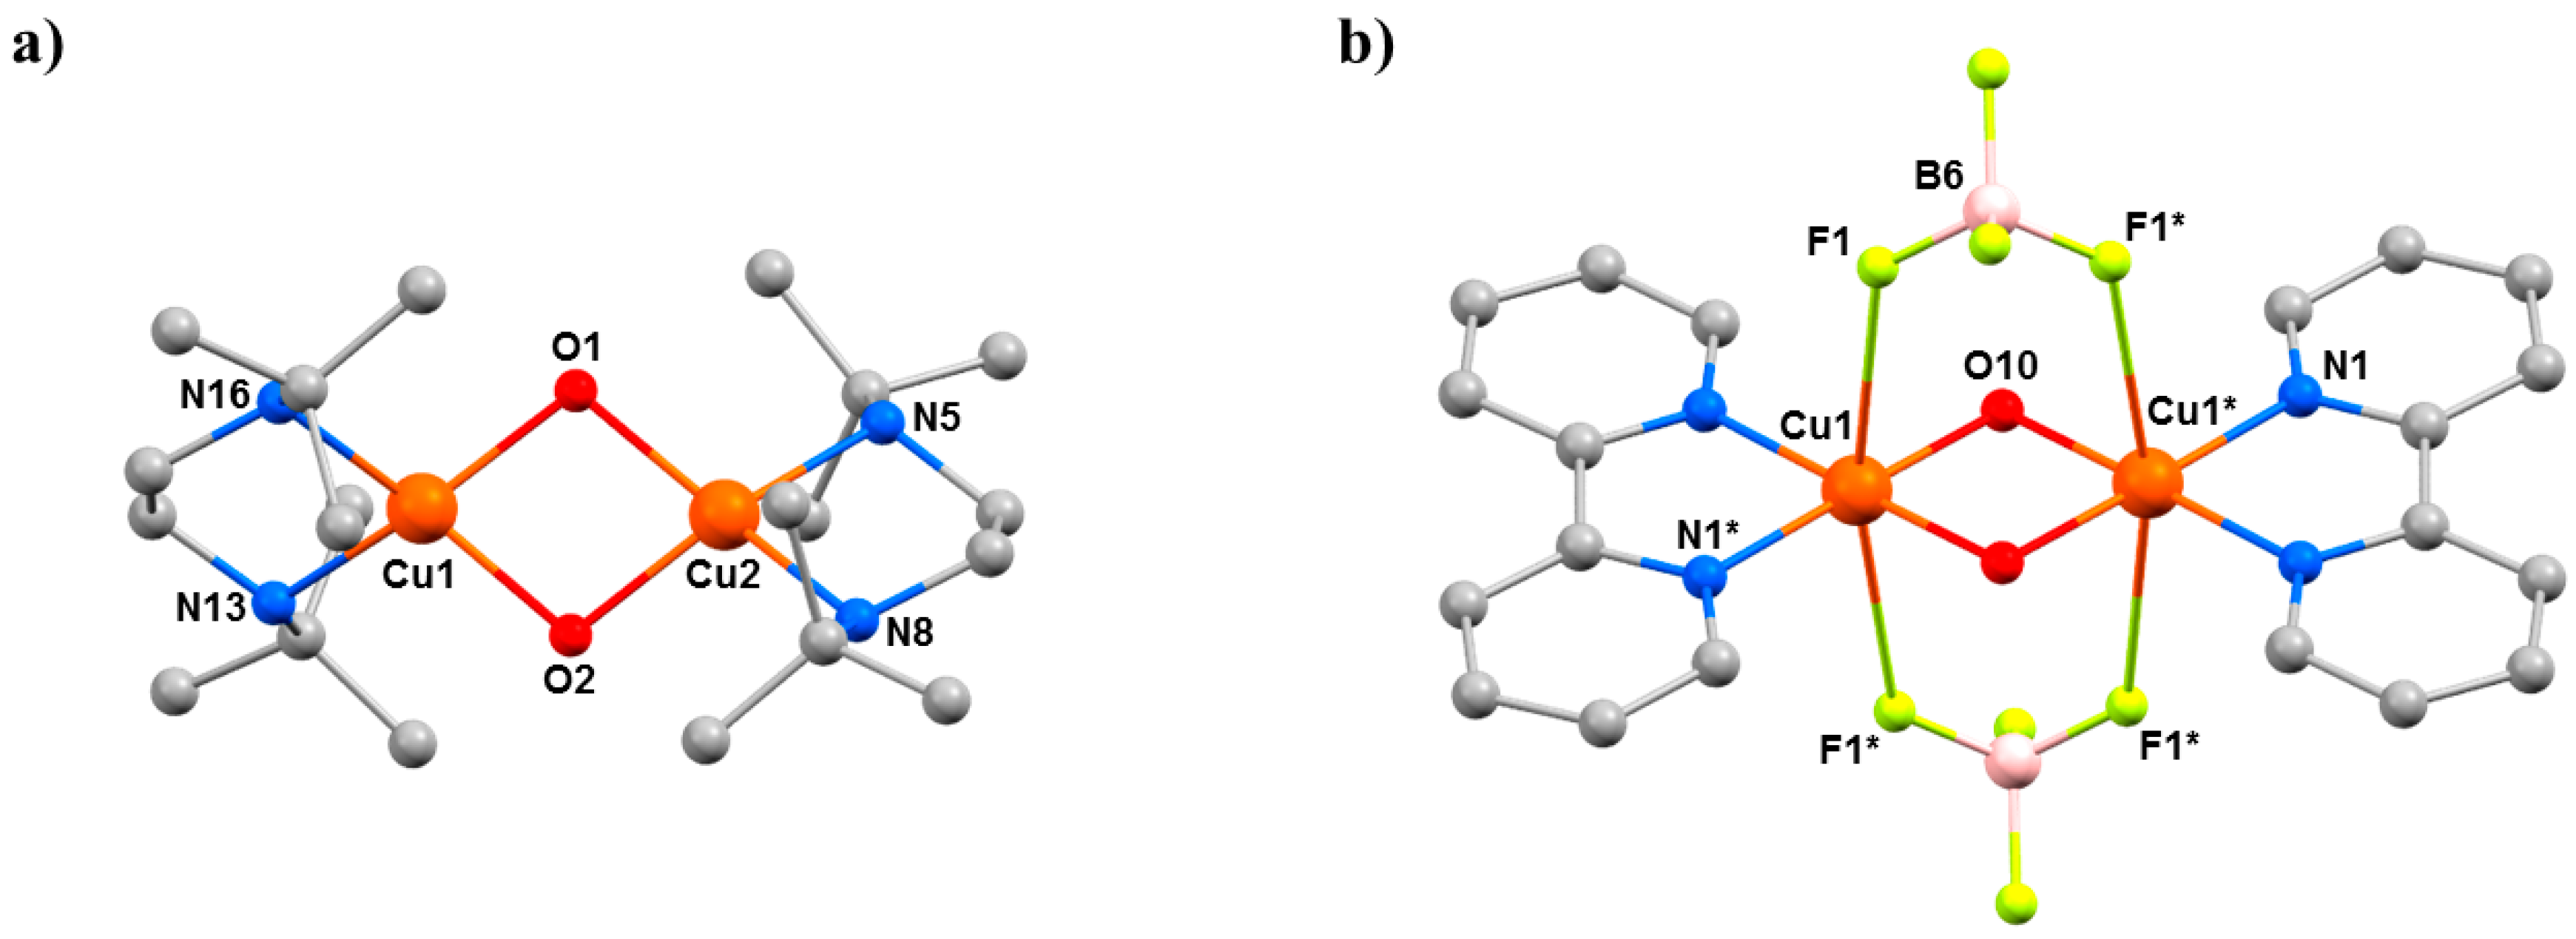
9 (
Figure 13) has each Cu
II ion in a [CuO
3N
2] square pyramidal coordination sphere, while in
10, the bulky
tBu groups of the tben ligands force the geometries of the metal ions to be intermediate between square planar and tetrahedral, with additional solvent ligation impossible, such that the Cu
II ions are four coordinate with [CuO
2N
2] coordination spheres (
Figure 14a). The Cu
II ions in
11 are in a JT distorted [CuO
2N
2F
2] octahedral geometry, with the F–Cu–F vector defining the JT axis (
Figure 14b). The Cu–O–Cu angles are 102.03(13)° in
9, 102.72(6)° and 101.62(6)° in
10, and 97.40(14)° in
11. At ambient pressure, they crystallise in the monoclinic space groups
P2
1/
c (
9),
C2/
c (
10), and
C2/
m (
11).
HP single-crystal XRD measurements were performed using petroleum ether as hydrostatic medium [
57]. Data were collected at 0.25, 0.70, 1.20, and 2.50 GPa for
9, at 0.21 and 0.90 GPa for
10, and at 0.30, 0.80, 1.53, 2.25, 2.80, 3.50, 4.00, 4.30, and 4.70 GPa for
11. Crystals of
10 and
11 remain in the same space group in the full pressure range, whereas complex
9 undergoes a phase transition between 1.20 and 2.50 GPa from monoclinic
P2
1/
c to triclinic
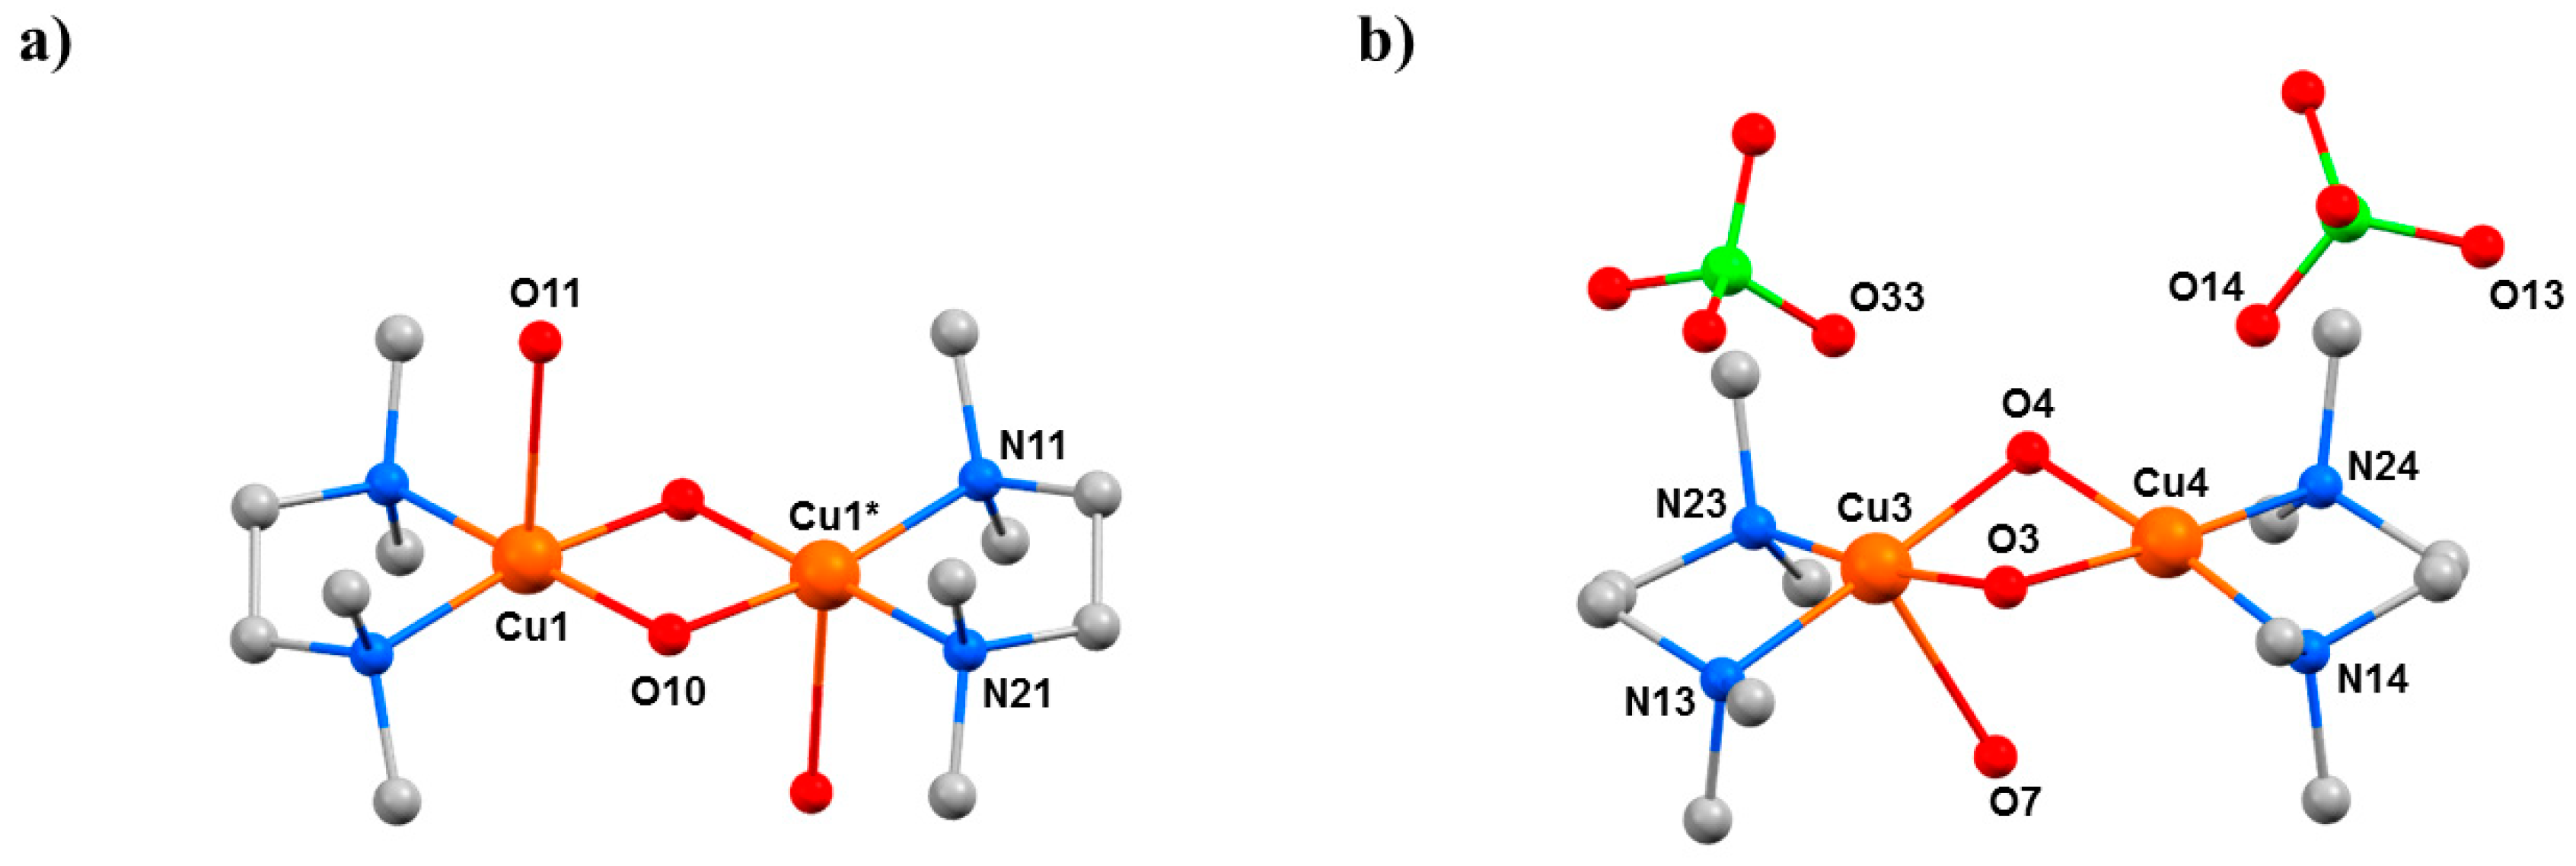
P-1. In all cases, the primary effect of applying pressure is a reduction of the unit cell, the compressions being assigned to the removal of void space due to the absence of any significant intermolecular interactions. The secondary effect is intramolecular. In
9, the Cu–O–Cu angle becomes smaller, from 102.03(13)° to 99.7(7)° at 1.20 GPa, with a concomitant shortening of the Cu···Cu distance from 2.9784(12) Å to 2.939(3) Å (
Table 6). At ambient pressure, one H
2O molecule is bonded to each Cu
II ion, which is approximately perpendicular to the Cu
2O
2 plane (Cu–Cu–O = 91.41(16)°;
Figure 13), but it becomes severely distorted at higher pressures (Cu–Cu–O = 80.4(7)°). The reason for this bending appears to be the shortening of the intermolecular O(ClO
4)···O(H
2O) distance to just 3.50 Å. Further increases in pressure lead to a phase transition from the monoclinic space group
P2
1/
c to the triclinic space group
P-1 between 1.20 and 2.50 GPa, with the asymmetric unit now containing two full dimers and four perchlorate anions. The loss of symmetry is caused by the elimination of one H
2O molecule from half the dimers, producing two different complexes: one with two H
2O molecules (one bonded to Cu1 and Cu1*) and one with only one H
2O molecule (bonded to Cu3;
Figure 13). This was the first reported example of pressure-induced H
2O elimination. In both dimers, the decreasing Cu···Cu distance with increasing pressure continues, reaching 2.914(3) Å for Cu1–Cu1* and 2.849(9) Å for Cu3–Cu4 at the highest pressure (2.5 GPa) measured.
Complexes 10 and 11 are less affected by the application of pressure. In 10, the Cu···Cu distance decreases from 2.9784(3) Å at ambient pressure to 2.908(7) Å at 0.90 GPa, with the Cu–O–Cu angles changing from 102.76(6)° and 101.62(6)° to 99.3(10)° and 104.2(11)°. The shortening of the Cu···Cu distance is likely due to the contraction of the bond between Cu2 and the two bridging hydroxide ions decreasing from 1.9198(12) Å to 1.77(3) Å, thus becoming one of the shortest CuII–OH distances ever reported. The presence of the two BF4– anions in 11 results in a more rigid structure, reducing the effect of applying pressure. The Cu–F distances decrease from 2.775(2) Å to 2.503(3) Å (ambient pressure → 4.7 GPa), the Cu···Cu distance changes from 2.8663(17) Å to 2.8210(19) Å, and the Cu–O–Cu angles decrease from 97.40(14)° at ambient pressure to 95.6(2)° at 4.7 GPa.
HP dc magnetic susceptibility data (
T = 350–20 K,
B = 0.1 T) were collected at ambient pressure to a maximum pressure of 0.84 GPa (
9), 0.87 GPa (
10), and 0.86 GPa (
11) using Daphne oil. Simulation of the susceptibility data at ambient pressure reveals strong antiferromagnetic exchange in
9 and
10 (
J = −260 cm
−1 and
J = −252 cm
−1, respectively) and moderate ferromagnetic exchange in
11 (
J = +22 cm
−1). The
χmT value for complexes
9 and
10 at low temperatures (up to 90 K) are 0 cm
3 mol K
−1 at all pressures. As the temperature increases, the
χmT value of
9 increases, following different paths as a function of the applied pressure, reaching a maximum value of 0.28 cm
3 mol
−1 K at ambient pressure and 0.39 cm
3 mol
−1 K at 0.84 GPa. The data follow a similar trend for complex
10 with
χmT changing from 0.30 cm
3 mol
−1 K to 0.34 cm
3 mol
−1 K (ambient pressure → 0.87 GPa) at
T = 350 K. This behaviour reveals a weakening of the antiferromagnetic interaction between the Cu
II ions. The parameters obtained from the simulations at different pressures (
Table 7) show that
J decreases from −260 cm
−1 to −203 cm
−1 for
9 and from −252 cm
−1 to −228 cm
−1 for
10 with increasing pressure, which is in agreement with magneto-structural correlations developed for [Cu
2(OH)
2] dimers in which decreasing Cu–O–Cu angles, Cu–O, and Cu···Cu distances are all expected to decrease |
J| [
58]. HP susceptibility measurements of
11 show a small increase in the
χmT value with increasing pressure, with
J increasing from +22.0 cm
−1 at ambient pressure to +29.4 cm
−1 at 0.86 GPa.
Previous HP powder XRD (PXRD) and magnetic susceptibility measurements on the coordination polymer [Cu
IIF
2(H
2O)
2(pyz)] (
12, pyz = pyrazine) had shown successive structural phase transitions and a pronounced change in the effective dimensionality of the extended Cu
II···Cu
II exchange interactions from 2D to 1D [
59]. To further complement this study, we performed detailed HP single-crystal XRD and HP single-crystal electron paramagnetic resonance (EPR) spectroscopy on
12 in order to provide direct information regarding any pressure-induced reorientation of the JT (
) axes and magnetic (
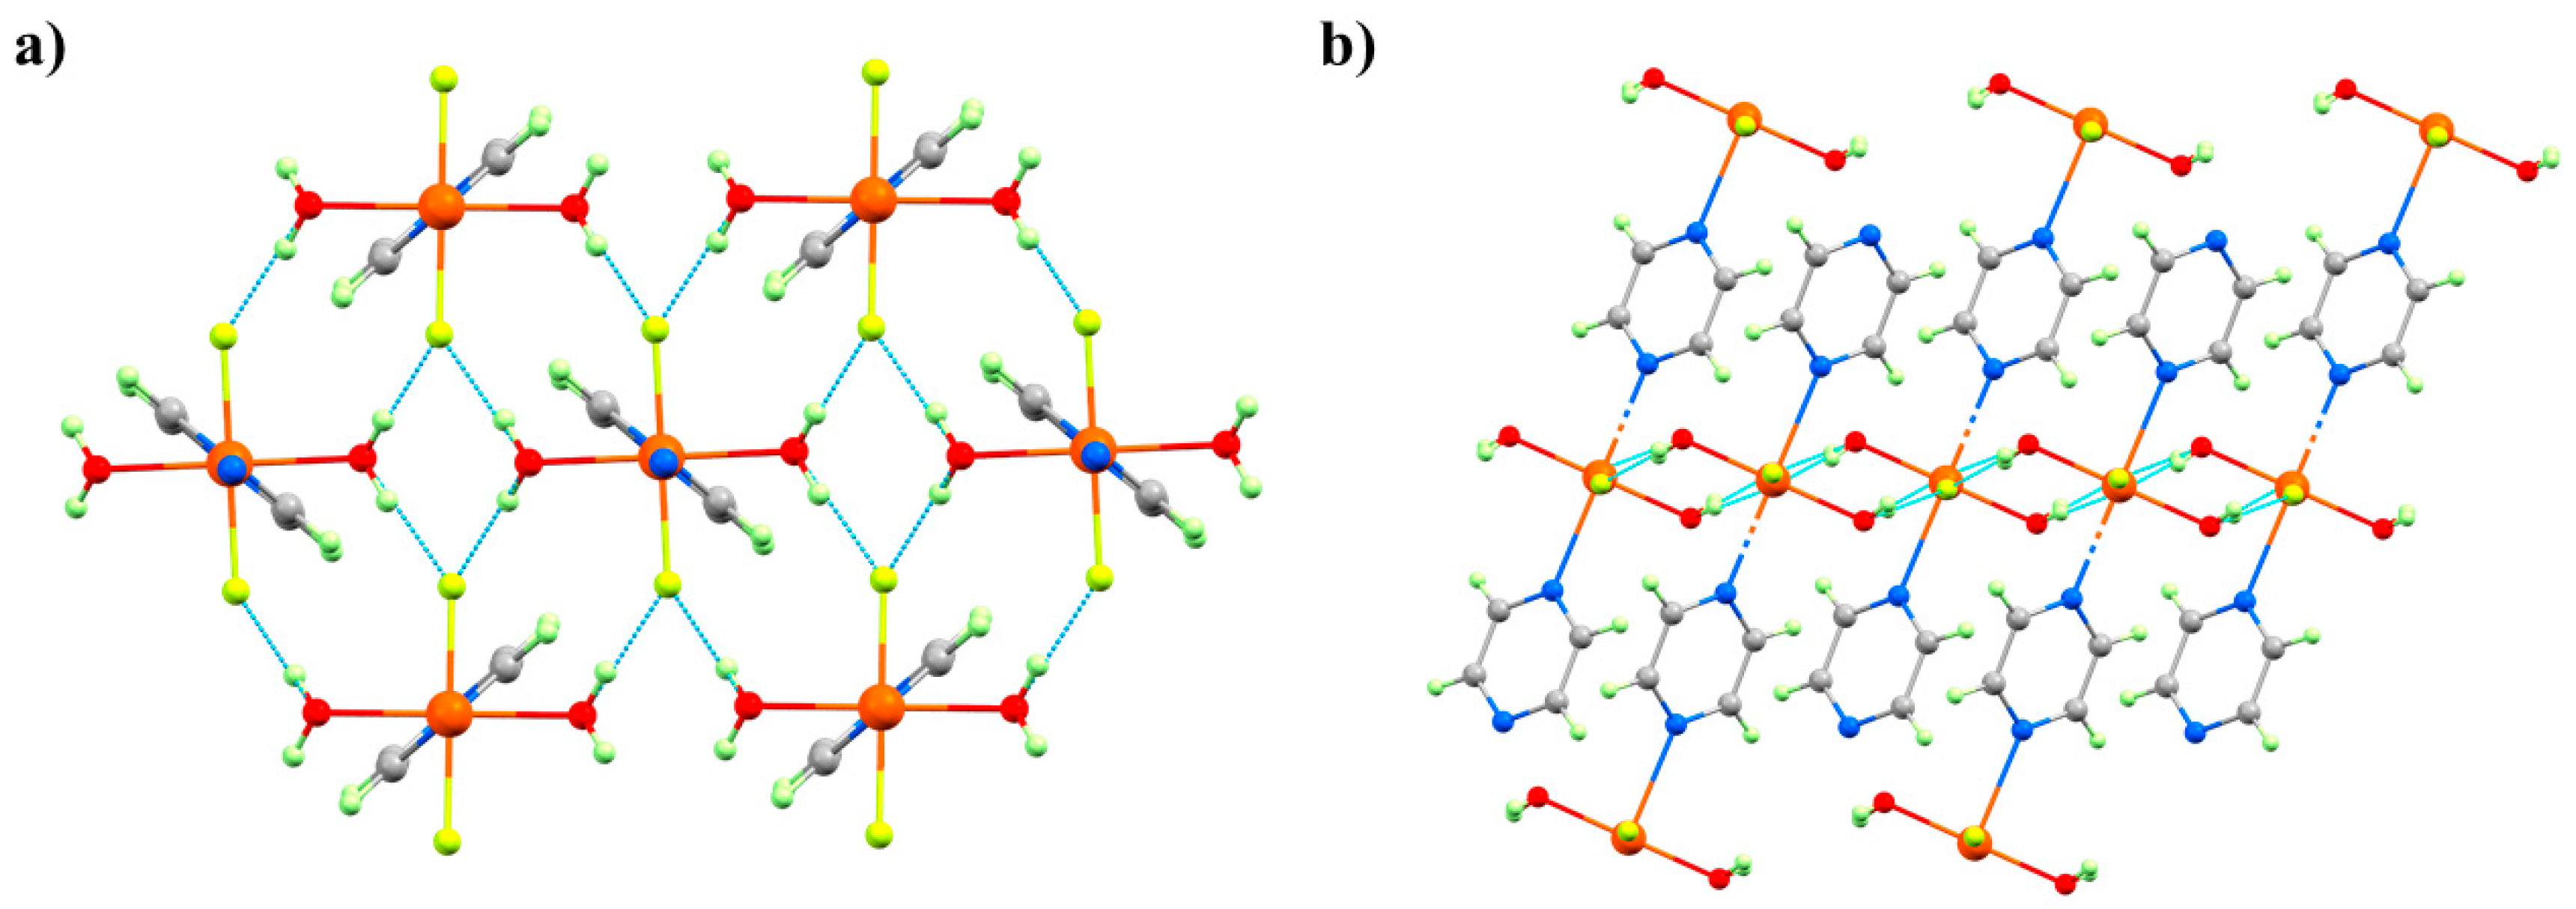
) orbitals. At ambient pressure, complex
12 crystallises in the monoclinic space group
P2
1/
c with one Cu
II ion in the asymmetric unit (
Figure 15). The six-coordinate, JT distorted octahedral Cu
II ion is bonded to two O-atoms (1.984(4) Å) from the two H
2O ligands, two F
- ions (1.908(4) Å), and two N-atoms (2.454(6) Å) from the pyz ligands. The latter define the orientation of the JT axis, whereby the pyz ligands direct the formation of 1D chains along the
a-axis of the unit cell. In the
bc plane, these chains are linked into a 2D network by short Cu–OH···F–Cu H-bonds (2.623(4) Å and 2.607(4) Å). Therefore, the magnetic
orbital of the Cu
II ion lies in the CuF
2O
2 (
bc) plane, as confirmed by ambient low temperature magnetisation data, which show a 2D antiferromagnetic magnetic order with
TN = 2.54 K.
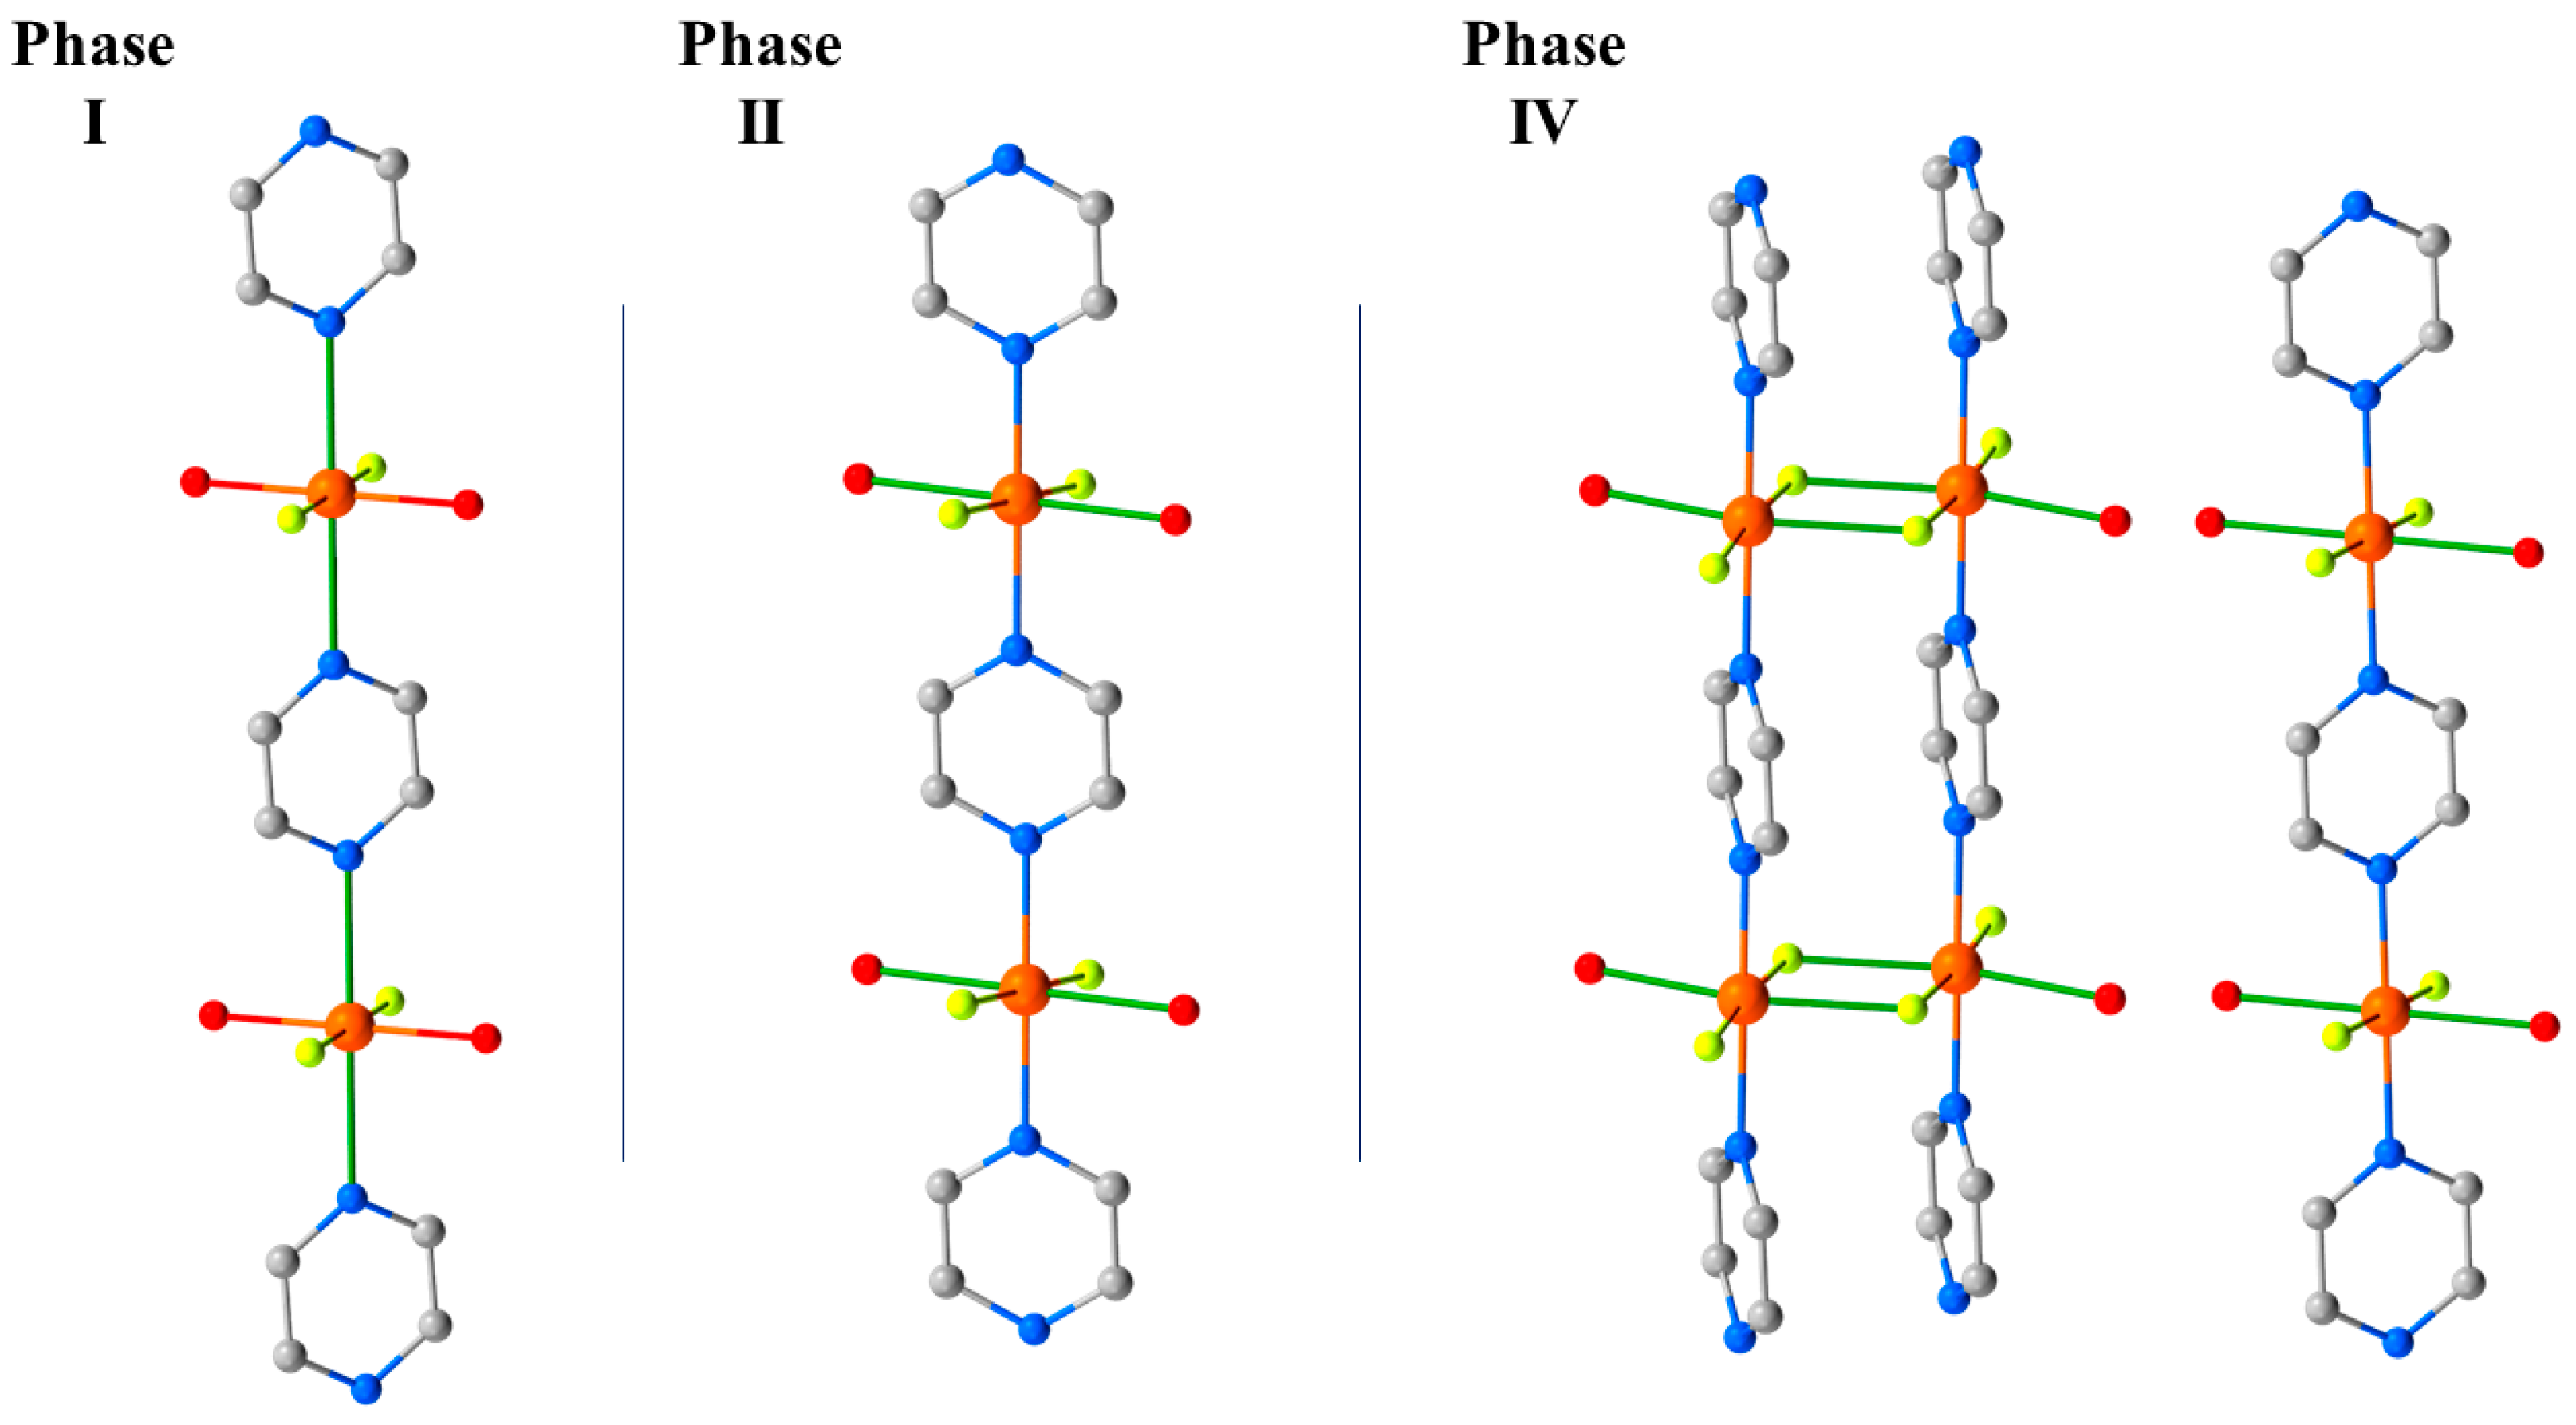
HP single-crystal XRD measurements were performed in petroleum ether, with room temperature data collected at 0.50, 0.90, 1.20, 1.80, 2.20, 2.50, 2.85, and 3.30 GPa [
60]. The initial effect of pressure is a compression of the unit cell, and while the Cu–N, F, and O distances do not change significantly up to 1.2 GPa; both Cu–OH···F–Cu hydrogen bonds compress to 2.515(13) Å. This value is exceptionally short for this type of interaction and hints at a build-up of strain in the
bc plane. At 1.8 GPa, the phase modification (Phase II) observed in the PXRD measurements occurs. The crystallographic symmetry is maintained, but the Cu–N bond lengths decrease by approximately 0.4 Å to 2.039(3) Å, and the Cu–O bonds increase by 0.3 Å to 2.316(3) Å. This reflects the reorientation of the JT axis from the N–Cu–N direction to the O–Cu–O direction, and it means the magnetic
orbital is now oriented along the 1D pyrazine chains. This structural reorganisation simultaneously relieves the tension in the OH···F hydrogen bonds, which increase to 2.702(3) and 2.626(3) Å, respectively.
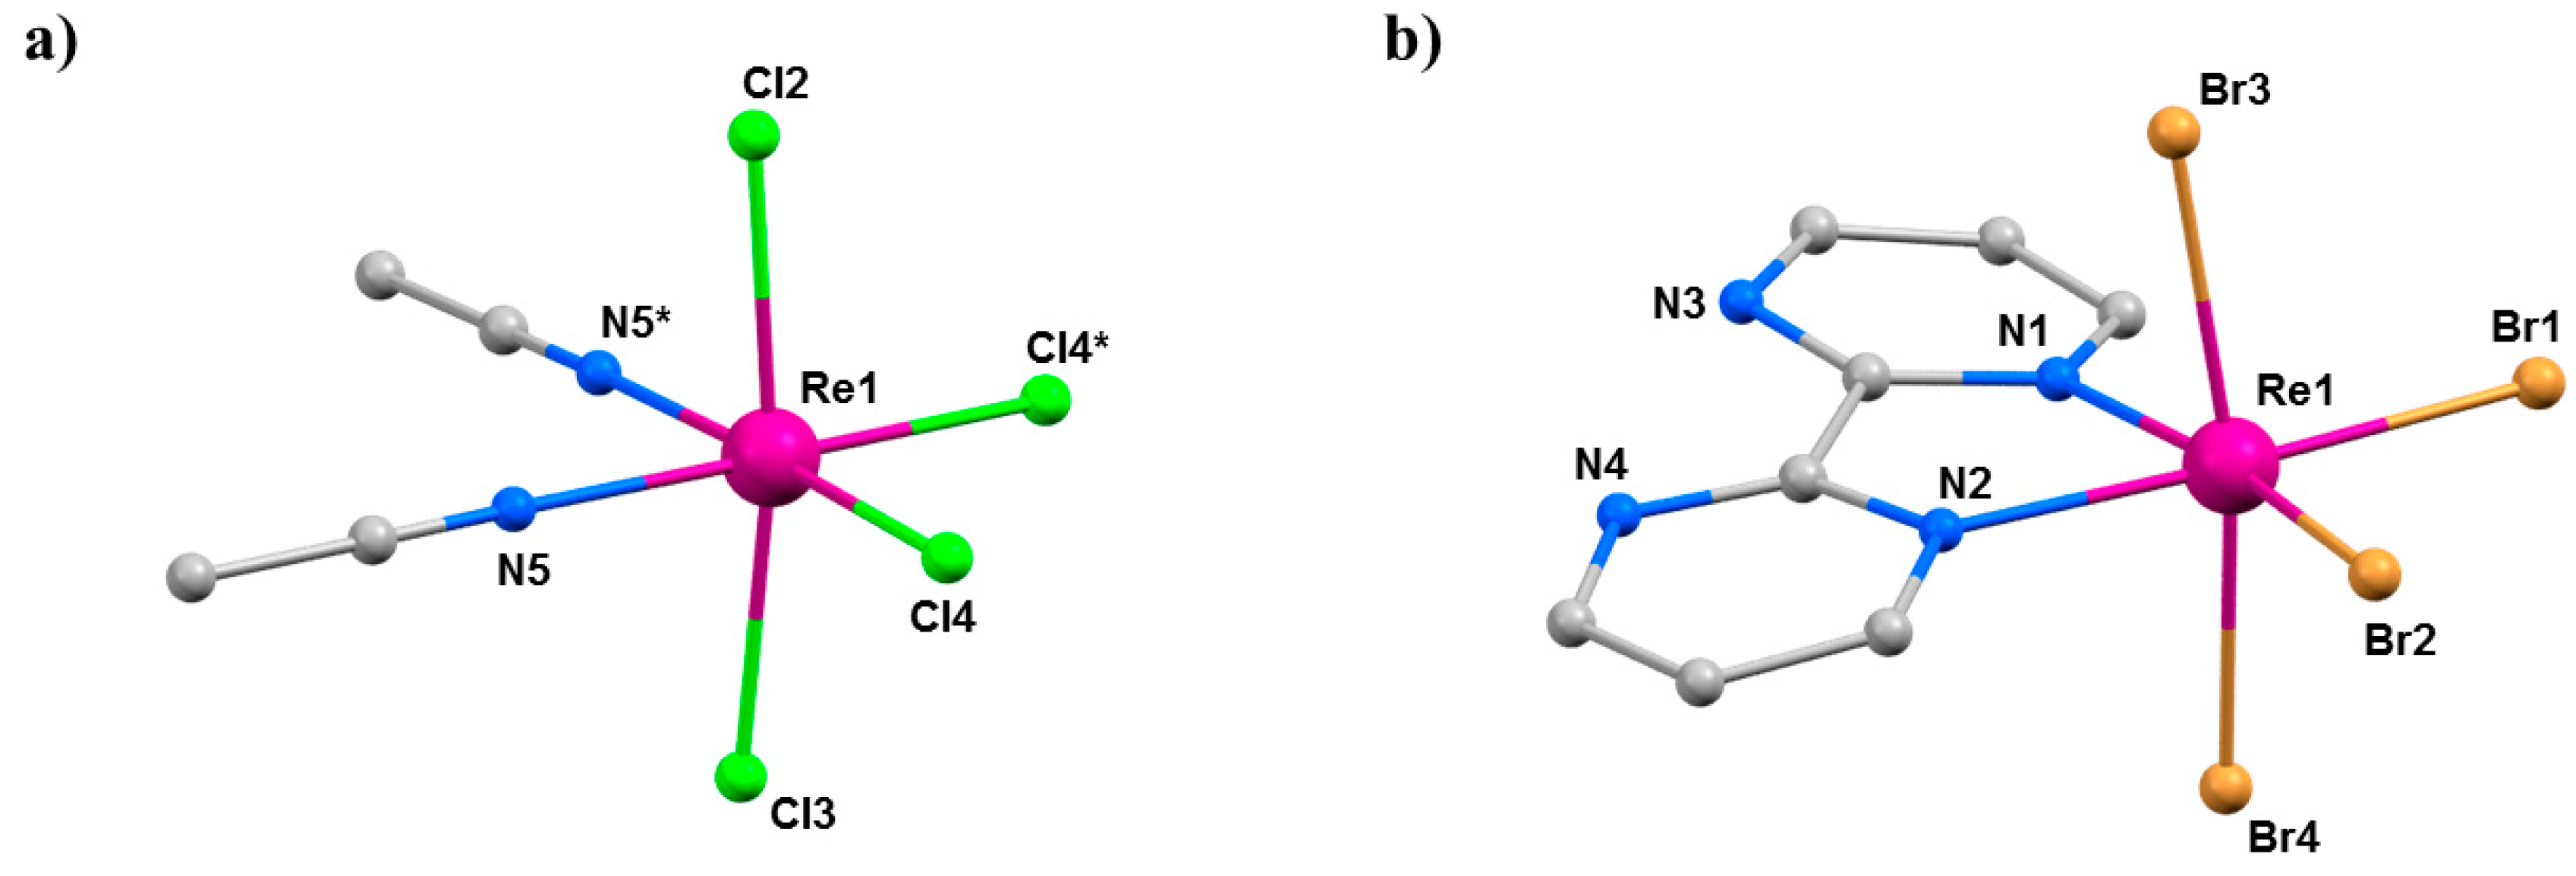
12 undergoes a second, even more disruptive, pressure-induced phase transition between 2.85 and 3.30 GPa to the triclinic space group
P-1 (Phase IV). During this transition, one H
2O molecule per Cu unit from two-thirds of the chains is lost, forcing a dimerisation of the chains through the F
- ions (
Figure 16). The remaining one-third of the chains are unchanged. Interestingly, and in contrast to
3 where the solvent was ejected from the lattice, the expelled water molecules remain in the crystal lattice and sit between the monomeric and dimeric chains, which are held in place by the OH···F H-bonding network. In Phase IV, the JT axes are now oriented along the O–Cu–F bonds (Cu2-O1, 2.22(3) Å, Cu2-F6*, 2.28(2) Å), and adjacent Cu ions within the dimerised chains are now bridged directly by F
- ions (Cu2–F6, 1.908(18) Å; Cu2–F6–Cu2*, 103.0(8)°). A separate study has revealed a third transformation route at 3.3 GPa which leads to a phase in which the chemical connectivity and orientation of the JT axes in Phase II were retained but its symmetry is reduced to triclinic, and the orientation of the pyrazine ligands changes [
61].
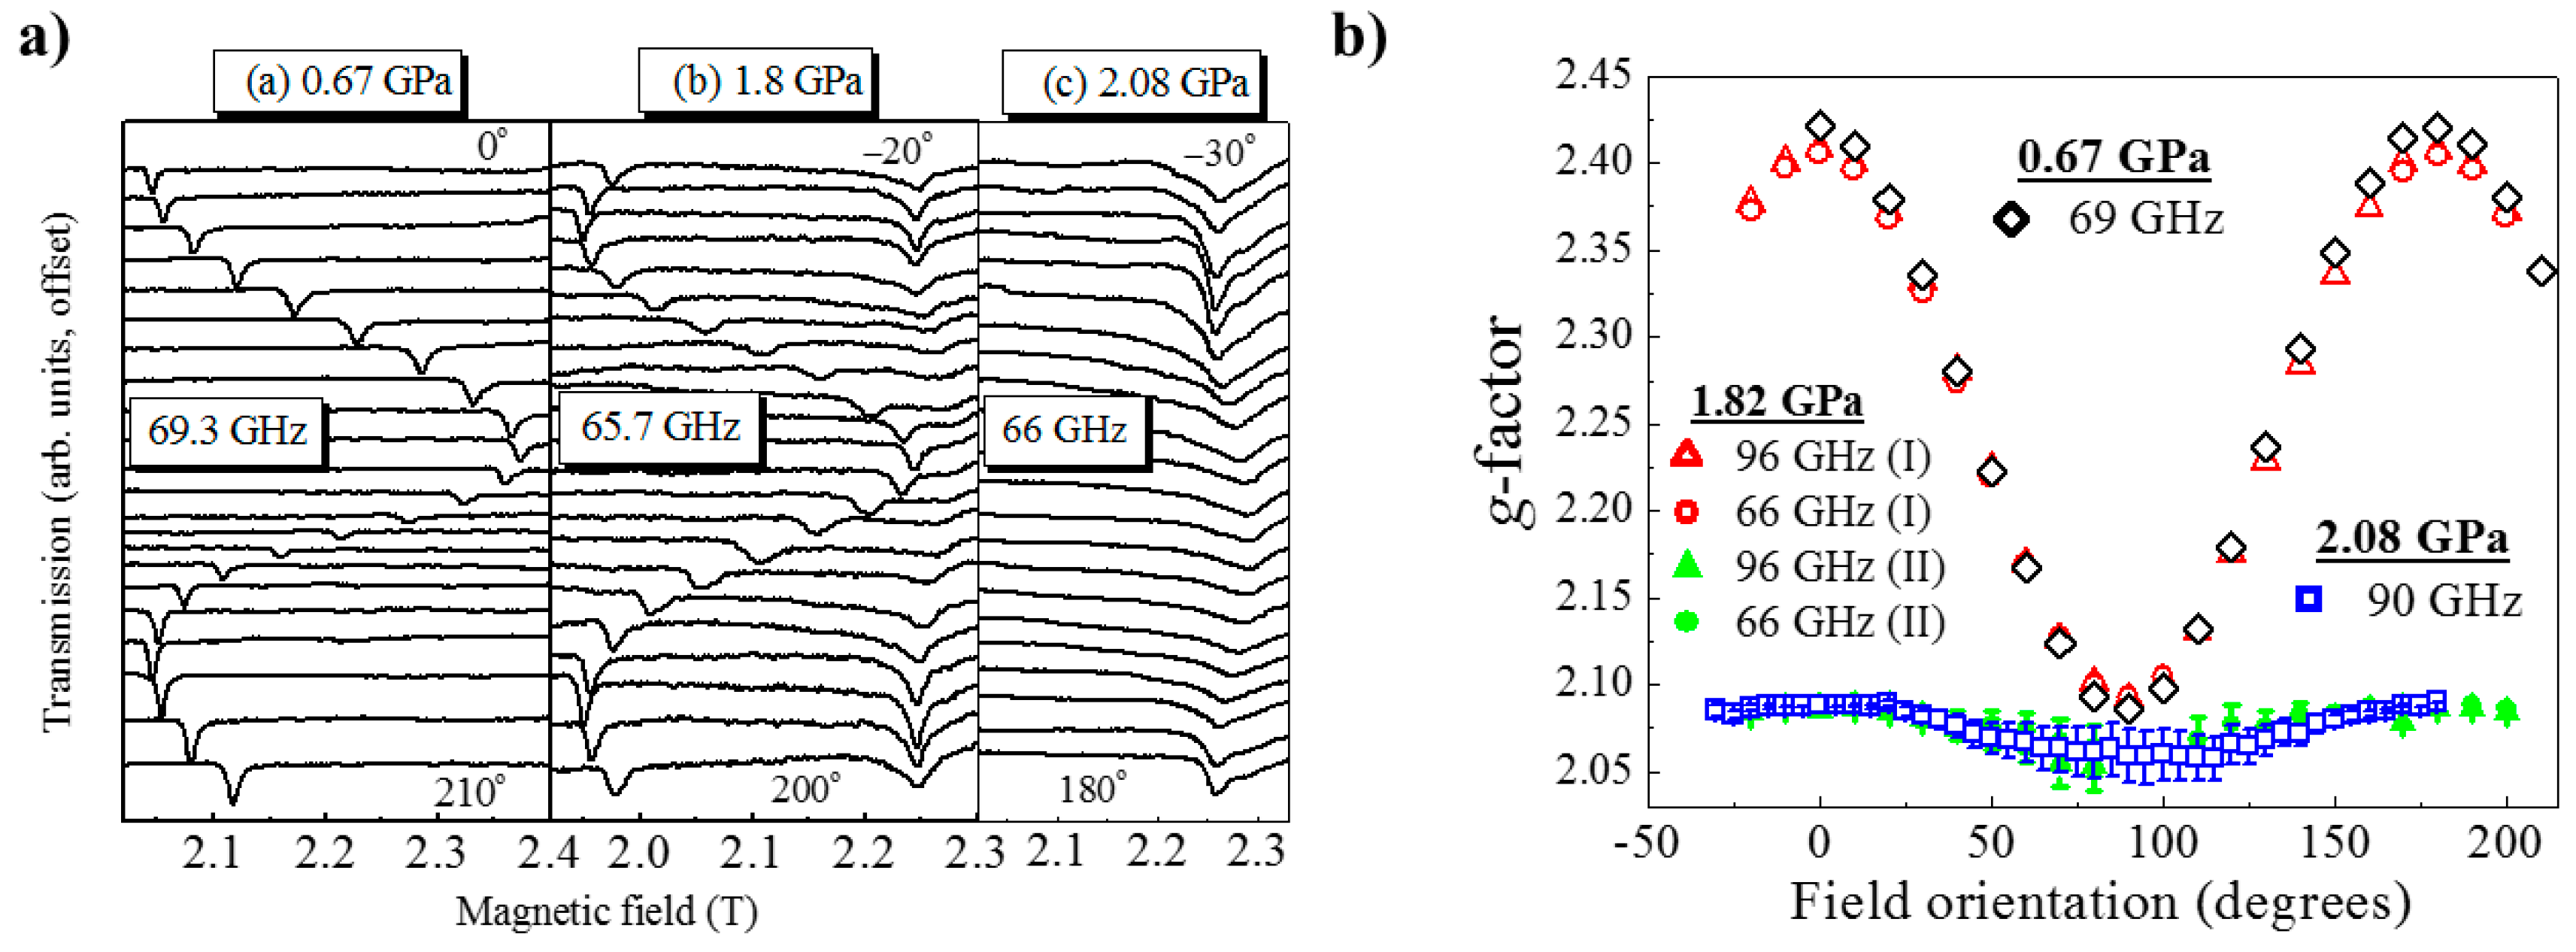
HP single-crystal EPR measurements at 0.67 GPa (
Figure 17) as a function of field orientation at 69.3 GHz and 10 K show a single, sharp peak with strong angle dependence and
g-value extrema of
g|| = 2.42 and
g⊥ = 2.08. The former corresponds to the direction parallel to the JT axis. At 1.82 GPa and 65.7 GHz two signals are observed, one with a similar angle dependence to the low-pressure signal and a second with a weaker angle dependence and
g-values in the 2.05–2.10 range. This corresponds to field rotation within the plane of the
orbital, i.e., the ⊥ orientation. Measurements at 96 GHz (
Figure 17b) also suggest that part of the sample has transformed to Phase II, i.e., the mechanism of the phase transformation occurs in domains rather than via a concerted transition over the whole crystal; this is local information only visible through spectroscopy and not recognised from the crystallographic data, which yields only an average structure. The strongly angle-dependent signal vanishes completely upon increasing the pressure to 2.1 GPa, and the EPR intensity is observed only in a single, broad low
g-value signal that displays weak angle dependence. This is direct evidence that the magnetic
orbital has switched from the CuF
2O
2 plane to the CuF
2N
2 plane. Access to the pressure at which the second phase transition was observed (i.e., to Phase IV) was beyond the technological capabilities of the plastic EPR cells.
4. Ni Compounds
Research in the field of Single-Ion Magnets (SIMs) has focussed on achieving precise control over the coordination geometry of a single paramagnetic (d-/f-block) metal ion in order to construct a specific ligand field that generates first order spin-orbit coupling (SOC) [
62,
63,
64]. An attractive option for HP measurements is Ni
II, for which a range of 4-/5-coordinate, air-/moisture-stable species are known. For example, ambient pressure magnetic measurements and HF-EPR studies performed on both oriented single crystals and powder samples of the complex [Ni(MeDABCO)
2Cl
3](ClO
4) (
13, MeDABCO = 1-methyl-4-aza-1-azoniabicyclo[2.2.2]octanium) had shown it to possess |
D| ≥ 400 cm
−1 [
65]. Given that |
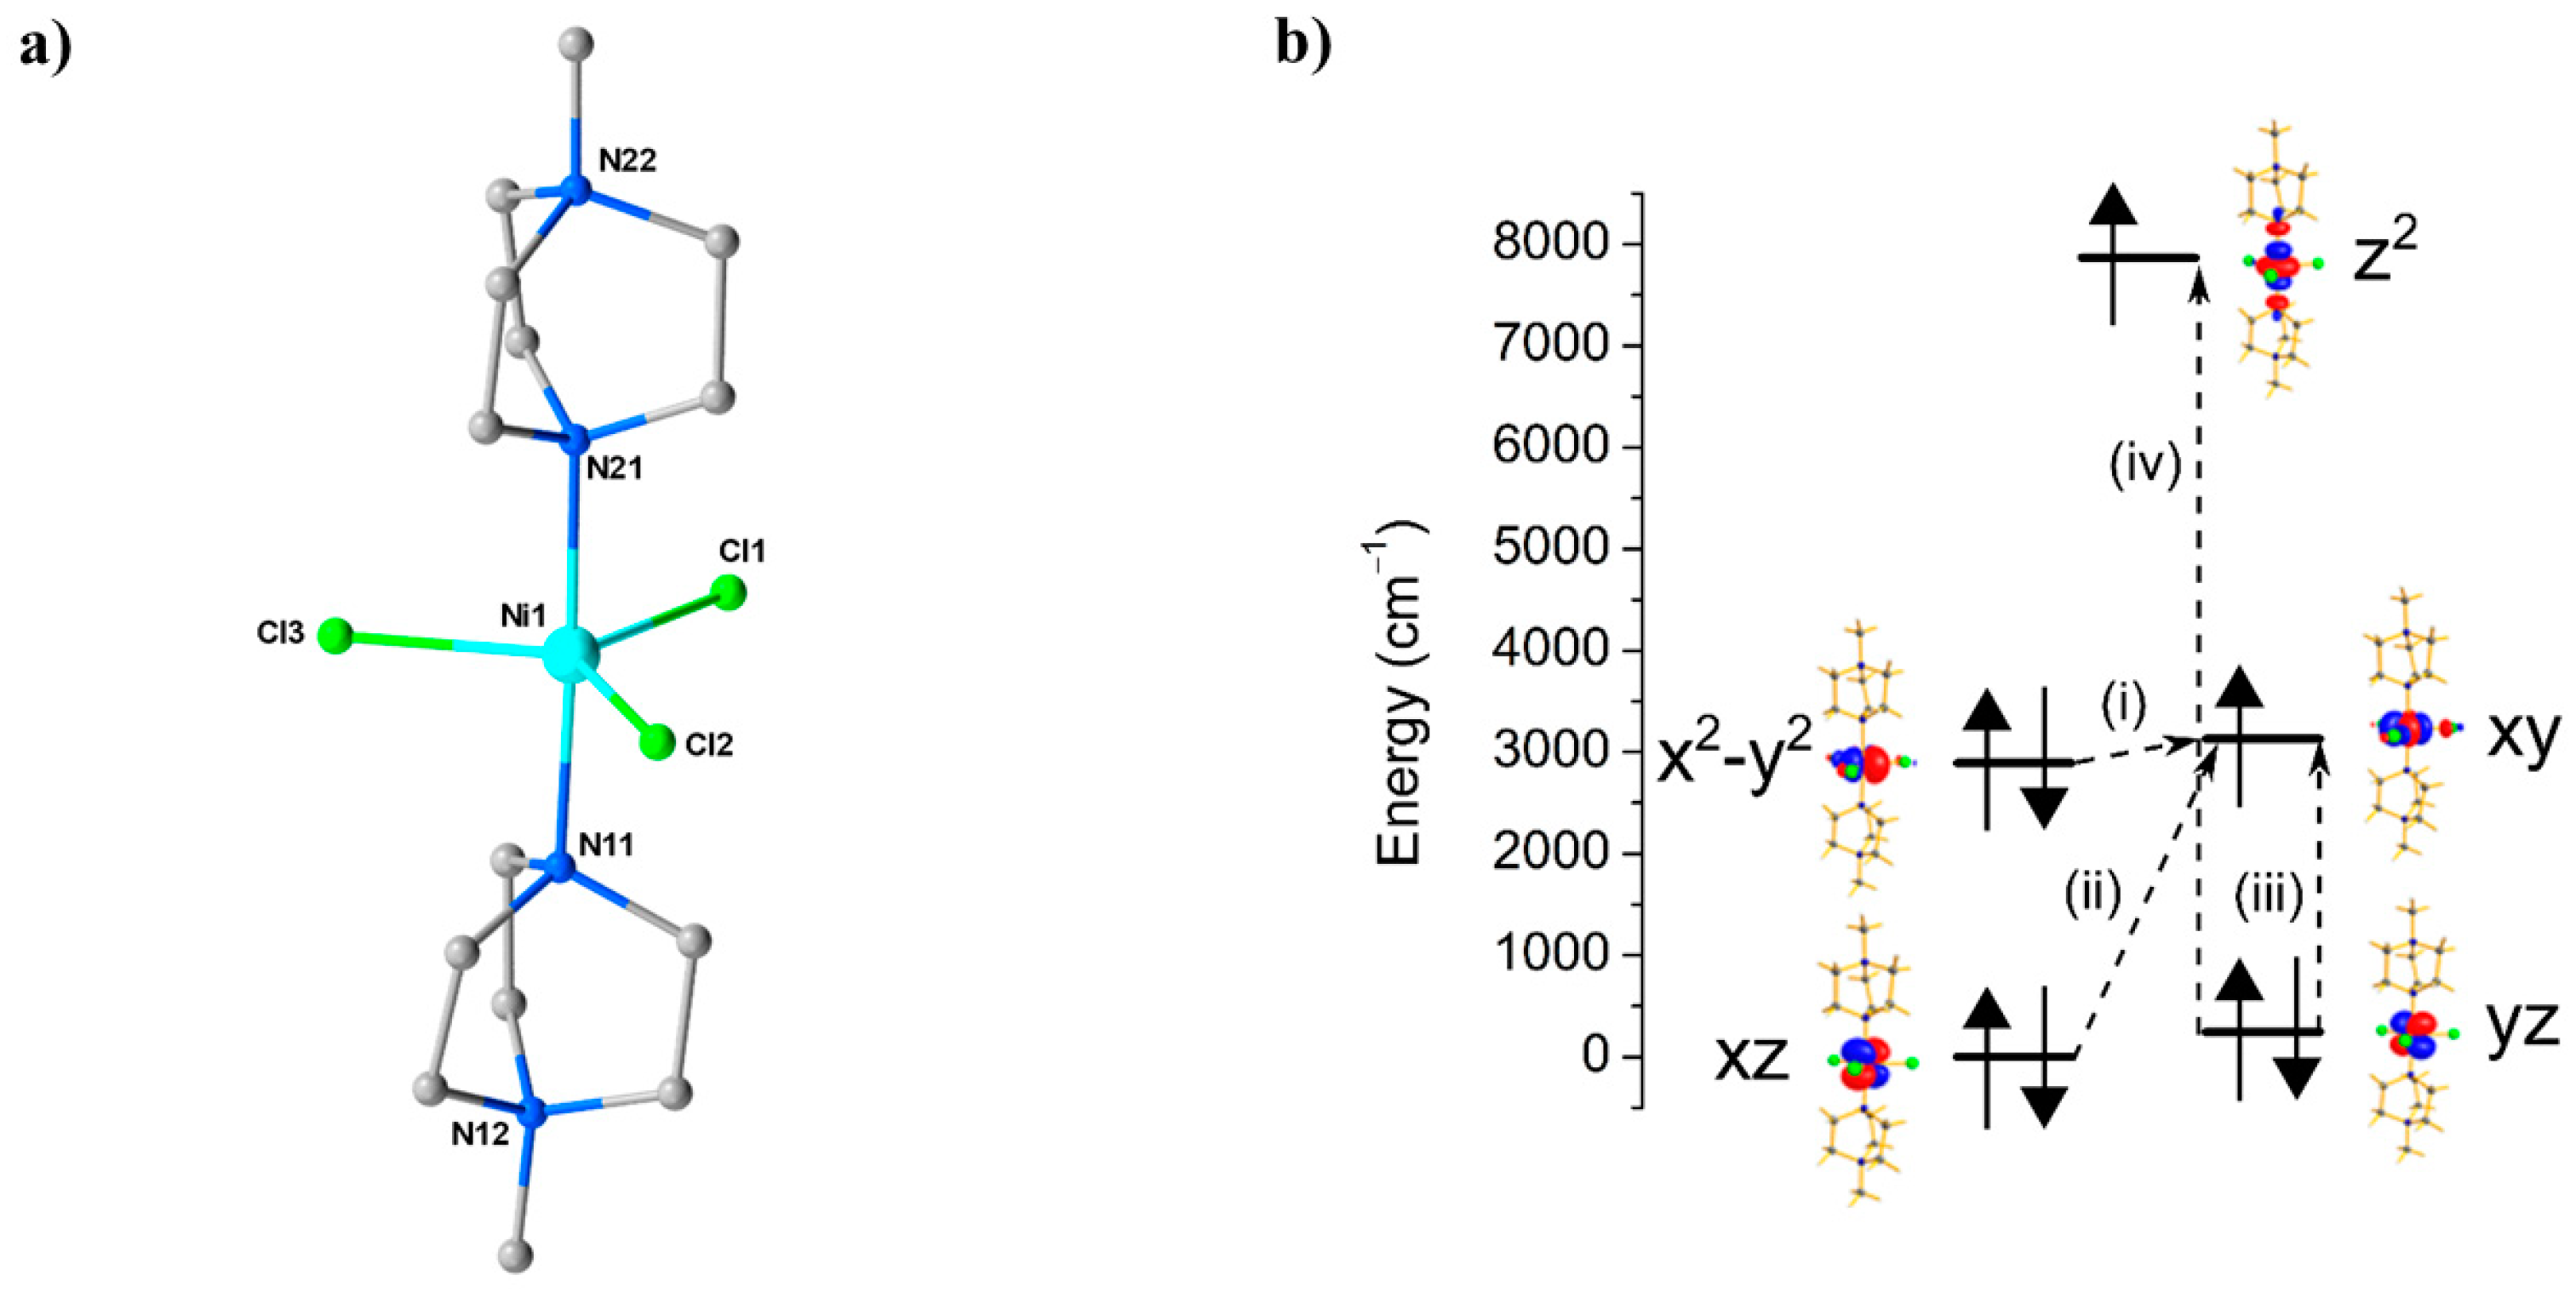
D| is highly sensitive to changes in coordination geometry, it appeared to be an ideal candidate to explore the effects of pressure. Complex
13 (
Figure 18) crystallises in the orthorhombic space group
Pca2
1. The structure describes a simple 5-coordinate, slightly distorted trigonal prismatic Ni
II ion bonded to two axial MeDABCO
+ ligands and three equatorial Cl
- ions (
Table 8). The structural distortions away from ideal
D3h symmetry arise from the JT effect, which splits the degeneracy of the
−
and
−
pairs of orbitals [
66].
HP single-crystal XRD measurements were performed using Fluorinert FC-77 at four different pressures, to a maximum of 1.65 GPa; unit cell parameters were determined over the pressure range 0.58–3.51 GPa [
67].
13 remains in the same space group in the full pressure range without major changes in the relative orientation of the molecules in the lattice (the volume decreases from 2145.0(4) Å
3 at ambient to 1936.4(3) Å
3 at 1.65 GPa), and the effect of applying pressure on the bond lengths around the Ni
II ion is negligible (
Table 8). In contrast, there are significant changes to the equatorial bond angles: Cl1–Ni1–Cl2 and Cl2–Ni1–Cl3 increase to 124.3(1)° and 123.4(1)°, respectively, while Cl1–Ni1–Cl3 decreases to 112.3(1)°. A small decrease in the trans N–Ni–N angle is also observed (177.1(1)→176.2(2)°). The net result is a further lowering of the symmetry around the metal centre, as confirmed by continuous shape measures, which reveal
S(
D3h) = 0.09 at ambient pressure and
S(
D3h) = 0.23 at 1.65 GPa [
68].
Ab initio calculations performed on the four structures collected at 0.58, 0.90, 1.40, and 1.65 GPa were employed to extract the
zfs parameters (
D,
E) associated with the gradual loss of symmetry (
Table 9). At ambient pressure, the computed
DZZ axis is found to lie along the
pseudo-
C3 axis (the N–Ni–N direction), and the computed
gzz is found to coincide with this axis. The origin of the very large
D value is the closely lying
and
orbitals (their separation is approximately 239 cm
−1), which contribute −488 cm
−1 to the total
D parameter. Significant, but smaller, positive contributions stem from excitations from the
and
orbitals to the
orbital. Calculations on the structure collected at higher pressure suggest a decrease in
D by approximately one-third, from −399 cm
−1 at 0 GPa to −264 cm
−1 at 1.4 GPa, highlighting the extreme sensitivity of the magnetic anisotropy to small structural changes in the Cl–Ni–Cl angles (
Table 9). Specifically, these changes lead to a larger separation between the
and
orbitals, which directly correlates with a decrease in the major contribution to |
D|. This is accompanied by an increase in the rhombic anisotropy, |
E|, from 0.10 cm
−1 at ambient pressure to 0.86 cm
−1 at 1.4 GPa, which originates from the increased separation between the and
orbitals and an increase in the tunnel splitting between the
MS = ±1 states. Using the
ab initio calculations and HF-EPR data as a starting point, simulations of HP dc magnetic susceptibility data (
T = 290–2 K,
B = 1 T) collected at four different pressure points to a maximum pressure of 1.08 GPa show clear agreement with a decrease in |
D| and an increase in |
E| with pressure (
Table 10). The availability of theoretical methods for the calculation of anisotropy, exchange coupling, and other magnetic parameters, together with elucidation of the orbital interactions that influence them, is a major development in the field of high-pressure coordination chemistry. We anticipate that it will not only enable meaningful conclusions to be drawn from data which can on occasion suffer from poor statistics, but, as this and the next study show, it also pinpoints the electronic source of the magneto-structural correlations seen experimentally.

 ,
, 


