Article

Design, Characterization and Molecular Modeling of New Fluorinated Paramagnetic Contrast Agents for Dual 1H/19F MRI

1
General, Organic and Biomedical Chemistry Unit, Nuclear Magnetic Resonance (NMR) and Molecular Imaging Laboratory, University of Mons, 7000 Mons, Belgium
2
Laboratory for Chemistry of Novel Materials, University of Mons, 7000 Mons, Belgium
3
CMMI–Center for Microscopy and Molecular Imaging, 6041 Gosselies, Belgium
*
Author to whom correspondence should be addressed.
Magnetochemistry 2020, 6(1), 8; https://doi.org/10.3390/magnetochemistry6010008
Submission received: 18 December 2019 / Revised: 29 January 2020 / Accepted: 7 February 2020 / Published: 11 February 2020

Abstract

:
One major goal in medical imaging is the elaboration of more efficient contrast agents (CAs). Those agents need to be optimized for the detection of affected tissues such as cancers or tumors while decreasing the injected quantity of agents. The paramagnetic contrast agents containing fluorine atoms can be used for both proton and fluorine magnetic resonance imaging (MRI), and they open the possibility of simultaneously mapping the anatomy using 1H MRI and accurately locating the agents using 19F MRI. One of the challenges in this domain is to synthesize molecules containing several chemically equivalent fluorine atoms with relatively short relaxation times to allow the recording of 19F MR images in good conditions. With that aim, we propose to prepare a CA containing a paramagnetic center and nine chemically equivalent fluorine atoms using a cycloaddition reaction between two building blocks. These fluorinated contrast agents are characterized by 19F NMR, showing differences in the fluorine relaxation times T1 and T2 depending on the lanthanide ion. To complement the experimental results, molecular dynamics simulations are performed to shed light on the 3D-structure of the molecules in order to estimate the distance between the lanthanide ion and the fluorine atoms.

1. Introduction

Magnetic resonance imaging (MRI) has become one of the most used imaging techniques in the medical field with tens of millions MRI examinations performed annually around the world [1]. This non-invasive imaging technique allows the recording of anatomical and functional images with high resolution (10 μm to 1 mm) and depth penetration without the use of ionizing radiations [1].
Traditional MRI relies on the signal detection of water molecules from mobile protons. These images can be affected by the concentration of protons in the tissues as well as their longitudinal and transversal relaxation times, T1 and T2. These medical examinations can then be performed thanks to endogenous local contrast from the body, but in numerous cases, this natural signal is not sufficient and the use of exogenous contrast agents (CAs) is required.
Those agents can affect the tissues imaging either by their direct or indirect detection as reviewed by Wahsner et al. [1]. The most common ones rely on the indirect detection of their effect on the bulk water signal, which is convenient because of the high-water concentration in tissues. Those agents are known to affect and shorten both the longitudinal (T1) and transverse (T2) relaxation times of surrounding water proton nuclei, enhancing the contrast between tissues. T1 agents (mostly lanthanide complexes) are called positive agents because of the hyperintense signal they engender in the accumulation areas, whereas T2 agents (usually iron oxide nanoparticles) are “negative” contrast agents since they induce darker contrast in accumulation areas.
Gadolinium-based CAs are the most often clinically used contrast agents. The use of this particular lanthanide is explained by its high paramagnetic properties and long electronic relaxation times enabling a significant reduction of the T1 of nearby water protons [2]. The resulting signal intensity appears globally increased. However, the “free” Gd3+ ion is toxic since its ionic radius is relatively close to that of calcium and could then interfere with calcium ion channels. Gd3+ therefore needs to be carefully chelated by organic ligands in order to avoid those toxicity issues. Two classes of chelates were developed to complex gadolinium: linear or macrocyclic organic ligands. To avoid the release of free Gd3+, the resulting complexes must be kinetically and thermodynamically stable [2]. Unfortunately, some studies have shown that linear complexing agents tend to release gadolinium mostly when administered to patients suffering from renal deficiency, causing in some cases nephrogenic systemic fibrosis (NSF) [3,4]. In December 2017, the EMA (European Medicines Agency) confirmed the necessity of restricting the use of some linear gadolinium CAs because of their high propensity to release gadolinium ions in physiological conditions. In contrast, most macrocyclic gadolinium-based CAs were validated and can still be administered to patients, but in the lowest doses needed [5].
Nonetheless, magnetic inhomogeneities induce a nonlinear relationship between the signal intensity and the CA concentration and constitute a major drawback for MR image analysis. In addition, the background signal coming from water protons in the surrounding tissues makes it sometimes difficult to visualize the exact accumulation of the CAs, especially in the context of molecular imaging where the CA is vectorized in order to target a specific organ or tissue.
Alternatives are thus explored, among which organic molecules containing heteronuclei, such as 13C, 31P or 19F [6,7]. These elements are medically interesting since they can be directly detected and imaged with MRI. Among those new MRI probes, fluorine-containing CAs appear particularly attractive because of the magnetic properties of the fluorine atom [8,9]. Fluorine-19 has a natural abundance of 100% with spin one-half and its sensitivity and gyromagnetic ratio can be compared to those of the proton. All these properties make fluorine an excellent alternative as a tracer agent that can be directly and quantitatively visualized when administered to patients. Exogenous fluorinated compounds can be detected and imaged without any background signal coming from endogenous fluorine, which is present only in the solid matrices of bones and teeth as solid salts, associated with very short, transverse relaxation times. Despite these advantages, typical 10–50 millimolar concentrations of diamagnetic compounds are required to collect enough signal intensity over a reasonable timescale. In comparison, paramagnetic, gadolinium-based contrast agents require a much lower concentration (0.1 μM) [10,11,12].
To overcome this sensitivity problem, two techniques can be applied: (i) increasing the number of identical heteronuclei within the same molecule or (ii) decreasing their relaxation times and then increasing the number of scans in a particular timeframe.
Multiple types of fluorinated probes have been developed and reviewed recently [13,14,15], including fluorinated nanoparticles (gold [16,17,18], silica [19,20,21], etc …), dendrimers [22,23,24], polymers [25,26,27] or perfluorocarbons, PFCs [28,29,30,31].
The use of small diamagnetic fluorine compounds is also interesting because of their more favorable elimination from the body than the nanoparticular or macromolecular agents. Nonetheless, their use can be complicated in clinical imaging because of the long relaxation times, T1 and T2, of fluorine (usually between 0.5 and 3 s), requiring long acquisition times [11]. One interesting solution is to enhance the contrast-to-noise ratio by increasing the number of chemically equivalent fluorine atoms within the same molecule, but there is a limitation resulting from the well-known hydrophobicity of fluorinated compounds, which decreases the probe solubility in aqueous media.
An alternative is the combination of fluorine atoms with a paramagnetic ion, in order to reduce the 19F relaxation times thanks to the paramagnetic relaxation enhancement (PRE) effect [9,32,33]. In that case, paramagnetic ions play two distinct roles: reducing the fluorine relaxation times as well as favoring the recording of anatomical images of the studied subject by proton MRI. In fact, fluorine magnetic resonance can only provide the localization of fluorine-containing tracers and needs to be combined with anatomical imaging in order to superimpose the anatomical information with the precise location of the injected fluorinated tracer [34,35].
Among all fluorinated paramagnetic CAs designed and reviewed by scientists [36], we can cite application fields such as cell tracking [37], CEST MRI [38,39,40,41,42] and multicontrast 1H/19F MRI [43,44].
To maximize the PRE effect, paramagnetic metals (M) need to be carefully placed at an ideal distance from the fluorine atoms. If the 19F-M distance is too long, the paramagnetic effect on fluorine atom relaxation times is severely decreased. On the contrary, if the fluorine atoms and the paramagnetic ion are too close to each other, a too large T2 decrease is observed, causing severe line broadening and reducing the signal intensity. This PRE effect tends to be maximum when the paramagnetic center is located at an appropriate distance from the fluorine atoms, within a range of 4.5 to 7 Å [35]. Consistently, Parker and co-workers [9,10,33] conclude that the 19F-M distance should range between 4.5 and 7.5 Å to obtain a T2/T1 ratio close to unity and thus a better signal-to-noise ratio.
We report herein the synthesis of a series of cyclen derivative lanthanide (Ln = Gadolinium (III), Dysprosium (III), Terbium (III) and Europium (III)) complexes associated to nine chemically- and magnetically-equivalent fluorine atoms. These complexes were then characterized by relaxivity measurements, proton nuclear magnetic relaxation dispersion (NMRD) profiles, 19F NMR spectra and fluorine relaxation measurements. To complement the experimental results, molecular dynamics simulations were performed to shed light on the 3D-structure of the molecules in order to estimate the distance between the lanthanide ion and the fluorine atoms.

2. Results and Discussion
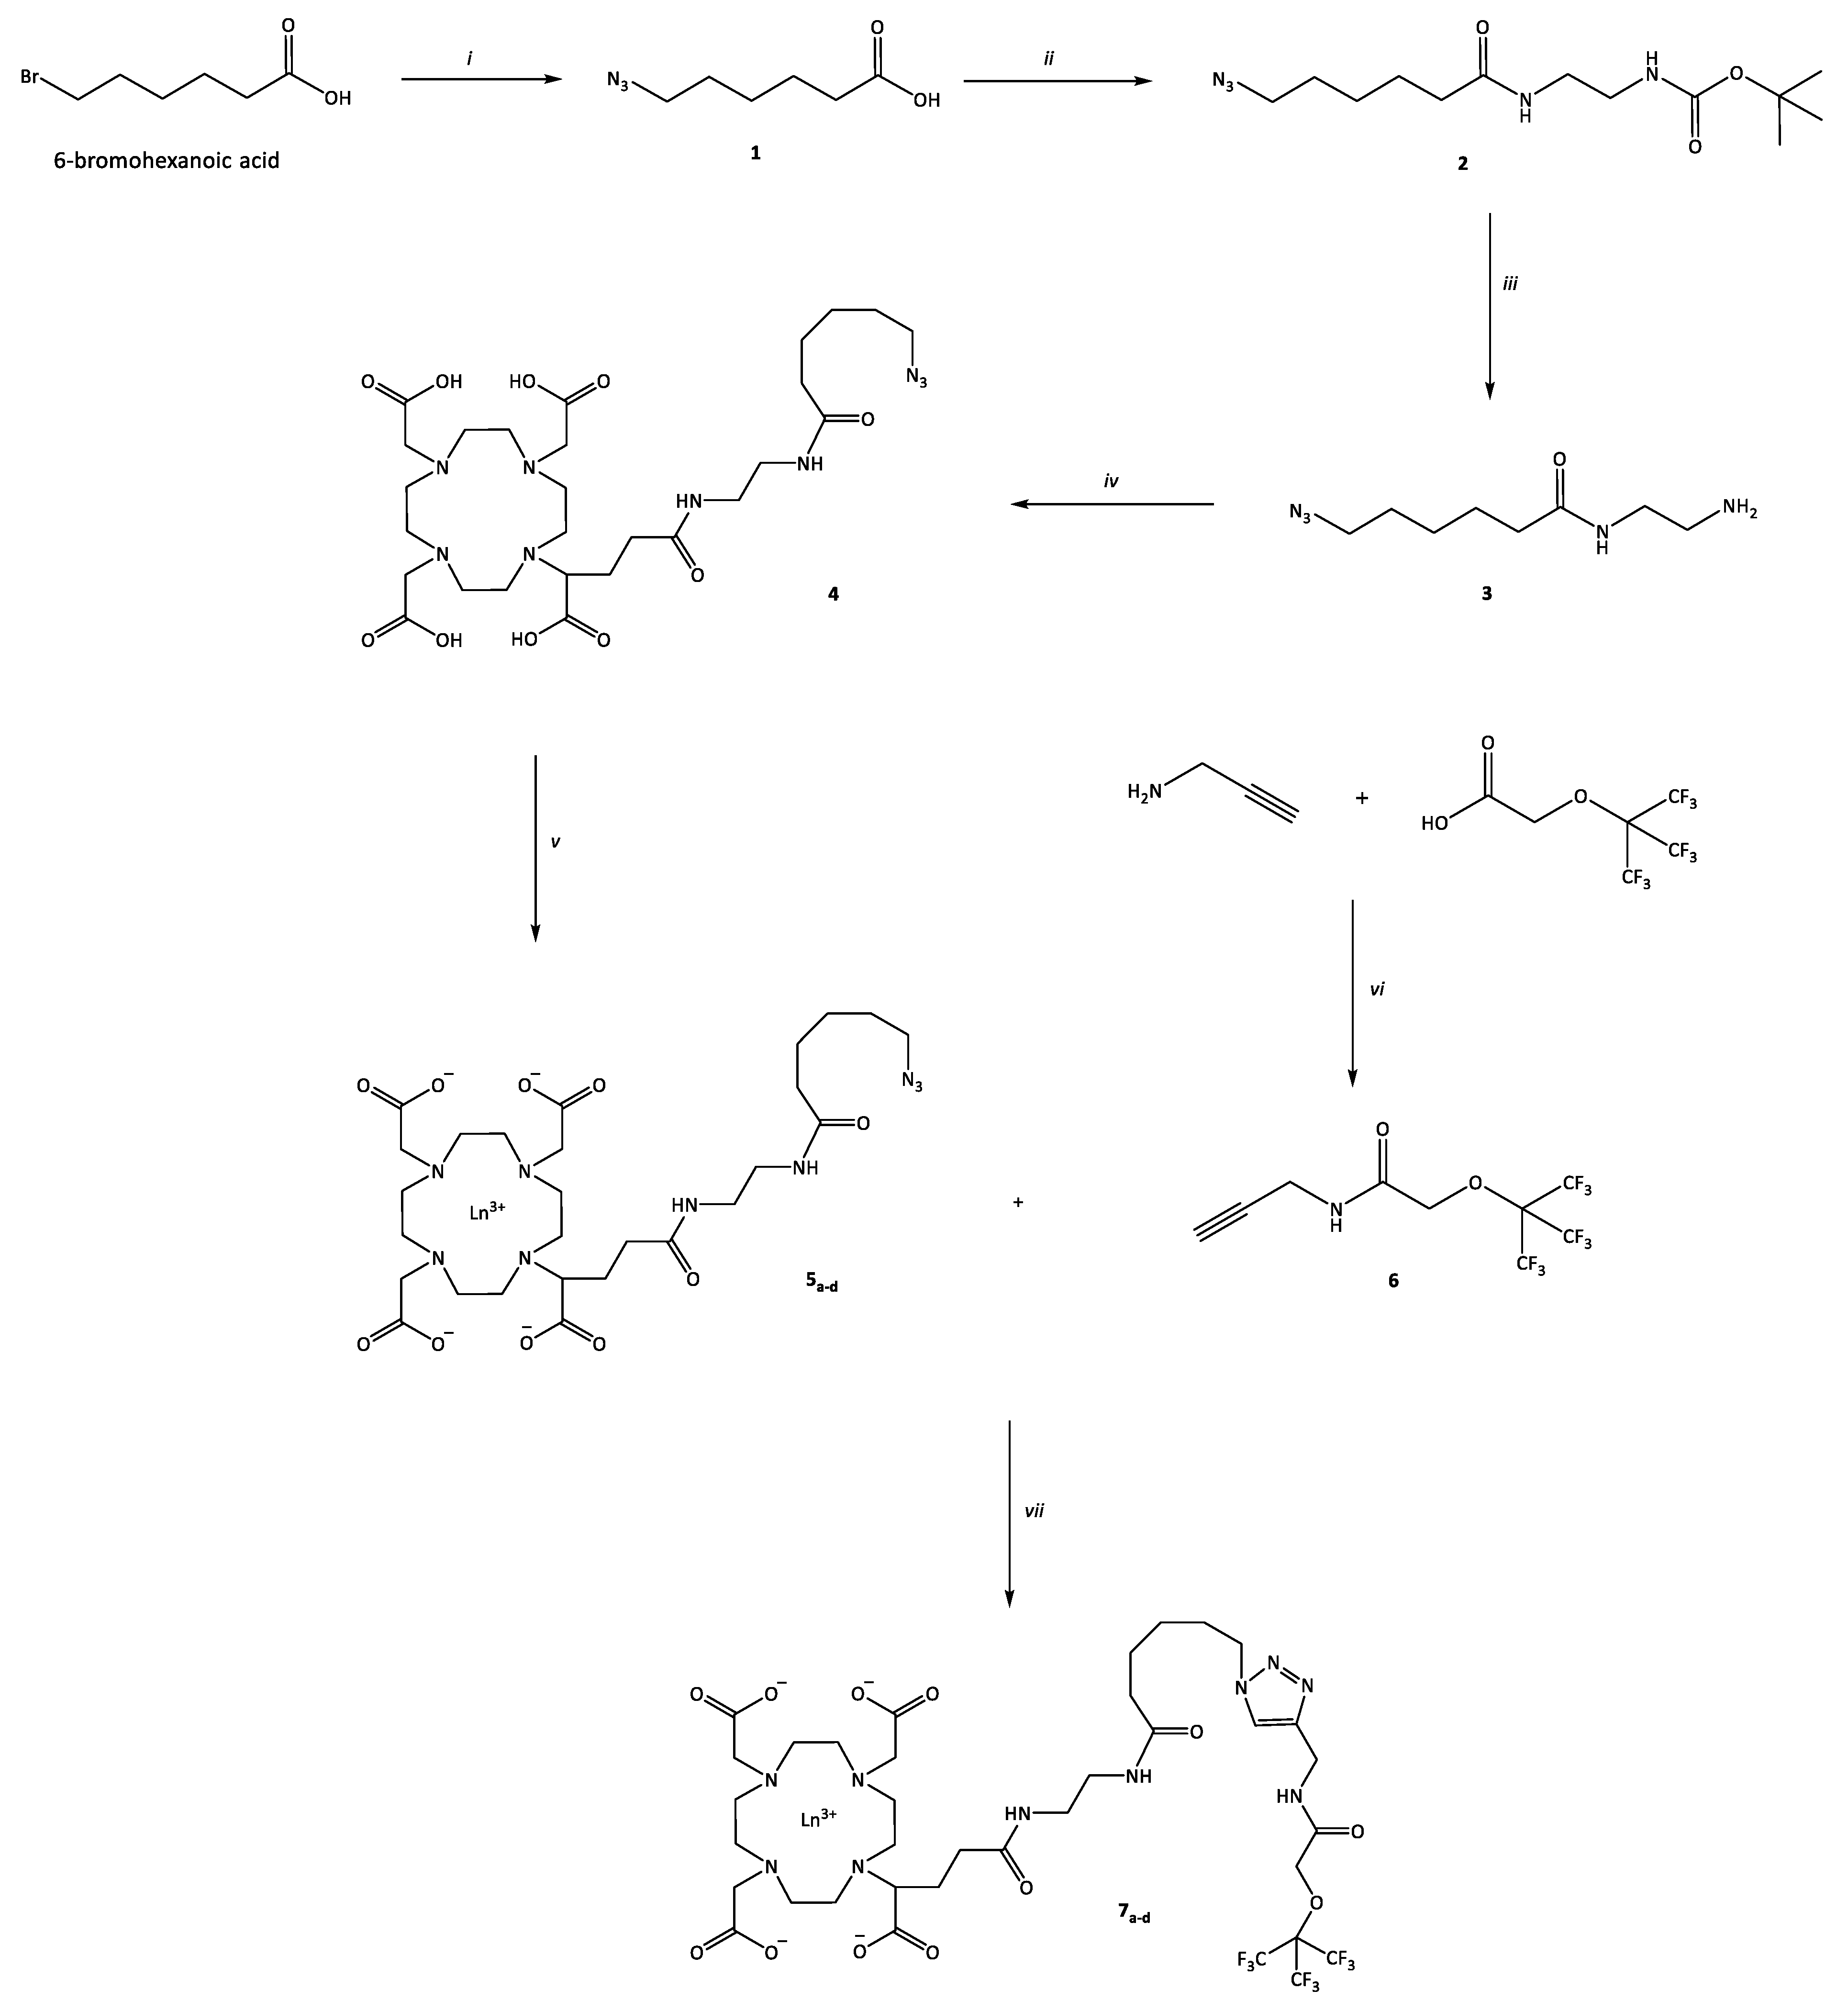
2.1. Synthesis

The fluorinated lanthanide-based complexes were synthesized through a multistep synthesis represented in Scheme 1. The synthesis can be divided in three parts: (i) the synthesis of the DOTA-GA derivative lanthanide complexes bearing an azide function, (ii) the synthesis of the fluorinated diamagnetic compound and (iii) the combination of these two building blocks through a cycloaddition reaction.
  • Synthesis of the lanthanide complexes bearing an azide function:
First, the 6-azidohexanoic acid (1) was synthesized through the nucleophilic substitution between the commercially-available 6-bromohexanoic acid and sodium azide. Compound 2 was then prepared by reacting the carboxylic acid function of compound 1 with N-Boc-ethylenediamine in N,N-Dimethylformamide in the presence of the coupling reagent TBTU (O-(benzotriazol-1-yl)-N,N,N′,N′-tetramethyluronium tetraffluoroborate) and the non-nucleophilic strong base DIPEA (N,N-diisopropylethylamine). The protected amino group N-Boc can then be deprotected with formic acid to give the terminal amine in compound 3. Ligand 4 was prepared by reaction between the commercially-available DOTA-GA anhydride and compound 3 in anhydrous N,N-Dimethylformamide under nitrogen atmosphere and in the presence of triethylamine. Ligand 4 was divided in 4 parts and metalated with GdCl3.6H2O, DyCl3.6H2O, TbCl3.6H2O or EuCl3.6H2O in water at pH range 5.5–6.5 to give the corresponding Gd (III) 5a, Dy (III) 5b, Tb (III) 5c and Eu (III) 5d complexes, respectively.
  • Synthesis of the diamagnetic fluorine compound:
The nonafluorinated compound 6 was obtained through the coupling reaction between a nonafluorinated carboxylic acid and propargylamine in the presence of the coupling reagent TBTU and the non-nucleophilic strong base DIPEA.
  • Synthesis of the fluorinated lanthanide complexes:
Once the complexes 5a–d and the nonafluorinated compound 6 were synthesized, they were combined using click chemistry under microwave to form the desired fluorinated paramagnetic contrast agents 7a–d. During this cycloaddition reaction, the alkyne function reacted with the azido group, forming a triazole heterocyclic compound. The use of copper (I) as catalyst, generated in situ by the copper salt and sodium ascorbate as the reducing agent, affords the obtention of the 1,4-regioisomers as the sole product. This variant of the Huisgen 1,3-dipolar cycloaddition reaction is called Copper (I)-Catalyzed Azide-Alkyne Cycloaddition (CuAAC) [45].
All the compounds were characterized by 1H and 13C NMR, as well as mass spectrometry.

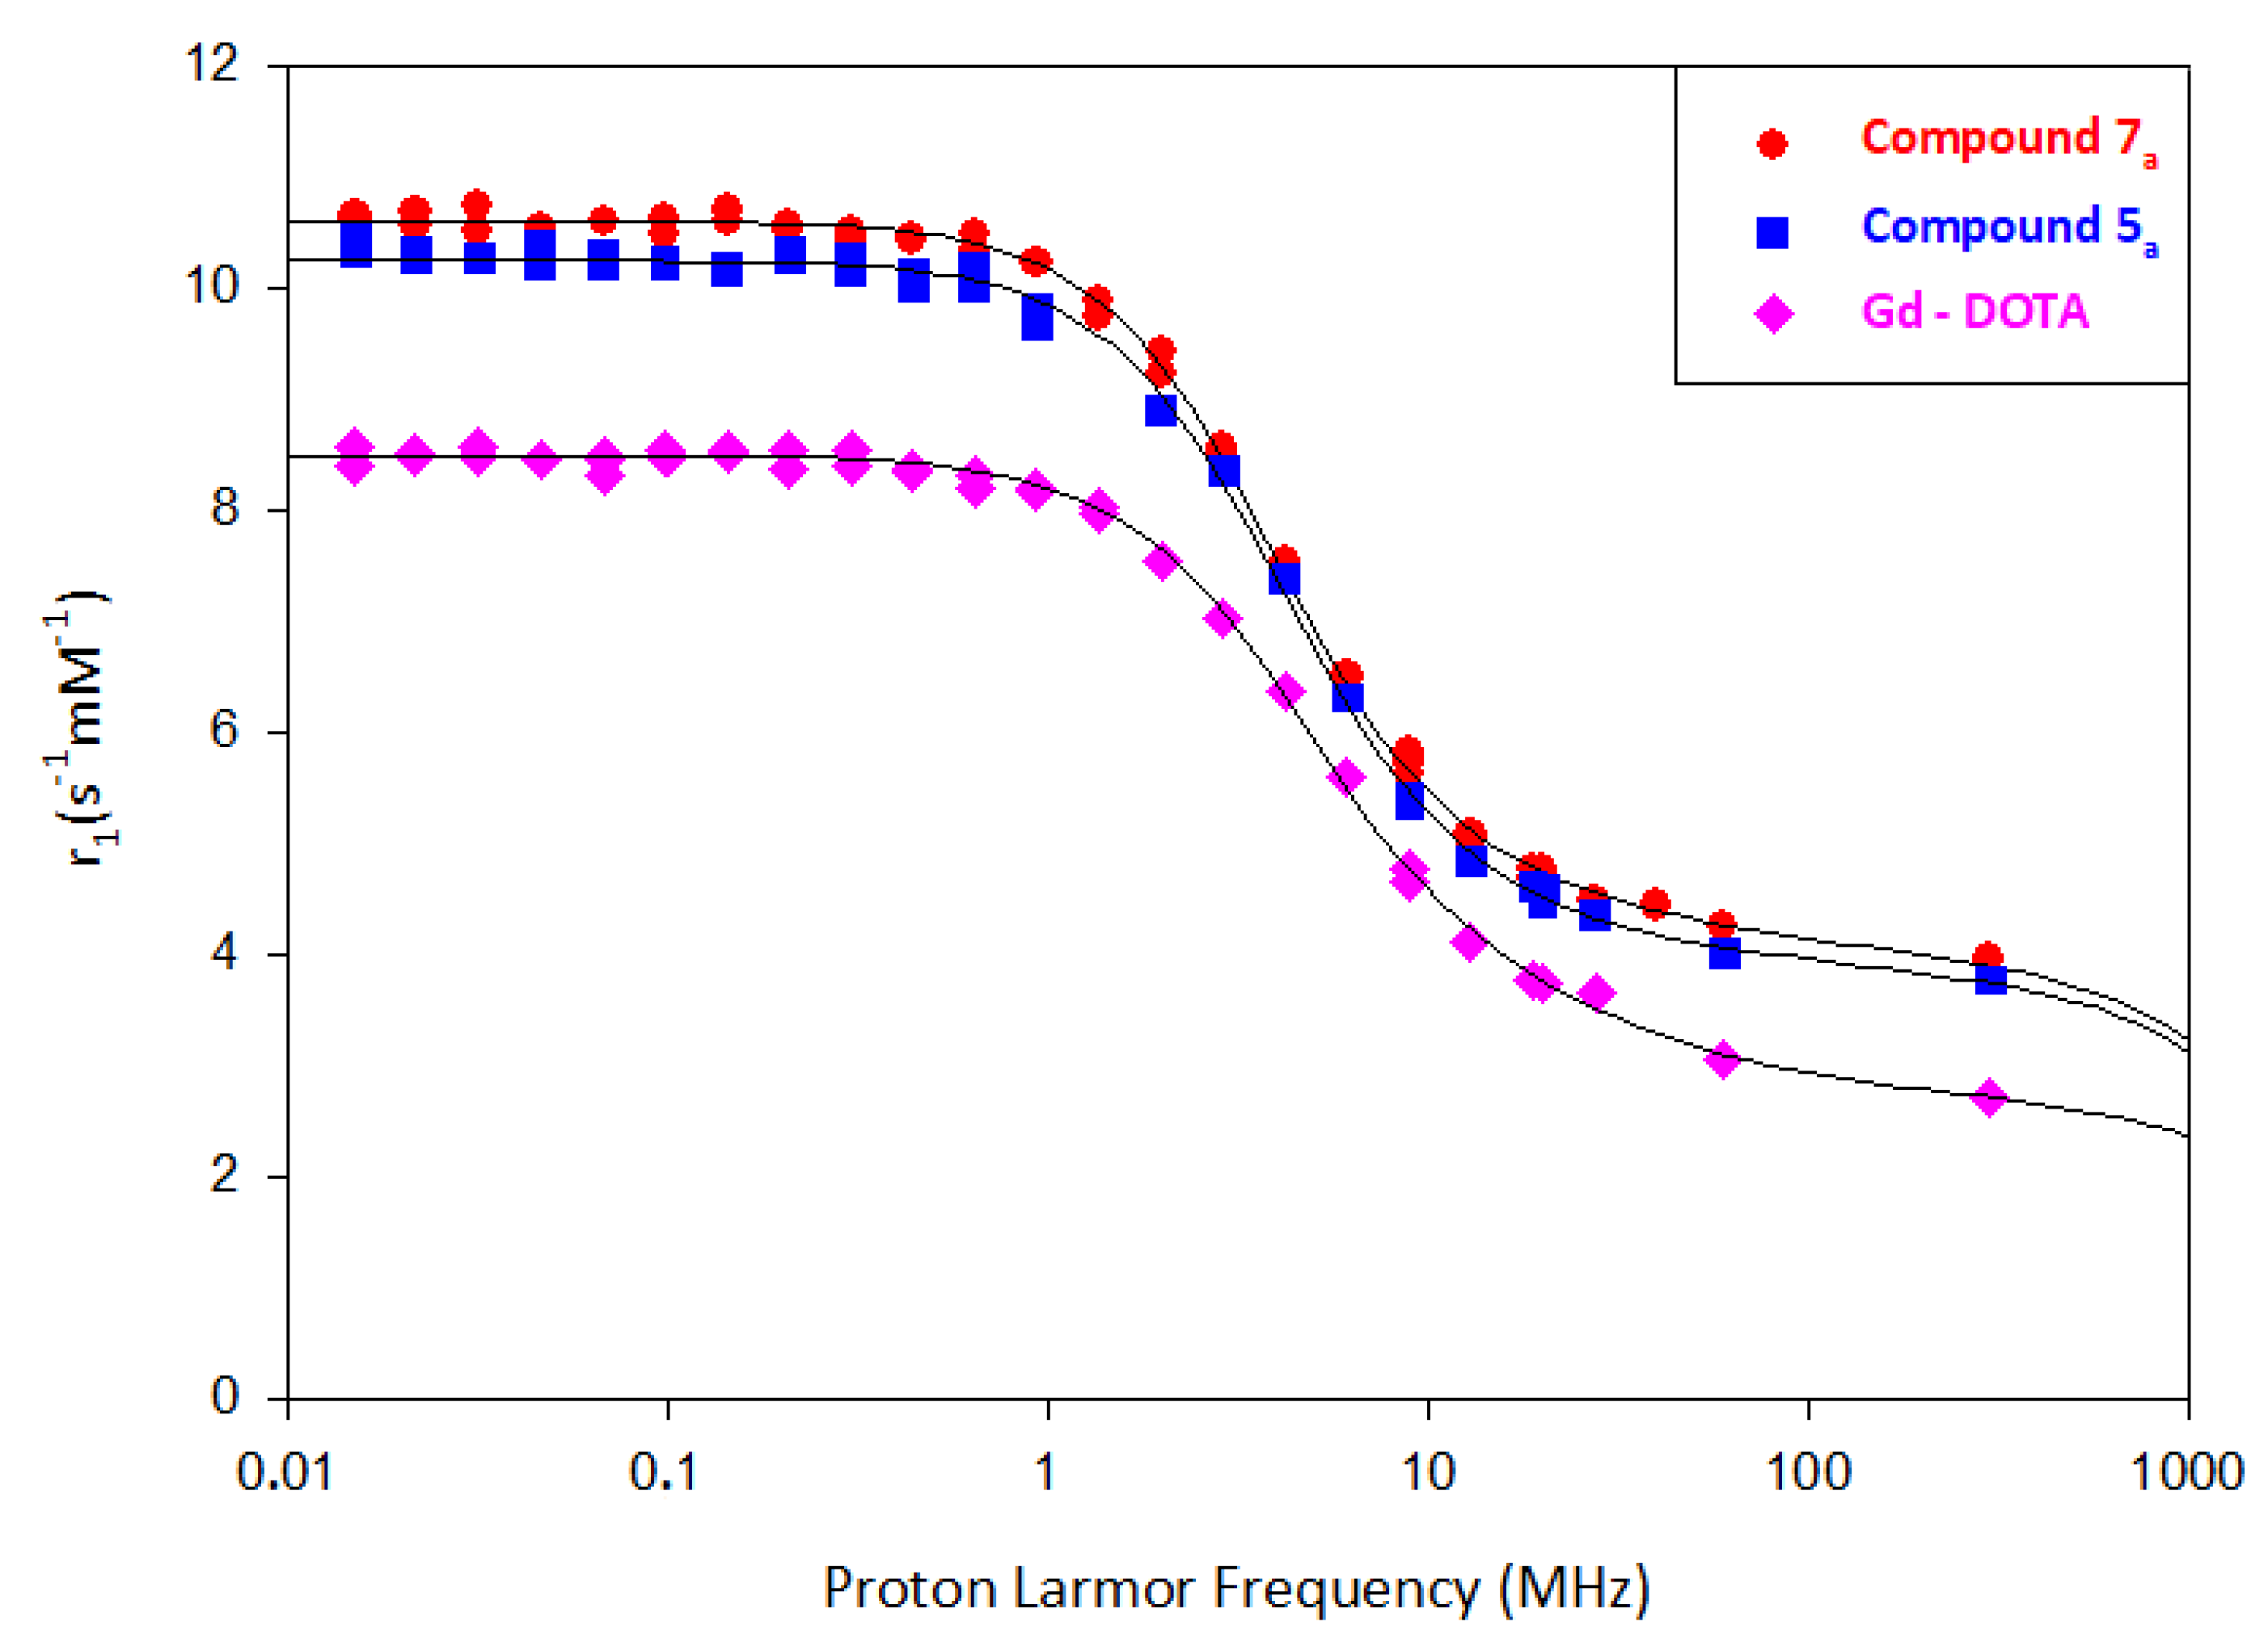
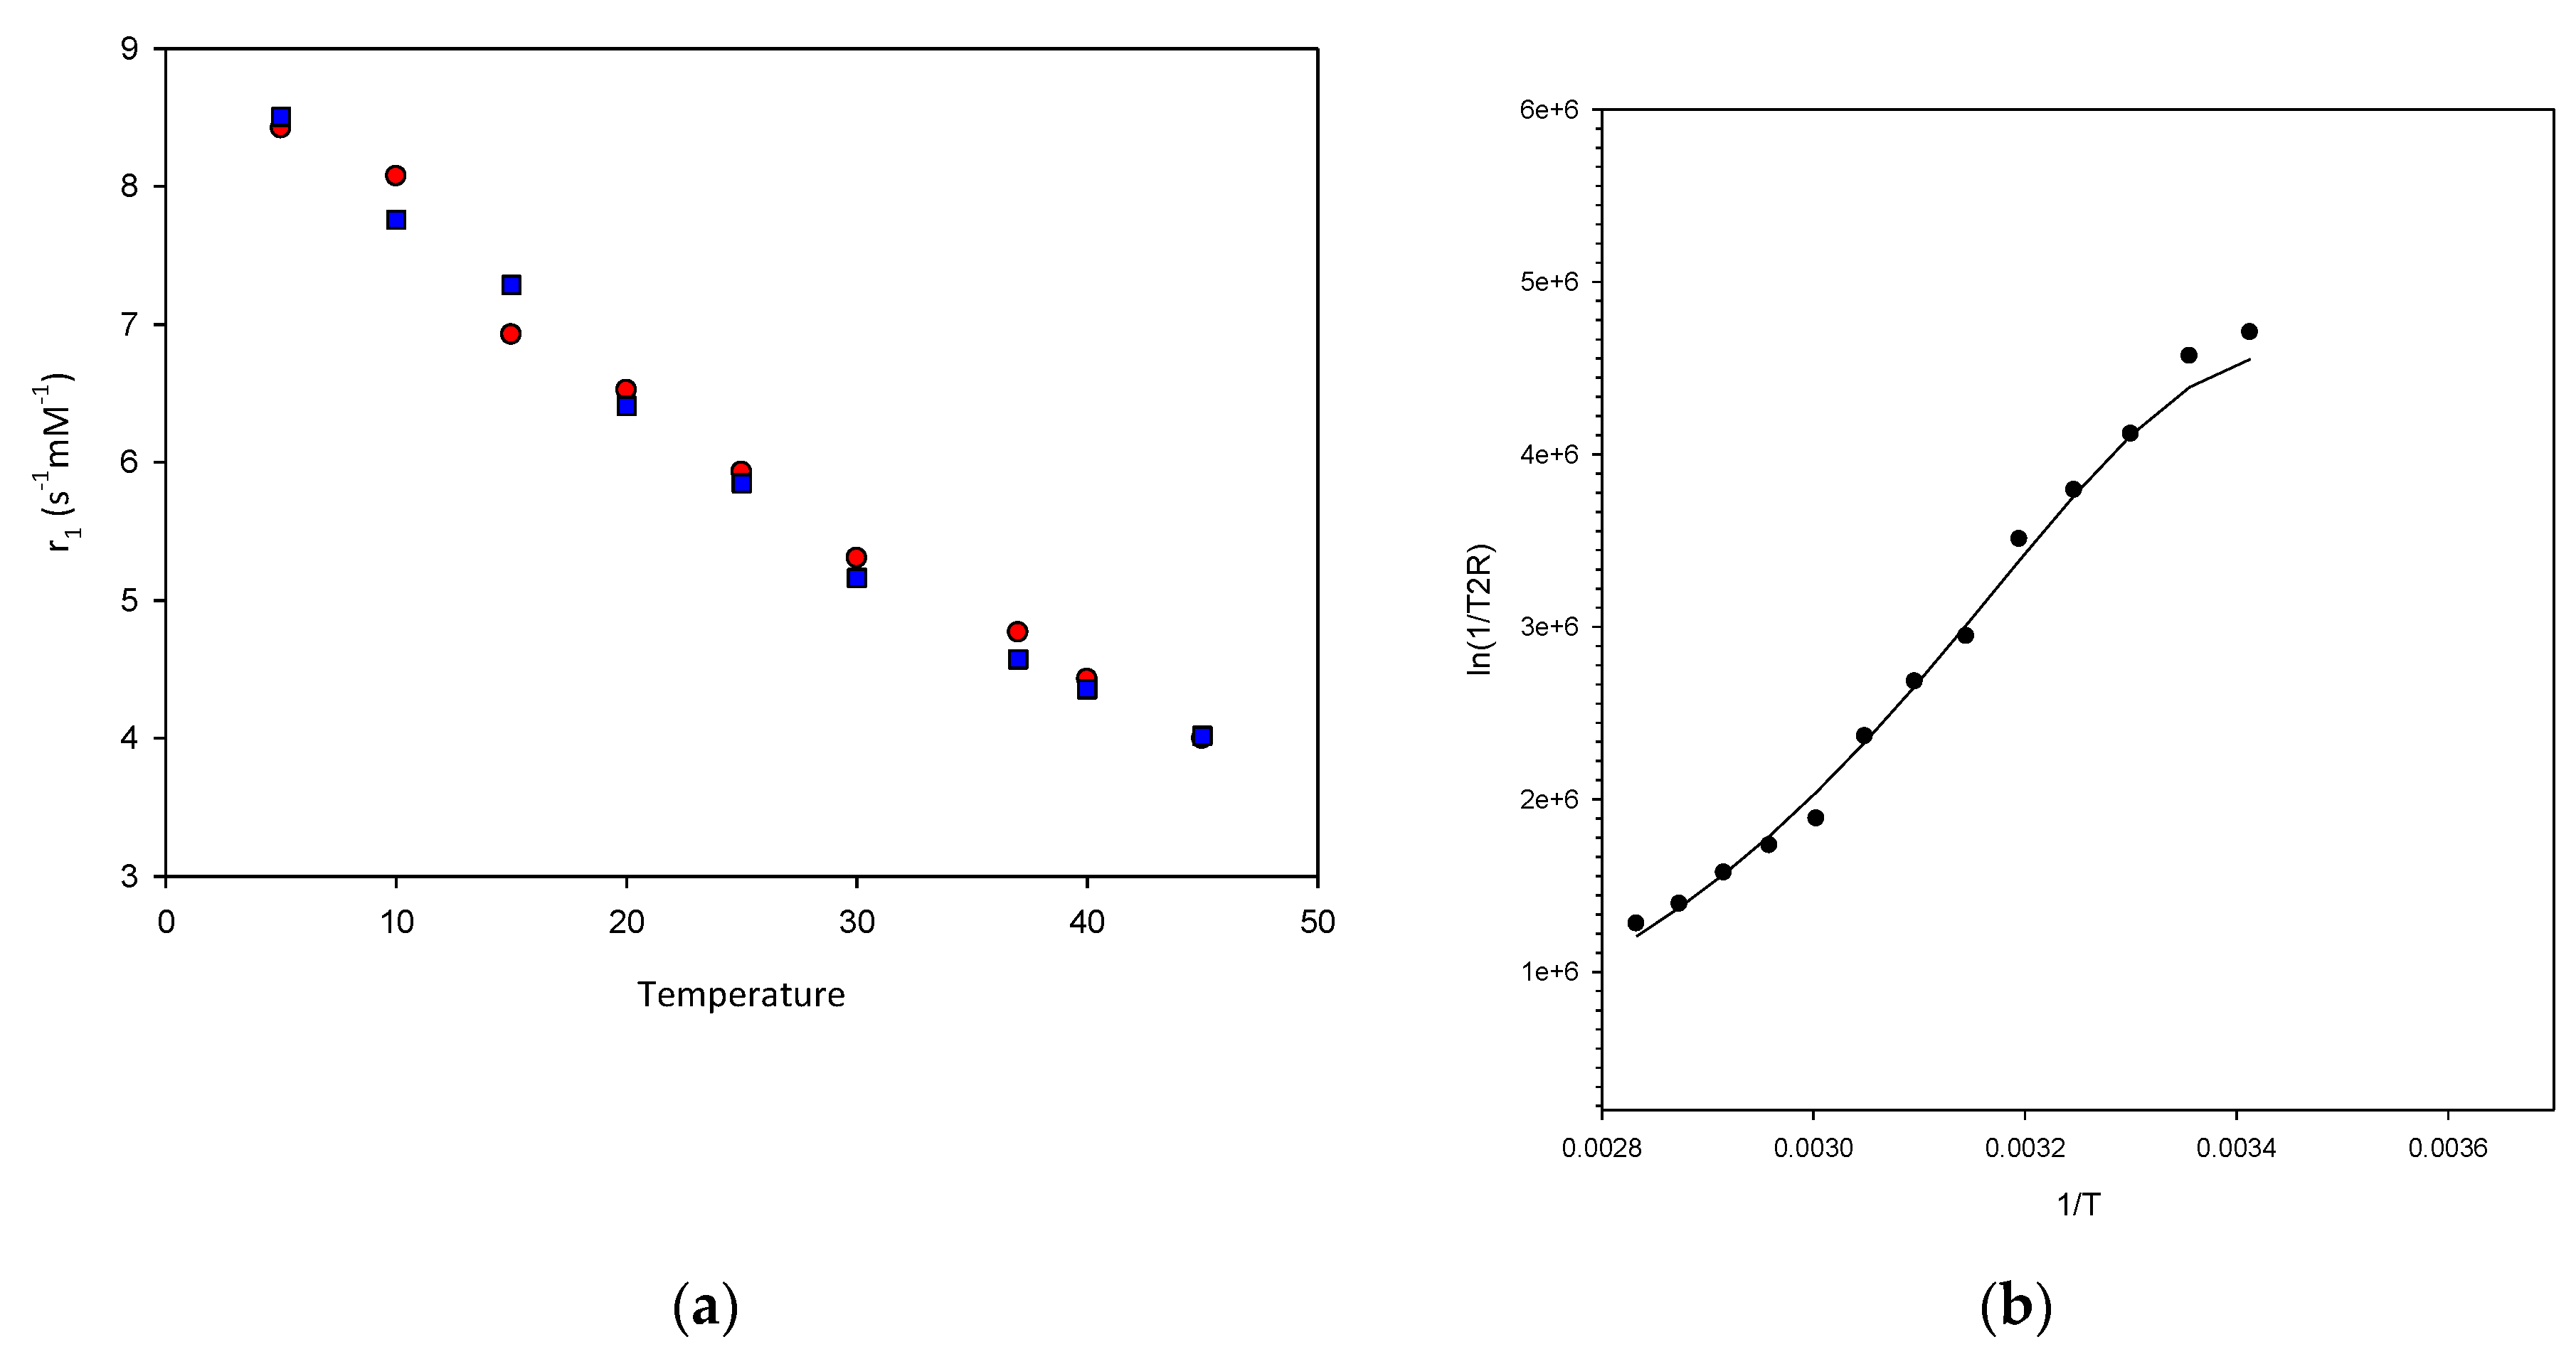
2.2. Relaxivity Measurements
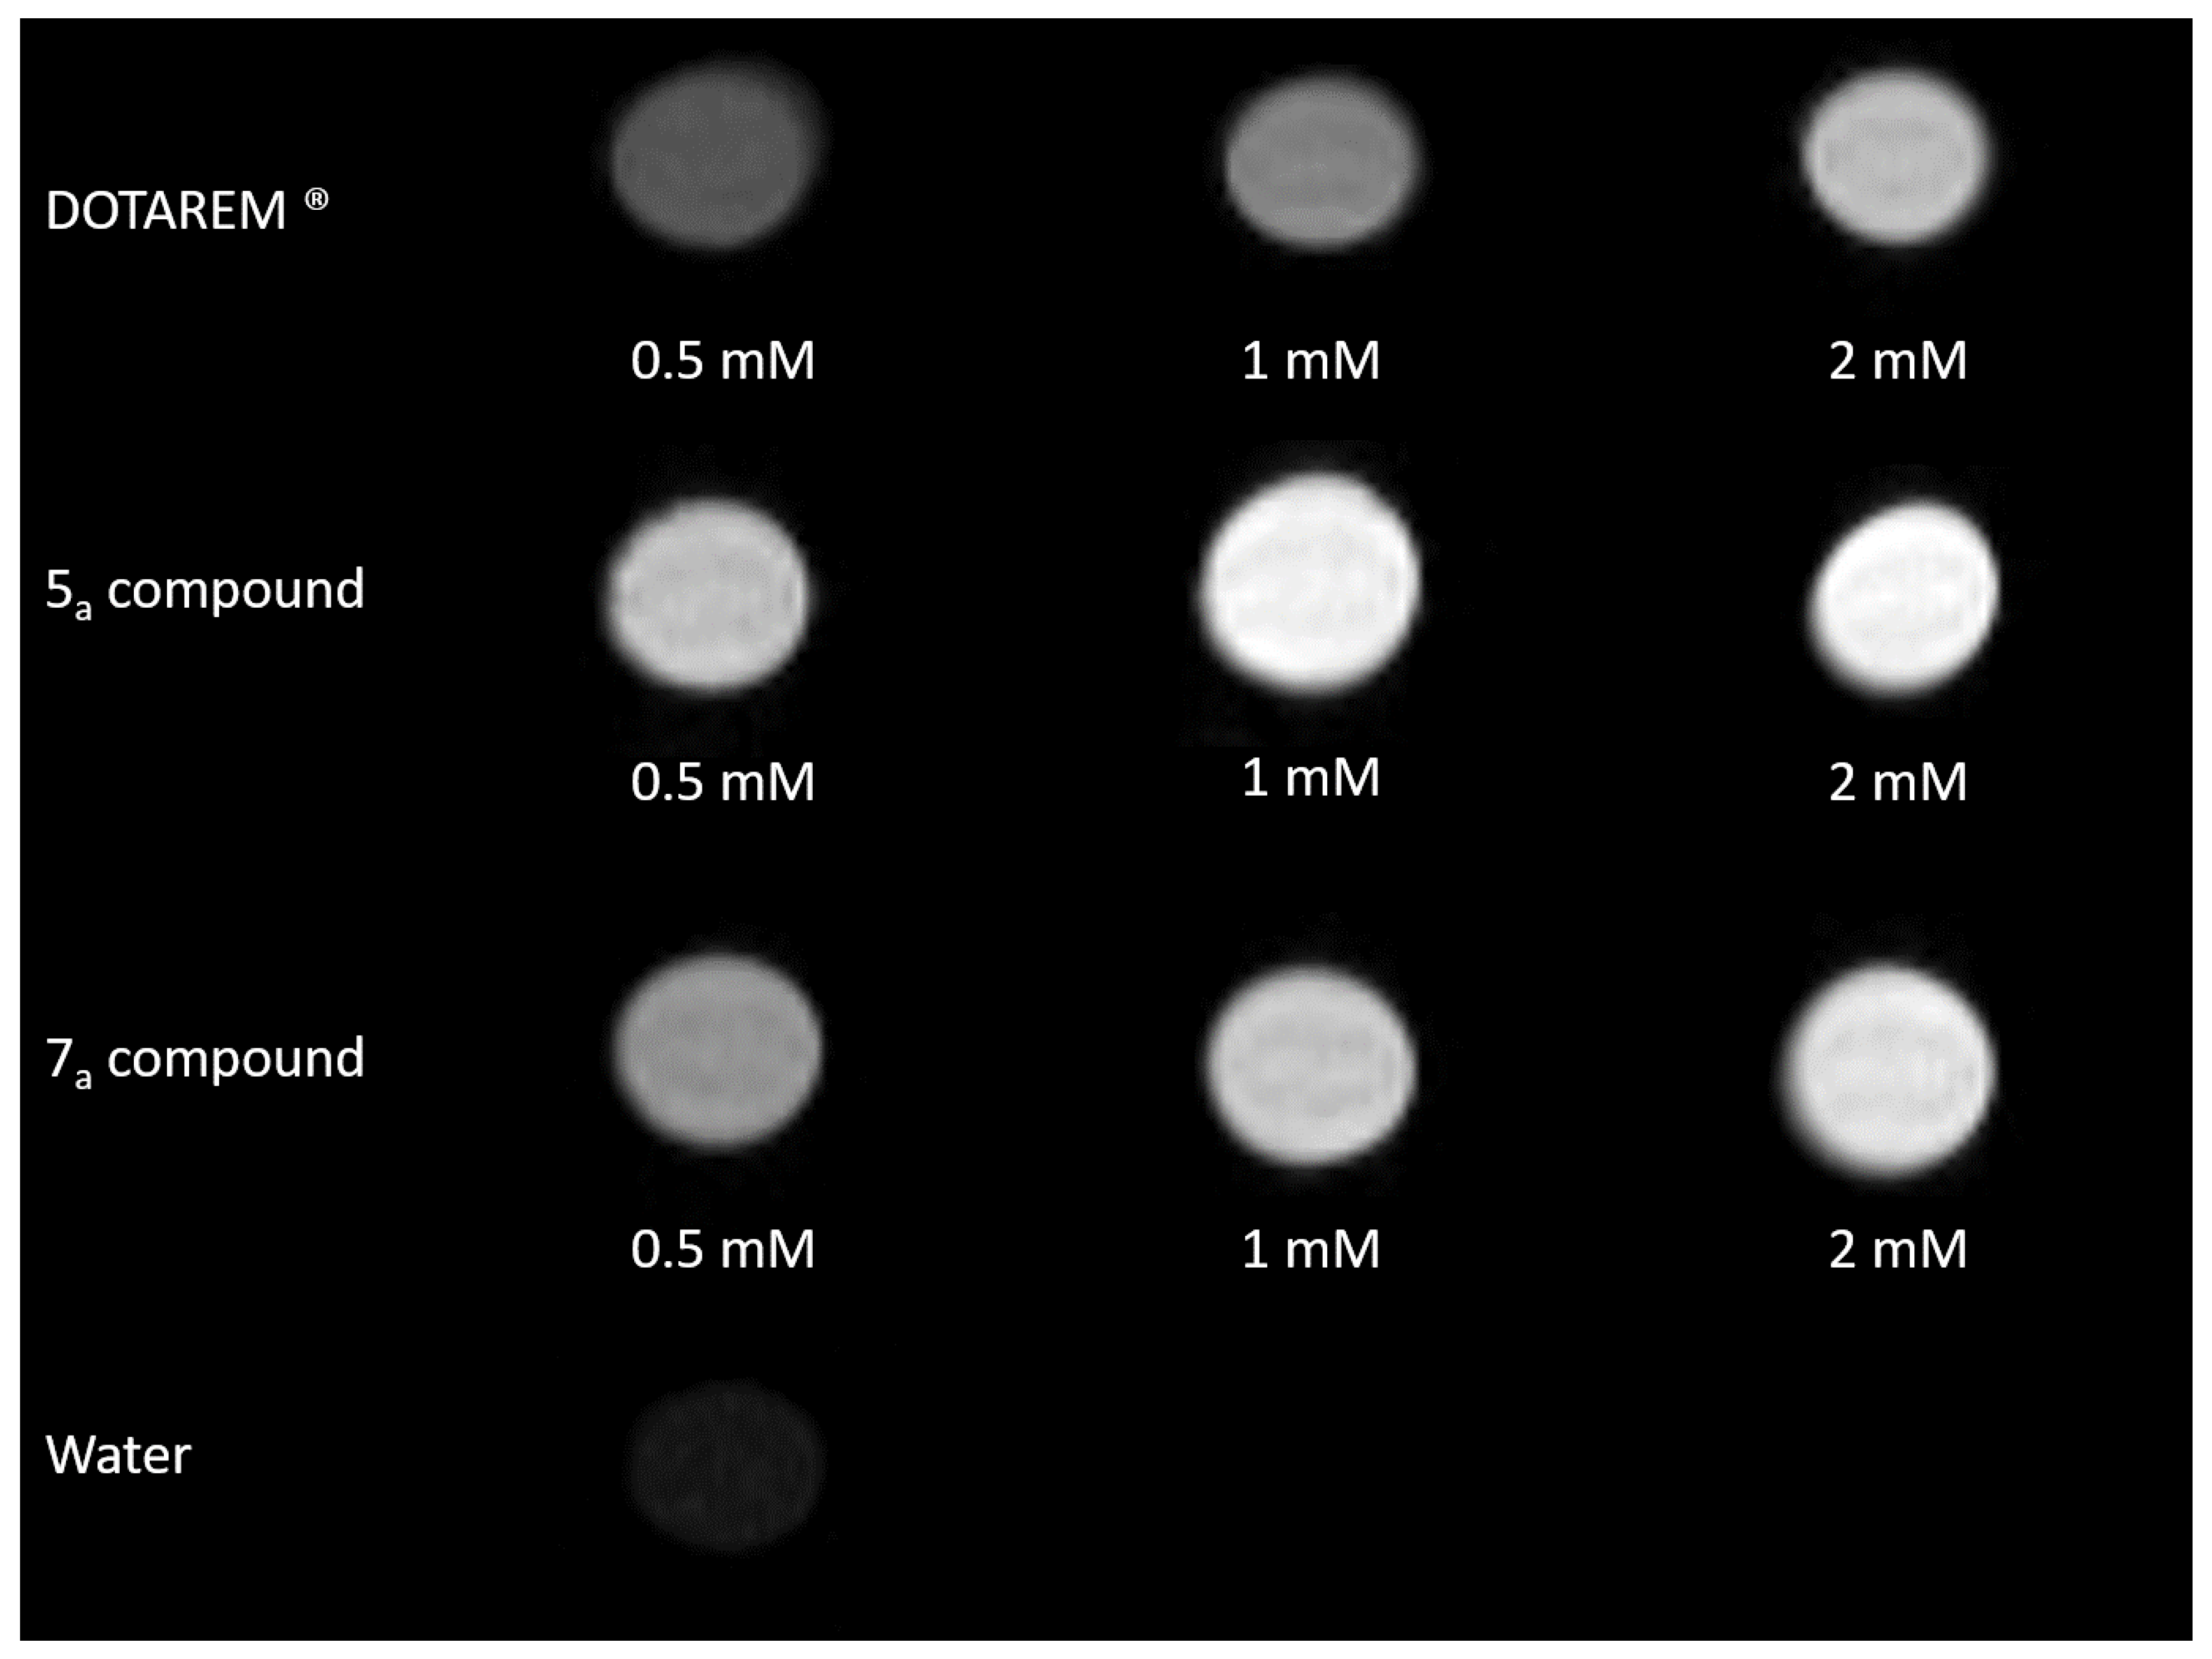
The efficiency of a paramagnetic complex as T1-weigted contrast agent can be measured by the relaxation enhancement of water protons induced by one millimolar concentration of the paramagnetic center. This efficiency, also known as relaxivity, has been measured for the synthesized fluorinated gadolinium complex (7a) and compared to the commercially available Gd-based contrast agent, DOTAREM®.
The relaxivity of this complex has been measured at 310 K and 1.41 T in aqueous solution and values of 3.34 s−1·mM−1 and 4.26 s−1·mM−1 were obtained for DOTAREM® and complex 7a, respectively. This increase of relaxivity is mainly explained by the increase of the molecular mass of the synthesized molecule compared to its commercially-available counterpart, as confirmed by the NMRD profiles (Figure 1).
These NMRD profiles were fitted thanks to the Solomon and Bloembergen theory [46,47,48], which states that relaxivity can be altered by different parameters such as the number of coordinated water molecules in the first coordination sphere (q), the distance between the protons of the coordinated water molecules and the gadolinium ion (r), the residence time of the coordinated water molecules (τM), the rotational correlation time (τR), the electronic relaxation time at zero field (τS0) and the correlation time that modulates the electronic relaxation (τV). By comparison with monohydrated neutral and positively-charged complexes of similar size, we can suppose that the complexes studied here coordinate one water molecule (q = 1), and it has been verified using 17O NMR measurements of the water chemical shift on the complex 5a by comparison with Gd-DOTA (Figure 2). The comparison of the slopes allows the presence of one water molecule to be confirmed in the first coordination sphere of complex 5a, which can be extended to complex 7a.
Moreover, the outer-sphere mechanism can also interfere in the relaxivity fitting and is described by two parameters: the distance of closest approach between the water molecules and the gadolinium ion (d) and the relative diffusion coefficient of water (D). Among all these parameters, r, d and D are well-known for these types of gadolinium complexes and were fixed to 0.31 nm, 0.36 nm and 3.30 × 10⁻⁹ m2/s, respectively.
The relaxivity has been measured at several temperatures in order to evaluate the exchange regime of the coordinated water molecule (Figure 3a). Both complexes show a continuous decrease of the relaxivity with increasing temperature and can then be qualified as fast-exchange complexes characterized by a short τM (of about 100 ns or lower) [49,50]. The exact τM was determined by 17O NMR for the complex 7a and a value of 53.07 ± 1.76 ns was obtained (Figure 3b). This confirms the fast exchange of the coordinated water molecule for both complexes 5a and 7a, which will not limit the relaxivity.
The other parameters were allowed to vary during the fitting procedure and the results are presented in Table 1 below.
The values obtained for those parameters confirm that the increased relaxivities measured for compounds 5a and 7a are mainly due to an increase of the molecular weight, reflected by the higher values of the rotational correlation time τR.

2.3. Phantom Images

Phantom images have been recorded at several concentrations in order to compare the contrast generated by the commercially available DOTAREM® and the two synthesized gadolinium complexes 5a and 7a (Figure 4).
On these images, we can notice a highlight of the 5a and 7a samples compared to the Gd-DOTA compound for each studied concentration, with no significant differences between 5a and 7a compounds.

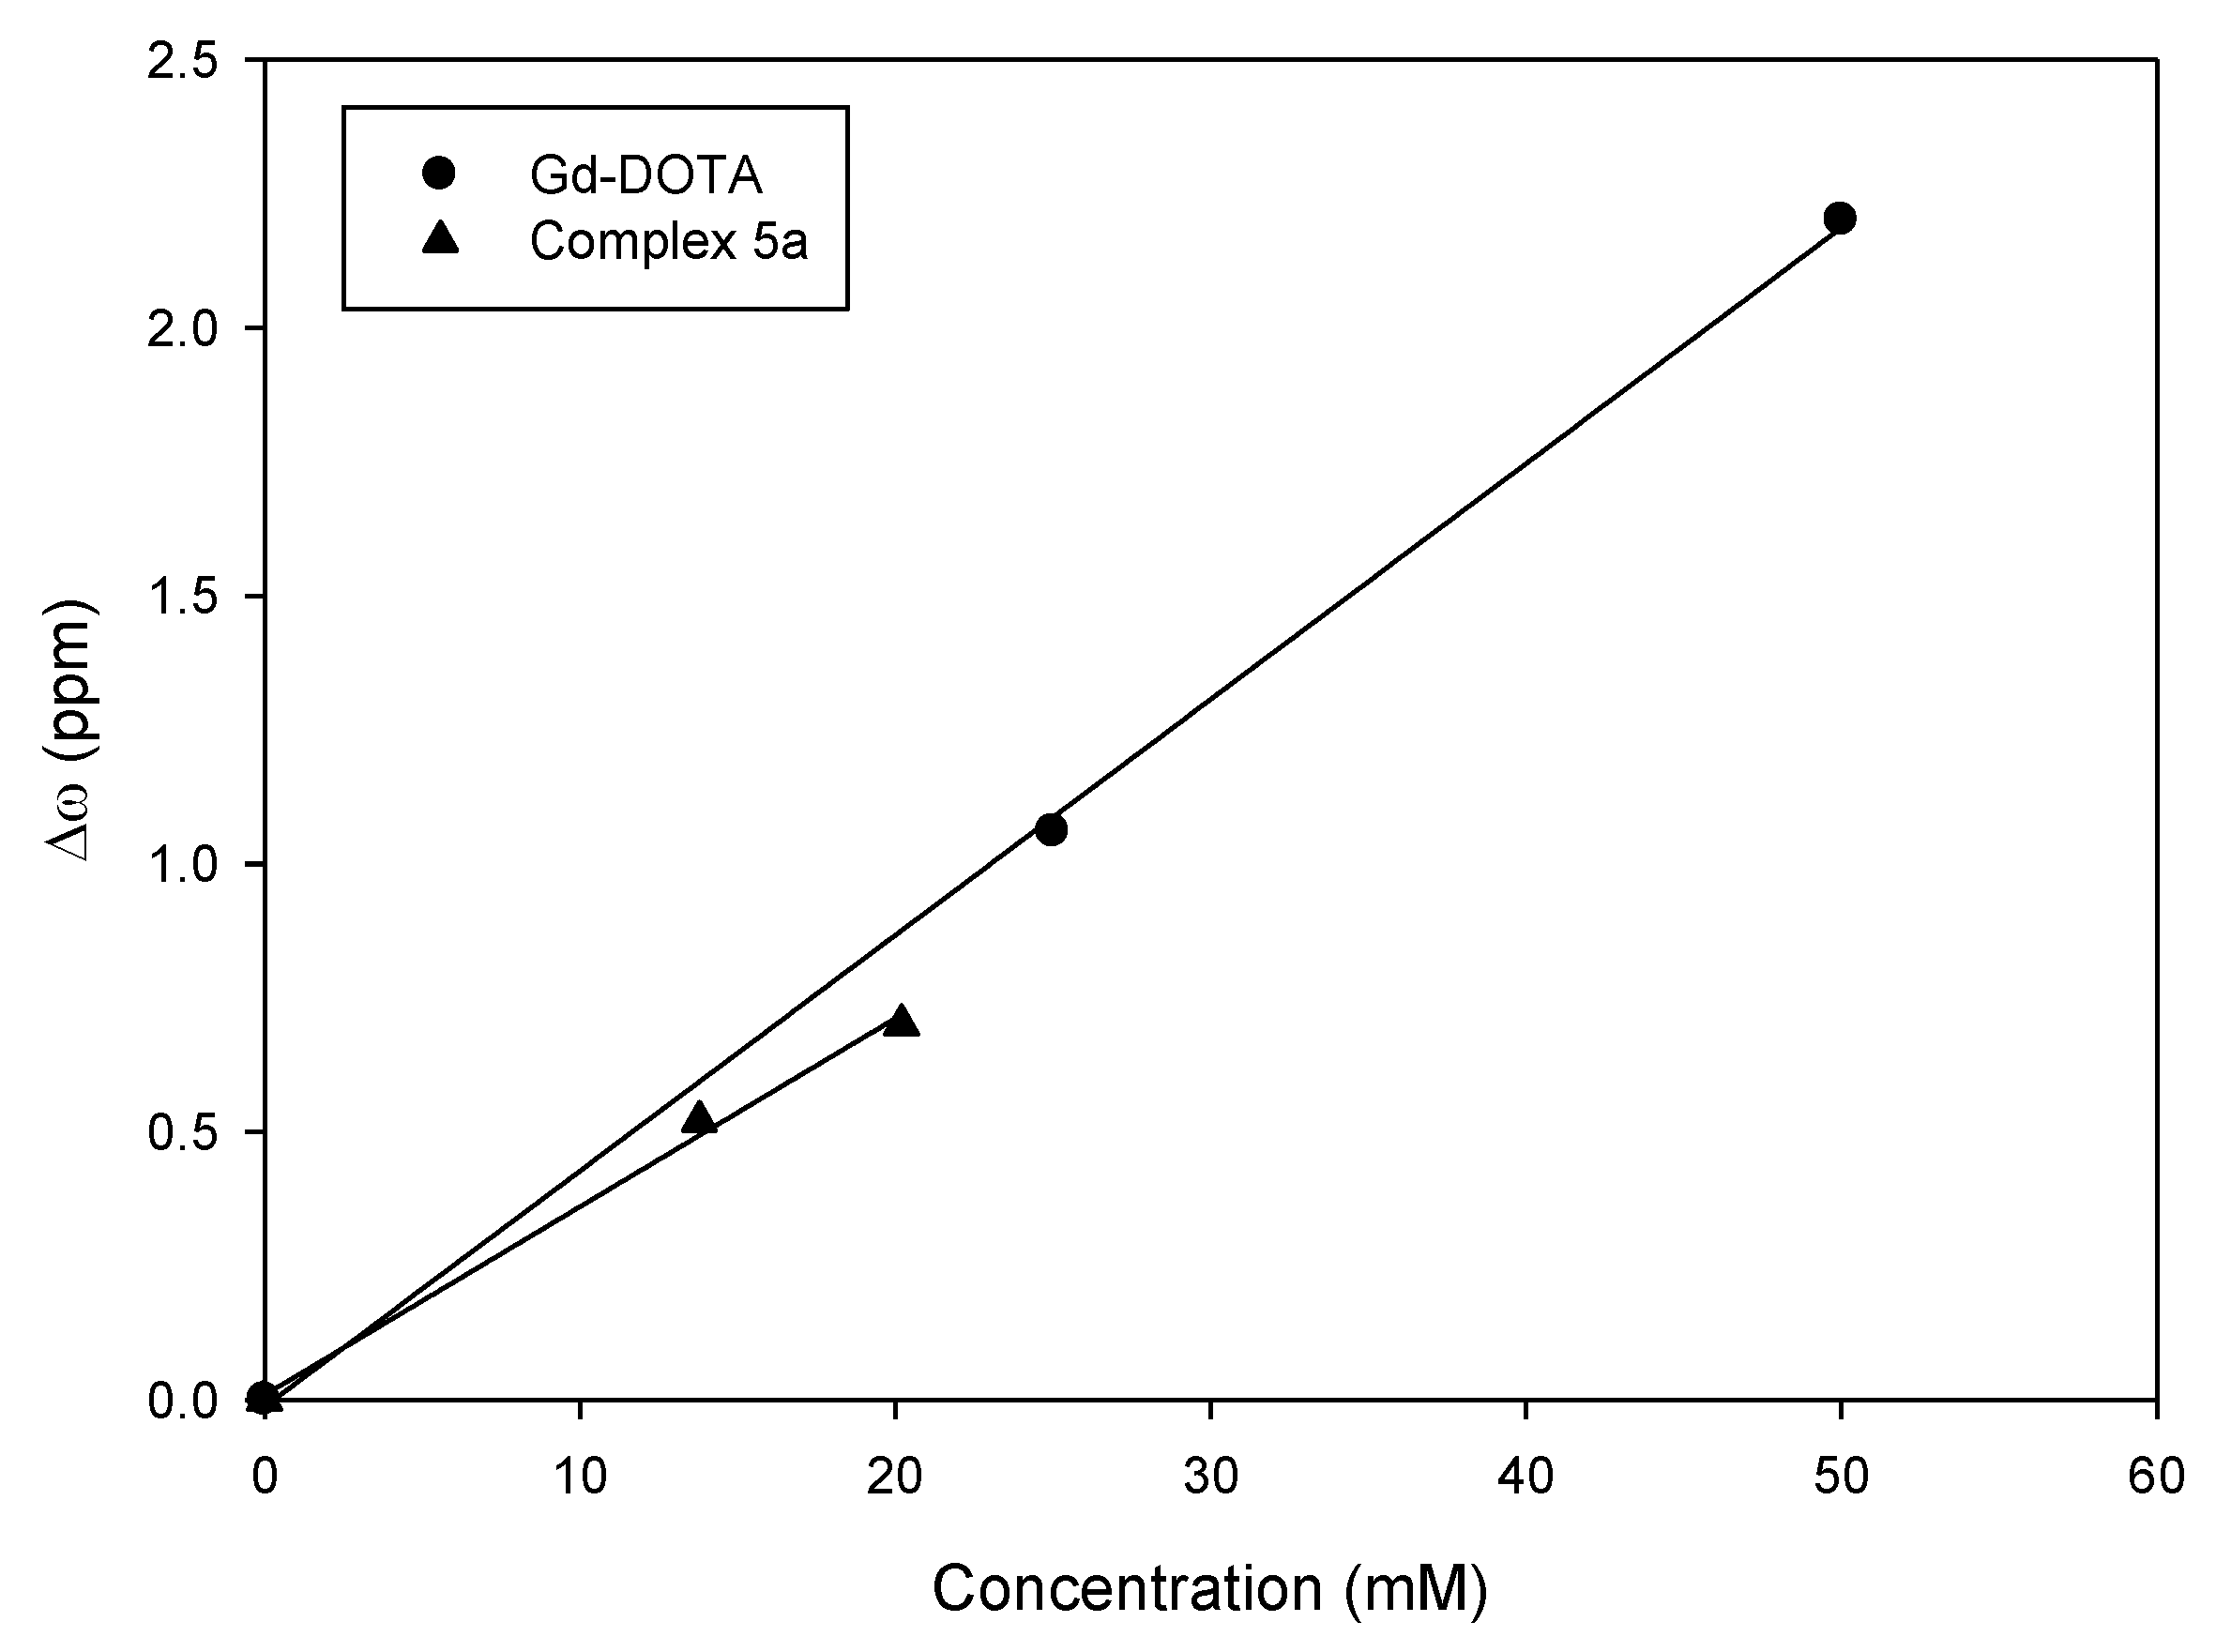
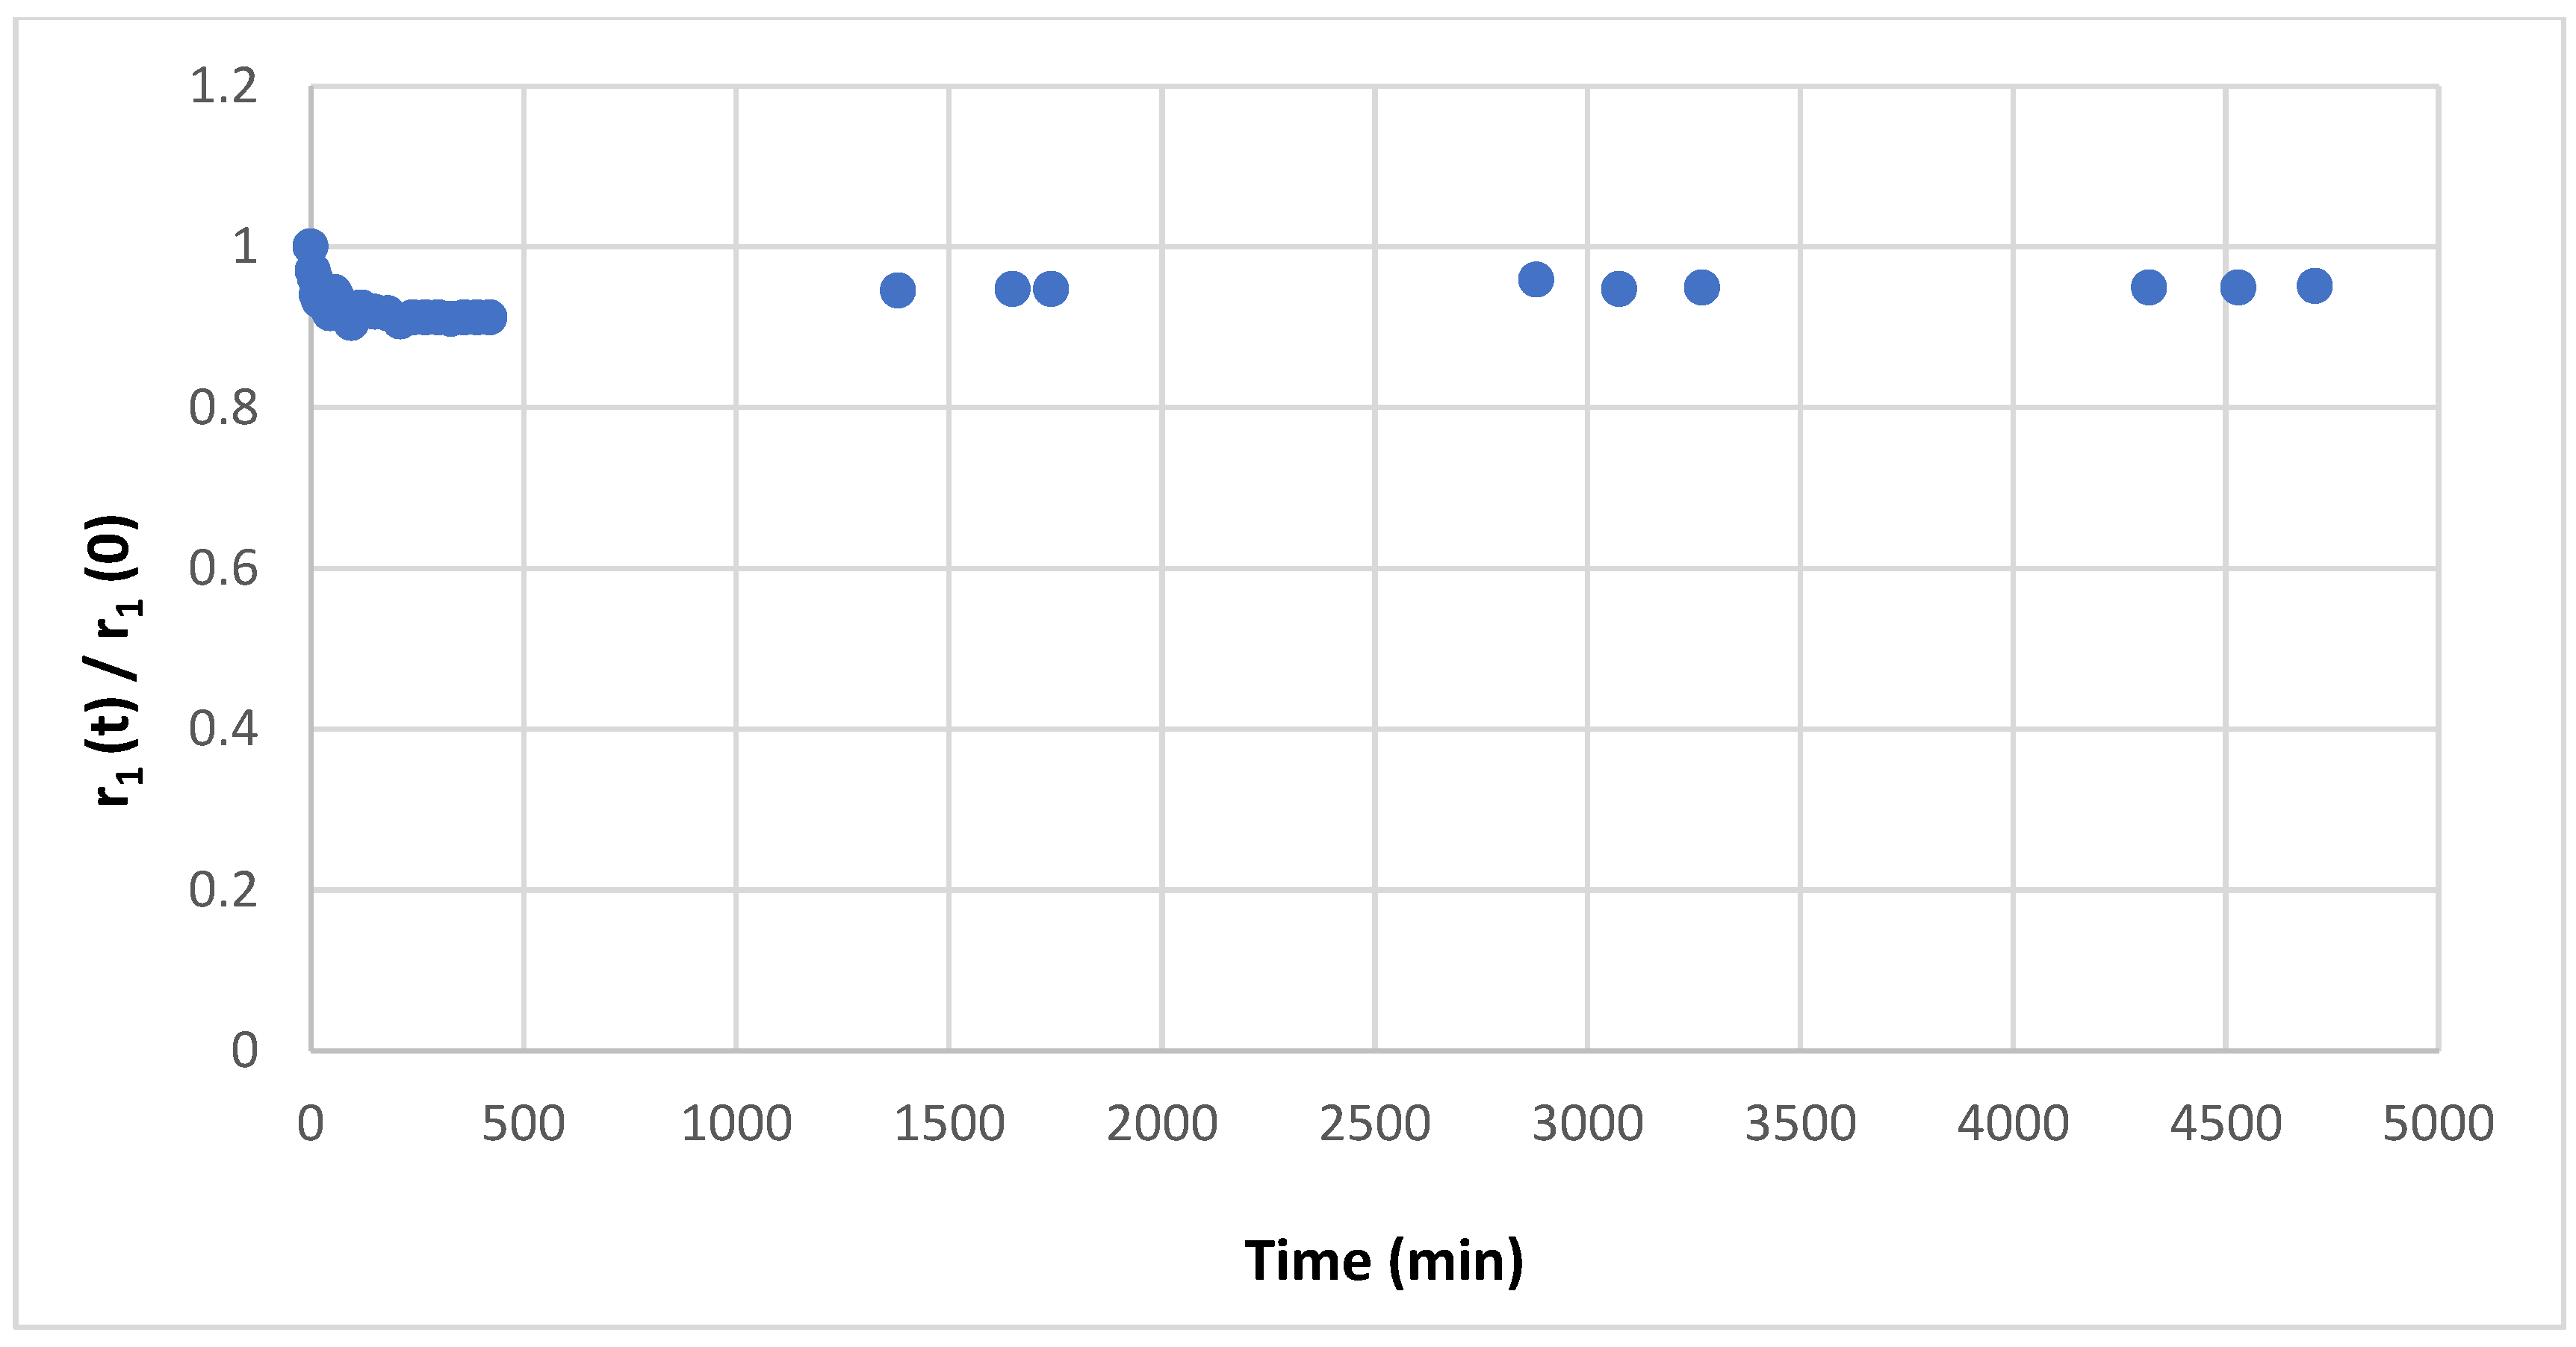
2.4. Transmetallation

In order to evaluate the thermodynamic stability and kinetic inertness of the synthesized complexes, the possible dechelation of gadolinium complex has been studied in the presence of endogenous ion, Zn2+ [51].
For that purpose, equal concentrations of the paramagnetic complex (7a) and zinc ions were added in phosphate buffer solution (pH = 7) and the paramagnetic relaxation rate (R1p) was measured (Figure 5). If the transmetallation reaction between Gd3+ and Zn2+ ions occurs, the gadolinium will precipitate as GdPO4, leading to a decrease of R1p.
The gadolinium complex shows no significant variation of paramagnetic relaxation rate R1p, confirming the tendency of DOTA-derivative compounds to avoid the release of gadolinium ions in vivo.

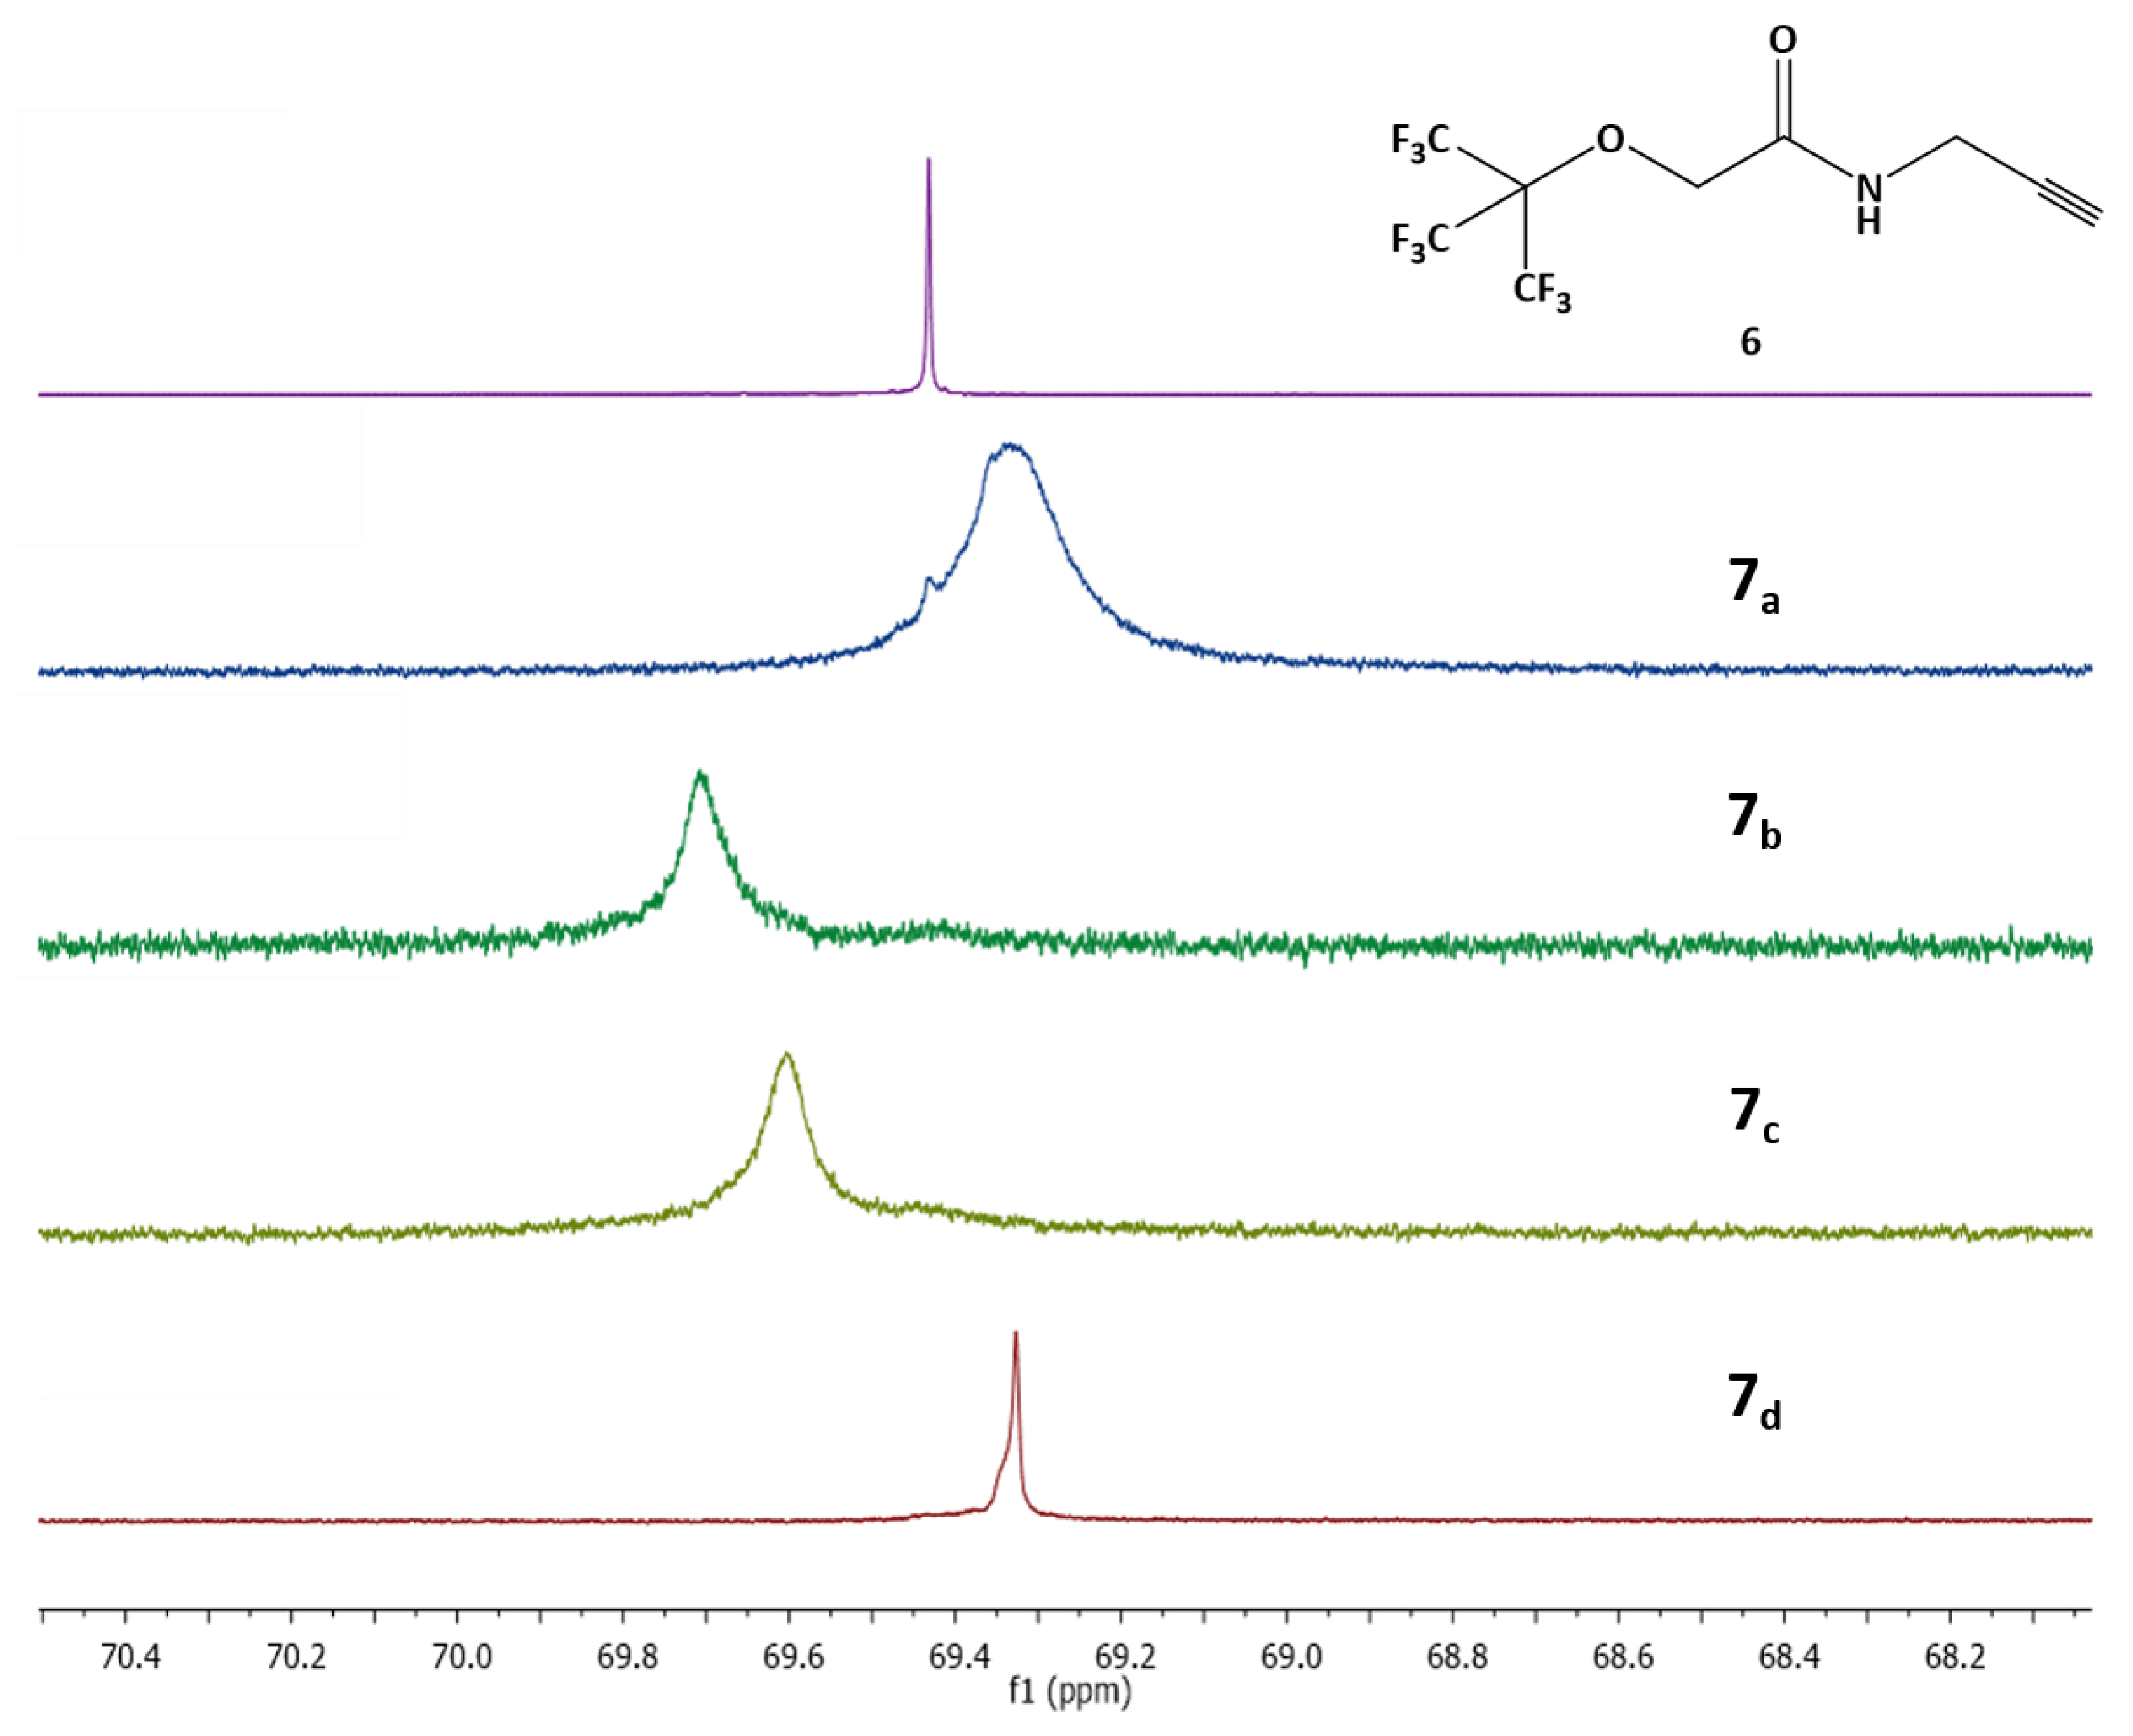
2.5. 19F Measurements

The 19F NMR spectra of the four synthesized complexes 7a–d were recorded at 11.75 T and 37 °C (Figure 6) and compared to the corresponding fluorinated diamagnetic compound. The presence of the paramagnetic effect of the different lanthanides on the fluorine atoms can be evidenced by the broadening and the shift of the NMR peak.
In order to evaluate the efficacy of the different complexes for fluorine MRI, the fluorine T1 and T2 relaxation times were measured at 11.75 T and 37 °C for each complex. They have to be as short as possible in order to decrease the acquisition time during the clinical examinations. For the corresponding diamagnetic compound, the fluorine atoms are characterized by long T1 and T2 relaxation times (2.0 and 1.8 s, respectively). Those times are considerably shortened (Table 2) to 13.3 and 8.6 milliseconds for T1 and T2 respectively, when the fluorinated groups are combined with Gd3+ (7a, 1.7 mM). Longer fluorine T1 and T2 relaxation times were obtained in the presence of dysprosium, terbium and europium: 206.6 and 77.3 ms for 7b (1.3 mM), 468.1 and 186.9 ms for 7c (1.9 mM) and 1380 and 1177 ms for 7d (2.0 mM). These results are quite logical considering the paramagnetic effect of each lanthanide ion as described in the literature [12].
The evolution of the fluorine relaxation times with the concentration was also measured for the four complexes. It appears that no concentration dependence was observed for the studied concentration range (from 0.5 to 5 mM in lanthanide center). These results are explained by the predominantly intramolecular interaction of the paramagnetic center with fluorine atoms (dipolar interaction) compared to an intermolecular interaction. In other words, the paramagnetic center mainly affects fluorines within the same molecule.
Moreover, proton and fluorine longitudinal relaxation times were measured in a 1 mM solution of complex 7a prepared in Seronorm® in order to evaluate the possible interaction with blood serum (Table 3).
The obtained results show a noticeable decrease of the water proton relaxation time, corresponding to a weak interaction of the complex with the blood serum. The fluorine relaxation time is however not affected, meaning that the conformation of the molecule remains unchanged.
Finally, the stability of complex 7a according to the pH was studied by measuring proton and fluorine longitudinal relaxation times at 37 °C and 20 and 500 MHz respectively, and no significant effect of the pH was observed.
Considering the obtained results, gadolinium, dysprosium and terbium complexes can be considered as promising for a future application in fluorine MRI, whereas the europium complex is characterized by too long T1 and T2 relaxation times.
However, it must be highlighted that short relaxation times, as obtained for the gadolinium complex, involve the recording of information during a very short timeframe. Conventional MRI tools do not always possess hardware and software able to detect nuclei with such short relaxation times. However, over the last decade, new pulse sequences have been developed to detect very fast relaxing spins [35]. Those sequences are called Ultrashort Time Echo (UTE) and Zero Time Echo (ZTE) and allow information to be recorded even when the relaxation times are very short (in a range of few milliseconds).
In this field, Parker [43] and Platas-Iglesias et al. [44] have already described very short fluorine relaxation times when combined to gadolinium ions. Platas-Iglesias et al. reported fluorine T1 and T2 below 1 ms for distances between 19F and Gd (III) ion estimated to be in the 7.4 and 9.1 Å range.
To get insights on the origin of the very short relaxation times T1 and T2 for the gadolinium complex, molecular dynamics (MD) simulations were performed. In practice, the conformation of 7a coordinated with three water molecules was probed, focusing in particular on how far the fluorine atoms sit from the gadolinium center. Introducing three water molecules in the simulations of the complexes, while only one is coordinated experimentally, allows the dynamic exchange of coordinated water molecules to be accounted for, which could not be reproduced if only one water molecule was considered.
As a prerequisite to the molecular dynamics calculations, the Dreiding force field [52], which was not originally specifically developed to study lanthanide derivatives, was first adapted to make it suitable for reproducing intra and intermolecular interactions of gadolinium-based contrast agents (see the details in the experimental section). With this reparameterized Dreiding force field, we performed a conformational search analysis to identify the most stable structure of 7a. Then, molecular dynamics simulations with that structure as the starting point were run at room temperature, and the distances between the gadolinium center and fluorine atoms were measured along the MD trajectories (see Figure 7). Interestingly, the results show that the vast majority of fluorine atoms are sitting at distances ranging from 4.5 Å to 10 Å from the gadolinium center. This means that the molecule is folded, since the length of the fully extended fluorinated chain is ~25Å.
The driving force of the folding process is, however, not directly linked to specific interactions between fluorine and gadolinium atoms, due to their broad distance distribution. Instead the folding originates from strong interactions between the hydrogen atom of the amine group close to the terminal nonafluoro-tert-butyl ether and the negatively-charged oxygen atoms of the carboxylate groups of the DOTA ligand. Indeed, the radial distribution function analysis in Figure 7 shows an intense peak at ~2 Å characteristic of strong specific H-bond interactions. Those interactions therefore govern the distance between the fluorine and gadolinium atoms since it avoids fluorine atoms getting too close to the gadolinium center but also too far from it, due to the distance between the “locking” amine function and the fluorine atoms.
As a consequence, most of the fluorine atoms lie at distances between 4.5 and 10Å from the gadolinium center during the MD simulations, and only very seldomly can a fluorine atom reach distances as small as 3.5 Å. This could explain the very short measured relaxation times and also suggests that designing strategies to avoid such small distances could move the range of performances of 7a-like compounds to values compatible with the experimental requirements for medical imaging.

3. Materials and Methods

DOTA-GA anhydride was purchased from CheMatech (Dijon, France). All other reagents and solvents were obtained from commercial sources and used without further purification.
6-bromohexanoic acid (>96%) and sodium azide (>98%) were purchased from TCI Chemicals (Belgium). N-Boc-ethylenediamine (98%) was purchased from Alfa Aesar, sodium sulfate (≥99.5%) from J. T. Baker Chemicals and TBTU (97%) from Activate Scientific. Diethylether (≥99.5%), ethyl acetate (≥99%) and dichloromethane (≥99%) were purchased from Chemlab (Belgium). Anhydrous DMF (≥99.8%), DIPEA (≥99%), formic acid (98–100%), triethylamine (≥99.5%), lanthanide chloride (99%) and propargylamine (98%) were purchased from Sigma-Aldrich (Belgium).
Sample concentrations were measured either using relaxometry or ICP-OES (using a Varian Liberty Series II spectrometer). For relaxometric measurements, the samples were digested in acidic conditions (H2O/HNO3, 1:1, v:v) and longitudinal relaxation rates were compared to the relaxivity of GdCl3 1mM (11.76 s−1). For ICP-OES measurements, a calibration curve was built for each lanthanide ion, and samples of complexes 7a to 7d were compared to determine their concentration.

3.1. 1H Relaxation Measurements and 1H NMRD Profiles

Longitudinal (R1) and transverse (R2) relaxation rate measurements at 0.47, 1.41 and 7.05 T were obtained on Minispec mq 20, mq 60 spin analyzers and a Bruker Avance 300 NMR spectrometer (Bruker, Germany), respectively.
Nuclear magnetic relaxation dispersion (NMRD) profiles were recorded in water with a field cycling relaxometer (STELAR, Mede, Italy) measuring the longitudinal relaxation rates (R1) in a magnetic field range extending from 0.24 mT to 1 T. The temperature of the samples was adjusted to 37 °C with a precision of 0.1 °C.

3.2. 17O NMR

17O NMR measurements of the water chemical shift were performed on an Avance II 500 (11.7 T, 67.8 MHz) NMR spectrometer (Bruker®) at 37 °C.
The transverse 17O relaxation rates (1/T2) were measured in an aqueous solution of the complex 7a (50 mM) in the temperature range 290–350 K, on a Bruker Avance II 500 spectrometer. The temperature was calculated according to a previous calibration with ethylene glycol and methanol. Proton decoupling was applied during all the acquisitions. Transverse relaxation times (T2) were obtained using the measurement of the signal width at mid-height. The data are presented as the reduced transverse relaxation rate 1/T2R = 55.55/([Gdcomplex].q.T2P), where [Gdcomplex] is the molar concentration of the complex, q is the number of coordinated water molecules and T2P is the paramagnetic transverse relaxation rate obtained after subtraction of the diamagnetic contribution from the observed relaxation rate.

3.3. T1-Weighted Images

MR imaging of complexes 5a and 7a were performed using a 1.0 T MRI device (ICON, Bruker) using a T1-weighted spin−echo sequence (TR = 45 ms, TE = 5 ms, resolution = 192 × 128 μm, slice thickness = 1.25 mm, 4 averages). Solutions of complexes 5a and 7a were tested in the 0.5−2 mM range.

3.4. Transmetallation

The transmetallation reaction was monitored with a Bruker mq20 minispec relaxometer (0.47 T). The evolution of the paramagnetic proton longitudinal relaxation rate was measured at 37 °C in pH = 7 phosphate buffer solutions containing 2.5 mM of the gadolinium complex 7a as well as 2.5 mM of zinc chloride.

3.5. 1H–13C–19F Measurements

1H, 13C and 19F NMR spectra were recorded on a Bruker Avance II 500 (500 MHz) spectrometer (Karlsruhe, Germany) using d-chloroform, deuterium oxide or d4-methanol as solvents. Chemical shifts (δ) are reported in ppm and the following abbreviations were used: br for broad, s for singlet, d for doublet, t for triplet, q for quadruplet and m for multiplet.
Fluorine T1 and T2 relaxation times were measured at 37 °C and 500 MHz using an IR sequence for T1 measurements and a “cpmg” sequence for T2.
1.
Synthesis of 6-azidohexanoic acid (1)
To an aqueous solution of sodium azide (2 eq, 0.5084 g, 7.820 mmol) was added 6-bromohexanoic acid (1 eq, 0.7655 g, 3.925 mmol). The mixture was stirred overnight at 55 °C. After completion of the reaction, the reaction mixture was acidified (pH 5) and extracted with diethyl ether (3 × 50 mL), dried with anhydrous sodium sulfate, filtered, and evaporated under reduced pressure until the obtention of a pale yellow oil (1) (0.4155 g; 2.644 mmol, 67.35%).
1H NMR (500 MHz, CDCl3, 25 °C): δH = 1.43 (m, 2H, (CH2)2-CH2-(CH2)2), 1.59–1.69 (m, 4H, CH2-CH2-CH2-CH2-CH2), 2.37 (t, 2H, CH2-CH2-COOH), 3.27 (t, 2H, N3-CH2-CH2), 11.08 (s br, 1H, COOH).
13C NMR (125 MHz, CDCl3, 25 °C): δC = 24.09 (CH2-CH2-CH2-COOH), 26.10 ((CH2)2-CH2-(CH2)2), 28.48 (N3-CH2-CH2-CH2), 33.79 (CH2-CH2-COOH), 51.15 (N3-CH2-CH2), 179.86 (COOH).
2.
Synthesis of tert-butyl (2-(6-azidohexanamido)ethyl) carbamate (2)
To a stirred suspension of 1 (1 equivalent, 0.5635 g, 3.585 mmol) in N,N-dimethylformamide were added 1.1 equivalent of N-Boc-ethylenediamine (0.622 mL, 3.944 mmol), 1.2 equivalent of O-(benzotriazol-1-yl)-N,N,N′,N′-tetramethyluronium tetrafluoroborate (TBTU; 1.3873 g, 4.321 mmol) and finally 2.5 equivalents of N,N-diisopropylethylamine (DIPEA ; 1.478 mL, 8.486 mmol). The solution was stirred for 4 h at room temperature. The crude mixture was diluted in water and extracted with ethyl acetate (3 × 30 mL). The organic fractions were collected, washed with NaCl saturated solution, dried with anhydrous sodium sulfate, filtered and evaporated under reduced pressure to yield a pale yellow crude product. The solid was purified using column chromatography over silica gel (20% Hexane/80% EtOAc). The solvent was evaporated under reduced pressure yielding to a yellow solid (2) (0.8740 g, 2.919 mmol, 81,43%).
MS-ESI calculated for C13H25N5NaO3+ (M + Na)+ 322.1850, found 322.1
1H NMR (500 MHz, CDCl3, 25 °C): δH = 1.44 (m, 11H, (CH2)2-CH2-(CH2)2 + C-(CH3)3); 1.58–1.69 (m, 4H, CH2-CH2-CH2-CH2-CH2), 2.18 (t, 2H, CH2-CH2-C(O)-NH), 3.27 (t, 4H, N3-CH2-CH2 + NH-CH2-CH2-NH), 3.36 (t, 2H, NH-CH2-CH2-NH), 4.91 (s br, 1H, CH2-C(O)-NH-CH2), 6.21 (s br, 1H, CH2-NH-C(O)-O).
13C NMR (125 MHz, CDCl3, 25 °C): δC = 25.10 (CH2-CH2-CH2-C(O)-NH), 26.36 ((CH2)2-CH2-(CH2)2), 28.35 (C-(CH3)3), 28.58 (N3-CH2-CH2-CH2), 36.38 (CH2-CH2-C(O)-NH), 40.24 (HN-CH2-CH2-NH), 40.86 (HN-CH2-CH2-NH), 51.24 (N3-CH2-CH2), 79.74 (C(CH3)3), 157.08 (CH2-C(O)-NH), 173.46 (NH-C(O)-O).
3.
Synthesis of N-(2-aminoethyl)-6-azidohexanamide (3)
To a solution of dichloromethane and compound 2 (1.426 g, 4.763 mmol) was added formic acid (20%). The reaction mixture was stirred for 18 h at 55 °C. The reaction mixture was evaporated under reduced pressure until the obtention of a brown oil (3) with quantitative yield.
MS-ESI calculated for C8H18N5O+ (M + H)+ 200.1506, found 200.1
1H NMR (500 MHz, D2O, 25 °C): δH = 1.39 (m, 2H, (CH2)2-CH2-(CH2)2), 1.59–1.66 (m, 4H, CH2-CH2-CH2-CH2-CH2), 2.31 (t, 2H, CH2-CH2-C(O)-NH), 3.15 (t, 2H, NH-CH2-CH2-NH), 3.33 (t, 2H, N3-CH2-CH2), 3.50 (t, 2H, NH-CH2-CH2-NH).
13C NMR (125 MHz, CD3OD, 25 °C): δC = 26.15 (CH2-CH2-CH2-C(O)-NH), 27.39 ((CH2)2-CH2-(CH2)2), 29.60 (N3-CH2-CH2-CH2), 36.69 (CH2-CH2-C(O)-NH), 38.47 (C(O)- HN-CH2-CH2-NH), 40.76 (CH2-CH2-NH2), 52.27 (N3-CH2-CH2), 177.12 (CH2-C(O)-NH).
4.
Synthesis of 2,2′,2″-(10-(4-((2-(6-azidohexanamido)ethyl)amino)-1-carboxy-4-oxobutyl) -1,4,7,10-tetraazacyclododecane-1,4,7-triyl)triacetic acid (4)
To a solution of compound 3 (1 equivalent, 0.521 g, 2.615 mmol) in anhydrous N,N-dimethylformamide (5 mL) under nitrogen atmosphere were added 2.5 equivalents of anhydrous triethylamine (1 mL, 7.175 mmol) and 0.9 equivalent of DOTA-GA anhydride (1 g, 2.181 mmol). The reaction mixture was heated to 60 °C and stirred for 6 to 8 h. The reaction medium was cooled to ambient temperature and added dropwise in cold diethyl ether where the crude product precipitated. The solution was centrifuged, and the liquid phase was poured off. Purification of the white crude product was made using flash chromatography on reverse-phase silica gel 60 RP-18, eluting with H2O/ACN (9:1) to give the purified compound 4 (0.955 g, 1.452 mmol) as a white solid with 66.7% yield.
MS-ESI calculated for C27H48N9O10+ (M + H)+ 658.35, for C27H47N9NaO10+ (M + Na)+ 680.33, C27H46N9Na2O10+ (M + 2 Na − 1 H)+ 702.32, found 658.3, 680.3, 702.3
1H NMR (500 MHz, D2O, 25 °C): δH = 1.34 (m, 2H, (CH2)2-CH2-(CH2)2), 1.58 (m, 4H, CH2-CH2-CH2-CH2-CH2), 2.24 (t, 2H, CH2-CH2-C(O)-NH), 3.29 (m, 6H, NH-CH2-CH2-NH2 + N3-CH2-CH2 + NH-CH2-CH2-NH2). Peaks from the DOTA-GA center: 1.84, 1.94, 2.45, 3.06, 3.39, 3.59, 3.80 (broad peaks difficult to attribute).
5.
Synthesis of {(2,2′,2″-(10-(4-((2-(6-azidohexanamido)ethyl)amino)-1-carboxylato-4-oxobutyl)-1,4,7,10-tetraazacyclododecane-1,4,7-triyl)triacetate)}lanthanide (5)
To an aqueous solution of compound 4 (1 equivalent, 0.8376 g, 1.273 mmol) was added dropwise 1.1 equivalent of lanthanide chloride (LnCl3.6H2O where Ln = Gd3+, Dy3+, Tb3+, Eu3+). The pH was adjusted between 5.5 and 6.5 and the reaction mixture was stirred for 4 h. The excess of lanthanide ions was eliminated with Chelex® 100 to give the pure compound 5a–d. An arsenazo III test was used in order to confirm the total elimination of free lanthanide ions. One drop of the reaction mixture is added in 1 mL of phosphate buffer pH 7.4 followed by the addition of one drop of pyridine and arsenazo III solutions. If the reaction mixture still contains free lanthanide ions, the solution appears blue. If not, it appears purple.
MS-ESI calculated for C27H43O10N9Gd- (M) - 811.25, found 811.24; for C27H43O10N9Dy (M) 817.24, found 817.25; for C27H43O10N9Tb (M) 812.24, found 812.24; for C27H43O10N9Eu- (M)- 806.23, found 806.24.
6.
Synthesis of 2-(nonafluorotert-but-oxy)-N-(prop-2-yn-1-yl)acetamide (6)
To a solution of propargylamine (1 equivalent, 0.109 mL, 1.702 mmol) in N,N-dimethylformamide (5 mL) were added 0.8 equivalent of (nonafluoro-tert-butoxy)acetic acid (0.400 g, 1.36 mmol), 1.5 equivalent of O-(benzotriazol-1-yl)-N,N,N′,N′-tetramethyluronium tetrafluoroborate (TBTU; 0.8188 g; 2.55 mmol) and 3 equivalents of N,N-Diisopropylethylamine (DIPEA, 0.888 mL; 5.098 mmol). The reaction mixture was stirred overnight at room temperature. The reaction medium was diluted in 20 mL of water and extracted with ethyl acetate (3 × 30 mL). The organic fractions were collected, washed with NaCl saturated solution, dried with anhydrous sodium sulfate, filtered and evaporated under reduced pressure to yield an orange oil. The crude product was purified using flash chromatography on silica gel, eluting with Hexane/EtOAc gradient (until 20%). The solvent was evaporated under reduced pressure yielding to an orange solid (6) (62.02%, 0.2793 g, 0.843 mmol).
1H NMR (500 MHz, CDCl3, 25 °C): δH = 2.27 (t, 1H, NH-CH2-CΞCH), 4.11 – 4.13 (dd, 2H, NH-CH2-CΞCH), 4.52 (s, 2H, O-CH2-C(O)), 6.45 (s br, 1H, C(O)-NH-CH2).
13C NMR (125 MHz, CDCl3, 25 °C): δC = 28.98 (CΞCH), 67.53 (CH2-CΞCH), 72.19 (C(O)-NH-CH2-C), 78.35 (O-CH2-C(O)), 79.26–79.98 (2J 13C–19F: 30.22 Hz; O-C-(CF3)3), 116.49 – 123.44 (1J 13C–19F : 292.11 Hz; C-(CF3)3), 165.24 (CH2-C(O)-NH).

3.6. Synthesis of Complexes 7a–d

To a solution of nonafluorinated compound 6 (0.0216 g, 0.06523 mmol) in N,N-dimethylformamide (0.5 mL) was added an aqueous solution (3 mL) of 0.8 equivalent of compound 5a–d, 0.2 equivalent of copper (II) acetate, 1 equivalent sodium ascorbate and 1 equivalent of N,N-Diisopropylethylamine (DIPEA). The reaction mixture was placed in a microwave for 20 min at 80 °C. The solution was purified by dialysis and extraction of the excess compound 6 with chloroform. The final products were lyophilized yielding the fluorinated complexes 7a–d as white powder (yield: 7a: 55%; 7b: 74%; 7c: 70%; 7d: 70%).
HR-MS (ESI): m/z calculated for C36H49O12N10Gd (M) 1138.2596, found 1138.2609; for C36H49O12N10Dy (M) 1144.2640, found 1144.2616; for C36H49O12N10Tb (M) 1143.2641, found 1143.2642; for C36H49O12N10Eu (M) 1135.2586, found 1135.2576.

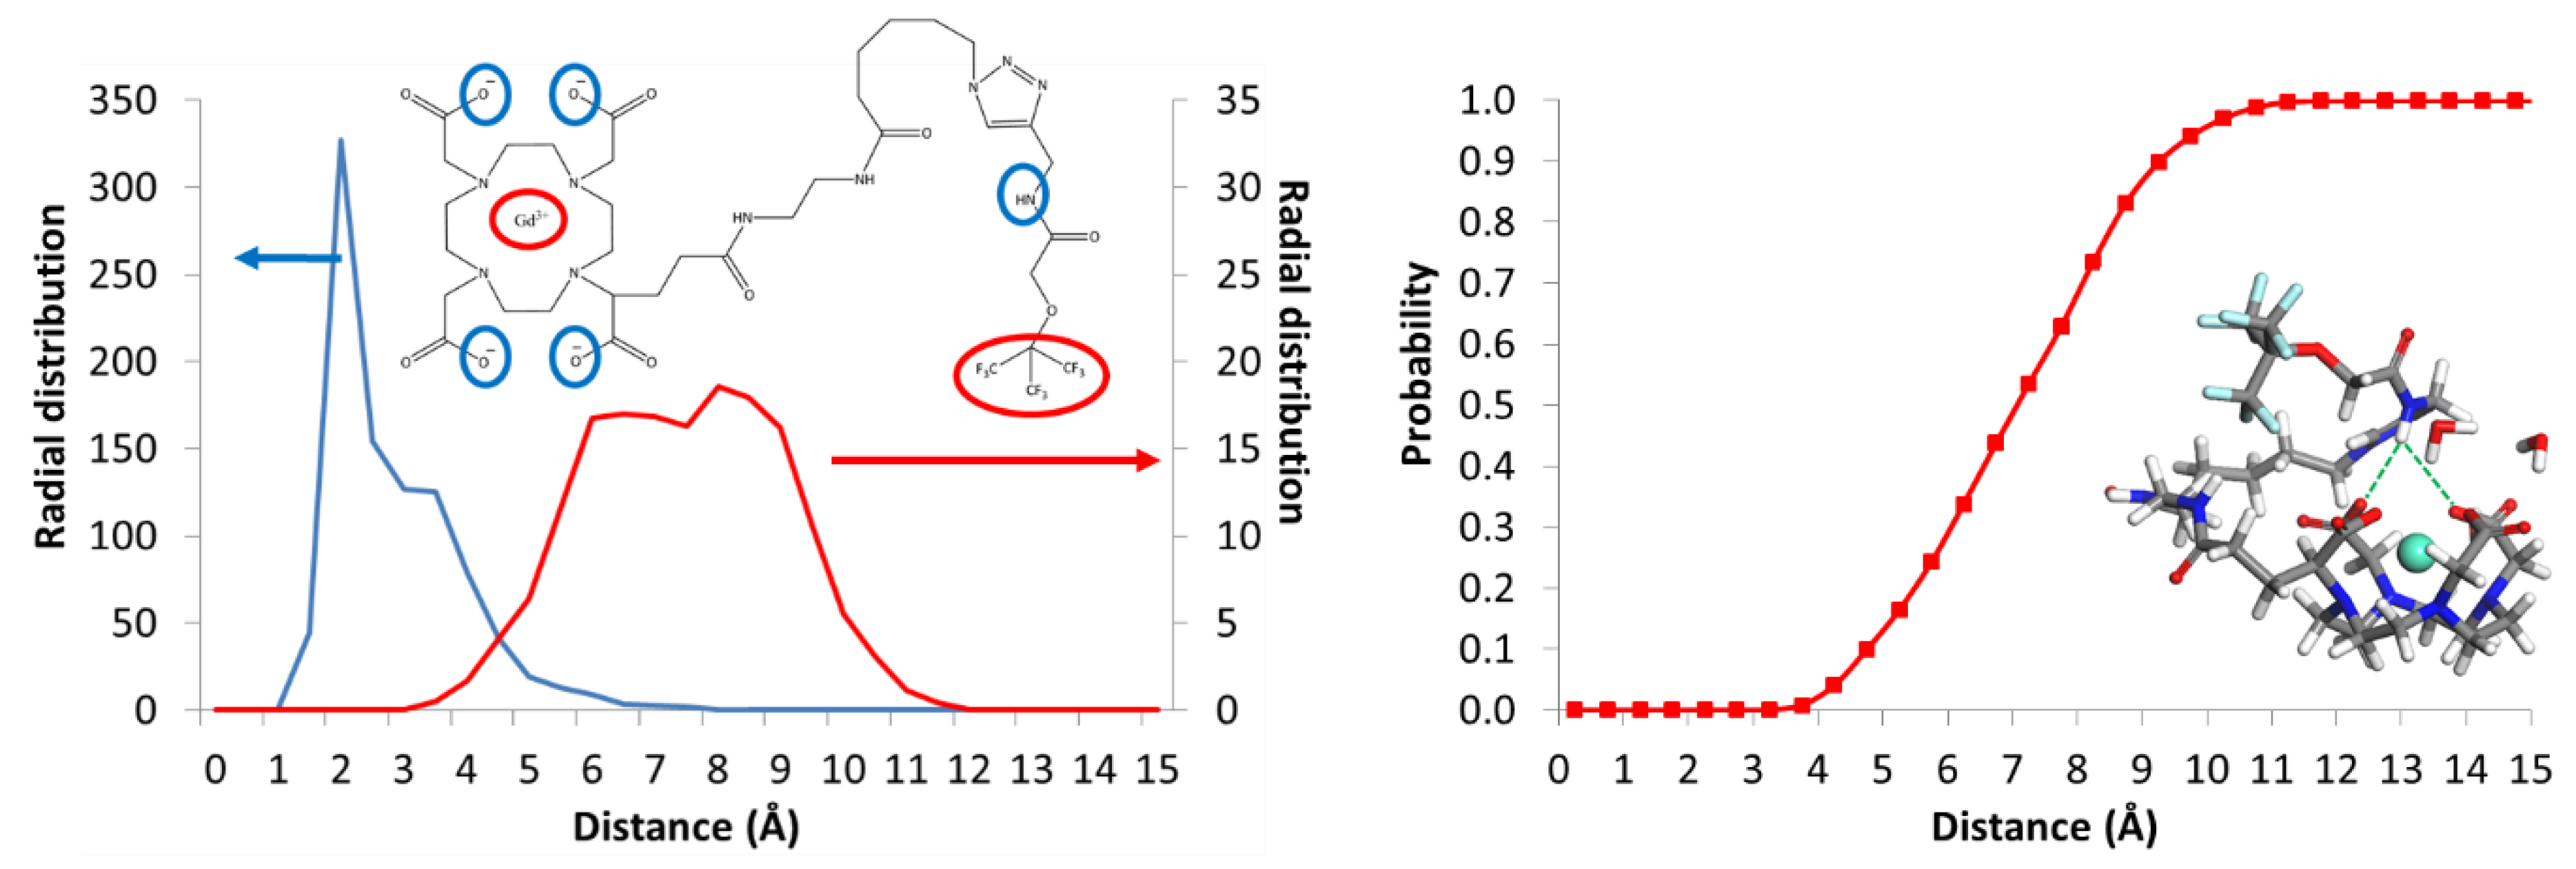
3.7. Modeling Strategy

To probe the conformation of 7a at room temperature, molecular dynamics simulations were performed with the Materials Studio 2018 (MS2018) package [Dassault Systèmes BIOVIA, Materials Studio 2018, San Diego: Dassault Systèmes, 2018]. Since none of the MS2018 available force fields have been specifically developed for Gd derivatives, the parametrization of the Dreiding force field was adapted by comparing the impact of the new parameters on the simulated conformation of Gd (DOTA)-coordinated by three water molecules to experimental results [53].
Introducing three water molecules in the simulations of the complexes, while only one is coordinated experimentally, allows the dynamic exchange of coordinated water molecules to be accounted for, which could not be reproduced if only one water molecule was considered. This is illustrated in Figure 8 through the time evolution of the distance between the gadolinium center and the oxygen atoms of the water molecules. The best theory-experiment agreement was found when (i) transferring the van der Waals parameters of a gadolinium atom from the universal force field [54] (well depth of 0.005 kcal/mol and equilibrium distance of 3.368 Å), (ii) adapting the van der Waals parameters corresponding to Gd–N (well depth of 10 kcal/mol and equilibrium distance of 2.655 Å) and Gd–O (well depth of 10 kcal/mol and equilibrium distance of 2.365 Å) interactions, (iii) defining atomic charges to Mulliken values extracted from the lowest energy DFT-optimized structure (using the B3LYP functional, the 6–31G** basis set for all atoms except the Gd center for which the SDD pseudopotential has been used) and (iv) considering that the electrostatic term follows Coulomb’s law (r-1) instead of the shielded approximation (r-2) defined as default. By using this procedure for Gd(DOTA)- solvated by three water molecules, we obtain an energy difference of 0.70 kcal/mol between the well-known square antiprismatic (SAP) and twisted square antiprismatic (TSAP) structures, which translates, according to a Maxwell-Boltzmann population analysis, into 76% of SAP structures, in good agreement with the reported value of ~85% [55].
7a was then built from the Gd (DOTA)-moiety described above, to which a fluorinated chain was added. Since the latter only contains common atoms that are already accurately described in the Dreiding force field, no further modifications were introduced. The atomic charges of the fluorinated chain were defined using the Gasteiger method available in MS2018.
The lowest energy structure of 7a was then extracted from a conformational search procedure involving four steps: (i) all starting structures (differing by the conformation of the fluorinated chain) are put in a cubic unit cell (cell parameter = 40 Å) and optimized at the molecular mechanics level; (ii) 1ns-quenched MD runs (NVT fixed, T = 500 K, quench frequency = 5 ps) are then performed on each optimized structure; (iii) on the most stable structures obtained at step (ii), successive 1ns-quenched MD runs (NVT, T = 298 K, quench frequency = 5 ps) are performed at room temperature until the energy between two successive quenched MD no longer decreases. The lowest energy structure was then submitted to a 1ns-long equilibration MD (NVT, T = 298 K) followed by a longer data-acquisition MD (NVT, T = 298 K, 5 ns) from which structures were extracted every 5 ps. Radial distribution functions between the gadolinium core and the fluorine atoms and between the hydrogen atom of the amine function close to the terminal fluoroester and the negatively-charged oxygen atoms of the carboxylate groups of the DOTA ligand were then built from the 1001 snapshots of the last MD run to estimate how far the fluorine atoms are from the gadolinium atom and the driving force for the folding process of 7a. Finally, the cumulative probabilities were built by calculating the Gd-F distance for 1001 snapshots saved along the trajectories of five different MD runs. Those five runs were performed in order to improve the accuracy of the cumulative probabilities.

4. Conclusions

In this work, the effect of several lanthanide ions on fluorine relaxation times has been studied in order to optimize the numerous advantages of fluorine imaging while excluding its drawback such as long relaxation times and low solubility in aqueous media.
After the synthesis of the four fluorinated lanthanides complexes, several physico-chemicals characterizations were performed showing that the gadolinium, dysprosium and terbium complexes are promising for a future use in 19F MRI due to their relatively short fluorine relaxation times. Nevertheless, for the gadolinium complex, the induced T1 and T2 are so short that it would require the use of new sequences in 19F MRI but would give the benefit of a good signal-to-noise ratio and then a good contrast in 1H MRI. On the contrary, while dysprosium and terbium complexes could be used with classical sequences in 19F MRI, they would not produce any useable contrast in 1H MRI.
Several biological characterizations are needed and will be performed in the near future such as toxicity and biocompatibility tests as well as in vitro and in vivo tests on these three complexes.

Author Contributions

All authors have read and agree to the published version of the manuscript. Conceptualization, E.H., C.H. and S.L. Formal analysis, E.H., C.H., S.B. and V.L. Funding acquisition, L.V.E., R.N.M. and S.L. Investigation, E.H., C.H. and V.D.K. Methodology, E.H., C.H., V.D.K. and S.L. Project administration, L.V.E., R.M. and S.L. Supervision, C.H. and S.L. Writing—original draft, E.H. Writing—review and editing, E.H., C.H., V.L., R.L., S.B., L.V.E., R.N.M. and S.L.

Funding

This research received no external funding.

Acknowledgments

The authors would like to acknowledge the FNRS, the ARC, the Walloon Region (Gadolymph, Holocancer and Interreg projects), the Interuniversity Attraction Poles of the Belgian Federal Sciences Policy Office and the COST actions. Authors also thank the Center for Microscopy and Molecular Imaging (CMMI, supported by the European Regional Development Fund and Wallonia). The molecular modeling activities are supported by FNRS via the “Consortium des Equipements de Calcul Intensif–CECI” program (grant No. 2.5020.11) and the EOS ‘2Dto3D’ project (grant No. 30489208). The authors have no other relevant affiliations or financial involvement with any organization or entity with a financial interest in or financial conflict with the subject matter or materials discussed in the manuscript apart from those disclosed.

Conflicts of Interest

The authors declare no conflicts of interest.

References

  1. Wahsner, J.; Gale, E.M.; Rodriguez-Rodriguez, A.; Caravan, P. Chemistry of MRI Contrast Agents: Current Challenges and New Frontiers. Chem. Rev. 2019, 119, 957–1057. [Google Scholar] [CrossRef]
  2. De Leon Rodriguez, L.; Martins, A.; Pinho, M.; Rofsky, N.; Sherry, A.D. Basic MR Relaxation Mechanisms & Contrast Agent Design. J. Magn. Reason. Imaging 2015, 42, 545–565. [Google Scholar]
  3. Gianolio, E.; Di Gregorio, E.; Aime, S. Chemical Insights into the tissues of Gd-retention in brain and other tissues upon the admnistration of Gd-containing MRI contrast agents. Eur. J. Inorg. Chem. 2019, 2019, 137–151. [Google Scholar] [CrossRef]
  4. Runge, V.M. Critical Questions Regarding Gadolinium Deposition in the Brain and Body After Injections of the Gadolinium-Based Contrast Agents, Safety. Inve. Radiol. 2017, 52, 317–323. [Google Scholar] [CrossRef] [PubMed] [Green Version]
  5. Dekkers, I.; Roos, R.; van der Molen, A. Gadolinium retention after administration of contrast agents based on linear chelators and the recommendations of the European Medicines Agency. Eur. Radiol. 2017. [Google Scholar] [CrossRef] [PubMed]
  6. Morrow, J.; Toth, E. Next-Generation Magnetic Resonance Imaging Contrast Agents. Inorg. Chem. 2017, 56, 6029–6034. [Google Scholar] [CrossRef] [PubMed] [Green Version]
  7. Caschera, L.; Lazzara, A.; Piergallini, L.; Ricci, D.; Tuscano, B.; Vanzulli, A. Contrast agents in diagnostic imaging: Present and future. Pharmacol. Res. 2016, 110, 65–75. [Google Scholar] [CrossRef]
  8. Ruiz-Cabello, J.; Barnett, B.P.; Bottomley, P.A. Bulte JWM, Fluorine (19F) MRS and MRI in biomedicine. NMR Biomed. 2011, 24, 114–129. [Google Scholar] [CrossRef]
  9. Keliris, A.; Schefler, K.; Engelmann, J. 5. Responsve Probes for 19F MRS/MRI. In Fluorine Magnetic Resonance Imaging; Flögel, U., Ahrens, E., Eds.; Pan Stanford Publishing: Singapore (Singapore), 2017; Chapter 5; pp. 141–190. [Google Scholar]
  10. Kenwright, A.M.; Kuprov, I.; De Luca, E.; Parker, D.; Pandya, S.U.; Senanayake, P.K.; Smith, D.G. 19F NMR based pH probes: Lanthanide (III) complexes with pH-sensitive chemical shifts. Chem. Commun. 2008, 22, 2514–2516. [Google Scholar] [CrossRef]
  11. Peterson, K.L.; Srivastava, K.; Pierre, V.C. Fluorinated Paramagnetic Complexes: Sensitive and Responsive Probes for Magnetic Resonance Spectroscopy and Imaging. Front. Chem. 2018, 6, 120. [Google Scholar] [CrossRef]
  12. Harvey, P.; Kuprov, I.; Parker, D. Lanthanide Complexes as Paramagnetic Probes for 19F Magnetic Resonance. Eur. J. Inorg. Chem. 2012, 2012, 2015–2022. [Google Scholar] [CrossRef]
  13. Knight, J.C.; Edwards, G.; Paisey, S.J. Fluorinated contrast agents for magnetic resonance imaging; a review of recent developments. RSC Adv. 2011, 1, 1415–1425. [Google Scholar] [CrossRef]
  14. Tirotta, I.; Dichiarante, V.; Pigliacelli, C.; Cavallo, G.; Terraneo, G.; Bombelli, F.B.; Metrangolo, P.; Resnati, G. 19F Magnetic Resonance Imaging (MRI): From Design of Materials to Clinical Applications. Chem. Rev. 2015, 115, 1106–1129. [Google Scholar] [CrossRef] [PubMed]
  15. Hequet, E.; Henoumont, C.; Muller, R.N.; Laurent, S. Fluorinated MRI contrast agents and their versatile applications in the biomedical field. Future Med. Chem. 2019, 11, 1157–1175. [Google Scholar] [CrossRef] [PubMed] [Green Version]
  16. Boccalon, M.; Franchi, P.; Lucarini, M.; Delgado, J.J.; Sousa, F.; Stellacci, F.; Zucca, I.; Scotti, A.; Spreafico, R.; Pengo, P.; et al. Gold nanoparticles protected by fluorinated ligands for 19F MRI. Chem. Commun. 2013, 49, 8794–8796. [Google Scholar] [CrossRef]
  17. Pengo, P.; Pasquato, L. Gold nanoparticles protected by fluorinated ligands: Syntheses, properties and applications. J. Fluorine Chem. 2015, 177, 2–10. [Google Scholar] [CrossRef] [Green Version]
  18. Sologan, M.; Padelli, F.; Giachetti, I.; Aquino, D.; Boccalon, M.; Adami, G.; Pengo, P.; Pasquato, L. Functionalized Gold Nanoparticles as Contrast Agents for Proton and Dual Proton/Fluorine MRI. Nanomaterials 2019, 9, 879. [Google Scholar] [CrossRef] [Green Version]
  19. Nakamura, T.; Sugihara, F.; Matsushita, H.; Yoshioka, Y.; Mizukami, S.; Kikuchi, K. Mesoporous silica nanoparticles for 19F resonance imaging, fluorescence imaging, and drug delivery. Chem. Sci. 2015, 6, 1986–1990. [Google Scholar] [CrossRef] [Green Version]
  20. Matsushita, H.; Mizukami, S.; Sugihara, F.; Nakanishi, Y.; Yoshioka, Y.; Kikuchi, Y. Multifunctional core-shell silica nanoparticles for highly sensitive 19F magnetic resonance imaging. Angew. Chem. Int. Ed. 2014, 53, 1008–1011. [Google Scholar] [CrossRef]
  21. Bouchoucha, M.; van Heeswijk, R.B.; Gossuin, Y.; Kleitz, F.; Fortin, M.-A. Fluorinated Mesoporous Silica Nanoparticles for Binuclear Probes in 1H and 19F Magnetic Resonance Imaging. Langmuir 2017, 33, 10531–10542. [Google Scholar] [CrossRef]
  22. Yu, Y.B. Fluorinated dendrimers as imaging agents for 19F MRI. WIRES Nanomed Nanobiotechnol. 2013, 5, 646–661. [Google Scholar] [CrossRef] [PubMed]
  23. Hernández-Ainsa, S.; Barberá, J. Fluorinated liquid crystalline dendrimers. J. Fluorine Chem. 2015, 177, 37–45. [Google Scholar] [CrossRef]
  24. Liu, X.; Yuan, Y.; Bo, S.; Li, Y.; Yang, Z.; Zhou, X.; Chen, S.; Jiang, Z.-X. Monitoring Fluorinated Dendrimer-Based Self-Assembled Drug-Delivery Systems with 19F Magnetic Resonance. Eur. J. Org. Chem. 2017, 2017, 4461–4468. [Google Scholar] [CrossRef]
  25. Biaggi, C.; Benaglia, M.; Ortenzi, M.; Micotti, E.; Perego, C.; De Simoni, M.-G. Easily available, low cost 19F MRI agents: Poly(ethylene-glycol)-functionalized fluorinated ethers. J. Fluorine Chem. 2013, 153, 172–177. [Google Scholar] [CrossRef]
  26. Sedlacek, O.; Jirak, D.; Galisova, A.; Jager, E.; Laaser, J.E.; Lodge, T.P.; Stepanek, P.; Hruby, M. 19F Magnetic Resonance Imaging of Injectable Polymeric Implants with Multiresponsive Behavior. Chem. Mater. 2018, 30, 4892–4896. [Google Scholar] [CrossRef]
  27. Jirak, D.; Galisova, A.; Kolouchova, K.; Babuka, D.; Hruby, M. Fluorine polymer probes for magnetic resonance imaging: Quo vadis? Magn. Reson. Mater. Phys. Biol. Med. 2019, 32, 173–185. [Google Scholar] [CrossRef] [Green Version]
  28. Schmieder, A.H.; Caruthers, S.D.; Keupp, J.; Wickline, S.A.; Lanza, G.M. Recent Advances in 19Fluorine Magnetic Resonance Imaging with Perfluorocarbon Emulsions. Engineering 2015, 1, 475–489. [Google Scholar] [CrossRef] [Green Version]
  29. Zhang, T.; Zhang, Q.; Tian, J.-H.; Xing, J.-F.; Guo, W.; Liang, X.-J. Perfluorocarbon-based nanomedicine: Emerging strategy for diagnosis and treatment of diseases. Mater. Res. Soc. 2018, 8, 303–313. [Google Scholar] [CrossRef]
  30. Chapelin, F.; Capitini, C.M.; Ahrens, E.T. Fluorine-19 MRI for detection and quantification of immune cell therapy for cancer. J. Immunother. Cancer 2018, 6, 105. [Google Scholar] [CrossRef]
  31. Akazawa, K.; Sugihara, F.; Nakamura, T.; Matsushita, H.; Mukai, H.; Akimoto, R.; Minoshima, M.; Mizukami, S.; Kakuchi, K. Perfluorocarbon-based 19F MRI Nanoprobes for In Vivo Multicolor Imaging. Angew. Chem. Int. Ed. 2018, 57, 16742–16747. [Google Scholar] [CrossRef] [Green Version]
  32. Senanayake, P.K.; Kenwright, A.M.; Parker, D.; Van Der Hoorn, S.K. Responsive fluorinated lanthanide probes for 19F magnetic resonance spectroscopy. Chem. Commun. 2007, 28, 2923–2925. [Google Scholar] [CrossRef] [PubMed]
  33. Chalmers, K.H.; De Luca, E.; Hogg, N.H.M.; Kenwright, A.M.; Kuprov, I.; Parker, D.; Botta, M.; Wilson, J.I.; Blamire, D.A.M. Design principles and theory of paramagnetic fluorine-labelled lanthanide complexes as probes for 19F magnetic resonance: A proof-of-concept study. Chem. Eur. J. 2010, 16, 134–148. [Google Scholar] [CrossRef] [PubMed]
  34. Wolters, M.; Mohades, S.G.; Hackeng, T.M.; Post, M.J.; Kooi, M.E.; Backes, W.H. Clinical Perspectives of Hybrid Proton-Fluorine Magnetic Resonance Imaging and Spectroscopy. Inve. Radiol. 2012, 48, 341–350. [Google Scholar] [CrossRef] [PubMed]
  35. Schmid, F.; Höltke, C.; Parker, D.; Faber, C. Boosting 19F MRI-SNR efficient detection of paramagnetic contrast agents using ultrafast sequences. Magn. Reson. Med. 2013, 69, 1056–1062. [Google Scholar] [CrossRef]
  36. Bartusik, D.; Aebisher, D. 19F applications in drug development and imaging—A review. Biomed. Pharmacother. 2014, 68, 813–817. [Google Scholar] [CrossRef]
  37. Peng, Q.; Li, Y.; Bo, S.; Yuan, Y.; Yang, Z.; Chen, S.; Zhou, X.; Jiang, Z.-X. Paramagnetic nanoemulsions with unified signals for sensitive 19F MRI cell tracking. Chem. Commun. 2018, 54, 6000–6003. [Google Scholar] [CrossRef]
  38. Cakić, N.; Savić, T.; Stricker-Shaver, J.; Truffault, V.; Platas-Iglesias, C.; Mirkes, C.; Pohmann, R.; Scheffler, K.; Angelovski, G. Paramagnetic lanthanide chelates for multicontrast MRI. Chem. Commun. 2016, 52, 9224–9227. [Google Scholar] [CrossRef] [Green Version]
  39. Srivastava, K.; Ferrauto, G.; Young, V.G.; Aime, S.; Pierre, V.C. Eight-Coordinate, Stable Fe(II) Complex as a Dual 19F and CEST Contrast Agent for Ratiometric pH Imaging. Inorg. Chem. 2017, 56, 12206–12213. [Google Scholar] [CrossRef]
  40. Pujales-Paradela, R.; Savić, T.; Brandariz, I.; Perez-Lourido, P.; Angelovski, G.; Esteban-Gómez, D.; Platas-Iglesias, C. Reinforced Ni(II)-cyclam derivatives as dual 1H/19F MRI Probes. Chem. Commun. 2019, 55, 4115–4118. [Google Scholar] [CrossRef]
  41. Pujales-Paradela, R.; Savić, T.; Perez-Lourido, P.; Esteban-Gómez, D.; Angelovski, G.; Botta, M.; Platas-Iglesias, C. Lanthanide Complexes with 1H paraCEST and 19F Response for Magnetic Resonance Imaging Applications. Inorg. Chem. 2019, 58, 7571–7583. [Google Scholar] [CrossRef]
  42. Yu, M.; Bouley, B.S.; Xie, D.; Que, E.L. Highly fluorinated metal complexes as dual 19F and PARACEST imaging agents. Dalton Trans. 2019, 48, 9337–9341. [Google Scholar] [CrossRef] [PubMed]
  43. De Luca, E.; Harvey, P.; Chalmers, K.H.; Mishra, A.; Senanayake, P.K.; Wilson, J.I.; Botta, M.; Fekete, M.; Blamire, A.M.; Parker, D. Characterisation and evaluation of paramagnetic fluorine labelled glycol chitosan conjugates for 19F and 1H magnetic resonance imaging. J. Biol. Inorg. Chem. 2014, 19, 215–227. [Google Scholar] [CrossRef] [PubMed] [Green Version]
  44. Pujales-Paradela, R.; Savić, T.; Esteban-Gómez, D.; Angelovski, G.; Carniato, F.; Botta, M.; Platas-Iglesias, C. Gadolinium (III)-Based Dual 1H/19F Magnetic Resonance Imaging Probes. Chem. Eur. J. 2019, 25, 4782–4792. [Google Scholar] [CrossRef] [PubMed]
  45. Berg, R.; Straub, B.F. Advancements in the mechanistic understanding of the copper-catalyzed azide—alkyne cycloaddition. Beilstein J. Org. Chem. 2013, 9, 2715–2750. [Google Scholar] [CrossRef] [Green Version]
  46. Solomon, I. Relaxation Processes in a System of Two Spins. Phys. Rev. 1955, 99, 559–565. [Google Scholar] [CrossRef]
  47. Bloembergen, N. Proton Relaxation Times in Paramagnetic Solutions. J. Chem. Phys. 1957, 27, 572–573. [Google Scholar] [CrossRef]
  48. Bloembergen, N.; Morgan, L.O. Proton Relaxation Times in Paramagnetic Solutions. Effects of Electron Spin Relaxation. J. Chem. Phys. 1961, 34, 842–850. [Google Scholar] [CrossRef] [Green Version]
  49. Henoumont, C.; Vander Elst, L.; Laurent, S.; Muller, R.N. Synthesis and Physicochemical Characterization of Gd-C4-Thyroxin-DTPA, a Potential MRI Contrast Agent. J. Phys. Chem. B 2010, 114, 3689–3697. [Google Scholar] [CrossRef]
  50. Laurent, S.; Henoumont, C.; Stanicki, D.; Boutry, S.; Lipani, E.; Belaid, S.; Muller, R.N.; Vander Elst, L. Contrast Agents From Molecules to Particles; Springer: Singapore (Singapore), 2016. [Google Scholar]
  51. Laurent, S.; Vander Elst, L.; Henoumont, C.; Muller, R.N. How to measure the transmetallation of a gadolinium complex. Contrast Media Mol. Imaging 2010, 5, 305–308. [Google Scholar] [CrossRef]
  52. Mayo, S.L.; Olafson, B.D.; Goddard, W.A. DREIDING: A Generic Force Field for Molecular Simulations. J. Phys. Chem. 1990, 94, 8897–8909. [Google Scholar] [CrossRef]
  53. Consentino, U.; Villa, A.; Pitea, D.; Moro, G.; Barone, V.; Maiocchi, A. Conformational Characterization of Lanthanide(III)–DOTA Complexes by ab Initio Investigation in Vacuo and in Aqueous Solution. J. Am. Chem. Soc. 2002, 124, 4901–4909. [Google Scholar] [CrossRef] [PubMed]
  54. Rappe, A.K.; Casewit, C.J.; Colwell, K.S.; Goddard, W.A.; Skiff, W.M. UFF, a Full Periodic Table Force Field for Molecular Mechanics and Dynamics Simulations. J. Am. Chem. Soc. 1992, 114, 10024–10035. [Google Scholar] [CrossRef]
  55. Opina, A.C.L.; Strickland, M.; Lee, Y.-S.; Tjandra, N.; Byrd, R.R.; Swenson, R.E.; Vasalatiy, O. Analysis of the isomer ratios of polymethylated-DOTA complexes and the implications on protein structural studies. Dalton Trans. 2016, 45, 4673–4687. [Google Scholar] [CrossRef] [PubMed] [Green Version]
Scheme 1. Multi-step synthesis of the fluorinated lanthanide complexes reported in this work. Reagents: (i) NaN3; (ii) NH2-CH2-CH2-NHBoc, TBTU, DIPEA; (iii) HCOOH; (iv) DOTA-GA anhydride, TBTU, Et3N; (v) LnCl3.6H2O; (vi) TBTU, DIPEA; (vii) Cu(OAc)2, Sodium Ascorbate (E301), DIPEA.
Magnetochemistry 06 00008 sch001
Figure 1. Nuclear magnetic relaxation dispersion (NMRD) profiles of the compounds 5a and 7a compared to the DOTAREM® profile fitted with the Solomon and Bloembergen theory. The parameters extracted from these profiles are listed in Table 1.
Magnetochemistry 06 00008 g001
Figure 2. Evolution of the 17O NMR chemical shift of water with the gadolinium concentration of Gd-DOTA and complex 5a.
Magnetochemistry 06 00008 g002
Figure 3. (a) Measurement of the relaxivity of complexes 5a (blue squares) and 7a (red dots) at various temperatures in a magnetic field of 0.47 T. (b) Measurement of the 17O water transverse relaxation rate at various temperatures in a magnetic field of 11.75 T.
Magnetochemistry 06 00008 g003
Figure 4. Phantom images recorded at 1T and 25 °C of DOTAREM® and synthesized gadolinium complexes 5a and 7a.
Magnetochemistry 06 00008 g004
Figure 5. Evolution of R1p (t)/R1p (t = 0) vs. time for the complex 7a in the presence of Zn2+ ions in phosphate buffer solution.
Magnetochemistry 06 00008 g005
Figure 6. 19F NMR spectra of compound 6, in purple (5 mM) and 7a–d in blue, dark green, khaki and red (3.7 mM, 13.7 mM, 17.2 mM and 12.8 mM respectively).
Magnetochemistry 06 00008 g006
Figure 7. (Left) Radial distribution functions between (i) the fluorine atoms and the gadolinium center (red curve and red circles in the inset) and (ii) between the hydrogen atom of the amine function close to the terminal nonafluoro-tert-butyl ether and the negatively-charged oxygen atoms of the carboxylate groups of the DOTA ligand (blue curve and blue circles in the inset), as built from 1001 snapshots recorded during a 5-ns molecular dynamics (MD) run. (Right) Cumulative probability for the distance between the fluorine atoms and the gadolinium center as a function of their distance. Inset: a typical conformation of 7a extracted from a MD run for which the hydrogen bonds between the hydrogen atom of the amine function close to the terminal nonafluoro-tert-butyl ether and the negatively-charged oxygen atoms of the carboxylate groups of the DOTA ligand are represented by green dashed lines.
Magnetochemistry 06 00008 g007
Figure 8. Time evolution of the distance between the gadolinium center and the three water molecules; each curve corresponding to one given water molecule.
Magnetochemistry 06 00008 g008
Table 1. Parameters extracted from the NMRD profiles fitted according to the Solomon and Bloembergen theory.
DOTAREM®Compound 5aCompound 7a
d (nm) *0.360.360.36
D (m2·s−1) *3.30 10−93.30 10−93.30 × 10⁻⁹
r (nm) *0.310.310.31
τR (ps)49.5 ± 0.479.9 ± 2.483.0 ± 2.0
τM (ns) *1225053
τS0 (ps)450.0 ± 24.0301.0 ± 28.3296.0 ± 19.4
τV (ps)4.4 ± 1.16.5 ± 1.79.5 ± 1.3
q *111
* fixed parameters during the fitting procedure.
Table 2. Fluorine T1 and T2 relaxation times for each synthesized complex.
Compound 6Gadolinium Complex 7a (1.7 mM)Dysprosium Complex 7b (1.3 mM)Terbium Complex 7c (1.9 mM)Europium Complex 7d (2.0 mM)
T1 (ms)T2 (ms)T1 (ms)T2 (ms)T1 (ms)T2 (ms)T1 (ms)T2 (ms)T1 (ms)T2 (ms)
2000180013.38.6206.677.3468.1186.913801177
Table 3. Proton and fluorine T1 relaxation times for aqueous and Seronorm-based solutions of complex 7a at a concentration of 1 mM. The proton relaxation times were measured at 20 MHz and 37 °C, whereas the fluorine relaxation times were measured at 500 MHz and 37 °C.
1H T1 (ms)19F T1 (ms)
Aqueous solution of 7a155 13.3
Seronorm-based solution of 7a8414.8

