Article

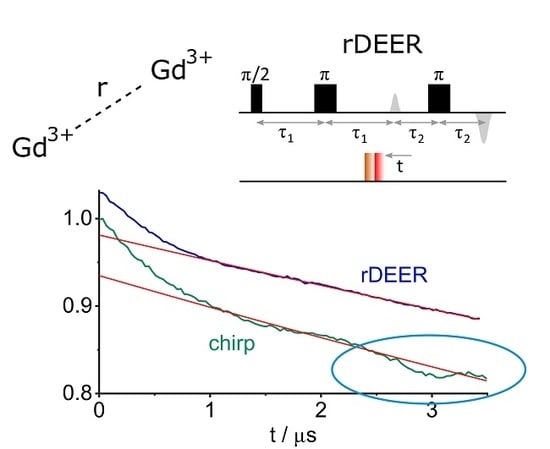
rDEER: A Modified DEER Sequence for Distance Measurements Using Shaped Pulses

Department of Chemical and Biological Physics, Weizmann Institute of Science, 76100 Rehovot, Israel
*
Authors to whom correspondence should be addressed.
Magnetochemistry 2019, 5(1), 20; https://doi.org/10.3390/magnetochemistry5010020
Submission received: 30 December 2018 / Revised: 15 February 2019 / Accepted: 22 February 2019 / Published: 8 March 2019
(This article belongs to the Special Issue Electron Paramagnetic Resonance)

Abstract

:
The DEER (double electron-electron resonance, also called PELDOR) experiment, which probes the dipolar interaction between two spins and thus reveals distance information, is an important tool for structural studies. In recent years, shaped pump pulses have become a valuable addition to the DEER experiment. Shaped pulses offer an increased excitation bandwidth and the possibility to precisely adjust pulse parameters, which is beneficial especially for demanding biological samples. We have noticed that on our home built W-band spectrometer, the dead-time free 4-pulse DEER sequence with chirped pump pulses suffers from distortions at the end of the DEER trace. Although minor, these are crucial for Gd(III)-Gd(III) DEER where the modulation depth is on the order of a few percent. Here we present a modified DEER sequence—referred to as reversed DEER (rDEER)—that circumvents the coherence pathway which gives rise to the distortion. We compare the rDEER (with two chirped pump pulses) performance values to regular 4-pulse DEER with one monochromatic as well as two chirped pulses and investigate the source of the distortion. We demonstrate the applicability and effectivity of rDEER on three systems, ubiquitin labeled with Gd(III)-DOTA-maleimide (DOTA, 1,4,7,10-Tetraazacyclododecane-1,4,7,10-tetraacetic acid) or with Gd(III)-DO3A (DO3A, 1,4,7,10-Tetraazacyclododecane-1,4,7-triyl) triacetic acid) and the multidrug transporter MdfA, labeled with a Gd(III)-C2 tag, and report an increase in the signal-to-noise ratio in the range of 3 to 7 when comparing the rDEER with two chirped pump pulses to standard 4-pulse DEER.

Graphical Abstract

1. Introduction

Double electron-electron resonance (DEER, also called Pulsed Electron Double Resonance, PELDOR) is an Electron Paramagnetic Resonance (EPR) method that measures the dipolar interaction between two (or potentially more) coupled spins and has become a routine method for structural biology applications [1]. As the majority of proteins and nucleic acids are diamagnetic, spin labels, which are covalently attached to the biomolecule of interest, are introduced via site-directed spin labeling (SDSL) [2,3,4]. While the most commonly used spin labels are nitroxide-based (mainly S-(1-oxyl-2,2,5,5-tetramethyl-2,5-dihydro-1H-pyrrol-3-yl)methyl methanesulfonothioate, MTSSL), the use of other paramagnetic tags as spin labels for biomolecules like triarylmethyl [5,6], Cu(II) [7,8], Mn(II) [9,10,11,12,13] or Gd(III) [14,15,16,17,18,19,20,21,22] has been successfully demonstrated. In the case of these metal ions, the metal is usually coordinated to chelating tags that are covalently attached to the biomolecule. Additionally, genetically encoded chelators have been presented for, e.g., Cu(II) [23] and Gd(III) [24]. Gd(III)-Gd(III) distance measurements are gaining popularity in recent years due to the high sensitivity at high magnetic fields of Gd(III) and its redox stability, which is an important feature for in-cell EPR experiments [22,24,25,26,27,28].
One main drawback of the DEER experiment compared to continuous wave (CW) EPR is its significantly lower sensitivity which leads to accumulation times that, at times, are as long as 12 h or more, especially for demanding biological samples with long distances that suffer from low concentration and a short phase memory time. In the case of Gd(III), along with Cu(II) and Mn(II), the limited bandwidth of commonly used monochromatic pump pulses allows only for a small fraction of the spins in the sample to be excited, leading to a modulation depth (λ) of a few percent [29,30,31,32]. Challenging biological samples may also suffer from a low labeling efficiency, which further diminishes λ. Additionally, as in-cell experiments become increasingly popular [22,24,25,26,27,28], increased sensitivity in the range of only a few micromolar protein concentration is desired to be as close as possible to physiological concentrations. The small modulation depth—compared to nitroxide-nitroxide DEER, where λ can easily reach 30% or more [33]—makes DEER on metal centers prone to small perturbations that may originate from the cross-talk of the observe and pump pulses or other instrumental limitations, and are difficult to remove.
Over the past few years, the sensitivity issue was addressed by the introduction of Arbitrary Waveform Generators (AWGs) to allow for broadband excitation on the pump channel. The successful application of AWGs to EPR spectroscopy and the DEER experiment was first demonstrated in the labs of Jeschke [34,35,36] and Prisner [37,38,39] at X- and Q-band, where the pump pulse was replaced with linear chirps as well as more sophisticated pulse shapes (See Figure 1). At Q-band frequencies, the modulation depth in Gd(III)-Gd(III) distance measurements could be increased to up to 15% using chirp pump pulses [36]. The use of shaped pump pulses to increase the modulation depth is also associated with increasing the intensity of combination frequencies in multi-spin systems as they crucially depend on the modulation depth. Therefore, data analysis needs to be performed carefully [40]. This issue is, however, less important in the case of Gd(III) spin labeling because the modulation depth is still relatively low. Gaussian pump and observe pulses have also been shown to be beneficial for removing artifacts arising from the overlapping frequency bandwidths of these pulses [41]. A recent report described a coherent spectrometer at 200 GHz based on AWG [42] and DEER experiments with shaped pulses at 180-GHz and 260-GHz frequencies [43], highlighting the need for sensitivity improvement using shaped pulses with high-frequency spectrometers.
We recently presented an AWG setup at the W-band where we reported signal to noise ratio (SNR) improvements for Gd(III)-Gd(III) DEER with one chirp pump pulse by a factor of 2–3.3, meaning a significant reduction in the experiment run-time by a factor of 4–10 [45]. In the current work, we present a new and improved AWG setup for our spectrometer. Because current AWGs do not have a sufficient sampling rate to generate pulses of tens of GHz directly, some upconversion or mixing [42] scheme must be applied to reach the desired frequency. The main difference between the previous setup and the setup presented here is the final upconversion step towards 95 GHz. In the setup presented in Reference [45], this was achieved by a ×13 multiplier; while in the current setup we mix an intermediate frequency of 7.3 GHz with 87.6 GHz. Details are given in the Materials and Methods section.
While not a significant problem with the past setup [45], our efforts in increasing SNR with the new setup were limited by a distortion at the end of the DEER time trace that required the extension of the DEER evolution time, τ2 (refer to Figure 1 for an explanation of the symbols used) by almost 1 μs. This requires discarding the last microsecond, thus reducing the effective SNR of the experiment.
In this work, we show the origin and consequences of the aforementioned distortion towards the end of the time trace of Gd(III)-Gd(III) DEER experiments recorded with chirped pulses. We show that it can be attributed to an echo originating from a specific coherence pathway involving both the pump and observe pulses even though the pump pulses are coming from an incoherent source. We found that using a slightly modified DEER sequence—the reversed DEER (here, called rDEER, Figure 1C) where the DEER evolution time is dictated by τ1 and not τ2—it was possible to alleviate this problem and gain the max SNR that can be afforded by the use of chirp pump pulses. We demonstrate and compare the results obtained with rDEER with those obtained from regular DEER and regular DEER with chirp pump pulses on human ubiquitin labeled with Gd(III)-DOTA-maleimide (DOTA, 1,4,7,10-Tetraazacyclododecane-1,4,7,10-tetraacetic acid) and Gd(III)-DO3A (DO3A, (DO3A, 1,4,7,10-Tetraazacyclododecane-1,4,7-triyl) triacetic acid) [28], as well as the multidrug antiporter MdfA [46,47,48], labeled with Gd(III)-C2 [49] (for the chemical structure of the spin labels, see Figure 2), with different EPR and Gd(III)-Gd(III) DEER characteristics.

2. Results

In order to demonstrate the performance of the rDEER sequence, we chose three samples—(A) Ubiquitin D39C/E64C doubly labeled with Gd(III)-DOTA-maleimide (Ubi-DOTA-M-Gd), (B) Ubiquitin D39C/E64C doubly labeled with Gd(III)-DO3A (Ubi-DO3A-Gd) [28] and (C) MdfA A163C/V307C doubly labeled with Gd(III)-C2 (MdfA-C2-Gd) [49]—to serve as model systems. While Ubi-DOTA-M-Gd and MdfA-C2-Gd have a narrow EPR central transition and a relatively broad distance distribution, Ubi-DO3A-Gd has a broader central transition but a narrower distance distribution such that several oscillations are clearly visible in the DEER trace. These are all typical examples of Gd(III) spin labels used in DEER measurements, and therefore we chose to evaluate the performance of rDEER for these cases separately. Figure 3 shows the echo-detected EPR spectra of the three samples in the region of the central transition. The pump and observe positions are also indicated.
Throughout this paper, we refer to regular, dead-time free 4-pulse DEER with a single, monochromatic pump pulse as “Rectangular DEER”’; to DEER obtained with two consecutive linear chirps, but with the regular DEER sequence as “chirp DEER”; and to the newly introduced rDEER sequence with two consecutive chirp pulses and a reverted pulse direction, as “rDEER”. Schemes of all pulse sequences are found in Figure 1. The primary time domain traces of the rectangular, standard chirped DEER and rDEER measurements on Ubi-DOTA-M-Gd, along with the form factors and the derived distance distributions are shown in Figure 4A–C. While the dipolar evolution time was set to 3.15 μs, there is a clear artifact in the DEER trace visible in the range of 2.0–3.0 μs (Figure 4A, blue trace). It is not possible to reliably analyze these data and one would need to cut off the last microsecond of the DEER trace in order to use it. The obtained distance distribution reveals that the shortened trace introduces errors in the evaluation of the background decay and therefore drastically reduces the achievable data quality (Figure 4C). Thus, to achieve an evolution time of 3.15 μs, one would need to extend τ2 by 1 μs, which means a significant loss in SNR and, consequently, a longer experiment (see Figure S1, where we extended the evolution time to 5.3 μs to demonstrate the reliability of the data analysis). However, when using rDEER the distortion is not present. The results for Ubi-DO3A-Gd are shown in Figure 4D–F. Here, we do not see a strong influence of the artifact on the background-subtracted DEER trace and, in fact, the chirp DEER yields a reliable distance distribution. However, a closer look at the data reveals that the distortion is also present in this sample. The validation shows a rather large error in the intensity, but not in the position of the main peak in the distance distribution which is attributed to changes in λ in the validation procedure. Similar conclusions can be drawn from experiments on MdfA (Figure 4G–I). The SNR of the rectangular trace is insufficient to yield any usable data within the 20 min of accumulation and is presented here for comparison with chirp DEER and rDEER data accumulated for the same experimental run-time. A higher-quality rectangular DEER trace can be found in Figure S2. Even this trace—which was accumulated for 11 h—does not have an optimal SNR.
The investigation of the origin of the distortion at the end of the DEER trace revealed a traveling echo that interferes with the observed echo at the position of the artifact. Figure 5 shows transient traces at different time points where the maximum of the observed echo is fixed at 500 ns and the traveling echo is clearly visible. When the traveling echo enters the detection window, this unwanted echo begins to affect the integrated signal of the observed echo. Note that the first echo at around 300 ns is not part of the detected signal and lies outside of the detection window. Investigation of the echo’s timing revealed that it crosses the detection window at τ2 – 2τ1. Tait and Stoll have recently performed a careful analysis of coherent pathways in the DEER experiment [51]; given the timing, it is likely to be a stimulated echo that originates from the SE1p3 pathway which involves both the pump pulse and observe pulses (see Table 1 of Reference [51]). Although the pump pulse originates from the AWG and is, therefore, not coherent with the reference source, it is not averaged out entirely during the experiment run-time. The timing of the rDEER moves this artefact outside of the DEER trace and the result is a clean trace as can be seen in Figure 4A,D,G (green trace). We note that this distortion is different than the “2 + 1” distortions appearing at the end of DEER traces that was described recently [41].
Additionally, we compared our rDEER experiments to the standard 4-pulse DEER with rectangular pulses (Figure 4) to validate that the distance distribution the experiment yields is consistent with the established DEER experiment. DEER with rectangular pulses is performed by pumping on the central transition and observing on the side, while chirp DEER and rDEER are performed by pumping on the sides and observing the central transition. The former gives an increased modulation depth at the expense of signal intensity, which is why the modulation depth is similar on both types of experiments, while the SNR of chirp DEER and rDEER is higher. The SNR is calculated according to the following equation:
SNR   =   1 NumScan · λ ·   NumPt SumSq
where NumScan is the number of scans, λ is the modulation depth, NumPt is the number of data points and SumSq is the sum of squares, an indicator of the noise in the trace. This number is calculated by subtracting the form factor from the DEER trace so that only the noise remains. This is done in the region 1–2 μs (for MdfA-C2-Gd and Ubi-DO3A-Gd) or 0.896–1.888 μs (for Ubi-DOTA-M-Gd). This follows the SNR calculation found on page 4 of Reference [45], but takes into account the number of scans. In order to ease the comparison, we have added the number of points used for SNR estimation to the calculation. For all experiments presented herein, NumPt = 31. It is worth noting that all experiments carried out on a particular sample were performed with identical tuning, power, and pulse settings so the relative improvements are reliable. Once a sample is removed from the spectrometer and introduced again, the tuning conditions may change and, accordingly, the absolute SNR may change as well.
While DEER with rectangular pulses on ubiquitin doubly labeled with Ubi-DOTA-M-Gd gave an SNR of 7.2, chirp DEER gave a value of 15.0 and rDEER gave a value of 18.4 (see Table 1), which corresponds to an increase by a factor of 2.5 for rDEER relative to rectangular DEER. Within acceptable error, the distance distributions obtained by Tikhonov regularization using DeerAnalysis 2018 for both the rectangular and the rDEER are the same. To interpret the chirp DEER data, the trace has to be significantly shortened due to the distortion (see above); thus, the distance distribution, while reproducing the main distance, is notably distorted.
DEER of Ubi-DO3A-Gd was accumulated up to a t of 4 μs. In this sample, the SNR of the DEER with rectangular pulses was 5.6, with chirp DEER having an SNR of 31.2 and with rDEER having an SNR 40.7. The improvement of rDEER compared to rectangular DEER is 7.3, the highest of all samples presented in this work, while the chirp DEER gave an improvement of 5.6.
For MdfA-C2-Gd, the improvement is again quite pronounced with an SNR of 2.2 for rectangular pulses compared to 13.9 with the rDEER sequence, a factor of 6.2. Chirp DEER gives an SNR of 15.6 and thus an improvement of 7. However, with the standard chirp DEER, a reliable determination of the background is not possible due to the distortion and because the obtasined distance distribution is distorted (see Figure 4). A possible solution here would be to significantly increase the dipolar evolution time at the expense of a large loss in SNR. The rDEER sequence, on the other hand, does not exhibit this artifact.

3. Discussion

In this paper, we showed that the implementation of broadband chirp pulses as pump pulses in W-band Gd(III)-Gd(III) DEER experiments can result in echoes from additional coherence pathways that are potential sources of distortion to the DEER trace and its data analysis. We showed that using broadband chirp pump pulses together with a modified pulse sequence, where we moved the dipolar evolution into the time between the spin echo sequence and the pump pulse (see Figure 1C), makes it possible to record a practically distortion-free trace, with a minimal dead-time at the end of the trace of 0.15 µs. This also required setting τ2 to be rather long, which surprisingly did not significantly reduce the echo intensity. We demonstrated the effectiveness of the rDEER on three proteins labeled with different tags and thereby exhibiting Gd(III) central transitions with different widths that are typical examples encountered in Gd(III)-Gd(III) DEER applications.
As can be seen in Figure 4 and Table 1, the modulation depth changes very little across all experiments on both ubiquitin samples, although the rectangular DEER was recorded by pumping the central transition and observing 100 MHz away while rDEER and chirp DEER were recorded while observing at the maximum of the central transition and pumping on the sides. For the MdfA sample, Table 1 reports a very high modulation depth of 8%. The importance of this number should not be overestimated as it is probably a consequence of the low overall SNR of the trace; longer accumulation (see Figure S2) shows that the modulation depth is more likely to be around 3.5% and, therefore, comparable to the other experiments.
It is possible to observe on the central transition using rectangular pulses; however, this setup leads to very low modulation depths (>1%) and is prone to artifacts and is, therefore, usually not used in our lab. With chirp pulses, observing the central transition becomes feasible due to the increased modulation depth owing to the increased excitation width of the chirp pump pulses. This, in turn, generates a much higher absolute echo intensity, which is the primary source of the improvement in this study. The improvements in SNR reported here lie between 3.3 and 7.3 and exceed the improvement of 1.8 that we reported earlier on Ubi-DOTA-M-Gd [45]. This advancement is mainly due to the following: (1) in the present study, the pump pulse was applied symmetrically around the central transition with two separate pulses (94.5–94.8 GHz and 95.0–95.3 GHz) [36], while previously only one pump pulse was used; (2) with the improved AWG setup shown in Figure 6, it is possible to position the observe sequence directly at 94.9 GHz, to which the resonator is tuned. This was not possible in the previous study. There, a distortion of unknown origin at a frequency of 94.9 GHz forced us to move the observe frequency to 94.95 GHz, which—while it is feasible—results in a decrease in the observed signal intensity. Interestingly, the present study showed that the DO3A tag [28] performed very well with chirp pulses. The same holds true for the C2-Gd tag. Here, however, we do not understand why C2-Gd performs better than DOTA-M as they have spectra with a very similar width.
Although rDEER is a good tool to avoid the problem of an artifact towards the end of the DEER trace as well as recording high-SNR DEER traces in a reasonable amount of time, the source of the distortion in an incoherent setup like ours is not completely understood. The literature describing the implementation of AWGs at X- [39] and Q-band [36] does not mention any appearance of distortions of the magnitude that we observed. However, the upconversion/modulation scheme used in these works significantly differs from ours. Additionally, the hardware requirements at high microwave frequencies are more demanding and our comparably low modulation depth due to power limitations makes these experiments sensitive to distortions. While we can clearly exclude that the cause of the distortion is purely instrumental, its intensity and impact changed significantly with different tags. In the Ubi-DO3A-Gd, for example, the distortion is barely visible at all, while it is quite pronounced with both of the other tags. The artifact does not depend on the pulse sweep direction (see Figure S4). We were also not able to phase-cycle the artifact out by applying a 16-step phase cycle instead of the 8-step phase cycle that is commonly used (see Figure S5). Additionally, in the case of Gd(III)-Gd(III) DEER, the time τ2 can be significantly increased to several microseconds without the loss of signal intensity, a fact that we exploited to clear the observation window of unwanted echoes (see Figure S6). This interesting spectroscopic feature deserves further investigation, which is, however, beyond the scope of this study.
The large SNR improvements together with an artifact-free DEER trace produced by the rDEER experiment are highly beneficial especially for challenging experiments like membrane proteins in a heterogeneous environment or in-cell measurements where the protein concentration should be as low as possible. Notably, we demonstrated that a DEER of a challenging low-concentration (around 30 μM) membrane protein labeled with Gd(III)-C2 can be obtained with a reasonable SNR in only 20 min and, on suitable samples, the improvement in SNR can be as high as 7.3 when applying shaped pump pulses. The rDEER sequence is now routinely used in our lab.

4. Materials and Methods

4.1. Sample Preparation

Experiments were performed on three systems: (A) Ubiquitin D39C/E64C doubly labeled with Gd(III)-DOTA-maleimide (purchased from Macrocyclics, Inc., USA and used without further purification; here called Ubi-DOTA-M-Gd; 50 mM MES buffer, pH 6.5, 50 μM protein concentration). Ubiquitin purification and labeling were performed according to a published protocol [45]; (B) Ubiquitin D39C/E64C doubly labeled with Gd(III)-DO3A (Ubi-DO3A-Gd). Protein purification and labeling were performed according to Reference [28] (50 mM MES buffer, pH 6.5, 50 μM protein concentration). (C) MdfA double mutant A163C/V307C was solubilized (MdfA-C2-Gd) with dodecyl-maltopyranoside (DDM) and labeled with C2 [49] (20 mM Tris-HCl, 120 mM NaCl, 200 mM Imidazole, 0.1% DDM, approx. 30 μM protein concentration, as determined by NanoDrop). Details on the purification and labeling will be published elsewhere. All samples were supplemented with 10% glycerol-d8 and filled in 0.6/0.84 mm (inner/outer diameter) quartz capillaries (VitroCom, New Jersey, USA).

4.2. Spectroscopy

All experiments were performed on our home-built W-band (94.9 GHz) spectrometer [52,53] using the controller software SpecMan [54]. The spectrometer is equipped with two microwave (MW) physical channels and a 2 W solid-state amplifier. To reduce losses and dead-time, we have recently replaced our ferrite based circulator with a quasi-optical setup designed and manufactured by Thomas Keating Inc. For sample cooling, a cryo-free closed cycle cryostat, custom-designed and manufactured by Coldedge Inc. tailored for our setup was used. The minimal sample temperature obtainable with this system is 4.5 K.
Echo-detected EPR spectra were recorded with a spin-echo sequence π/2 – τ – π – τ – det. The following parameters were used: tπ/2 = 15 ns, tπ = 30 ns, τ = 550 ns. The field was swept at 10 mA/s.
DEER. All experiments were performed at 10 K. The standard dead-time free 4-pulse DEER sequence [44] was used with the 8-step phase cycling (x)(x)(xP)x (a pulse in parenthesis is cycled in a 2-step manner; for details on the phase cycling nomenclature, refer to References [51,55]). The observe and pump frequencies were 94.95 GHz and 94.85 GHz (foffset = 100 MHz), respectively, with the resonator tuned at 94.9 GHz, τ1 = 375 ns and a repetition rate of 0.8 ms; the magnetic field was positioned such that the central transition of Gd(III) was pumped, this mode is referred to as “pump on maximum”. The time τ2 was experiment-dependent and as follows: For Ubi-DOTA-M-Gd τ2 = 3.5 μs, for Ubi-DO3A-Gd τ2 = 4.5 μs and for MdfA-C2-Gd and the trace shown in Figure S2, τ2 was 4 μs. The lengths of the pulses were tπ/2, obs, tπ, obs = 15, 30 ns; tπ,pump = 15 ns. The raw data were analyzed with DeerAnalysis 2018 [50]. All data were accumulated as transients using SpecMan [54] and later integrated into Matlab.
Chirp DEER. A Chase Scientific DA12000 Arbitrary Waveform Generator (AWG) card with a sampling rate of 2 GS/s was used to generate shaped pulses. Its output was fed into one of the two microwave channels in an incoherent manner. The AWG is controlled by a LabView program and can be triggered by SpecMan. In the past, in order to obtain 94.9 GHz pulses, a frequency of 400 MHz was generated and then fed into a home-built unit that converted these pulses to 7.3 GHz by means of multiplication followed by mixing. This signal was then fed into our home-built bridge and multiplied (×13) to yield the desired frequency. A detailed description of this setup has been published previously and can be found in Reference [45]. Due to frequency sidebands around 95 GHz that cannot be filtered, we used a new setup with a modified upconversion scheme where the 7.3 GHz signal was generated as described above and subsequently mixed with a frequency of 87.6 GHz (see Figure 6). This system shows improved performance in terms of the observable modulation depth as well as an increased signal. It enables the use of a measurement mode where the observe pulses are set to the maximum of the Gd(III) signal, while the pump pulses are placed symmetrically around it [36], referred to as “observe on maximum” (also refer to Figure 3). In the past, this setup was only possible with one pump pulse on the low-frequency side due to the aforementioned sidebands. These limitations, however, are specific to our instrument. While “observe on maximum” with pumping on one side can also be used with rectangular pulses, it yields a low modulation depth and is thus susceptible to small artifacts, though the SNR could be higher [30].
All experiments with shaped pulses were performed with the 8-step phase cycling (x)(x)(xP)x. For the standard chirp DEER experiments, the resonator was tuned to 94.9 GHz and the Gd(III) central transition was positioned at this frequency. The parameters of the experiment were τ1 = 375 ns, tπ/2,obs = 15 ns, tπ,obs = 30 ns; tpump = 192 ns, while τ2 was sample-dependent. The following values were used: for Ubi-DOTA-M-Gd τ2 = 3.5 μs, for Ubi-DO3A-Gd τ2 = 4.25 μs, for Ubi-C2-Gd τ2 = 3.75 μs and for the long trace shown in Figure S1, a τ2 of 5.5 μs was used. The repetition rate was set to 0.8 ms. Two linear chirp pump pulses [36] were positioned symmetrically about the central transition with a frequency range of 94.5 GHz–94.8 GHz and 95.0 GHz–95.3 GHz (Δf = 300 MHz) with a pulse length of 96 ns each and no delay between the two pulses. It is worth noting that this pulse setup (up/up) differs from the two-pump-pulse scheme introduced by Doll et al. in 2015 (up/down) [36], but was empirically found to perform better on our hardware. We have excluded the possibility that the distortion is caused by a different pulse setup by comparing these pulse schemes in Figure S4.
The pump pulse was applied with the maximum available power, which for a rectangular pulse results in a π pulse of 5–10 ns for Gd(III) at the maximum intensity of the echo-detected EPR spectrum.
rDEER. The resonator was tuned to 94.9 GHz and the field was adjusted such that it matches the maximum of the central transition. The parameters of the rDEER experiments were chosen to match the chirp DEER settings (see paragraph above) in terms of the pulse lengths and frequency sweeps. τ2 was chosen to be long, 2.2 μs, in order to move unwanted echoes out of the detection window. Surprisingly, this did not lead to a significant reduction in the observed signal. Compensation for the resonator profile was not used. These pulse parameters have previously been found to be optimal for our resonator [45].
Validation. Validation was performed using DeerAnalysis 2018’s built-in validation function using 10 trials of added white noise with an RMS factor of 1.5 and 11 trials of background corrections. Values for the background correction interval were 600–2000 ns (±300 ns).

Supplementary Materials

The following are available online at https://www.mdpi.com/2312-7481/5/1/20/s1, Figure S1 (Chirp DEER of Ubi-DOTA-M-Gd), Figure S2 (Rectangular DEER of MdfA-C2-Gd), Figure S3 (Distance distributions from Figure 4 with their corresponding distance-dependent color coding from DeerAnalysis), Figure S4 (Raw data of DEER traces on Ubi-DOTA-M-Gd with different pulse directions), Figure S5 (Effect of phase cycling on the echo) and Figure S6 (Echo decay for a refocused spin echo on MdfA-C2-Gd).

Author Contributions

The study was conceived by D.G. and A.F. Ubiquitin expression and labeling were performed by Y.Y.; MdfA production and labeling was carried out by T.B. The AWG setup, all DEER measurements as well as data analysis were done by T.B. and A.F. The manuscript was written by T.B. and D.G. with the help of all other co-authors.

Funding

This project was funded by Israel Science Foundation (ISF)—National Natural Science Foundation of China (NSFC) grant (grant number 118768). TB acknowledges financial support from the Minerva Foundation.

Acknowledgments

The authors would like to thank E. Bibi and E. Yardeni for help in the preparation of the MdfA sample, B. Graham for providing the C2 tag and X.-C. Su for providing the DO3A tag.

Conflicts of Interest

The authors declare no conflict of interest.

References

  1. Jeschke, G. DEER Distance Measurements on Proteins. Annu. Rev. Phys. Chem. 2012, 63, 419–446. [Google Scholar] [CrossRef] [PubMed]
  2. Hubbell, W.L.; Altenbach, C. Investigation of structure and dynamics in membrane proteins using site-directed spin labeling. Curr. Opin. Struc. Biol. 1994, 4, 566–573. [Google Scholar] [CrossRef]
  3. Hubbell, W.L.; Gross, A.; Langen, R.; Lietzow, M.A. Recent advances in site-directed spin labeling of proteins. Curr. Opin. Struc. Biol. 1998, 8, 649–656. [Google Scholar] [CrossRef]
  4. Klare, J.P.; Steinhoff, H.-J. Spin labeling EPR. Photosynth. Res. 2009, 102, 377–390. [Google Scholar] [CrossRef] [PubMed]
  5. Shevelev, G.Y.; Krumkacheva, O.A.; Lomzov, A.A.; Kuzhelev, A.A.; Rogozhnikova, O.Y.; Trukhin, D.V.; Troitskaya, T.I.; Tormyshev, V.M.; Fedin, M.V.; Pyshnyi, D.V.; et al. Physiological-temperature distance measurement in nucleic acid using triarylmethyl-based spin labels and pulsed dipolar EPR spectroscopy. J. Am. Chem. Soc. 2014, 136, 9874–9877. [Google Scholar] [CrossRef] [PubMed]
  6. Giannoulis, A.; Yang, Y.; Gong, Y.-J.; Tan, X.; Feintuch, A.; Carmieli, R.; Bahrenberg, T.; Liu, Y.; Su, X.-C.; Goldfarb, D. DEER distance measurements on trityl/trityl and Gd(III)/trityl labelled proteins. Phys. Chem. Chem. Phys. 2019. [Google Scholar] [CrossRef]
  7. Yang, Z.; Becker, J.; Saxena, S. On Cu(II)–Cu(II) distance measurements using pulsed electron electron double resonance. J. Magn. Reson. 2007, 188, 337–343. [Google Scholar] [CrossRef] [PubMed]
  8. Yang, Z.; Kise, D.; Saxena, S. An Approach towards the Measurement of Nanometer Range Distances Based on Cu2+ Ions and ESR. J. Phys. Chem. B 2010, 114, 6165–6174. [Google Scholar] [CrossRef] [PubMed]
  9. Kaminker, I.; Bye, M.; Mendelman, N.; Gislason, K.; Sigurdsson, S.T.; Goldfarb, D. Distance measurements between manganese(ii) and nitroxide spin-labels by DEER determine a binding site of Mn2+ in the HP92 loop of ribosomal RNA. Phys. Chem. Chem. Phys. 2015, 17, 15098–15102. [Google Scholar] [CrossRef] [PubMed]
  10. Martorana, A.; Yang, Y.; Zhao, Y.; Li, Q.-F.; Su, X.-C.; Goldfarb, D. Mn(ii) tags for DEER distance measurements in proteins via C-S attachment. Dalt. Trans. 2015, 44, 20812–20816. [Google Scholar] [CrossRef] [PubMed]
  11. Yang, Y.; Gong, Y.-J.; Litvinov, A.; Liu, H.-K.; Yang, F.; Su, X.-C.; Goldfarb, D. Generic tags for Mn(ii) and Gd(iii) spin labels for distance measurements in proteins. Phys. Chem. Chem. Phys. 2017, 19, 26944–26956. [Google Scholar] [CrossRef] [PubMed]
  12. Akhmetzyanov, D.; Ching, H.Y.V.; Denysenkov, V.; Demay-Drouhard, P.; Bertrand, H.C.; Tabares, L.C.; Policar, C.; Prisner, T.F.; Un, S. RIDME spectroscopy on high-spin Mn2+ centers. Phys. Chem. Chem. Phys. 2016, 18, 30857–30866. [Google Scholar] [CrossRef] [PubMed]
  13. Banerjee, D.; Yagi, H.; Huber, T.; Otting, G.; Goldfarb, D. Nanometer-Range Distance Measurement in a Protein Using Mn2+ Tags. J. Phys. Chem. Lett. 2012, 3, 157–160. [Google Scholar] [CrossRef]
  14. Prokopiou, G.; Lee, M.D.; Collauto, A.; Abdelkader, E.H.; Bahrenberg, T.; Feintuch, A.; Ramirez-Cohen, M.; Clayton, J.; Swarbrick, J.D.; Graham, B.; et al. Small Gd(III) Tags for Gd(III)-Gd(III) Distance Measurements in Proteins by EPR Spectroscopy. Inorg. Chem. 2018, 57. [Google Scholar] [CrossRef] [PubMed]
  15. Feintuch, A.; Otting, G.; Goldfarb, D. Gd3 + Spin Labeling for Measuring Distances in Biomacromolecules: Why and How? Methods Enzymol. 2015, 563, 415–457. [Google Scholar] [PubMed]
  16. Potapov, A.; Yagi, H.; Huber, T.; Jergic, S.; Dixon, N.E.; Otting, G.; Goldfarb, D. Nanometer-Scale Distance Measurements in Proteins Using Gd3+ Spin Labeling. J. Am. Chem. Soc. 2010, 132, 9040–9048. [Google Scholar] [CrossRef] [PubMed]
  17. Lueders, P.; Jeschke, G.; Yulikov, M. Double electron-electron resonance measured between Gd3+ ions and nitroxide radicals. J. Phys. Chem. Lett. 2011, 2, 604–609. [Google Scholar] [CrossRef]
  18. Mahawaththa, M.C.; Lee, M.D.; Giannoulis, A.; Adams, L.A.; Feintuch, A.; Swarbrick, J.D.; Graham, B.; Nitsche, C.; Goldfarb, D.; Otting, G. Small neutral Gd(iii) tags for distance measurements in proteins by double electron–electron resonance experiments. Phys. Chem. Chem. Phys. 2018, 20, 23535–23545. [Google Scholar] [CrossRef] [PubMed]
  19. Abdelkader, E.H.; Lee, M.D.; Feintuch, A.; Cohen, M.R.; Swarbrick, J.D.; Otting, G.; Graham, B.; Goldfarb, D. A New Gd3+ Spin Label for Gd3+–Gd3+ Distance Measurements in Proteins Produces Narrow Distance Distributions. J. Phys. Chem. Lett. 2015, 6, 5016–5021. [Google Scholar] [CrossRef] [PubMed]
  20. Yagi, H.; Banerjee, D.; Graham, B.; Huber, T.; Goldfarb, D.; Otting, G. Gadolinium Tagging for High-Precision Measurements of 6 nm Distances in Protein Assemblies by EPR. J. Am. Chem. Soc. 2011, 133, 10418–10421. [Google Scholar] [CrossRef] [PubMed]
  21. Sajid, M.; Jeschke, G.; Wiebcke, M.; Godt, A. Conformationally unambiguous spin labeling for distance measurements. Chemistry 2009, 15, 12960–12962. [Google Scholar] [CrossRef] [PubMed]
  22. Qi, M.; Groß, A.; Jeschke, G.; Godt, A.; Drescher, M. Gd(III)-PyMTA Label Is Suitable for In-Cell EPR. J. Am. Chem. Soc. 2014, 136, 15366–15378. [Google Scholar] [CrossRef] [PubMed]
  23. Cunningham, T.F.; Putterman, M.R.; Desai, A.; Horne, W.S.; Saxena, S. The Double-Histidine Cu2+-Binding Motif: A Highly Rigid, Site-Specific Spin Probe for Electron Spin Resonance Distance Measurements. Angew. Chemie Int. Ed. 2015, 54, 6330–6334. [Google Scholar] [CrossRef] [PubMed]
  24. Mascali, F.C.; Ching, H.Y.V.; Rasia, R.M.; Un, S.; Tabares, L.C. Using Genetically Encodable Self-Assembling Gd III Spin Labels to Make In-cell Nanometric Distance Measurements. Angew. Chemie Int. Ed. 2016, 1–4. [Google Scholar]
  25. Yang, Y.; Yang, F.; Gong, Y.-J.; Chen, J.-L.; Goldfarb, D.; Su, X.-C. A Reactive, Rigid Gd III Labeling Tag for In-Cell EPR Distance Measurements in Proteins. Angew. Chemie Int. Ed. 2017, 56, 2914–2918. [Google Scholar] [CrossRef] [PubMed]
  26. Martorana, A.; Bellapadrona, G.; Feintuch, A.; Di Gregorio, E.; Aime, S.; Goldfarb, D. Probing Protein Conformation in Cells by EPR Distance Measurements using Gd3+ Spin Labeling. J. Am. Chem. Soc. 2014, 136, 13458–13465. [Google Scholar] [CrossRef] [PubMed]
  27. Theillet, F.-X.; Binolfi, A.; Bekei, B.; Martorana, A.; Rose, H.M.; Stuiver, M.; Verzini, S.; Lorenz, D.; van Rossum, M.; Goldfarb, D.; et al. Structural disorder of monomeric α-synuclein persists in mammalian cells. Nature 2016, 530, 45–50. [Google Scholar] [CrossRef] [PubMed]
  28. Yang, Y.; Yang, F.; Gong, Y.-J.; Bahrenberg, T.; Feintuch, A.; Su, X.-C.; Goldfarb, D. High Sensitivity In-Cell EPR Distance Measurements on Proteins Using an Optimized Gd(III) Spin Label. J. Phys. Chem. Lett. 2018. [Google Scholar] [CrossRef] [PubMed]
  29. Dalaloyan, A.; Qi, M.; Ruthstein, S.; Vega, S.; Godt, A.; Feintuch, A.; Goldfarb, D. Gd( III)–Gd(III) EPR distance measurements – the range of accessible distances and the impact of zero field splitting. Phys. Chem. Chem. Phys. 2015, 17, 18464–18476. [Google Scholar] [CrossRef] [PubMed]
  30. Goldfarb, D. Gd3+ Spin Labeling For Distance Measurements by Pulse Epr Spectroscopy. PCCP 2014, 16, 9685–9699. [Google Scholar] [CrossRef] [PubMed]
  31. Demay-Drouhard, P.; Ching, H.Y.V.; Akhmetzyanov, D.; Guillot, R.; Tabares, L.C.; Bertrand, H.C.; Policar, C. A Bis-Manganese(II)–DOTA Complex for Pulsed Dipolar Spectroscopy. ChemPhysChem 2016, 17, 2066–2078. [Google Scholar] [CrossRef] [PubMed]
  32. van Amsterdam, I.M.C.; Ubbink, M.; Canters, G.W.; Huber, M. Measurement of a Cu–Cu Distance of 26 Å by a Pulsed EPR Method. Angew. Chemie Int. Ed. 2003, 42, 62–64. [Google Scholar] [CrossRef]
  33. Polyhach, Y.; Bordignon, E.; Tschaggelar, R.; Gandra, S.; Godt, A.; Jeschke, G. High sensitivity and versatility of the DEER experiment on nitroxide radical pairs at Q-band frequencies. Phys. Chem. Chem. Phys. 2012, 14, 10762–10773. [Google Scholar] [CrossRef] [PubMed]
  34. Doll, A.; Pribitzer, S.; Tschaggelar, R.; Jeschke, G. Adiabatic and fast passage ultra-wideband inversion in pulsed EPR. J. Magn. Reson. 2013, 230, 27–39. [Google Scholar] [CrossRef] [PubMed]
  35. Doll, A.; Jeschke, G. Fourier-transform electron spin resonance with bandwidth-compensated chirp pulses. J. Magn. Reson. 2014, 246, 18–26. [Google Scholar] [CrossRef] [PubMed]
  36. Doll, A.; Qi, M.; Wili, N.; Pribitzer, S.; Godt, A.; Jeschke, G. Gd(III)-Gd(III) distance measurements with chirp pump pulses. J. Magn. Reson. 2015, 259, 153–162. [Google Scholar] [CrossRef] [PubMed]
  37. Spindler, P.E.; Zhang, Y.; Endeward, B.; Gershernzon, N.; Skinner, T.E.; Glaser, S.J.; Prisner, T.F. Shaped optimal control pulses for increased excitation bandwidth in EPR. J. Magn. Reson. 2012, 218, 49–58. [Google Scholar] [CrossRef] [PubMed]
  38. Schöps, P.; Spindler, P.E.; Marko, A.; Prisner, T.F. Broadband spin echoes and broadband SIFTER in EPR. J. Magn. Reson. 2015, 250, 55–62. [Google Scholar] [CrossRef] [PubMed]
  39. Spindler, P.E.; Glaser, S.J.; Skinner, T.E.; Prisner, T.F. Broadband Inversion PELDOR Spectroscopy with Partially Adiabatic Shaped Pulses. Angew. Chemie Int. Ed. 2013, 52, 3425–3429. [Google Scholar] [CrossRef] [PubMed]
  40. Giannoulis, A.; Ackermann, K.; Spindler, P.E.; Higgins, C.; Cordes, D.B.; Slawin, A.M.Z.; Prisner, T.F.; Bode, B.E. Nitroxide–nitroxide and nitroxide–metal distance measurements in transition metal complexes with two or three paramagnetic centres give access to thermodynamic and kinetic stabilities. Phys. Chem. Chem. Phys. 2018, 20, 11196–11205. [Google Scholar] [CrossRef] [PubMed]
  41. Teucher, M.; Bordignon, E. Improved signal fidelity in 4-pulse DEER with Gaussian pulses. J. Magn. Reson. 2018, 296, 103–111. [Google Scholar] [CrossRef] [PubMed]
  42. Kaminker, I.; Barnes, R.; Han, S. Arbitrary waveform modulated pulse EPR at 200GHz. J. Magn. Reson. 2017, 279, 81–90. [Google Scholar] [CrossRef] [PubMed]
  43. Kuzhelev, A.; Akhmetzyanov, D.; Denysenkov, V.; Shevelev, G.; Krumkacheva, O.; Bagryanskaya, E.; Prisner, T. High-frequency pulsed electron–electron double resonance spectroscopy on DNA duplexes using trityl tags and shaped microwave pulses. Phys. Chem. Chem. Phys. 2018, 20, 26140–26144. [Google Scholar] [CrossRef] [PubMed]
  44. Pannier, M.; Veit, S.; Godt, A.; Jeschke, G.; Spiess, H. Dead-Time Free Measurement of Dipole–Dipole Interactions between Electron Spins. J. Magn. Reson. 2000, 142, 331–340. [Google Scholar] [CrossRef] [PubMed]
  45. Bahrenberg, T.; Rosenski, Y.; Carmieli, R.; Zibzener, K.; Qi, M.; Frydman, V.; Godt, A.; Goldfarb, D.; Feintuch, A. Improved sensitivity for W-band Gd(III)-Gd(III) and nitroxide-nitroxide DEER measurements with shaped pulses. J. Magn. Reson. 2017, 283, 1–13. [Google Scholar] [CrossRef] [PubMed]
  46. Edgar, R.; Bibi, E. MdfA, an Escherichia coli multidrug resistance protein with an extraordinarily broad spectrum of drug recognition. J. Bacteriol. 1998, 179, 2274–2280. [Google Scholar] [CrossRef]
  47. Sigal, N.; Cohen-Karni, D.; Siemion, S.; Bibi, E. MdfA from Escherichia coli, a Model Protein for Studying Secondary Multidrug Transport. J. Mol. Microbiol. Biotechnol. 2006, 11, 308–317. [Google Scholar] [CrossRef] [PubMed]
  48. Yardeni, E.H.; Zomot, E.; Bibi, E. The fascinating but mysterious mechanistic aspects of multidrug transport by MdfA from Escherichia coli. Res. Microbiol. 2017. [Google Scholar] [CrossRef] [PubMed]
  49. de la Cruz, L.; Nguyen, T.H.D.; Ozawa, K.; Shin, J.; Graham, B.; Huber, T.; Otting, G. Binding of Low Molecular Weight Inhibitors Promotes Large Conformational Changes in the Dengue Virus NS2B-NS3 Protease: Fold Analysis by Pseudocontact Shifts. J. Am. Chem. Soc. 2011, 133, 19205–19215. [Google Scholar] [CrossRef] [PubMed]
  50. Jeschke, G.; Chechik, V.; Ionita, P.; Godt, A.; Zimmermann, H.; Banham, J.; Timmel, C.R.; Hilger, D.; Jung, H. DeerAnalysis2006—A comprehensive software package for analyzing pulsed ELDOR data. Appl. Magn. Reson. 2006, 30, 473–498. [Google Scholar] [CrossRef]
  51. Tait, C.E.; Stoll, S. Coherent pump pulses in Double Electron Electron Resonance spectroscopy. Phys. Chem. Chem. Phys. 2016, 18, 18470–18485. [Google Scholar] [CrossRef] [PubMed]
  52. Goldfarb, D.; Lipkin, Y.; Potapov, A.; Gorodetsky, Y.; Epel, B.; Raitsimring, A.M.; Radoul, M.; Kaminker, I. HYSCORE and DEER with an upgraded 95 GHz pulse EPR spectrometer. J. Magn. Reson. 2008, 194, 8–15. [Google Scholar] [CrossRef] [PubMed]
  53. Mentink-Vigier, F.; Collauto, A.; Feintuch, A.; Kaminker, I.; Tarle, V.; Goldfarb, D. Increasing sensitivity of pulse EPR experiments using echo train detection schemes. J. Magn. Reson. 2013, 236, 117–125. [Google Scholar] [CrossRef] [PubMed]
  54. Epel, B.; Gromov, I.; Stoll, S.; Schweiger, A.; Goldfarb, D. Spectrometer manager: A versatile control software for pulse EPR spectrometers. Concepts Magn. Reson. Part B Magn. Reson. Eng. 2005, 26B, 36–45. [Google Scholar] [CrossRef]
  55. Stoll, S.; Kasumaj, B. Phase Cycling in Electron Spin Echo Envelope Modulation. Appl. Magn. Reson. 2008, 35, 15–32. [Google Scholar] [CrossRef]
Figure 1. (A) The standard dead-time free 4-pulse double electron-electron resonance (DEER) sequence [44] with a refocused echo in the observe channel (ν1); (B) a 4-pulse DEER sequence using two consecutive chirped pump pulses generated with an AWG on the pump channel [36]; (C) a new rDEER sequence with two consecutive chirped pump pulses.
Magnetochemistry 05 00020 g001aMagnetochemistry 05 00020 g001b
Figure 2. Chemical structures of the spin labels that were used in this work: (A) Gd(III)-DOTA-maleimide and (B) Gd(III)-DO3A, used to label ubiquitin. (C) Gd(III)-C2, used to label MdfA. The leaving group of the labeling reaction is indicated in red.
Magnetochemistry 05 00020 g002
Figure 3. The normalized, echo-detected EPR spectra of (A) Ubi-DOTA-M-Gd, (B) Ubi-DO3A-Gd and (C) MdfA-C2-Gd. For DEER with a rectangular pump pulse, the signal was observed at the position indicated by a green arrow and pumped at the maximum of the central transition (blue arrow). For chirp DEER and rDEER, the signal was observed at the maximum of the central transition (blue arrow) and pumped on both sides by two 300 MHz wide chirp pulses (blue areas). The direction of the linear chirp is indicated by light blue arrows above the respective pump regions.
Magnetochemistry 05 00020 g003
Figure 4. Comparison of the DEER data of Ubi-DOTA-M-Gd (top panels), Ubi-DO3A-Gd (center panels), and MdfA-C2-Gd (bottom panels) with rectangular DEER, chirp DEER, and the rDEER experiment; (A,D,G) Raw data with the background correction function (red traces); The artifact is clearly visible at 2–3 μs for the chirp DEER sequence (blue trace) in (A) and from 2.5 μs to 3.3 μs in (G) and disappears with the use of the rDEER sequence (green trace); (B,E,H) Background-corrected DEER data and fit obtained with the distance distributions shown in (C,F,I) using Tikhonov regularization and DeerAnalysis (red traces) [50]. Confidence intervals using DeerAnalysis’ built-in validation function are shown in grey. Within each sample, all data were accumulated on the same sample tube and with the same tuning. More details are given in Table 1. The regularization parameter α was kept constant within each sample and was 100 for (C), 12.6 for (F) and 20.0 for (I). Figure S3 shows the DeerAnalysis’ color-coding of the distance reliability ranges of the data shown in (C), (F), and (I).
Magnetochemistry 05 00020 g004
Figure 5. The transient traces of the data shown in Figure 4A (blue trace, on Ubi-DOTA-M-Gd) reveal the presence of an additional echo that traverses the observed echo (indicated by a black arrow). The number on the left refers to the time of the pump pulse (indicated as t in Figure 1). The integration interval of the observe echo starts at the red line and ends 300 nsec later (the end of the integration window is not within the scale of this figure).
Magnetochemistry 05 00020 g005
Figure 6. The scheme of the arbitrary waveform generator (AWG) setup.
Magnetochemistry 05 00020 g006
Table 1. Summary of the SNR and modulation depth obtained from the various DEER experiments on the three samples studied.
ExperimentRun-Time/minSNRModulation DepthNumber of Scans **
Ubi-DOTA-M-Gd
Rectangular15:507.2 *4.3%20
chirp DEER08:0015.0 *5.2%10
rDEER15:5518.4 *4.5%20
Ubi-DO3A-Gd
Rectangular51:445.63%50
chirp DEER52:2231.23.7%50
rDEER52:1940.73.8%50
MdfA-C2-Gd
Rectangular18:202.28%20
chirp DEER18:2215.66.5%20
rDEER18:4313.95%20
* This SNR was calculated in the range 0.896–1.888 μs due to the shorter length of the arbitrary waveform generator (AWG) DEER trace; ** One scan consists of a complete 8-step phase cycle with 8 × 50 shots per point and a repetition rate of 800 μs, equivalent to a run-time of ~46 seconds, not taking overhead into account.

