Article

Parahydrogen-Based Hyperpolarization for the Masses at Millitesla Fields

1
Department of Chemical and Biological Engineering, and Health Sciences, South Dakota School of Mines & Technology, Rapid City, SD 57701, USA
2
Department of Chemistry, Biology, and Health Sciences, South Dakota School of Mines & Technology, Rapid City, SD 57701, USA
3
Department of Chemistry, Integrative Biosciences (Ibio), Karmanos Cancer Institute, Wayne State University, Detroit, MI 48202, USA
4
Department of Materials and Metallurgical Engineering, South Dakota School of Mines & Technology, Rapid City, SD 57701, USA
5
Department of Nanoscience & Biomedical Engineering, South Dakota School of Mines & Technology, Rapid City, SD 57701, USA
6
International Tomography Center SB RAS, Novosibirsk 630090, Russia
7
School of Chemical & Biomolecular Sciences, Southern Illinois University, Carbondale, IL 62901, USA
8
Department of Physics, Indiana University Bloomington/IU Center for Exploration of Energy and Matter, Bloomington, IN 47408, USA
*
Author to whom correspondence should be addressed.
Magnetochemistry 2025, 11(9), 80; https://doi.org/10.3390/magnetochemistry11090080
Submission received: 31 August 2025 / Revised: 16 September 2025 / Accepted: 18 September 2025 / Published: 22 September 2025

Abstract

Hyperpolarization (HP) techniques, such as Parahydrogen-Induced Polarization (PHIP), Signal Amplification by Reversible Exchange (SABRE), and dissolution Dynamic Nuclear Polarization (d-DNP), significantly enhance the sensitivity of nuclear magnetic resonance (NMR) spectroscopy for chemical analysis and metabolic imaging. However, the high cost of equipment, ranging from tens of thousands to millions of dollars, limits accessibility of hyperpolarization for the broad scientific community. In this work, we aim to mitigate some of the challenges by developing a cost-effective solution for parahydrogen (pH2)-based PHIP and SABRE HP methods. A custom coil-winding machine was designed to fabricate solenoid magnet coils, which were then evaluated for their magnetic field profiles, demonstrating a high degree of magnetic field homogeneity. A model 1H SABRE experiment successfully implemented the constructed solenoid, achieving efficient hyperpolarization. Additionally, the solenoid magnet can be utilized for in situ detection of hyperpolarization when integrated with a low-field NMR spectrometer, reducing the total setup cost to a few thousand dollars. These findings suggest that our approach makes HP technology more affordable and accessible, potentially broadening its applications in chemical and biomedical research, as well as educational settings involving undergraduate student researchers. This work provides a practical pathway to lower the financial barriers associated with pH2 HP setups.

1. Introduction

Nuclear magnetic resonance spectroscopy’s sensitivity depends on the magnetic alignment of the nuclear spins of analyte molecules. Although this alignment is usually low under thermal equilibrium conditions, it can be raised via hyperpolarization by orders of magnitude [1,2,3,4]—approaching 100% in some cases [5,6,7,8,9,10,11,12,13,14,15,16,17,18,19,20,21,22,23]. Therefore, hyperpolarization increases the magnetic resonance (MR) signal by 104–108 times, which can be leveraged for applications such as improved chemical analysis [24,25,26,27,28,29,30,31,32] and metabolic and functional MR imaging, including in vivo human applications in clinics [33,34,35,36].
Presently, dissolution Dynamic Nuclear Polarization (d-DNP) [3,4,37] leads the field of HP in vivo imaging but requires expensive up-front investments from hundreds of thousands to millions of dollars for equipment purchase [3,33] and regular supply of liquid helium as a cryogen [3,4], presenting an obstacle to otherwise-interested researchers worldwide. Alternative HP techniques are based on the use of parahydrogen (pH2, the spin isomer of molecular H2 with zero nuclear spin) as a source of nuclear spin order to achieve hyperpolarization [38,39]. For example, hydrogenative Parahydrogen-Induced Polarization (PHIP) exploits pairwise addition of pH2 to an unsaturated substrate, usually at the site of an asymmetric double or triple carbon–carbon bond [40,41,42]. Another pH2-based HP technique is Signal Amplification by Reversible Exchange (SABRE), which relies on reversible binding of both pH2 and a substrate to an iridium complex that serves as a polarization-transfer catalyst [43,44,45]. Parahydrogen-based HP techniques open an avenue to NMR spectroscopy and imaging with enhanced sensitivity at comparatively lower cost than d-DNP [46,47,48]. Nevertheless, despite their comparative ease, speed, and low cost, pH2 approaches still require four main sets of instrumentation, which may not be commonly present in an average science laboratory. Namely, one needs to have at a minimum: (a) access to pH2, (b) a gas-flow setup for hyperpolarization, (c) a setup allowing magnetic field adjustment, and (d) an instrument capable of NMR signal readout.
Our previous work [47] addressed the construction of a simple and efficient pH2 generator in great technical detail, including all of the parts and step-by-step building instructions, making it easy to replicate. The gas-flow setup and magnetic field adjustment setup operating in the microtesla field range (suitable for hyperpolarization of heteronuclei, typically 13C and 15N) are well-described in [49]. Therefore, the aim of this study is to find a low-cost solution for magnetic field adjustment in the millitesla range (suitable for hyperpolarization of protons) and signal detection in the presence or absence of a commercial NMR instrument. Of note, strong dependence of SABRE effects intensity on the polarization transfer field was predicted theoretically as early as in 2009 [50] and is explained by the fact that polarization transfer in SABRE results from coherent spin mixing at nuclear spin level anti-crossing (LAC) conditions, which occur at particular magnetic fields, where the frequency difference between the nascent pH2-derived hydrides and coordinated substrate resonances is roughly matched by the size of the scalar couplings between them [51]. Taken together, our efforts drastically decrease the entrance barrier to this exciting and promising field of science for members of the scientific community outside of the field of NMR hyperpolarization.

2. Materials and Methods

2.1. Setup Used for Winding of the Solenoid Coils

A coil-winding machine (U.S. SOLID (Cleveland, OH, USA), UPC 888107032649, purchased at Amazon) was mounted with screws near the middle of the lateral axis and approximately 15 cm from the longitudinal end of a 2.54 cm × 25.4 cm × 12.7 cm (1″ × 10″ × 5″) pine base board purchased from a local Menards’ value lumber section (Figure 1A). The winding machine was composed of a handle connected to a small shaft through which rotary force was manually transmitted via a gearbox, an analog line length counter, and a steel stand with screw holes on which the other parts rested, and which was used to mount the device on the base board. A 10 mm threaded nut was attached to the end of the rod coming from the winding machine and used to attach a 50.8 cm (20 inch) long 10 mm threaded steel rod (“rod #1”) to the winding machine. Two large rubber stoppers (MOCAP (Park Hills, MO, USA), 2.750/3.500 EPDM PLUG, BLACK) with centrally drilled 10 mm holes were slid onto the rod, one close to each opposite end.
When the large 101.6 cm (40 inch) long, 15.24 cm (6 inch) diameter tube was used to make a coil, the stoppers of the required size were not available for purchase from a manufacturer. Therefore, the stoppers were cast from polyurethane liquid rubber. The casting form was made from a pipe plug (Gordon Electric Supply (Kankakee, IL, USA), IPEX 077437 6” PVC Poly Plug) by cutting with a handsaw its “Pulling Eye”, so the plug could stand upside-down and be used as a casting form (Figure S4). A steel rod (Uxcell (Hong Kong, China) Round Steel Rod, 9 mm diameter, purchased at Amazon) was affixed in the center of the casting form in order to make a hole for future attachment to the coil-winding machine. Internal parts of the casting form were sprayed with a release agent (Polytek® Development Corp. (Easton, PA, USA), Pol-Ease® 2300 Release Agent, SKU: 2300). Castable polyurethane rubber (Polytek® Development Corp. (Easton, PA, USA), Poly 75-70 Liquid Rubber SKU: 7570U16) was mixed in a disposable paint mixing container (per Polytek instructions) and poured into the prepared casting mold (Figure S4). After 24 h, the prepared polyurethane stopper was pulled out of the casting form and washed with a gentle surfactant (baby soap) due to the modest chemical stability of polyurethane rubber.
The fiberglass tube (Madcow Rocketry (Laguna Hills, CA, USA), 3″ G12 Airframe STD-3B1D970C-600-RED, 60″ (2 cuts) and 6″ G12 Airframe FT60-600-NAT, 60″ (1 cut at 42″)) with the diameter matching the stoppers’ diameter was slowly slid onto and over the stoppers until each end was about 2.5 cm over the end of each rubber stopper. Another 10 mm threaded nut was attached to the end of the rod #1. Directly across from the winding machine at the other end of the base board, a 2.54 cm × 15.24 cm × 20.32 cm (1″ × 6″× 8″) pine tailstock board piece was screwed into the base board, vertically projecting up 20.32 cm (8 inches) high and 15.24 cm (6 inches) wide (Figure 1A). A 10 mm hole was drilled into the tailstock board at the location corresponding to the same exact height and width across the base board of the rod end of the winding machine. Another long 10 mm threaded rod (“rod #2”) was guided through the hole in the tailstock and screwed into the nut on the end of rod #1. The other end of rod #2 was fixed at the tailstock board with a 10 mm full-sliding threaded nut.

2.2. Winding of the Solenoid Coils

In total, four solenoid coils were constructed for the study. Their physical parameters are presented in detail in the Section 3. The winding procedure was as follows. Points along the tube corresponding to the final length of the desired coil were marked on the tube. The tip of the wire from the spool (McMaster-Carr (Elmhurst, IL, USA), Motor Winding Wire: 1.024 mm diameter 18 Gauge (7588K63), 0.812 mm diameter 20 Gauge (7588K81), 0.511 mm diameter 24 Gauge (7588K77), 0.405 mm diameter 26 Gauge (7588K75)) was fixed onto the tube with a small (ca. 1.3 cm × 1.3 cm) piece of tape ca. 0.6 cm in front of the point marked as the beginning of the coil. About 30–45 cm of wire (using the line counter as a reference) was loosely pulled off the wire spool onto the tube until the point marked as the beginning of the coil was reached. The wire was then coiled over the tube manually, slowly, and with great attention paid to minimizing inter-winding spacing. Once four to six coiled revolutions had been made (ignoring the first loose 30–45 cm of wire), a thin layer of Gorilla Glue (any quick-drying polyurethane or similar adhesive would work similarly) was applied to the coiled layers, again ignoring the 30–45 cm loose initial portion of wire. After the glue was allowed to dry, winding of the coil resumed at a relatively gentle pace, but now using the winding machine, with the handle being spun. Once the winding was approximately 6 revolutions worth of distance from the marked point at which the coil would end, machine winding was stopped, and manual winding resumed with attention paid to keep the coil spacing tight for the last 6 revolutions. Once the coil reached the marked end point, an additional 30–45 cm of wire was pulled off the spool (using the line counter as a reference), although they were not wound over the tube. The wire was fixed on the tube at the marked endpoint with tape. While tension was kept applied to the coil and tube, a two-part epoxy adhesive (WEST SYSTEM (Bay City, MI, USA) 105A Epoxy Resin (32 fl oz) Bundle with 207SA Special Clear Epoxy Hardener (10.6 fl oz) and 300 Mini Pumps Epoxy Metering 3-Pack Pump Set, purchased at Amazon) was mixed together until desired homogeneity and viscosity were achieved, and was then applied over the whole coiled part of the tube, excluding the end portions of 30–45 cm loose wire. The epoxy was allowed to cure for 1 day. Afterwards, the coil was removed from the device.

2.3. Simulation of Solenoid Electromagnetic Field

The solenoid magnetic field simulations were performed using the BiotSavart L 4.0.19 platform (Ripplon Software). BiotSavart calculates the electromagnetic field produced by an object of arbitrary geometry with a given amount of current flowing through it. The input parameters (the current and the coil geometry parameters, such as inner and outer diameter of solenoids) were chosen to match the physical parameters of Coil 1. A solenoid conductor geometry was chosen with a length of 44.4 cm, determined by measuring the total coiled wire length of Coil 1, and an inner radius of 3.81 cm. The outer radius was computed by adding 0.812 mm (the standard diameter of AWG 20-gauge copper wire) to the inner radius, which gives an outer radius of 3.89 cm. Square winding was selected, with a value of 546, determined by dividing the coil length by the diameter of the wire and floor rounding the result. The current used in the simulations was 7 A, since this is about the practical current limit of AWG 20-gauge wire without generating excessive resistive and heating effects. A volumetric probe was selected to model the electromagnetic field in the region in and around the coil. The probe’s X and Y values for grid size were set to 3.81 cm, equal to the coil’s inner radius, and Z was set equal to 55.88 cm (i.e., 22 inches), slightly longer than the total coil length, to further demonstrate the exponentially declining strength of the electromagnetic field as it emanates from the solenoid center. The numbers of X, Y, and Z grids were 101 each, leading to a grid with 1013 = 1,030,301 individual volumetric elements. The arithmetic mean of the magnetic field, computed from each of the 101 points along each axial cross-section at each of the equally spaced 101 z-axis values, was calculated.

2.4. Magnetic Field Homogeneity Measurements of the Solenoid Coils

The procedure for the measurement of magnetic field profiles of the constructed solenoid coils is described below, using Coil 2 as an example. For Coil 2, the length of the solenoid (wire-covered region) was measured to be 49.2 cm total, and the base length was 56.1 cm. There was a 5 cm gap from the start of each foundation to the start of the solenoid, so the position of the center of the solenoid was computed as (49.2/2) + 5 = 29.6 cm. A gaussmeter (Lake Shore Cryotronics (Westerville, OH, USA), Model 410) was calibrated to “0” by placing its tip in a nominally zero field magnetic shield (supplied by the vendor). Next, the Gaussmeter sensor tip with a metric ruler attached to it was placed at the calculated central point inside the solenoid and taped to keep its position steady. While the Gaussmeter tip was inside, the solenoid coil was connected to the programmable power supply unit (PSU, GW Instek (New Taipei City, Taiwan, China), model PSM-6003, purchased at TestEquipmentUSA). The current through the coil was first set to 1.0 A and then increased up to 6.0 A with a 0.5 A increment. The current and corresponding PSU voltage were recorded while the magnetic field was measured at the coil center. Then, to record the coil’s field homogeneity profile, the current value was set to 4.9 A to start the measurements with a magnetic field in the coil’s center of 5.6 mT. The magnetic field was measured as the probe was repositioned through the length of the coil at 1 cm increments. For other solenoids, the same procedure was used except that current values were different.

2.5. Sample Preparation

In a vial, a 100 mM pyridine stock solution was prepared by dissolving 23.7 mg of pyridine (Py) in 2.4 g of regular (natural isotopic abundance) methanol. In an Eppendorf plastic tube, 6 mM [Ir(IMes)(COD)Cl] (IMes = 1,3-dimesitylimidazol-2-ylidene, COD = 1,5-cyclooctadiene) of SABRE precatalyst solution was prepared by dissolving 2.5 mg of precatalyst in 0.8 mL of the 100 mM pyridine stock solution prepared in the first step. The detailed synthetic procedure for the SABRE precatalyst is presented in the Supplementary Materials. The resultant 6 mM catalyst and 100 mM pyridine solution was transferred into a 5 mm medium wall NMR tube and bubbled with argon to remove any trapped oxygen.

2.6. SABRE Experiments

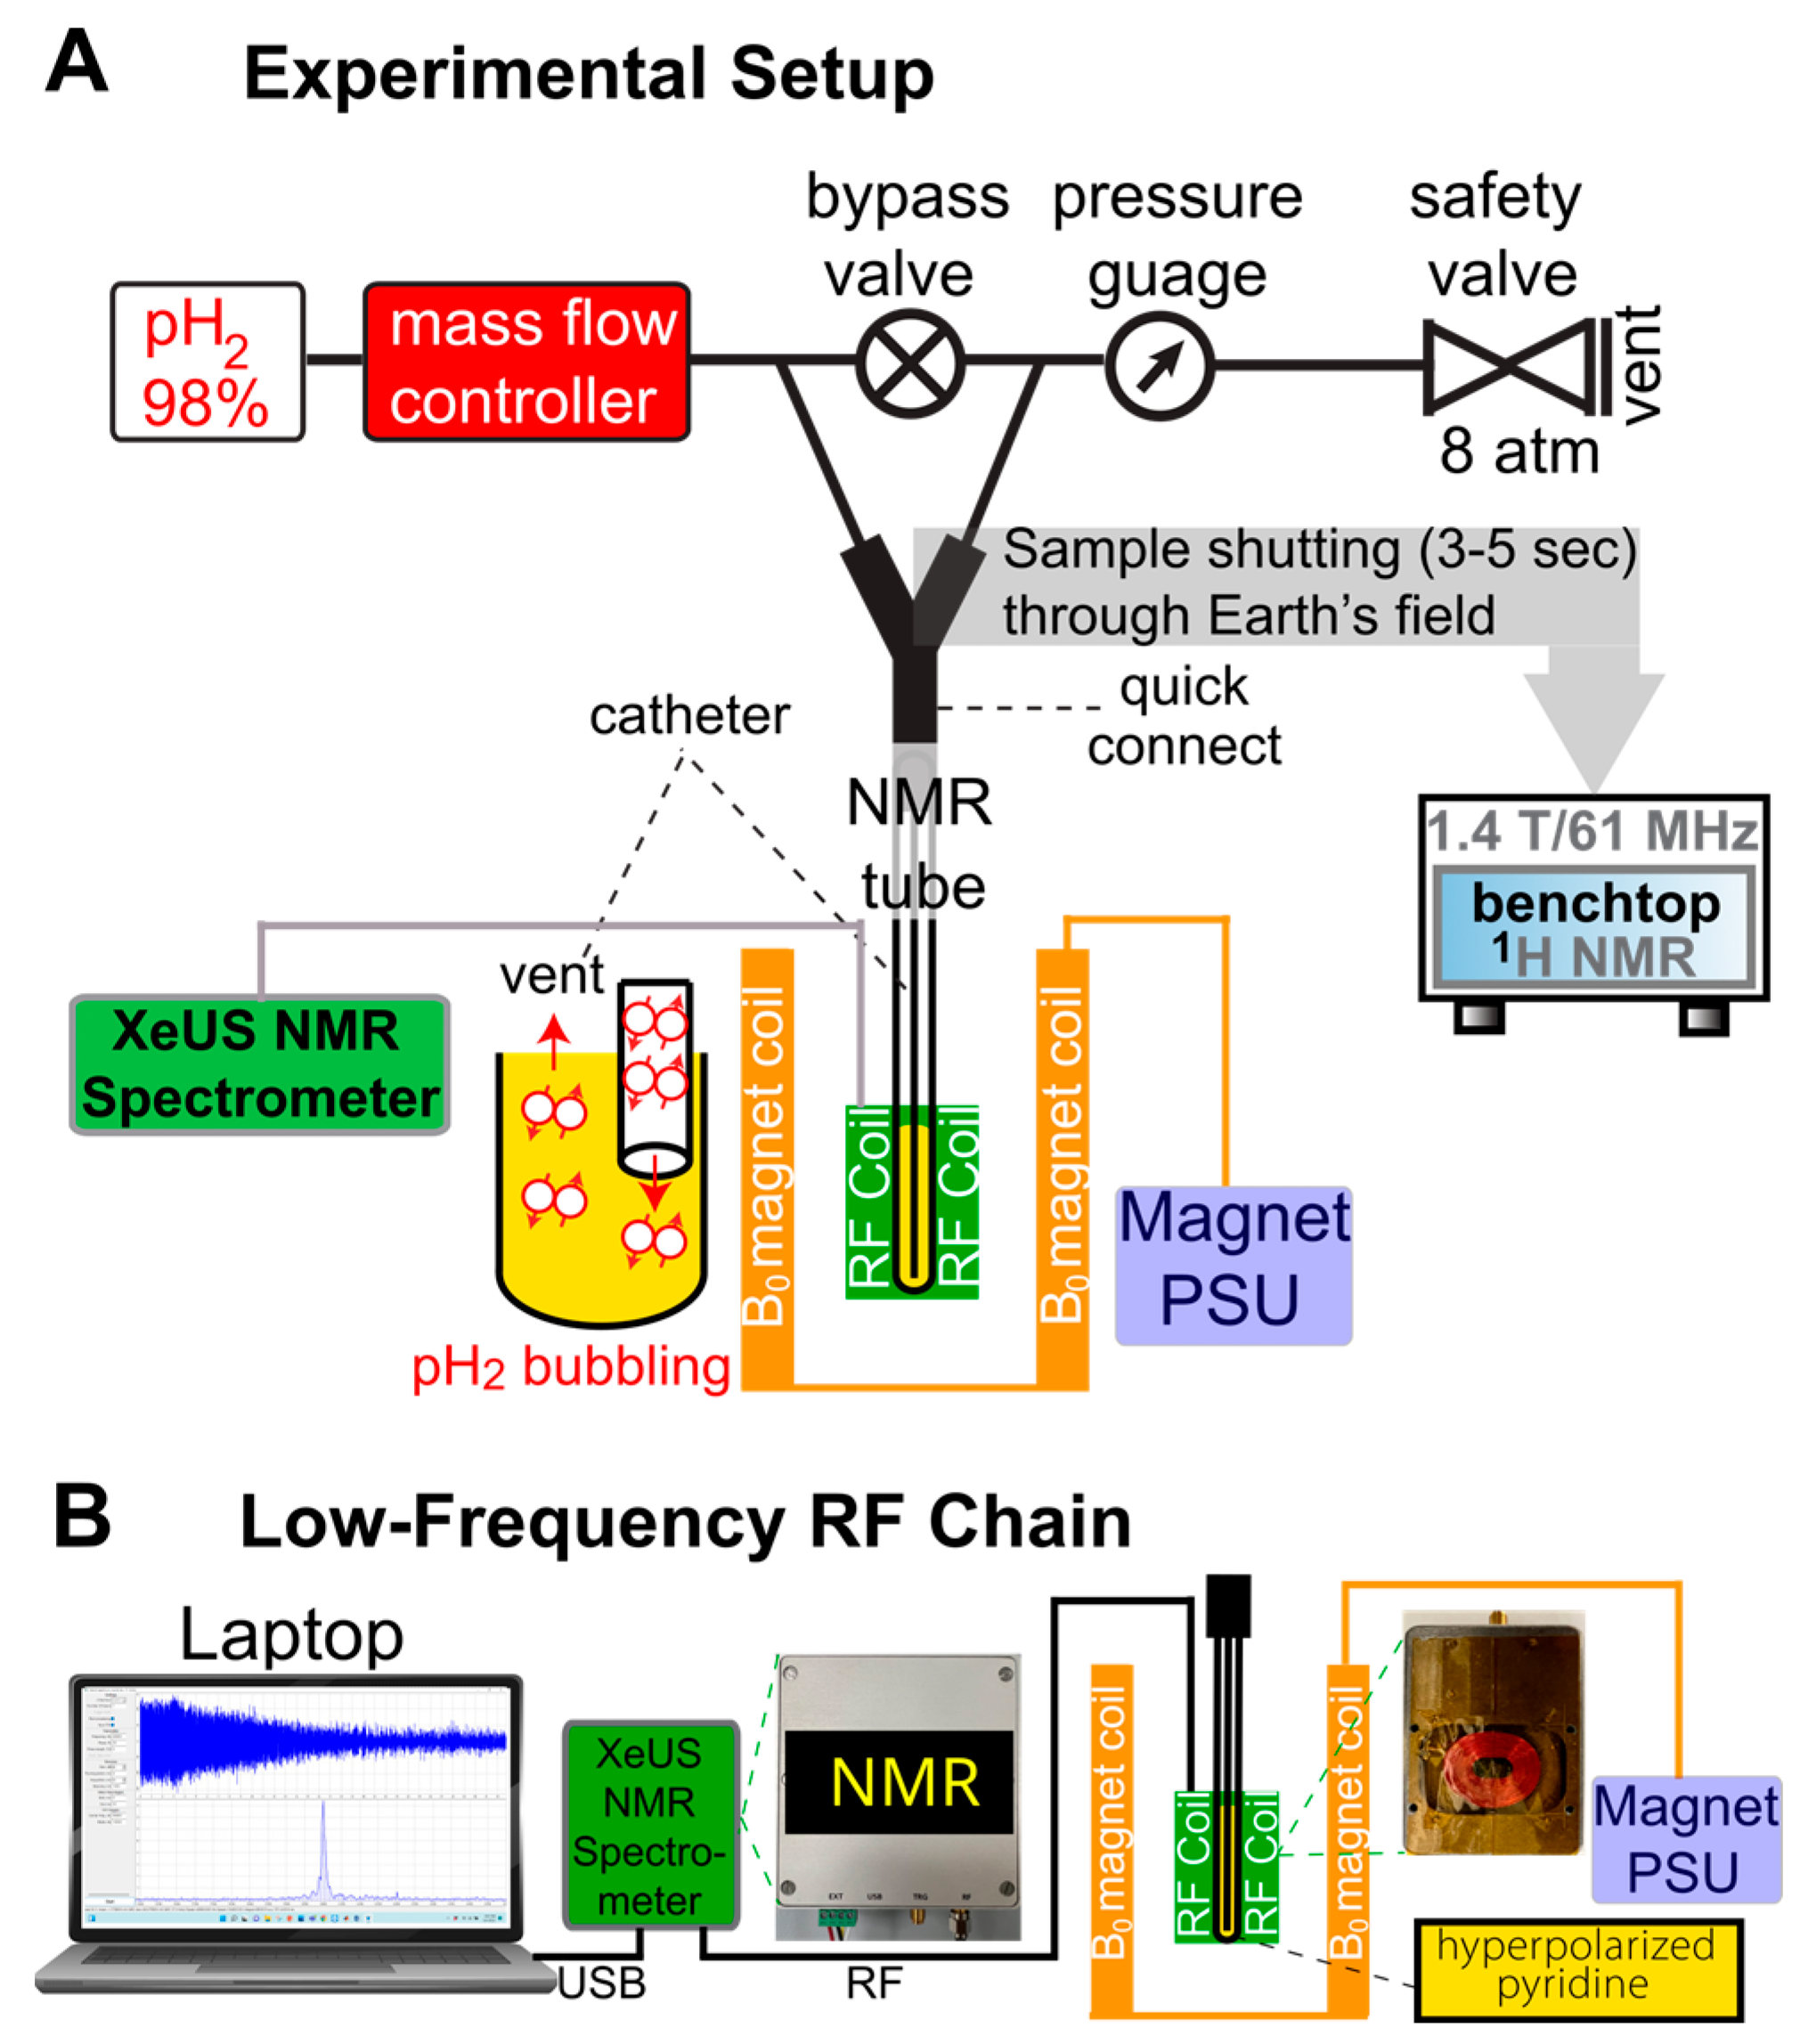
The sample was connected to the SABRE setup shown in Figure 2A and inserted into the solenoid magnet at its center position. The sample was bubbled with pH2 for 10 min to convert the precatalyst into the SABRE-active complex [Ir(IMes)(H)2(Py)3].
In the case of NMR detection using a 1.4 T benchtop NMR spectrometer (Magritek (Wellington, New Zealand), SpinSolve Carbon 60), the magnetic field inside the solenoid was set to 8 mT. pH2 was bubbled through the sample for 60 s at 7.5 atm overpressure and 100 standard cubic centimeters per minute (sccm) gas flow rate. The sample was manually transferred to the spectrometer after gas bubbling was terminated, and a 1H NMR spectrum was acquired with a 90° RF pulse.
The low-field NMR spectrometer used for in situ detection experiments was previously described in Ref. [52]. The NMR tube containing the prepared sample was placed such that the sample was at the center of the RF coil. The RF coil employs a parallel LC circuit optimized for detection at 40.8 kHz, with a resistance of 20 Ohm, a tuning capacitor with a capacity of 33,000 pF with impedance of ~130 Ohm at 40 kHz, and a multi-turn inductor with inductance of 0.5 mH with impedance of ~130 Ohm at 40 kHz (total impedance of 280 Ohm). The RF coil was encased in an aluminum enclosure. This shielded design eliminated much of the noise from the surroundings. The RF coil was placed in the center of the solenoid magnet and connected to the low-field NMR spectrometer (XeUS Technologies Ltd. (Nicosia, Cyprus)) [52], which, in turn, was connected to a laptop. The magnet PSU was dialed to 0.70 A, and pH2 was bubbled through the sample for 30 s at 7.5 atm overpressure and 100 sccm gas flow rate while acquiring NMR data every second. For the acquisition of relaxation data, pH2 was bubbled for ca. 60 s, after which bubbling was stopped, and NMR data was acquired for ca. 20 s.
The NMR data was analyzed using MATLAB 2022-2023 (The MathWorks, Inc. (Natick, MA, USA)). Plots of proton NMR signal integral of HP pyridine were fitted using either a mono-exponential growth function for the polarization buildup or a mono-exponential decay function for the relaxation data.
The magnetic field profile of the SABRE polarization was measured by acquiring NMR data as a function of solenoid current. The values of the magnetic field were calculated using a proportion between the current dialed to the PSU and the field (e.g., 0.70 A corresponds to 0.96 mT). The data was then analyzed using MATLAB, and the proton integral values were plotted in Origin Pro 9 software (OriginLab Corporation (Northampton, MA, USA)).

3. Results and Discussion

3.1. Physical Properties of Constructed Solenoid Coils

In total, four solenoid coils were constructed for the study; their physical parameters are presented in Table 1. Two of the coils, referred to as Coils 1 and 2, were very close to one another in length, 51.2 cm and 49.2 cm, respectively, except for having different wire diameters. The reduction in wire diameter for Coil 2 versus Coil 1 is expected to increase the generated magnetic field at fixed current. Coil 3 was designed with the same inner diameter, with a slightly increased tube base length of 56.1 cm and a coiled wire length of 48.9 cm with a thicker 1.024 mm diameter (18 gauge) wire, which results in a lower magnetic field at the same current compared to Coils 1 and 2. Coil 4 was the largest coil constructed, with 2 times greater the length and diameter of the other three coils.

3.2. Simulation of Solenoid Electromagnetic Field

Simulation of the electromagnetic field generated by solenoids showed a peak near the geometric center of the coil, which decayed slowly over a ~10 cm long region and sharply decreased towards the ends of the coil—as expected for a single-source solenoidal electromagnetic field. Visualizations of the magnetic field simulation for one of the coils (Coil 1) are shown in Figure 3.

3.3. Magnetic Field Homogeneity Measurements of the Solenoid Coils

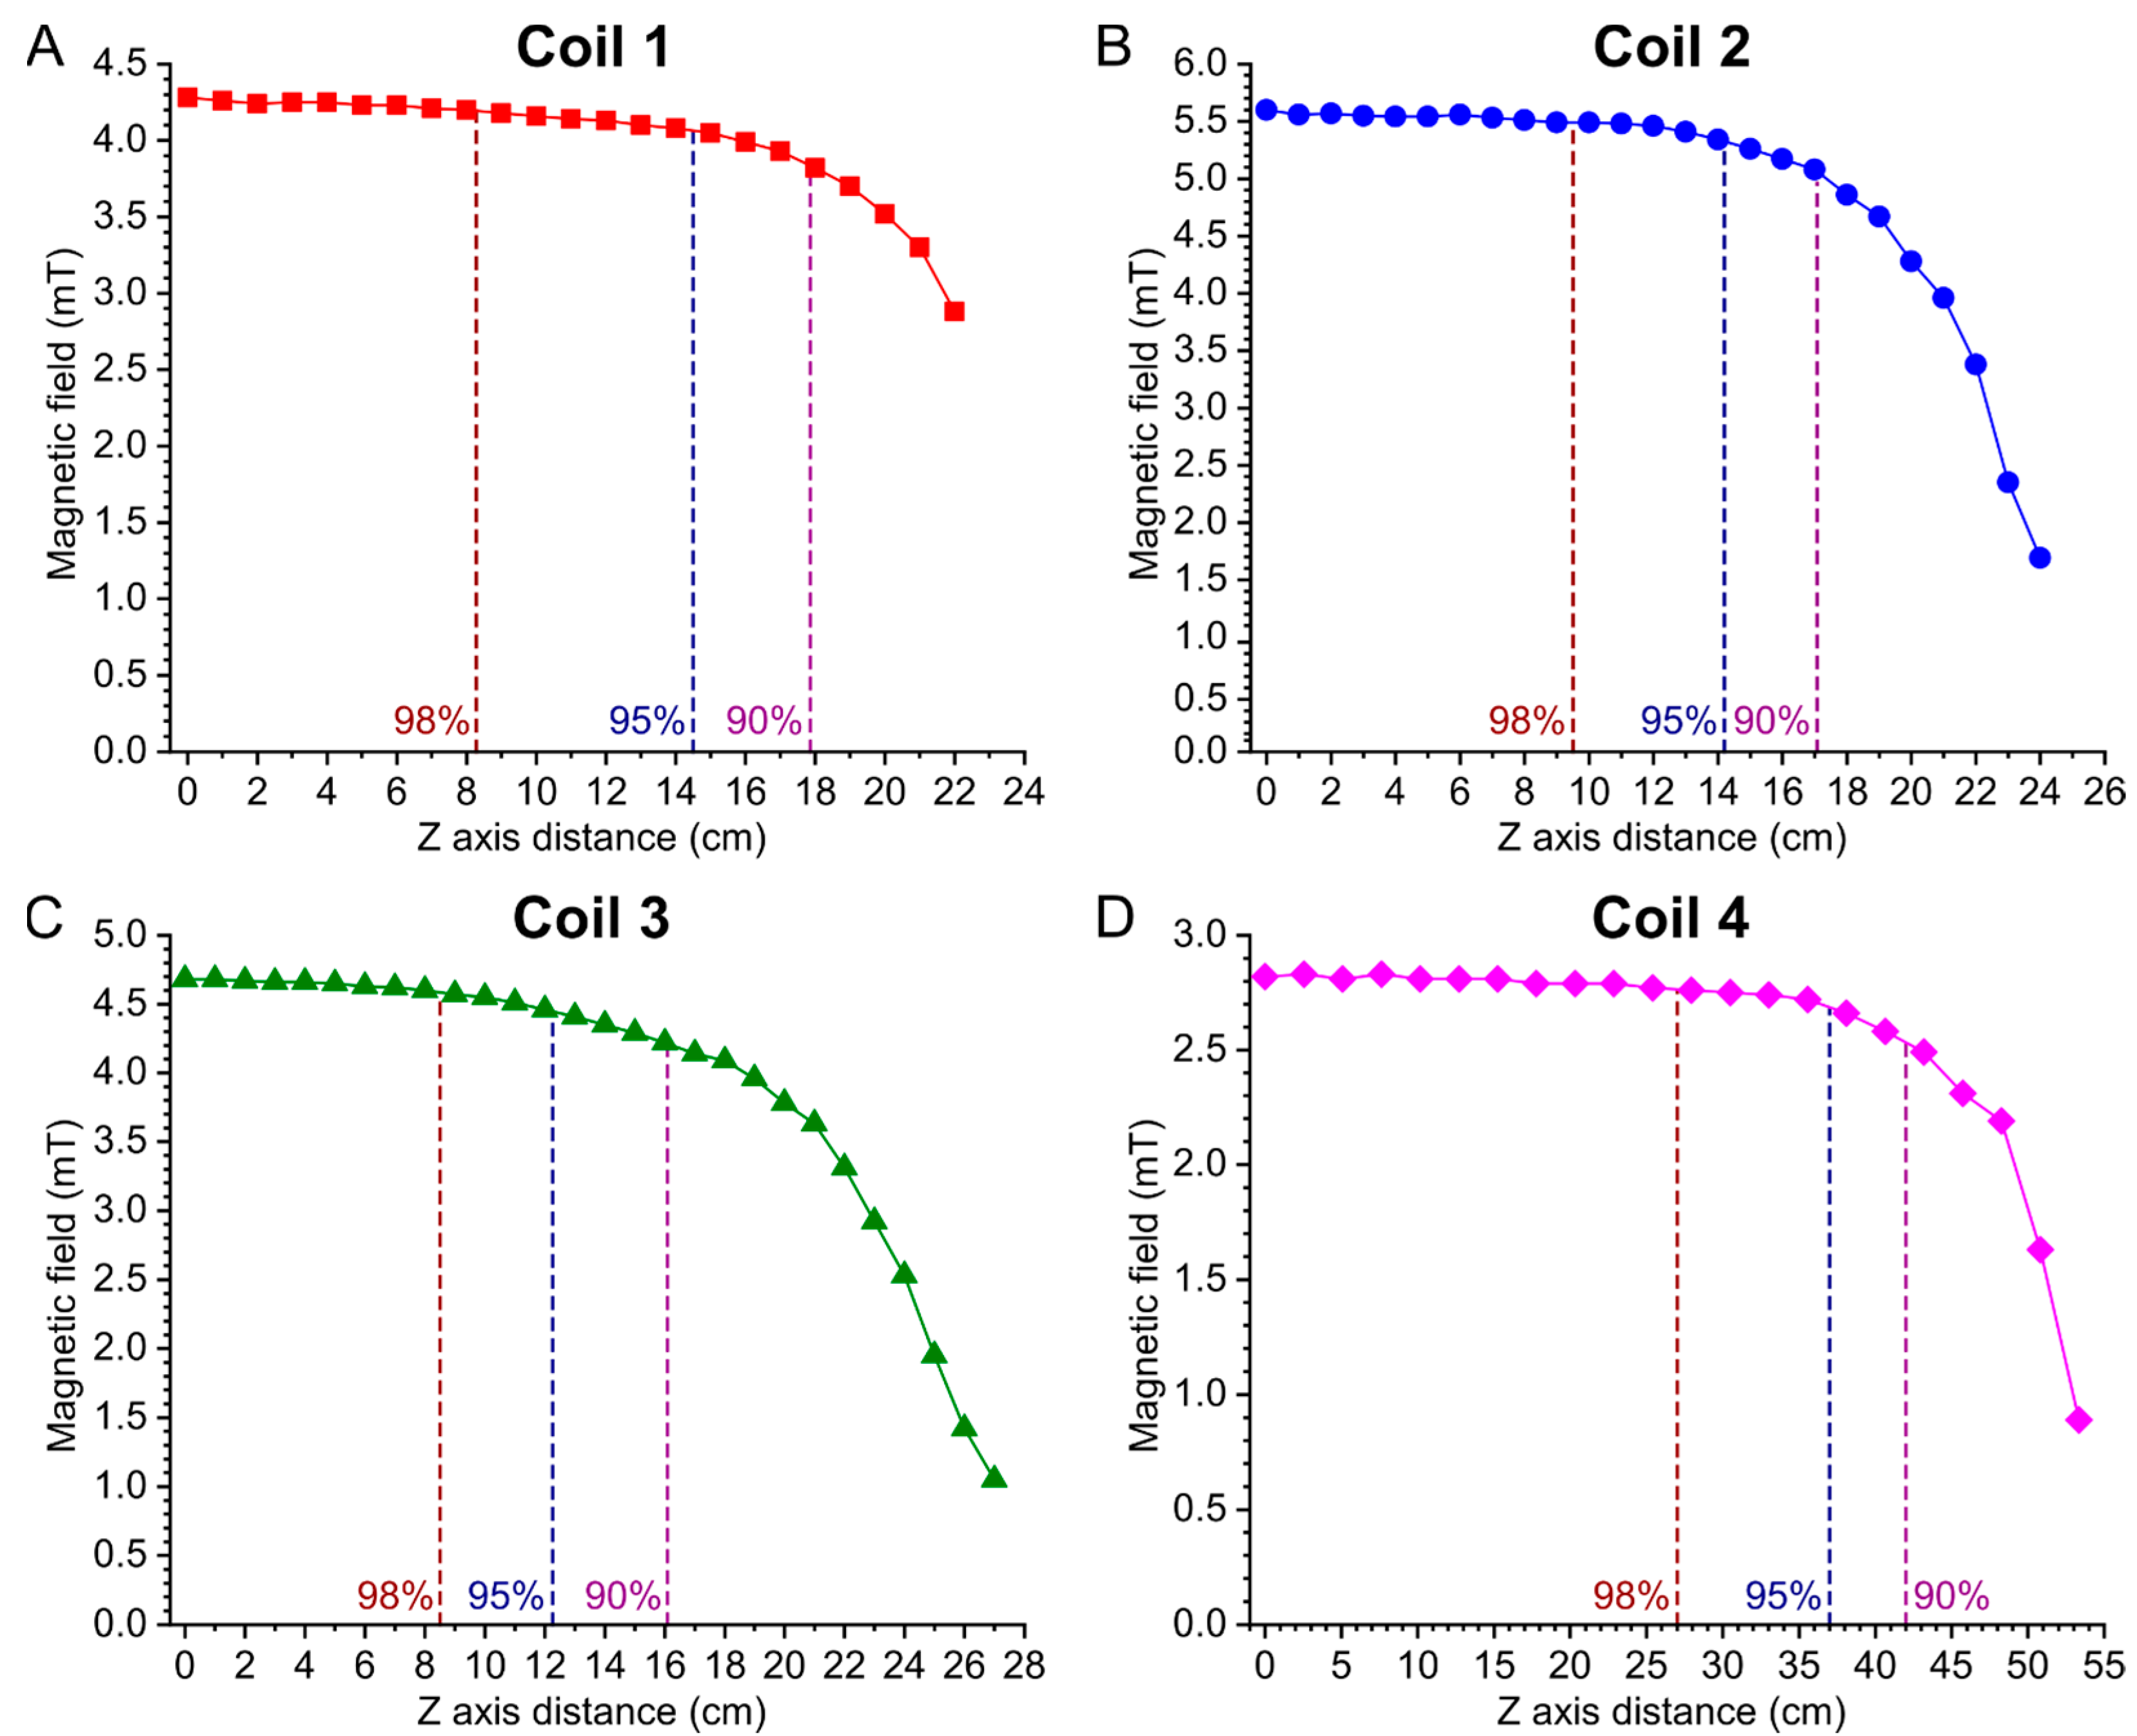
The simulation data was promising regarding a homogeneous region of magnetic field near the coil center, but once the coil was built, empirical data was needed to verify simulation results and demonstrate efficacy as a field source for SABRE and PHIP experiments, as well as for in situ NMR spectroscopy. The measured magnetic field profiles along the Z axes of the constructed solenoids are presented in Figure 4. Electromagnetic solenoids are known to have homogeneous magnetic fields internally, peaking in strength near their geometric center. This was borne out both by the simulation (see Section 3.2) and the empirical data presented in Figure 4. The difference in simulated and experimentally measured magnetic fields for Coil 1 (cf. Figure 3 and Figure 4) stems from the fact that different currents were used (7 A in simulations and 2.5 A in experimental measurements). Notably, the largest Coil 4 also had the largest region of highly homogeneous magnetic field strength, which is to be expected. Promisingly, each solenoid has a large enough region of magnetic field homogeneity to allow for low-field NMR spectroscopy when using appropriately sized samples and containers less than 10 cm long. Of note, magnetic field homogeneity is not critically important for polarization transfer because the maximum in the 1H SABRE magnetic field profile is typically broad enough [51]. However, it is important for in situ NMR detection as better homogeneity allows for a narrower linewidth. The suggested solution for improved homogeneity is to add a second layer of several compensation wire turns at the ends of the coil [49].

3.4. SABRE Hyperpolarization Tests

Next, SABRE hyperpolarization experiments were performed to demonstrate the usability of the constructed coils for 1H SABRE hyperpolarization. The employed experimental setup is schematically presented in Figure 2A. Hyperpolarization occurred as a result of pH2 bubbling through the sample initially containing 0.1 M of pyridine and 6 mM of SABRE precatalyst [Ir(IMes)(COD)Cl] (converted to [Ir(IMes)(H)2(Py)3]+ upon activation [53]), while it is located inside the solenoid with a generated magnetic field controlled with a PSU. After the hyperpolarization process, NMR detection was performed—either in situ inside the same electromagnet using a low-field NMR spectrometer operating at 40.8 kHz (Figure 2B) or via manual transfer of the sample to a 1.4 T (61 MHz) benchtop NMR spectrometer.
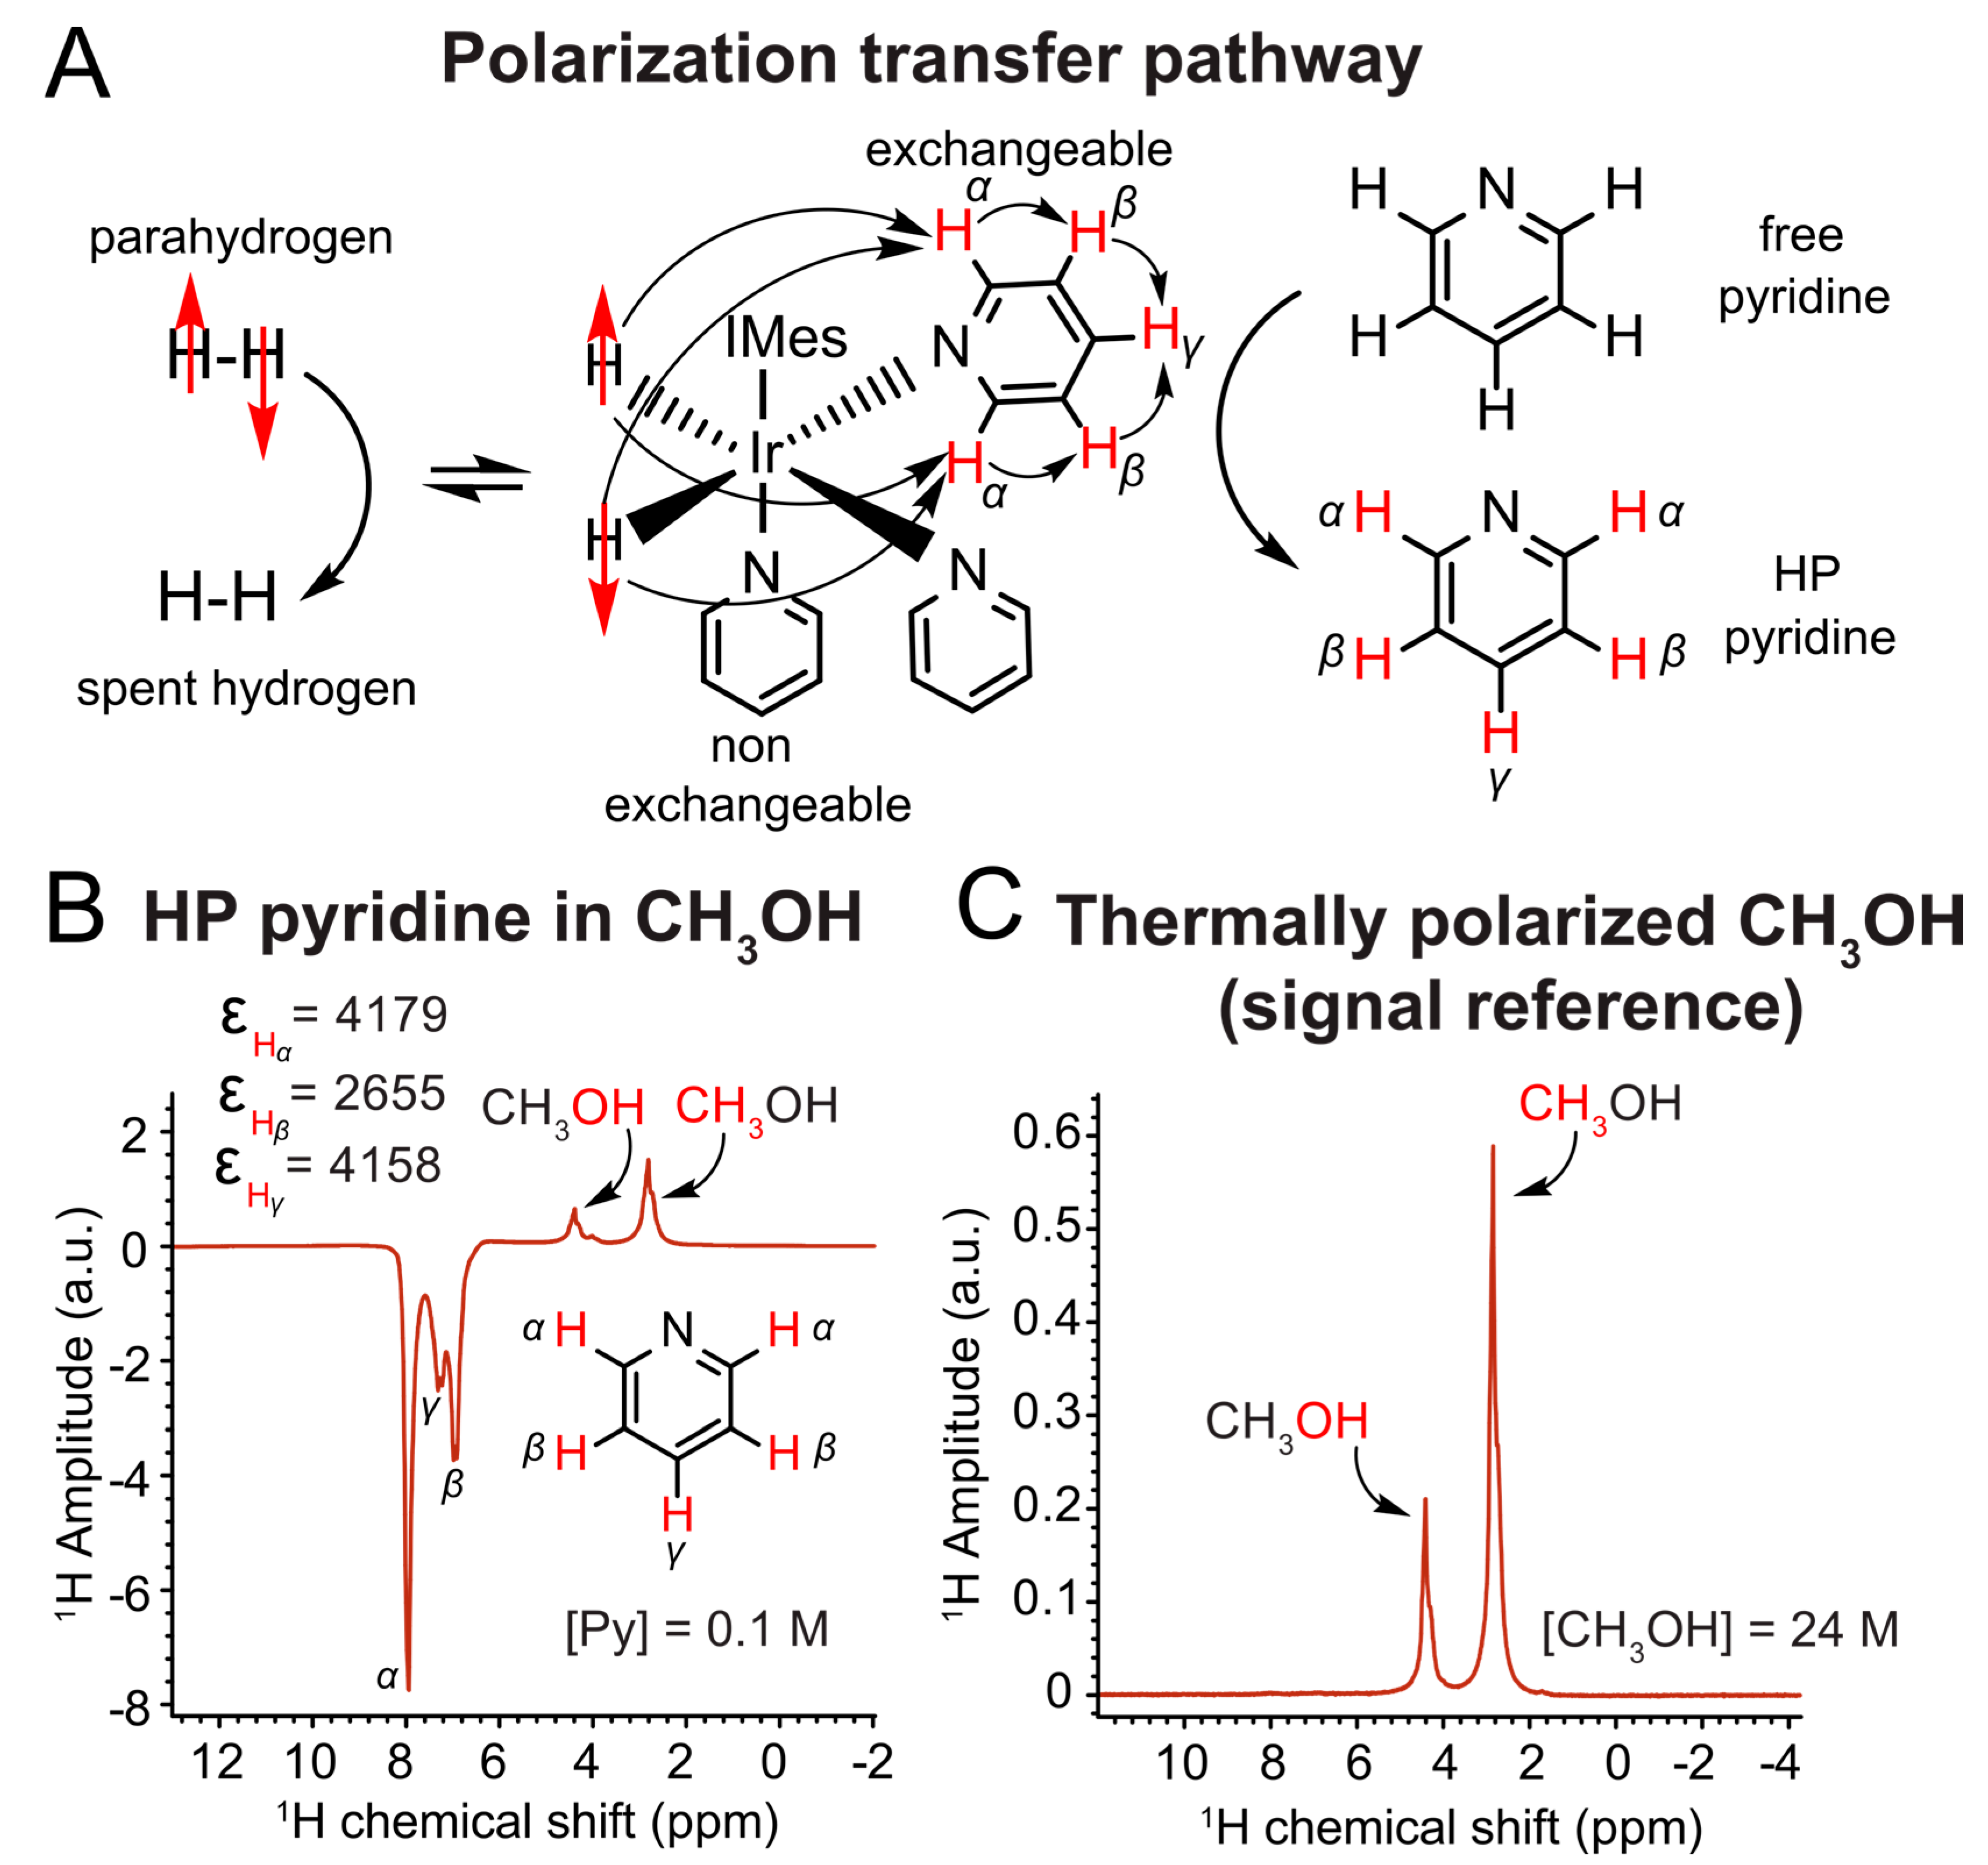
The 1H NMR spectrum of pyridine (0.1 M) in a methanol solution hyperpolarized at 8 mT using Coil 2 is shown in Figure 5B (the spectrum was acquired at 61 MHz using a 1.4 T benchtop NMR spectrometer; additional reproducibility runs are shown in Figure S5). The signal enhancement factors were 3750 ± 490, 2730 ± 190, and 3680 ± 460 for the α, β, and γ-protons of pyridine, respectively. The corresponding 1H polarization levels were 1.8 ± 0.2, 1.30 ± 0.09, and 1.8 ± 0.2, respectively, which are comparable with data from the literature [53,54].
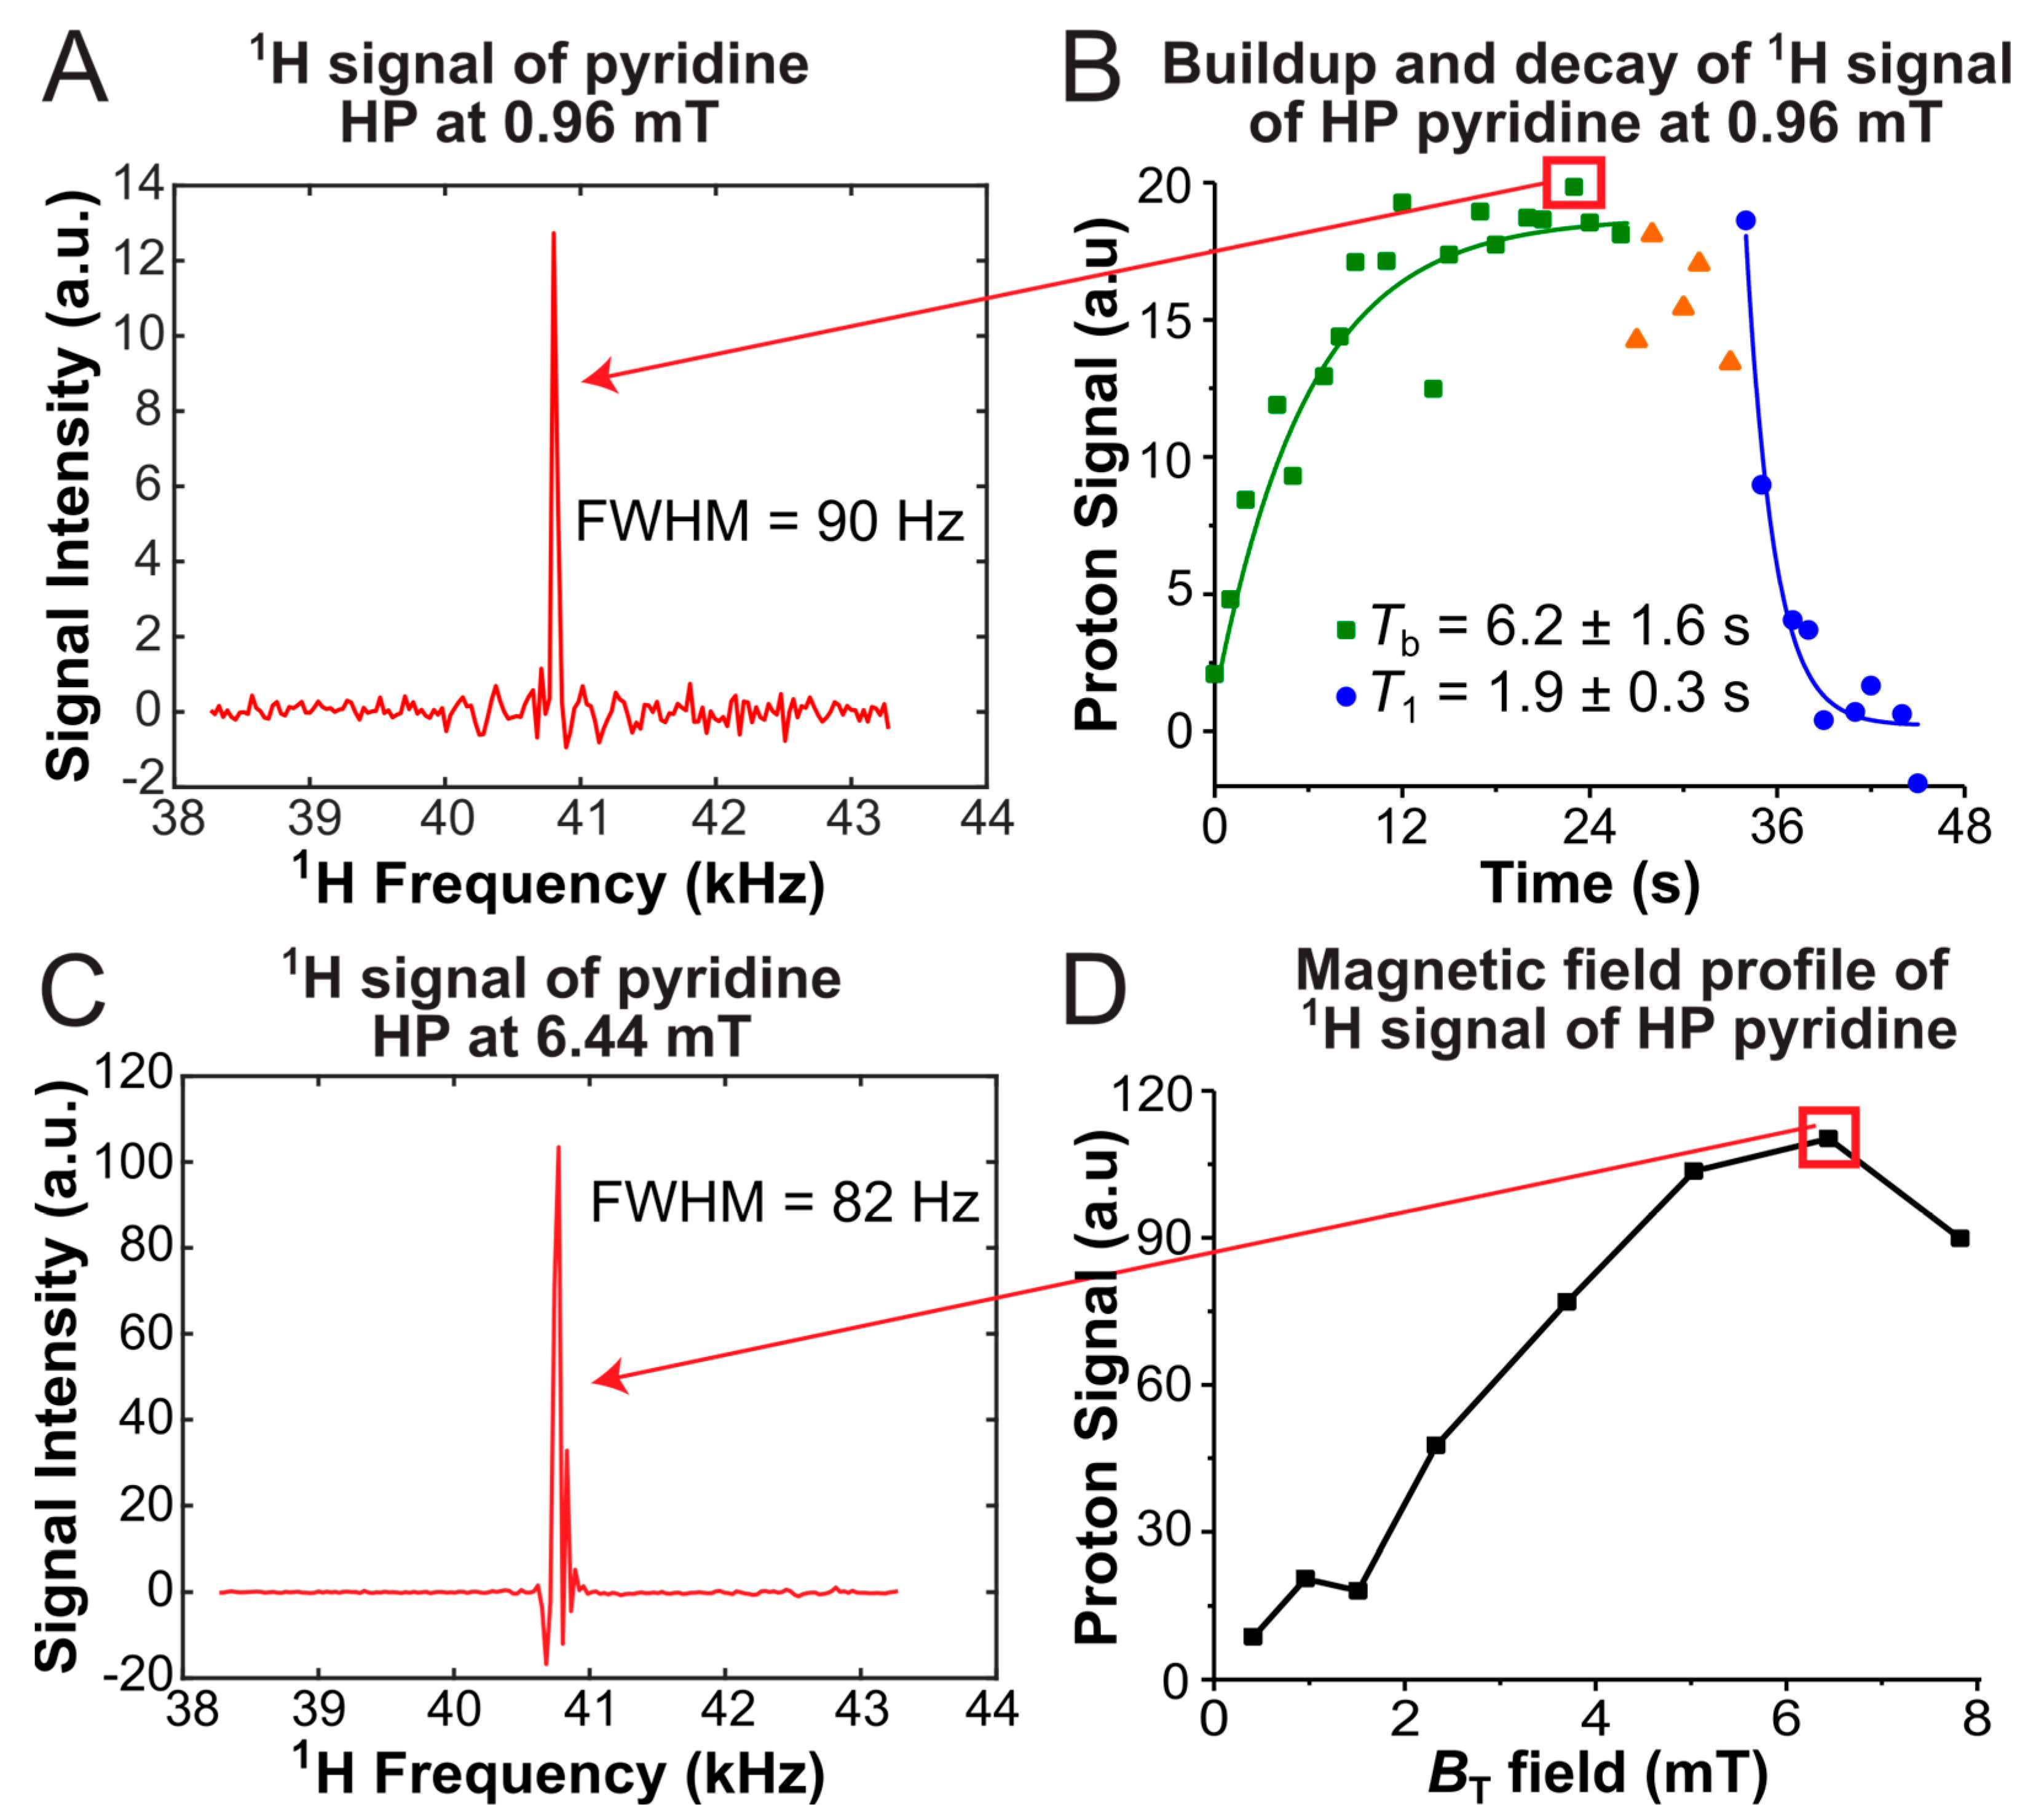
The feasibility of in situ detection of 1H SABRE hyperpolarization using the designed setup was also demonstrated. Figure 6A shows the 1H NMR spectrum of HP pyridine for the case when both hyperpolarization and detection were carried out at a magnetic field of 0.96 mT (at this field, 1H resonance frequency is 40.8 kHz). The in situ detected hyperpolarization dynamics at 0.96 mT (polarization buildup and decay) are shown in Figure 6B. The polarization buildup exponential time constant (Tb) was 6.2 ± 1.6 s, whereas the longitudinal relaxation time (T1) was 1.9 ± 0.3 s. Of note, these are effective time constants because we did not use the volume coil, so the pulse angle is difficult to quantify. As a result, it is possible that the applied RF pulses significantly affected the measured hyperpolarization dynamics, leading to enhanced apparent relaxation. Another possible factor contributing to fast relaxation is that at such a low field, the pyridine spins share polarization with the hydride network very efficiently, causing faster-than-expected apparent signal decay. At the same time, the fact that this low-field setup allows us to resolve and quantify such fast dynamics in situ demonstrates the usefulness of this approach.
Figure 6D shows the magnetic field dependence of the 1H NMR signal of SABRE-HP pyridine in the several millitesla range. The maximal signal was observed when hyperpolarization was performed at 6.44 mT (the corresponding spectrum is presented in Figure 6C), which is in excellent agreement with expectations based on data from the literature for [Ir(IMes)(H)2(Py)3]+ complex and position of LACs for this spin system [51,53,55]. Our results demonstrate that, in spite of relatively high full width of half maximum (FWHM) of ca. 80–90 Hz (corresponding to ca. 2100 ppm, Figure 6A,C), low-field in situ single-scan NMR detection of 1H SABRE hyperpolarization using the constructed solenoids is feasible.
Although here we demonstrated the efficient performance of the designed solenoid coils on the example of 1H SABRE hyperpolarization of pyridine (which arguably is a benchmark substrate for SABRE), other compounds suitable for 1H SABRE can be employed for this purpose. The list of possible alternatives includes other nitrogen heterocycles (e.g., pyridazine [56], pyrazine [57], nicotinamide [22], imidazole [58]), amines [59], and acetonitrile [60].

4. Conclusions

The custom-made low-cost system was successfully used for SABRE hyperpolarization generation and detection. The 1H NMR signals were detected at relatively low field strengths, demonstrating the efficacy of the employed hyperpolarization protocol. No individual component (except for the optional benchtop NMR spectrometer) of the system costs more than USD 5000, and the most expensive component was the 1H NMR detector. The solenoids all have a central region of highly homogeneous magnetic field, being within at least 97% of the maximum field strength at 10 cm from the center, with the homogeneity increasing as the solenoid length/size increases. The field homogeneity measured was not at the level of large commercial grade NMR spectroscopy systems, which is on the order of <10 ppb over their sampled volumes. However, it was sufficient to acquire a well-resolved signal of a HP sample in situ. Altogether, this study serves as a useful viability demonstration for similar low-cost experimental setups for SABRE hyperpolarization and detection, as the materials acquired are all low-cost, and the coils production methods, enrichment of pH2, and SABRE hyperpolarization were easy to perform and repeat. Taken together with our recent publication, which describes simple and large-scale Ir catalyst preparation for SABRE hyperpolarization [61], this work helps to drastically decrease the entrance barrier to the area of hyperpolarization for members of the broader scientific community worldwide.

Supplementary Materials

The following supporting information can be downloaded at: https://www.mdpi.com/article/10.3390/magnetochemistry11090080/s1, Figure S1: (A) photo of the assembled apparatus prior to synthesis; (B) photo of the assembled apparatus after dissolving the reagents in two flasks, yellow solution of IMes (left), brown non-transparent solution of [Ir(COD)Cl]2 (right); (C) photo of the reaction flask during synthesis. Figure S2: (A) photo of the reaction flask used to evaporate benzene solvent using a rotovap; (B) photo of a silica gel column shortly after the addition of crude product in DCM; (C) photo of the final product stored in a sealed glass vial under argon. Figure S3: 1H NMR (600 MHz) spectra of [Ir(IMes)(COD)Cl] catalyst in CD3OD synthesized using the procedure described in the text; (A) final dried product; (B) material after column and pentane wash; (C) crude product. Figure S4: casting of stoppers for winding of Coil 4. Figure S5: reproducibility 1H NMR spectra of HP pyridine in CH3OH acquired on a 1.4 T benchtop NMR spectrometer. Table S1: summary of all synthesized batches. References [62,63,64,65] are cited in the Supplementary Materials.

Author Contributions

Conceptualization, R.V.S.; methodology, L.M.K. and R.V.S.; investigation, G.L.W., C.O., T.Y.O., I.A., J.E.R., F.A., Z.T.B., A.S., J.G. and R.V.S.; resources, R.V.S. and E.Y.C.; writing—original draft preparation, Z.T.B., O.G.S., G.L.W., C.O. and R.V.S.; writing—review and editing, O.G.S., I.V.K., B.M.G., E.Y.C., R.V.S., W.M.S. and J.E.R.; visualization, Z.T.B., O.G.S., G.L.W., C.O. and R.V.S.; supervision, R.V.S.; funding acquisition, R.V.S., E.Y.C. and O.G.S. All authors have read and agreed to the published version of the manuscript.

Funding

This work was supported by the National Science Foundation under grants CHE-2404387, CHE-2404388, National Cancer Institute P30CA022453, and the National Institute of Biomedical Imaging and Bioengineering of the National Institutes of Health under awards R21EB033872 and R01EB029829. The content is solely the responsibility of the authors and does not necessarily represent the official views of the National Institutes of Health. CO and EYC thank Wayne State University Thomas C. Rumble University Graduate Fellowship. This material is based upon work supported by the U.S. Department of Energy, Office of Biological and Environmental Research (BER) under Award Number(s) DE-SC0025315. Disclaimer: This report was prepared as an account of work sponsored by an agency of the United States Government. Neither the United States Government nor any agency thereof, nor any of their employees, makes any warranty, express or implied, or assumes any legal liability or responsibility for the accuracy, completeness, or usefulness of any information, apparatus, product, or process disclosed, or represents that its use would not infringe privately owned rights. Reference herein to any specific commercial product, process, or service by trade name, trademark, manufacturer, or otherwise does not necessarily constitute or imply its endorsement, recommendation, or favoring by the United States Government or any agency thereof. The views and opinions of authors expressed herein do not necessarily state or reflect those of the United States Government or any agency. O.G.S. thanks the Russian Science Foundation (grant 24-73-10093) for the support of the data analysis and writing and editing of the manuscript draft. O.G.S. and I.V.K. thank the Ministry of Science and Higher Education of the Russian Federation for access to NMR equipment. R.V.S. thanks South Dakota Mines (university startup), South Dakota Mines (Nelson Research Grant), NSF (WSU subaward, 2404388).

Institutional Review Board Statement

Not applicable.

Informed Consent Statement

Not applicable.

Data Availability Statement

The dataset generated and analyzed during the current study is openly available in Zenodo at https://doi.org/10.5281/zenodo.17156800.

Conflicts of Interest

E.Y.C. and B.M.G. are co-founders and shareholders of XeUS Technologies LTD, and PerXeus, Inc. The remaining authors declare that the research was conducted in the absence of any commercial or financial relationships that could be construed as a potential conflict of interest.

Abbreviations

The following abbreviations are used in this manuscript:
HPHyperpolarization
PHIPParahydrogen-Induced Polarization
SABRESignal Amplification By Reversible Exchange
d-DNPDissolution Dynamic Nuclear Polarization
NMRNuclear Magnetic Resonance
pH2Parahydrogen
PSUPower Supply Unit
PyPyridine
IMes1,3-dimesitylimidazol-2-ylidene
COD1,5-cyclooctadiene
sccmStandard Cubic Centimeters Per Minute

References

  1. Eills, J.; Budker, D.; Cavagnero, S.; Chekmenev, E.Y.; Elliott, S.J.; Jannin, S.; Lesage, A.; Matysik, J.; Meersmann, T.; Prisner, T.; et al. Spin Hyperpolarization in Modern Magnetic Resonance. Chem. Rev. 2023, 123, 1417–1551. [Google Scholar] [CrossRef]
  2. Kovtunov, K.V.; Pokochueva, E.V.; Salnikov, O.G.; Cousin, S.F.; Kurzbach, D.; Vuichoud, B.; Jannin, S.; Chekmenev, E.Y.; Goodson, B.M.; Barskiy, D.A.; et al. Hyperpolarized NMR Spectroscopy: D-DNP, PHIP, and SABRE Techniques. Chem. Asian J. 2018, 13, 1857–1871. [Google Scholar] [CrossRef]
  3. Elliott, S.J.; Stern, Q.; Ceillier, M.; El Daraï, T.; Cousin, S.F.; Cala, O.; Jannin, S. Practical Dissolution Dynamic Nuclear Polarization. Prog. Nucl. Magn. Reson. Spectrosc. 2021, 126–127, 59–100. [Google Scholar] [CrossRef]
  4. Pinon, A.C.; Capozzi, A.; Ardenkjær-Larsen, J.H. Hyperpolarization via Dissolution Dynamic Nuclear Polarization: New Technological and Methodological Advances. Magn. Reson. Mater. Phys. Biol. Med. 2021, 34, 5–23. [Google Scholar] [CrossRef]
  5. Capozzi, A.; Patel, S.; Wenckebach, W.T.; Karlsson, M.; Lerche, M.H.; Ardenkjær-Larsen, J.H. Gadolinium Effect at High-Magnetic-Field DNP: 70% 13C Polarization of [U-13C] Glucose Using Trityl. J. Phys. Chem. Lett. 2019, 10, 3420–3425. [Google Scholar] [CrossRef]
  6. Yoshihara, H.A.I.; Can, E.; Karlsson, M.; Lerche, M.H.; Schwitter, J.; Comment, A. High-Field Dissolution Dynamic Nuclear Polarization of [1-13C]Pyruvic Acid. Phys. Chem. Chem. Phys. 2016, 18, 12409–12413. [Google Scholar] [CrossRef]
  7. Patel, S.; Pinon, A.C.; Lerche, M.H.; Karlsson, M.; Capozzi, A.; Ardenkjær-Larsen, J.H. UV-Irradiated 2-Keto-(1-13C)Isocaproic Acid for High-Performance 13C Hyperpolarized MR. J. Phys. Chem. C 2020, 124, 23859–23866. [Google Scholar] [CrossRef]
  8. Stern, Q.; Reynard-Feytis, Q.; Elliott, S.J.; Ceillier, M.; Cala, O.; Ivanov, K.; Jannin, S. Rapid and Simple 13C-Hyperpolarization by 1H Dissolution Dynamic Nuclear Polarization Followed by an Inline Magnetic Field Inversion. J. Am. Chem. Soc. 2023, 145, 27576–27586. [Google Scholar] [CrossRef]
  9. Pokochueva, E.V.; Le, N.H.; Guibert, S.; Gioiosa, C.; Stern, Q.; Tolchard, J.; Bocquelet, C.; Cala, O.; Cavaillès, M.; Veyre, L.; et al. Hybrid Polarizing Solids with Extended Pore Diameters for Dissolution Dynamic Nuclear Polarization. Chem.-Methods 2025, 5, e202400068. [Google Scholar] [CrossRef]
  10. Nikolaou, P.; Coffey, A.M.; Walkup, L.L.; Gust, B.M.; Whiting, N.; Newton, H.; Barcus, S.; Muradyan, I.; Dabaghyan, M.; Moroz, G.D.; et al. Near-Unity Nuclear Polarization with an Open-Source 129Xe Hyperpolarizer for NMR and MRI. Proc. Natl. Acad. Sci. USA 2013, 110, 14150–14155. [Google Scholar] [CrossRef]
  11. Nikolaou, P.; Coffey, A.M.; Walkup, L.L.; Gust, B.M.; LaPierre, C.D.; Koehnemann, E.; Barlow, M.J.; Rosen, M.S.; Goodson, B.M.; Chekmenev, E.Y. A 3D-Printed High Power Nuclear Spin Polarizer. J. Am. Chem. Soc. 2014, 136, 1636–1642. [Google Scholar] [CrossRef]
  12. Nikolaou, P.; Coffey, A.M.; Walkup, L.L.; Gust, B.M.; Whiting, N.; Newton, H.; Muradyan, I.; Dabaghyan, M.; Ranta, K.; Moroz, G.D.; et al. XeNA: An Automated “open-Source” 129Xe Hyperpolarizer for Clinical Use. Magn. Reson. Imaging 2014, 32, 541–550. [Google Scholar] [CrossRef]
  13. Birchall, J.R.; Irwin, R.K.; Nikolaou, P.; Coffey, A.M.; Kidd, B.E.; Murphy, M.; Molway, M.; Bales, L.B.; Ranta, K.; Barlow, M.J.; et al. XeUS: A Second-Generation Automated Open-Source Batch-Mode Clinical-Scale Hyperpolarizer. J. Magn. Reson. 2020, 319, 106813. [Google Scholar] [CrossRef]
  14. Korchak, S.; Mamone, S.; Glöggler, S. Over 50% 1H and 13C Polarization for Generating Hyperpolarized Metabolites—A Para-Hydrogen Approach. ChemistryOpen 2018, 7, 672–676. [Google Scholar] [CrossRef]
  15. Korchak, S.; Emondts, M.; Mamone, S.; Blümich, B.; Glöggler, S. Production of Highly Concentrated and Hyperpolarized Metabolites within Seconds in High and Low Magnetic Fields. Phys. Chem. Chem. Phys. 2019, 21, 22849–22856. [Google Scholar] [CrossRef]
  16. Knecht, S.; Blanchard, J.W.; Barskiy, D.; Cavallari, E.; Dagys, L.; Van Dyke, E.; Tsukanov, M.; Bliemel, B.; Münnemann, K.; Aime, S.; et al. Rapid Hyperpolarization and Purification of the Metabolite Fumarate in Aqueous Solution. Proc. Natl. Acad. Sci. USA. 2021, 118, e2025383118. [Google Scholar] [CrossRef]
  17. Dagys, L.; Korzeczek, M.C.; Parker, A.J.; Eills, J.; Blanchard, J.W.; Bengs, C.; Levitt, M.H.; Knecht, S.; Schwartz, I.; Plenio, M.B. Robust Parahydrogen-Induced Polarization at High Concentrations. Sci. Adv. 2024, 10, eado0373. [Google Scholar] [CrossRef]
  18. Marshall, A.; Salhov, A.; Gierse, M.; Müller, C.; Keim, M.; Lucas, S.; Parker, A.; Scheuer, J.; Vassiliou, C.; Neumann, P.; et al. Radio-Frequency Sweeps at Microtesla Fields for Parahydrogen-Induced Polarization of Biomolecules. J. Phys. Chem. Lett. 2023, 14, 2125–2132. [Google Scholar] [CrossRef]
  19. de Maissin, H.; Ivantaev, V.; Mohiuddin, O.; Berner, S.; von Elverfeldt, D.; Zaitsev, M.; Kiselev, V.; Schmidt, A.B. Overcoming the Challenges of Hyperpolarizing Substrates with Parahydrogen-Induced Polarization in an MRI System. Chem. Eur. J. 2025, 31, e202402911. [Google Scholar] [CrossRef]
  20. Rayner, P.J.; Norcott, P.; Appleby, K.M.; Iali, W.; John, R.O.; Hart, S.J.; Whitwood, A.C.; Duckett, S.B. Fine-Tuning the Efficiency of Para-Hydrogen-Induced Hyperpolarization by Rational N-Heterocyclic Carbene Design. Nat. Commun. 2018, 9, 4251. [Google Scholar] [CrossRef]
  21. Fekete, M.; Ahwal, F.; Duckett, S.B. Remarkable Levels of 15N Polarization Delivered Through SABRE into Unlabeled Pyridine, Pyrazine, or Metronidazole Enable Single Scan NMR Quantification at the mM Level. J. Phys. Chem. B 2020, 124, 4573–4580. [Google Scholar] [CrossRef]
  22. Rayner, P.J.; Burns, M.J.; Olaru, A.M.; Norcott, P.; Fekete, M.; Green, G.G.R.; Highton, L.A.R.; Mewis, R.E.; Duckett, S.B. Delivering Strong 1H Nuclear Hyperpolarization Levels and Long Magnetic Lifetimes through Signal Amplification by Reversible Exchange. Proc. Natl. Acad. Sci. USA 2017, 114, E3188–E3194. [Google Scholar] [CrossRef]
  23. Adelabu, I.; TomHon, P.; Kabir, M.S.H.; Nantogma, S.; Abdulmojeed, M.; Mandzhieva, I.; Ettedgui, J.; Swenson, R.E.; Krishna, M.C.; Theis, T.; et al. Order-Unity 13C Nuclear Polarization of [1-13C]Pyruvate in Seconds and the Interplay of Water and SABRE Enhancement. ChemPhysChem 2022, 23, 131–136. [Google Scholar] [CrossRef]
  24. Fraser, R.; Rutjes, F.P.J.T.; Feiters, M.C.; Tessari, M. Analysis of Complex Mixtures by Chemosensing NMR Using Para-Hydrogen-Induced Hyperpolarization. Acc. Chem. Res. 2022, 55, 1832–1844. [Google Scholar] [CrossRef]
  25. Plainchont, B.; Berruyer, P.; Dumez, J.N.; Jannin, S.; Giraudeau, P. Dynamic Nuclear Polarization Opens New Perspectives for NMR Spectroscopy in Analytical Chemistry. Anal. Chem. 2018, 90, 3639–3650. [Google Scholar] [CrossRef]
  26. Ribay, V.; Praud, C.; Letertre, M.P.M.; Dumez, J.-N.; Giraudeau, P. Hyperpolarized NMR Metabolomics. Curr. Opin. Chem. Biol. 2023, 74, 102307. [Google Scholar] [CrossRef]
  27. Silva Terra, A.I.; Taylor, D.A.; Halse, M.E. Hyperpolarised Benchtop NMR Spectroscopy for Analytical Applications. Prog. Nucl. Magn. Reson. Spectrosc. 2024, 144–145, 153–178. [Google Scholar] [CrossRef]
  28. Jimmink, B.O.; Negroni, M.; Posthumus, T.B.; Kentgens, A.P.M.; Tessari, M. Quantitative Trace Analysis of Dilute Mixtures Using a Benchtop NMR System with SABRE Hyperpolarization. Anal. Chem. 2025, 97, 10962–10965. [Google Scholar] [CrossRef]
  29. Dreisewerd, L.; Aspers, R.L.E.G.; Feiters, M.C.; Rutjes, F.P.J.T.; Tessari, M. NMR Discrimination of D- and L-α-Amino Acids at Submicromolar Concentration Via Parahydrogen-Induced Hyperpolarization. J. Am. Chem. Soc. 2023, 145, 1518–1523. [Google Scholar] [CrossRef]
  30. Ausmees, K.; Reimets, N.; Reile, I. Parahydrogen Hyperpolarization of Minimally Altered Urine Samples for Sensitivity Enhanced NMR Metabolomics. Chem. Commun. 2022, 58, 463–466. [Google Scholar] [CrossRef]
  31. Dey, A.; Charrier, B.; Martineau, E.; Deborde, C.; Gandriau, E.; Moing, A.; Jacob, D.; Eshchenko, D.; Schnell, M.; Melzi, R.; et al. Hyperpolarized NMR Metabolomics at Natural 13C Abundance. Anal. Chem. 2020, 92, 14867–14871. [Google Scholar] [CrossRef]
  32. Ribay, V.; Charrier, B.; Croyal, M.; Cariou, B.; Hadjadj, S.; Boccard, J.; Cannet, C.; Dumez, J.-N.; Letertre, M.P.M.; Giraudeau, P. Hyperpolarized 13C NMR Metabolomics of Urine Samples at Natural Abundance Applied to Chronic Kidney Disease. J. Am. Chem. Soc. 2025, 147, 644–650. [Google Scholar] [CrossRef]
  33. Kurhanewicz, J.; Vigneron, D.B.; Ardenkjaer-Larsen, J.H.; Bankson, J.A.; Brindle, K.; Cunningham, C.H.; Gallagher, F.A.; Keshari, K.R.; Kjaer, A.; Laustsen, C.; et al. Hyperpolarized 13C MRI: Path to Clinical Translation in Oncology. Neoplasia 2019, 21, 1–16. [Google Scholar] [CrossRef]
  34. Nelson, S.J.; Kurhanewicz, J.; Vigneron, D.B.; Larson, P.E.Z.; Harzstark, A.L.; Ferrone, M.; van Criekinge, M.; Chang, J.W.; Bok, R.; Park, I.; et al. Metabolic Imaging of Patients with Prostate Cancer Using Hyperpolarized [1-13C]Pyruvate. Sci. Transl. Med. 2013, 5, 198ra108. [Google Scholar] [CrossRef]
  35. Larson, P.E.Z.; Bernard, J.M.L.; Bankson, J.A.; Bøgh, N.; Bok, R.A.; Chen, A.P.; Cunningham, C.H.; Gordon, J.W.; Hövener, J.; Laustsen, C.; et al. Current Methods for Hyperpolarized [1-13C]Pyruvate MRI Human Studies. Magn. Reson. Med. 2024, 91, 2204–2228. [Google Scholar] [CrossRef]
  36. Khan, A.S.; Harvey, R.L.; Birchall, J.R.; Irwin, R.K.; Nikolaou, P.; Schrank, G.; Emami, K.; Dummer, A.; Barlow, M.J.; Goodson, B.M.; et al. Enabling Clinical Technologies for Hyperpolarized 129Xenon Magnetic Resonance Imaging and Spectroscopy. Angew. Chem. Int. Ed. 2021, 60, 22126–22147. [Google Scholar] [CrossRef]
  37. Ardenkjær-Larsen, J.H.; Fridlund, B.; Gram, A.; Hansson, G.; Hansson, L.; Lerche, M.H.; Servin, R.; Thaning, M.; Golman, K. Increase in Signal-to-Noise Ratio of >10,000 Times in Liquid-State NMR. Proc. Natl. Acad. Sci. USA 2003, 100, 10158–10163. [Google Scholar] [CrossRef]
  38. Hövener, J.-B.; Pravdivtsev, A.N.; Kidd, B.; Bowers, C.R.; Glöggler, S.; Kovtunov, K.V.; Plaumann, M.; Katz-Brull, R.; Buckenmaier, K.; Jerschow, A.; et al. Parahydrogen-Based Hyperpolarization for Biomedicine. Angew. Chem. Int. Ed. 2018, 57, 11140–11162. [Google Scholar] [CrossRef]
  39. Green, R.A.; Adams, R.W.; Duckett, S.B.; Mewis, R.E.; Williamson, D.C.; Green, G.G.R. The Theory and Practice of Hyperpolarization in Magnetic Resonance Using Parahydrogen. Prog. Nucl. Magn. Reson. Spectrosc. 2012, 67, 1–48. [Google Scholar] [CrossRef]
  40. Bowers, C.R.; Weitekamp, D.P. Transformation of Symmetrization Order to Nuclear-Spin Magnetization by Chemical Reaction and Nuclear Magnetic Resonance. Phys. Rev. Lett. 1986, 57, 2645–2648. [Google Scholar] [CrossRef]
  41. Bowers, C.R.; Weitekamp, D.P. Parahydrogen and Synthesis Allow Dramatically Enhanced Nuclear Alignment. J. Am. Chem. Soc. 1987, 109, 5541–5542. [Google Scholar] [CrossRef]
  42. Eisenschmid, T.C.; Kirss, R.U.; Deutsch, P.P.; Hommeltoft, S.I.; Eisenberg, R.; Bargon, J.; Lawler, R.G.; Balch, A.L. Para Hydrogen Induced Polarization in Hydrogenation Reactions. J. Am. Chem. Soc. 1987, 109, 8089–8091. [Google Scholar] [CrossRef]
  43. Adams, R.W.; Aguilar, J.A.; Atkinson, K.D.; Cowley, M.J.; Elliott, P.I.P.; Duckett, S.B.; Green, G.G.R.; Khazal, I.G.; López-Serrano, J.; Williamson, D.C. Reversible Interactions with Para-Hydrogen Enhance NMR Sensitivity by Polarization Transfer. Science 2009, 323, 1708–1711. [Google Scholar] [CrossRef]
  44. Salnikov, O.G.; Burueva, D.B.; Skovpin, I.V.; Koptyug, I.V. Parahydrogen-Based NMR Signal Amplification by Reversible Exchange (SABRE): Recent Advances and Applications. Mendeleev Commun. 2023, 33, 583–596. [Google Scholar] [CrossRef]
  45. Rayner, P.J.; Duckett, S.B. Signal Amplification by Reversible Exchange (SABRE): From Discovery to Diagnosis. Angew. Chem. Int. Ed. 2018, 57, 6742–6753. [Google Scholar] [CrossRef]
  46. Schmidt, A.B.; Bowers, C.R.; Buckenmaier, K.; Chekmenev, E.Y.; de Maissin, H.; Eills, J.; Ellermann, F.; Glöggler, S.; Gordon, J.W.; Knecht, S.; et al. Instrumentation for Hydrogenative Parahydrogen-Based Hyperpolarization Techniques. Anal. Chem. 2022, 94, 479–502. [Google Scholar] [CrossRef]
  47. Chapman, B.; Joalland, B.; Meersman, C.; Ettedgui, J.; Swenson, R.E.; Krishna, M.C.; Nikolaou, P.; Kovtunov, K.V.; Salnikov, O.G.; Koptyug, I.V.; et al. Low-Cost High-Pressure Clinical-Scale 50% Parahydrogen Generator Using Liquid Nitrogen at 77 K. Anal. Chem. 2021, 93, 8476–8483. [Google Scholar] [CrossRef]
  48. Ellermann, F.; Pravdivtsev, A.; Hövener, J.-B. Open-Source, Partially 3D-Printed, High-Pressure (50-Bar) Liquid-Nitrogen-Cooled Parahydrogen Generator. Magn. Reson. 2021, 2, 49–62. [Google Scholar] [CrossRef]
  49. Nantogma, S.; Chowdhury, M.R.H.; Kabir, M.S.H.; Adelabu, I.; Joshi, S.M.; Samoilenko, A.; de Maissin, H.; Schmidt, A.B.; Nikolaou, P.; Chekmenev, Y.A.; et al. MATRESHCA: Microtesla Apparatus for Transfer of Resonance Enhancement of Spin Hyperpolarization via Chemical Exchange and Addition. Anal. Chem. 2024, 96, 4171–4179. [Google Scholar] [CrossRef]
  50. Adams, R.W.; Duckett, S.B.; Green, R.A.; Williamson, D.C.; Green, G.G.R. A Theoretical Basis for Spontaneous Polarization Transfer in Non-Hydrogenative Parahydrogen-Induced Polarization. J. Chem. Phys. 2009, 131, 194505. [Google Scholar] [CrossRef]
  51. Pravdivtsev, A.N.; Ivanov, K.L.; Yurkovskaya, A.V.; Petrov, P.A.; Limbach, H.-H.; Kaptein, R.; Vieth, H.-M. Spin Polarization Transfer Mechanisms of SABRE: A Magnetic Field Dependent Study. J. Magn. Reson. 2015, 261, 73–82. [Google Scholar] [CrossRef]
  52. Chowdhury, M.R.H.; Ahmed, F.; Oladun, C.; Adelabu, I.; Abdurraheem, A.; Nantogma, S.; Birchall, J.R.; Gafar, T.A.; Chekmenev, Y.A.; Nikolaou, P.; et al. Low-Cost Purpose-Built Ultra-Low-Field NMR Spectrometer. Anal. Chem. 2024, 96, 16724–16734. [Google Scholar] [CrossRef]
  53. Cowley, M.J.; Adams, R.W.; Atkinson, K.D.; Cockett, M.C.R.; Duckett, S.B.; Green, G.G.R.; Lohman, J.A.B.; Kerssebaum, R.; Kilgour, D.; Mewis, R.E. Iridium N-Heterocyclic Carbene Complexes as Efficient Catalysts for Magnetization Transfer from Para-Hydrogen. J. Am. Chem. Soc. 2011, 133, 6134–6137. [Google Scholar] [CrossRef]
  54. van Weerdenburg, B.J.A.; Glöggler, S.; Eshuis, N.; Engwerda, A.H.J.; Smits, J.M.M.; de Gelder, R.; Appelt, S.; Wymenga, S.S.; Tessari, M.; Feiters, M.C.; et al. Ligand Effects of NHC-Iridium Catalysts for Signal Amplification by Reversible Exchange (SABRE). Chem. Commun. 2013, 49, 7388–7390. [Google Scholar] [CrossRef]
  55. Lloyd, L.S.; Asghar, A.; Burns, M.J.; Charlton, A.; Coombes, S.; Cowley, M.J.; Dear, G.J.; Duckett, S.B.; Genov, G.R.; Green, G.G.R.; et al. Hyperpolarisation Through Reversible Interactions with Parahydrogen. Catal. Sci. Technol. 2014, 4, 3544–3554. [Google Scholar] [CrossRef]
  56. Appleby, K.M.; Mewis, R.E.; Olaru, A.M.; Green, G.G.R.; Fairlamb, I.J.S.; Duckett, S.B. Investigating Pyridazine and Phthalazine Exchange in a Series of Iridium Complexes in Order to Define Their Role in the Catalytic Transfer of Magnetisation from Para-Hydrogen. Chem. Sci. 2015, 6, 3981–3993. [Google Scholar] [CrossRef]
  57. TomHon, P.M.; Han, S.; Lehmkuhl, S.; Appelt, S.; Chekmenev, E.Y.; Abolhasani, M.; Theis, T. A Versatile Compact Parahydrogen Membrane Reactor. ChemPhysChem 2021, 22, 2526–2534. [Google Scholar] [CrossRef]
  58. Fekete, M.; Rayner, P.J.; Green, G.G.R.; Duckett, S.B. Harnessing Polarisation Transfer to Indazole and Imidazole through Signal Amplification by Reversible Exchange to Improve Their NMR Detectability. Magn. Reson. Chem. 2017, 55, 944–957. [Google Scholar] [CrossRef]
  59. Iali, W.; Rayner, P.J.; Alshehri, A.; Holmes, A.J.; Ruddlesden, A.J.; Duckett, S.B. Direct and Indirect Hyperpolarisation of Amines Using Para Hydrogen. Chem. Sci. 2018, 9, 3677–3684. [Google Scholar] [CrossRef]
  60. Mewis, R.E.; Green, R.A.; Cockett, M.C.R.; Cowley, M.J.; Duckett, S.B.; Green, G.G.R.; John, R.O.; Rayner, P.J.; Williamson, D.C. Strategies for the Hyperpolarization of Acetonitrile and Related Ligands by SABRE. J. Phys. Chem. B 2015, 119, 1416–1424. [Google Scholar] [CrossRef]
  61. Smith, I.; Terkildsen, N.; Bender, Z.; Abdurraheem, A.; Nantogma, S.; Samoilenko, A.; Gyesi, J.; Kovtunova, L.M.; Salnikov, O.G.; Koptyug, I.V.; et al. SABRE Ir-IMes Catalysis for the Masses. Molecules 2025, in press. [Google Scholar]
  62. Kownacki, I.; Kubicki, M.; Szubert, K.; Marciniec, B. Synthesis, Structure and Catalytic Activity of the First Iridium(I) Siloxide versus Chloride Complexes with 1,3-Mesitylimidazolin-2-Ylidene Ligand. J. Organomet. Chem. 2008, 693, 321–328. [Google Scholar] [CrossRef]
  63. Blanchard, J.W.; Ripka, B.; Suslick, B.A.; Gelevski, D.; Wu, T.; Münnemann, K.; Barskiy, D.A.; Budker, D. Towards Large-Scale Steady-State Enhanced Nuclear Magnetization with in Situ Detection. Magn. Reson. Chem. 2021, 59, 1208–1215. [Google Scholar] [CrossRef] [PubMed]
  64. Barskiy, D.A.; Kovtunov, K.V.; Koptyug, I.V.; He, P.; Groome, K.A.; Best, Q.A.; Shi, F.; Goodson, B.M.; Shchepin, R.V.; Coffey, A.M.; et al. The Feasibility of Formation and Kinetics of NMR Signal Amplification by Reversible Exchange (SABRE) at High Magnetic Field (9.4 T). J. Am. Chem. Soc. 2014, 136, 3322–3325. [Google Scholar] [CrossRef]
  65. Vázquez-Serrano, L.D.; Owens, B.T.; Buriak, J.M. Catalytic Olefin Hydrogenation Using N-Heterocyclic Carbene-Phosphine Complexes of Iridium. Chem. Commun. 2002, 21, 2518–2519. [Google Scholar] [CrossRef]
Figure 1. (A) Annotated photograph of the setup used for winding of solenoid coils. 1—coil-winding machine, 2—10 mm rod coming from the coil-winding machine, 3—rod #1, 4—rod #2, 5—tail stock board, 6—commercial rubber stoppers, 7—custom-made polyurethane stoppers. (B) Photograph of the same setup with a solenoid coil assembled. (C) Photograph of the wound coil.
Magnetochemistry 11 00080 g001
Figure 2. (A) Schematic of experimental setup for 1H hyperpolarization of 0.1 M pyridine via SABRE followed by in situ NMR detection at 40.8 kHz using an electromagnet-based setup or sample transfer to a 1.4 T benchtop NMR spectrometer. (B) Schematic of the low-frequency RF chain for NMR signal detection using a low-field NMR spectrometer operating at 40.8 kHz.
Magnetochemistry 11 00080 g002
Figure 3. (A) Photograph of Coil 1. (B) Simulated image of Coil 1 with cross-sectional colors given by a heat map corresponding to the mean cross-sectional magnetic field strength in Tesla (see legend on the right). (C) The mean cross-sectional magnetic field versus distance from the center of Coil 1. The heat map coloration at any given point along the axis (see the color legend on the right) corresponds to the numerical value of the magnetic field shown by the white line.
Magnetochemistry 11 00080 g003
Figure 4. Magnetic field profiles along the Z axis for the constructed solenoid coils: (A) Coil 1, (B) Coil 2, (C) Coil 3, (D) Coil 4. The regions of 98, 95, and 90% magnetic field homogeneity are shown with dashed lines of different colors. Note that due to symmetry of the coils with respect to their centers, the actual lengths of the regions of the coils with a desired magnetic field homogeneity are twice as high as the corresponding Z-axis distances.
Magnetochemistry 11 00080 g004
Figure 5. (A) Schematic of the SABRE hyperpolarization process involving the example of pyridine substrate. (B) 1H NMR spectrum of HP pyridine in CH3OH acquired on a 1.4 T benchtop NMR spectrometer. (C) 1H NMR spectrum of thermally polarized CH3OH used as a signal reference.
Magnetochemistry 11 00080 g005
Figure 6. 1H NMR of HP 0.1 M pyridine using a low-field NMR spectrometer. (A) Proton signal detection at 40.8 kHz using an electromagnet-induced polarization transfer field (BT) of 0.96 mT. (B) Proton polarization dynamics: polarization buildup due to initiation of pH2 bubbling (green squares), steady-state plateau (orange triangles), and T1 decay of proton hyperpolarization (blue circles) with mono-exponential buildup time of 6.2 ± 1.6 s and relaxation time T1 of 1.9 ± 0.3 s, respectively. (C) Proton signal detection at 40.8 kHz using an electromagnet-induced BT of 6.44 mT. Note that after hyperpolarization at 6.44 mT, the magnetic field was switched to 0.96 mT for detection. (D) BT magnetic field dependence of pyridine 1H SABRE signal.
Magnetochemistry 11 00080 g006
Table 1. Physical details of the constructed solenoid coils.
Coil #Length, cmLength (Coiled Wire), cmInner Diameter, cmThickness of Tube Base, cmWire Diameter, mm
Coil 151.246.47.60.1650.812
Coil 249.244.37.60.1650.511
Coil 356.148.97.60.1581.024
Coil 4106.7101.815.20.2750.812
Disclaimer/Publisher’s Note: The statements, opinions and data contained in all publications are solely those of the individual author(s) and contributor(s) and not of MDPI and/or the editor(s). MDPI and/or the editor(s) disclaim responsibility for any injury to people or property resulting from any ideas, methods, instructions or products referred to in the content.