Article

Isolating, Identifying, and Analyzing the Biological Characteristics of Pathogens Causing Postharvest Disease in Fresh Radix Astragali

College of Science, Gansu Agricultural University, Lanzhou 730070, China
*
Author to whom correspondence should be addressed.
Horticulturae 2023, 9(9), 1019; https://doi.org/10.3390/horticulturae9091019
Submission received: 19 July 2023 / Revised: 29 August 2023 / Accepted: 5 September 2023 / Published: 9 September 2023

Abstract

:
Radix Astragali (RA) is the root of Astragalus membranaceus var. mongholicus (Bunge) P.K. Hsiao. In order to determine targeted and effective methods for treating mold infections in fresh RA, pathogenic fungi were isolated and identified using morphology and molecular biology techniques, and factors affecting the growth of the pathogenic fungi, such as temperature, pH, light, and carbon and nitrogen sources, were analyzed. Changes in the main active ingredients of RA, such as carbohydrates, flavonoids, and saponins, were detected before and after infection with pathogenic fungi. The results showed that Penicillium polonicum, Trichothecium roseum, and Fusarium equiseti were the main pathogens causing postharvest disease in fresh RA. The optimum growth temperature for the three pathogens was 25 °C; P. polonicum was able to grow at an alkaline pH of 8–9, while T. roseum and F. equiseti grew better and had higher levels of sporulation under acidic conditions with pH values of 5–6. Different carbon and nitrogen sources had different effects on mycelium growth and sporulation. Darkness was favorable for the growth and sporulation of the three pathogens. Compared with healthy RA, the total carbohydrate, flavonoid, and saponin contents of the RA samples infected with the three fungi decreased. This study provides a theoretical basis for the scientific and precise control of RA postharvest disease during storage by targeting different pathogens and their growth conditions.

1. Introduction

Radix Astragali (RA), also known by its Chinese name, “Huang-qi”, has been utilized as a well-known traditional Chinese medicine for invigorating vital energy for over 2000 years. It is the root of Astragalus membranaceus (Fisch.) Bge. or Astragalus membranaceus (Fisch.) Bge. var.mongholicus (Bge.) Hsiao. Modern studies have shown that the main active chemical components of RA are polysaccharides, saponins, and flavonoids, which have anti-inflammatory, antioxidant, anti-tumor, and immune-enhancing effects [1]. As a commonly used bulk medicinal material, RA is known as “ten herbs and eight RA” in China. In addition, there are hundreds of Chinese patent medicines and health products on the market that use RA as a raw material. In the traditional Chinese diet, slices of RA were often added when preparing rice porridge, chicken soup, and soybean milk to enhance the foods’ health effects on the human body. RA is so widely used that the quality of its medicinal components has attracted an increasing amount of attention [2]. According to the Chinese Pharmacopeia [3], the contents of Astragaloside IV (not less than 0.08%) and calycosin-7-O-β-glycoside (not less than 0.02%) are used as standards for measuring the quality of RA. In addition, microbial contamination is another important factor affecting the quality of RA [4,5], which not only affects the active ingredients of RA but may also produce toxins that are harmful to humans.
In recent years, with the continuous expansion of the scale of RA planting, the economic loss and decline in quality caused by microbial infection have attracted an increasing amount of attention. At present, research on the microbial infection of AR focuses on two aspects: diseases affecting RA during field growth, such as powdery mildew caused by Erysiphe trifoliorum [6], anthracnose caused by Colletotrichum spinaciae [7], and root rot diseases caused by Dactylonectria torresensis [8], Fusarium acuminatum [9], and Fusarium solani [10], etc., and fungal infections and toxin accumulation affecting dried RA during the marketing stage. Aspergillus flavus, Aspergillus niger, and Penicillium polonicum were isolated from dried, commercially available RA, and AFB1 and AFB2 were simultaneously detected in RA infected with Aspergillus flavus [5]. Zhu et al. confirmed that 32.6% of commercially available RA samples were positive for OTA [11]. It has been found that the synergistic side effects of two or more mycotoxins on animal health are greater than those of individual mycotoxins [12]. The most fundamental method for avoiding the accumulation of one or more mycotoxins in medicinal material is to prevent the growth of various pathogenic fungi that easily cause mildew. It is well known that mold infections are transmitted through the spread of spores. Mildew occurs in dried medicinal materials under suitable conditions, largely due to the existence of mold spores on the surfaces themselves, and the existence of these spores is mainly due to the improper preservation of the medicinal materials after fresh collection.
RA is harvested annually in late autumn in Gansu Province, at a time of moderate temperatures (23–28 °C) and high humidity. Fresh RA is rich in starch, sugar, and water, which can provide enough nutrition for pathogens to grow and successfully infect the plant. Due to the spatial distance between the origin of RA and the places where it is processed or sold, fresh RA must undergo a lengthy storage time after harvest; at this time, if improperly handled, it is the most susceptible to fungal infection, mildew, and even decay. In addition, the market for fresh traditional Chinese medicine is becoming increasingly popular. Modern studies have shown that the active ingredients and pharmacological activities of some fresh herbs are stronger than those of dry products [13]. Nevertheless, the technology for storing fresh traditional Chinese medicine is not very developed, leading to serious postharvest mildew and decay. Mildew can lead to massive fungal growth and the accumulation of mycotoxins, which affect the quality and safety of RA. It can also cause a serious waste of medicinal herbs, economic losses, and even threaten the health and safety of people. Therefore, it is of particular importance to systematically study the diseases affecting fresh RA after harvest; however, there are few studies in this area at present. Accurately isolating and identifying the various pathogenic fungi that easily cause mildew in fresh RA and summarizing the influence of environmental factors on the growth of these pathogens can provide some basic information for the diagnosis and identification of pathogens causing mildew in RA and for targeted and effective control strategies.

2. Materials and Methods

2.1. Isolation and Purification

Fresh RA (cv. Longqi 1), from the root of Astragalus membranaceus (Fisch.) Bge. var.mongholicus (Bge.) Hsiao, was purchased from a Longxi (located at 35° N and 104° E) medicinal material planting base in Gansu Province, China. First, one hundred and twenty samples of fresh RA without visible mechanical damage or disease were collected, stored in sterile preservation bags, and maintained at room temperature (23–27 °C and 40% RH) to allow for the natural growth of mildew. Typical mildew tissues from each moldy sample were selected, and using a sterilized blade, 3 mm × 3 mm fragments were cut at junctions of diseased–healthy tissue, disinfected via immersion in 1% NaClO for 3 min, and washed three times with sterile water. The disinfected fragments were placed on potato dextrose agar (PDA) in incubators (28 °C) for culturing for three or five days. The colonies were grouped according to colony morphology and sub-cultured repeatedly for four to five cycles until pure isolates were obtained. Colony characteristics were examined, and microscopic observations of all isolates were made to select representative isolates.

2.2. Morphological Observation

The purified pathogenic fungi were inoculated on a PDA medium and incubated at 28 °C for 5 d. Cultural characteristics, including the morphology, growth rate, and pigment secretion of the colonies, were observed and recorded. Mycelium morphology and spore morphology were observed using an optical microscope (40×), and the size and morphology of the pathogenic fungal spores were observed using a scanning electron microscope (SEM) (JEOL JSM-5910LV, Tokyo, Japan). The pathogenic species were identified by referring to a fungal identification manual [14] and a previous publication. Twenty random measurements were performed for each pathogen and repeated three times.

2.3. Molecular Biological Identification

2.3.1. Genomic DNA Extraction

The isolate spore suspension (1 × 10⁶ spores/mL) obtained as described above was inoculated on a PDA medium and incubated at 28 °C for 5 days. The mycelium was collected and ground into a fine powder in the presence of liquid nitrogen, and DNA was extracted using a UNLQ-10 column fungal genomic DNA Extraction Kit (Sangon, Shanghai, China), according to the manufacturer’s instructions.

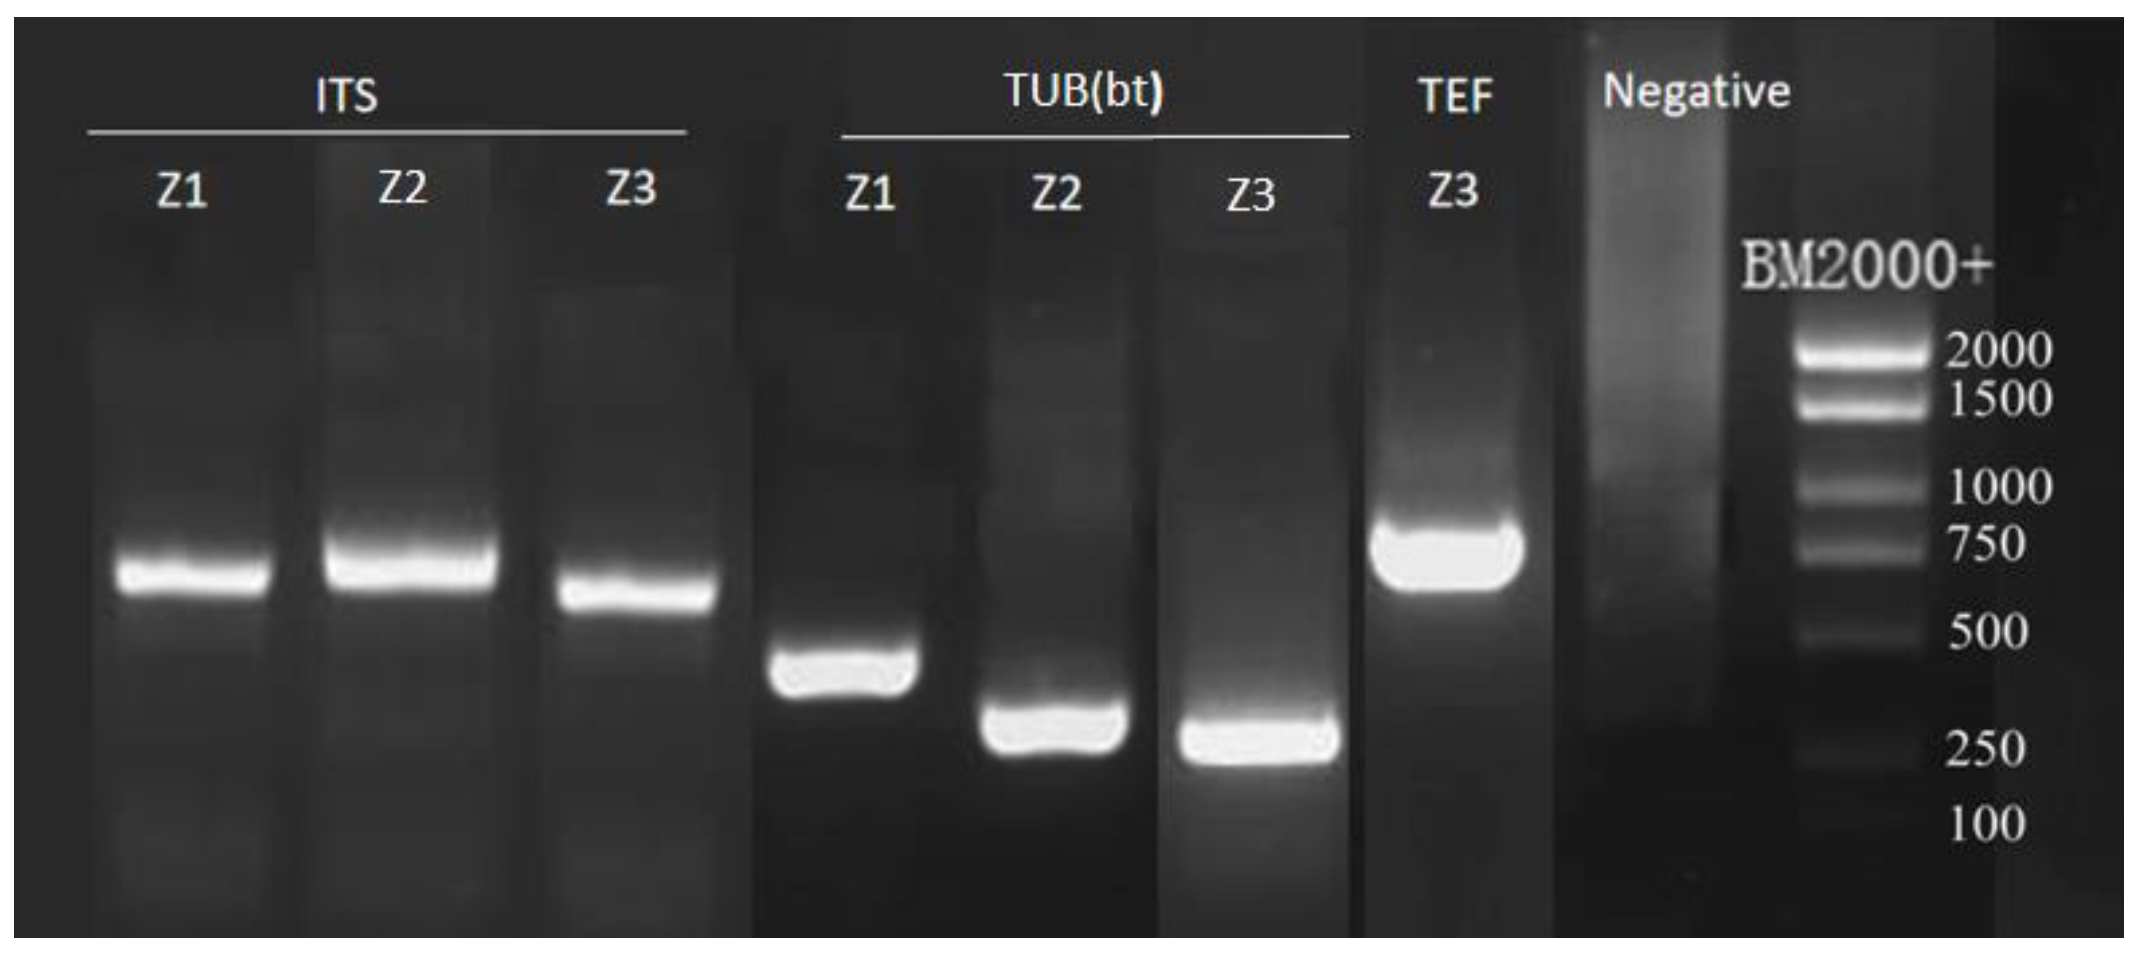
2.3.2. PCR Amplification and Sequencing

Two conserved genes, the internal transcribed spacer protein (ITS) and β-tubulin (TUB), were used to identify all the isolated fungi. The Fusarium species was further identified using the translation elongation factor (TEF). The ITS gene was amplified using the primers 5′-TCCGTAGGTGAACCTGCGG-3′ and 5′-TCCTCCGCTTATTGATATGC-3′ [15], and the partial TUB gene was amplified using the primers 5′-GGTAACCAAATCGGTGCTGCTTTC-3′ and 5′-ACCCTCAGTGTAGTGACCCTTGGC-3′ [16]. The primers 5′-ATGGGTAAGGA(A/G)GACAAGAC-3′ and 5′-GGA(G/A)GTACCAGT(G/C)ATCATGTT-3′ [17,18] were used to amplify the TEF gene. The PCR reactions were conducted in a solution with a final volume of 50 μL which contained 46 μL of 1 × PCR Mix (Taq DNA polymerase, PCR reaction buffers, and dNTPs), 1 μL of a forward primer, 1 μL of a reverse primer, and 2 μL of template DNA. The PCR mixtures underwent an initial denaturation at 94 °C for 5 min, followed by 30 cycles of denaturing (94 °C for 10 s), annealing (53 °C for 10 s), and extension (72 °C for 30 s), and were finally held at 72 °C for 5 min. Then, the obtained amplification products were subjected to electrophoresis using a 2% agarose gel. The sequencing of the PCR products was carried out at Beijing Bomad Biological Co., Ltd., Beijing, China. The sequencing results were compared with the sequences previously deposited in GenBank and the CBS Database using BLAST, and the sequences with high similarities to the queries were retrieved and selected for a phylogenetic analysis. The phylogenetic trees were constructed using MEGA 7.0 software via the neighbor-joining (NJ) method, adopting 1000 bootstrap replications. The molecular biological identification was combined with morphological identification to determine the pathogen species.

2.4. The Pathogenicity Test

To test the pathogenicity of each strain, one hundred and thirty healthy RA samples were selected and sterilized by soaking them in a 0.1% sodium hypochlorite solution for 15 min, followed by washing them three times with sterile distilled water and drying them at room temperature. The spore suspensions (1 × 10⁶ spores/mL) of the above-mentioned isolated pathogens were prepared and inoculated into the disinfected RA tissues via injury inoculation and spray inoculation (twenty samples, respectively), and ten samples inoculated with sterile water were selected as negative controls. All samples were incubated in sterile, sealed bags at room temperature, followed by statistics of the incidence of each group and recording of disease symptoms such as mycelial morphology and colony color. The pathogens were re-isolated from the inoculated RA by adopting the described method. The pathogenic fungi were compared with the isolates obtained from the first purification to determine the pathogenicity of the pathogens to the RA, and the isolates that conformed to Koch’s postulates were selected for further study.

2.5. Effects of Temperature, pH, Light, and Carbon and Nitrogen Sources on Mycelial Growth and Spore Production

Based on the 3 pathogenic fungi isolates (P. polonicum, T. roseum, and F. equiseti) obtained via the above experiments, the effects of temperature, medium pH, carbon source, nitrogen source, and light conditions on the colony growth and sporulation of the pathogens were investigated. The temperature, pH, and light conditions were investigated in a PDA medium. Fresh mycelial discs with diameters of 5 mm were inoculated in the center of the PDA medium plate (90 mm in diameter; natural pH) and cultured in a constant-temperature incubator at 25 °C under full darkness. Two of the conditions were kept constant and one was changed, with pH values of 5, 6, 7, 8, 9, and 11, culture temperatures of 15, 20, 25, 30, and 35 °C, and light conditions of 24 h light and 24 h dark and 12 h light/dark. Czapek’s medium, which consisted of 3 g of NaNO3, 1 g of K2HPO4, 0.5 g of MgSO4·7H2O, 0.5 g of KCl, 0.01 g of FeSO4·7H2O, 30 g of sucrose, and 20 g of agar dissolved in 1000 mL of sterile water, was used to investigate the sources of carbon and nitrogen. The nitrogen source was kept constant as NaNO3, and glucose (31.58 g), maltose (30 g), cyclodextrin (28.42 g), mannitol (31.93 g), and fructose (31.58 g) with the same carbon mass were used as carbon sources instead of sucrose. Similarly, sucrose was kept as the carbon source, and ammonium sulfate (2.33 g), yeast extract powder (6.16 g), peptone (0.22 g), glycine (2.65 g), and urea (1.06 g) with the same nitrogen content were used as nitrogen sources instead of sodium nitrate. Czapek’s medium was used as a blank control. The pathogenic strains were cultured and grown under the above conditions, and the colony growth diameter was measured using the crossover method for five or seven consecutive days as an indicator of mycelial growth, and the sporulation of the colonies under each culture condition after five or seven days was measured using a blood count plate via microscopic observation. Each treatment had 3 replicates.

2.6. Determination of Total Carbohydrates, Flavonoids, and Saponins

RA samples infected with P. polonicum, T. roseum, and F. equiseti for thirty days were chopped and labeled as groups A, B, and C, respectively. Samples measuring 5 g were soaked in 40 mL of ethanol (75%) for 4 h and extracted via reflux at 80 °C for 3 h. Then, the mixtures were centrifuged at 3500× g for 10 min to separate the supernatant, and the extraction procedure was repeated three times. The combined supernatant was concentrated to 20 mL at 45 °C via a rotary evaporator (RE1200 Huachen LAB, Shanghai, China). The extracts were finally stored at 4 °C for further use. Healthy RA samples were used as controls and labeled as group K, and three samples were included per group.
The total carbohydrate content of each sample was determined based on the sulfuric acid–phenol method, according to the procedure described by Nielsen and Zhang [19,20]. The flavonoid content of each sample was determined using the sodium nitrosate–aluminum nitrate method, as described by Wu et al. [21], and the saponin content was determined via the vaniline–perchloric acid method, as described by Wan et al. [22]. Detailed experimental procedures are provided in Appendix A.
For a quantitative analysis of the RA’s calycosin-7-O-β-glycoside content, an Agilent 1260 high-performance liquid chromatography system equipped with an Agilent 1260 series DAD detector was used. Separation was performed on an Agilent Eclipse XDB-C18 column (250 mm × 4.6 mm; 5 μm) at a column temperature of 35 °C. Solvent A was a 0.05% phosphoric acid aqueous solution, and solvent B was acetonitrile (spectral purity, Guang Fu, Tianjin, China). The gradient elution procedure was as follows: 0–5 min, 5–20% B; 5–10 min, 20–40% B; 10~20 min, 40~60% B; 20~25 min, 60~20% B; 25–28 min, 20–5% B. The column temperature was 35 °C, the flow rate was 1.0 mL/min and the detection wavelength was 260 nm. The solution was filtered through a 0.22 μm RC disc filter prior to the HPLC analysis.
Astragaloside IV was detected via an AB SCIEX-Qtrap5500 equipped with an ESI source. The HPLC analysis was performed on a thermoscientific Hypersil GOLD column (2.1 mm × 100 mm, 1.9 μm). The mobile phases consisted of 0.1% formic acid in water (A) or acetonitrile (B) (spectral purity, Guang Fu, Tianjin, China), using a gradient elution of 30% (v/v) B at 0–0.5 min, 30–80% B at 0.5–4 min, 80–30% B at 4.0–4.1 min and 30% B at 4.1–7.0 min. The flow rate was 0.3 mL/min, the column temperature was kept at 40 °C, and the injection volume was 5 μL. The ionization mode was ESI and positive, and the selected ion monitoring (SIM) setting was m/z: 807 [M + Na]+. Other conditions for the MS analysis were as follows: drying gas (N2) pressure, 35 psi; ionspray voltage, 5000 V; ionization temperature, 500 °C; nebulizing gas (N2) pressure, 50 psi; auxiliary heating gas pressure, 55 psi; declustering potential, 120 V; collision energy, 16 eV.

2.7. Statistical Analysis

A one-way ANOVA was performed using SPSS 17.0 software, and Duncan’s multiple range test (p < 0.05) was employed in this study. GraphPad Prism 9 software was used for plotting. The vertical lines in the figure represent the standard deviation (n = 3).

3. Results

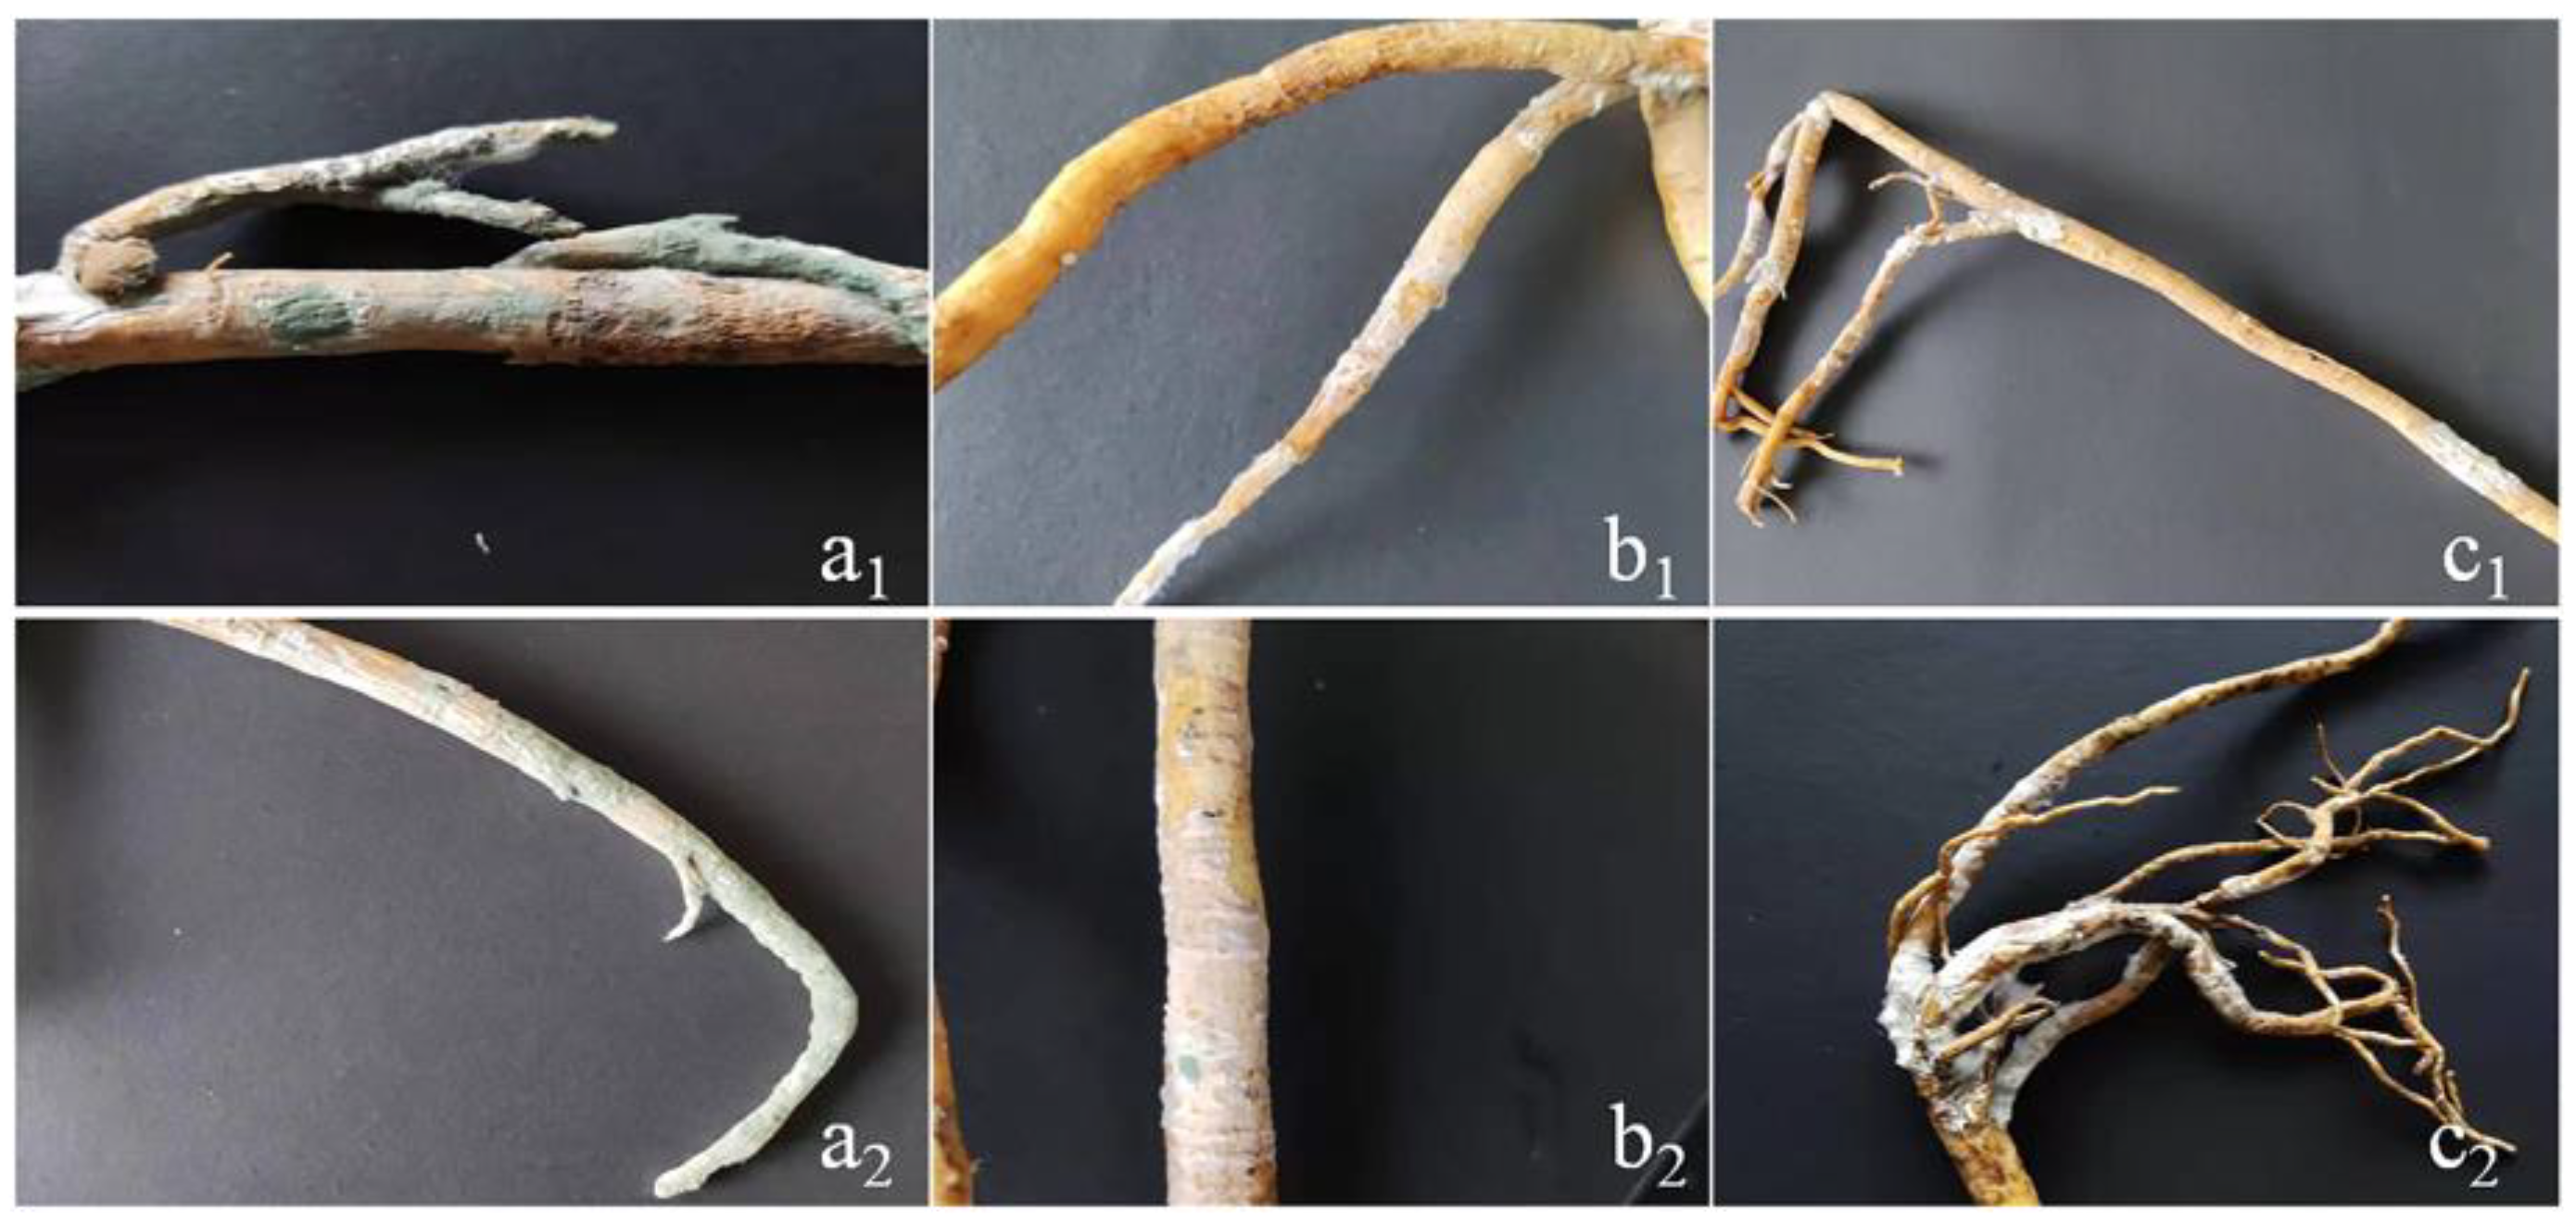
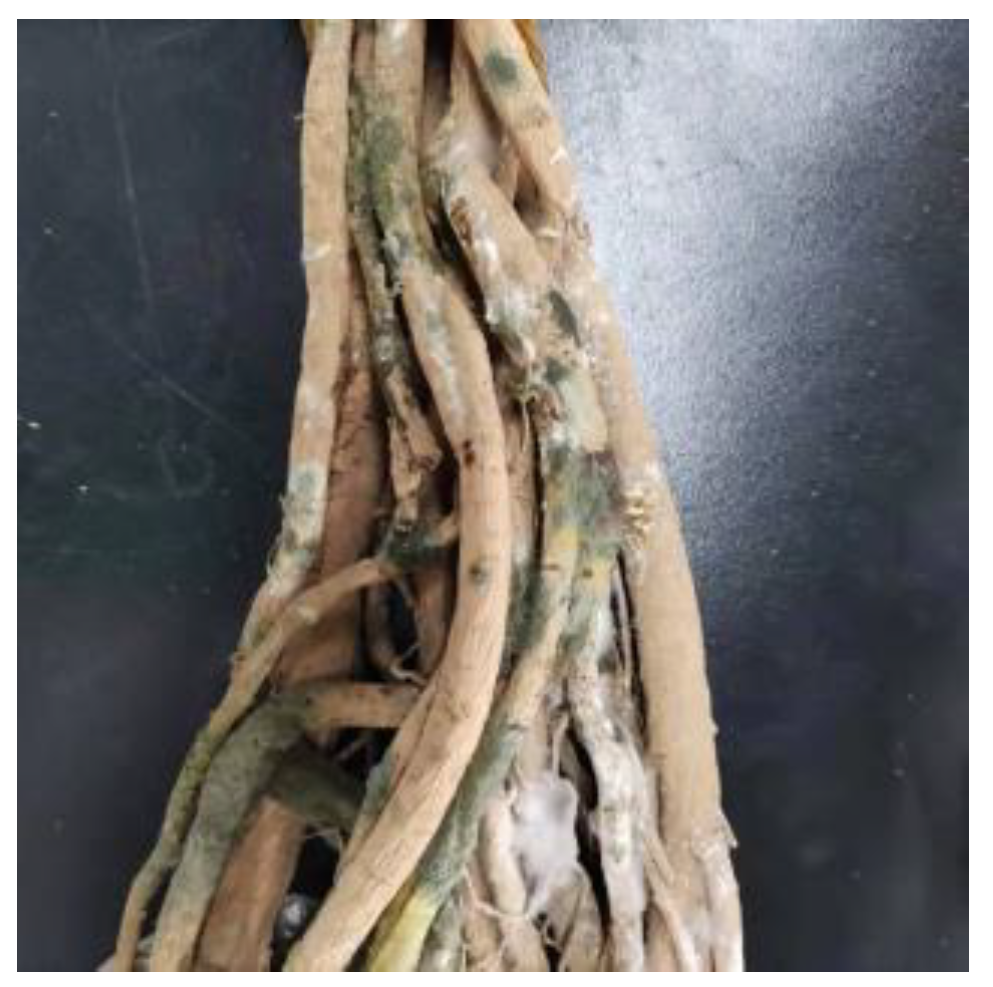
3.1. The Occurrence of RA Mildew

In total, one hundred and twenty freshly harvested RA samples were placed in a sterile preservation bag and stored at room temperature (25 °C and 40% RH) for several days; during this storage process, ninety-six samples gradually began to mold. After seven days of storage, fifty-five samples (45.8%) began to show moldy spots on their roots and at the junctions of tips and roots. When stored for fifteen days, mildew symptoms were observed in 80% of the samples, and the mycelia at the infected site grew continuously and gradually expanded to form white and cyanotic mold-infected areas. After twenty-eight days of storage, the branches of 80% of the samples were covered with cyan, white, pink, and other colors of hyphae, as shown in Appendix A, Figure A1.

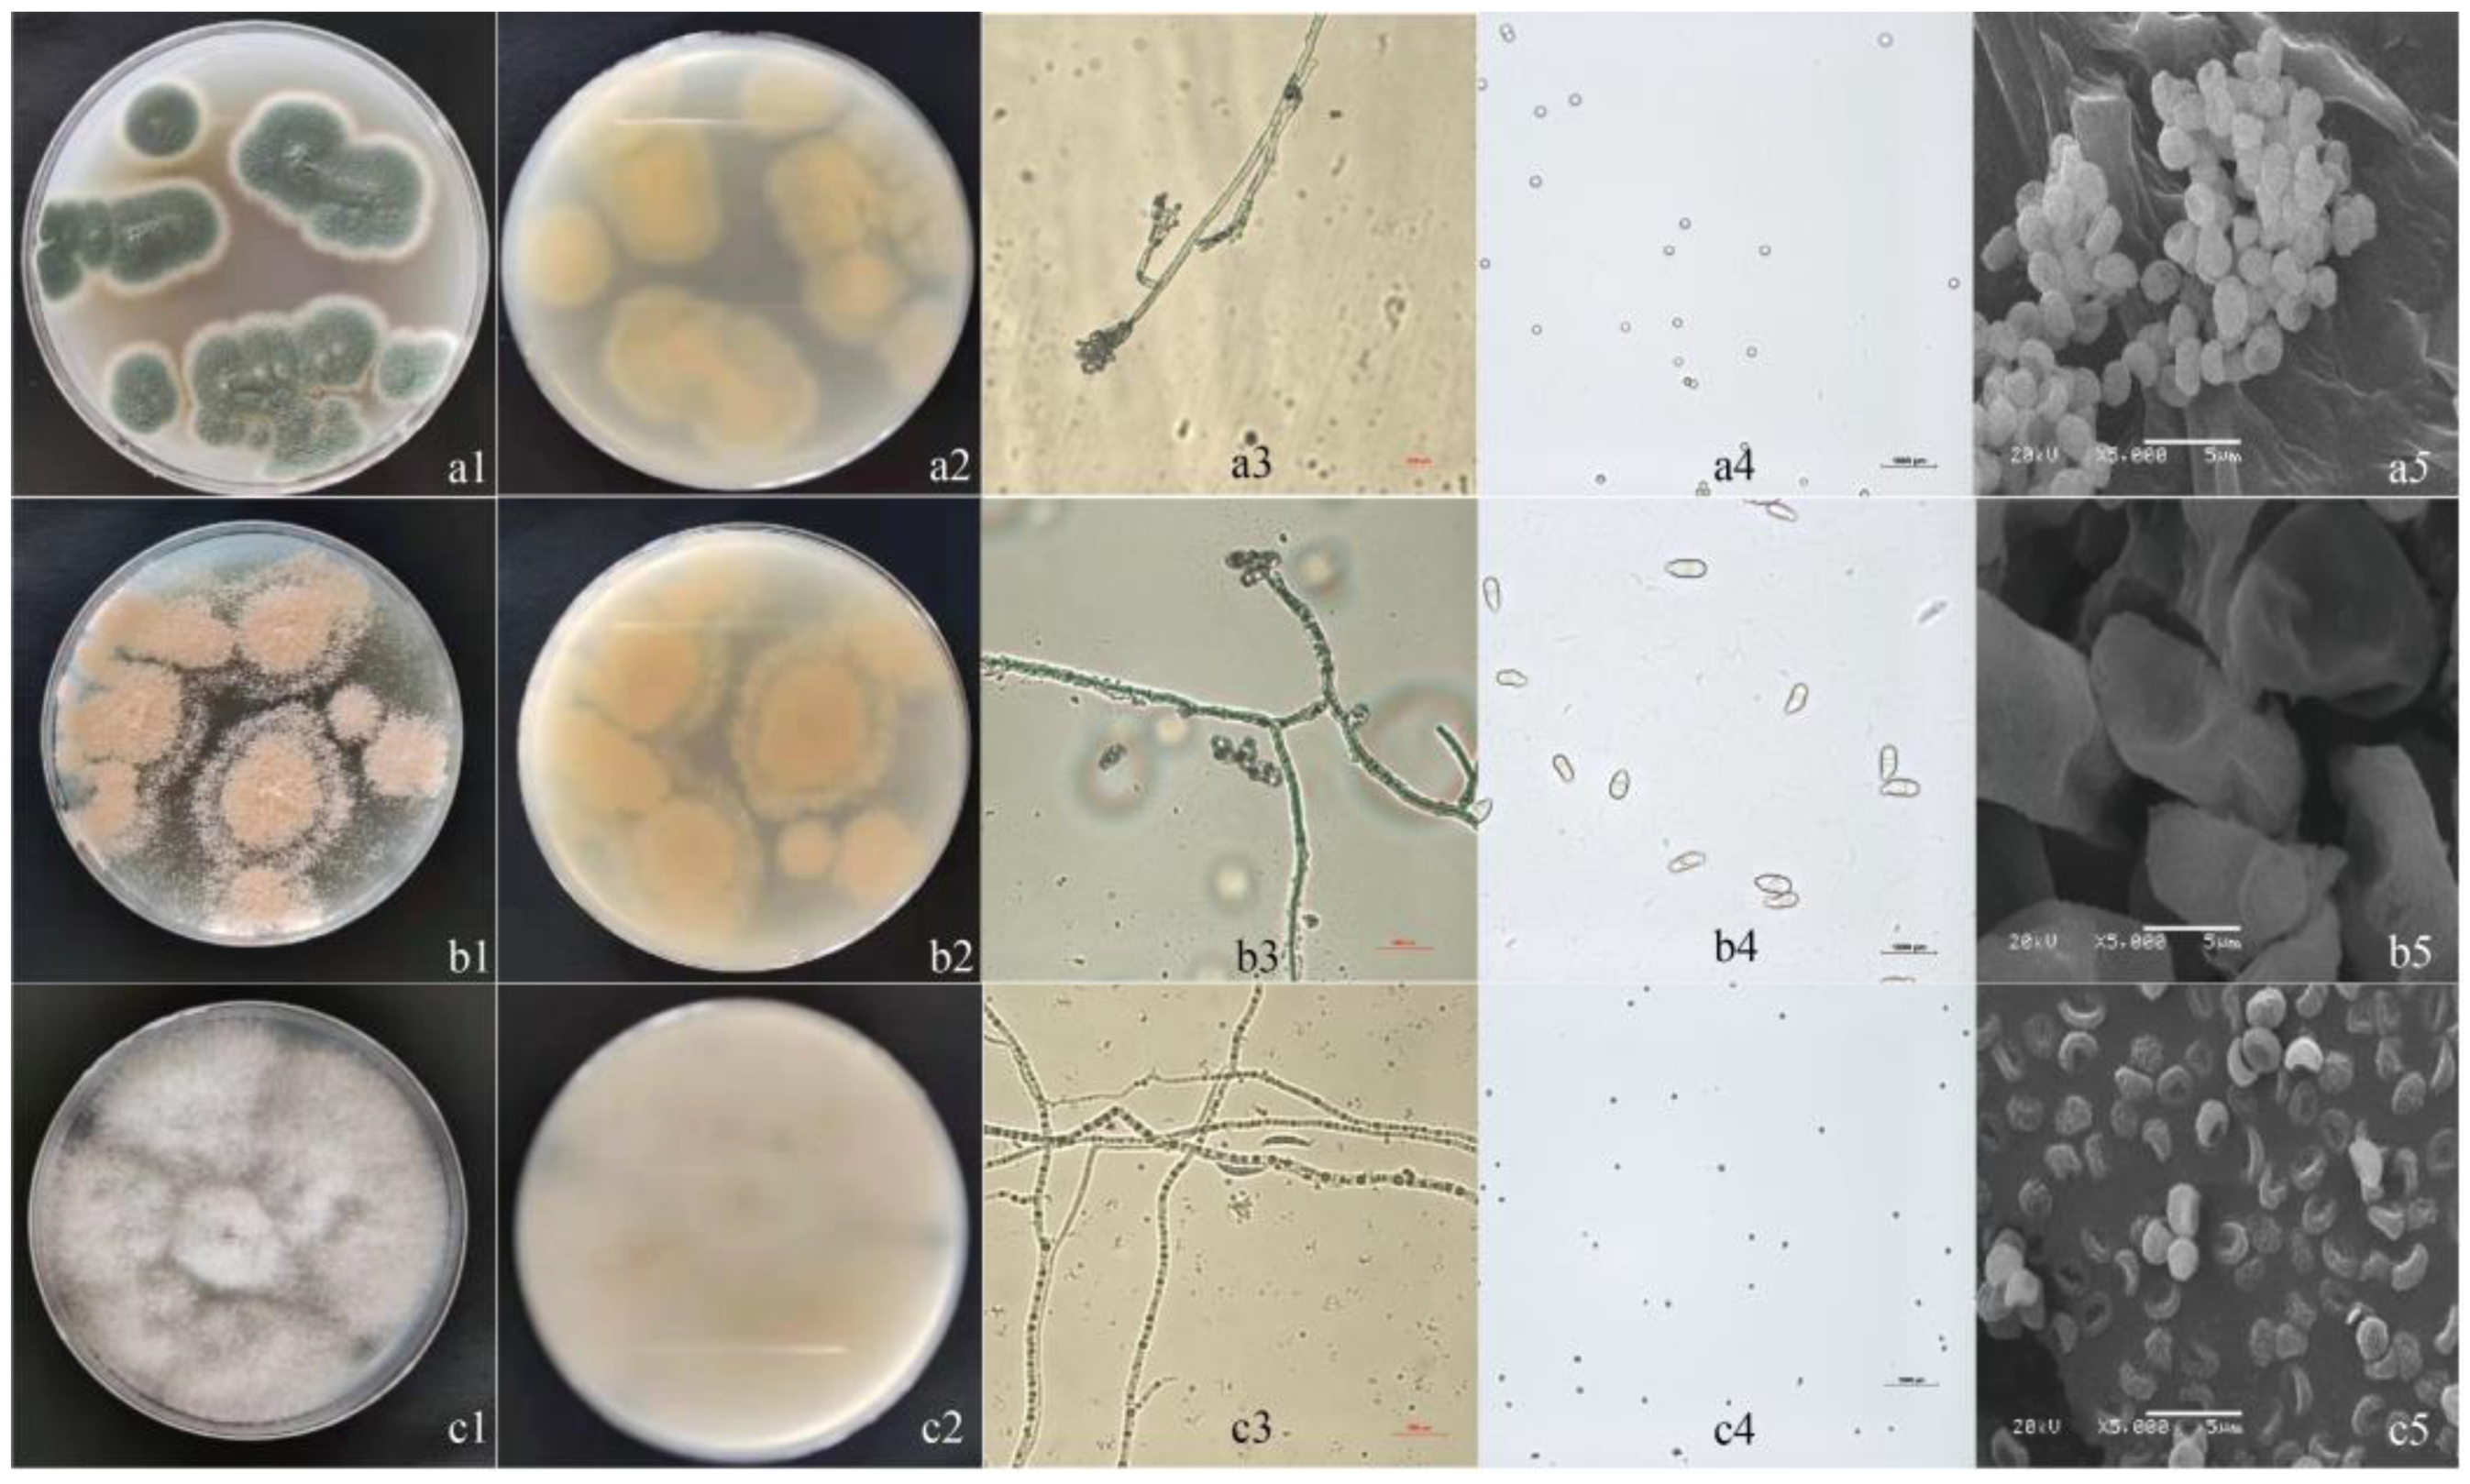
3.2. Isolation and Morphological Identification

Based on colony characteristics and microscopic observations, three representative strains were isolated from ninety-six moldy RA samples and named Z1, Z2, and Z3, respectively. Among the 96 moldy RA samples, the Z1 strain was found in 84 samples, accounting for 87.5% of the total amount of mold. The isolation frequencies of the Z2 and Z3 strains were 56.2% and 75.7%, respectively.
The colony morphology of isolate Z1, which was isolated from the moldy tissue of RA, was initially white when growing on a PDA medium and then gradually deepened to a dark green color (Figure 1a1). The colony’s reverse color was yellow-brown (Figure 1a2). The mycelium grew radially with white edges and covered the surface of a plate 90 cm in diameter in ten days. The conidiophore was broom-shaped and measured about 30–50 μm in size (Figure 1a3). The conidia were rosary-shaped, with concatenated, ellipsoid, dented surfaces, and measured 2.5~5.2 μm × 2.7~5.4 μm in size (Figure 1a4,a5). The colony morphology of isolate Z1 was similar to the description of P. polonicum [23,24].
Isolate Z2 was initially white on the front of PDA medium and then gradually turned pink after two days and grew in rings, with colonies measuring up to 90 cm in diameter after eight days (Figure 1b1). The back of the colony was yellow-brown (Figure 1b2). The conidiophore was erect, slender, and without branches (Figure 1b3). The conidia were solitary or appeared in clusters of two or three at the tops of the conidium stems, with inverted pear-shaped or oval-shaped diaphragms at maturity (Figure 1b4), and demonstrated irregular cylindrical shapes under a scanning electron microscope, with several surface depressions, measuring 12.5~20.4 μm × 4.9~10.3 μm in size (Figure 1b5). The morphological characteristics of isolate Z2 in the present study were consistent with the strain of T. roseum that causes tomato, orange, and apple rot [25].
When isolate Z3 was grown on a PDA medium, the colony on the front was whitish and cottony, growing long and loose in circular growth patterns (Figure 1c1). The back of the Petri dish was white to pale yellow (Figure 1c2). Z3 grew rapidly and could cover the entire Petri dish (90 mm in diameter) in six days. The conidium stems were short and erect on the top of the mycelium or at the nodes (Figure 1c3). On the PDA medium, the number of large conidia was very low in our study; most were small conidia. These small conidia were oblate, with a depression in the middle, and measured about 2.2~3.4 μm in diameter and 0.8~1.5 μm in thickness (Figure 1c4,c5). A small number of large conidia were smooth, fusiform to clavate, with lengths and widths of 8.5–24.2 μm and 4.2–6.7 μm, respectively. The cultural and morphological characteristics of the isolates matched the species description of Fusarium equiseti [26,27].

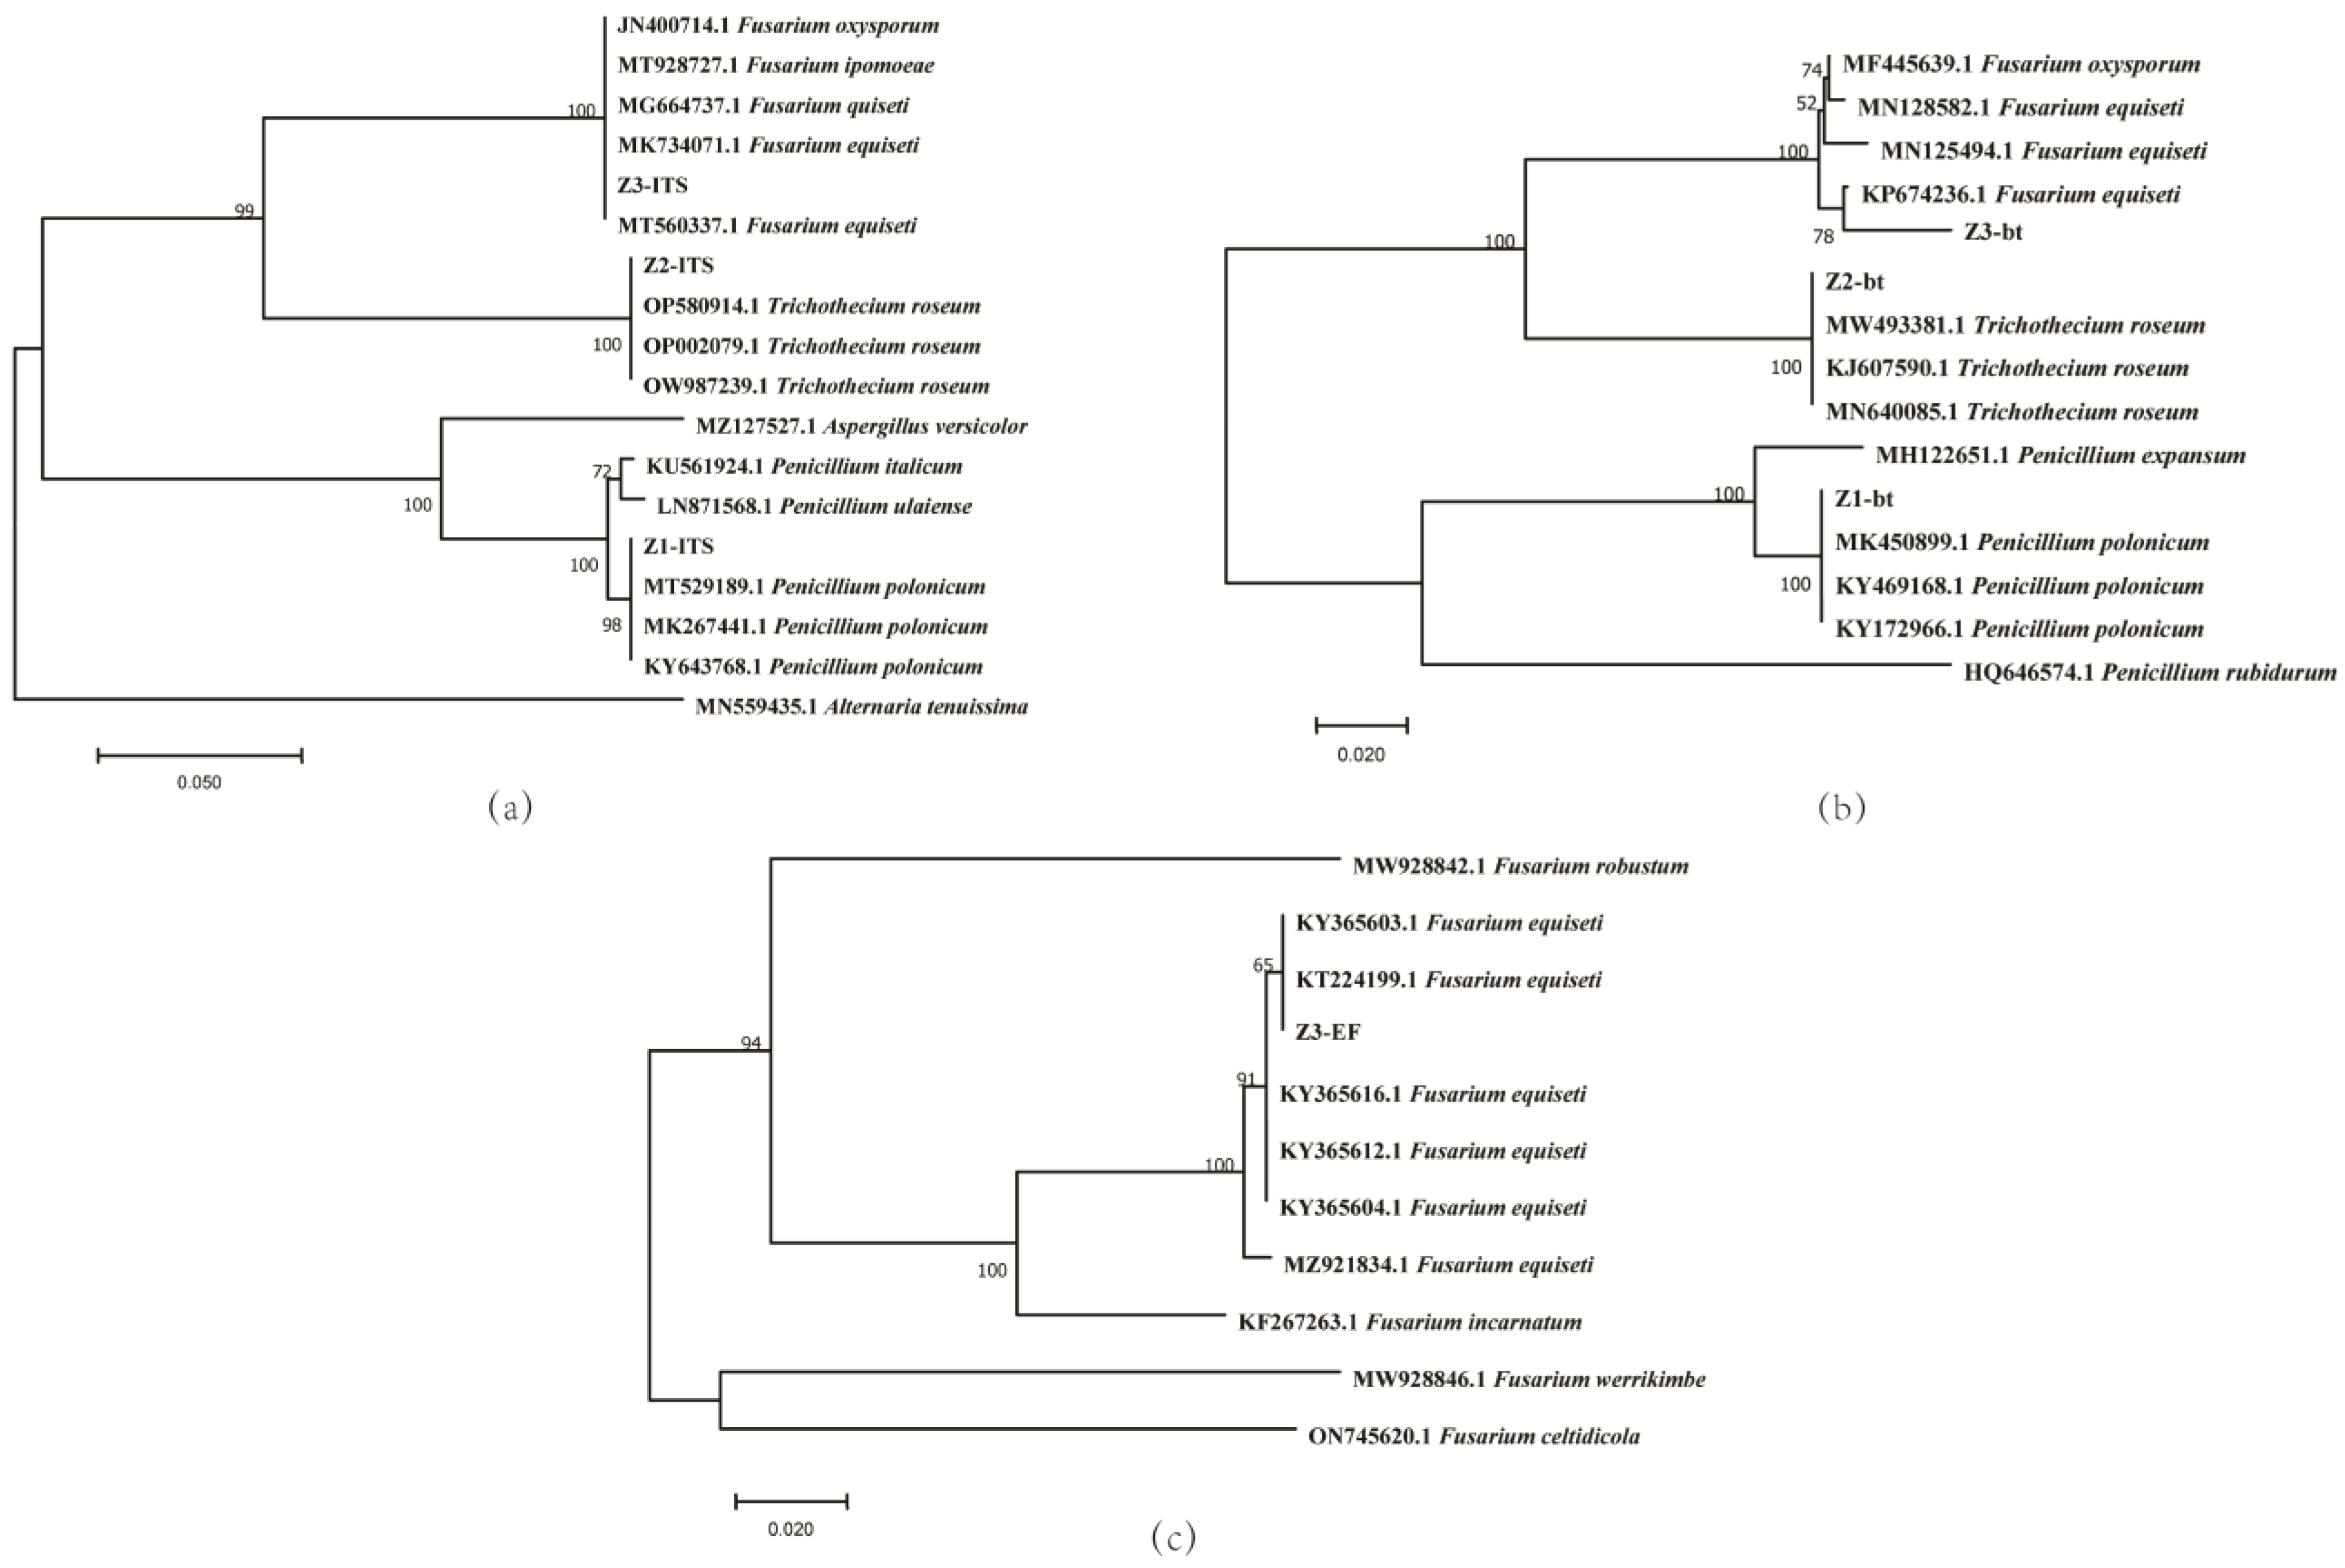
3.3. Phylogenetic Analysis

The PCR products indicated that the ITS genes of Z1, Z2, and Z3 generated 584 bp, 612 bp, and 544 bp fragments, respectively; the TUB genes of Z1, Z2, and Z3 generated 454 bp, 332 bp, and 311 bp fragments, respectively; and the TEF genes of Z3 generated a 686 bp fragment (Appendix A, Figure A2). The amplified sequences were sequenced, and the obtained sequences were used to search for alignments in the GeneBank database (National Library of Medicine) [28]. The sequences are provided in supplementary materials (Figures S1–S3).
A BLAST analysis showed that the ITS and TUB sequences of the isolates Z1 and Z2 (GenBank accession no. OR461569, OR461570, OR476217, OR476218) were 100% similar to Penicillium polonicum and Trichothecium roseum in the NCBI database, and the ITS, TUB, and TEF sequences of Z3 (GenBank accession no. OR461571, OR485577, OR476219) were 100% similar to Fusarium equiseti. Among the sequences with the highest degrees of homology, three to seven sequences of each strain were selected to construct phylogenetic trees for the tested isolates. Alternaria tenuissima (MN559435.1), Aspergillus versicolor (MZ127527.1), and other Penicillium and Fusarium species were chosen as exogenous fungi. Based on the ITS-based phylogenetic tree, the strains Z1, Z2, and Z3 were clustered with Penicillium polonicum, Trichothecium roseum, and Fusarium equiseti, respectively, and the groupings of the strains Z1, Z2, and Z3 were supported by bootstrap values of 98%, 100%, and 100%, respectively (Figure 2a). The TUB phylogenetic tree showed the same results as the ITS phylogenetic tree, and the groupings of Z1, Z2, and Z3 were supported by bootstrap values of 100%, 100%, and 78%, respectively (Figure 2b). In order to further accurately characterize the isolate of Z3, a separate TEF phylogenetic tree (Figure 2c) indicated that Z3 was located in the same evolutionary branch as Fusarium equiseti, with a bootstrap value of 100%. Combined with the morphological characteristics, it can be determined that the isolate Z1 was Penicillium polonicum, Z2 was Trichothecium roseum, and Z3 was Fusarium equiseti.

3.4. Pathogenicity Test

The pathogenicity results showed that the three isolates were pathogenic to RA, and the incidence rates of pathogenicity were all 100%. After healthy RA tissue was inoculated with P. polonicum, the site of inoculation began to develop disease about seven days after the inoculation, and white villi were observed on the wound surface. Fourteen days after the inoculation, a visible green mildew spot appeared on the wound (Figure 3a1). Similarly, RA samples inoculated with P. polonicum via spraying showed green fungal hyphae throughout their branches after fourteen days (Figure 3a2). Both T. roseum and F. equiseti were inoculated into healthy RA tissues, and after ten days, mildew disease was also observed at the inoculation sites, accompanied by the proliferation of mycelia (Figure 3b1,c1). The method of inoculation without injury (spray inoculation) also infected healthy RA during the storage period. A large number of pink (Figure 3b2) and white flocculent (Figure 3c2) mycelia were also found in the epidermises of the RA branches after twenty days. The incidence rates of pathogenicity for T. roseum and F. equiseti were also 100%. This shows that the three pathogens can infect RA not only via a wound but also without a wound. The three fungi re-isolated from symptomatic tissues were identical to the original isolates and had the same morphological characteristics.

3.5. Effects of Temperature, pH, and Light on Mycelial Growth and Spore Production

The effects of temperature, pH, and light conditions on the growth and sporulation of the three fungi are shown in Table 1.

3.5.1. Temperature Conditions

The optimum temperature for the mycelial growth and sporulation of the three fungi was 25 °C. None of the three fungi could grow below 5 °C or above 40 °C. When the temperature reached 35 °C, the mycelium growth rate and sporulation of the three fungi decreased significantly. When the temperature was 15 °C, the sporulation yield of T. roseum was only 1.33 × 10⁷ CFU/mL, and F. equiseti did not grow or sporulate at this temperature (Table 1).

3.5.2. pH Conditions

The optimum pH for the growth and sporulation of P. polonicum was 7–8. P. polonicum had a wider pH range for its growth environment and grew well under both weakly acidic and alkaline conditions. The optimum pH value for the growth of T. roseum and F. equiseti was 6, followed by 5. T. roseum and F. equiseti were better suited to growing in a slightly acidic environment, but they could also grow under alkaline conditions (Table 1).

3.5.3. Lighting Conditions

Lighting conditions had remarkable effects on the growth of the three fungi. Under the dark condition, the three fungi had the largest colony diameters and sporulation amounts, followed by the alternating 12 h light/dark condition. Under the full-illumination condition, the colony growth diameters and sporulation amounts were smaller and lower (Table 1).

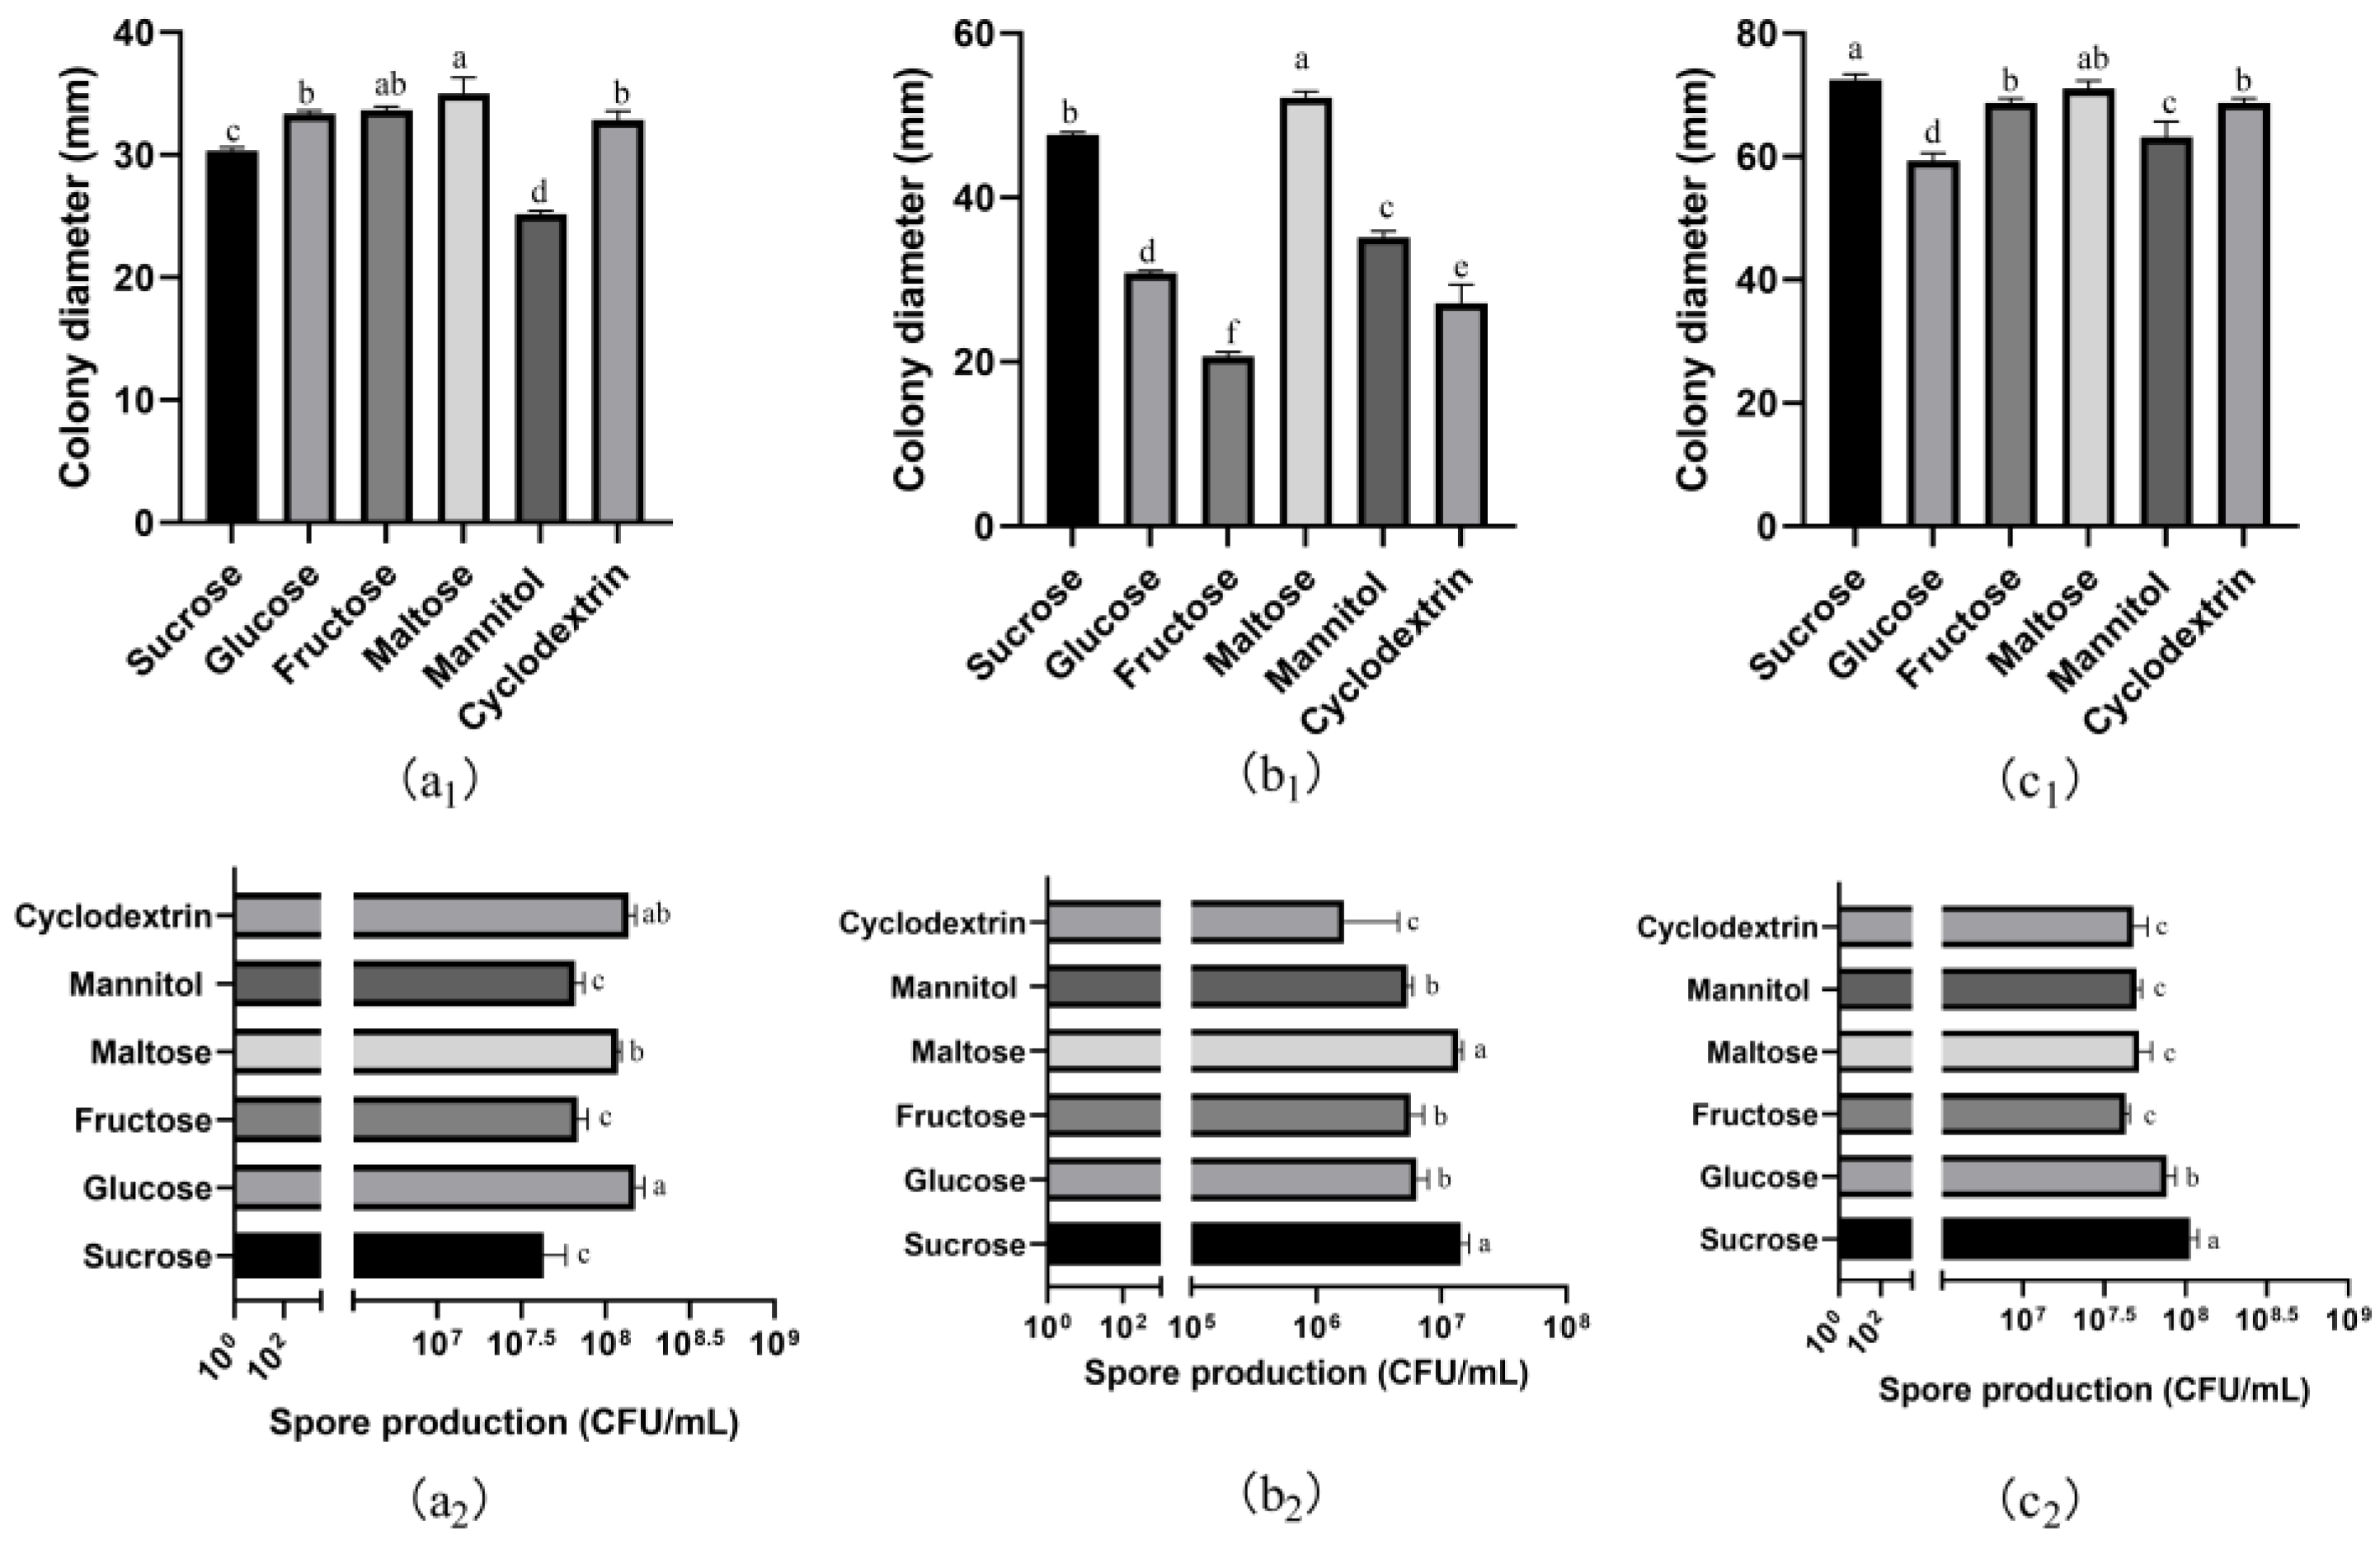
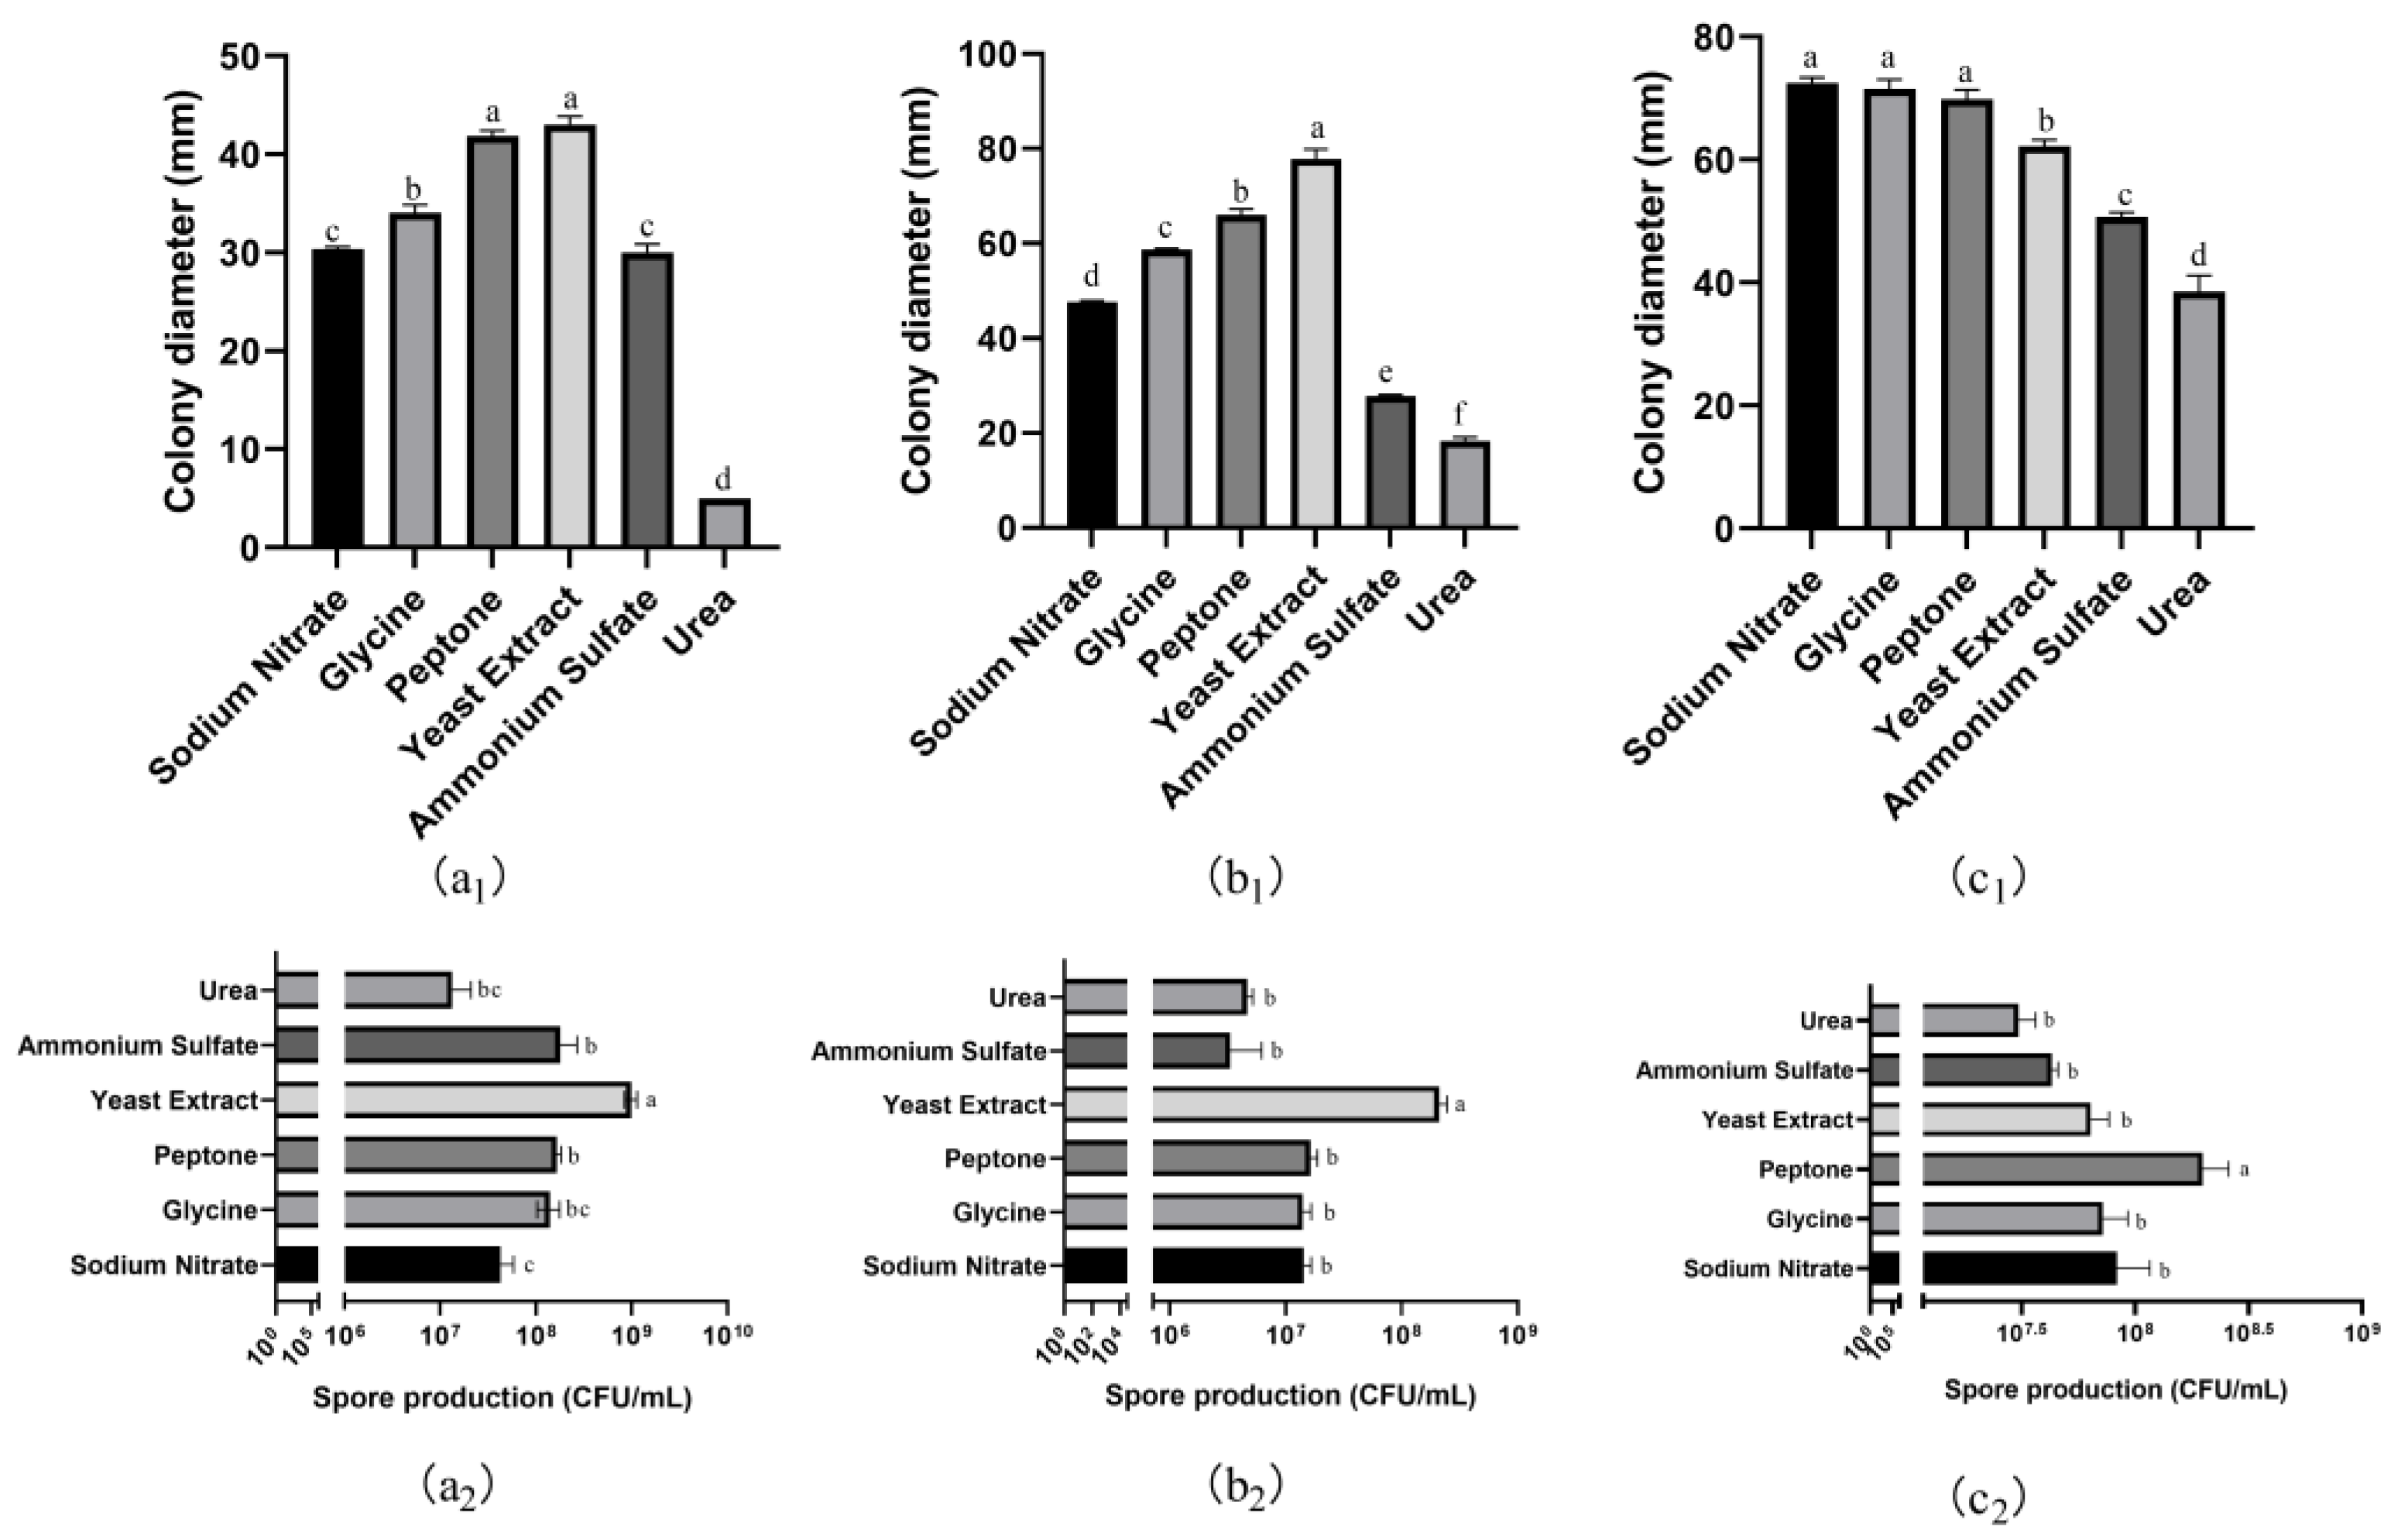
3.6. Effects of Carbon and Nitrogen Sources on Mycelial Growth and Spore Production

3.6.1. Carbon Sources

As can be seen from Figure 4a1, P. polonicum grew slowly on the medium containing mannitol as a carbon source; on the medium with other carbon sources, P. polonicum grew well and could sporulate (Figure 4a2). The colony diameter of T. roseum was the largest when maltose was used as a carbon source (Figure 4b1). The sporulation amount of T. roseum was the largest on the medium with sucrose and maltose as the carbon sources (Figure 4b2). Regarding the growth of F. equiseti, it could grow well and sporulate on media modified with the various carbon sources provided (Figure 4c1,c2).

3.6.2. Nitrogen Sources

When P. polonicum and T. roseum grew on the medium containing a yeast extract as the nitrogen source, the values for both the colony diameter and sporulation amount were the largest, especially the sporulation amount, which was at least six times higher than on other nitrogen-source media (Figure 5a1,a2,b1,b2). P. polonicum grew very slowly and produced few spores on the medium containing urea as the nitrogen source (Figure 5a1,a2). T. roseum could grow and sporulate on the other nitrogen-source media provided (Figure 5b1,b2). The colony diameter of F. equiseti was the largest when grown on media modified with peptone, glycine, or sodium nitrate as nitrogen sources, for which the colony could reach more than 70 mm in diameter (Figure 5c1). The amount of sporulation of F. equiseti was the greatest on the medium containing peptone as the nitrogen source (Figure 5c2). T. roseum and F. equiseti grew the slowest and produced the lowest amounts of sporulation on the medium containing urea as the nitrogen source.

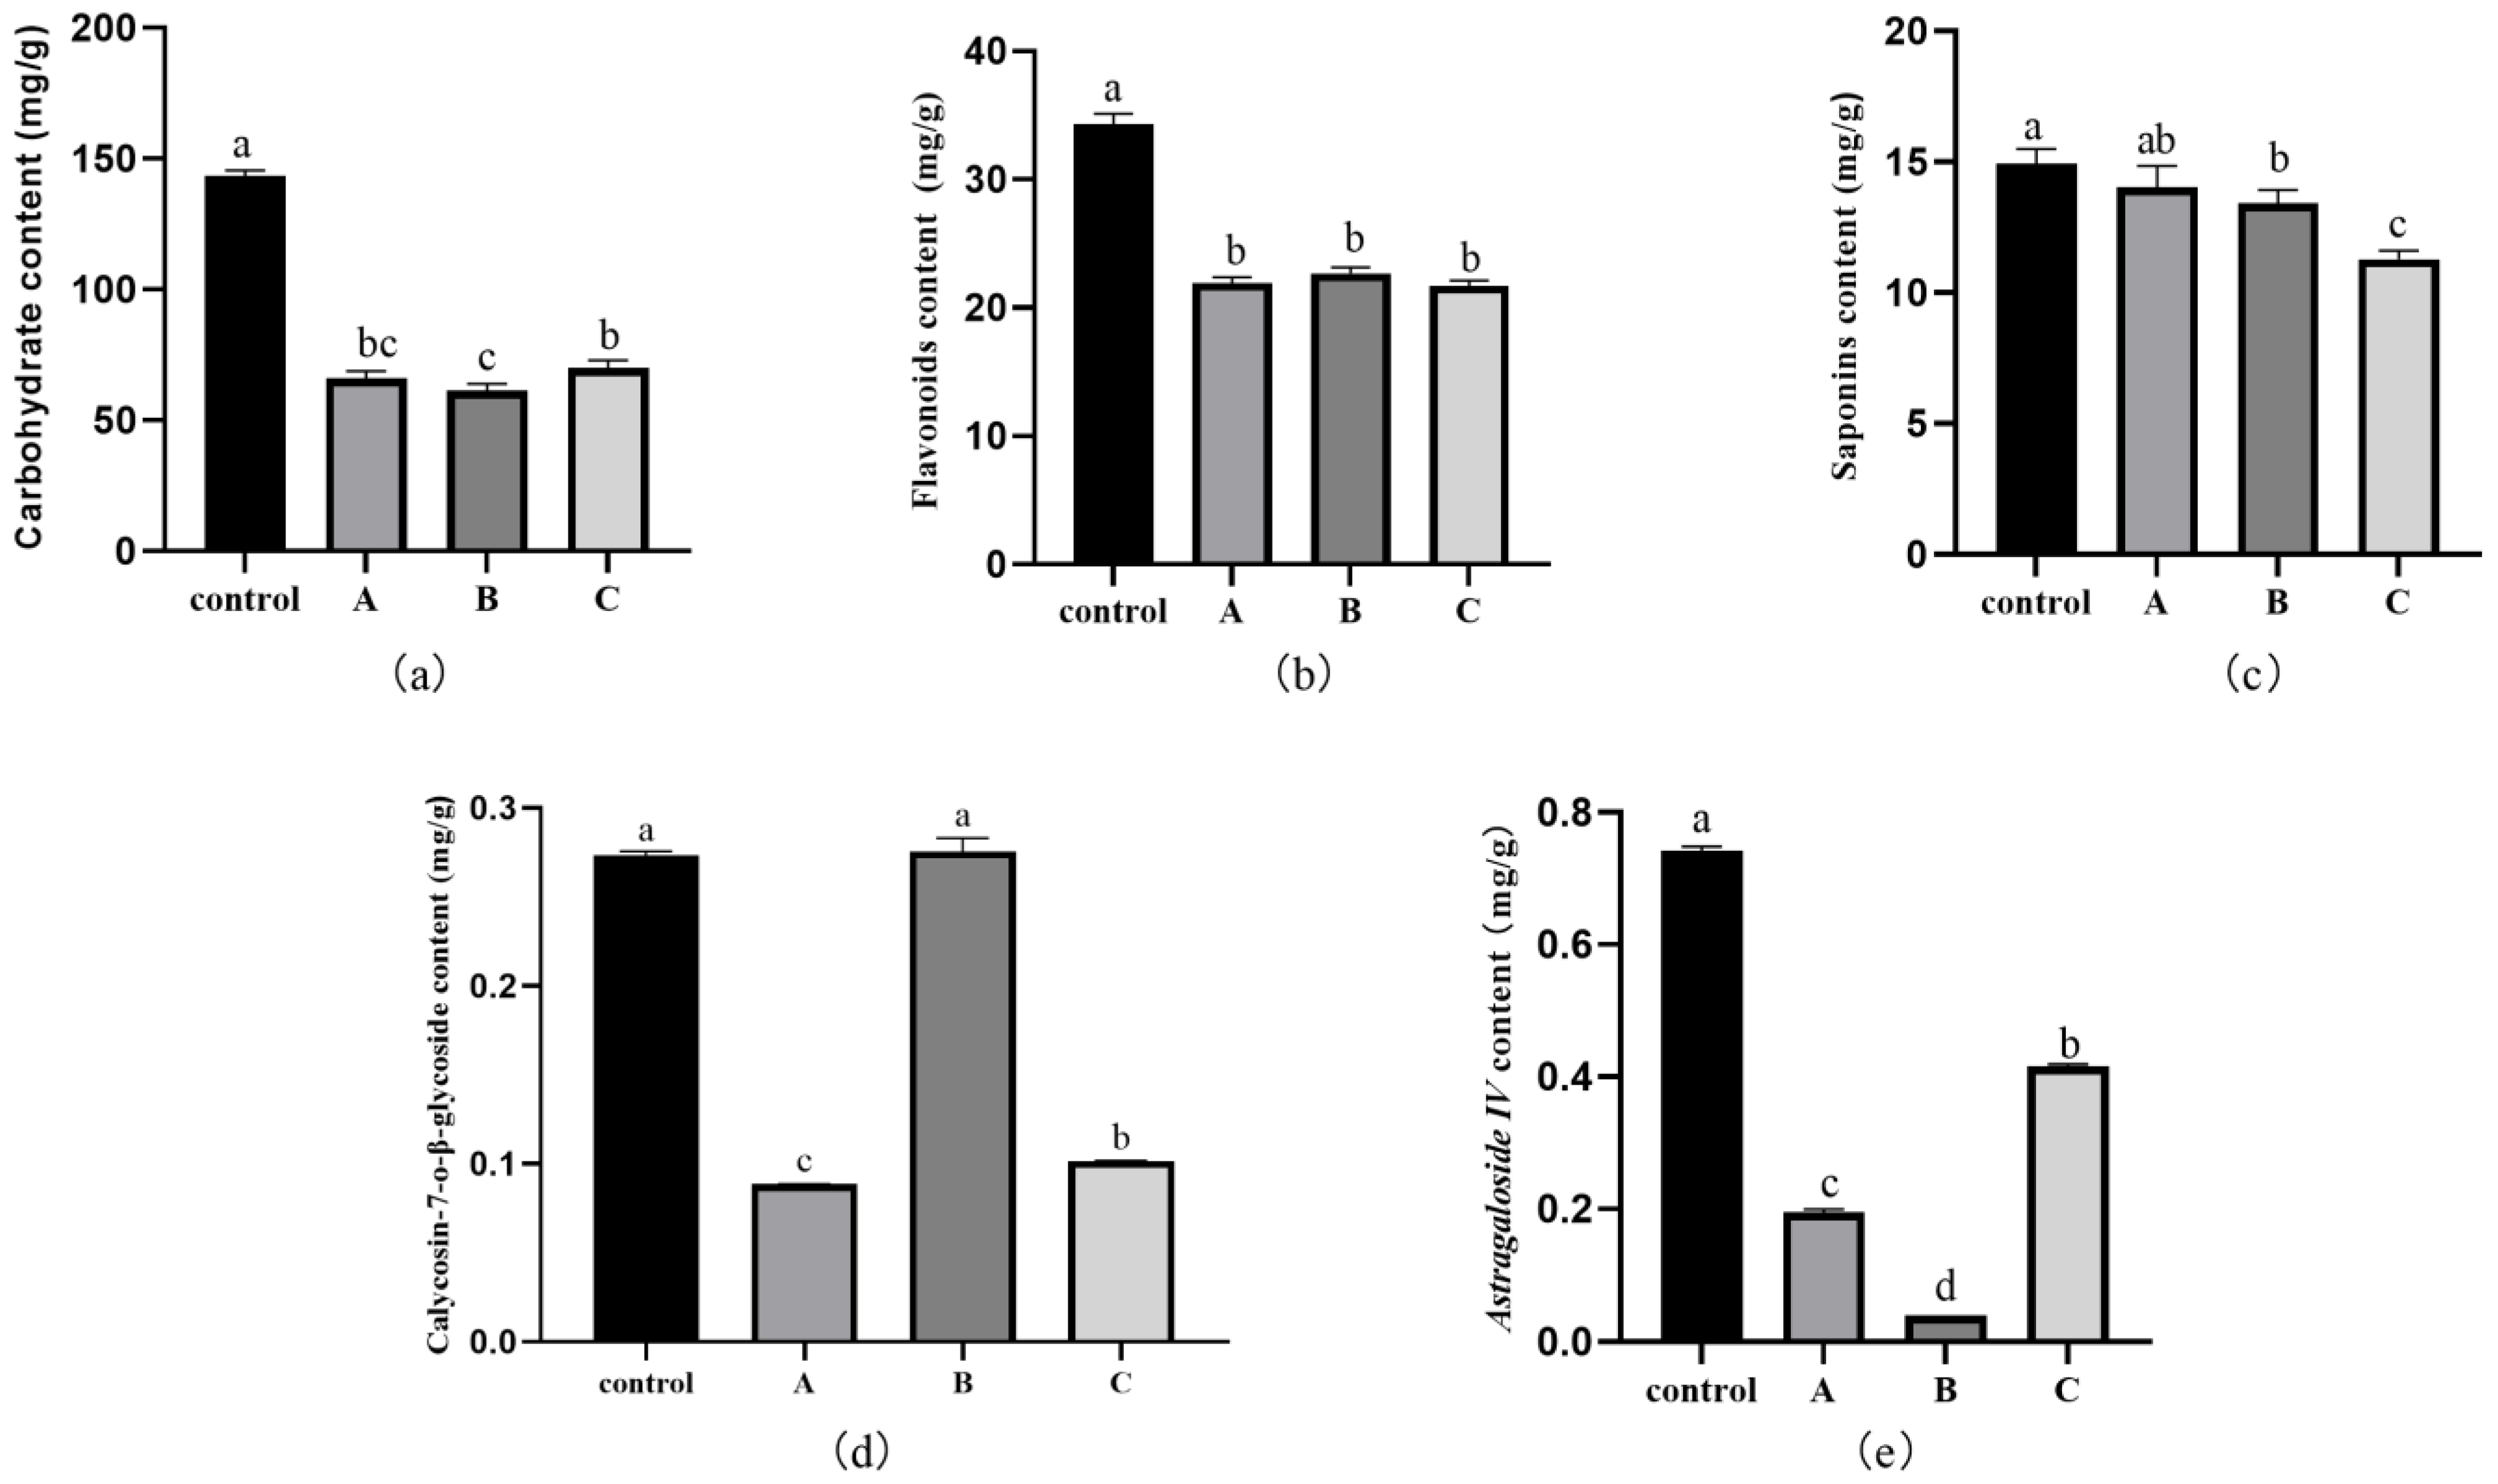
3.7. Effect of Fungal Infection on the Active Ingredients, Total Carbohydrates, Flavonoids, and Saponins in RA

It was obvious that the total carbohydrate content decreased from 145 mg/g in the control group to 65 mg/g in the infected group, and the total carbohydrate content decreased by about 55.17% (Figure 6a). Compared with the control group, the total flavonoid contents of the RA samples infected with P. polonicum (A), T. roseum (B), and F. equiseti (C) were reduced by about 34.5% (Figure 6b); the total saponins in the RA samples infected with P. polonicum (A) and T. roseum (B) decreased by 6.10% and 10.19%, respectively; and the total saponin contents of the RA samples infected with F. equiseti (C) decreased by 24.46% (Figure 6c).
The contents of calycosin-7-O-β-glycoside in the RA samples infected with P. polonicum (A) and F. equiseti (C) were 0.088 mg/mL and 0.101 mg/mL, which are lower than 0.02% of the lowest content of calycosin-7-O-β-glycoside in the Chinese pharmacopoeia and represent decreases of 67.8% and 63.0% compared with the control group, respectively (Figure 6d). There was no change in the content of calycosin-7-O-β-glycoside in the RA infected with T. roseum compared with the control group. The contents of Astragaloside IV in the RA samples infected with P. polonicum (A), T. roseum (B), and F. equiseti (C) decreased by 73.8%, 89.3%, and 44.0%, respectively, compared with the control group (Figure 6e).
The standard curves of total carbohydrate, flavonoids, saponins, calycosin-7-O-β-glycoside, and Astragaloside IV are shown in Appendix A (Figure A3, Figure A4, Figure A5, Figure A6 and Figure A7).

4. Discussion

Based on analyses of morphological characteristics and molecular biology techniques, the main pathogens causing mildew in RA during storage after harvest are P. polonicum, T. roseum, and F. equiseti. To our knowledge, this is the first finding to identify that T. roseum and F. equiseti are also the main pathogens causing RA mildew in Longxi, Gansu Province, during postharvest storage.
The results indicate that P. polonicum, T. roseum, and F. equiseti not only infected RA tissues via wounds but could cause infections when their spore suspensions were sprayed on the surfaces of intact and healthy RA plants (Figure 3). A similar phenomenon was observed in other fruits, vegetables, and plants in previous reports in the literature, such as P. polonicum causing onion disease in both wounded and non-injured conditions [29], the penetration of the bagged apple by the germ tube of T. roseum through natural openings such as stomata, dermal pores, and surface fissures [30], and the direct penetration of the epidermal cells of leaves by the mycelium produced via the spore germination of Alternaria alternata isolated from tobacco leaves [31].
It is well known that environmental conditions can significantly influence the growth of pathogens. Temperature, pH, and carbon and nitrogen sources are key environmental factors. Temperature plays an important role in the generation, spread, and infectiousness of plant pathogens. It was reported that the optimum growth and sporulation temperatures of T. roseum in apple and the three fusarium isolates in bell pepper were also in the range of 25–28 °C [32,33], which was consistent with the results of our research (Table 1). The temperature range suitable for the growth of T. roseum and F. equiseti was 20–30 °C, and the temperature range suitable for the growth of P. polonicum was 15–30 °C. Considering that RA is harvested annually from October to November, the local temperature at this time is about 20–30 °C during the day and 15–20 °C at night, which is exactly consistent with the temperature range suitable for the growth of the three fungi. Since P. polonicum is more susceptible to low temperatures, nighttime temperatures may be more suitable for its growth and sporulation, which also explained why P. polonicum was the main pathogenic fungus responsible for RA mildew (Section 3.2). When the temperature increased to 35 °C, the growth and sporulation of the three fungi were markedly inhibited, which provided us with an idea and method for the prevention and control of mildew during the postharvest storage of RA.
Light conditions are also important environmental conditions affecting the growth and sporulation of pathogens. Researchers discovered that continuous visible light irradiation on cultures and host plant tissues inhibited the spore production of many fungi, and the inhibitory effect of light decreased with a decrease in temperature [31,34,35]. The three pathogenic fungi isolated from mildew on RA plants also conformed to the above rules (Table 1). Therefore, in warm localities or in heated storerooms, the use of intermittent nocturnal illumination may be useful for the control of fungal diseases of RA during storage.
In terms of the degrees of utilization of carbon and nitrogen sources, the three pathogenic fungi could make good use of the various carbon sources provided in the experiment, including monosaccharides, disaccharides, and polysaccharides (Figure 4). The literature reported that T. roseum and isolates of the genus Fusarium had the ability to degrade cellulose, xylan, and pectin [36,37]. Meanwhile, recent research suggested that Penicillium could be the next champion for cellulase production for biofuel applications [38]. These studies verified that T. roseum and isolates of Penicillium or Fusarium had the ability to degrade various carbon sources. RA is rich in polysaccharides, cellulose, starch, and other substances, which provide good carbon sources for the growth of the three fungi. Unlike the carbon sources, the three fungi used the nitrogen sources provided in the experiment to different degrees (Figure 5). In our study, compared with other nitrogen sources, yeast extract had a great promotional effect on the sporulation of P. polonicum and T. roseum, and as a nitrogen source, peptone could promote the growth and sporulation of F. equiseti. It was found that the secondary metabolisms of a fungus are often associated with the microbial spore production process, and the nutritional environments for spore production and secondary metabolites were also similar [39]. For example, for P. expansum on the culture medium containing the yeast extract, peptone and a beef extract are capable of generating more high-level patulin [40], which is consistent with the optimal spore production conditions of the nitrogen sources in our study. It was interesting that on the medium modified with urea as a nitrogen source, the mycelia barely grew (P. polonicum) or grew slowly (T. roseum and F. equiseti). At the same time, sporulation decreased significantly. Therefore, directly spraying urea on the surfaces of RA plants or coating them with urea and other substances may be helpful in preventing RA mildew during postharvest storage.
As a component of traditional Chinese medicine, RA’s medicinal ingredient contents are very important to the quality of the medicinal materials produced. The active ingredients in RA, namely saponins, polysaccharides, and isoflavones, have therapeutic anti-inflammatory, antioxidant, immunostimulating, and anti-apoptotic effects [41]. The contents of calycosin-7-O-β-glycoside and Astragaloside IV are used as important indexes to evaluate the quality of RA, as stipulated in the Chinese Pharmacopoeia. According to the results of this study (Figure 6), the carbohydrate and total flavone contents of fresh RA were significantly decreased following infection with the isolated mildew fungi, and the total saponin contents of the RA were also slightly decreased following infection. Two important components of RA, calycosin-7-O-β-glycoside, and Astragaloside IV, were also reduced in RA mildew, except for the calycosin-7-O-β-glycoside content following infection with T. roseum. Therefore, the results show that infections with the three fungi will significantly decrease the medicinal quality of RA.

5. Conclusions

In our study, P. polonicum, T. roseum, and F. equiseti were isolated from RA mildew during the storage of RA after harvest. Biological characteristics showed that the growth and sporulation of the three fungi were affected by external environmental and nutritional factors, including temperature, the pH of the substrate, light, and sources of carbon and nitrogen. The determination of these pathogens’ requirements is necessary to develop an appropriate control strategy for avoiding RA mildew. Following infection with P. polonicum, T. roseum, and F. equiseti, the total carbohydrate, flavonoid, and saponin contents in the RA samples greatly decreased, indicating that fungal infection reduced the medicinal value of the RA. The results of this study will be beneficial in deepening our understanding of mildew diseases during the postharvest storage of fresh RA and will provide a theoretical basis for reasonable and effective methods of storing RA.

Supplementary Materials

The following are available online at https://www.mdpi.com/article/10.3390/horticulturae9091019/s1, Figure S1: ITS gel electrophoresis image of PCR amplification product, Figure S2: TUB gel electrophoresis image of PCR amplification product, Figure S3: TEF-Z3 gel electrophoresis image of PCR amplification product.

Author Contributions

Conceptualization, H.X.; material preparation, data collection, and analysis, Y.Z. and M.N.; writing—original draft preparation, Y.Z.; writing—review and editing, H.X.; funding acquisition, Y.Z. All authors have read and agreed to the published version of the manuscript.

Funding

This research was funded by the Science and Technology Program of Gansu Province (no. 21JR7RA834) and the Innovation Fund of Gansu Universities (no. 2022B-103).

Data Availability Statement

The data that support the findings of this study are available from the corresponding author upon reasonable request.

Acknowledgments

We are very thankful to the medicinal material planting base (Longxi, Gansu, China) for providing Fresh RA.

Conflicts of Interest

The authors declare no conflict of interest.

Appendix A

Figure A1. Typical symptoms of RA infected with mold after 28 days of storage.
Horticulturae 09 01019 g0a1
Figure A2. ITS, TUB, and TEF gel electrophoresis image of PCR amplification product. Note: The figure is spliced from Figures S1 to S3 in the supplementary materials.
Horticulturae 09 01019 g0a2

Appendix A.1. Determination of Total Carbohydrates

Appendix A.1.1. Preparation of Glucose Standard Solutions

Two grams of glucose (analytical grade, Guang Fu, Tianjin, China) was dissolved in deionized water and titrated into a 100 mL volumetric flask at a concentration of 20 mg/mL.

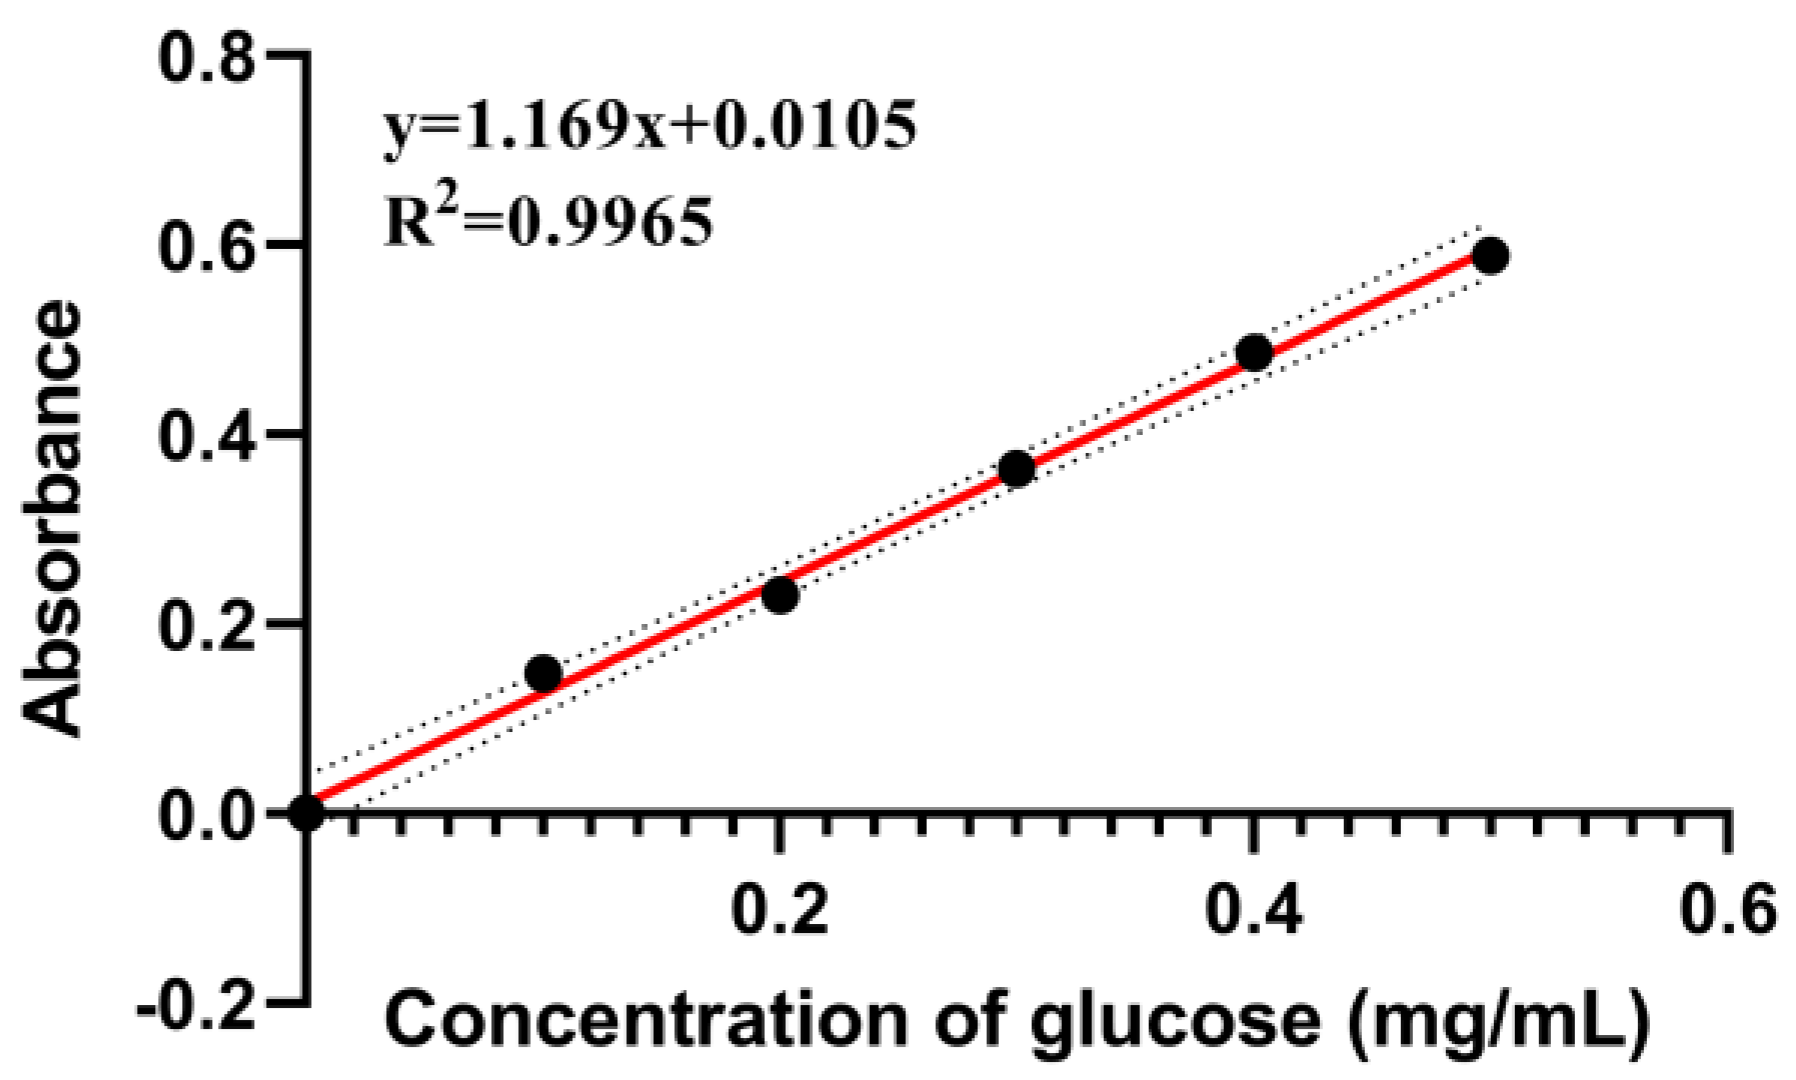
Appendix A.1.2. Preparation of Standard Curves for Total Carbohydrates

A glucose standard solution (0.05, 0.10, 0.15, 0.20, and 0.25 mL) in a 10 mL volumetric flask was accurately taken and made up to 2 m. Then, 1 mL of a 5% phenol solution (analytical grade, Aladdin, Shanghai, China) was added, and 5 mL sulfuric acid (analytical grade, Sinopharm Chemical Reagent Co., Ltd., Shanghai, China) was slowly added, shaken for 2 min, boiled in a water bath for 15 min, and cooled to room temperature. The agent blank was used as a reference, and absorbance was measured at 490 nm by UV spectrophotometry (INESA scientific Instruments Co., Ltd., Shanghai, China). The absorbance (A) was used as the ordinate (Y), and the concentration (mg/mL) was used as the abscissa (X) to draw the standard curve of total carbohydrates. The standard curve of total carbohydrates is shown in Figure A3.
Figure A3. The standard curve of total carbohydrates.
Horticulturae 09 01019 g0a3

Appendix A.1.3. Sample Test

Five hundred microliters of each sample solution was accurately sucked, and the volume was fixed at 10 mL with deionized water. The same treatment was performed as in Appendix A.1.2, and then the solution was diluted 10 times to measure its absorbance.

Appendix A.2. Determination of Total Flavonoids

Appendix A.2.1. Preparation of Rutin Standard Solution

A 0.0688 g mass of rutin (analytical grade, Aladdin, Shanghai, China) was accurately weighed and titrated into a 10 mL volumetric flask with methanol to a concentration of 6.88 mg/mL.

Appendix A.2.2. Preparation of Standard Curves for Total Flavonoids

Precision suction rutin standard solution 0.1, 0.2, 0.3, 0.4, and 0.5 mL were placed in a 10 mL colorimetric tube, and 0.5 mL of 5% sodium nitrite solution (analytical grade, Guang Fu, Tianjin, China) was added, mixed, and left for 6 min. Then, 0.5 mL of 10% aluminum nitrate solution (analytical grade, Guang Fu, Tianjin, China) was added, mixed, and left for 6 min. Following this, 4 mL of 1 M sodium hydroxide (analytical grade, Guang Fu, Tianjin, China) was added, methanol was added to the scale, and the reagent without reference was used as a blank. The absorbance was measured at 506 nm by UV spectrophotometry. The standard curve of total flavonoids is shown in Figure A4.
Figure A4. The standard curve of total flavonoids.
Horticulturae 09 01019 g0a4

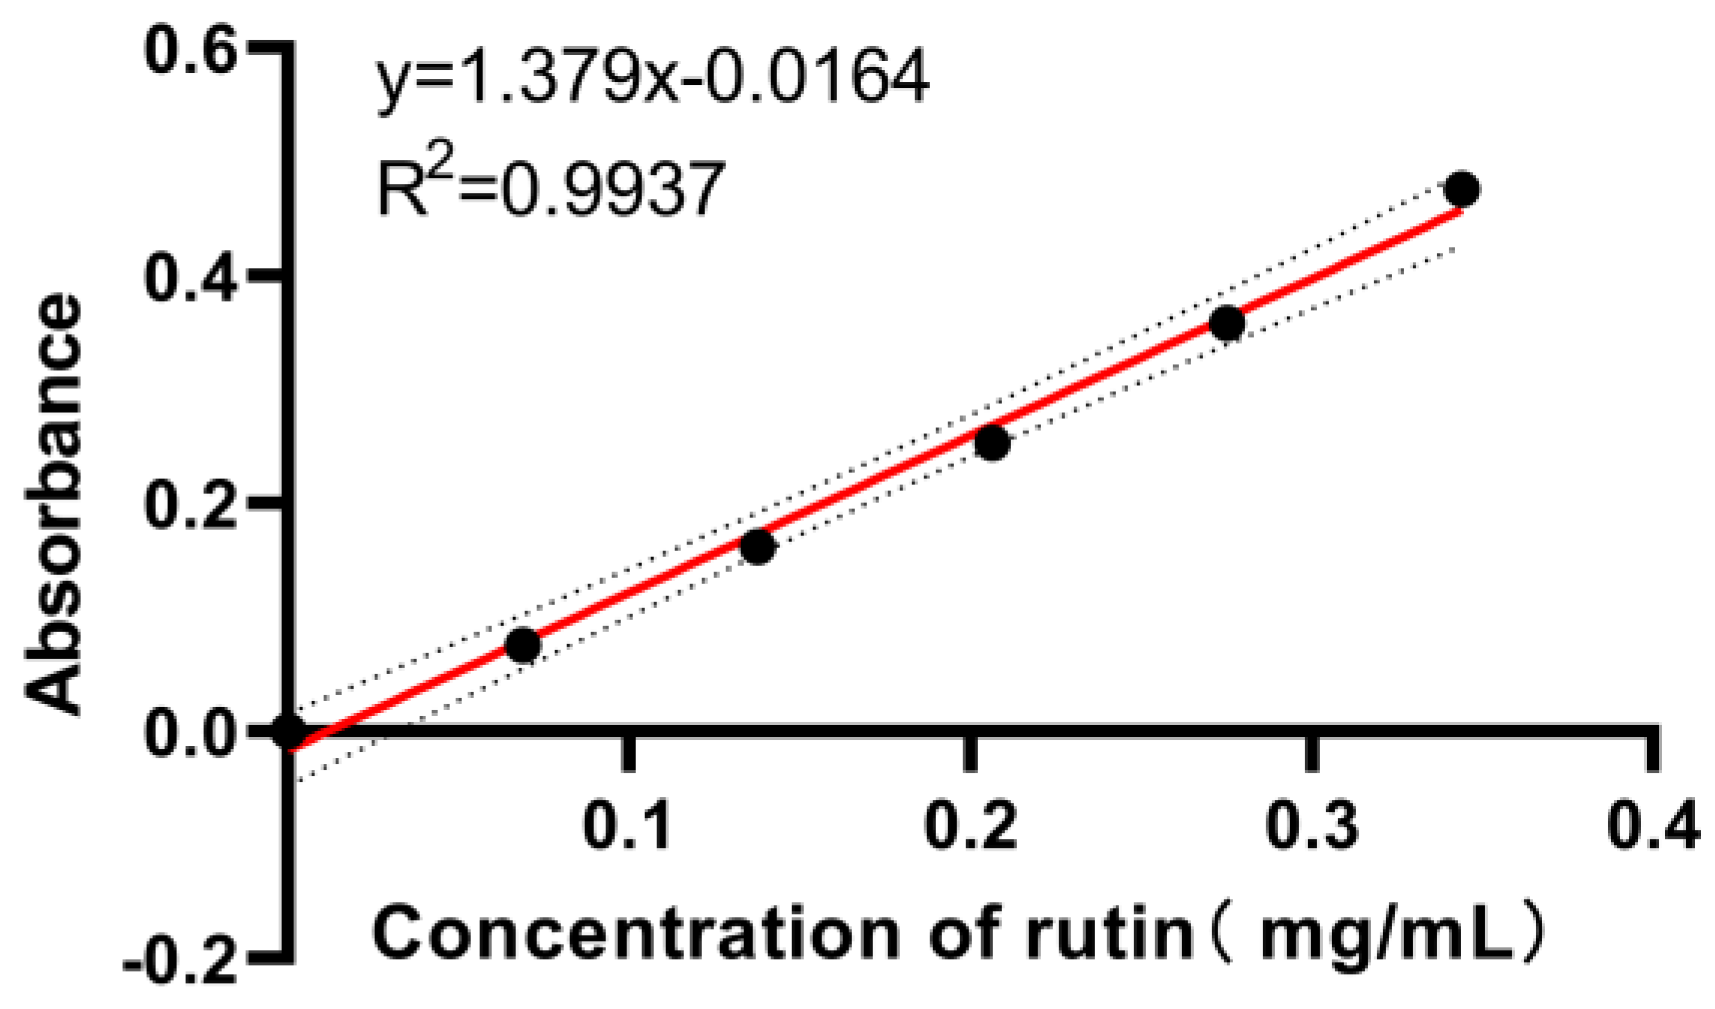
Appendix A.2.3. Sample Tests

First, 500 uL of each sample solution was accurately sucked, and the volume was fixed to 10 mL with methanol. The same treatment was performed as in Appendix A.2.2.

Appendix A.3. Determination of Total Saponins

Appendix A.3.1. Preparation of Standard Solutions of Astragaloside IV

A 0.0104 g mass of Astragaloside IV (analytical standard, Yuanye Bio-Technology Co., Ltd., Shanghai, China) was accurately weighed and diluted to 10 mL with methanol, and the concentration was 1.04 mg/mL.

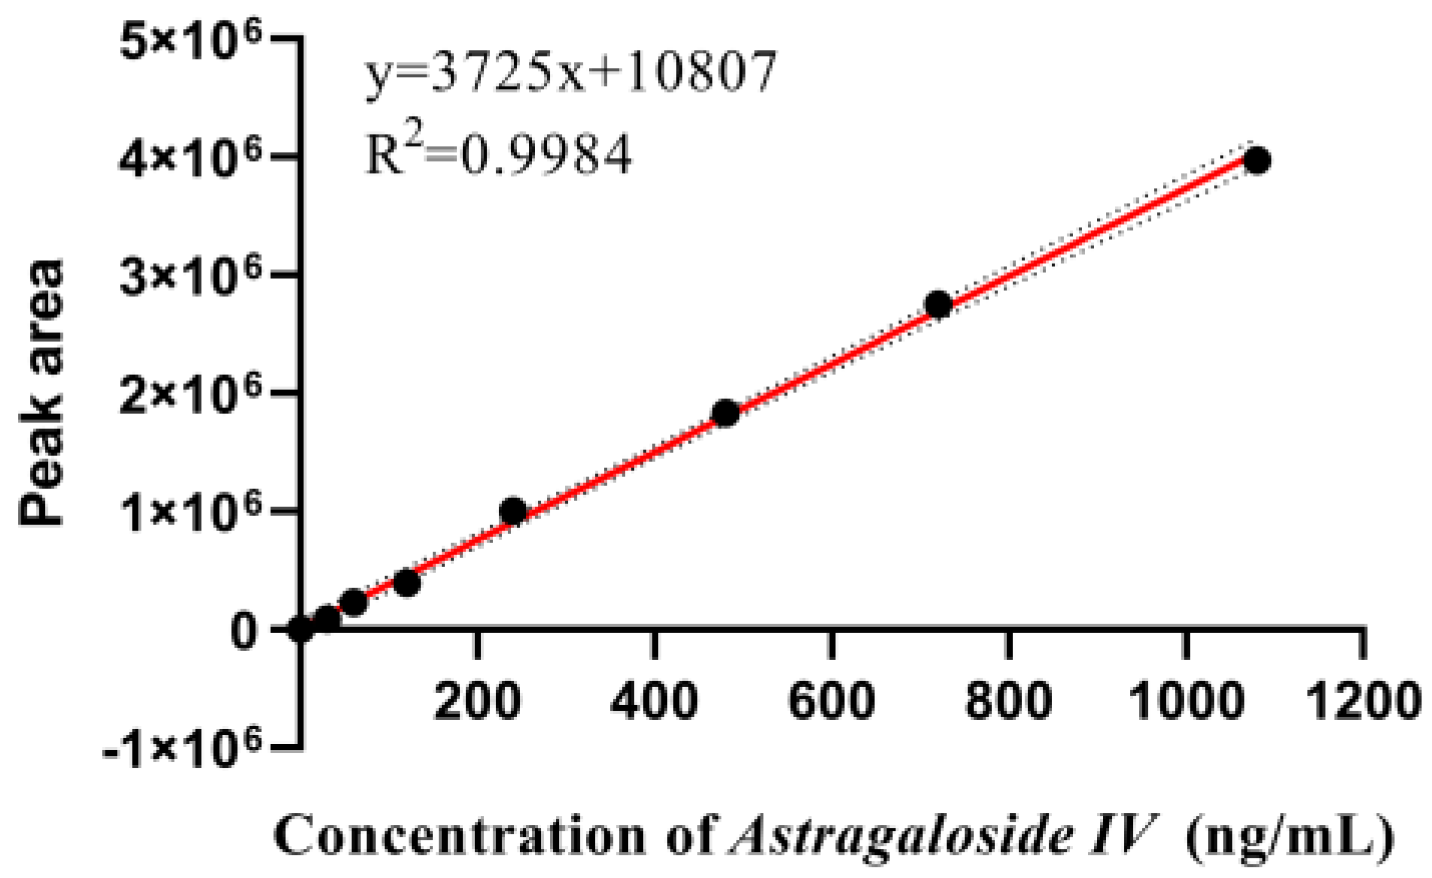
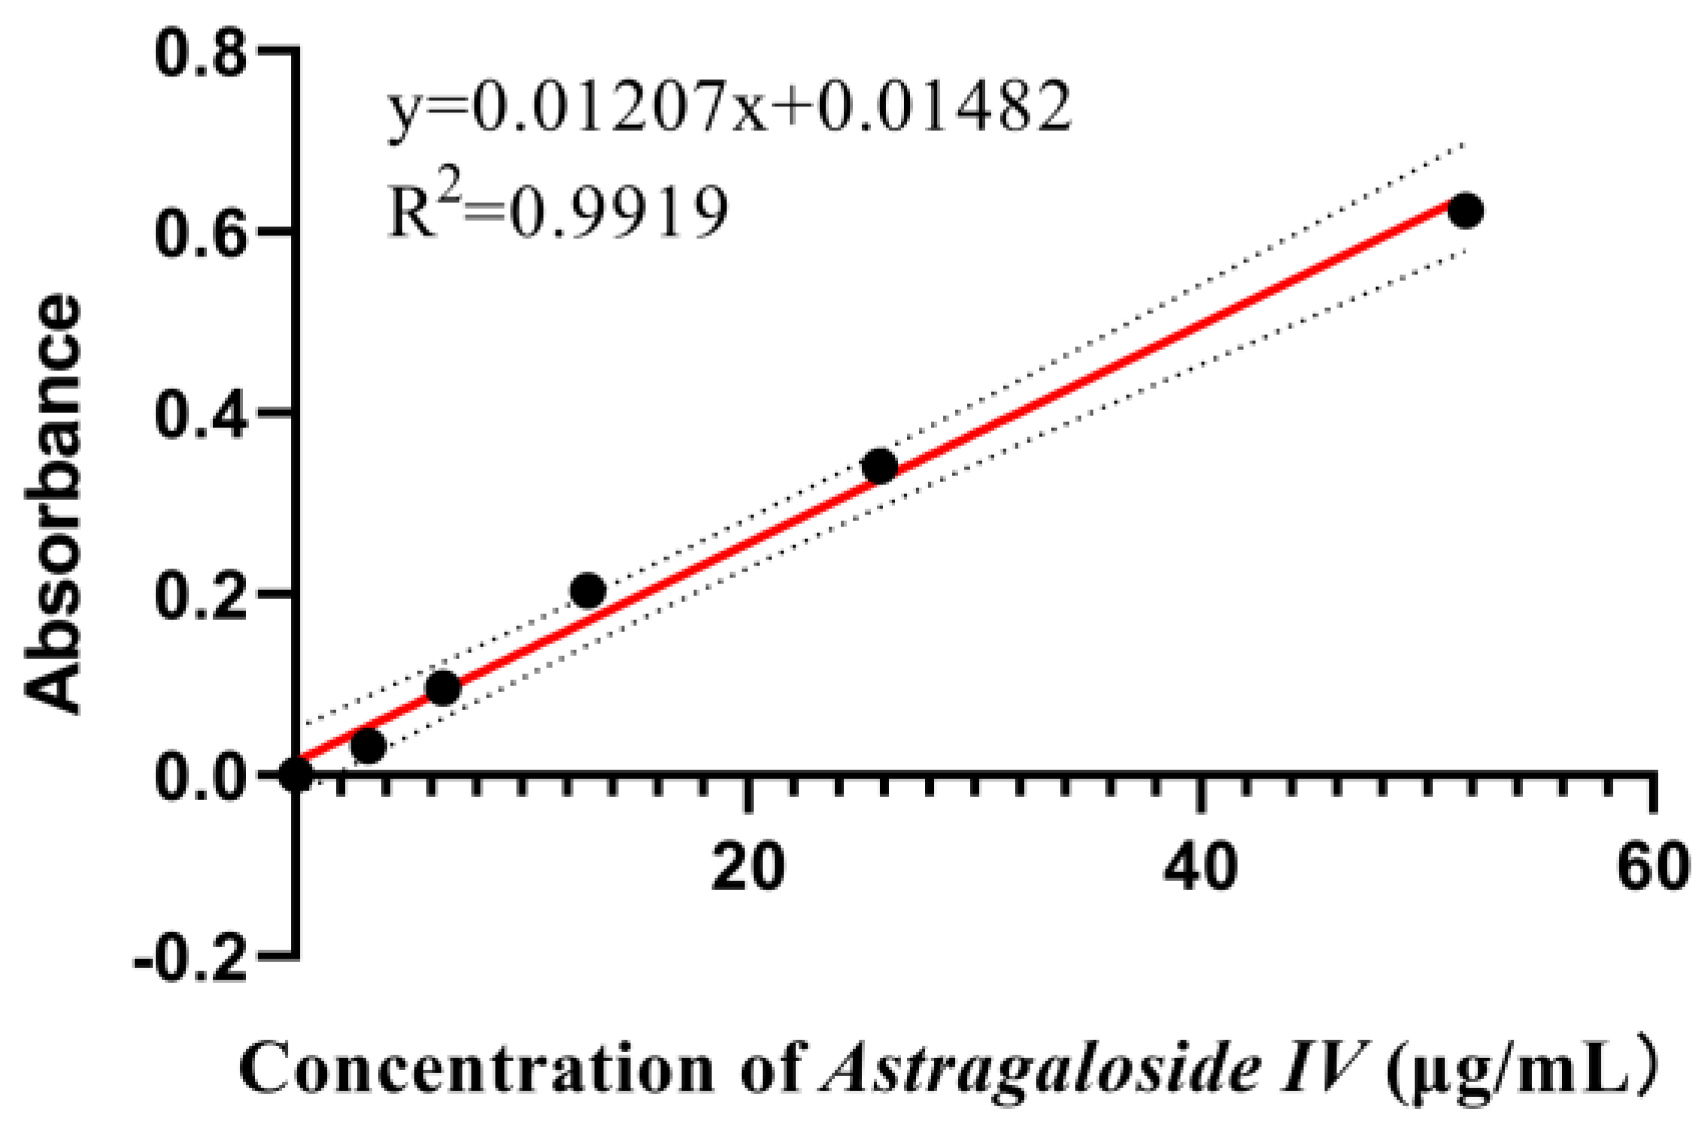
Appendix A.3.2. Preparation of Standard Curves for Total Saponins

First, 500 μL of Astragaloside IV standard solution with a concentration of 1040 μg/mL was accurately absorbed into a 10 mL volumetric flask, and the concentration was titrated to 52.0 μg/mL with methanol. The method of multiple dilution was used to prepare 5 mL solutions with concentrations of 26.0, 13.0, 6.50, and 3.25 μg/mL in turn. Then, 0.5 mL of 8% vanillin absolute ethanol solution (analytical grade, Aladdin, Shanghai, China) and 4.5 mL of 72% perchloric acid (analytical grade, Guang Fu, Tianjin, China) were precisely added, and the volume was fixed to 10 mL. The solution was kept in a 62 °C water bath for 20 min, and then cooled to room temperature in an ice water bath. The accompanying reagent was used as a blank, and the absorbance value was measured at a wavelength of 539 nm by UV spectrophotometry. The standard curve of total flavonoids is shown in Figure A5.
Figure A5. The standard curve of total saponins.
Horticulturae 09 01019 g0a5

Appendix A.3.3. Sample Tests

First, 500 μL of each sample solution was accurately sucked, and the volume was fixed to 5 mL with methanol. The same treatment was undertaken as in Appendix A.3.2, and then the solution was diluted 5 times to measure its absorbance.

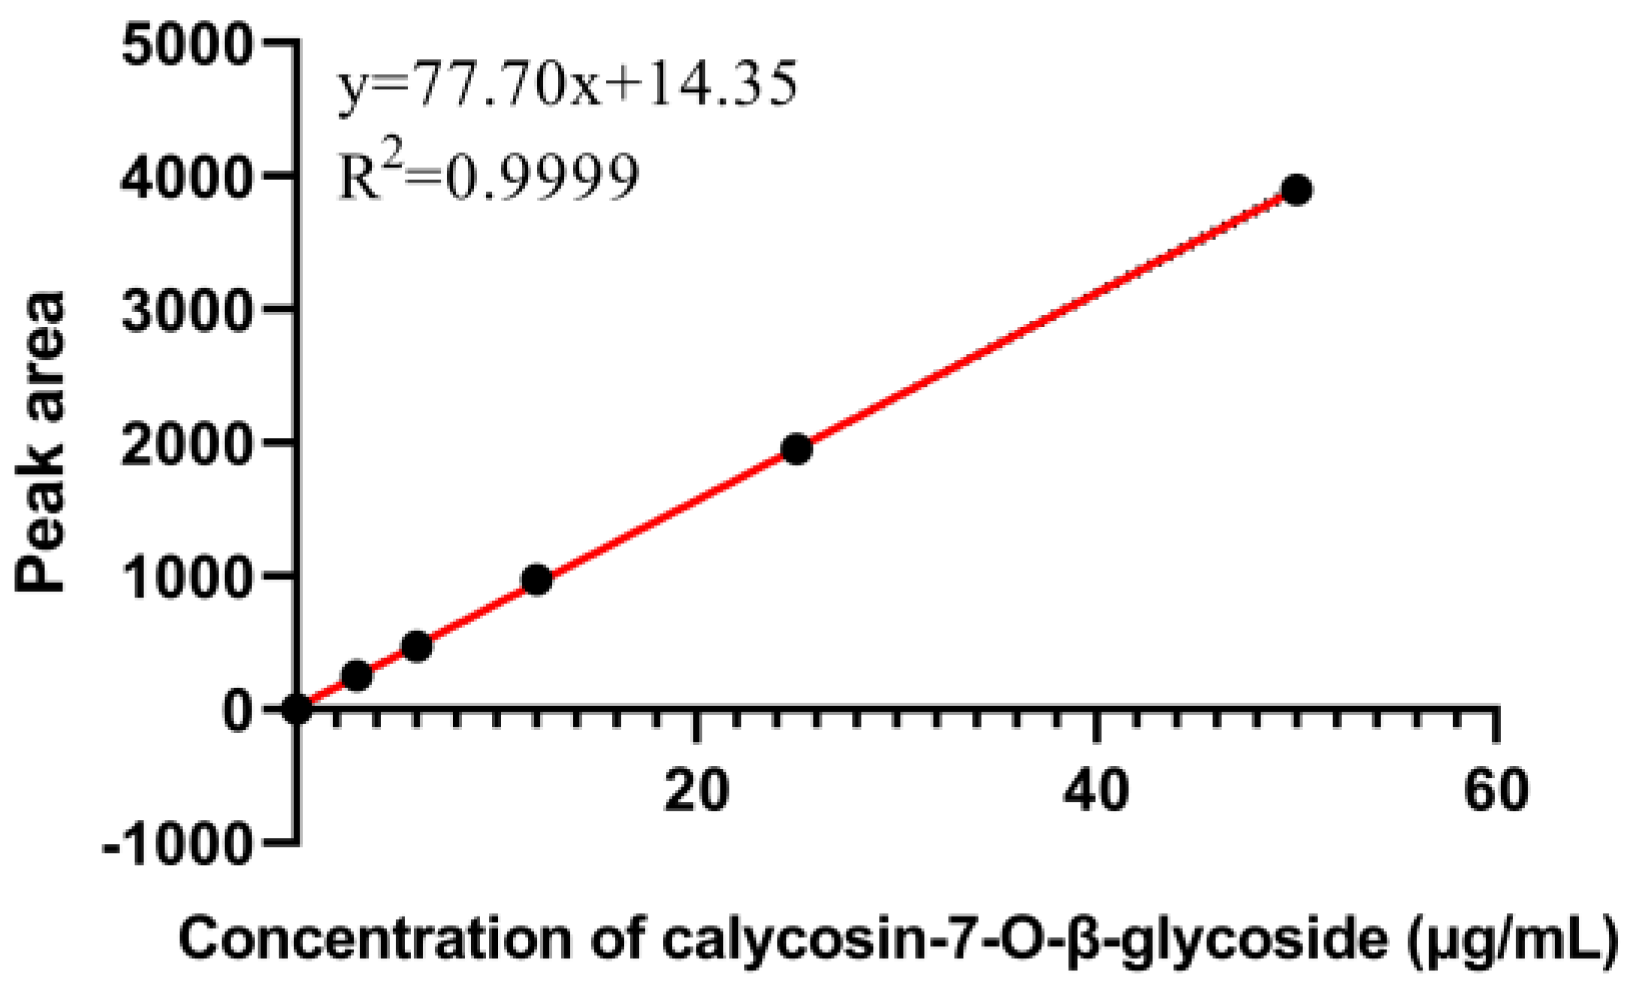
Appendix A.4. Determination of Calycosin-7-O-β-Glycoside

Calycosin-7-O-β-glycoside standard solutions (analytical standard, Yuanye Bio-Technology Co., Ltd., Shanghai, China) with concentrations of 0.0, 3.0, 6.0, 12.0, 25.0, and 50.0 μg/mL were prepared and tested by HPLC. The standard curve was drawn with the concentration as the abscissa (X) and the peak area as the ordinate (Y) (Figure A6).
Figure A6. The standard curve of calycosin-7-O-β-glycoside.
Horticulturae 09 01019 g0a6

Appendix A.5. Determination of Astragaloside IV

Astragaloside IV standard solutions with concentrations of 30, 60, 120, 240, 480, and 720 ng/mL were prepared and tested by HPLC-MS. The standard curve was drawn with the concentration as the abscissa (X) and the peak area as the ordinate (Y) (Figure A7).
Figure A7. The standard curve of Astragaloside IV.
Horticulturae 09 01019 g0a7

References

  1. Zheng, Y.; Ren, W.; Zhang, L.; Zhang, Y.; Liu, D.; Liu, Y. A Review of the Pharmacological Action of Astragalus Polysaccharide. Front. Pharmacol. 2020, 11, 349. [Google Scholar] [CrossRef]
  2. Rangsipanuratn, W.; Kammarnjassadakul, P.; Janwithayanuchit, I.; Paungmoung, P.; Ngamurulert, S.; Sriprapun, M.; Yangen, S.; Soottitantawat, V.; Sandee, A. Detection of microbes, aflatoxin and toxic heavy metals in Chinese medicinal herbs commonly consumed in Thailand. Pharm. Sci. Asia 2017, 44, 162–171. Available online: https://pharmacy.mahidol.ac.th/journal/_files/2017-44-3_5.pdf (accessed on 20 January 2023). [CrossRef]
  3. Commission, S.P. Chinese Pharmacopoeia; Chemistry and Industry Press: Beijing, China, 2015; p. 261. [Google Scholar]
  4. Wang, Y.; Zhang, C.; Zhang, L.; Zhao, M.; OuYang, Z.; Yang, M. A comprehensive strategy for screening and exploring multi-class mycotoxins contamination status in Astragali radix. Microchem. J. 2020, 158, 105294. [Google Scholar] [CrossRef]
  5. Su, C.; Hu, Y.; Gao, D.; Luo, Y.; Chen, A.J.; Jiao, X.; Gao, W. Occurrence of Toxigenic Fungi and Mycotoxins on Root Herbs from Chinese Markets. J. Food Prot. 2018, 81, 754–761. [Google Scholar] [CrossRef] [PubMed]
  6. Mukhtar, I.; Chen, R.; Cheng, Y.; Chen, J. First Report of Powdery Mildew on Astragalus sinicus (Chinese Milk Vetch) Caused by Erysiphe trifoliorum in China. Plant Dis. 2022, 106, 2535. [Google Scholar] [CrossRef]
  7. Jin, M.; Yang, C.; Yang, L.; Cui, L.; Wei, L. Isolation and identification of a new Colletotrichum species causing anthracnose of Astragalus membranaceus. Crop Prot. 2020, 143, 105470. [Google Scholar] [CrossRef]
  8. Guan, Y.M.; Zhang, S.N.; Ma, Y.Y.; Zhang, Y.Y. Occurrence of Dactylonectria torresensis Causing Root Rot on Astragalus membranaceus in Northeastern China. Plant Dis. 2021, 105, 1219. [Google Scholar] [CrossRef]
  9. Gao, F.; Zhao, X.; Qin, X.; Lei, Z. Analysis of dominant pathogen community causing Astragalus membranaceus var. mongholicus root rot in Shanxi Province. J. Plant Prot. 2018, 45, 878–885. (In Chinese) [Google Scholar]
  10. Zhou, H.; Yang, H.; Tang, W. Occurrence of Fusarium root rot in Astragalus adsurgens and identification of the pathogens. Acta Agrestia Sinica 2004, 12, 285. (In Chinese) [Google Scholar]
  11. Zhu, Y.; Wang, S.; Xu, X.; Wang, L.; Zhou, H.; Ying, X.; Hu, Q.; Wang, X.; Ji, S.; Cai, Q. Exposure assessment and risk-based limit levels evaluation of ochratoxin A in Astragali radix in China. Ecotoxicol. Environ. Saf. 2022, 237, 113517. [Google Scholar] [CrossRef]
  12. Frisvad, J.; Hubka, V.; Ezekiel, C.; Hong, S.-B.; Nováková, A.; Chen, A.; Arzanlou, M.; Larsen, T.; Sklenář, F.; Mahakarnchanakul, W.; et al. Taxonomy of Aspergillus section Flavi and their production of aflatoxins, ochratoxins and other mycotoxins. Stud. Mycol. 2019, 93, 1–63. [Google Scholar] [CrossRef] [PubMed]
  13. Zhang, R.; Miao, M.-S. Application characteristics of fresh traditional Chinese medicine. In Proceedings of the 2017 2nd International Conference on Biological Sciences and Technology (BST 2017), Zhuhai, China, 17–19 November 2017; Atlantis Press: Amsterdam, The Netherlands, 2017. [Google Scholar]
  14. Wei, J.C. Fungal Identification Manual; Shanghai Scientific and Technical Publishers: Shanghai, China, 1979. (In Chinese) [Google Scholar]
  15. White, T.J.; Bruns, T.; Lee, S.; Taylor, J. Amplification and direct sequencing of fungal ribosomal RNA genes for phylogenetics. In PCR Protocols: A Guide to Methods and Applications; Innis, M.A., Gelfand, D.H., Sninsky, J.J., White, T.J., Eds.; Academic Press: San Diego, CA, USA, 1990; pp. 315–322. Available online: https://sci-hub.ru/10.1016/b978-0-12-372180-8.50042-1 (accessed on 24 January 2023).
  16. Glass, N.L.; Donaldson, G.C. Development of primer sets designed for use with the PCR to amplify conserved genes from filamentous ascomycetes. Appl. Environ. Microbiol. 1995, 61, 1323–1330. [Google Scholar] [CrossRef]
  17. O’Donnell, K.; Kistler, H.C.; Cigelnik, E.; Ploetz, R.C. Multiple evolutionary origins of the fungus causing Panama disease of banana: Concordant evidence from nuclear and mitochondrial gene genealogies. Proc. Natl. Acad. Sci. USA 1998, 95, 2044–2049. [Google Scholar] [CrossRef] [PubMed]
  18. Duan, Y.; Qu, W.; Chang, S.; Li, C.; Xu, F.; Ju, M.; Zhao, R.; Wang, H.; Zhang, H.; Miao, H. Identification of Pathogenicity Groups and Pathogenic Molecular Characterization of Fusarium oxysporum f. sp. sesami in China. Phytopathology 2020, 110, 1093–1104. [Google Scholar] [CrossRef]
  19. Nielsen, S.S. Phenol-Sulfuric Acid Method for Total Carbohydrates. In Food Analysis Laboratory Manual, 1st ed.; Nielsen, S.S., Ed.; Springer: Boston, MA, USA, 2010; pp. 47–53. Available online: https://link.springer.com/chapter/10.1007/978-1-4419-1463-7_6 (accessed on 29 January 2023).
  20. Zhang, W.-H.; Wu, J.; Weng, L.; Zhang, H.; Zhang, J.; Wu, A. An improved phenol-sulfuric acid method for the determination of carbohydrates in the presence of persulfate. Carbohydr. Polym. 2019, 227, 115332. [Google Scholar] [CrossRef]
  21. Wu, S.; Shen, D.; Wang, R.; Li, Q.; Mo, R.; Zheng, Y.; Zhou, Y.; Liu, Y. Phenolic profiles and antioxidant activities of free, esterified and bound phenolic compounds in walnut kernel. Food Chem. 2021, 350, 129217. [Google Scholar] [CrossRef]
  22. Wan, Z.; Zhu, J.; Tian, R.; Yang, W.; Chen, Z.; Hu, Q.; Zeng, Z. Quality evaluation for Dipacus asperoides from Enshi areas and optimization extraction of saponins and organic acids and its application. Arab. J. Chem. 2021, 14, 103107. [Google Scholar] [CrossRef]
  23. Bradshaw, M.J.; Bartholomew, H.P.; Lichtner, F.; Gaskins, V.L.; Jurick, W.M. First Report of Blue Mold Caused by Penicillium polonicum on Apple in the United States. Plant Dis. 2022, 106, 762. [Google Scholar] [CrossRef]
  24. Duduk, N.; Vasić, M.; Vico, I. First report of Penicillium polonicum causing blue mold on stored onion (Allium cepa) in Serbia. Plant Dis. 2014, 98, 1440. [Google Scholar] [CrossRef]
  25. Hamid, M.I.; Hussain, M.; Ghazanfar, M.U.; Raza, M.; Liu, X.Z. Trichothecium roseum Causes Fruit Rot of Tomato, Orange, and Apple in Pakistan. Plant Dis. 2014, 98, 1271. [Google Scholar] [CrossRef]
  26. Booth, C. The Genus Fusarium; Commonwealth Mycological Institute: Kew, UK, 1971. [Google Scholar]
  27. Guo, M.; Li, B.; Wang, R.; Liu, P.; Chen, Q. Occurrence of dieback disease caused by Fusarium equiseti on Dendrobium officinale in China. Crop Prot. 2020, 137, 105209. [Google Scholar] [CrossRef]
  28. Available online: https://www.ncbi.nlm.nih.gov/home/learn/ (accessed on 18 October 2022).
  29. Su, J.; Guo, C.; Zhang, J.; Qi, Y.; Cao, S.; Li, M. Isolation and identification of penicilliosis pathogens in onion during storage period. J. Gansu Agric. Univ. 2016, 51, 95–101. (In Chinese) [Google Scholar]
  30. Dai, P.; Liang, X.; Wang, Y.; Gleason, M.L.; Zhang, R.; Sun, G. High Humidity and Age-Dependent Fruit Susceptibility Promote Development of Trichothecium Black Spot on Apple. Plant Dis. 2019, 103, 259–267. [Google Scholar] [CrossRef]
  31. Slavov, S.; Mayama, S.; Atanassov, A. Some aspects of epidemiology of Alternaria alternata tobacco pathotype. Biotechnol. Biotechnol. Equip. 2004, 18, 85–89. [Google Scholar] [CrossRef]
  32. Li, X.; Li, B.-H.; Lian, S.; Dong, X.-L.; Wang, C.-X.; Liang, W.-X. Effects of temperature, moisture and nutrition on conidial germination, survival, colonization and sporulation of Trichothecium roseum. Eur. J. Plant Pathol. 2018, 153, 557–570. [Google Scholar] [CrossRef]
  33. Frans, M.; Aerts, R.; Van Laethem, S.; Ceusters, J. Environmental effects on growth and sporulation of Fusarium spp. causing internal fruit rot in bell pepper. Eur. J. Plant Pathol. 2017, 149, 875–883. [Google Scholar] [CrossRef]
  34. Rotem, J.; Cohen, Y.; Bashi, E. Host and Environmental Influences on Sporulation In Vivo. Annu. Rev. Phytopathol. 1978, 16, 83–101. [Google Scholar] [CrossRef]
  35. Li, F.; Matloob, M.; Nzabanita, C.; Li, Y. Growth, sporulation and germination of Verticillium alfalfae on media. Eur. J. Plant Pathol. 2021, 161, 383–395. [Google Scholar] [CrossRef]
  36. Yun, Y.H.; Son, S.Y.; Choi, C.W.; Hong, J.K.; Kim, Y.S.; Kim, S.H. The occurrence of pink mold rot fungus Trichothecium roseum on tomatoes in Korea. Afr. J. Microbiol. Res. 2013, 7, 1128–1135. [Google Scholar] [CrossRef]
  37. Bertonha, L.C.; Neto, M.L.; Garcia, J.A.A.; Vieira, T.F.; Castoldi, R.; Bracht, A.; Peralta, R.M. Screening of Fusarium sp. for xylan and cellulose hydrolyzing enzymes and perspectives for the saccharification of delignified sugarcane bagasse. Biocatal. Agric. Biotechnol. 2018, 16, 385–389. [Google Scholar] [CrossRef]
  38. Vaishnav, N.; Singh, A.; Adsul, M.; Dixit, P.; Sandhu, S.K.; Mathur, A.; Puri, S.K.; Singhania, R.R. Penicillium: The next emerging champion for cellulase production. Bioresour. Technol. Rep. 2018, 2, 131–140. [Google Scholar] [CrossRef]
  39. Calvo, A.M.; Wilson, R.A.; Bok, J.W.; Keller, N.P. Relationship between Secondary Metabolism and Fungal Development. Microbiol. Mol. Biol. Rev. 2002, 66, 447–459. [Google Scholar] [CrossRef] [PubMed]
  40. Zong, Y.; Li, B.; Tian, S. Effects of carbon, nitrogen and ambient pH on patulin production and related gene expression in Penicillium expansum. Int. J. Food Microbiol. 2015, 206, 102–108. [Google Scholar] [CrossRef]
  41. Abd Elkader, H.T.A.E.; Essawy, A.E.; Al-Shami, A.S. Astragalus species: Phytochemistry, biological actions and molecular mechanisms underlying their potential neuroprotective effects on neurological diseases. Phytochemistry 2019, 103, 2692. [Google Scholar] [CrossRef] [PubMed]
Figure 1. Morphological characteristics of Z1, Z2, and Z3: (a) Z1 isolate, (b) Z2 isolate, and (c) Z3 isolates. 1—Fronts of colonies cultured on PDA; 2—backs of colonies cultured on PDA; 3—sporophore morphology, observed via a microscope at 40×; 4—spore morphology, observed via a microscope at 40×; and 5—spore morphology, observed via SEM.
Horticulturae 09 01019 g001
Figure 2. The phylogenetic trees of the isolated pathogenic fungi, constructed via the neighbor-joining method and based on analyses of the ITS (a), TUB (b), and TEF (c) sequences.
Horticulturae 09 01019 g002
Figure 3. Pathogenicity test of the pathogens causing postharvest disease in fresh RA ((a)—P. polonicum; (b)—T. roseum; (c)—F. equiseti; subscript 1 represents damage inoculation, and subscript 2 represents spray inoculation).
Horticulturae 09 01019 g003
Figure 4. Effects of different carbon sources on the growth and sporulation of the three fungi ((a)—P. polonicum; (b)—T. roseum; (c)—F. equiseti. Different lowercase letters indicate a significant difference (p < 0.05)).
Horticulturae 09 01019 g004
Figure 5. Effects of different nitrogen sources on the growth and sporulation of the three fungi ((a)—P. polonicum; (b)—T. roseum; (c)—F. equiseti. Different lowercase letters indicate a significant difference (p < 0.05)).
Horticulturae 09 01019 g005
Figure 6. Effect of the fungi on the total carbohydrate (a), total flavonoid (b), total saponin (c), calycosin-7-O-β-glycoside (d), and Astragaloside IV (e) contents of the RA (K—control group; A—P. polonicum-infected group; B—T. roseum-infected group; C—F. equiseti-infected group. Different lowercase letters indicate a significant difference (p < 0.05)).
Horticulturae 09 01019 g006
Table 1. Effects of temperature, pH, and light on the mycelial growth and sporulation of the isolated P. polonicum, T. roseum, and F. equiseti.
Culture ConditionsP. polonicumT. roseumF. equiseti
Colony
Diameter (mm)
Spore
Production (×107/mL)
Colony Diameter (mm)Spore Production (×107/mL)Colony Diameter (mm)Spore Production (×107/mL)
Temperature (°C)1528.33 ± 0.58 b46.7 ± 1.52 d42.33 ± 0.58 c1.33 ± 0.06 d0.00 ± 0.00 e0.00 ± 0.00 c
2029.00 ± 1.00 b61.50 ± 1.73 c53.00 ± 1.80 b15.8 ± 0.75 b47.67 ± 2.08 c29.98 ± 3.93 b
2534.67 ± 0.58 a87.00 ± 3.00 a64.67 ± 2.08 a19.8 ± 2.27 a66.17 ± 0.58 a42.42 ± 5.39 a
3021.67 ± 0.58 c79.00 ± 2.84 b44.67 ± 0.58 c4.67 ± 0.61 c57.17 ± 0.76 b29.58 ± 5.64 b
359.50 ± 0.50 d0.50 ± 0.10 e13.00 ± 1.00 d2.13 ± 0.21 d13.70 ± 1.20 d4.25 ± 0.08 c
pH525.50 ± 0.71 d39.40 ± 0.32 d68.50 ± 0.50 b8.67 ± 0.50 b68.67 ± 1.44 b51.60 ± 4.80 b
627.50 ± 0.71 c52.40 ± 0.96 c77.00 ± 0.50 a11.47 ± 1.00 a71.00 ± 0.87 a64.27 ± 2.80 a
730.00 ± 0.00 ab84.70 ± 2.70 a66.67 ± 0.29 b6.53 ± 0.69 c62.33 ± 1.15 c50.83 ± 3.33 b
830.75 ± 0.35 a67.50 ± 0.64 b60.00 ± 0.50 c5.93 ± 0.70 c59.50 ± 0.50 d40.67 ± 2.10 c
928.75 ± 0.35 bc64.80 ± 1.91 b56.83 ± 3.33 d5.33 ± 0.57 cd54.50 ± 0.50 e22.50 ± 0.87 d
1127.50 ± 0.71 c54.80 ± 3.34 c53.67 ± 0.76 e4.07 ± 0.30 d48.33 ± 0.29 f8.40 ± 0.60 e
Light
condition
Full illumination30.47 ± 0.35 b50.83 ± 0.76 c54.92 ± 0.72 c8.25 ± 0.25 c57.47 ± 0.45 c33.33 ± 1.91 c
12 h light/12 h dark31.70 ± 0.62 b53.70 ± 0.26 b56.75 ± 1.25 b12.67 ± 1.37 b59.47 ± 0.45 b40.42 ± 0.72 b
Total darkness35.75 ± 0.79 a65.37 ± 0.35 a61.25 ± 1.25 a15.58 ± 0.14 a65.47 ± 0.50 a50.00 ± 1.25 a
Annotation: The colony diameter and sporulation columns present the statistical results for P. polonicum and T. roseum cultured for 7 days and F. equiseti cultured for 5 days; each datum is the average of three replicate values. Different lowercase letters indicate a significant difference (p < 0.05).
Disclaimer/Publisher’s Note: The statements, opinions and data contained in all publications are solely those of the individual author(s) and contributor(s) and not of MDPI and/or the editor(s). MDPI and/or the editor(s) disclaim responsibility for any injury to people or property resulting from any ideas, methods, instructions or products referred to in the content.

