Article

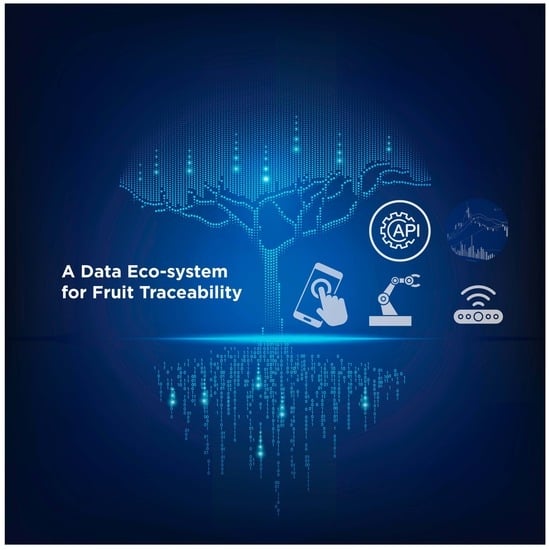
A Data Ecosystem for Orchard Research and Early Fruit Traceability

by
Stephen Ross Williams
,
Arbind Agrahari Baniya
,
Muhammad Sirajul Islam
* and
Kieran Murphy
AgriBio, Agriculture Victoria Research, Bundoora, VIC 3083, Australia
*
Author to whom correspondence should be addressed.
Horticulturae 2023, 9(9), 1013; https://doi.org/10.3390/horticulturae9091013
Submission received: 26 June 2023 / Revised: 24 August 2023 / Accepted: 4 September 2023 / Published: 8 September 2023

Abstract

:
Advances in measurement systems and technologies are being avidly taken up in perennial tree crop research and industry applications. However, there is a lack of a standard model to support streamlined management and integration of the data generated from advanced measurement systems used in tree crop research. Furthermore, the rapid expansion in the diversity and volumes of data is increasingly highlighting the requirement for a comprehensive data model and an ecosystem for efficient orchard management and decision-making. This research focuses on the design and implementation of a novel proof-of-concept data ecosystem that enables improved data storage, management, integration, processing, analysis, and usage. Contemporary technologies proliferating in other sectors but that have had limited adoption in agricultural research have been incorporated into the model. The core of the proposed solution is a service-oriented API-driven system coupled with a standard-based digital orchard model. Applying this solution in Agriculture Victoria’s Tatura tree crop research farm (the Tatura SmartFarm) has significantly reduced overheads in research data management, enhanced analysis, and improved data resolution. This is demonstrated by the preliminary results presented for in-orchard and postharvest data collection applications. The data ecosystem developed as part of this research also establishes a foundation for early fruit traceability across industry and research.

Graphical Abstract

1. Overview

The adoption of new techniques, such as advanced measurement and record-keeping technologies, has played a crucial role in achieving continuous improvement in perennial horticulture research and the industry. The utilisation of contemporary measurement systems results in significant data volumes, often diverse and complex in nature. This leads to a growing need to manage, integrate, analyse, publish, and re-use the generated data more effectively. Interviews with a wide spectrum of researchers within the organisation found that a significant proportion of project resources is expended on data-related activities. With the increasing diversity and volumes of research data, this condition is likely to worsen. While advancements in other sectors have the potential to address these issues, agricultural researchers still tend to use legacy tools.
A potential solution is to apply new research data management (RDM) approaches to generate a comprehensive ecosystem for orchard data in research projects that can also provide examples for industry adoption. These new RDM approaches are required to support the widely accepted FAIR (findable, accessible, interoperable, and re-usable) data principles [1,2] in the various fields of agricultural research. To address these emerging gaps and requirements, this work utilises standards such as the ISO observations and measurements (O&M) standard [3] and its associated standard SensorML [4], particularly to organise raw measurement data. The standardised measurement data, when linked with orchard design and events, will enable the development of a digital twin for the orchard [5,6,7], providing a framework to associate experimental design, analytics, and project data holistically. Furthermore, it fosters the efficient re-use of established orchards for new studies, enabling meta-analysis across experiments. The definition or resolution of orchard features within the proposed digital model is scalable, allowing precise data collection and, for a commercial setting, the potential enhancement in detail for recording inputs and production reporting.

2. Background

2.1. Agriculture Victoria Research

Pioneering contemporary practices and advanced technology applications, Agriculture Victoria Research (AVR) is incrementally developing an innovation ecosystem to bring together clusters of collaborative networks between government, industry, and academia to deliver cutting-edge innovation and research to profit fast-tracked applications of emerging technologies for agriculture industries in Victoria, Australia and beyond. SmartFarms in five key regional centres dispersed strategically across Victoria are critical infrastructure to AVR’s innovation ecosystem. Among these five, the Tatura SmartFarm located in Goulburn Valley, is a leader in horticulture research. The Tatura SmartFarm facilitates collaborations between communities of practice and interest for sensorised data collection and data-driven efficiency improvements in stone fruit and pome fruit orchards. A substantial number of experiments are underway at the Tatura SmartFarm, which have participated in helping identify current practices and needs for research projects as part of this work.

2.2. RDM and FAIR Principles

Recent reviews of RDM in agricultural science indicate that researchers have been slow to adopt both FAIR principles [8] and newer technologies [9]. These adaptations are important in enabling machine-oriented approaches both in research and agricultural industries. Our experience in Australia, including in AVR, is that many horticultural researchers and groups still tend to use traditional manual or semi-automated approaches to store, manage, and manipulate their data. Additionally, there is a tendency for the research community and its reviewers to regard each project and experimental data as a single resource that comprises a mixed assembly or collection of information and data objects of various types. This is illustrated in approaches such as the DataCite schema [10]. Approaches to organise and standardise research data better will enable integration with new technologies and support FAIR principles. For plant-based research, the focus needs to be expanded from improving data collection to developing the models and means for enhancing data management, integration, and analysis [11].
To adequately capture the full spectrum of data, metadata about the configuration and parameterisation of modelling and analytical processes need to be collected. Additionally, the details of the algorithms and models utilised for the analysis and generation of data products also need to be combined. Any other pertinent data and information required to repeat data processes must also be captured and managed. This is essential to support research reproducibility, meta-analysis [12], data integration, and comparative analysis underpinning science collaboration [13]. At present, the summary of an experiment’s data and its description are only recorded in the associated peer-reviewed papers and/or the catalogues and registers where the data is published. While this especially supports the findability component in the FAIR principles, enhanced RDM solutions are required to support the FAIR principles for horticultural research.
The current data practice creates a perceived bias where the application of FAIR principles tends to be addressed as part of a data curation phase after completion of the research rather than during its planning and execution. However, the research community is increasingly evolving towards much richer and more nuanced implementations, and these newer approaches emphasise the need to use persistent globally unique identifiers (GUIDs) and richer metadata to specifically describe the detailed data [14].

2.3. Data Standards and Integration

The newer RDM approaches are built on research data linkage and integration that ideally utilise streamlined services. One of the associated issues is the often unappreciated scale of the cost to implement what is required to not only enable data linkage but also support services to achieve FAIR data [15]. It can be difficult to judge and establish a sufficiently rich level of contextual or metadata to support the integration and re-use of complex data assets [16]. The use of data standards to guide the collection, analysis, and aggregation of data is essential, but standards can be applied at different scales for different purposes and influenced by assumptions and theories [17]. However, if used appropriately, a data standard provides an efficient way to foster data consistency and describe data to support the consolidation, harmonisation, and integration of data for analysis (or to identify differences to be accounted for in analyses). Additionally, the use of ontologies or standardised vocabularies (common data coding schemes) is a key component of a data standard. Together with data-sharing policies and other institutional factors, these elements create the potential for data integration and provide the foundation for data services.
The use of temporal and spatial data tags provides common referential frameworks to enable linkages via data association. Using universally unique identifiers (UUID) or GUIDs [18] supports explicit data linkages, which are both persistent and do not require a centralised authority for their creation. This facilitates their use as a universal resource name (URN), and when combined with a universal resource locator (URL), this supports data services that can be persistent and citable.
The foundation features in a digital twin of an experimental or commercial orchard are inherently spatial, so the support for data linkage and integration will naturally be achieved via solutions that combine spatial data and the use of unique identifiers. Where tree crops are potentially long-lived (such as pome fruit), then the identifiers associated with the orchard features can be utilised for successive experiments. Where trees have a shorter life (such as stone fruit), spatial and temporal tagging of features can support data association and analysis across experiments.
While some service-oriented solutions in the research community are implemented in association with newer measurement systems, these tend to operate discretely with little support for integration with other services and data. The authors have yet to see a fully integrated service-oriented data solution deployed for operational research in horticulture. There is a suite of existing services that are centred around research data archives and repositories, but these do not directly benefit research operations as the data is lodged after research is completed. If automated services are implemented during the delivery of research, there are significant opportunities for efficiency gains. These mainly accrue by streamlining data capture and handling, supporting more comprehensive capture of research metadata (to support data re-use and science reproducibility), and improving all-around data accessibility. Additionally, service-oriented approaches can be extremely useful in addressing challenges associated with the burgeoning volumes of research data by enabling automated data quality assurance, data ingestion, and data integration. Finally, the development and publishing of data services can support collaboration, findability, and associated data exchanges more effectively.

2.4. Traceability

In the fresh fruit industry, the three most common applications of the term traceability are (a) the ability to determine provenance (point of origin being a more precise example), (b) the tracking and tracing of product movement, and (c) supply chain monitoring (fruit sample and environmental measurement and event recording in the context of production and supply). In this paper, traceability will be used to refer to the tracking and tracing of products from the production or orchard setting through to final consumption. Product identity and how this is assigned, preserved, and later evaluated are at the heart of traceability and fruit tracking.
For fruit, there are three types of identity: intrinsic, assigned, and inferred. Intrinsic identity cannot be disassociated from the product but may lack precision and be difficult, costly, or require destructive means to assess in fruit. Examples of intrinsic identity are DNA and chemical signatures such as isotopic profiles. Inferred identity is usually supported by spatial and temporal referencing of a product during its journey along its supply pathway. Spatial and temporal records taken at points in the journey of the product are used to link or form associations to data in other systems along the supply chain. As the product is not specifically identified, it must be inferred that it is present at each step in the supply chain based on analysis and linkage of associated data. If there is no continuous monitoring of the supply chain, departures or variations in supply chain events may not be detected. These issues and other assumptions can have negative impacts on the clarity, authority, and precision of product traceability. By far, the most common and currently effective means of supporting product traceability is to apply unique identifiers to carriers (i.e., labels or tags) on the product units (i.e., fruit packages).
Product traceability solutions can face different challenges and issues depending on the industry and characteristics of the product and its supply chain. In manufacturing industries, after a product is assembled, it can usually be labelled, identified, and traced and consequently, this is where the more advanced traceability systems currently exist. It is logical to leverage these solutions to address product traceability for fruit. In contrast, after production, a fruit product can go through a series of processing steps (aggregation, disaggregation, and mixing) before it is finally packaged into an identifiable product unit and labelled. For traceability purposes, it is only when fruit reaches this point that it becomes aligned to the manufacturing supply chain and those traceability approaches and systems. The current fruit handling and processing steps routinely produce a loss of resolution or gap in traceability because fruit in a bin is potentially harvested from multiple trees, and these bins are subsequently combined with others to create a processing batch. While the resultant fruit packages from the batch can be uniquely labelled and identified, they can almost always only be traced and identified to the processing batch. Depending on the rules used to form batches, this almost always means that the fruit can only be traced back to a tree block (For a large, well-organised orchard business in Australia, a tree block represents, on average, five hectares and perhaps 6000 trees, depending on planting density) in an orchard. Addressing this gap will enable the enhancement of fruit traceability for commercial operators.
Additionally, the use of fruit grading systems to collect research data on a whole crop basis, rather than using subsampling, can be supported with a precise connection back to individual trees or small research plots. AVR uses fruit grading technology augmented with additional sensors to obtain measurements for fruit derived from experimental features in research orchards. For researchers, a downside of adopting this approach is to substantially increase the volumes of data collected and add complexity to the associated workflows and RDM. Approaches to address these issues need to easily associate the identity of where the fruit came from (the tree, research plot, row, or other tree grouping) and automatically preserve this through subsequent workflows. For growers, solutions of this nature deliver fine-grain production reporting for a range of fruit parameters that can greatly inform orchard management, improve postharvest decisions, and deliver more profitable outcomes. This is a key objective of the research described in this paper.

3. Materials and Methods

3.1. Requirements Analysis

The research began at the start of the COVID-19 pandemic. This significantly impacted opportunities for researchers and especially industry engagement. Despite this, where possible, the initial landscape mapping of data management and traceability practices across the fresh fruit production and supply chain were undertaken through interviews and observations of the activities at commercial and research orchards and other processing and supply enterprises. Leading industry stakeholders from the apple, pear, cherry, and stone-fruit industries were individually interviewed to enable ideation and requirement specification for an identified orchard and traceability-related data and system needs. There had been substantial engagement with researchers prior to the research documented here, and this was leveraged in a series of early workshops. These were targeted to elucidate the types and methods of data collection within the research orchards.
A specific mix of workshops and one-on-one interviews were then conducted to gather the intel and requirements for mobile application development, current systems, and technologies and for the development of use cases. Workshops specifically targeting the requirements of the mobile applications were conducted by an independent technology partner as a first step in their development. Specific sessions were held for the investigation of technologies and systems already in place both within the orchards and associated with research operations, such as the Compac fruit grader system. Similar engagement sessions were undertaken with researchers and technology providers to support investigation and data gathering for the development of a new use case. Key researchers and technical staff were also funded on the project to facilitate ongoing input from researchers to maintain alignment and connection to the data ecosystem design, development, and delivery.

3.2. Conceptual Information Framework

An organisation framework for perennial tree research data and information was created to assist in the conceptualisation and design of the data ecosystem model and associated systems, as shown in Figure 1. In the model, all the primary measurements and observations occur at tier 1. Tier 2 contains all the data to describe the orchard, its features, and its management events. Features defined at tier 2, such as trees, were assembled to create the units (such as plots) that make up the experimental design. These experimental features, along with the details of the experimental treatments, sampling, and management that may be associated, are the core elements of tier 3. When data associations (linkages) are supported across tiers, the information in tiers 2 and 3 can be regarded as metadata for the measurement data at tier 1. Indeed, the data in tiers 2 and 3 provide the organising framework to support the processing and analysis that subsequently occurs at tier 4. At this tier, data includes details of (a) configuration and parameterisation of modelling and analytical processes, (b) details of the algorithms and models utilised, (c) the data products arising from the processing, analysis, and modelling, and (d) any other pertinent data and information that would be required to repeat data processes. Tier 5 tends to be descriptive and to have the same content as the peer-reviewed papers describing the research and the higher-level data description in a data catalogue. It represents a more skeletal description of the whole data stack and is particularly useful when published to introduce a research dataset for findability and to describe and support its access.
The development of the orchard data ecosystem was focused on the measurement data (tier 1), the orchard and event data (tier 2), and the experimental design data (tier 3).

3.3. Research Information Model and Backend Database Development

The technology platforms used to support the implementation of the information model were the ESRI ArcGIS Enterprise suite version 10.9.1 and Microsoft [19] SQL 12 as the foundation database platform. It was estimated that the amount of measurement data within a research season would be in the order of 1 million records and that the SQL server would easily accommodate this volume and support the relationships required for data integration. Although sensor-based data collection systems generate complex data, this is almost immediately processed to generate parameter estimates. The original scanned data is currently discarded. Consequently, only the parameter estimates require management and storage. If the original scans are retained in the future, then other data platforms such as graph databases and other big data solutions will be considered to augment the orchard data ecosystem.
The ISO 19156:2011 Observation and Measurements (O&M) standard [3] was used as a foundation to develop the information model and schema to support measurement data. The data structures to support early traceability for research purposes were designed to serve the purposes for industry-based fresh fruit traceability additionally. Standards-based data schema were developed to support the storage of event data. Furthermore, this component of the schema was informed by following the initiatives in record-keeping requirements containing key data elements (KDEs) associated with specific critical tracking events (CTEs) defined by the US FDA’s New Era of Smarter Food Safety Blueprint and Section 204 (d) of the FDA Food Safety Modernization Act (FSMA). However, the approach to schema design and associated semantics development was in the form of “lightweight semantics” to allow progress toward a form of pragmatic interoperability [19]. In this approach, there is a higher emphasis on the use of controlled lists and concepts rather than ontology development (which will be progressed in the future). Any comprehensive extension of the schema to support traceability events and data beyond the initial production and fruit processing settings was not undertaken.
A high-level conceptual diagram of the combined elements of the orchard information model developed is shown in Figure 2. This consists of a two-level spatial description of orchard features (see dark grey diagram components). At the first and mandatory level, all orchard features are georeferenced to a point, which is the feature centroid. The orchard feature concept aligns with the feature concept in the observations and measurements standard but is quite broad in application in the orchard data ecosystem. A feature may be any physical feature within an orchard. These features can range in scale from a fruit or tree branch to an orchard block. A wide range of other nonproduction features, such as sensors, weather stations, pest traps, and irrigation points, can also be orchard features.
A GUID assigned to each feature point becomes the identifier associated with any of its descriptive information or the measurements taken on the feature. Thus, these features become the data collection and integration points for the orchard. A feature can also overlap with others. For example, trees can be features, but so can the research plot where they are members. Both are supported because some measurements and observations may be taken on individual trees while others may be taken on a plot basis. Additionally, a feature may have information stored referring to other features, i.e., a tree may have a plot number in one of its associated information records. In combination, this flexible approach allows data to be collected at multiple scales against different assemblies of orchard features. This is useful as different researchers and experiments may require different sampling and orchard feature assemblies. This design allows these multiple approaches to be supported in the same information model. To better support future experiments, we have registered every tree as a feature in the experimental orchard, thereby providing a basement for the assembly of other features. A second, more complex level of spatial information that is not mandatory may also be collected to describe a feature more precisely. This expands the support for analytics and visualisation.
At a higher level, two approaches are taken to record locations. In a separate part of the information model, specific coordinates are stored to register the general location of orchards and experiments. These and other locations and contexts along the production and supply chain are also assigned a GS1 global location number (GLN) [20] to enable them to be identified worldwide. GLNs are not inherently unique like a GUID, but because they are created under controlled conditions and supported by a lookup-style authentication service, they are, for all intents and purposes, unique. A simple model is used to support controlled access to data and functionality within the system. This is shown in Figure 3.
In this model, users can be assigned to a location (alternatively, a research context such as an experiment) where they are also assigned a role. They can also be assigned an overarching role that is independent of a location. At this point, only two roles are established in the system, namely a “researcher” or “grower”. As the system evolves, other roles will be created, particularly aligned with other parts of the supply chain. These relationships can be leveraged by services and applications to control access and entry of data.
The proof-of-concept implementation of the research data ecosystem solution is focused on the sundial research orchard at Tatura, Victoria. All trees within the orchards have been registered as orchard features with an associated spatial point with an accuracy greater than 0.5 m. Each tree has a GUID that has been written on an NFC tag and affixed to the trunk at a height of approximately 1.0 m. Where trellis systems have multiple arms (such as with the Tatura trellis [21]), an additional tag (with a duplicate of the GUID) has been placed so that both arms are tagged. This makes scanning the NFC tags easy from either side of trees. Overall, 1440 trees were tagged and registered as features for the proof-of-concept development. Three types of feature information records were created: (1) feature property records (descriptive properties of the feature), (2) feature research-related records (details of experimental treatment and design), and (3) feature event records (details of events associated with the features). Examples of feature property records are crop type, tree variety, and row number. Examples of feature research records are plot number, rootstock, training system, and tree spacing. Examples of feature events are spraying, bee pollination, pruning, and blossom bursts. Some of these examples may be interchangeable when a basic feature property in one experiment is part of the experimental design in another.
The coding schemes for feature information and feature measurements are registered in a metadata table or data dictionary. This is a common list of accepted items of information and measurement that are supported in the solution. New measurements can be added, and associated services and applications are designed to accommodate these additions automatically. There is a suite of additional metadata that is captured as part of registering the new information or measurement. An example of this is a flag to identify which role can interact with the new type of data. If a type of measurement is potentially supported by one or more devices, then this can also be specified. New devices can also be registered in the information model along with data to support the automation of their connection and use within applications. When new data is submitted, it is lodged in interim data structures. Consequently, the ingestion and data integration processes can be staged, allowing quality assurance and processing scripts to be applied before the data is committed into the final data model.

3.4. Service Design and Development

A component-based information system with an application programming interface (API) service-oriented architecture was developed to allow open approaches to seamless data capture, storage, and consumption. REST APIs were created using the ESRI technology and published using AVR on-premises research infrastructure. These internal services were then externally published using the whole of Victorian government (WoVG) API gateway. This approach provides additional opportunities to secure, control, refine, and customise the published services, facilitating their development for both public and private consumption. This service orientation enabled multiple applications to be independently developed to integrate with the common service suite. This simplified the engagement of third-party developers by allowing the focus to be on application development rather than the services and backend solutions.
The development of the API services is aligned with the orchard information model with additional services to support early traceability. In all, thirteen API services were designed, developed, and published through the Victorian Government API gateway. These are listed in Table 1 below.
These services are consumed by applications and are divided into functional groups to support (a) user registration and authentication, (b) access to less volatile orchard information, (c) access and submission of orchard and fruit-related data, and (d) traceability related data access and submission. The API services automate the exchanges that deliver the integration and fusion of the data across the tiers in the organizational framework for research project data.

3.5. Solution Architecture and Application Development

The scoped requirements were then translated to the development of a data ecosystem with two key foci—(i) a standards-based information model for capturing, processing, storing, and consuming production/product data, and (ii) a novel information system infrastructure to support this.
Modern labelling with QRCodes, near field communication (NFC) and radio frequency identification (RFID) technologies were used to enable the unique identification of production features and products and map their associations with events.
A component-based information system with service-oriented architecture was developed to deploy the information model and corresponding data storage and processing. API and native mobile applications were built as part of the solution implementation to allow seamless data capture, storage, and consumption. A geodatabase was created as part of the system to enable spatial and/or temporal data to be used as a data integration tool.
The user experience (UX) design and development paradigm were used to ensure the wholesome usability of the user interface (UI) and the overall mobile application. Rapid development iterations with feature-specific user tests and usability tests for the creation of user-centric applications were carried out in collaboration with technology partner Spatial Vision, Melbourne. These applications were developed either using the Ionic development platform [22] or Python scripts.
The proposed solution architecture for the orchard research data ecosystem incorporates several technologies and components that enable efficient data capture, management, and exchange. Here, we provide a detailed technical description of each component, as shown in Figure 4.
[Component 1] Core Backend\On-Premises Database Server: To serve as the core database management system, an on-premises database server is employed, utilising ESRI ArcGIS and an ArcSDE database with an SQL server as its underlying database storage platform. ESRI ArcGIS is a powerful geographic information system (GIS) software suite that enables the storage, analysis, and visualisation of spatial data, enabling each orchard feature to have a spatial component, enabling spatial data integration and analysis. The ArcSDE database, specifically designed for managing spatial data, ensures efficient storage and retrieval of geospatial information along with other feature attributes. Access and manipulation of data in the database are facilitated through RESTful API services published internally via the ESRI Portal, which provides a standardised interface to interact with the backend database. In addition to serving as the database for Agriculture Victoria, the on-premises backend server provides several further capabilities to support orchard research data management:
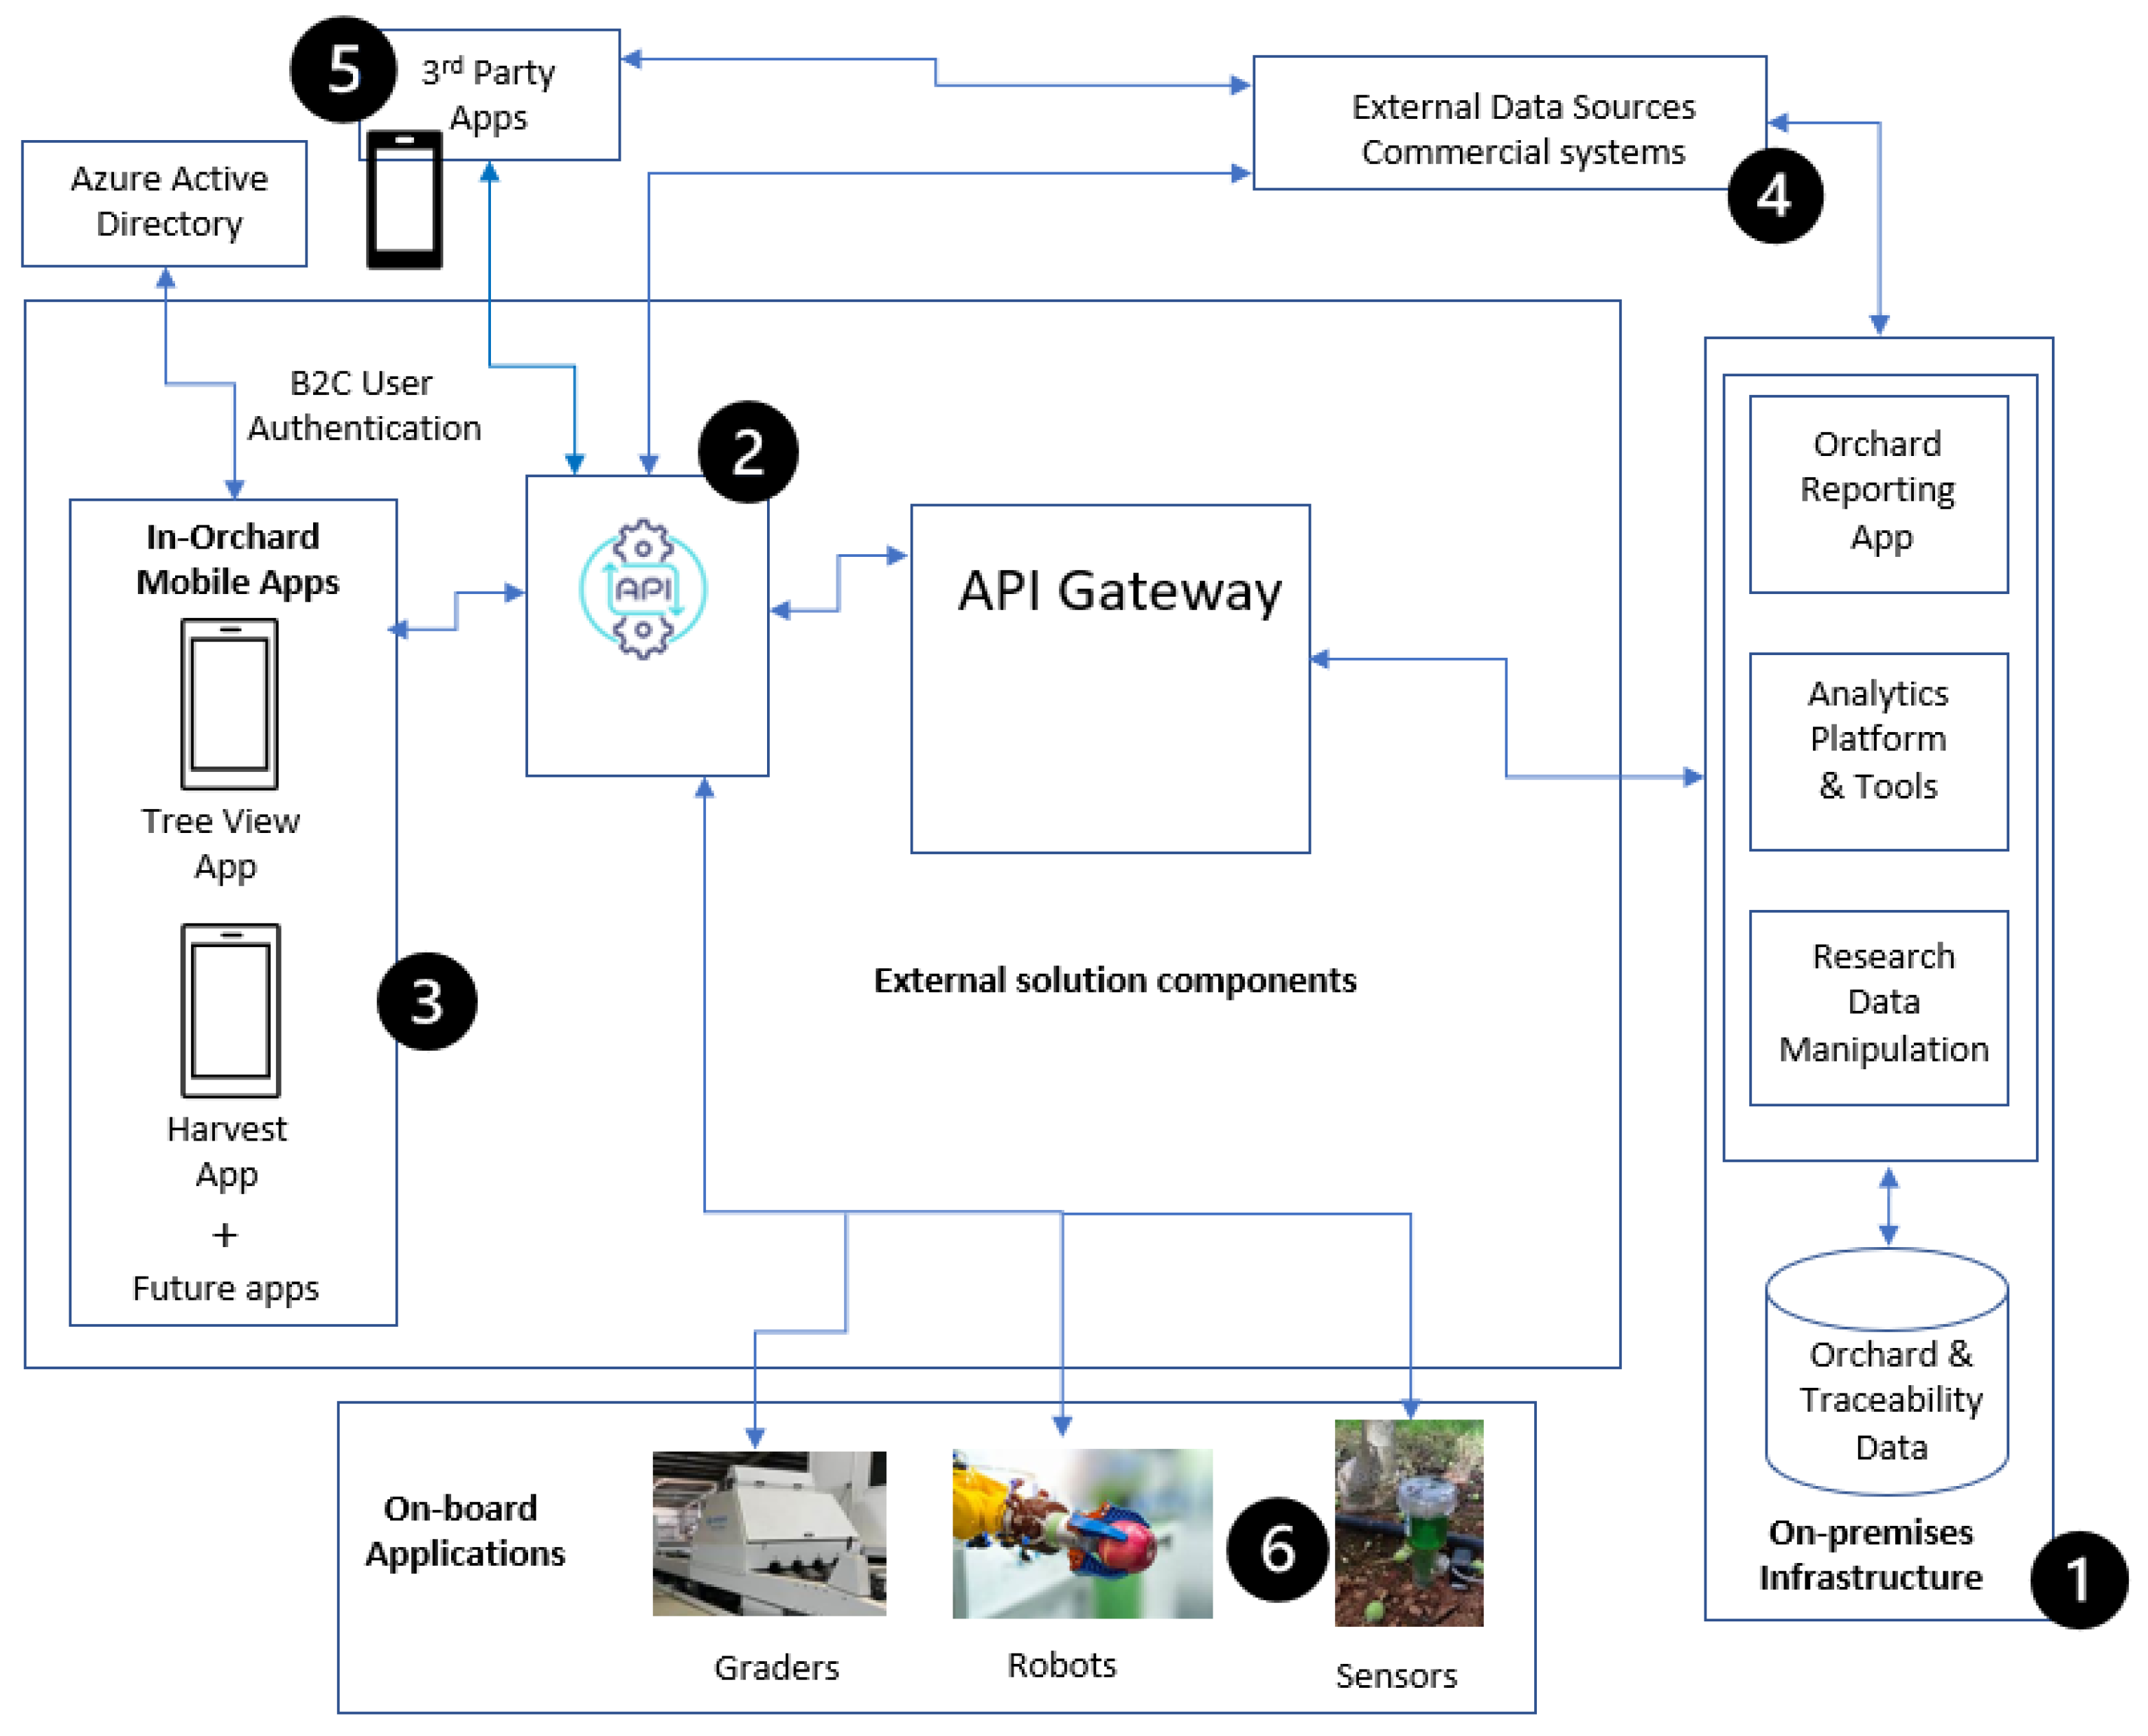
  • Orchard Reporting App: The database server includes an Orchard Reporting App, which leverages the stored data to generate comprehensive reports on various aspects of orchard research. The app utilises ESRI ArcGIS to visualise and analyse integrated, comprehensive data, allowing users to generate reports for any orchard features.
  • Analytics Platform and Tools: The database server incorporates an analytics platform that enables advanced data analysis and modelling. Leveraging tools such as ArcGIS Spatial Analyst and ArcGIS Geostatistical Analyst, users can perform statistical analysis, geospatial modelling, and predictive analytics on the orchard research and traceability data. The platform can support a range of analytical capabilities.
  • Research Data Manipulation: The on-premises database server provides functionalities for the efficient manipulation of research data. Researchers and administrators can perform data transformations, cleaning, and aggregation within the database environment. Advanced data manipulation techniques, such as querying, filtering, and joining, are supported to extract specific subsets of data for further analysis or reporting purposes.
[Component 2] API Services: Victoria’s Whole of Victorian Government API Service comprises a collection of public APIs that are meticulously managed using API Policy for authentication and authorisation. These APIs act as the primary means of interaction with the data ecosystem, allowing authorised users or applications to access and manipulate data. An API gateway is employed to facilitate communication and manage the flow of API requests. The API gateway interacts with internal backend REST APIs, ensuring seamless connectivity and interoperability across the systems. API Factory and MuleSoft tools are utilised to support the development and management of these APIs, enabling efficient creation, deployment, and monitoring of the services.
[Component 3] Front-End Mobile Apps: The front-end component provides a user-friendly interface for data interaction and includes two mobile applications: “Tree View” and “Tree Harvest”, with provisions for future app development. These mobile apps enable users to collect, view, and analyse orchard research data. User authentication within the apps is implemented using B2C authentication with Azure Active Directory. This approach ensures secure access to the data ecosystem, with Azure Active Directory handling user identity management and authentication processes.
[Component 4] External Data Sources (Commercial Systems): To enhance the capabilities of the data ecosystem, integration with external data sources, particularly commercial systems, is facilitated. This can be done either through the APIs developed in Component 2 or via the Agriculture Victoria backend described in Component 1 to enable seamless data exchange and interaction. By integrating with these external systems, the data ecosystem can leverage additional data sources, thereby enriching the analysis and research capabilities.
[Component 5] Third-Party Apps: Third-party applications can interact with the APIs developed in Component 3 to exchange data with the data ecosystem. These applications make use of the services exposed by the APIs, enabling them to integrate seamlessly with the system. This integration allows for data exchange and interoperability with external applications, fostering collaboration and expanding the broader potential applications of the orchard data.
[Component 6] Sensors and Robots: The data ecosystem is designed to accommodate various sensors and robots that capture data within the orchard context and beyond. These sensors and robots can interact with the APIs developed in Component 3 for data exchange. By leveraging the APIs, real-time data captured by the sensors and robots can be seamlessly integrated into the data ecosystem. This integration enables further analysis and processing of the collected data, contributing to the early fruit traceability goals of the system.
In conclusion, the proposed solution architecture harnesses a range of technologies, including ESRI ArcGIS, SQL Server, RESTful APIs, Azure Active Directory, and mobile applications, to create a comprehensive data ecosystem for orchard research data management. By incorporating on-premises databases, external data sources, third-party applications, and sensors/robots, the architecture supports early fruit traceability and facilitates advanced data analysis for decision support.

4. Results

The core components of the orchard data ecosystem were successfully established and tested. Although all the peripheral ecosystem elements and use cases described in the methodology have been designed, some of the specialised systems and workflows remain in various stages of completion. An example is the full systematisation of workflows for the Green Atlas Cartographer [23]. While these are developed, they have yet to be chained together in an application to completely automate data submission through the API services. Similarly, the integration with existing commercial systems, such as the Rubens handheld spectrophotometer [24], has been designed but procurement and scheduling needs have delayed development. Additionally, the automated data quality assurance and postprocessing built into the backend database platform has been implemented to the level of proof-of-concept. The substantial researcher engagement to establish all the business and quality assurance rules and postprocessing scripts has yet to be expanded to all the current data parameters. Those parameters that do not have these in place are currently automatically transferred from the ingestion area to their appropriate destinations in the data schema to enable access through the mobile applications.

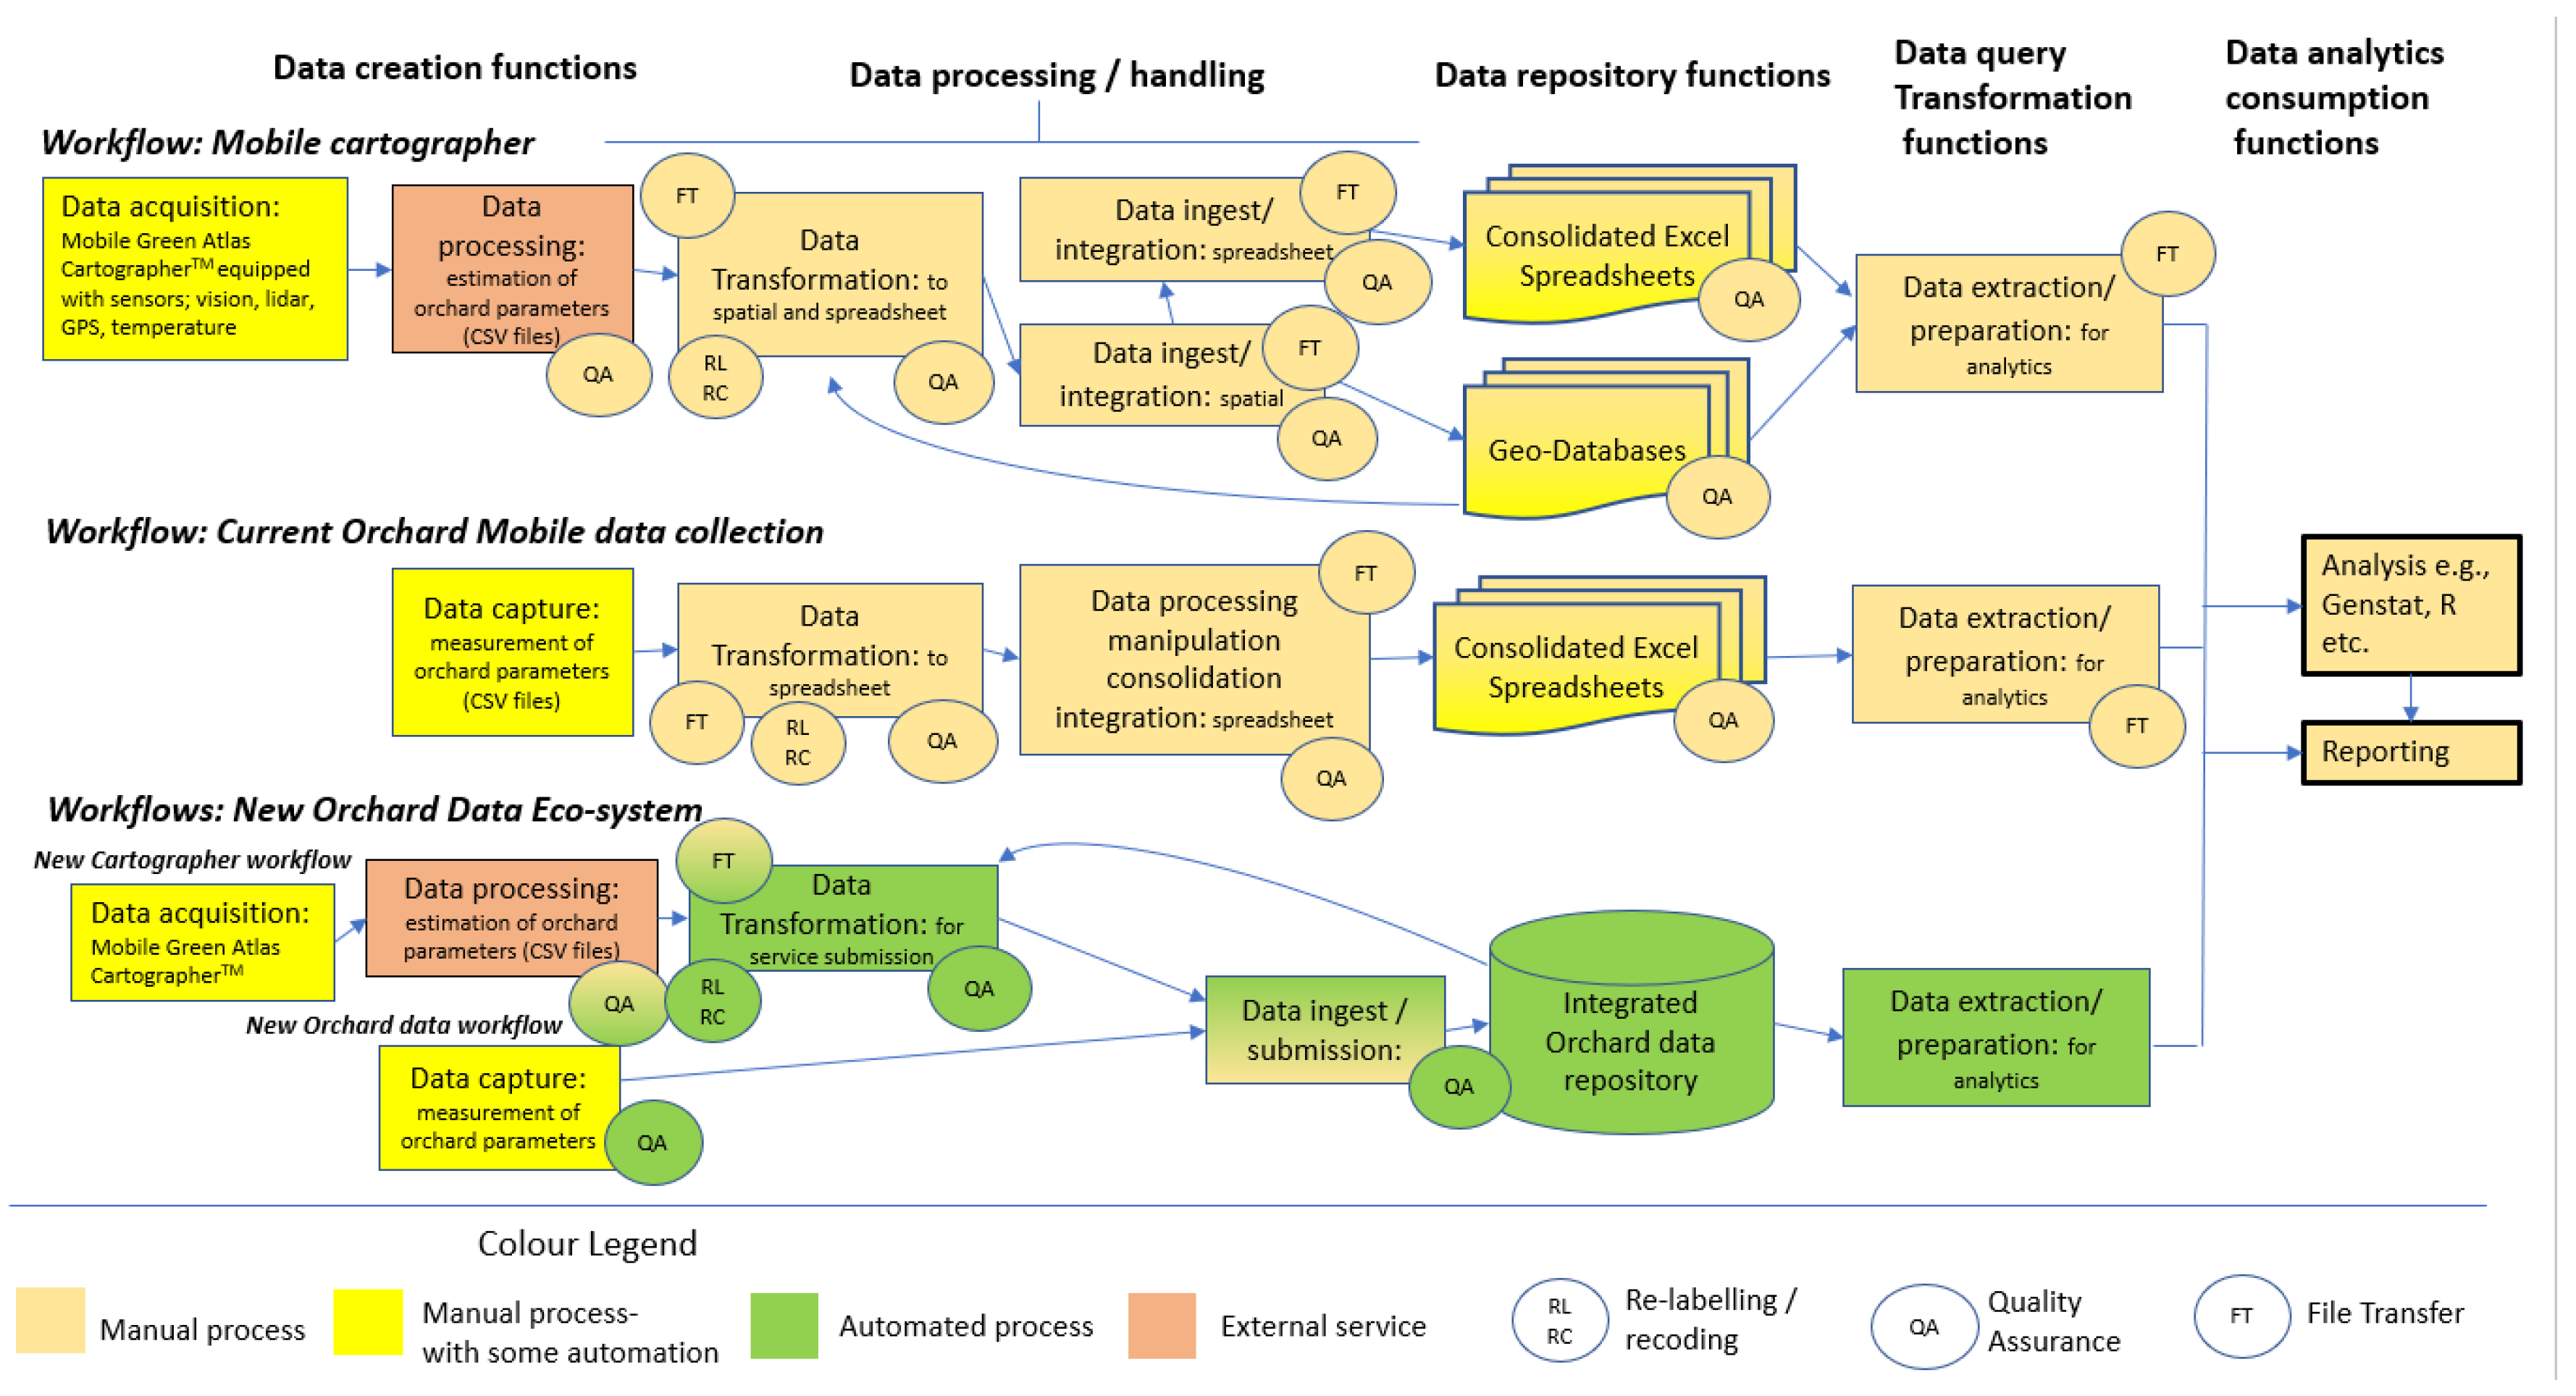
4.1. Ecosystem Model Evaluation

The development of the orchard data ecosystem began during the production season of 2021–2022 and hence was not ready for trial that season. A major hailstorm wiped out the crop in the subsequent 2022–2023 season. Consequently, while a comparison between legacy approaches to those facilitated by the data ecosystem could be accommodated, the performance of the solution under load during a full production and harvest season has yet to be evaluated. The comparative evaluation of the ecosystem model is broken into two parts. The first encompasses the spectrum of operations and workflows associated with data collection occurring for research and orchard management (within the orchard). The second evaluation component addresses a comparison of legacy approaches to those fostered by the data ecosystem for data related to fruit traceability with a focus on harvest and postharvest operations and data workflows.

4.1.1. In-Orchard Data collection

While some commercial systems are used for orchard monitoring data collection (such as orchard irrigation), the bulk of the legacy orchard data workflows use manual steps that vary with the researcher, experiment, and technology employed in measuring each parameter. Within an experiment, some of these steps may use standardised file templates and processing scripts. This results in a diverse array of data pathways that operate within the research orchards. To facilitate comparison, these can be summarised and contexed against a generalised data workflow with five functional groups. This is shown in Figure 5, where the functional groupings are depicted in bold text at the top of the diagram. For evaluation purposes, two legacy pathways are shown as well as the generic pathway for data handled by the data ecosystem. The uppermost legacy workflow is for the mobile cartographer. This represents a complex and sophisticated approach to data collection that is sensor-based and utilises a third-party image processing service. It is a mobile data collection platform that will see the addition of more measurement systems and increasing use in the future. The mobile workflow in the centre of the diagram represents the most common legacy pathway in use.
The associated mobile phone-based application is currently used by most researchers and experiments to initially collect orchard data. This data is stored on a memory card that is physically transferred, and then the data is copied and subjected to individualised manual relabeling, reformatting, and other data processing operations. The bottom workflow in the diagram is t the data ecosystem solution; it addresses and consolidates the functionality of both legacy pathways. The rectangular objects in the diagram represent stages or steps that are aligned to the functional areas in the diagram, while the operations in circular objects are more generic and can be applied at each step or stage in the workflow. All steps and operations that are manual in nature are represented as orange objects. Those that are manual but also have some codified processing are represented in yellow and those that are fully automated are green. The pink steps represent external services provided by a third party. An object that has dual colouring is one where there are parallel or alternate paths that have different support. An example is the data ingestion step in the data ecosystem workflow. This is automated, but the machine and rule-based quality assurance may detect records that are exceptions, and to address these currently requires human supervision, hence a manual process.
Analysis of effort expenditure indicated the data capture and acquisition steps in all workflows above take, on average, around 30 min to complete per capture event. In other words, this is unchanged between legacy workflows and those that utilise the data ecosystem. The major change is that the new orchard data ecosystem workflow can more flexibly and seamlessly be configured to support new types of parameter measurements. The external service component for the “cartographer” workflows is also largely unchanged for both the legacy and comparable data ecosystem workflows. In contrast, the subsequent steps for both legacy workflows take between an hour and an hour and a half of effort per collection event if there are no issues. The equivalent steps in the data ecosystem are fully automatic and take no effort if there are no issues identified in the automated quality assurance. This represents either the removal of effort or, where issues occur, its reduction by orders of magnitude. The elapsed time taken for the legacy workflows can be in the order of days or weeks as some of these steps may be delayed and undertaken after major periods of activity are completed, such as harvest. In contrast, the equivalent data ecosystem processes take seconds, delivering multiple orders of improvement.
The outcome of the repository functions for the legacy workflows are several collections of spreadsheets and spatial datasets, and while some consolidation is in place, the data lacks integration. In contrast, the data ecosystem features a fully integrated and consolidated data repository that is built around the digital twins of orchards. Consequently, the effort required to access and leverage data for analysis is conservatively at least an order of magnitude greater for the legacy solutions. Additionally, the fully functioning and current data repository allows previously captured data to be seen in the data ecosystem mobile data capture application when this is used in the orchard. Unlike the legacy approaches, this allows comparison and additional quality assurance of new data before submission.
While the removal of manual steps and the automation of quality assurance in the data ecosystem should result in a reduction of errors and improved data quality, this has not been objectively quantified. The data ecosystem will need to be trialed within a typical season of data collection in parallel to legacy processes to enable an objective comparison.

4.1.2. Postharvest and Traceability Data Collection

Ostensively, the primary purpose of the harvest mobile application is to create records that link fruit harvested into containers to the orchard features that produced them. This is the first product traceability step, and the solution here is a model for subsequent CTEs along the fresh fruit supply chain. For research and commercial purposes, the records created by the mobile application allow linkage to data that is subsequently created at the grader or any other setting where the container and its fruit persist. It also enables fine-grain production reporting for growers. The level of orchard feature definition and identification determines the level of this granularity.
The harvest data pathways utilising the grader to capture fruit assessment data are depicted in Figure 6, with the legacy pathway shown at the top of the diagram and that supported by the orchard data ecosystem below. The same symbolisation and colour coding used in Figure 5 is also employed for this diagram. Except for the actual harvest and transportation of fruit to the grader, all newly designed steps are almost fully automated. It is estimated that this will reduce effort considerably, and the removal of manual steps will reduce errors. Unfortunately, although the solution has been designed, some elements in the path are still under development, and there was no harvest this season. Consequently, a full evaluation of the orchard data ecosystem for supporting harvest and traceability was not possible.
The structure of the records generated in the application is shown in Figure 7. This represents a simple but standardised structure for exchanging traceability data. It is derived and highly simplified from the GS1 electronic product code information services (EPCIS) data model [25]. It features the use of parent and child GUIDs in this case to identify the orchard feature (parent) that is harvested and contributed fruit to the bin (child). This represents “instance-related identification”, which is a precise way of linking objects and events. The example in the diagram shows a record detailing how many of a picker’s bags of fruit from a tree (identified by its feature GUID) have been put into the container (identified by its container GUID).
There may be other records where the fruit from the same tree picked by the same picker is placed in a different container or where fruit from another tree is placed in the same container. Each scenario or “instance” will generate a separate record in the application. These records are submitted via the “createTraceabilityEvent” API service into a database table for processing. The ability to specify different “data names” and associated values allows for multiple records holding different data for the same traceability event. This allows the different data elements within the EPCIS model to be accommodated as required. The GS1 GLN is used to identify the location where the event occurs. In the future, this may be expanded to allow the use of geographic coordinates. The descriptive elements in the GS1 master data, such as the global trade item number (GTIN) [26], are not required in this simplified exchange standard as these are either already assigned to the parent and child objects in the backend database or alternatively inherited from parent to child. This requires both parent and child to be registered in the database (in this situation, unregistered children can be automatically registered). The data value “6” in Figure 7 represents the number of bags that have been harvested by the agent (picker). Records submitted from the application, when processed as a batch, can be transformed, and assembled into more complex records for ingestion into various parts of the backend data structures. The same approach can be taken for new applications to be developed further along the supply chain. Where an event is a process that applies solely to an object (such as the disinfection of a fruit pallet), then parent and child GUIDs can be identical.
Current research will deliver onboard analogues of this application for picking platforms and robotic harvesting. These are in development and intended for full automation. For the picking platform, a carefully placed RFID antenna will be used to identify RFID-tagged harvest zones and containers. The exchange records in Figure 7 will be automatically generated when a new harvest zone is entered, or a bin is filled. In this scenario, the agent identified in these records will be the team of pickers on the platform.

5. Discussion

By its nature, big data and meta-analysis currently focus on the final outputs of research (published material and associated data) but are hampered by a general lack of metadata and issues around data diversity and quality. This has had a profound influence on the recent developments in data science and the focus of research activities, with much attention on using “second data” as a key input for modern research. The data ecosystem described herein provides the data organisation, linkage, description, and support for data management to address these issues during research delivery, both for the benefit of the research and for the later re-use of data. Without solutions of this nature, it is difficult to leverage new data collection technologies and undertake effective analysis, and it is wickedly difficult to redress the data issues after the research is completed.
The development of the research data ecosystem to date has successfully focused on the basement tiers within the conceptual model, namely tiers 1 to 3. The applications and use cases that have progressed now enable the streamlined ingestion, fusion, and integration of most forms of data produced in tier 1 with the data in tiers 2 and 3. An important area of future development will be the addition of new services to support the rapid and easy creation of new digital orchards and to support improved management of the orchard features within these digital constructs. This would involve a new application that is used at planting that would harvest a geo-reference for the planting location, create a GUID, and register this through a new service in the backend. Depending on what machinery and support is involved during planting, this could be automated. The addition of this functionality to the ecosystem will substantially reduce the effort to create the orchard’s digital twin and make the advancements possible from the data ecosystem practicable to deploy to the industry. Additionally, the solution for proximal-sensed imagery requires spatial analysis and processing to establish linkages between the data derived from the scans and orchard features to enable effective ingestion and integration of the data. Although a standardised methodology for these processes has been established, its automation is under development. When completed, this will allow the rapid crop scanning associated with mobile platforms such as the cartographer to automatically feed into the orchard ecosystem. For research, the ongoing leverage of these processing models and associated workflows is essential to research reproducibility [27]. This aligns with the needs of tier 4. Establishing a standardised way of storing and managing processing models such as this will be a future area of research. This will be informed by approaches such as the journal Nature’s Protocolexchange [28] and the emerging code-sharing solutions and prototypes of interactive research notebooks [29]. While there are extant external solutions to address the needs of tier 5 [30], including online journals and project and data catalogues [31], the details of how the data ecosystem developed could or would interoperate with these systems need to be advanced. Given that the data ecosystem is service-oriented, with persistent and unique identifiers used throughout, it makes sense to publish its data assets as consumable services, whether for open discovery and access or to support specific collaborations. Due to the potential data richness and level of data integration, such services could be quite extensive and potentially fine-grained. It would be simpler to deliver this as a customised, stand-alone suite of services but better, although much more difficult, to align and build interoperability with emerging developments in RDM. This will require effort to build and extend a formalised ontology from existing efforts such as CGIAR [32,33] and others [34,35] to support the data ecosystem.
The current ecosystem is focused on research and fruit traceability within the Tatura orchards. AVR also undertakes experimental research on fruit performance and management along the supply chain. The next phase of work will extend the ecosystem to encompass data integration and research from settings further along the supply chain. This will require an expansion of the system functionality and data structures that support fruit traceability. Additional data feeds and associated systems and technologies will require integration. The ESRI GeoEvent server technology [36] will be utilised to accommodate some of these enhancements, particularly the spatial tracing of the product. Collaboration with an associated project, Bee2Tree, will also advance the functionality to support traceability and associated data linkages. The Bee2Tree project is designing a solution to enable exchanges of data between orchardists and apiarists to inform the coordination of chemical application and hive deployment and movement. This aligns with data collected at tier 1 that also informs the eco-credentials for fresh fruit production.

Author Contributions

Conceptualization, S.R.W. and A.A.B.; methodology, S.R.W.; software, S.R.W. and A.A.B.; validation, S.R.W.; formal analysis, S.R.W.; investigation, S.R.W. and K.M. and A.A.B.; resources, K.M and S.R.W.; data curation, S.R.W.; writing—original draft preparation, S.R.W.; writing—review and editing, S.R.W. and A.A.B. and M.S.I.; visualization, S.R.W. and A.A.B. and M.S.I.; supervision, S.R.W.; project administration, K.M.; funding acquisition, K.M. All authors have read and agreed to the published version of the manuscript.

Funding

This research was funded by the Department of Energy, Environment and Climate Action (DEECA) and its predecessors.

Data Availability Statement

Not applicable.

Acknowledgments

The authors wish to acknowledge the support of the policy group within Agriculture Victoria for funding the work and the support from the AVR horticultural researchers and technical staff at the Tatura Smart Farm. Special thanks are given to Mark O’Connell for his work in the delivery of the data ecosystem. Additionally, we thank and acknowledge David Hunter in systems support and Donald Cherry for helping with the population of the orchard data model.

Conflicts of Interest

The authors declare no conflict of interest. The funders had no role in the design of the study, in the collection, analyses, or interpretation of data, in the writing of the manuscript, or in the decision to publish the results.

References

  1. Wilkinson, M.D.; Dumontier, M.; Aalbersberg, I.J.; Appleton, G.; Axton, M.; Baak, A.; Blomberg, N.; Boiten, J.W.; da Silva Santos, L.B.; Bourne, P.E.; et al. The FAIR Guiding Principles for scientific data management and stewardship. Sci. Data 2016, 3, 160018. [Google Scholar] [CrossRef] [PubMed]
  2. Birkbeck, G.; Nagle, T.; Sammon, D. Challenges in research data management practices: A literature analysis. J. Decis. Syst. 2022, 31 (Suppl. S1), 153–167. [Google Scholar] [CrossRef]
  3. ISO 19156:2011; Geographic Information—Observations and Measurements. International Organization for Standardization: Geneva, Switzerland, 2011. [CrossRef]
  4. Botts, A.; Robin, A.; Hirschorn, E. OGC SensorML: Model and XML Encoding Standard; Open Geospatial Consortium Pub.: Arlington, TX, USA, 2020; Available online: http://docs.opengeospatial.org/is/12-000r2/12-000r2.html (accessed on 23 May 2023).
  5. Pylianidis, C.; Osinga, S.; Ioannis, N.; Athanasiadis, I.N. Introducing digital twins to agriculture. Comput. Electron. Agric. 2021, 184, 105942. [Google Scholar] [CrossRef]
  6. Moghadam, P.; Lowe, T.; Edwards, E.J. Digital Twin for the Future of Orchard Production Systems. Proceedings 2019, 36, 92. [Google Scholar] [CrossRef]
  7. Queensland Alliance for Agriculture and Food Innovation: ’Digital Twin’ Concept Boosts Food Production. Available online: https://qaafi.uq.edu.au/article/2021/07/digital-twin-concept-boosts-food-production (accessed on 23 May 2023).
  8. Ali, B.; Dahlhaus, P. The Role of FAIR Data towards Sustainable Agricultural Performance: A Systematic Literature Review. Agriculture 2022, 12, 309. [Google Scholar] [CrossRef]
  9. Senft, M.; Stahl, U.; Svoboda, N. Research data management in agricultural sciences in Germany: We are not yet where we want to be. PLoS ONE 2022, 17, e0274677. [Google Scholar] [CrossRef] [PubMed]
  10. DataCite Metadata Working Group. DataCite Metadata Schema Documentation for the Publication and Citation of Research Data and Other Research Outputs. Version 4.4; DataCite: Hannover, Germany, 2021. [Google Scholar] [CrossRef]
  11. Pommier, C.; Coppens, F.; Ćwiek-Kupczyńska, H.; Faria, D.; Beier, S.; Miguel, C.; Michotey, C.; D’anna, F.; Owen, S.; Gruden, K. Plant Science Data Integration, from Building Community Standards to Defining a Consistent Data Lifecycle. In Towards Responsible Plant Data Linkage: Data Challenges for Agricultural Research and Development; Williamson, H.F., Leonelli, S., Eds.; Springer: Cham, Switzerland, 2023. [Google Scholar] [CrossRef]
  12. Sura, A.; Muna, A.; Ali, E.H. Meta-Analysis for Agricultural Research (Review). Mesop. J. Agric. 2020, 48, 21–32. [Google Scholar]
  13. Dundore-Arias, J.P.; Eloe-Fadrosh, E.; Schriml, L.; Beattie, G.; Brennan, F.; Busby, P.; Calderon, R.; Castle, S.; Emerson, J.; Everhart, S.; et al. Community-Driven Metadata Standards for Agricultural Microbiome Research. Phytobiomes J. 2020, 4, 115–121. [Google Scholar] [CrossRef]
  14. Jacobsen, A.; de Miranda Azevedo, R.; Juty, N.; Batista, D.; Coles, S.; Cornet, R.; Courtot, M.; Crosas, M.; Dumontier, M.; Evelo, C.T.; et al. FAIR Principles: Interpretations and Implementation Considerations. Data Intell. 2020, 2, 10–29. [Google Scholar] [CrossRef]
  15. Rawlings, R.; Castells, N.; Glendining, M. Linking Legacies: Realising the Potential of the Rothamsted Long-Term Agricultural Experiments. In Towards Responsible Plant Data Linkage; Springer: Cham, Switzerland; University of Exeter: Exeter, UK, 2023; pp. 107–123. [Google Scholar]
  16. Rawlings, C.J.; Davey, R.P. From Farm to FAIR: The Trials of Linking and Sharing Wheat Research Data. In Towards Responsible Plant Data Linkage: Data Challenges for Agricultural Research and Development; Williamson, H.F., Leonelli, S., Eds.; Springer: Cham, Switzerland, 2023. [Google Scholar] [CrossRef]
  17. Radick, G. Theory-Ladenness as a Problem for Plant Data Linkage. In Towards Responsible Plant Data Linkage; Springer: Cham, Switzerland; University of Exeter: Exeter, UK, 2023; pp. 27–36. [Google Scholar]
  18. Leach, P.; Mealling, M.; Salz, R. A Universally Unique IDentifier (UUID) URN Namespace. Available online: https://www.researchgate.net/publication/215758035_A_Universally_Unique_IDentifier_UUID_URN_Namespace (accessed on 12 June 2023).
  19. Baker, T.; Whitehead, B.; Musker, R.; Keizer, J. Global agricultural concept space: Lightweight semantics for pragmatic interoperability. NPJ Sci. Food 2019, 3, 16. [Google Scholar] [CrossRef] [PubMed]
  20. GS1 Global Location Number. Available online: https://www.gs1au.org/what-we-do/standards/global-location-number-glna. (accessed on 4 June 2023).
  21. Chalmers, D.; van den Ende, B.; van Heek, L. Productivity and Mechanization of the Tatura Trellis Orchard1. HortScience 1978, 13, 517–521. [Google Scholar] [CrossRef]
  22. Ionic Framework. Available online: https://ionicframework.com/ (accessed on 12 June 2023).
  23. Islam, M.S.; Scalisi, A.; O’Connell, M.G.; Morton, P.; Scheding, S.; Underwood, J.; Goodwin, I. A Ground-based Platform for Reliable Estimates of Fruit Number, Size, and Color in Stone Fruit Orchards. HortTechnology 2022, 32, 510–522. [Google Scholar] [CrossRef]
  24. Scalisi, A.; Pelliccia, D.; O’Connell, M.G. Maturity Prediction in Yellow Peach (Prunus persica L.) Cultivars Using a Fluorescence Spectrometer. Sensors 2020, 20, 6555. [Google Scholar] [CrossRef] [PubMed]
  25. EPCIS and CBV Implementation Guideline Release 2.0. Available online: https://ref.gs1.org/guidelines/epcis-cbv/2.0.0/ (accessed on 14 June 2023).
  26. Global Trade Item Number (GTIN). Available online: https://www.gs1.org/standards/id-keys/gtin (accessed on 14 June 2023).
  27. Sileshi, G.W. Analytic transparency is key for reproducibility of agricultural research. CABI Agric. Biosci. 2023, 4, 2. [Google Scholar] [CrossRef]
  28. Protocolexchange. Available online: https://protocolexchange.researchsquare.com/ (accessed on 25 June 2023).
  29. Cadwallader, L.; Hrynaszkiewicz, I. A survey of researchers’ code sharing and code reuse practices, and assessment of interactive notebook prototypes. PeerJ 2022, 10, e13933. [Google Scholar] [CrossRef] [PubMed]
  30. Ehrlinger, L.; Schrott, J.; Melichar, M.; Kirchmayr, N.; Wöß, W. Data Catalogs: A Systematic Literature Review and Guidelines to Implementation. In Database and Expert Systems Applications—DEXA 2021 Workshops. DEXA 2021; Kotsis, G., Tjoa, A.M., Khalil, I., Moser, B., Mashkoor, A., Sametinger, J., Fensel, A., Martinez-Gil, J., Fischer, L., Czech, G., et al., Eds.; Communications in Computer and Information Science; Springer: Cham, Switzerland, 2021; Volume 1479. [Google Scholar] [CrossRef]
  31. Research Data Australia. Available online: https://researchdata.edu.au/ (accessed on 25 June 2023).
  32. CGIAR. Ontologies Most Used in Agriculture. Available online: https://bigdata.cgiar.org/ontologies-for-agriculture/ (accessed on 25 June 2023).
  33. Arnaud, E.; Laporte, M.A.; Kim, S.; Aubert, C.; Leonelli, S.; Miro, B.; Cooper, L.; Jaiswal, P.; Kruseman, G.; Shrestha, R.; et al. The Ontologies Community of Practice: A CGIAR Initiative for Big Data in Agrifood Systems. Patterns 2020, 1, 100105. [Google Scholar] [CrossRef] [PubMed]
  34. Roussey, C.; Soulignac, V.; Champomier, J.C.; Abt, V.; Chanet, J.-P. Ontologies in Agriculture. In Proceedings of the AgEng 2010, International Conference on Agricultural Engineering, Clermont-Ferrand, France, 6–8 September 2010. [Google Scholar]
  35. Aydin, S.; Aydin, M.N. Ontology-based data acquisition model development for agricultural open data platforms and implementation of OWL2MVC tool. Comput. Electron. Agric. 2020, 175, 105589. [Google Scholar] [CrossRef]
  36. ESRI GeoEvent Server. Available online: https://enterprise.arcgis.com/en/geoevent/ (accessed on 25 June 2023).
Figure 1. A tiered model or organisational framework for orchard research project data.
Horticulturae 09 01013 g001
Figure 2. Conceptual orchard and early traceability information model.
Horticulturae 09 01013 g002
Figure 3. Elements of the simple governance model developed.
Horticulturae 09 01013 g003
Figure 4. Orchard data ecosystem high-level architectural diagram.
Horticulturae 09 01013 g004
Figure 5. Comparison between existing orchard data collection and new ecosystem workflows.
Horticulturae 09 01013 g005
Figure 6. Comparison between existing orchard harvest/traceability data collection and new ecosystem workflows.
Horticulturae 09 01013 g006
Figure 7. Structure of the data exchange records supported by the Harvest application.
Horticulturae 09 01013 g007
Table 1. The suite of API services developed to support the research data ecosystem.
API ServiceBrief DescriptionFunctional Group
getUserInformationLookup user detailsUser management/governance
createUserInformationCreate new userUser management/governance
getOrchardsRegisteredToUserLookup experiments, orchards or locations registered to a userData access/governance
getOrchardFeatureInformationLookup information for a featureOrchard information
geFeaturetInformationNearbySpatial-enabled lookup of feature informationOrchard Information
createFeatureInformationAdd new feature informationOrchard Information
getFeatureMeasurementInformationGet measurements/observations taken on a featureOrchard observations & measurements
createFeatureMeasurementInformationSubmit new measurements/observations for a featureOrchard observations & measurements
getMeasurementsMetadataGet metadata for registered measurementsOrchard measurements
getDeviceDataGet metadata for registered measurement devicesMeasurement devices
getTraceableObjectLookup traceable objectTraceability
createTraceabilityEventSubmit a traceability dataTraceability
getMetadataDescribes the servicesAPI services
Disclaimer/Publisher’s Note: The statements, opinions and data contained in all publications are solely those of the individual author(s) and contributor(s) and not of MDPI and/or the editor(s). MDPI and/or the editor(s) disclaim responsibility for any injury to people or property resulting from any ideas, methods, instructions or products referred to in the content.

