Article

Occurrence of Wetness on the Fruit Surface Modeled Using Spatio-Temporal Temperature Data from Sweet Cherry Tree Canopies

by
Nicolas Tapia-Zapata
1,
Andreas Winkler
2 and
Manuela Zude-Sasse
1,*
1
Leibniz Institute for Agricultural Engineering and Bioeconomy (ATB), Max-Eyth-Allee 100, 14469 Potsdam, Germany
2
Teaching and Research Institute for Horticulture and Arboristics, Horticultural Research Station Muencheberg, Eberswalder Str. 84 i, 15374 Muencheberg, Germany
*
Author to whom correspondence should be addressed.
Horticulturae 2024, 10(7), 757; https://doi.org/10.3390/horticulturae10070757
Submission received: 31 May 2024 / Revised: 8 July 2024 / Accepted: 13 July 2024 / Published: 17 July 2024

Abstract

:
Typically, fruit cracking in sweet cherry is associated with the occurrence of free water at the fruit surface level due to direct (rain and fog) and indirect (cold exposure and dew) mechanisms. Recent advances in close range remote sensing have enabled the monitoring of the temperature distribution with high spatial resolution based on light detection and ranging (LiDAR) and thermal imaging. The fusion of LiDAR-derived geometric 3D point clouds and merged thermal data provides spatially resolved temperature data at the fruit level as LiDAR 4D point clouds. This paper aimed to investigate the thermal behavior of sweet cherry canopies using this new method with emphasis on the surface temperature of fruit around the dew point. Sweet cherry trees were stored in a cold chamber (6 °C) and subsequently scanned at different time intervals at room temperature. A total of 62 sweet cherry LiDAR 4D point clouds were identified. The estimated temperature distribution was validated by means of manual reference readings (n = 40), where average R 2 values of 0.70 and 0.94 were found for ideal and real scenarios, respectively. The canopy density was estimated using the ratio of the number of LiDAR points of fruit related to the canopy. The occurrence of wetness on the surface of sweet cherry was visually assessed and compared to an estimated dew point ( Y d e w ) index. At mean Y d e w of 1.17, no wetness was observed on the fruit surface. The canopy density ratio had a marginal impact on the thermal kinetics and the occurrence of wetness on the surface of sweet cherry in the slender spindle tree architecture. The modelling of fruit surface wetness based on estimated fruit temperature distribution can support ecophysiological studies on tree architectures considering resilience against climate change and in studies on physiological disorders of fruit.

1. Introduction

Increasing peaks and rapid changes in daily temperatures have been registered as a result of climate change, enhancing the risk of fruit damage in orchards. One of the most common weather-triggered physiological disorder in fruit production is the cracking of fruit tissue. Cracking is related to fruit physiology, genetics, and environmental conditions [1]. Specific cracking mechanisms and influencing factors can vary in different crops [2,3]. In sweet cherry, the prolonged presence of wetness on the surface of the fruit is the main driving force, influencing the splitting of the pericarp.
The cracking of sweet cherry fruit is a major problem in all growing regions where rainfall occurs shortly before or during the harvest season [4,5]. Harvesting becomes uneconomical if the amount of cracked fruit in an orchard exceeds 25% [6], as cracked fruit cannot be sold on the fresh market. Moreover, cracks on the surface of the fruit allow pathogens to enter, causing the fruit to rot. This rot can spread to neighboring, non-cracked fruit [5]. Typically, fruit start cracking at the stylar end or in the pedicel cavity [7,8]. In both regions, extended periods of surface wetness appear due to the presence of hanging water droplets at the stylar end and/or a puddle in the pedicel cavity [5]. Furthermore, cracking is a localized phenomenon. The duration of surface wetness, rather than the amount of water uptake, is responsible for cracking [9,10]. Recently, the mechanism of crack formation and elongation has been described in the “zipper model” [9,11,12]. Thereof, the main prerequisite for cracking is the presence of microcracks in the cuticular membrane (CM). These microcracks result from a highly strained CM and surface wetness [13,14]. The most effective method to reduce cracking is to prevent the fruit from getting wet by using rain shelters [5,15,16]. Rain shelters can prevent most fruit from cracking, resulting in less than 5% of fruit being damaged under the shelter [17]. However, contradictory, higher amounts of cracking have been observed occasionally under rain shelters or in greenhouses. Actually, fruit in areas without rain but with high humidity can crack, even if they never come into contact with rainwater. Potential water condensation on the surface of the fruit near the pedicel cavity or stylar end can lead to localized water uptake and subsequent cracking.
Thus, current endeavors are focusing on the development of new technological strategies to mitigate food loss due to climate-triggered physiological disorders. Close range remote sensing (CRRS) techniques allow for the collection of spatially resolved information in time series. For this purpose, light detection and ranging (LiDAR) has been widely used to analyze fruit trees in orchards. By means of LiDAR sensors, 3D point clouds can be obtained, providing geometric data of the tree canopy. From 3D point clouds, the leaf area, number of fruit, and size of the fruit can be calculated [18,19,20]. Moreover, multisensor integration algorithms have been developed to fuse multi-LiDAR data to investigate the pigment content of apples on a tree [21] and merge LiDAR with thermal imaging [22]. Merging 3D point clouds and thermal data results in temperature information of each point in the 3D point cloud seen by the thermal camera. As a result, such temperature-annotated 3D point clouds (LiDAR 4D point clouds) provide the temperature distribution of the canopy, including the particular surface temperature of fruits. Alternatively, investigating wetness on the surface of sweet cherry after rainfall by means of thermal–RGB sensing techniques as well as based on weather data has been investigated [23,24], enabling the analysis of the temperature distribution in 2D at a lower cost. In this work, the application of CRRS techniques for monitoring the temperature of sweet cherry was used to model the occurrence of wetness on the surface of the fruit due to water vapor condensation. Previously, the temperature kinetics of horticultural produce in storage and the water condensation on surface of fruits were obtained via established methods such as thermocouples and infrared thermometry. Such data have been used to determine heat or mass transfer coefficients, allowing for the modelling of condensation [25,26]. A methodology for predicting the wetness formation and permanence on the surface of fruits in trees has never been approached from the perspective of using CRRS. However, this is an important step for the development of more complex, integrated risk models to combat crack formation on sweet cherry and other fruits, thus minimizing food waste in the supply chain.
The objectives of this study were to (i) describe the spatial temperature change in sweet cherry canopies by means of LiDAR 4D point clouds, (ii) use the spatio-temporal thermal information to model the occurrence of wetness on the fruit surface, and (iii) evaluate the effect of canopy density, as given by presence of foliage and woody parts, on the spatio-temporal temperature distribution of the canopies.

2. Materials and Methods

2.1. Experimental Set-Up

Sweet cherry trees of the cultivar ‘Sweetheart’, grafted on ‘Gisela 3’ rootstock and planted in 2013, were grown individually in 65 L containers under a rain shelter covered with glass and surrounded by a wire mesh at Leibniz University in Hanover (lat. 52°27′ N, long. 09°84′ E). The substrate consisted of a custom mixture of 90% white peat and 10% cocopor. After over-night cold storage, each tree was placed at ambient temperature and canopies were scanned at different time intervals (Table 1). Additionally, the air temperature ( T a i r ) (°C) and relative humidity ( R H ) (%) were recorded at 5 min intervals using a mini datalogger (174H, Testo SE & Co., KGaA, Titisee-Neustadt, Germany). Dew point air temperature ( T d e w ) was calculated using psychrometric conversion (Equation (1)) according to [27].
T d e w = T a i r 100 R H 5

2.2. Canopy Scanning

Geometric information relating to the sweet cherry canopies (Prunus avium ‘Sweatheart’) was obtained by means of a 2D mobile LiDAR laser scanner (LRS-4000, Sick AG, Waldkirch, Germany) emitting at a wavelength of 905 nm with an angular resolution of 0.1667° and a 25 Hz scanning frequency. Additionally, temperature information was acquired using a thermal camera (A655sc, FLIR Systems Inc., Wilsonville, OR, USA) with a spatial resolution of 640 × 480 pixels and a thermal resolution of <0.05 °C. A lens (T198065, FLIR Systems INC., Wilsonville, OR, USA) with a focal length of 6.5 mm (diagonal 80°) was attached to the thermal camera. Both sensors were mounted on a tooth belt linear conveyor, recording at a 10 mm s−1 constant speed (Figure 1a). The canopies were scanned with the two systems simultaneously. The LiDAR sensor provided a 3D point cloud of each tree by recording vertical lines of the canopy, which were added to a 3D point cloud when moving the sensor along the canopy during the vertical scanning process. In parallel, the thermal camera recorded the temperature information as images, from which the same vertical lines were taken as in the case of LiDAR scanning. Through a protocol of intrinsic and extrinsic calibration using an active light bulb panel, the data of both sensors were merged, resulting in the annotation of each canopy point obtained by LiDAR sensor with the corresponding temperature measured using a thermal camera. The recording of the calibration algorithm and its application was previously described by a group at ATB [22]. Thus, temperature-annotated point clouds (LiDAR 4D point clouds) of the scanned canopies were obtained at each considered time after cooling.
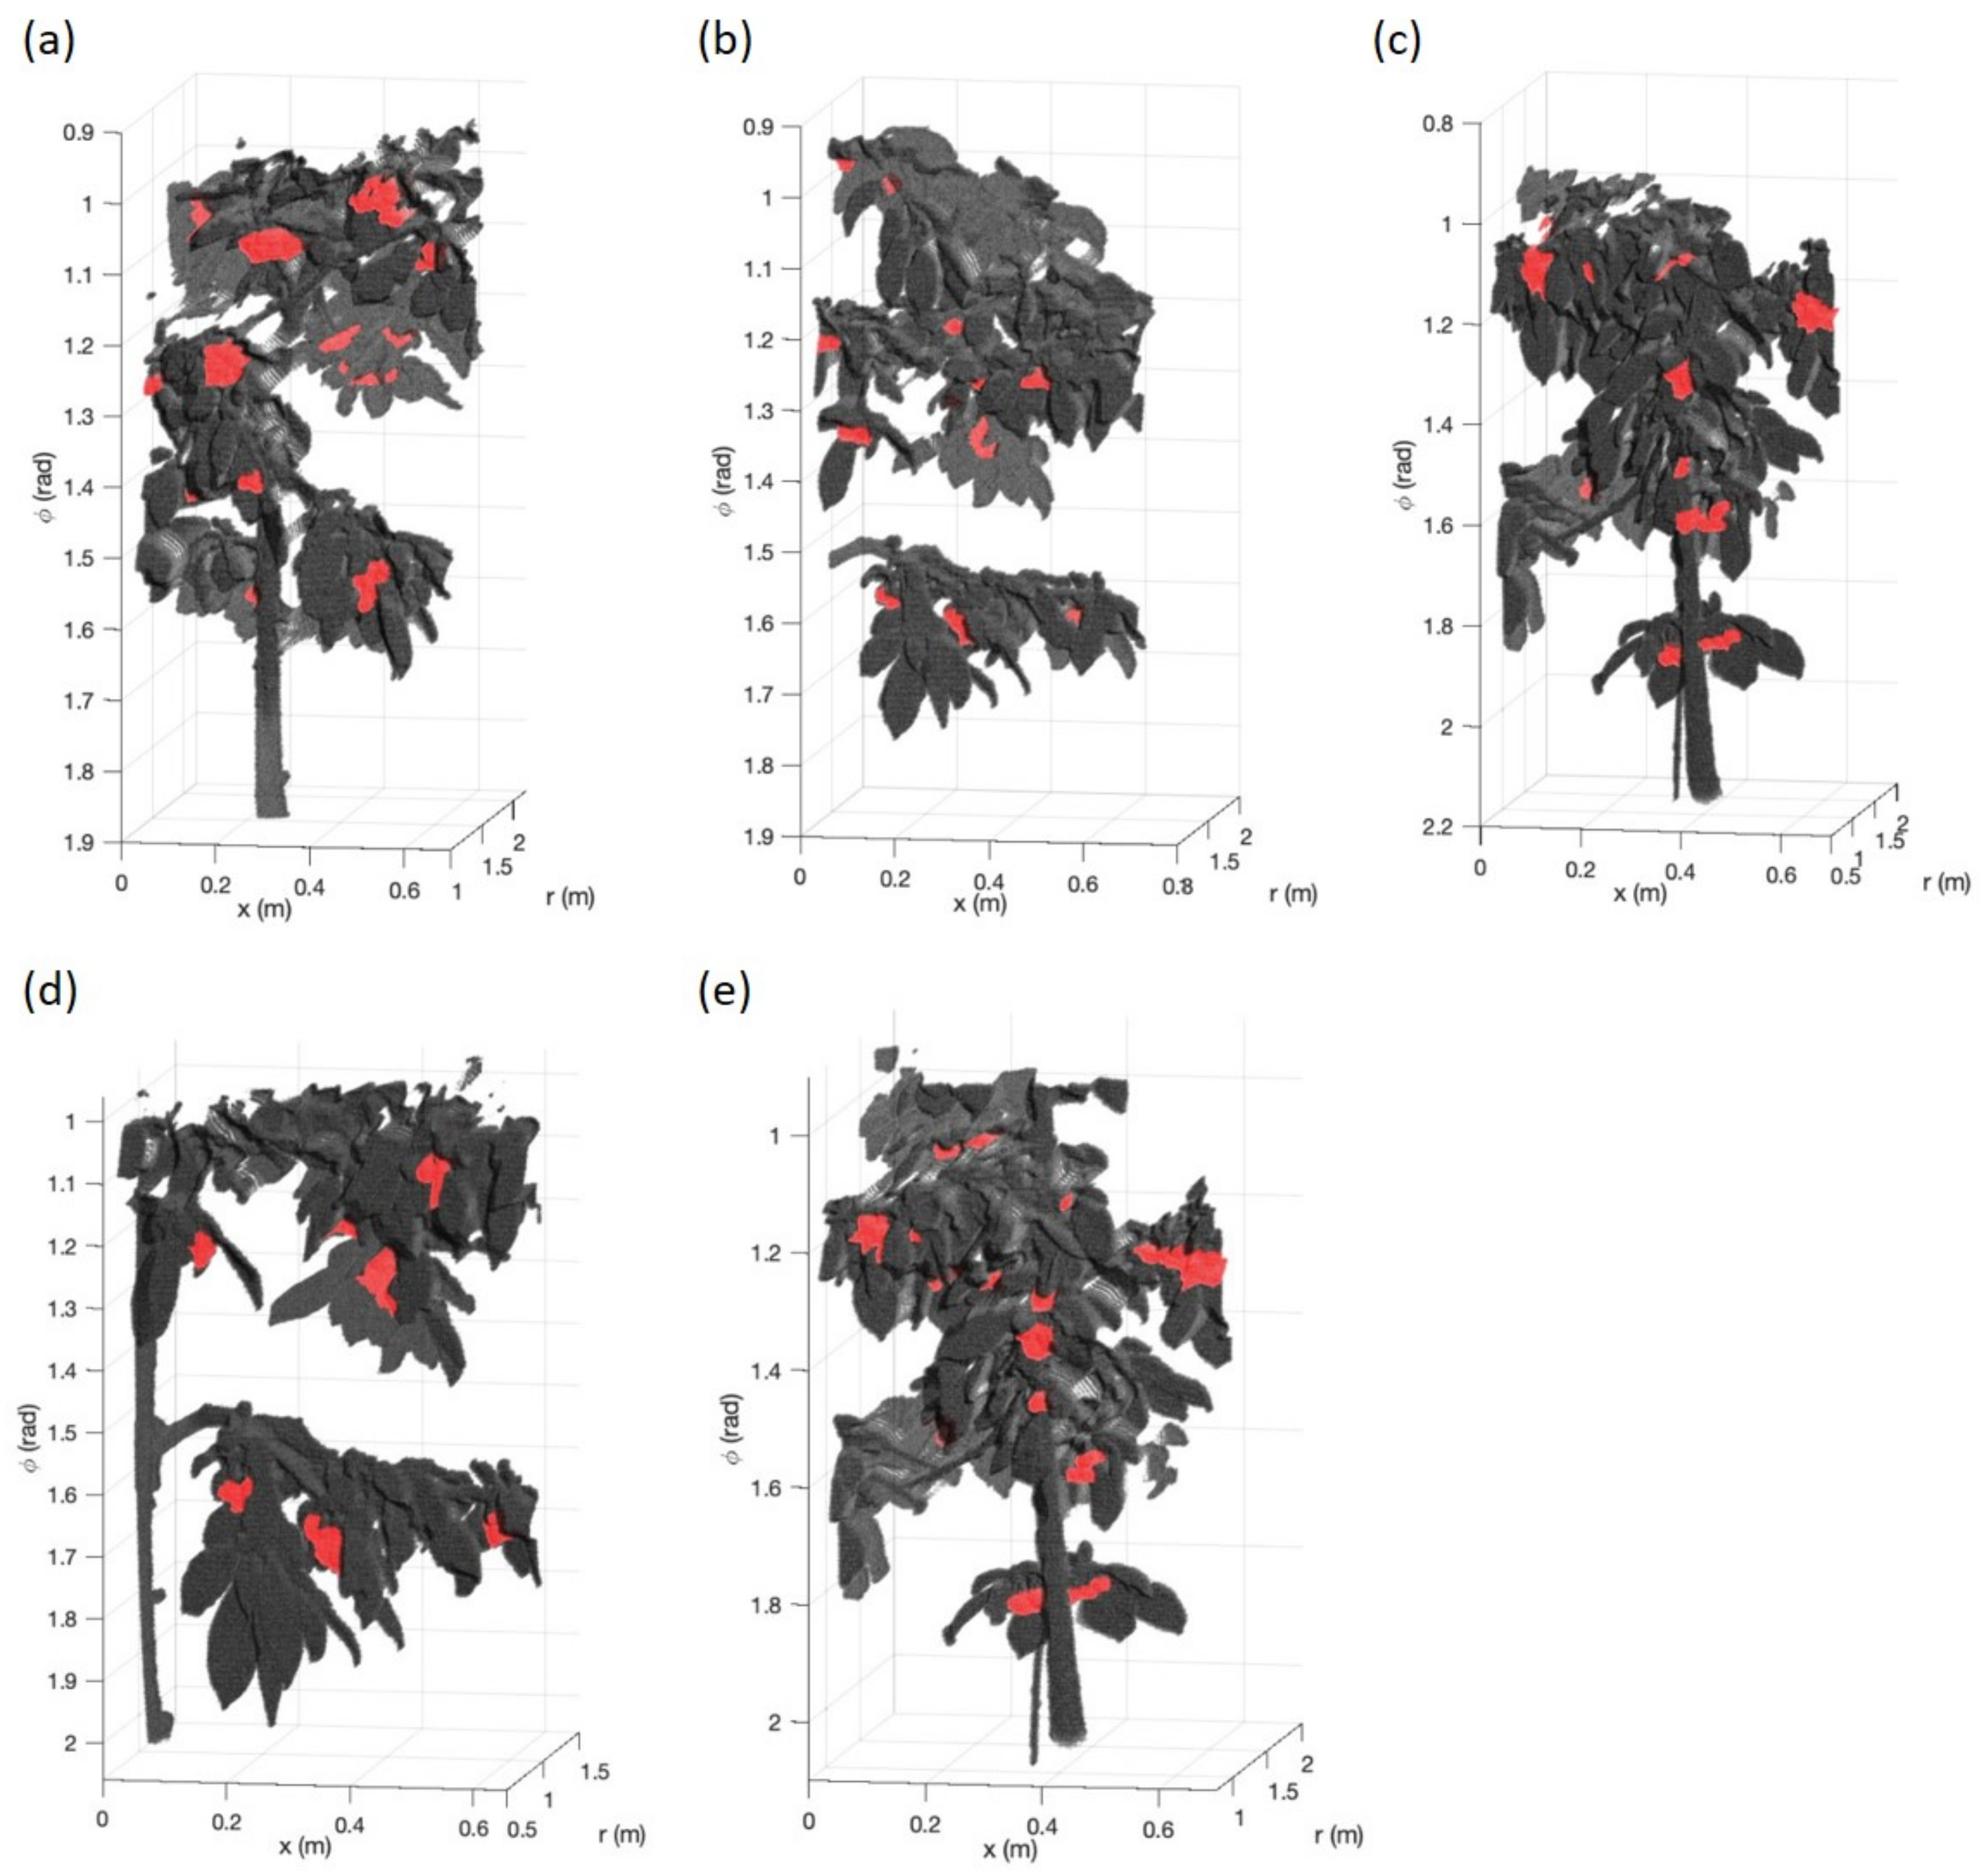
The reference readings on the cherries were manually measured at six locations within the canopies. The locations were delimited using the perspective of vision of the LiDAR sensor to the canopy (Figure 2). The polar angle (ϕ) between the LiDAR sensor and the canopy was considered, ranging from 0 to π from the top to the bottom of the canopy (Figure 1b). While locations 2 and 5 capture all cherries near the trunk area of the canopy, locations 1 and 4 and 3 and 6 are located at the extreme branches on the left and right side of the canopy, respectively. After temperature annotation, all cherry clusters were manually segmented in each location within the canopy (Figure 2) using CloudCompare (2.10, GPL software, Paris, France).

2.3. Reference Temperature and Wetness Measurements

Local reference measurements of wetness and temperature were taken at each location within the canopy. The presence of wetness was visually assessed using a regular mobile phone camera, taking an image of a random cherry at each location. Four wetness classes were immediately assessed visually after scanning and marked on the image. The considered classes of wetness were as follows: dry surface, water film of micro droplets, countable (2–3 droplets), and fully wet fruit surface (>3 droplets), using the labels W0, W1, W2, and W3, respectively. The wetness class of each fruit in the six locations was visually assessed in situ, thus avoiding possible bias due to image quality and misinterpretation in subsequent image inspection. Each registered wetness class was assigned to the corresponding point cloud within each of the locations within the canopy.
Manual temperature measurements were performed on one cherry per location within the canopy using an infrared thermometer (UniversalTemp Thermal Detector, Bosch, Gerlingen-Schillerhöhe, Germany). For validation of the temperature estimation with CRRS, the reference readings were compared to the mean temperature of all sweet cherry clusters within each location analyzed using LiDAR 4D point clouds. A total of 40 cherry temperature reference measurements were recorded, considering two sweet cherry canopies over the temperature adaptation period (Figure 2d,e). The comparison of temperature annotation into the point clouds against manual reference measurement was assessed by means of coefficient of determination. A real ( R r e a l 2 ) and ideal ( R i d e a l 2 ) correlation between the estimated and reference temperatures were evaluated, where a lineal correlation and an ideal ( T L i D A R = T r e f ) were considered, respectively.

2.4. Analysis of Geometric Features of LiDAR 4D Point Clouds

The cooling kinetics of each segmented sweet cherry or cherry cluster was analyzed by means of a LiDAR 4D point cloud represented as P ( x , y , z , T ) for all points in the x y z space with temperature annotation T from the thermal camera. Each cherry was attributed to one of the six locations (Figure 1b) within the 3D canopy. The location was determined by the cherry’s position in space. Thus, all point clouds were transformed using a semi-polar coordinate system to account for the angular beam registration of the LiDAR. Thereof, each point cloud P was transformed to the form P ( x , r , ϕ , T ) , where r i (m) and ϕ i (rad) are the distance and phase angle between the LiDAR (m) and the point i in space, respectively. Subsequently, the location of each sweet cherry point cloud within the location diagram was determined with reference to the spatial boundaries given in Table 2. The upper and lower sector are delimited by ϕ l i m , and the left, center, and right regions of the canopy are within the limits given by x l e f t and x r i g h t .
All of the boundary parameters for each location were arbitrarily established after the visual inspection of the point clouds in accordance with the region of the canopy effectively scanned using the multisensor platform. Thus, for a given sweet cherry point cloud, its location is given if the conditions in Equations (2)–(7) apply to the following:
L o c 1 = { P ( x i , r i , ϕ i , T i ) ( ϕ i < ϕ l i m )   a n d   ( x i < x l e f t ) }
L o c 2 = { P ( x i , r i , ϕ i , T i ) ( ϕ i < ϕ l i m )   a n d   x i > x l e f t   a n d   ( x i < x r i g h t ) }
L o c 3 = { P ( x i , r i , ϕ i , T i ) ( ϕ i < ϕ l i m )   a n d   ( x i > x r i g h t ) }
L o c 4 = { P ( x i , r i , ϕ i , T i ) ( ϕ i > ϕ l i m )   a n d   ( x i < x l e f t ) }
L o c 5 = { P ( x i , r i , ϕ i , T i ) ( ϕ i > ϕ l i m )   a n d   x i > x l e f t   a n d   ( x i < x r i g h t ) }
L o c 6 = { P ( x i , r i , ϕ i , T i ) ( ϕ i > ϕ l i m )   a n d   ( x i > x r i g h t ) }
Similarly, all of the points from the canopy within each location were identified, where all points are assumed to represent woody and leafy parts in each scanned tree. The local ratio between the canopy and cherry point cloud density was estimated for each location (Equation (8)). Thus, an estimate of the relative sweet cherry point cloud density surrounded by other canopy parts was estimated, accounting for potential effect of the canopy microclimate on the thermal kinetics of sweet cherry.
R d e n s i t y = n c a n o p y n s w e e t   c h e r r y
where n c a n o p y and n s w e e t   c h e r r y are the number of points of leafy–woody points and fruit points, respectively, within the location of the fruit or fruit cluster (Figure 2). Subsequently, the effect of canopy density around the sweet cherries was assessed by classifying all of the sweet cherries into low, mid, and high ratios R d e n s i t y using three percentiles, each class containing 1/3 of the entire population. Low and high R d e n s i t y values represent the low and high presence of leaves and branches in the environment relative to sweet cherries, respectively.

2.5. Analyzing the Dew Point Temperature Threshold Index

The temperature change kinetics of sweet cherry were characterized using a dimensionless normalized index. For each temperature annotated point within each sweet cherry point cloud T i at scanning time t i , the dimensionless fractional temperature change ( Y ) over time was calculated based on Newton’s law of temperature adjustment [25,28] (Equation (9)).
Y = T i , t T s t o r a g e T a i r , t T s t o r a g e
Thus, all of the scanned fruit start from T s t o r a g e ( Y = 0 ) over time d t until T a i r , t is reached ( Y = 1 ). Heat transfer from the environment to the cherry is mainly governed by convection, where heat is transferred between the air and the fruit surface, following the relationship in Equation (10).
d T d t = k T s T a
where T s is the fruit surface temperature, T a is the air temperature, and k is the heat transfer coefficient. By integrating over the temperature range, Equation (10) can be re-arranged to solve for the surface temperature (Equation (11)). Additionally, the relationship can be normalized within the Y range at time t (Equation (12)). Thus, for all canopies scanned, each cherry can be evaluated based on its individual temperature change kinetics.
T s = T a + T s T a e k t
Y t = 1 e k t
Heat transfer coefficient k was calculated for all fruit point clouds using a non-linear least squares method. Root mean squared error (RMSE) and R 2 were calculated for all segmented sweet cherry clusters. Significant differences between fitted and measured temperature kinetics were estimated for all scanned trees using a one-way ANOVA on all fitted k values with a 95% confidence interval. Curve fitting and statistical tests were performed in Python (version 3.7, Python Software Foundation, Wilmington, DE, USA) using the scipy module.
Similarly, the dew point temperature threshold index ( Y d e w ) can be derived, considering the fruit surface temperature of cherries and the ambient air dew point temperature (Equation (13)).
Y d e w = T i , t T s t o r a g e T d e w , t T s t o r a g e
where T d e w , t is the ambient dew point air temperature calculated using Equation (1). As the cherry surface temperature is below the dew point temperature, the values of Y d e w are expected to be negative. Inversely, the cherry surface temperature is considered to be above the dew point temperature at Y d e w > 1. The relationship between the occurrence of wetness on the surface of fruit at each location within the canopy and estimated Y d e w was assessed for the 62 sweet cherry point clouds.

3. Results

3.1. Temperature Recording by Means of LiDAR 4D Point Clouds

The validation of surface temperature estimation by means of LiDAR 4D fruit point clouds was performed by comparing manual reference readings (n = 40) and the estimated temperatures for trees #4 and #5 (Figure 3). Overall, coefficients of determination R r e a l 2 of 0.91 and 0.96 were found for tree #4 and #5, respectively. For an ideal scenario, R i d e a l 2 values of 0.79 and 0.60 were found for both considered trees (Figure 3a and 3b, respectively). Cherry surface temperatures analyzed by means of LiDAR 4D point clouds registered lower temperatures in comparison to the manual reference readings, where mean difference of 40.1% between the estimated and manual temperatures was observed 5 min after cooling (Figure 3). In subsequent scans, the difference between the reference and estimated temperatures decreased considerably to 7.8%.
Additionally, the non-uniform presence of wetness on the surface of sweet cherry was observed for both trees. In the case of tree #4 (Figure 3a), there is a steady progression of visually observed wetness from microfilm (W1: blue) to wet (W3: red) to dry surface (W0: white) as the temperature increases. However, the fruit wetness class of W3 was mostly observed for tree #5 (Figure 3b). Thereof, no apparent progression in terms of observed wetness class was found over time for the locations within the canopy.

3.2. Temperature Change in Sweet Cherry Canopies

Temperature changes in the sweet cherry canopy, segmented fruit cluster, air, and air dew point was obtained over time under ambient conditions (Figure 4). Overall, the mean temperatures of the fruit clusters were found to be lower compared to the canopy mean temperatures for each tree at all measuring times. Differences between trees were found, reaching 50.3% in terms of the measurements 5 and 10 min after transferring the trees from cool to ambient conditions. The differences between canopy and cherry temperatures decreased to 9.3 and 3.3% at 50 and 80 min after the cooling period, respectively (i.e., Figure 4d,e). The canopy temperatures of the trees were found to be above the air dew point temperature prior to the transfer from cool to ambient conditions, except for tree #5 (Figure 4e), where the canopy temperature reached the dew point only 35 min after the transfer. Thereof, tree #5 registered the highest mean relative humidity in the room (87.5%) in comparison to the other scanned trees (≈70%). Consequently, a high wetness class (W3) in all cherries was observed throughout the scanning process (Figure 3b).

3.3. Temperature Kinetics of Sweet Cherry Clusters

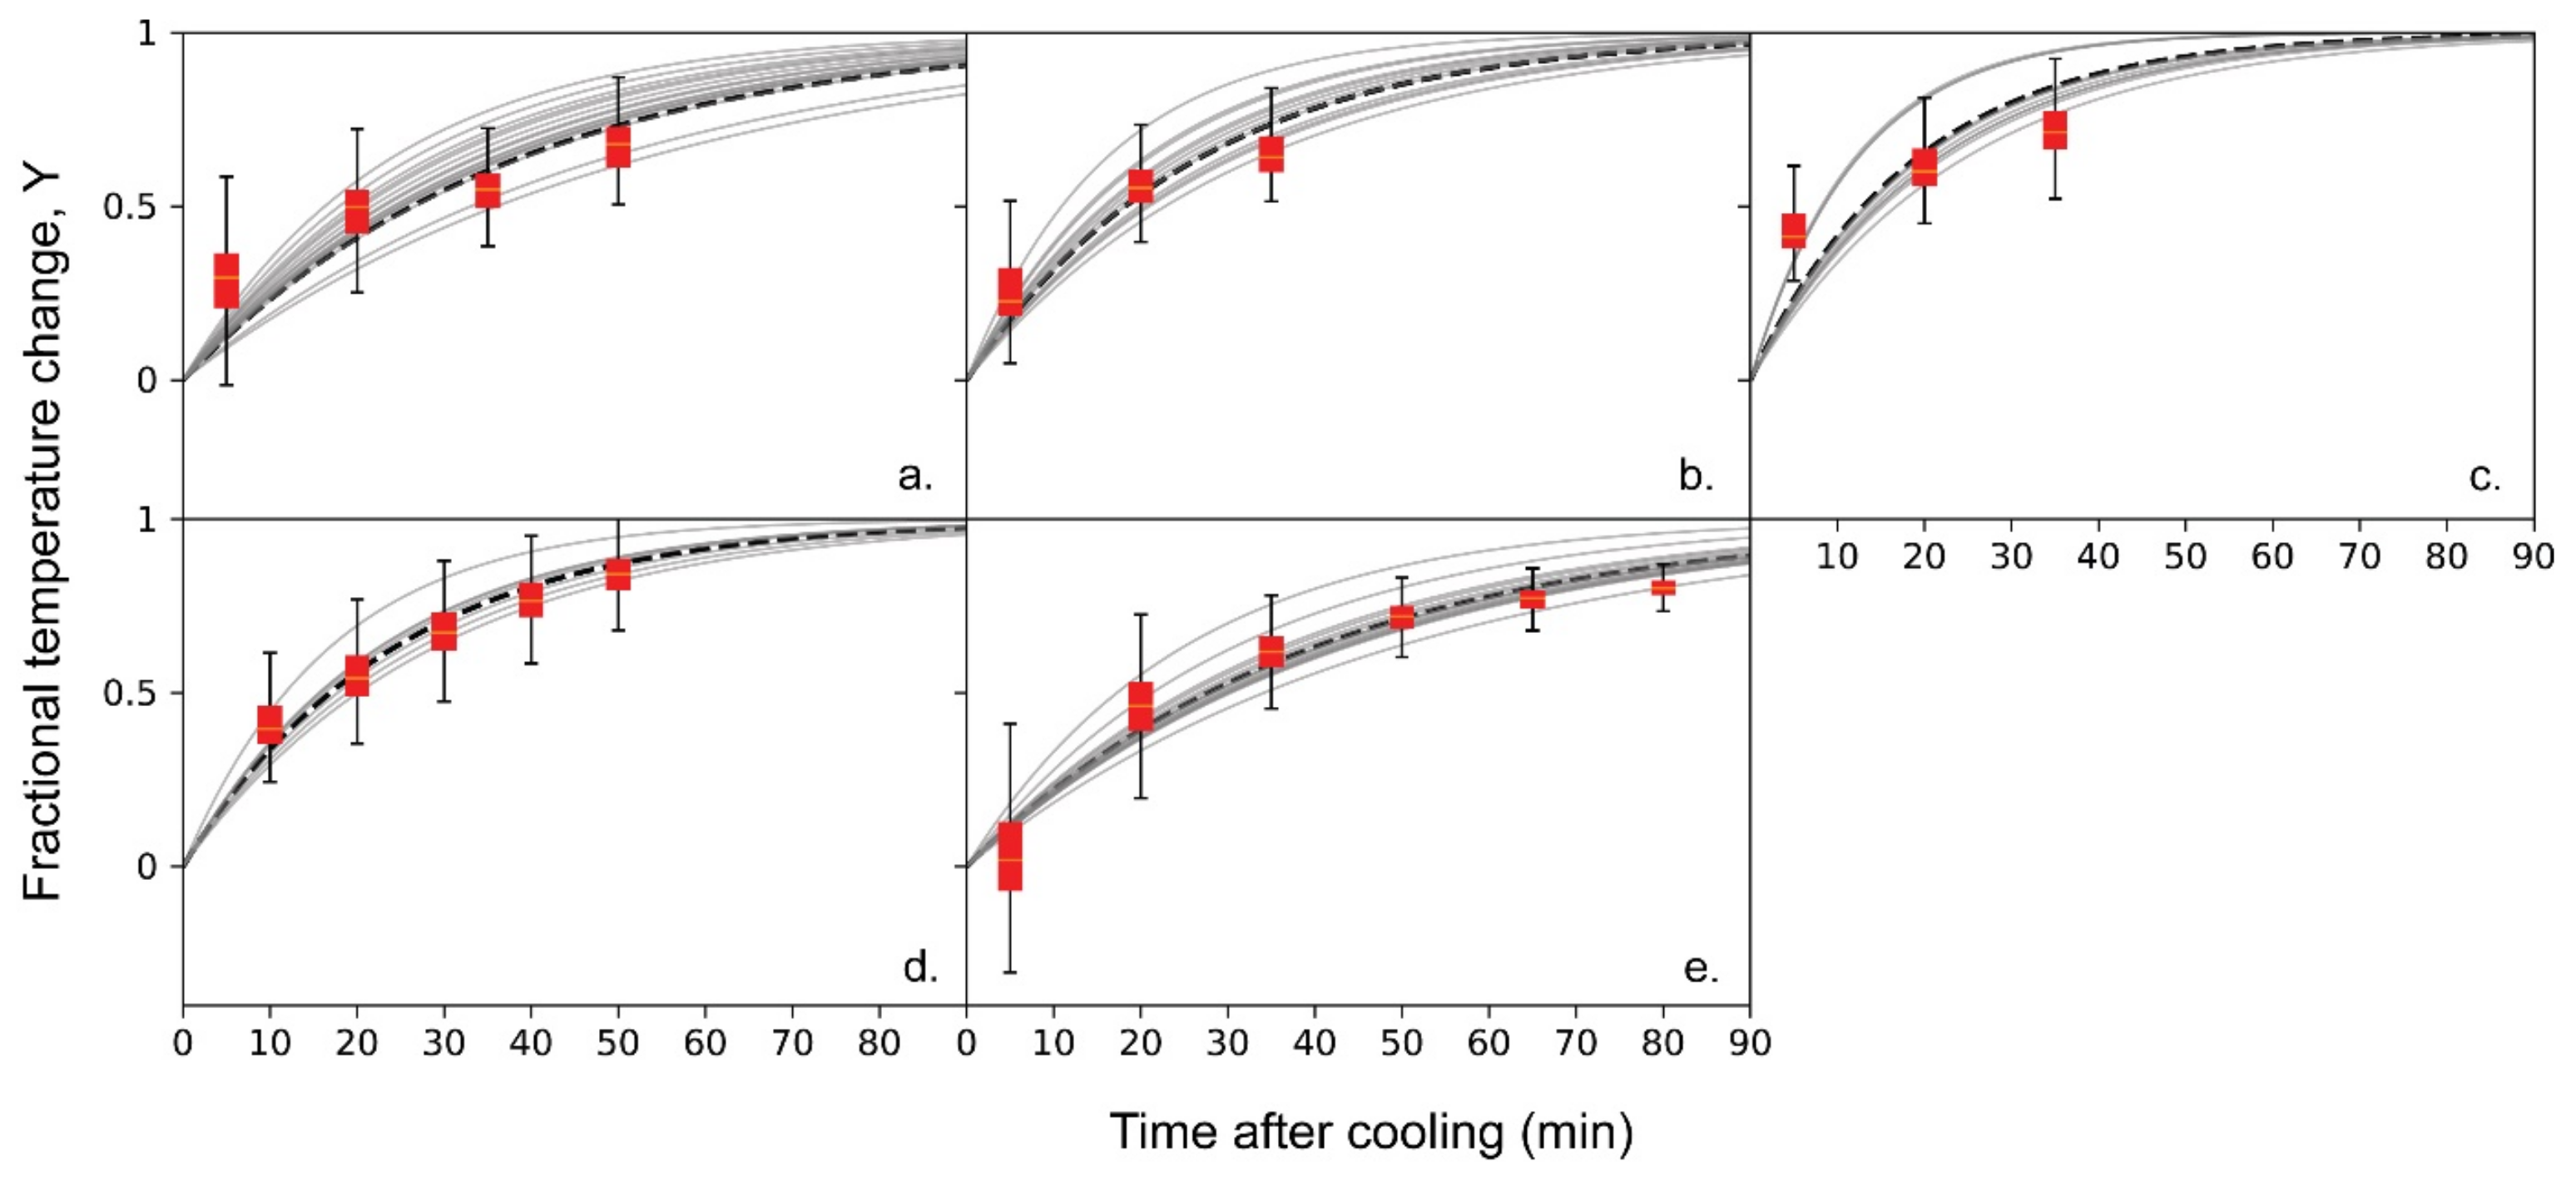
The dimensionless fractional temperature change index (Y) was estimated for all trees studied over time (Figure 5). From the curves, for each fruit, the heat transfer coefficient ( k ) was calculated according to Equation (12) (Table 3). No differences in k were found between all trees for all segmented fruit point clouds according to the results of a one-way ANOVA. Mean R M S E and R 2 values of 0.076 and 0.91 were found, respectively, when comparing empirical and fitted data. Values of Y below zero are not possible during heat transfer, as the fruit cannot be below storage temperature unless in contact with a medium of a lower temperature. In fact, Y values slightly below 0 were found 5 min after transfer to ambient conditions for tree #5 (Figure 5e) due to the marginal measuring uncertainty of the estimated temperature (Figure 3).

3.4. Effect of Microclimate on Thermal Kinetics and Wetness Occurrence of Sweet Cherry

The ratio of canopy (leaves and wood) to cherry fruit point cloud density was classified into low, mid, and high density ratios for all sweet cherry point clouds segmented in each location within the canopy (Table 4). For high density ratio R d e n s i t y , the surface area of the canopy was found to be 42,000 times that of the sweet cherry surface, registered in the point clouds. In contrast, low R d e n s i t y values indicate a much-reduced surface area of foliage and wood in comparison to the sweet cherry surface area within a canopy location.
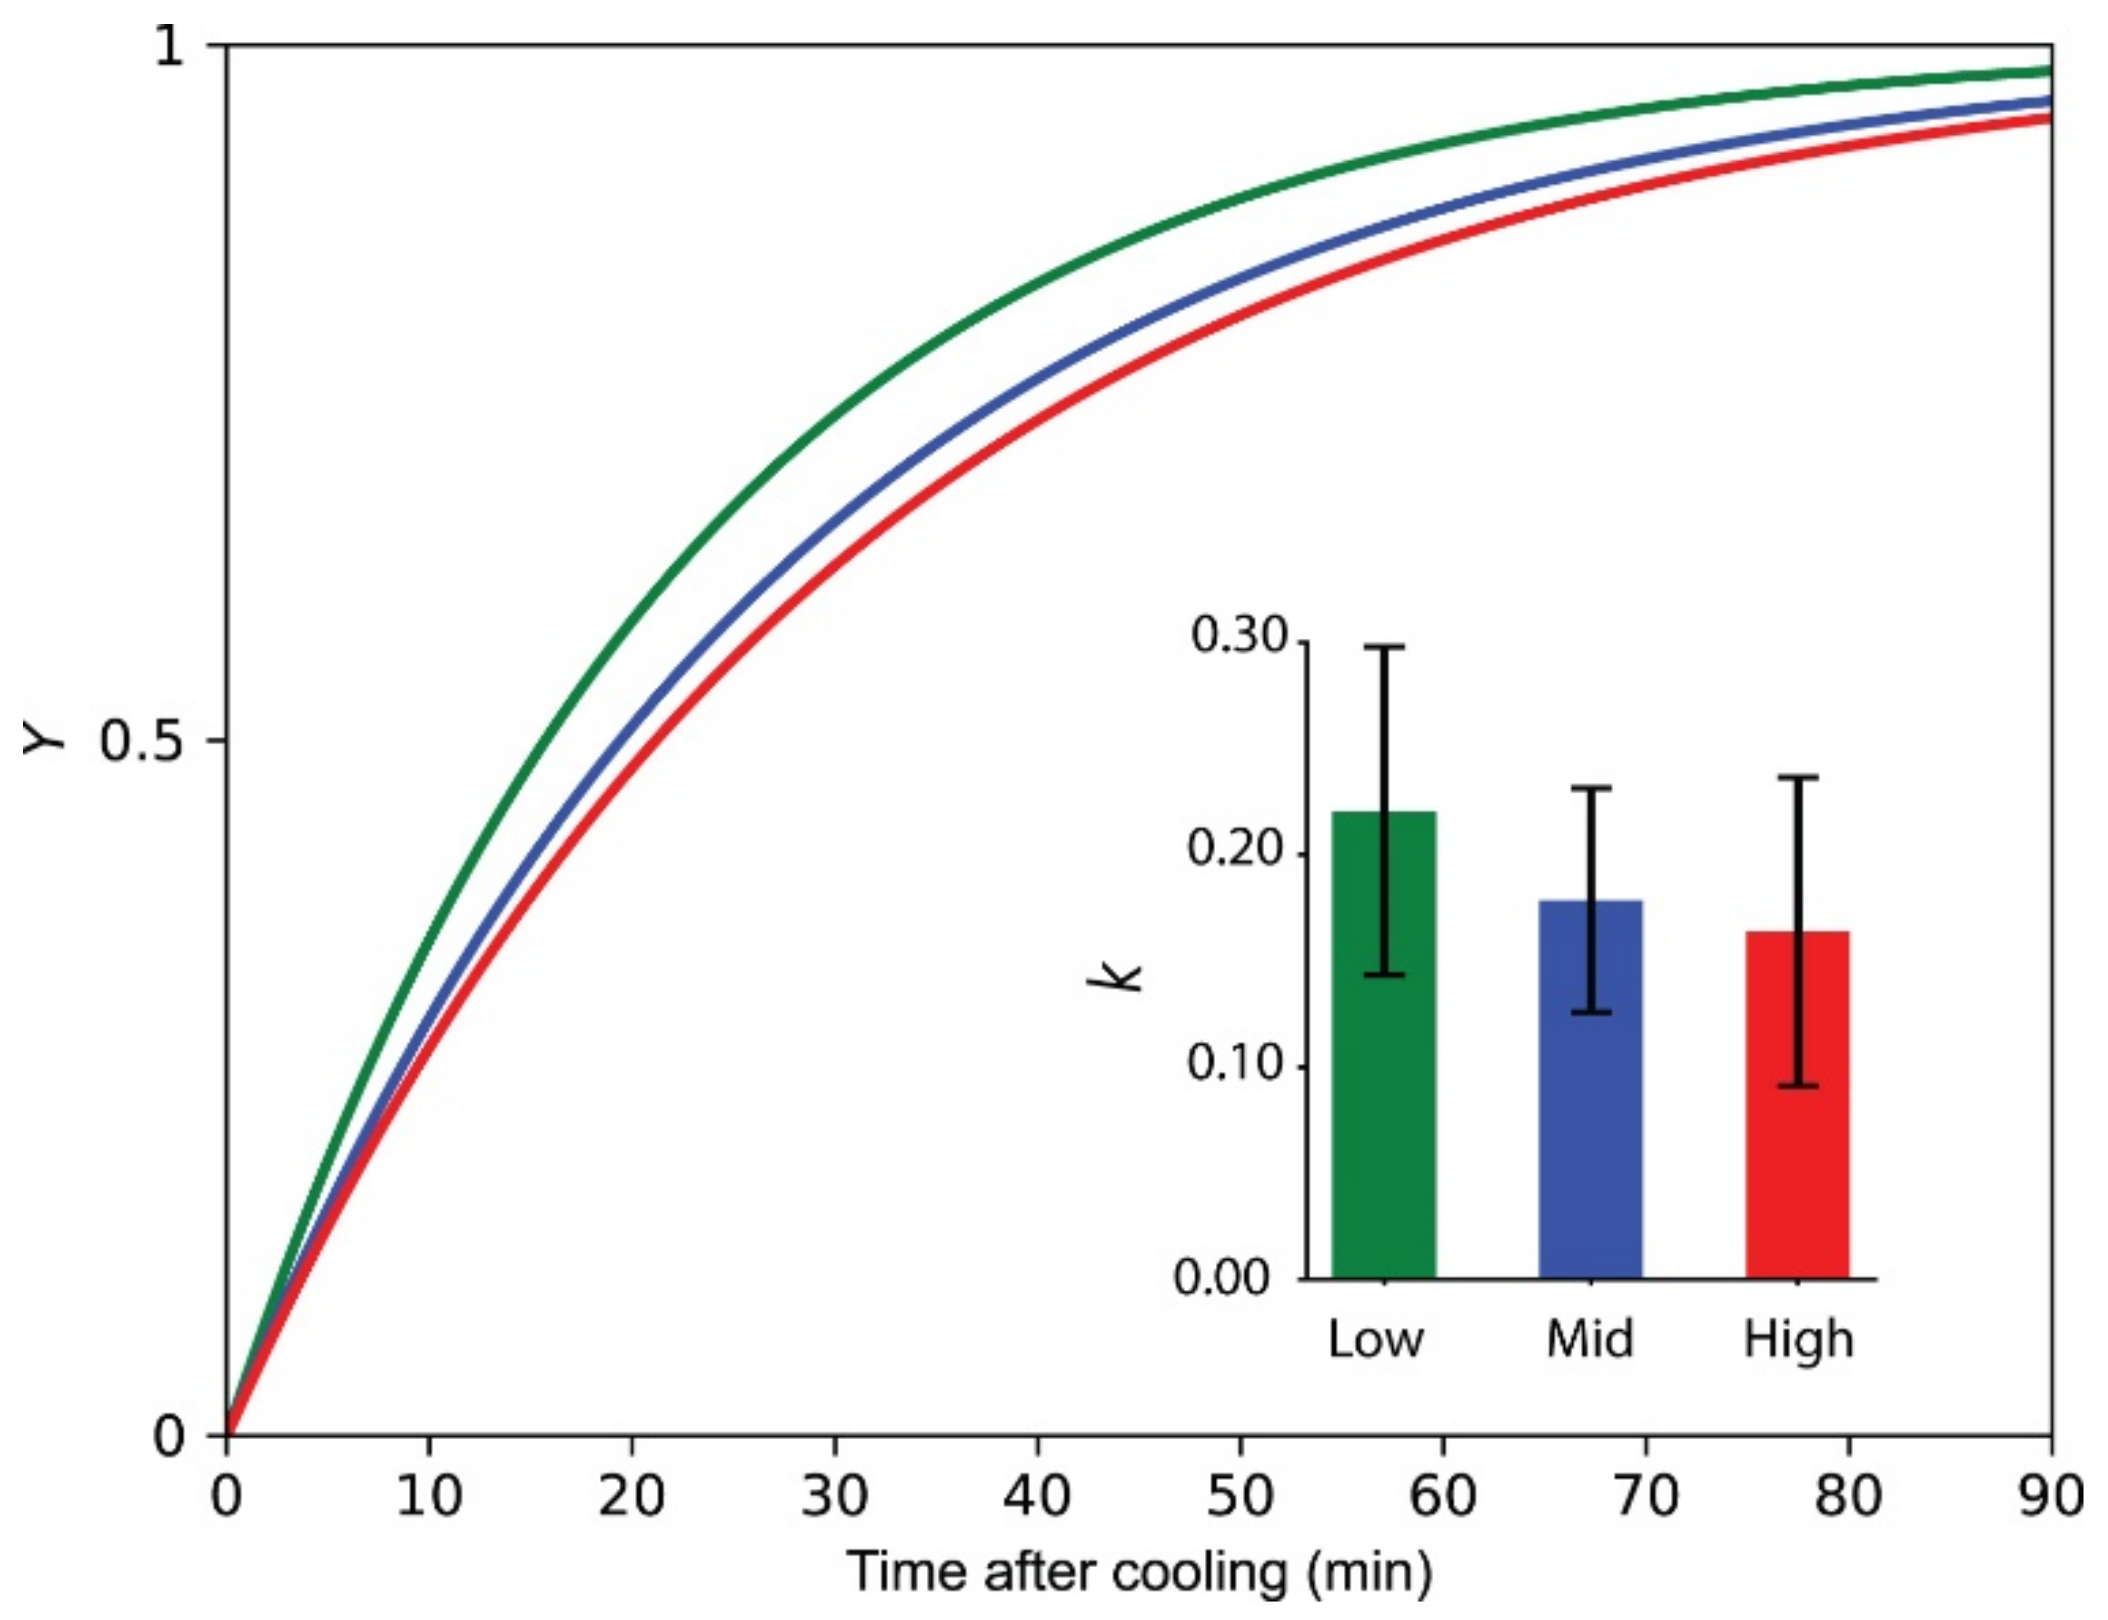
High mean values of k were found for sweet cherry with a low density ratio. Consequently, faster warming curves were observed (Figure 6). Similarly, slower warming curves, given by lower k values, were observed for the high density ratio of all LiDAR sweet cherry point clouds. Overall good fitting results appeared (Table 4). Mean values of 0.88 and 0.09 were found for R 2 and R M S E , respectively.

3.5. Estimation of Occurrence of Wetness

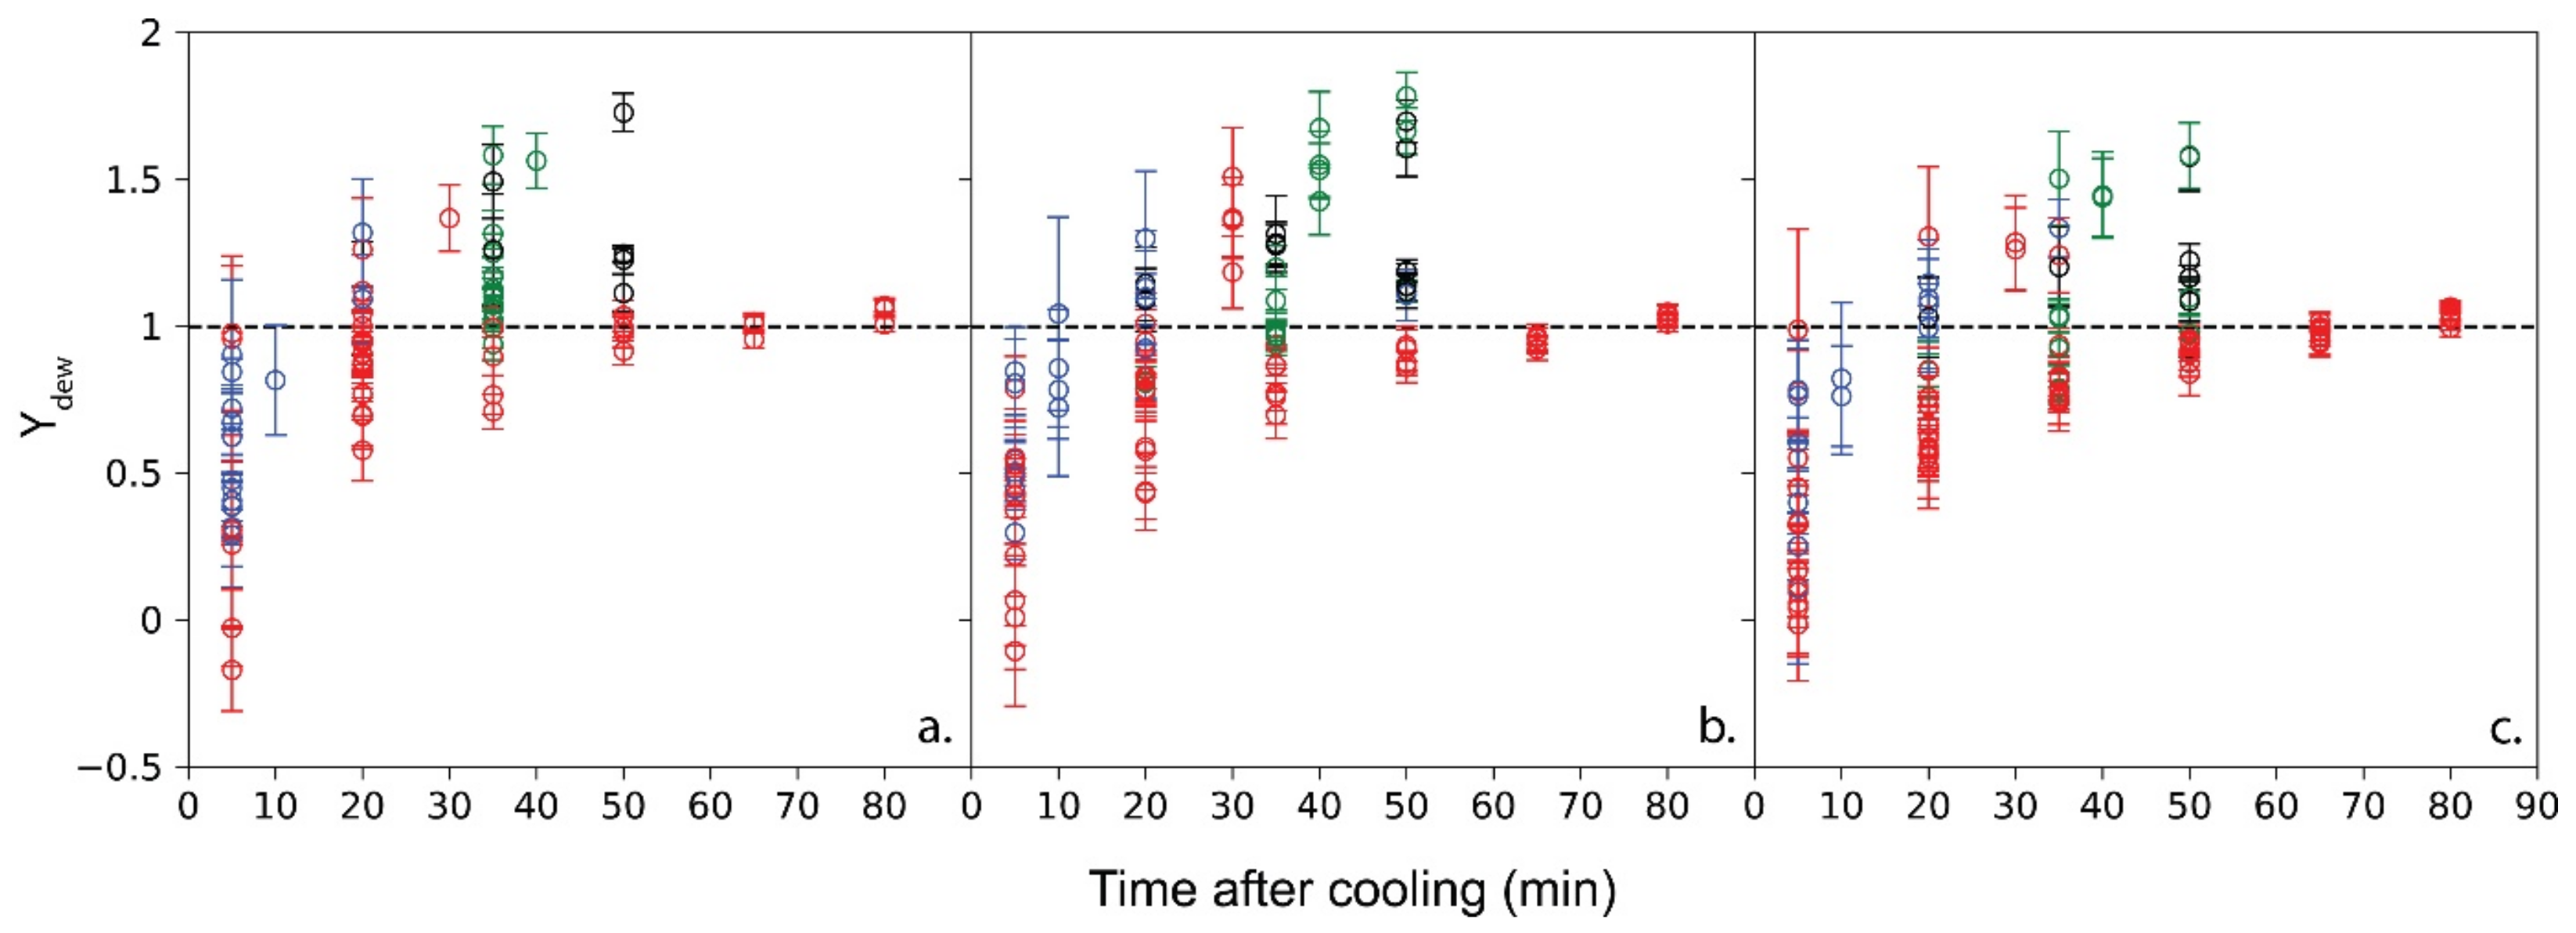
The occurrence of wetness on the surface of sweet cherry during temperature adaptation was visually rated as reference wetness class (W0–4) in relation to all spatial canopy locations (Figure 7). In all measurements, a wet fruit surface (W3) was observed, with 15.1, 16.8, and 23.3% of all measurements for low, mid, and high density ratios, respectively. As expected, wet fruit was observed when the temperature of the fruit was lower than the air dew point temperature, which was found for all three classes of sweet cherry density ratios. In average, 76% of all wet fruit was found at Y d e w < 1, while 24% of all wetness occurrence was found at Y d e w > 1 when considering all of the point cloud density ratios. On the other hand, a dry sweet cherry surface was always registered at Y d e w > 1. The observation of a water microfilm (W1) on the surface of sweet cherry primarily occurred at Y d e w < 1. The W1 wetness class was observed for sweet cherries with low, mid, and high density ratios of 82.4, 63, and 69%, respectively. The appearance of scattered single water droplets on the surface of cherries (W2) was observed in only 16.4% of the total wetness assessments for all density ratios. More specifically, 93% of the W2 wetness class was registered for the low density ratio, while 60 and 57% of W2 was registered for mid and high density ratios, respectively, at Y d e w > 1.
Histogram curves of Y d e w for each wetness class were obtained for low, mid, and high density ratios (Figure 8). Peaks of dry sweet cherry surface (W0) were observed at Y d e w values of 1.22, 1.18, and 1.12, for low, mid, and high canopy-to-fruit density ratio, respectively. A progression from W1, W3, W2 to W0 was found at Y d e w peaks of 0.49, 0.96, 1.09, and 1.22 for the low sweet cherry density ratio (Figure 8a). However, this progression is less pronounced in mid and high density ratios (Figure 8b,c). Visually registered wetness class of W1, W2, and W3 were found ranging from 0.88 to 1.02 and from 0.88 to 0.96 for mid and high density ratios, respectively.

4. Discussion

4.1. Spatio-Temporal Temperature and Wetness Analysis Using LiDAR 4D Point Clouds

This study aimed to capture spatio-temporal temperature changes in sweet cherries by means of LiDAR 4D point clouds. For this purpose, single fruit as well as clusters were captured. The reference and estimated temperatures found in this study, the latter obtained via the application of LiDAR 4D point cloud analysis, appeared to be in good agreement with low measuring uncertainty in a temperature range of >10 °C (Figure 3). Enhanced errors appeared in highly cold and humid canopy environments. Particularly, for tree #5, the highest relative humidity was recorded in the climate room, and a fully wet sweet cherry surface (W3) was observed throughout the warming period. As a result, temperature readings on wet sweet cherry converged toward the dew point temperature, indicating that thermal information relating to the water layer was possibly registered instead of the sweet cherry surface temperature. Consequently, negative Y values were observed 5 min after cooling (Figure 5e), which in ideal heat transfer scenarios, contradicts Newton’s laws of thermodynamics, unless sweet cherries were in contact with another (colder) medium. Typically, the surfaces of fruit stored in room temperature conditions serve as an interface for water droplets deposition as a result of condensation and subsequent evaporation once the fruit temperature is above the air dew point temperature, as frequently described in postharvest storage experiments [26]. In highly humid environments, large water deposition on surface can interfere with temperature readings when using infrared thermography, as the emissivity properties of the surface of the fruit may change. Furthermore, manual infrared thermometers capture the local reference temperature of surfaces that may not be covered by formed water droplets, resulting in bias in the reference readings. On the other hand, the temperatures acquired from the thermal camera captured a larger region of fruit surface, considering areas of non-uniform wetness on the surface. The emissivity of water can range from 0.95 to 0.98 for a water layer of > 0.1 mm [29]. Earlier work reported similar RMSE when using thermal images to detect wetness in specific sweet cherry cultivars [23]. However, wetness on the surface of the fruits was produced by rainfall and not by condensation due to previous cooling. Moreover, wetness determination protocols were developed under low relative humidity conditions (±42% RH) [23], where an average R 2 of 0.92 was found between sweet cherry and leaf temperature. On the contrary, large differences of up to 50.3% were found between sweet cherry and canopy temperature in the present work (Figure 4).

4.2. Thermal Kinetics and Wetness Occurrence Considering Sweet Cherry Surface

Using LiDAR 4D point clouds, the effect of microclimate on sweet cherry thermal kinetics and the occurrence of wetness was assessed by means of the apparent heat transfer coefficient ( k ) and a non-dimensional wetness threshold index ( Y d e w ), respectively. High values of heat transfer coefficient (k) represent a rapid heat transfer rate, thus pronounced warming curves (Figure 4). Typically, at room temperature (relative uniform air temperature and humidity), heat is transferred to the cooled produce. Therefore, at a given location, a larger sweet cherry surface will receive more latent heat from the air with constant airflow characteristics, resulting in slower heat transfer rates (Figure 6). Although significant differences could not be determined, the relative effect of the sweet cherry surface in comparison to the local microclimate provided by the foliage was found (Figure 6). When the density ratio, considering the ratio of the number of points belonging to leaves and wood to the points of the fruit surface ( R d e n s i t y ) , is low, wetness classes were found to be in the lower wetness classes (Figure 8a). Consequently, the high warming rate of sweet cherry at low R d e n s i t y produced a clear progression from W1, W2, W3 to W0. On the other hand, this class progression did not appear to be clean at slower sweet cherry warming rates (Figure 8b,c). When the sweet cherry surface temperature is above the dew point temperature ( Y d e w > 1), water on the surface of the fruit starts to evaporate, and the total time period at which all water is evaporated depends on the surrounding air properties and local moisture. Localized peaks of Y d e w for dry fruit surface class (W0) decreased from 1.22 to 1.12 for low to high R d e n s i t y values, respectively. Obviously, the presence of canopy foliage can retain more humidity from the cherry surface when compared to potential adjacent wet cherry surfaces (as in high R d e n s i t y fruit clusters), thus affecting the mass transfer of water to the environment. Typically, the inflection point between water condensation and evaporation occurs when the fruit surface temperature reaches the air dew point temperature [30]. Moreover, the evaporation of water from the surface of plums after cooling lasted 30 and 40 min according to measured and modelled water evaporation [26]. The surrounding ambient characteristics of packed fruit affects the local microclimate and cooling characteristics, as influenced by packaging design, location within packaging arrangements, and location within cooling units [31,32,33]. Despite available knowledge in this area, there is a need for detailed data relating to canopies under the conditions of climate change. With LiDAR 4D point clouds, such effects can be spatio-temporally quantified and modelled, as proposed for entire canopies in the present study. Wetness duration is a significant factor in the cracking of sweet cherry fruit [10]. Dew seems to be relevant, but has not been analyzed in detail yet. However, observing and quantifying dew on fruit remains a difficult task. The multisensor platform system allowed for the automated measuring of the appearance, amount, and duration of dew on the fruit surface. Moreover, information about the thermal kinetics of fruit during day/night cycles may give further insight into fruit skin dynamics since fruit usually grow during night periods [34], where the temperature is lower and the skin is stiffer than during the day [35]. A stiff skin with high growth in combination with surface wetness may cause microcracks, which is the precursor for cracking [12]. Consequently, such questions may be addressed in future work.

5. Conclusions

The occurrence and duration of wetness was analyzed using spatio-temporal data obtained with LiDAR 4D point clouds. The application of this close-range remote sensing method in sweet cherry tree canopies provided the geometric properties of the canopy as well as temperature distribution data. The temperature distribution at the fruit level can be obtained in various locations of the canopy. This allowed us to analyze the impact of growing location, but also the impact of the canopy density (canopy-to-fruit density ratio) on the fruit temperature. The value of the data was pointed out when modelling the thermal kinetics related to temperature changes and the risk of condensation on the surface of fruit.
Data were provided on the non-dimensional dew point temperature threshold index ( Y d e w ). Additionally, apparent differences in fitted heat transfer coefficient values were observed for low, mid, and high canopy density ratios at a given delimited location within the canopy. Relationships between observed wetness and the LiDAR-derived Y d e w threshold was determined. Finally, at Y d e w values between 1.22 and 1.12, no wetness was observed on the sweet cherry surface. The application developed for sweet cherry trees in controlled conditions has the potential to be applied under orchard conditions, gaining large-scale data of potentially entire orchards.

Author Contributions

Conceptualization, N.T.-Z. and M.Z.-S.; methodology, N.T.-Z. and M.Z.-S.; software, N.T.-Z.; validation, N.T.-Z., M.Z.-S. and A.W.; formal analysis, N.T.-Z.; investigation, N.T.-Z. and A.W.; resources, M.Z.-S. and A.W.; data curation, N.T.-Z. and A.W.; writing—original draft preparation, N.T.-Z.; writing—review and editing, M.Z.-S. and A.W.; visualization, N.T.-Z.; supervision, M.Z.-S.; project administration, A.W. and M.Z.-S.; funding acquisition, M.Z.-S. and A.W. All authors have read and agreed to the published version of the manuscript.

Funding

This research was funded by European Horizon2020 RIA program, project “CrackSense”, grant number 101086300.

Data Availability Statement

All of the raw data are available upon request and stored on an open access platform: Zude-Sasse, M., Tapia-Zapata, N., Bignardi, M., Regen, C., and Winkler, A. (2024). Temperature annotated 3D Point Cloud of sweet cherry trees in climate chamber [Data set]. Zenodo. https://doi.org/10.5281/zenodo.10687819.

Acknowledgments

We highly appreciate the support from Cristian Regen and Sven Jörissen in writing the software for merging the LiDAR and thermal data, as well as Marco Bignardi, who helped to run the measurements in Hanover.

Conflicts of Interest

The authors declare no conflicts of interest. The funders had no role in the design of the study; in the collection, analyses, or interpretation of data; in the writing of the manuscript; or in the decision to publish the results.

References

  1. Santos, M.; Egea-Cortines, M.; Gonçalves, B.; Matos, M. Molecular mechanisms involved in fruit cracking: A review. Front. Plant Sci. 2023, 14, 1130857. [Google Scholar]
  2. La Spada, P.; Dominguez, E.; Continella, A.; Heredia, A.; Gentile, A. Factors influencing fruit cracking: An environmental and agronomic perspective. Front. Plant Sci. 2024, 15, 1343452. [Google Scholar]
  3. Juan, L.; Chen, J. Citrus Fruit-Cracking: Causes and Occurrence. Hortic. Plant J. 2017, 3, 255–260. [Google Scholar]
  4. Christensen, J.V. Rain-induced cracking of sweet cherries: Its causes and prevention. In Cherries: Crop Physiology, Production and Uses; Webster, A.D., Looney, N.E., Eds.; CAB International: Wallingford, UK, 1996; pp. 297–327. [Google Scholar]
  5. Knoche, M.; Winkler, A. Rain-induced cracking of sweet cherries. In Cherries: Botany, Production and Uses; Quero-García, J., Iezzoni, A., Puławska, J., Lang, G., Eds.; CAB International: Wallingford, UK, 2017; pp. 140–165. [Google Scholar]
  6. Looney, N.E. Benefits of calcium sprays below expectations in BC tests. Goodfruit Grow. 1985, 36, 7–8. [Google Scholar]
  7. Verner, L.; Blodgett, E.C. Physiological studies of the cracking of sweet cherries. Bull. Agric. Exp. Sta. Univ. Idaho 1931, 184, 1–15. [Google Scholar]
  8. Glenn, G.M.; Poovaiah, B.W. Cuticular Properties and Postharvest Calcium Applications Influence Cracking of Sweet Cherries. J. Am. Soc. Hortic. Sci. 1989, 114, 781–788. [Google Scholar]
  9. Winkler, A.; Peschel, S.; Kohrs, K.; Knoche, M. Rain Cracking in Sweet Cherries is not Due to Excess Water Uptake but to Localized Skin Phenomena. J. Am. Soc. Hortic. Sci. 2016, 141, 653–660. [Google Scholar]
  10. Winkler, A.; Blumenberg, I.; Schürmann, L.; Knoche, M. Rain cracking in sweet cherries is caused by surface wetness, not by water uptake. Sci. Hortic. 2020, 269, 109400. [Google Scholar]
  11. Brüggenwirth, M.; Knoche, M. Cell wall swelling, fracture mode, and the mechanical properties of cherry fruit skins are closely related. Planta 2017, 245, 765–777. [Google Scholar] [PubMed]
  12. Schumann, C.; Winkler, A.; Brüggenwirth, M.; Köpcke, K.; Knoche, M. Crack initiation and propagation in sweet cherry skin: A simple chain reaction causes the crack to ‘run’. PLoS ONE 2019, 14, e0219794. [Google Scholar]
  13. Peschel, S.; Knoche, M. Characterization of microcracks in the cuticle of developing sweet cherry fruit. J. Am. Soc. Hortic. Sci. 2005, 130, 487–495. [Google Scholar]
  14. Knoche, M.; Peschel, S. Water on the Surface Aggravates Microscopic Cracking of the Sweet Cherry Fruit Cuticle. J. Am. Soc. Hortic. Sci. 2006, 131, 192–200. [Google Scholar]
  15. Gonçalves, B.; Silva, V.; Bacelar, E.; Guedes, F.; Ribeiro, C.; Silva, A.P.; Pereira, S. Orchard Net Covers Improve Resistance to Cherry Cracking Disorder. Foods 2023, 12, 543. [Google Scholar] [CrossRef]
  16. Pino, S.; Palma, M.; Sepúlveda, Á.; Sánchez-Contreras, J.; Moya, M.; Yuri, J.A. Effect of Rain Cover on Tree Physiology and Fruit Condition and Quality of ‘Rainier’, ‘Bing’ and ‘Sweetheart’ Sweet Cherry Trees. Horticulturae 2023, 9, 109. [Google Scholar] [CrossRef]
  17. Cline, J.A.; Meland, M.; Sekse, L.; Webster, A.D. Rain Cracking of Sweet Cherries: II. Influence of Rain Covers and Rootstocks on Cracking and Fruit Quality. Acta Agric. Scand. Sect. B Soil Plant Sci. 1995, 45, 224–230. [Google Scholar]
  18. Saha, K.K.; Zude-Sasse, M. Estimation of chlorophyll content in banana during shelf life using LiDAR laser scanner. Postharvest Biol. Technol. 2022, 192, 112011. [Google Scholar] [CrossRef]
  19. Tsoulias, N.; Paraforos, D.S.; Xanthopoulos, G.; Zude-Sasse, M. Apple Shape Detection Based on Geometric and Radiometric Features Using a LiDAR Laser Scanner. Remote Sens. 2020, 12, 2481. [Google Scholar] [CrossRef]
  20. Tapia-Zapata, N.; Saha, K.K.; Tsoulias, N.; Zude-Sasse, M. A geometric modelling approach to estimate apple fruit size by means of LiDAR 3D point clouds. Int. J. Food Prop. 2024, 27, 566–583. [Google Scholar]
  21. Tsoulias, N.; Saha, K.K.; Zude-Sasse, M. In-situ fruit analysis by means of LiDAR 3D point cloud of normalized difference vegetation index (NDVI). Comput. Electron. Agric. 2023, 205, 107611. [Google Scholar]
  22. Tsoulias, N.; Jörissen, S.; Nüchter, A. An approach for monitoring temperature on fruit surface by means of thermal point cloud. MethodsX 2022, 9, 101712. [Google Scholar]
  23. Osroosh, Y.; Peters, R.T. Detecting fruit surface wetness using a custom-built low-resolution thermal-RGB imager. Comput. Electron. Agric. 2019, 157, 509–517. [Google Scholar]
  24. Ranjan, R.; Sinha, R.; Khot, L.R.; Whiting, M. Thermal-RGB imagery and in-field weather sensing derived sweet cherry wetness prediction model. Sci. Hortic. 2022, 294, 110782. [Google Scholar]
  25. Defraeye, T.; Cronjé, P.; Berry, T.; Opara, U.L.; East, A.; Hertog, M.; Verboven, P.; Nicolai, B. Towards integrated performance evaluation of future packaging for fresh produce in the cold chain. Trends Food Sci. Technol. 2015, 44, 201–225. [Google Scholar]
  26. Gottschalk, K.; Linke, M.; Mészáros, C.; Farkas, I. Modeling Condensation and Evaporation on Fruit Surface. Dry. Technol. 2007, 25, 1237–1242. [Google Scholar]
  27. Lawrence, M.G. The Relationship between Relative Humidity and the Dew point Temperature in Moist Air: A Simple Conversion and Applications. Bull. Am. Meteorol. Soc. 2005, 86, 225–234. [Google Scholar]
  28. Thompson, J. Pre-cooling and storage facilities. In USDA Agriculture Handbook 66: The Commercial Storage of Fruits, Vegetables, and Florist and Nursery Stocks; USDA, Ed.; USDA: Washington, DC, USA, 2004; pp. 1–10. [Google Scholar]
  29. Minkina, W. Appendix B: Normal Emissivities of Various Materials. In Infrared Thermography: Errors and Uncertainties; Minkina, W., Dudzik, S., Eds.; John Wiley & Sons: Hoboken, NJ, USA, 2009. [Google Scholar]
  30. Linke, M.; Praeger, U.; Mahajan, P.V.; Geyer, M. Water vapour condensation on the surface of bulky fruit: Some basics and a simple measurement method. J. Food Eng. 2021, 307, 110661. [Google Scholar]
  31. Lufu, R.; Ambaw, A.; Opara, U.L. Determination of moisture loss of pomegranate cultivars under cold and shelf storage conditions and control strategies. Sustain. Food Technol. 2023, 1, 79–91. [Google Scholar]
  32. Defraeye, T.; Lambrecht, R.; Delele, M.A.; Tsige, A.A.; Opara, U.L.; Cronjé, P.; Verboven, P.; Nicolai, B. Forced-convective cooling of citrus fruit: Cooling conditions and energy consumption in relation to package design. J. Food Eng. 2014, 121, 118–127. [Google Scholar]
  33. Jantapirak, S.; Laguerre, O.; Denis, A.; Salomon, Y.P.; Flick, D.; Vangnai, K.; Jittanit, W.; Duret, S. Experimental simulation of temperature non-uniformity in a loaded container along air cargo supply chain: Mango case study. J. Food Eng. 2024, 380, 112161. [Google Scholar]
  34. Brüggenwirth, M.; Winkler, A.; Knoche, M. Xylem, phloem, and transpiration flows in developing sweet cherry. Trees 2016, 30, 1821–1830. [Google Scholar]
  35. Brüggenwirth, M.; Moritz, K. Factors affecting mechanical properties of the skin of sweet cherry fruit. J. Amer. Soc. Hort. Sci. 2016, 141, 45–53. [Google Scholar]
Figure 1. (a) Multisensor platform and example raw 3D point cloud of a cherry canopy. (b) Example of a scanned cherry tree (T5) with delimited spatial locations (1 to 6). ϕ is the polar angle with respect to the LiDAR position, ranging from 0 to π from the top to the bottom of the canopy. Fruit clusters marked in red were distributed in the six locations.
Horticulturae 10 00757 g001
Figure 2. Three-dimensional point cloud of each canopy (tree #1 - #5 in subfigures (ae), respectively) recorded with LiDAR sensor. Segmented cherry clusters are denoted in red.
Horticulturae 10 00757 g002
Figure 3. Scatter plots of local mean fruit temperature estimated with LiDAR 4D point cloud and manually recorded reference fruit temperature, capturing tree #4 (n = 10) and #5 (n = 30) in (a,b), respectively. Dashed and solid lines represent the ideal and real correlation lines, respectively. Depicted color of symbols refer to wetness class for: W0 (white), W1 (blue), W2 (green), and W3 (red).
Horticulturae 10 00757 g003
Figure 4. Temperature change in sweet cherry and canopy over time for each canopy analyzed by means of LiDAR 4D point clouds (ae).
Horticulturae 10 00757 g004
Figure 5. Non-dimensional fractional sweet cherry temperature change (Y) over time for all scanned trees (ae) by means of LiDAR 4D point clouds. Fitted curves of each sweet cherry cluster (grey) and tree averaged fitted curve (dashed line) according to Equation (12).
Horticulturae 10 00757 g005
Figure 6. Non-dimensional fractional temperature change (Y) during temperature adaptation according to Equation (12) and fitted heat transfer coefficient k for low, mid, and high density ratios of canopy points to fruit points in the overall canopy point cloud. Mean and standard deviations among all fitted k were presented as increment and error bars, respectively.
Horticulturae 10 00757 g006
Figure 7. Dew point threshold index (Ydew) over time for low, mid, and high density ratios (ac) considering the leaf–wood point to fruit ratio for each of the 62 scanned sweet cherry point clouds. Symbol color appears according to wetness class for the following: W0 (black), W1 (blue), W2 (green), and W3 (red).
Horticulturae 10 00757 g007
Figure 8. Density curves of Ydew for all wetness classes for all point clouds with low (a), mid (b), and high (c) density ratios.
Horticulturae 10 00757 g008
Table 1. Number of segmented sweet cherry clusters per tree. Each sweet cherry point cloud was scanned at time ti (min) for each whole-canopy scan.
Tree Numbert1t2t3t4t5t6No. Point Clouds
#1520355017
#25203512
#35203511
#410203040507
#55203550658015
Table 2. Delimitation parameters for local identification within the five monitored sweet cherry canopies.
ParameterSweet Cherry Canopy (No.)
#1#2#3#4#5
ϕlim (rad)1.351.501.501.501.50
xleft (m)0.120.200.25
xright (m)0.3000.5000.50
Table 3. The goodness of fit for heat transfer coefficient (k) considering all fruit clusters at all measuring times (Table 1, n = 62) according to Equation (12).
TreekRMSER2
#10.130.090.86
#20.190.060.93
#30.260.130.79
#40.200.050.97
#50.120.050.98
Mean0.18
p-value>0.05
Table 4. Mean canopy-to-sweet cherry cloud density ratio (Rdensity), fitted heat transfer coefficient (k), R2 and RMSE between fitted and measured non-dimensional temperature change (Y) of all sweet cherry with low, mid, and high (n = 62) point density ratios according to the percentile classification.
VariableRdensity
LowMidHigh
Rdensity (×104)0.41.24.2
k0.220.180.16
R20.890.900.87
RMSE0.110.090.08
Disclaimer/Publisher’s Note: The statements, opinions and data contained in all publications are solely those of the individual author(s) and contributor(s) and not of MDPI and/or the editor(s). MDPI and/or the editor(s) disclaim responsibility for any injury to people or property resulting from any ideas, methods, instructions or products referred to in the content.