Article

Genetic Assessment, Propagation and Chemical Analysis of Flowers of Rosa damascena Mill. Genotypes Cultivated in Greece

by
Fotios-Theoharis Ziogou
1,†,
Aikaterini-Angeliki Kotoula
1,†,
Stefanos Hatzilazarou
1,†,
Emmanouil-Nikolaos Papadakis
2,
Panos-George Avramis
3,
Athanasios Economou
1,* and
Stefanos Kostas
1,*
1
Laboratory of Floriculture, School of Agriculture, Aristotle University, 54124 Thessaloniki, Greece
2
Pesticide Science Laboratory, School of Agriculture, Aristotle University, 54126 Thessaloniki, Greece
3
Avramis Nurseries, Miden Loudia, 58100 Giannitsa Pella, Greece
*
Authors to whom correspondence should be addressed.
These authors contributed equally to this.
Horticulturae 2023, 9(8), 946; https://doi.org/10.3390/horticulturae9080946
Submission received: 22 July 2023 / Revised: 14 August 2023 / Accepted: 17 August 2023 / Published: 20 August 2023

Abstract

:
Rosa damascena Mill. is commercially the most important rose species used to produce essential oils. The plants of this species, cultivated in the district of Western Macedonia (Greece) for rose oil production, originated from indigenous genotypes but also nurseries abroad, mainly from Bulgaria. The present study investigated the genetic relationship between nine genotypes of R. damascena from Greece, one genotype from Turkey, three genotypes from Bulgaria and three genotypes from France using the molecular markers ISSR and SCoT. Also, the rooting ability of shoot cuttings from these nine genotypes was investigated by applying 2 g/L of the rooting regulator K-IBA. In addition, petals were chemically analyzed using GC-MS and LC-MS to identify the compounds that are the main components of the rose oil. The nine rose genotypes of R. damascena, cultivated in Greece, one from Turkey and one of the three genotypes from Bulgaria were clustered in one clade in the dendrogram. The other two genotypes from Bulgaria were clustered in a separate clade that demonstrated the existence of genetic diversity among the three Bulgarian genotypes, while the French genotypes were clustered in a third clade. The shoot cuttings rooted relatively easily (55–70%) with the application of K-IBA, without any significant differences among the nine genotypes. Large variation was observed among the nine genotypes in the main volatile compounds of the flower petal extracts, which are related to rose oil components. For these compounds, the concentrations in μg/g of the fresh petal weight were 2-phenylethylalcohol (1148.35–2777.19), nerol (27.45–64.93), citronellol (88.45–206.59), geraniol (69.12–170.99) and nonadecane (209.27–533.15). Of the non-volatile compounds, gallic acid was the most abundant phenolic acid in the petal extracts of the nine genotypes (0.28–0.82 μg/g), while for the flavonoids, quercetin and kaempferol variations of 0.35–1.17 μg/g and 0.26–2.13 μg/g were recorded, respectively.

1. Introduction

Rosa damascena Mill., a hybrid belonging to Rosaceae, has been known since ancient times [1,2,3]. In addition to its ornamental value, it is also cultivated as an aromatic and medicinal plant for the production of essential oil, rose water, etc. Some of the characteristic actions of its products are antimicrobial, anti-inflammatory [4], anti-cancer, relaxing and antidepressant, as well as antioxidant and analgesic properties [5]. Natural compounds from flower extracts, such as polyphenols and flavonoids, have antioxidant and anti-aging effects and help protect the skin from light and moisture [6]. Rose water also has many healing properties, such as beneficial effects on the digestive and respiratory systems, and it helps heal wounds and acts against colds [7]. Rose oil has often been used to treat migraines in traditional Persian medicine [8].
Despite the large number of cultivated rose varieties, only a few rose species manifest the characteristic strong aroma. There are mainly four species of oil-producing roses: R. damascena Mill., R. gallica L., R. moschata Herrm. and R. centifolia L. In Morocco and France, R. centifolia is mainly cultivated, while in Egypt and China, this applies to R. gallica L. and R. rugosa, respectively [9]. Bulgaria, Turkey and Iran are the main countries cultivating R. damascena Mill. (a hybrid between R. gallica L. and R. moschata J. Herm. or R. phoenicia Boiss.) [9,10,11,12]. R. damascena Mill. is the most important species of the Rosaceae family, with its long-term use in the production of essential oil [13]. Bulgaria and Turkey are the countries with the highest production of rose oil [14,15].
R. damascena has a tetraploid genome (8n = 56) with probable triparental origin [16,17,18]. Being a heterogygous and polyploid species, preference is given to asexual reproduction that ensures the stability of the desired characteristics, i.e., the high productivity and quality of rose oil [19]. Thus, commercial propagation is carried out with shoot cuttings [20] obtained from superior clones in order to preserve the quality of the traditional product. The rooting of shoot cuttings remains the simplest and most efficient method for producing new plants similar to the mother plants of R. damascena [21,22].
Molecular markers have proven to be valuable tools for species identification, but also for the characterization and evaluation of genetic diversity within and between species [23,24], because the DNA polymorphism detected by these markers is not affected by the environment [25]. Inter Simple Repeated Sequence (ISSR) markers as well as Start Codon Targeted (SCoT) markers have been widely used in PCR techniques in recent years, providing valuable tools for the rapid genetic characterization of organisms and a relatively cost-effective method of determination [23,26,27,28,29,30].
Essential oils form mixtures of organic substances, the proportion of which varies from plant to plant and which is directly related to the stage of plant development, cultivation practices, climatic conditions of each region and soil composition [31,32]. In addition to these, the yield and composition of rose oil are also influenced by the stage of development of the flowers, the date and time of harvest, storage and processing, as well as the distillation process [14,32,33,34,35,36,37]. The chemical components of the essential oils that give them their characteristic aroma and medicinal properties are alcohols (2-phenylethylalcohol, geraniol, nerol and citronellol), aldehydes, ketones, phenols, acids and esters, whereas hydrocarbons (nonadecane) do not participate in the above properties [6,13,38,39]. It has been reported that the lower the level of hydrocarbons, the better the quality of rose oil obtained and their role lies in the stability of the aroma of the essential oil [6].
According to Ncube et al. [40], the basic parameters that generally affect the quality of the extract are (i) the plant part used as raw material, (ii) the solvent used for extraction and (iii) the extraction technology. The effect of the plant material depends on the nature of the plant material, its origin, the degree of processing, the moisture content and the particle size, while changes in the extraction method include the type of extraction, the extraction time and the temperature [40]. Solvent extraction results in the recovery not only of volatile substances but of all essential oil compounds [41]. During extraction, the solvent diffuses into the solid plant material and solubilizes compounds with similar polarity [40,42]. The most commonly used solvents are hexane and petroleum ether [31,41].
The effective detection and identification of the chemical compounds of rose flower petals and rose oil requires methods such as gas chromatography in combination with flame ionization detection (GC-FID). Using these methods, 132 compounds were identified in rose absolute, mainly mono- and sesquiterpenoids [13]. Furthermore, the main components, representing 80–95.5% of the total content of detectable compounds, were quantified with the GC-FID method.
The cultivation of R. damascena for rose oil production is a relatively recent crop process in Greece. Its cultivation is concentrated in the region of Western Macedonia, which has favorable climatic and soil conditions for rose plant growth and development. There is an increasing interest in expanding cultivation due to the apparent good quality of rose oil produced so far [1]. The genetic material of the cultivated plants consists of indigenous genotypes of the region but also genotypes imported from abroad and mainly from Bulgaria.
The aim of the present study was to assess the genetic diversity of nine genotypes of R. damascena Mill. cultivated in Greece for the production of rose oil and their relationship with genotypes of other countries, using ISSR and SCoT markers, as well as to investigate their ability to be reproduced vegetatively through shoot cuttings. A further aim was to identify, by using GC-MS and LC-MS analyses, the major compounds contained in their flower petal extracts, which are a potential indicator for the composition of the produced rose oil.

2. Materials and Methods

2.1. Plant Material

The plant material used in the present study consisted of 16 genotypes of R. damascena Mill. including nine genotypes from different locations of Greece, one from Turkey, three from France and three from Bulgaria (Table 1). The plants of R. damascena from Greece were cultivated in the region of Western Macedonia exclusively for the production of rose oil and rose water. During the flowering period (May of 2020), flowers were collected early in the morning from the nine genotypes, grown in Greece and transferred in dry ice to the Laboratory of Floriculture of the Aristotle University, Thessaloniki where they were stored at −80 °C. In addition, leaves of R. damascena were collected from the nine genotypes of Greece, as well as from plants maintained in nurseries of Turkey, France and Bulgaria, which were then transferred to the Laboratory of Floriculture where they were stored at −20 °C. Also, shoots were collected from the same previously mentioned plants of the nine genotypes, early in November, for the needs of the propagation experiment.

2.2. Genetic Assessment

2.2.1. DNA Extraction

For the molecular analysis of plant material, young leaves were used, which were ground in liquid nitrogen using pre-cooled mortars and pestles. Afterwards, total genomic DNA (gDNA) was extracted from the samples using the CTAB (cetyl-trimethyl ammonium bromide) method [43] as described by Tsaktsira et al. [44]. To evaluate and determine the quality and quantity of the isolated DNA, electrophoresis in 0.8% agarose gel was performed against a known concentration of unrestricted lambda phage DNA, as well as spectrophotometry on a NanoDrop 2000/2000c Spectrophotometer (Thermo Electron Corporation, Waltham, MA, USA). The samples were maintained at −20 °C until further use.

2.2.2. Molecular Markers and PCR Amplification

For the genetic analysis of the 16 genotypes of R. damascena, 21 ISSR and 10 SCoT primers (Integrated DNA Technologies, Coralville, IA, USA) were tested, with different combinations of annealing temperatures. Of these, only primers that generated consistent bands in two to three runs were selected for use and these were five ISSR and five SCoT primers (Table 2).
The PCR amplifications were carried out in a SimpliAmpTM Thermal Cycler (Life Technologies, Thermo Fisher Scientific, Waltham, MA, USA). The PCR reactions were performed in a 15 μL total volume, which consisted of 7.5 μL of a Taq DNA Polymerace Master Mix (Canvax Biotech, Cordova, Spain), 1.5 μL of a primer, 1.5 μL of isolated DNA per sample (20 ng/μL) and 4.5 μL of sterile distilled H2O. The PCR mixture was subjected to dwelling for 3 min at 95 °C, 35 cycles of 30 s at 95 °C, 30 s at the chosen annealing temperature of each primer (Table 2) and 2 min at 72 °C, followed by a final extension cycle of 2 min at 72 °C. The amplified fragments of DNA were separated with electrophoresis in 1.2% agarose gel together with a 1 kb DNA Ladder (Kapa Biosystems, Boston, MA, USA) in a 1× TAE buffer, stained with ethidium bromide (0.5 mg/mL) and photographed under UV light in a gel doc system with a camera. Two independent PCR amplification reactions were performed for each sample.

2.2.3. Data Analysis

The score of ISSR and SCoT bands for each genotype was carried in a binary mode, with 1 indicating its presence and 0 its absence. For each primer, the number of polymorphic bands (NPB), total amplified bands (TAB) and the percentage of polymorphism bands (PPB) were calculated. Also, the resolving power (RP) for each primer was calculated with the equation RP = ΣIb, where Ib (band informativeness) is given using the formula Ib= 1 − (2 × |0.5 − p|), where p is the proportion of the 16 genotypes containing the band [45]. The polymorphism information content (PIC) was calculated as PIC = 1 − [f2+ (1 − f)2], where f is the marker’s frequency in the data set with a maximum value of 0.5 [46], while the marker index (MI) was calculated as MI = n × β × PIC, where n is equal to the mean number of amplified bands per genotype of every primer used in this study, and β is the fraction of polymorphic markers and is given using the ratio of NPB to TAB [47]. The data obtained from the ISSR and SCoT primers were analyzed separately and in combination through the program GenAIEx 6.501 (Genetic Analysis in Excel, Australian National University) and presented in three PCoA (Principal Coordinates Analysis) diagrams [48]. Furthermore, the data were subjected to the cluster analysis of UPGMA (Unweighted Pair Group Method Analysis with the arithmetic mean) and dendrograms were constructed through MEGA 4 (Molecular Evolutionary Genetic Analysis) software [49,50]. The analysis of the data was carried out with the software STRUCTURE (ver. 2.3.4) [49], while the delta K values were calculated with the STRUCTURE HARVESTER program (available at https://taylor0.biology.ucla.edu/structureHarvester/, accessed on 8 August 2023) [51,52].

2.3. Propagation

2.3.1. Rooting of Shoot Cuttings

Semi-hard wood shoots, 30–40 cm long, were collected from plants of the nine genotypes of Greece in November, after being wrapped in moistened paper, placed in plastic bags and kept at 4 °C for 1 day. From these shoots, terminal cuttings 14–17 cm long and 0.6–1.0 cm in diameter were cut off, while the leaves of their bases were removed. Afterwards, the basal part (1–2 cm) of the cuttings was immersed in an aqueous solution of 2 gL−1 of K-IBA (potassium salt of indole-3-butyric acid) (Sigma-Aldrich, St Louis, MO, USA) for 10 s, and then the cuttings were planted for rooting in plastic boxes (40 × 25 × 10 cm) containing a 1:1 mixture of peat TS2 Klasmann (Klasmann-Deilmann, Geeste, Germany) and perlite (Isocon, Athens, Greece). The boxes with the shoot cuttings were transferred for rooting to the fog system, with a relative humidity of 90–95%, bench temperature of 20–21 °C and ambient temperature of 20–22 °C, where they remained for 2 months. Forty shoot cuttings were used for each of the nine genotypes. At the end of the 2-month rooting period, the rooting rate was estimated and, at the same time, the number and length of roots formed were recorded. A shoot cutting was considered rooted when at least one root ≥ 0.5 cm long was produced.

2.3.2. Data Analysis

For the rooting experiment, a completely randomized design was applied, while a one-way ANOVA (analysis of variance) was employed to analyze the data. The rooting percentages were subjected to arcsine transformation for proportions prior to the statistical analysis and converted back to percentages for table presentation. The comparisons of the means were made using Duncan’s multiple range test at p ≤ 0.05. The statistical analysis was performed using the statistical package SPSS 27 (IBM, Armonk, NY, USA).

2.4. Chemical Substances Analysis

2.4.1. Volatile Substances

The method followed was based mainly on the report of Rusanov et al. [53]. From the flowers of the nine genotypes from Greece stored at −80 °C, 1 g of petals was ground in a porcelain mortar in liquid nitrogen. The ground tissue was then placed in 4 mL glass bottles followed by the addition of 2 mL of hexane, containing 100 μg/mL of C-14 as an internal standard, for the analysis in a mass chromatograph (GC-MS). Immediately after that, the glass bottle was placed for 3 h and 30 min in a vortex device, at 2000 rpm, at room temperature. At the end of the extraction, the remaining water was removed by adding 500 mg of anhydrous sodium sulfate to the sample, which was then vortexed for another 15 min. The bottles with the samples were centrifuged at 3500 rpm for 10 min at 5 °C. Finally, 1.5 mL of the supernatant was transferred into a 2 mL glass vial via a 0.22 μm PTFE (hydrophobic) filter.
For the chromatographic determination of the volatile compounds, a TRACE GC Ultra gas chromatography system with a Polaris Q mass spectrometer (ion trap) (Thermo Electron Corporation, Milan, Italy) was used. The chromatographic analysis was carried out on a capillary column, DB-5MS (Agilent, Santa Clara, CA, USA), with a length of 30 m, an inner diameter of 0.25 mm and a film thickness of 0.25 μm. Helium was used as the mobile phase with a flow of 1 mL/min. The injector temperature was 250 °C. Injections of 1 μL were performed in the split mode (split ratio of 1:10). The temperature program of the analysis was as follows: The initial temperature of the column oven was 40 °C and remained constant for 3 min, followed by a linear ramp to 300 °C at a rate of 5 °C/min, where it remained constant for 5 min.
The eluted compounds were detected with an ion trap mass detector, employing electron ionization (EI). The collection and trapping of ions were carried out in a mass range/charge (m/z) range of 30–550 amu. Signal acquisition was performed in the Full Scan mode. Analyte identification was based on the Kovats Retention Index and mass spectra comparisons to the NIST (National Institute of Standards and Technology, Gaithersburg, MD, USA) library.

2.4.2. Non-Volatile Substances

Similar to the previous section, extractions were carried out for non-volatile compounds. An amount of 1 g of fresh petals was pulverized in liquid nitrogen and the resulting powder was placed in 15 mL eppendorf tubes. Homogenization was performed with 2 mL of 80% methanol in water and followed by 1-hour stirring in a vortex apparatus at 3000 rpm at room temperature. The extracted samples were then centrifuged for 15 min at 10,000 rpm to separate the liquid phase. Finally, 0.6 mL of the supernatant was transferred to a 2 mL glass vial via a special 0.22μm PTFE (hydrophobic) filter for the immediate chromatographic analysis.
The analytical standards used had a purity of more than 95%. Standard solutions of individual compounds were prepared in methanol at a concentration of 0.5 mg/mL and stored at −25 °C. The above solutions were used to prepare intermediate concentration standard solutions in methanol, which contained the target compounds at a concentration of 50 μg/mL. Then, for gallic acid, working standard solutions at concentrations of 0.25, 0.5, 1, 5, 10 and 25 μg/mL were prepared by diluting the intermediate concentration standard solution (concentration: 50 μg/mL) in methanol, while for the other compounds, working standard solutions were prepared at concentrations of 0.25, 0.5, 1, 5 and 10 μg/mL by diluting the respective intermediate concentration standard solutions (concentration: 50 μg/mL) to 25:75 (methanol/0.1% formic acid). All of the above solutions were used to construct calibration curves.
For the determination of the polyphenols in the prepared extracts, a liquid chromatography system with a mass spectrometry detector was used, consisting of a ternary Surveyor LC pump with a built-in mobile phase solvent degasser, an autosampler and a TSQ Quantum Discovery Max triple quadrupole mass spectrometer (Thermo Electron Corporation, Waltham, MA, USA). For the chromatographic separation, aHyPurity C18 chromatographic column was used, with a length of 150 mm, an inner diameter of 2.1 mm and a particle size of 5 μm (Thermo Fisher Scientific, Waltham, MA, USA) thermostated at 40 °C. The injection volume was 1 μL for gallic acid and 10 μL for the rest of the compounds. Mobile phase A consisted of 0.1% formic acid in water, while mobile phase B consisted of 0.1% formic acid in methanol. The chromatographic analysis for the determination of gallic acid was performed under isocratic conditions, with a ratio of mobile phase A/mobile phase B of 95:5 (v/v). The chromatographic analysis for the determination of the remaining compounds was performed according to the gradient elution regime shown in Table 3.
The source type of the mass spectrometer was electrospray ionization (ESI). The operating conditions of the ESI were as follows: sheath gas (nitrogen) was 50 units, auxiliary gas (nitrogen) was 10 units, the spray voltage was 4000V and the temperature of the capillary was 375 °C. Also, the collision gas pressure (Ar) was 1.5 mTorr and the polarity was negative. The signal was recorded in the Selected Reaction Monitoring (SRM) mode. The analyses were identified based on the retention time of each standard solution and by comparing the ion signal ratio of the quantification and confirmation ions in each sample to the respective ion ratio of the standard solution (Table 4). The entire system was controlled via a computer using Xcalibur software (Thermo Electron Corporation, Waltham, MA, USA).
The calibration curve for each analyte was constructed by injecting the working standard solutions into the chromatographic system. The correlation of the concentration of each analyte with the response of the detector was performed by applying the method of least squares and the corresponding correlation coefficient was calculated. In all cases, the calibration curves were linear throughout the range of concentrations examined and the correlation coefficient was greater than 0.99. For the determination of gallic acid, the extract was injected into the chromatographic system as is, while for the determination of the remaining compounds, 0.2 mL of each sample was diluted in 0.4 mL of a 0.1% formic acid solution in water (Figure 1).

2.4.3. Data Analysis

All chemical analyses of the flower petal extracts of the nine genotypes from Greece, in gas and liquid chromatography, were performed on five samples for each genotype (n = 5). The statistical analysis of the data was based on the analysis of variance (ANOVA) using IBM SPSS Statistics for Windows, v.25 (IBM Corp., Armonk, NY, USA). Duncan’s multiple range test was applied to distinguish statistically significant differences among means at p ≤ 0.05.

3. Results and Discussion

3.1. Genetic Assessment

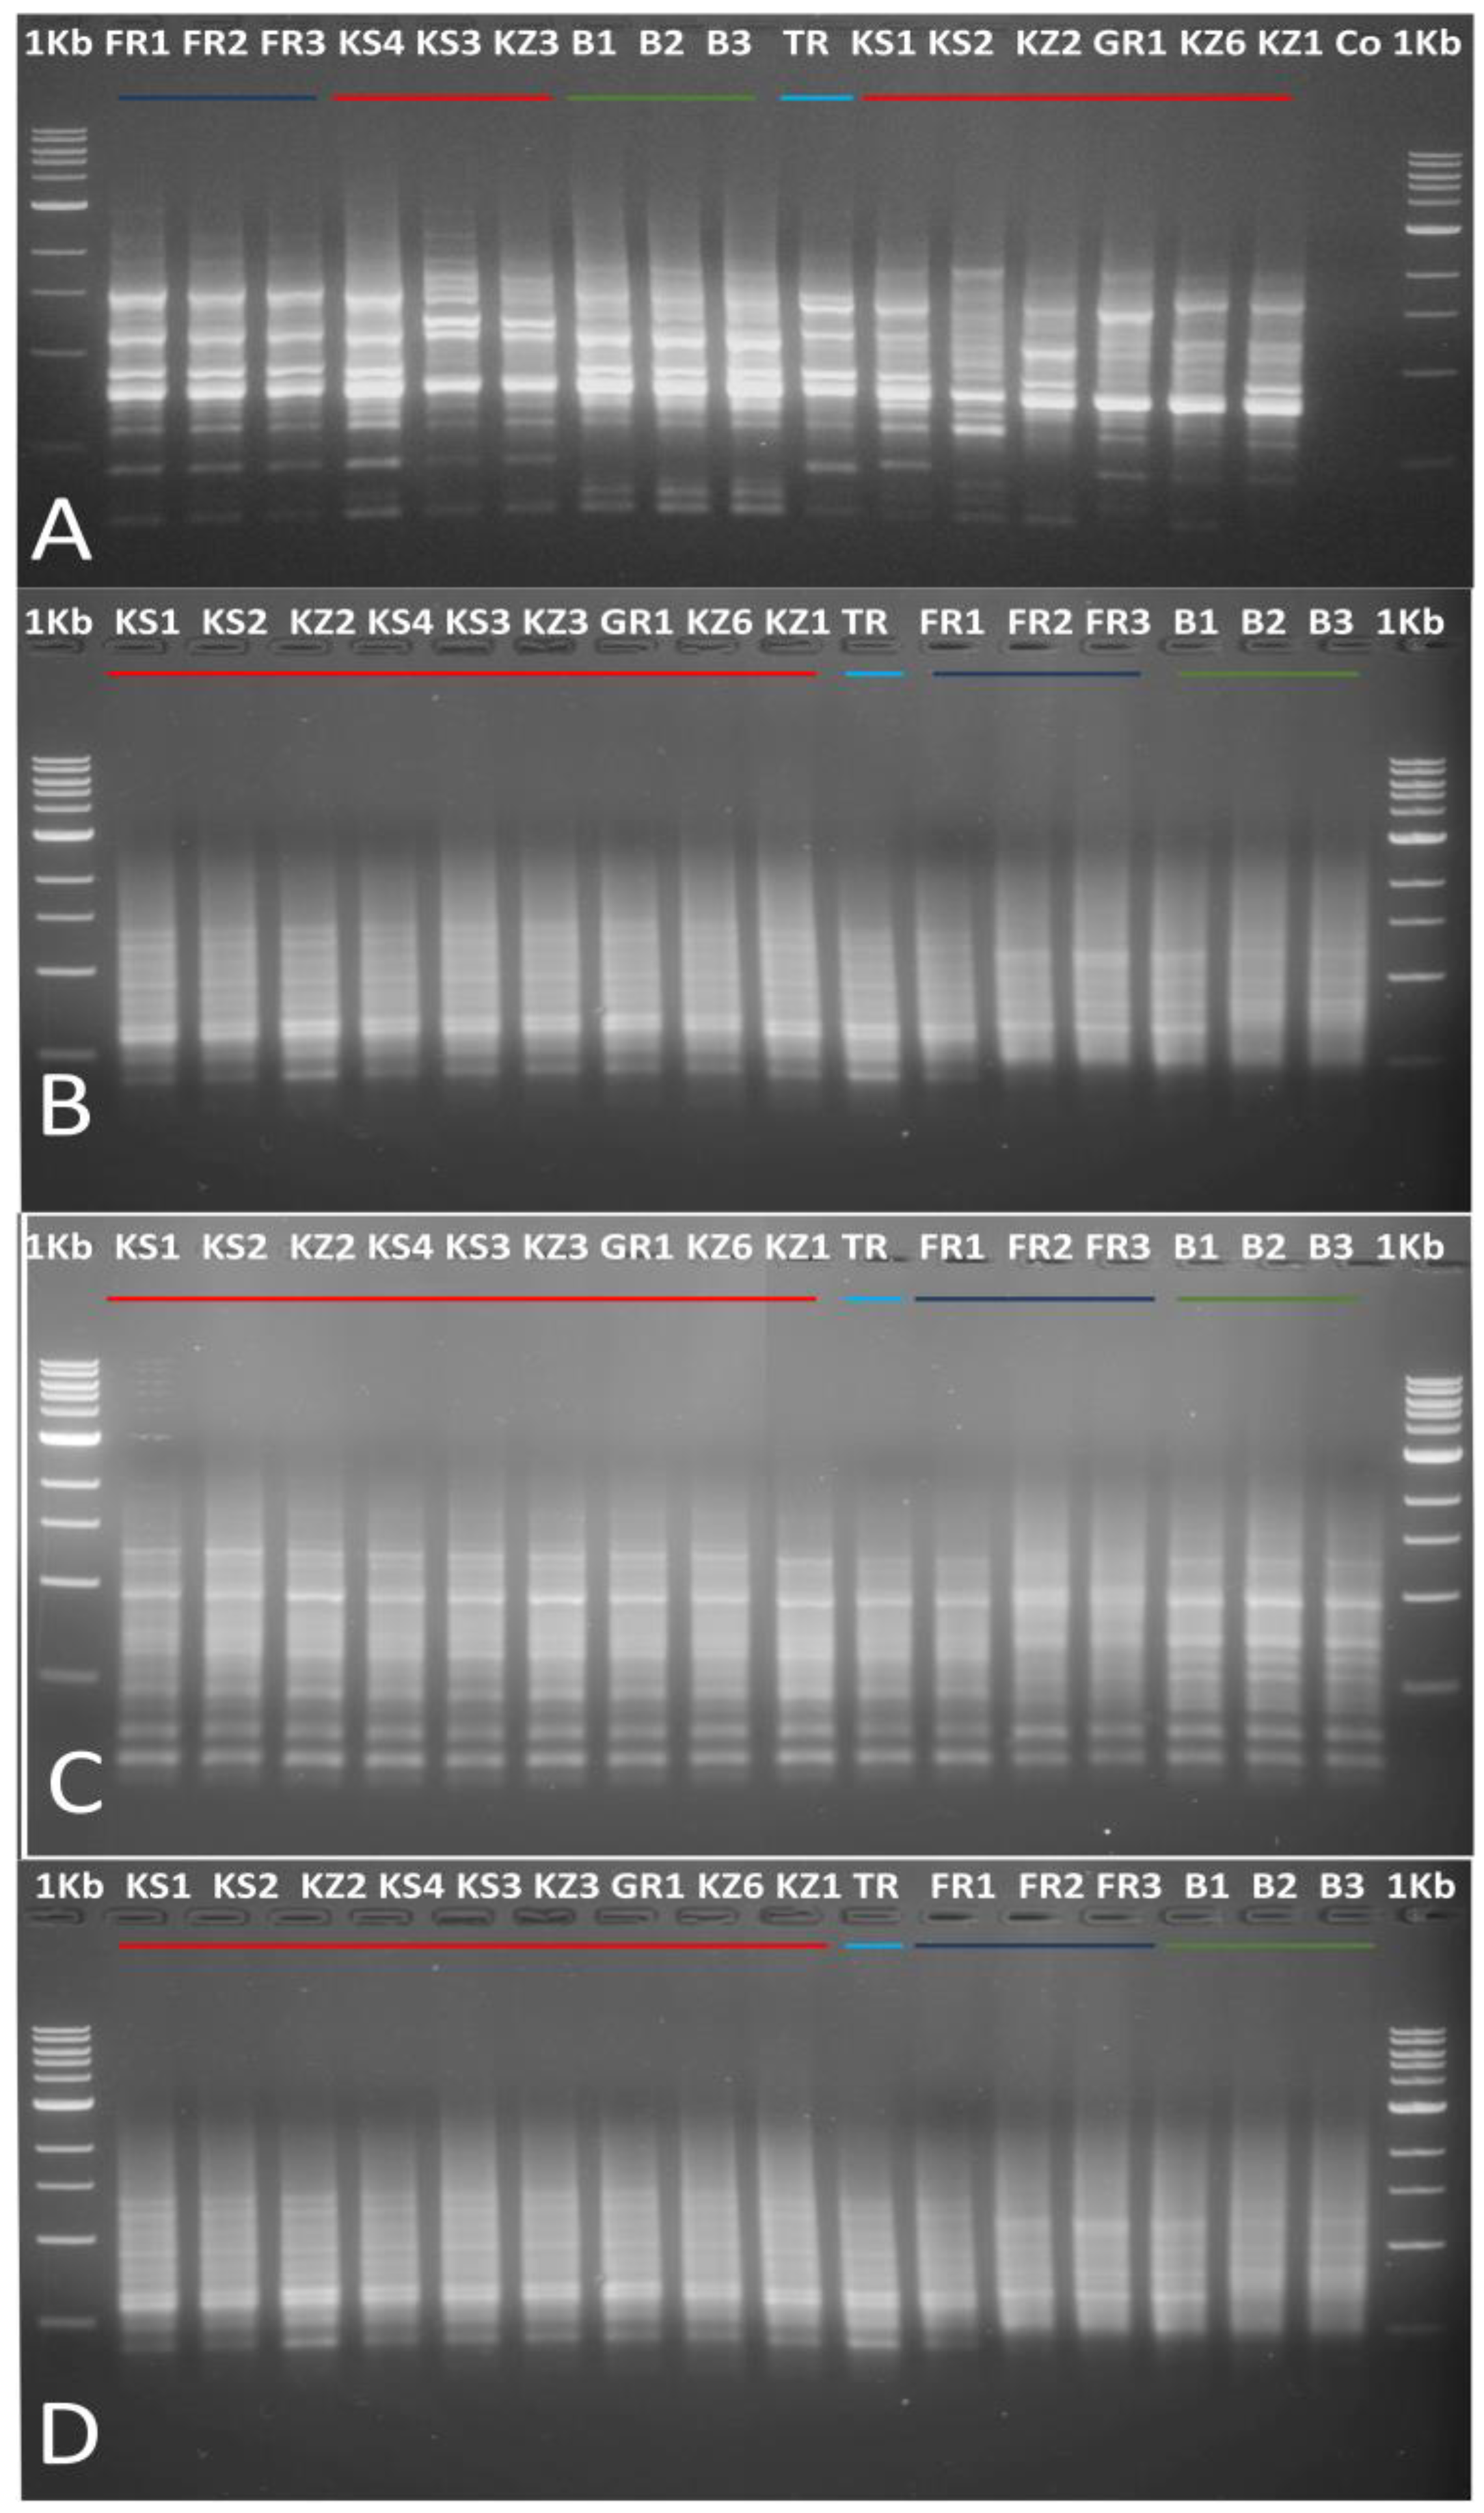
3.1.1. Use of ISSR and SCoT Markers

The five ISSR and five SCoT primers used were consistent for the presence and intensity of the bands, as shown in Figure 2 for SCoT 313 (A) and 330 (B) primers as well as for ISSR UBC-810 (C) and UBC-841 (D) primers. The amplification profiles of the used five ISSR and five SCoT primers are presented in Table 5. The total amplified bands produced, using the five ISSR and five SCoT primers, totaled 180, of which 141 of them were polymorphic (Table 5). Specifically, the five ISSR primers generated 88 loci, 70 of them being polymorphic fragments, accounting for polymorphism from 61.54% (UBC-815) to 86.67% (UBC-841). The total number of bands per primer varied from 13 (UBC-815) to 23 (UBC-810). To determine the PIC values of each ISSR marker, the mean of the PIC value for all amplified fragments was estimated. PIC values were between 0.20 (UBC-815) and 0.33 (UBC-841). The marker index (MI) was also calculated to examine the usefulness of the ISSR markers. It was found that the highest value of MI was 2.95 (UBC-810) and the lowest was 1.05 (UBC-815). Finally, the calculation of the resolving power (RP) presented values for ISSR primers from 3.5 (UBC-815) to 9.38 (UBC-810). In the case of SCoT primers, the amplified fragments totaled 92 with polymorphism values from 62.50% (primer 301) to 85.00% (primer 313). The largest number of amplified bands was achieved with primers 303 and 330 (23) and the lowest with primer 301 (10). The PIC values of the five SCoT primers varied from 0.22 (primer 315) to 0.33 (primer 301). Primer 330 presented the highest values of RP (9.25) and MI (3.04), while the lowest values of RP (5.25) and MI (1.49) were recorded for primers 301 and 315, respectively (Table 5).
The genetic analysis of the 16 genotypes of R. damascena from Greece, Turkey, Bulgaria and France, by using ISSR and SCoT markers, revealed varied polymorphism percentages (Table 5). However, these molecular markers exhibited similar values for PIC, RP and MI, with SCoT primers showing slightly higher values than ISSR primers. The PIC, which shows the amount of polymorphism and varies from 0 to 0.5 [6,54], was relatively high for both the ISSR (mean: 0.27) and SCoT (mean: 0.28) primers used, demonstrating that both these markers were equally effective in detecting polymorphism in the genotypes tested (Table 5). In addition, MI and PR, which show the ability of primers to distinguish genotypes, with their high values, indicated that the ISSR and SCoT markers were effective in discriminating the 16 genotypes. These findings are consistent with a number of reports using ISSR and ScoT primers [23,28,29,30], although in the genetic analysis of R. damascena, markers such as RAPD, SSR, AFLP and microsatellites have been used [9,11,55,56,57,58].

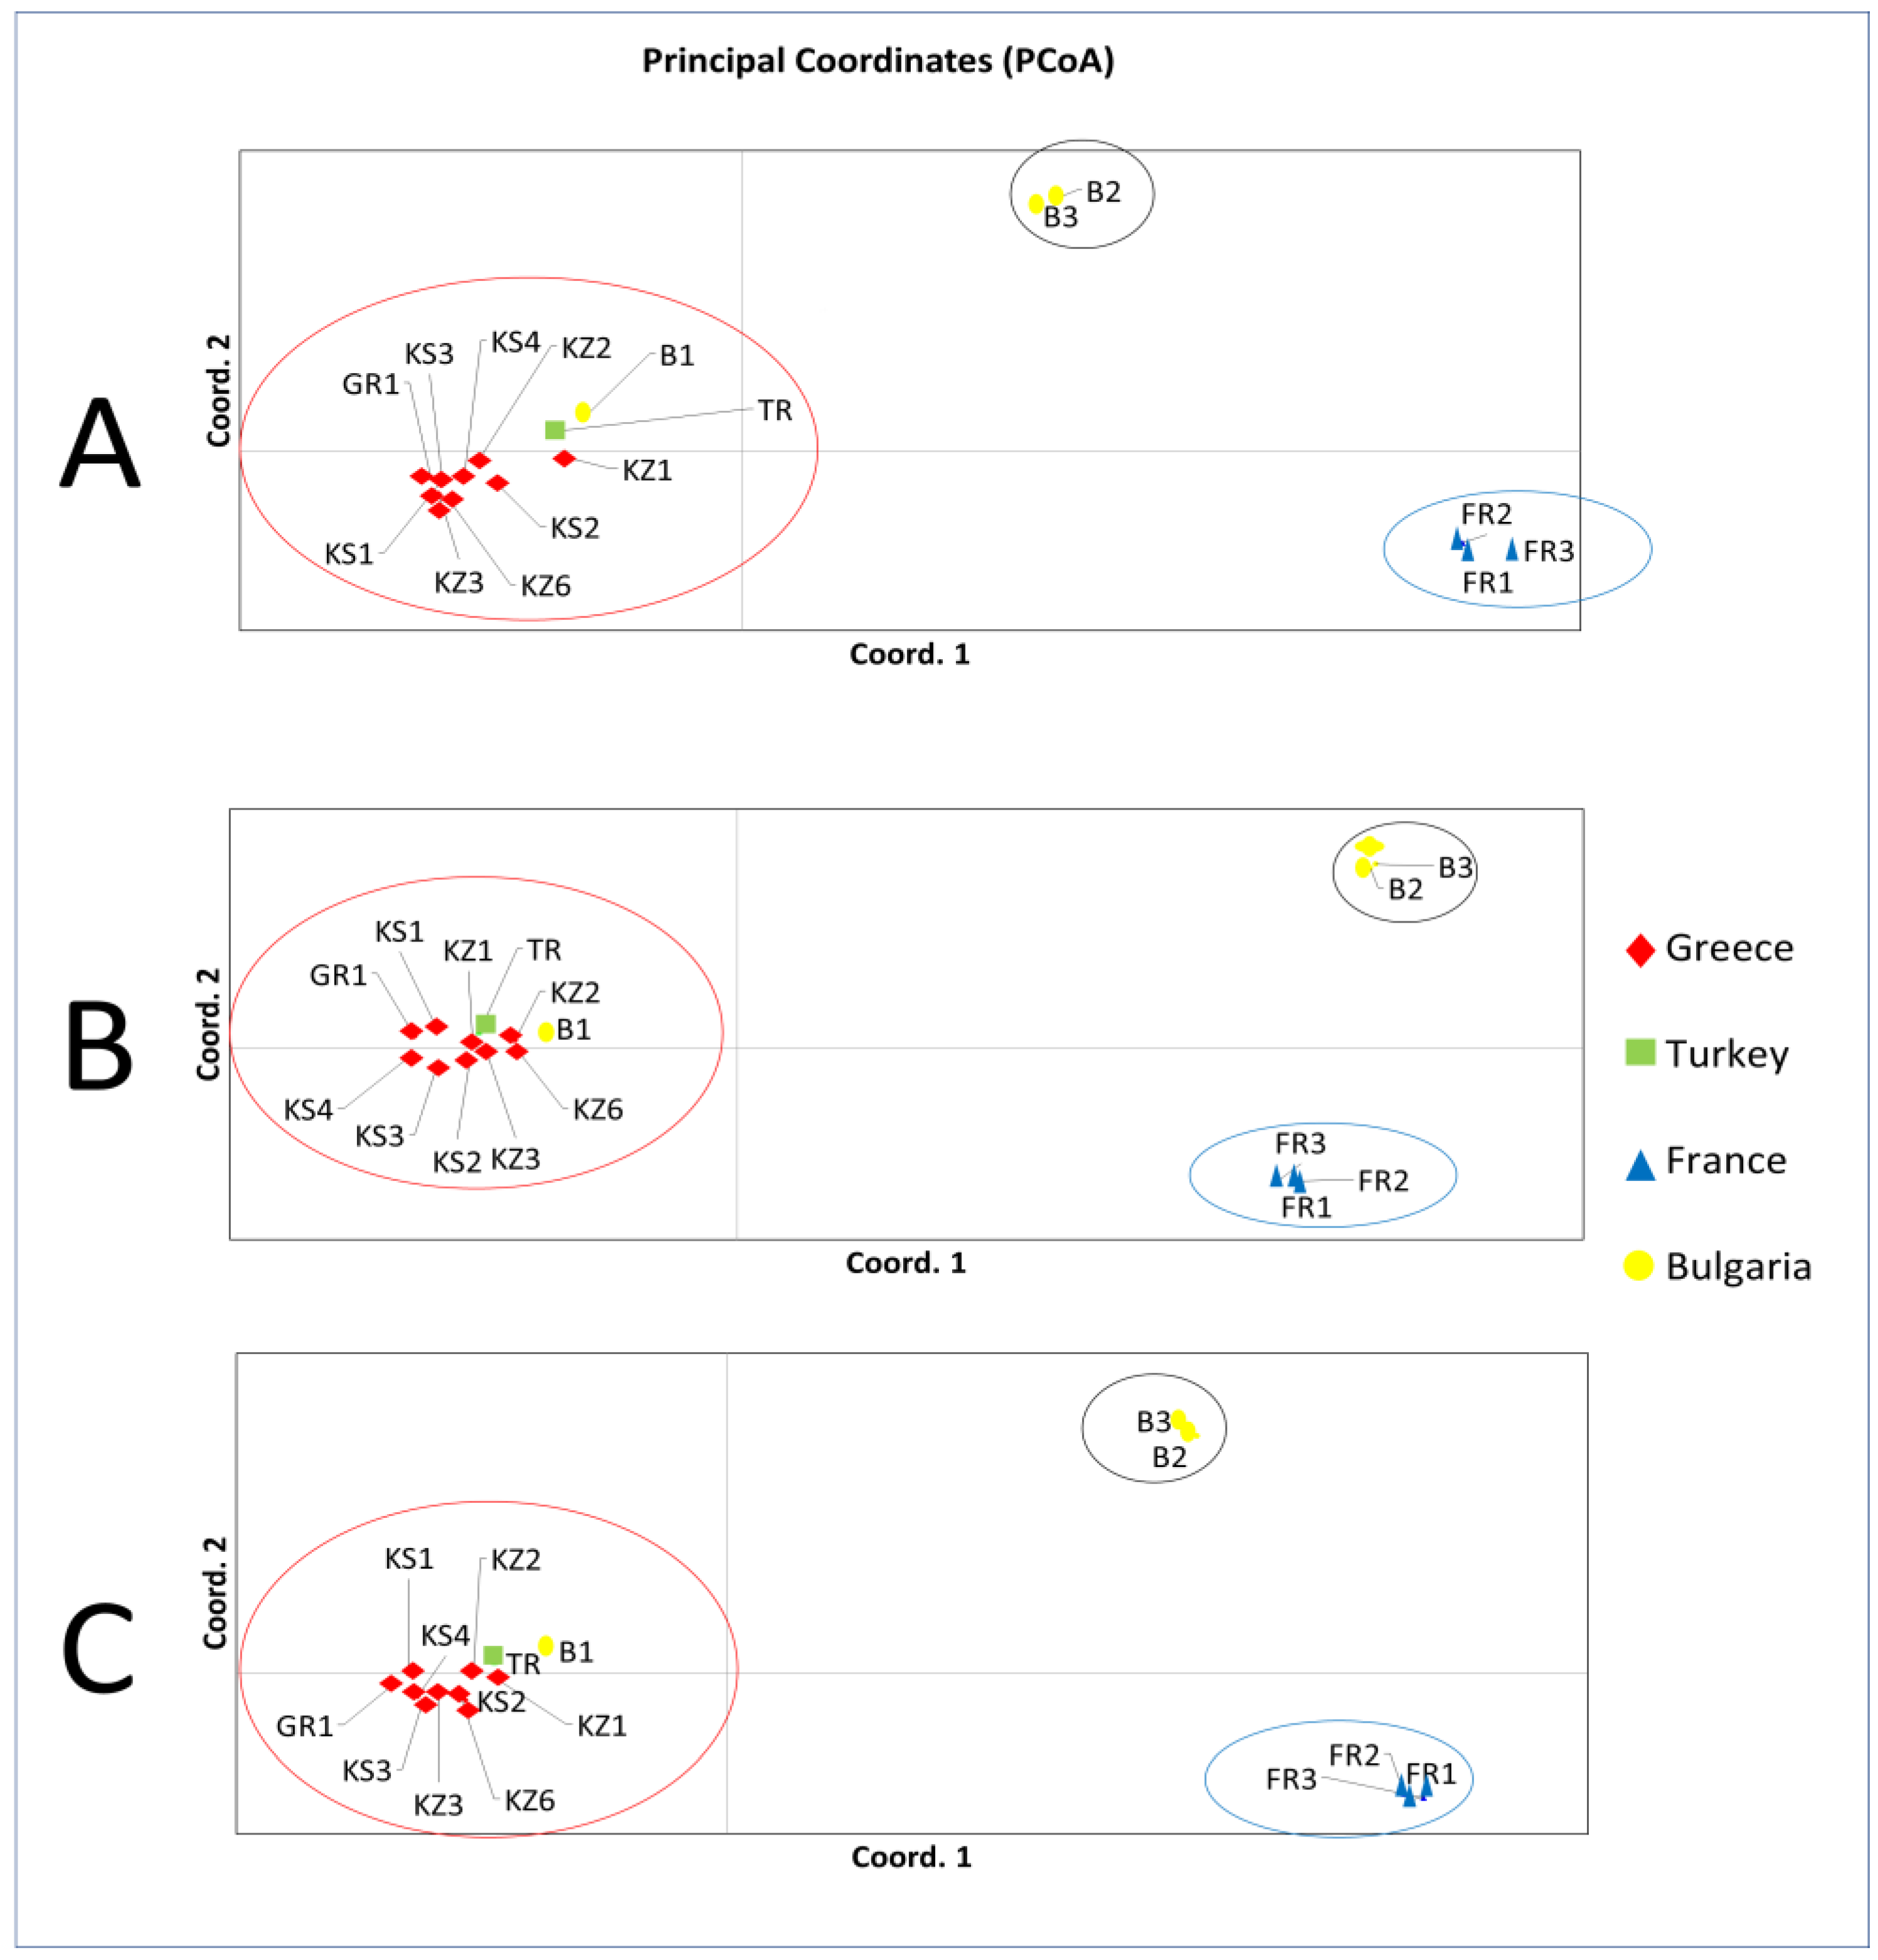
3.1.2. Principal Coordinates Analysis (PCoA)

As shown in Figure 3, the principal coordinates analysis (PCoA) based on ISSR primers (A) was close to PCoA based on SCoT primers (B) and the combination of ISSR and SCoT primers (C). In all three diagrams, three clusters of genotype samples were clearly separated. The first three principal coordinate components accounted for a mean of 45.05% (46.10% for A, 44.52% for B and 44.53% for C), 25.32% (23.2% for A, 27.11% for B and 25.64% for C) and 8.01% (9.45% for A, 7.10% for B and 7.49% for C) variation, respectively. The first cluster included all genotypes from Greece, the unique genotype from Turkey and one of the three genotypes from Bulgaria. The second distinguished cluster included the remaining two genotypes from Bulgaria and, finally, the third cluster included all three genotypes from France used in this study.
The three PCoA diagrams, created with the ISSR and SCoT markers as well as their combined data, are almost similar (Figure 3A–C). The nine genotypes from Greece (from KS1 to GR1), the genotype TR from Turkey and one (B1) of the three genotypes from Bulgaria were very close to each other in all three diagrams (Figure 3A–C, red circles), implying that their genetic distance is small and the genetic variation among them is low. Studies by other researchers showed that genotypes of R. damascena from Bulgaria, Turkey, Iran and India did not have significant genetic distance, or in other words, had the same origin [9,10,59]. The second cluster of PCoA diagrams of this study (black circles) included the other two genotypes from Bulgaria, implying the genetic polymorphism of the Bulgarian plant material of R. damascena. Finally, the third cluster (blue circles) included all three genotypes from France, representing a homogenous population, which was genetically distant from the other examined genotypes.

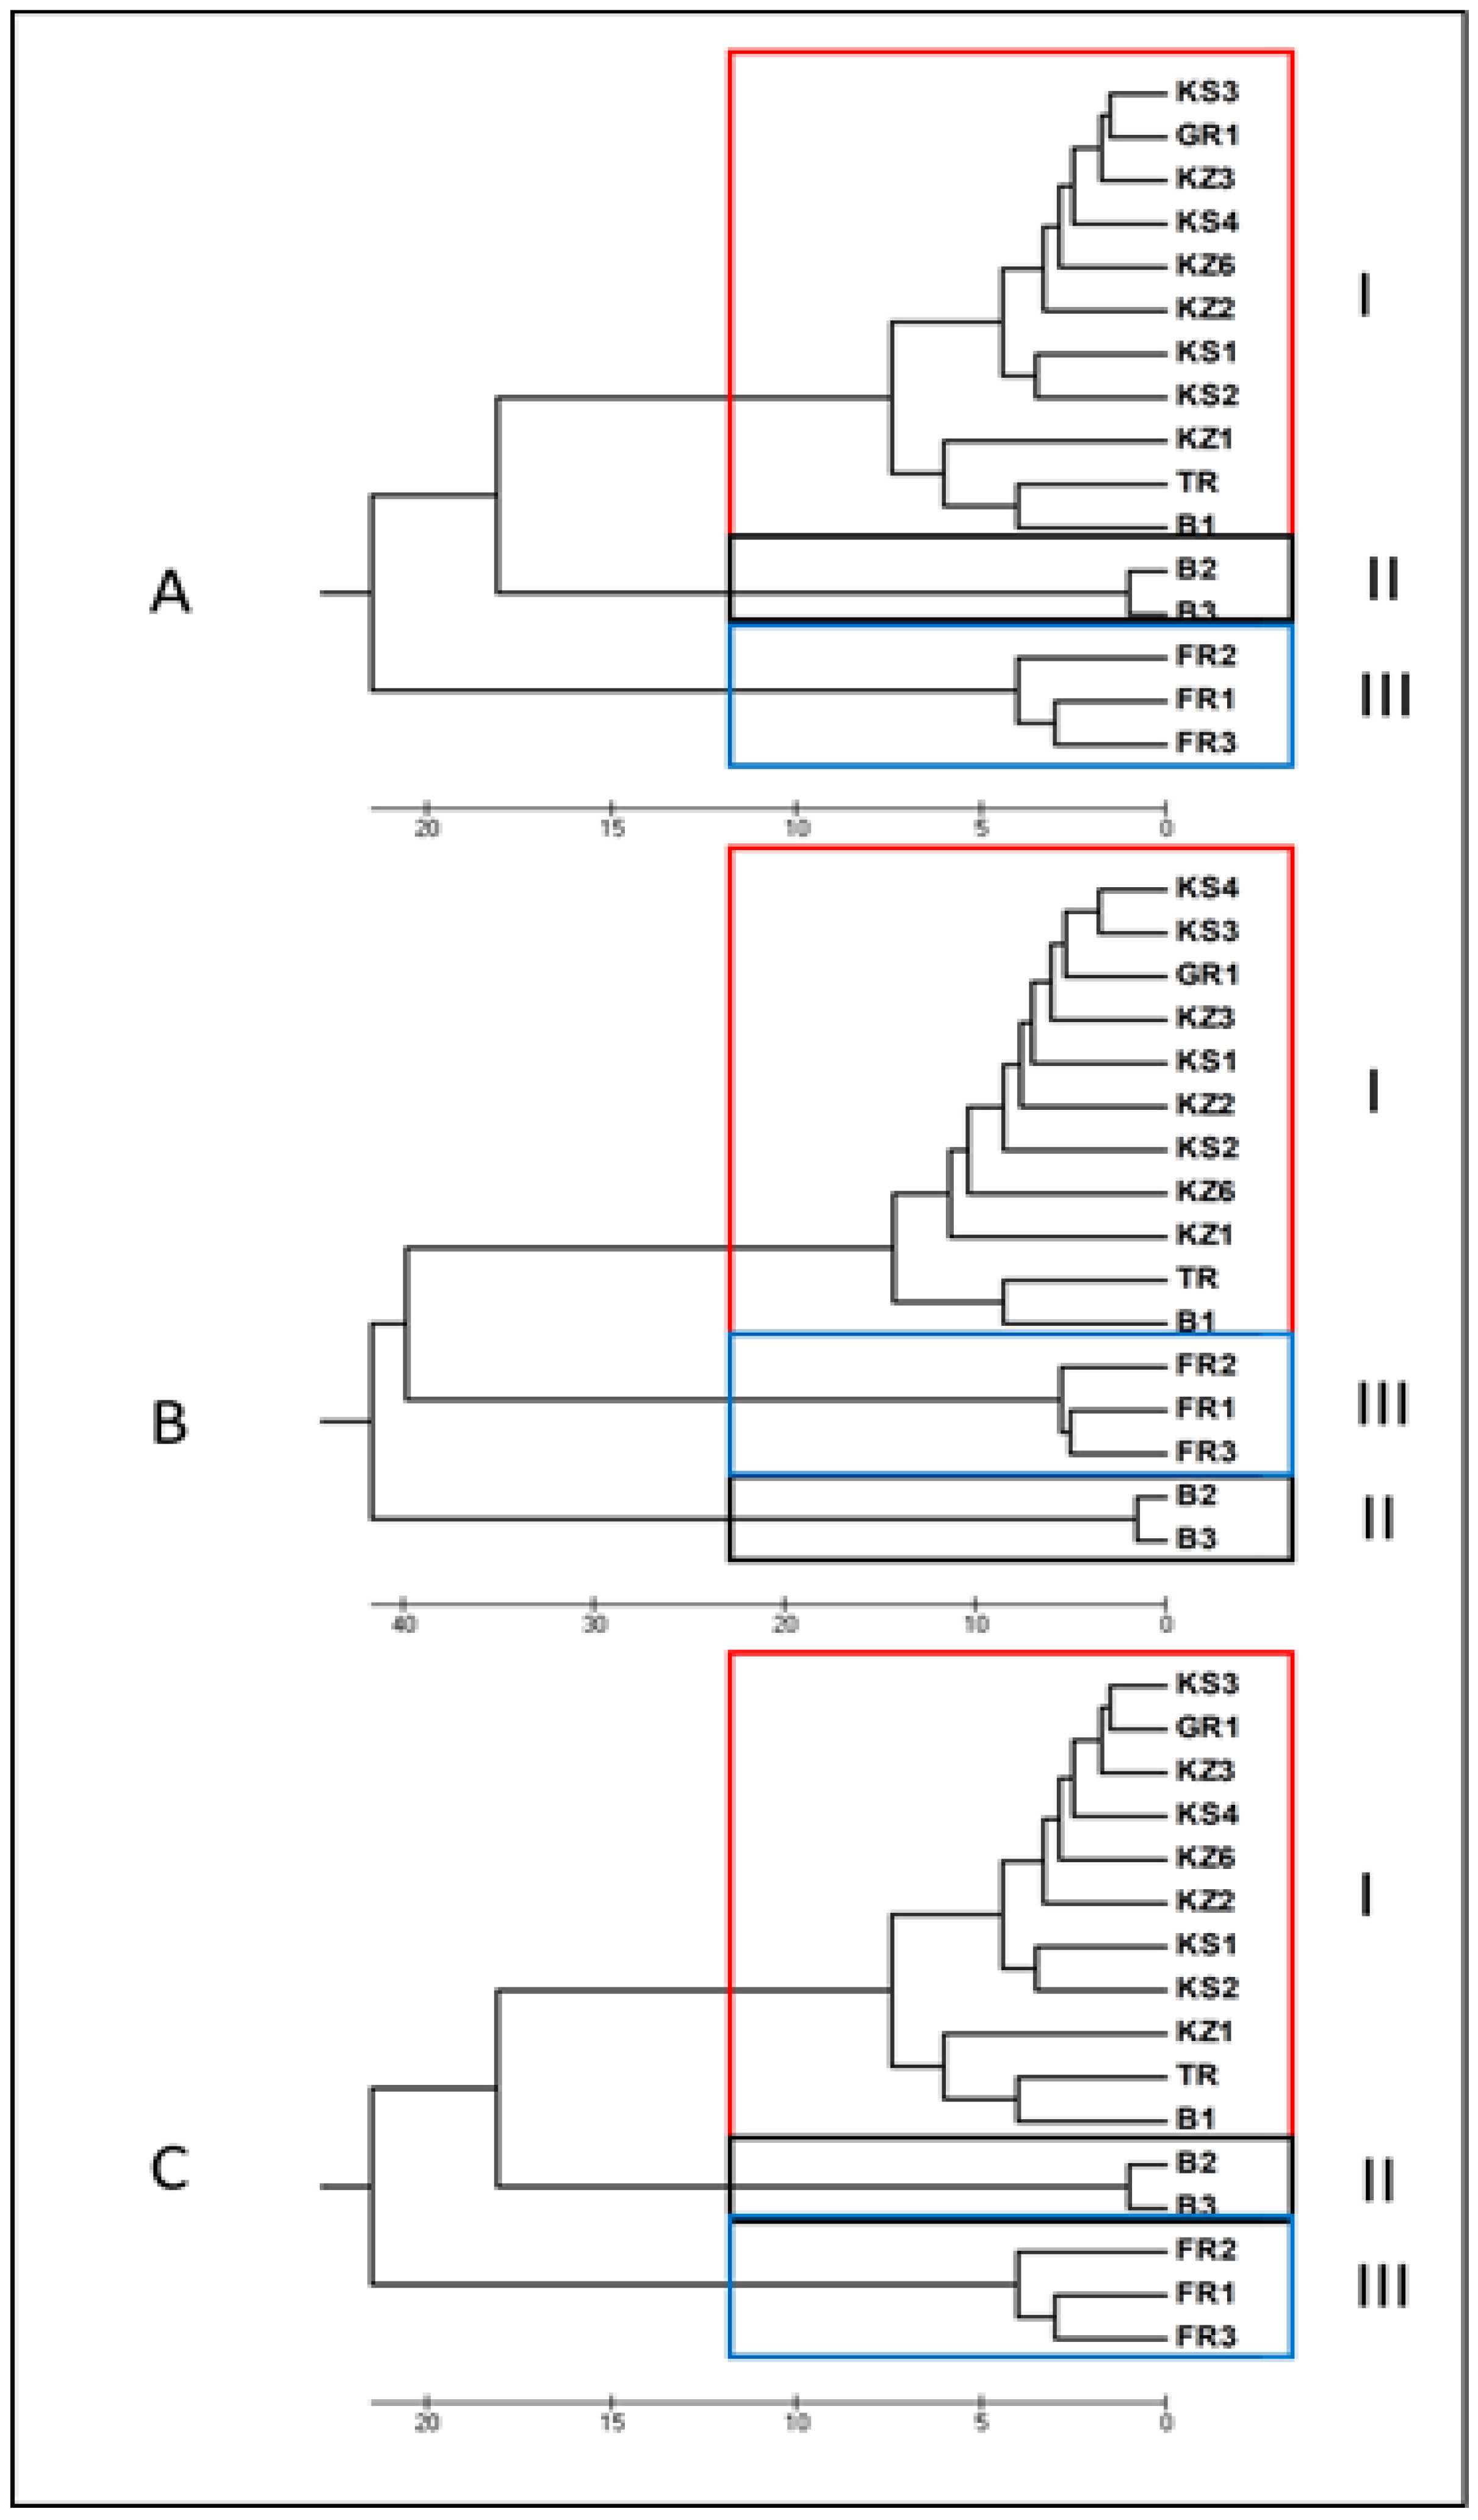
3.1.3. Unweighted Pair Group Method Analysis (UPGMA)

The cluster analysis using the UPGMA method, to examine the genetic relationships among the 16 R. damascena genotypes, revealed a similarity in the dendrograms generated from the ISSR and SCoT markers and their combination (Figure 4). As shown in the dendrogram of Figure 4A, generated with ISSR markers, the genotypes were distinguished in three clades, the first (I) included all the samples of the nine genotypes from Greece, the genotype sample from Turkey (TR) and one (B1) of the three genotype samples from Bulgaria, while in the second clade (II), the other two samples of the Bulgarian genotypes (B2 and B3) were identified. The third clade (III) included all three samples of the French genotypes. The main difference between the ISSR and SCoT dendrograms was the genetic distance of the French genotypes (group III) from group II, which was smaller in the SCoT dendrogram than in the dendrogram of the ISSR markers (Figure 4B). As for the dendrogram of ISSR and SCoT markers, based on their combined data, this was found to be similar to the ISSR dendrogram (Figure 4C).
The similarity in the dendrograms created with the ISSR and SCoT markers and their combined data using the UPGMA method confirms those of the PCoA diagrams, which means that there is a high percentage of genetic similarity among the genotypes from Greece, Turkey and the one genotype from Bulgaria, but at the same time, there is polymorphism between the Bulgarian genotypes, while the French genotypes belong to a separate cluster in their own right (Figure 3 and Figure 4). These findings are in line with the results of Kiani et al. [58,60], who studied 41 genotypes of R. damascena from Iran and one from Bulgaria using RAPD or SSR markers, and they found that most genotypes from Iran had the same genetic origin as that from Bulgaria, although they noticed polymorphism in the Damask rose germplasm from Iran.

3.1.4. STRUCTURE Analysis

The STRUCTURE analysis, based on Bayesian clustering, for the data of the ISSR primers and also the combined data of the ISSR and SCoT primers, with K = 2, separated the 16 genotypes into two clusters; the first cluster included the nine genotypes from Greece (1–9), the one from Turkey (10) and one of the three from Bulgaria (16), while the second cluster included the other two Bulgarian genotypes (14 and 15) and the three genotypes from France (11–13)(Figure 5A,C). On the other hand, the SRUCTURE analysis of the SCoT primers’ data, based on K = 6, separated the 16 genotypes into three clusters (Figure 5B). The largest cluster resembled that of the first cluster of the two previous STRUCTURE analyses by including all Greek genotypes (1–9), one Turkish (10) and one Bulgarian (16), while the French genotypes (11–13) formed a separate cluster as did the other two genotypes (14 and 15) from Bulgaria (Figure 5B).
The Bayesian clustering algorithm, implemented in the STRUCTURE software, allows for the identification of genetically homogeneous groups [60]. Using the online software HARVESTER STRUCTURE, the actual number of clusters (K) for the ISSR and SCoT data and their combination was determined. The STRUCTURE diagram based on the genetic analysis of SCoT primers, which shows three main clusters, despite K = 6, was the one most aligned with the corresponding PCoA diagram (Figure 3B and Figure 5B). On the other hand, the STRUCTURE diagrams based on the ISSR data and the combined data of the two types of markers identified two clusters, or else populations: the first cluster included all genotypes from Greece, the genotype from Turkey and one of the three genotypes from Bulgaria, and the second cluster included the other two genotypes from Bulgaria and the three genotypes from France (Figure 5A,C). Bayesian clustering has been reported to have the potential to assign mixed genotype samples to population clusters without assuming predefined populations [61,62]. Therefore, the fact that the populations are not completely separated in the regions from which they were collected implies that the genotypes examined are of mixed types. Although the genotype samples belong to the same cluster, they share their genetic traits to a higher degree, as is the case with the two main clusters in our study.

3.2. Propagation

Rooting of Shoot Cuttings

The statistical analysis of the data revealed no significant differences in the rooting parameters recorded among the nine R. damascena genotypes of Greece. The rooting rate ranged from 55% (KS1 and KZ2) to 70% (KZ3), while the number of roots produced per shoot cutting ranged from 5.6 (KZ1) to 7.2 (KS1 and KS4), with no statistically significant differences among them (Table 6). Also, no statistically significant differences were found in the length of roots measured from 6.7 (KZ2) to 9.6 (KS2) per rooted cutting (Table 6).
The rooting of shoot cuttings of R. damascena with IBA application has been reported in several publications. According to Aithida et al. [22], the rooting rate ranged from 10% to 70% depending on the origin of the cuttings and the applied IBA concentration (1 or 2 gL−1). The highest rooting (79.56%) was achieved with 1 gL−1 of IBA in a survey of wild genotypes of the Damask rose [2]. The positive effects of various IBA concentrations on the rooting ability of R. damascena shoot cuttings have been studied by Khatik et al. [63], who reported that IBA significantly promoted the rooting of cuttings. In some reports, the rooting ability of shoot cuttings of R. damascena differed among the various genotypes used, whereas in our investigation, no statistically significant differences among the nine genotypes occurred. This could be attributed to the same genetic heritage of the nine genotypes of Greece, as found in this study using the ISSR and SCoT markers.

3.3. Chemical Substances Analysis

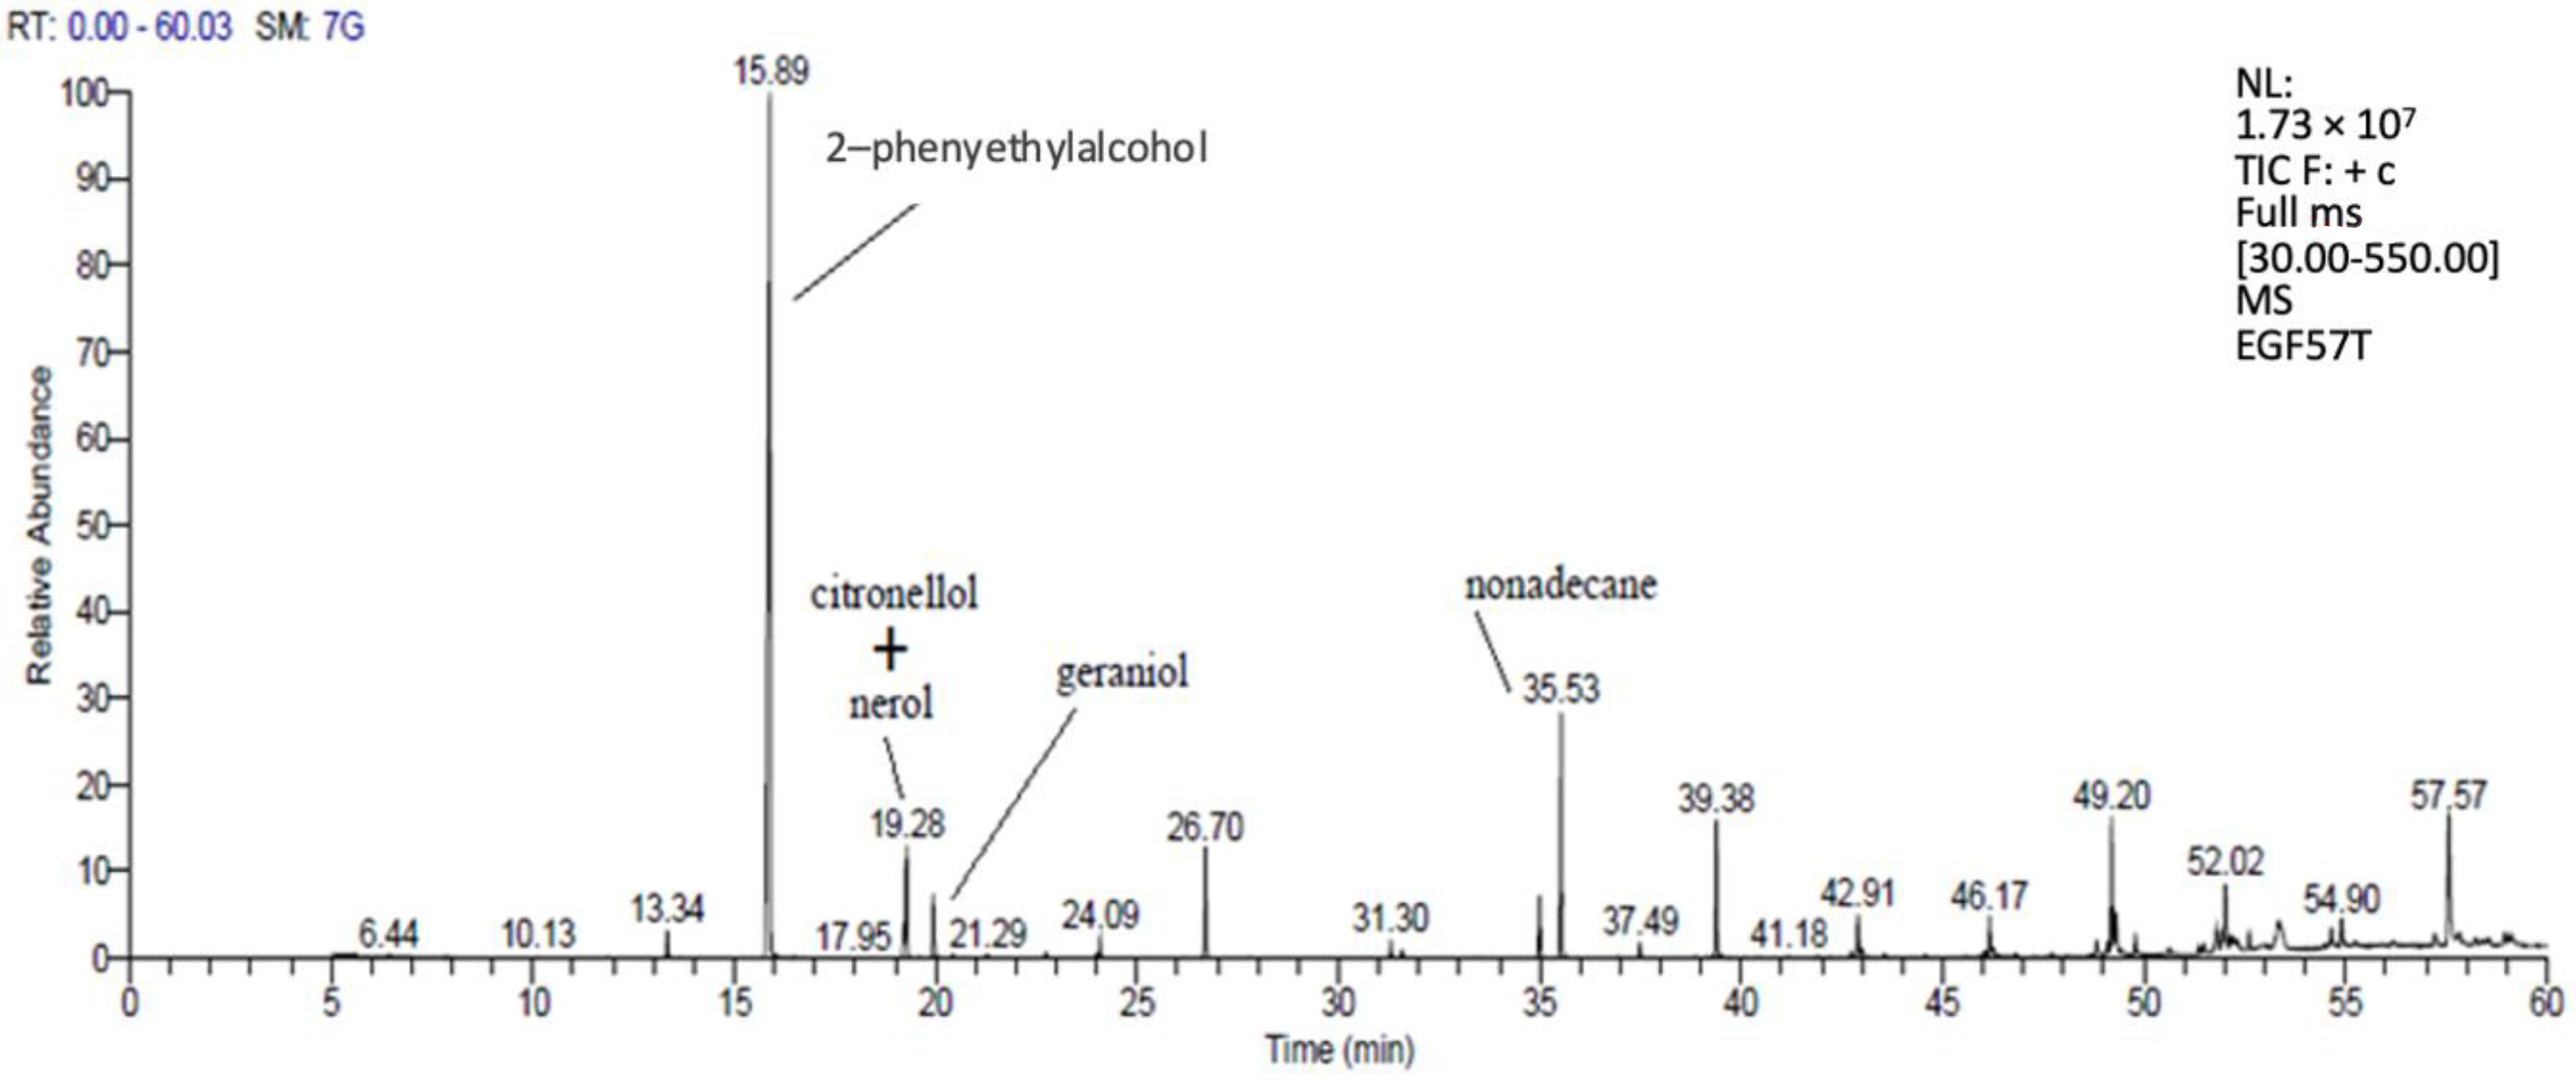
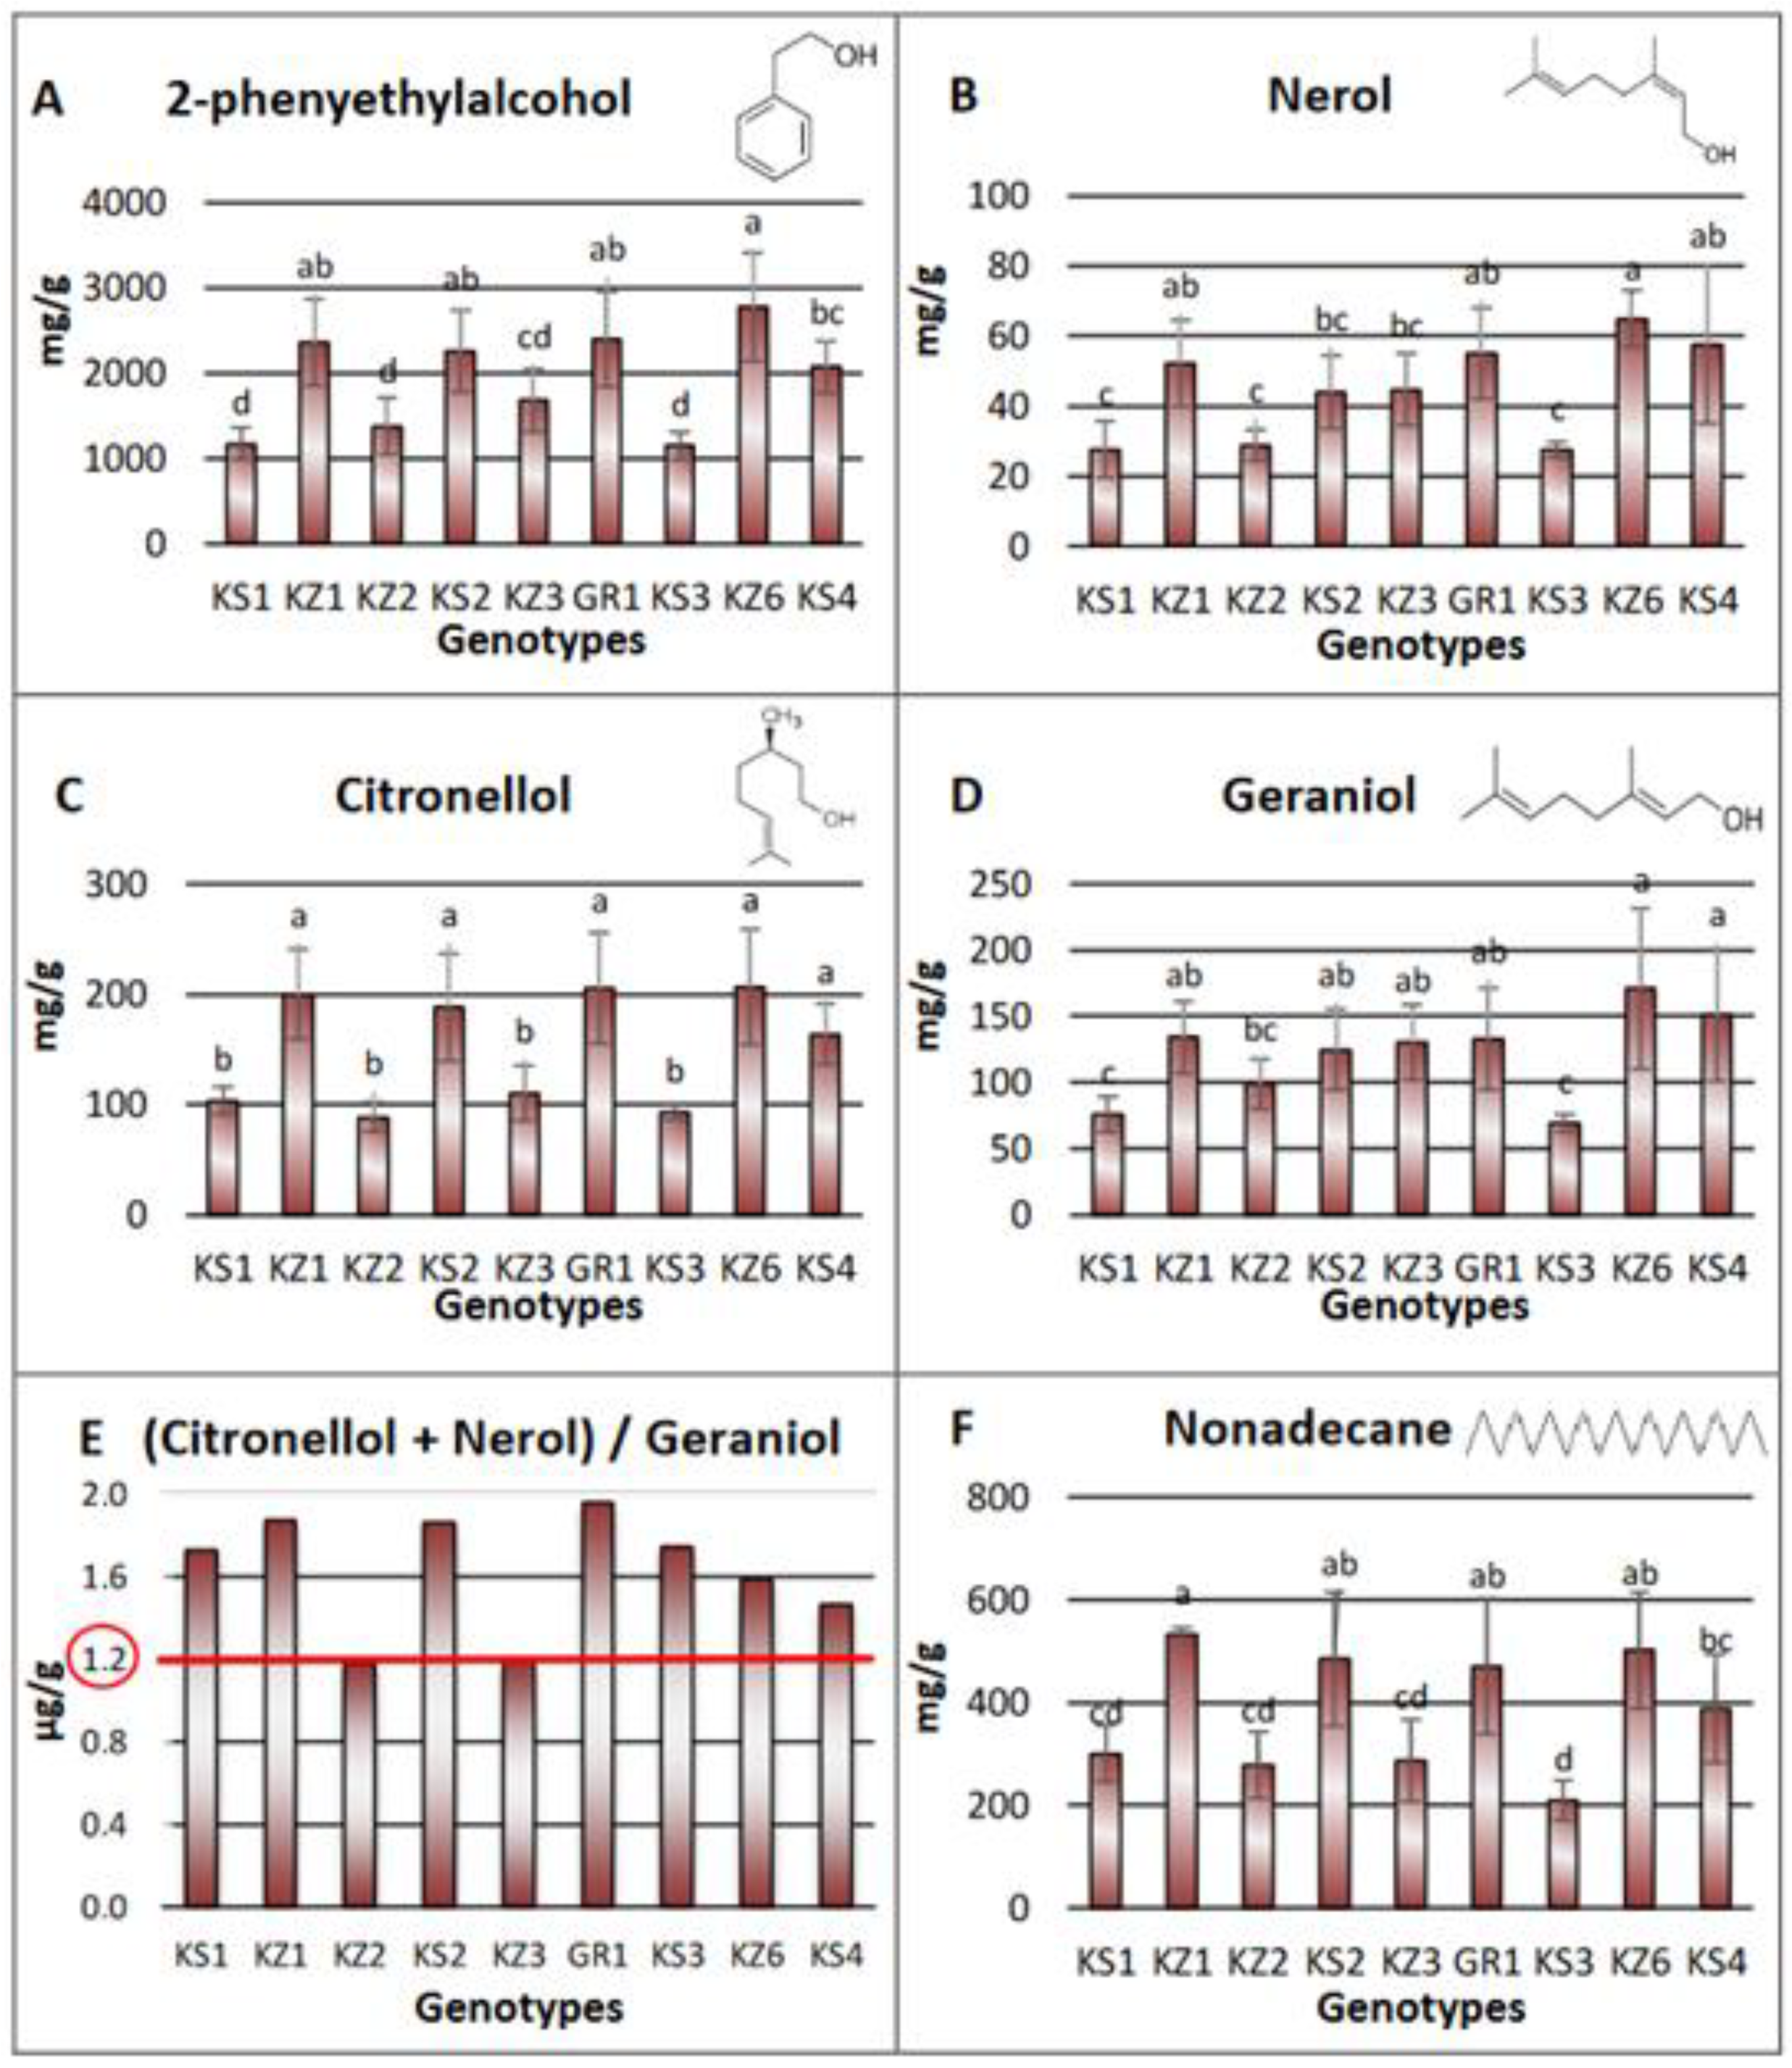
3.3.1. Volatile Substances Analysis with GC-MS

Thirteen substances were detected in total and tentatively identified in the flower petals of the nine genotypes from Greece of R. damascena (Figure 6). These, in agreement with the report of Akram et al. [64], were pinene, benzyl-alcohol, 2-phenylethylalcohol, nerol, citronellol, geraniol, C-14 (internal standard, for determination of residual concentration), heptadecane, lupenone, 9-nonadecene, nonadecane, eicosane, heneicosane and tricosane. Five of them were the main chemicals contained in rose petal extracts: 2-phenylethylalcohol, nerol, citronellol, geraniol and nonadecane. The substances were quantified in relation to the concentration of the internal standard (100 μg/mL of C-14) and presented per g of the fresh petal weight.
Τhe major chemical substance in the rose petal extracts was 2-phenylethylalcohol. Its concentrations varied among the samples of the nine genotypes and ranged from 1148.35 μg/g (KS3) to 2777.19 μg/g (KZ6) (Figure 7A and Table S1 in Supplementary Materials). High concentrations were also recorded in the samples of the genotypes GR1 (2402.85 μg/g), KZ1 (2358.48 μg/g) and KS2 (2257.01 μg/g), which did not significantly differ from the genotype KZ6. The concentrations of nerol in the petal samples ranged from 27.45 μg/g (KS3) to 64.93 μg/g (KZ6) and citronellol ranged from 88.45 μg/g (KZ2) to 206.59 μg/g (KZ6)(Figure 7B,C and Table S1). The highest concentrations for both of these compounds were measured in the genotype KZ6, followed, with no statistically significant differences, by the genotypes KS4, GR1 and KZ1 for nerol and GR1, KZ1 and KS2 for citronellol. For geraniol, the highest values were also recorded in samples of the same genotypes, namely KZ6 (170.99 μg/g), KS4 (150.85 μg/g), KZ1 (134.27 μg/g) and GR1 (133.03 μg/g), which did not differ statistically significantly from each other (Figure 7D and Table S1). The ratio of the sum of citronellol and nerol concentrations to geraniol concentration in the genotype samples exceeded the theoretical limit of 1.2, except for KZ2 (1.18) and KZ3 (1.19) (Figure 7E and Table S1). Nonadecane was detected at concentrations from 209.27 μg/g (KS1) to 533.15 μg/g (KZ1), with the remaining highest values recorded in the samples of genotypes KZ6 (501.82 μg/g), KS2 (485.25 μg/g) and GR1 (470.25 μg/g) with no statistically significant differences between them (Figure 7F and Table S1).
The most abundant volatile substance found in the petal extracts was 2-phenylethylalcohol, which is responsible for the characteristic odor in rose flowers [13,65]. Citronellol and nerol, detected in relatively high amounts in the petal extracts, are key components of flower aroma in the Damask rose [13,66]. Unlike geraniol, which imparts negative properties, these two compounds are preferred in high amounts, as they contribute to the aroma of rose flowers and, accordingly, to the quality of rose oil [5,6,67,68]. For this reason, the ratio of the total content of citronellol and nerol to geraniol has been established as a criterion for evaluating the quality of rose oil and should be above 1.2 [69,70,71,72]. In the present study, this ratio was above 1.2 in the petal samples of seven of the nine genotypes tested, while in the samples of the remaining two genotypes (KZ2 and KZ3), it was very close, i.e., 1.18 and 1.19, respectively. According to the procedure described by Rusanov et al. [53], for the solvent extraction of rose petals of R. damascena and GC-MS analysis of extracts, which was applied in the present study with some modifications, the amounts of volatile substances detected in rose flower petals can be well correlated with their respective amounts in distilled rose oil. Therefore, the findings of the main volatile substances present in the flower petals of the R. damascena genotypes cultivated in Greece could provide a reliable prediction for the volatile composition of the distilled oils of these genotypes.

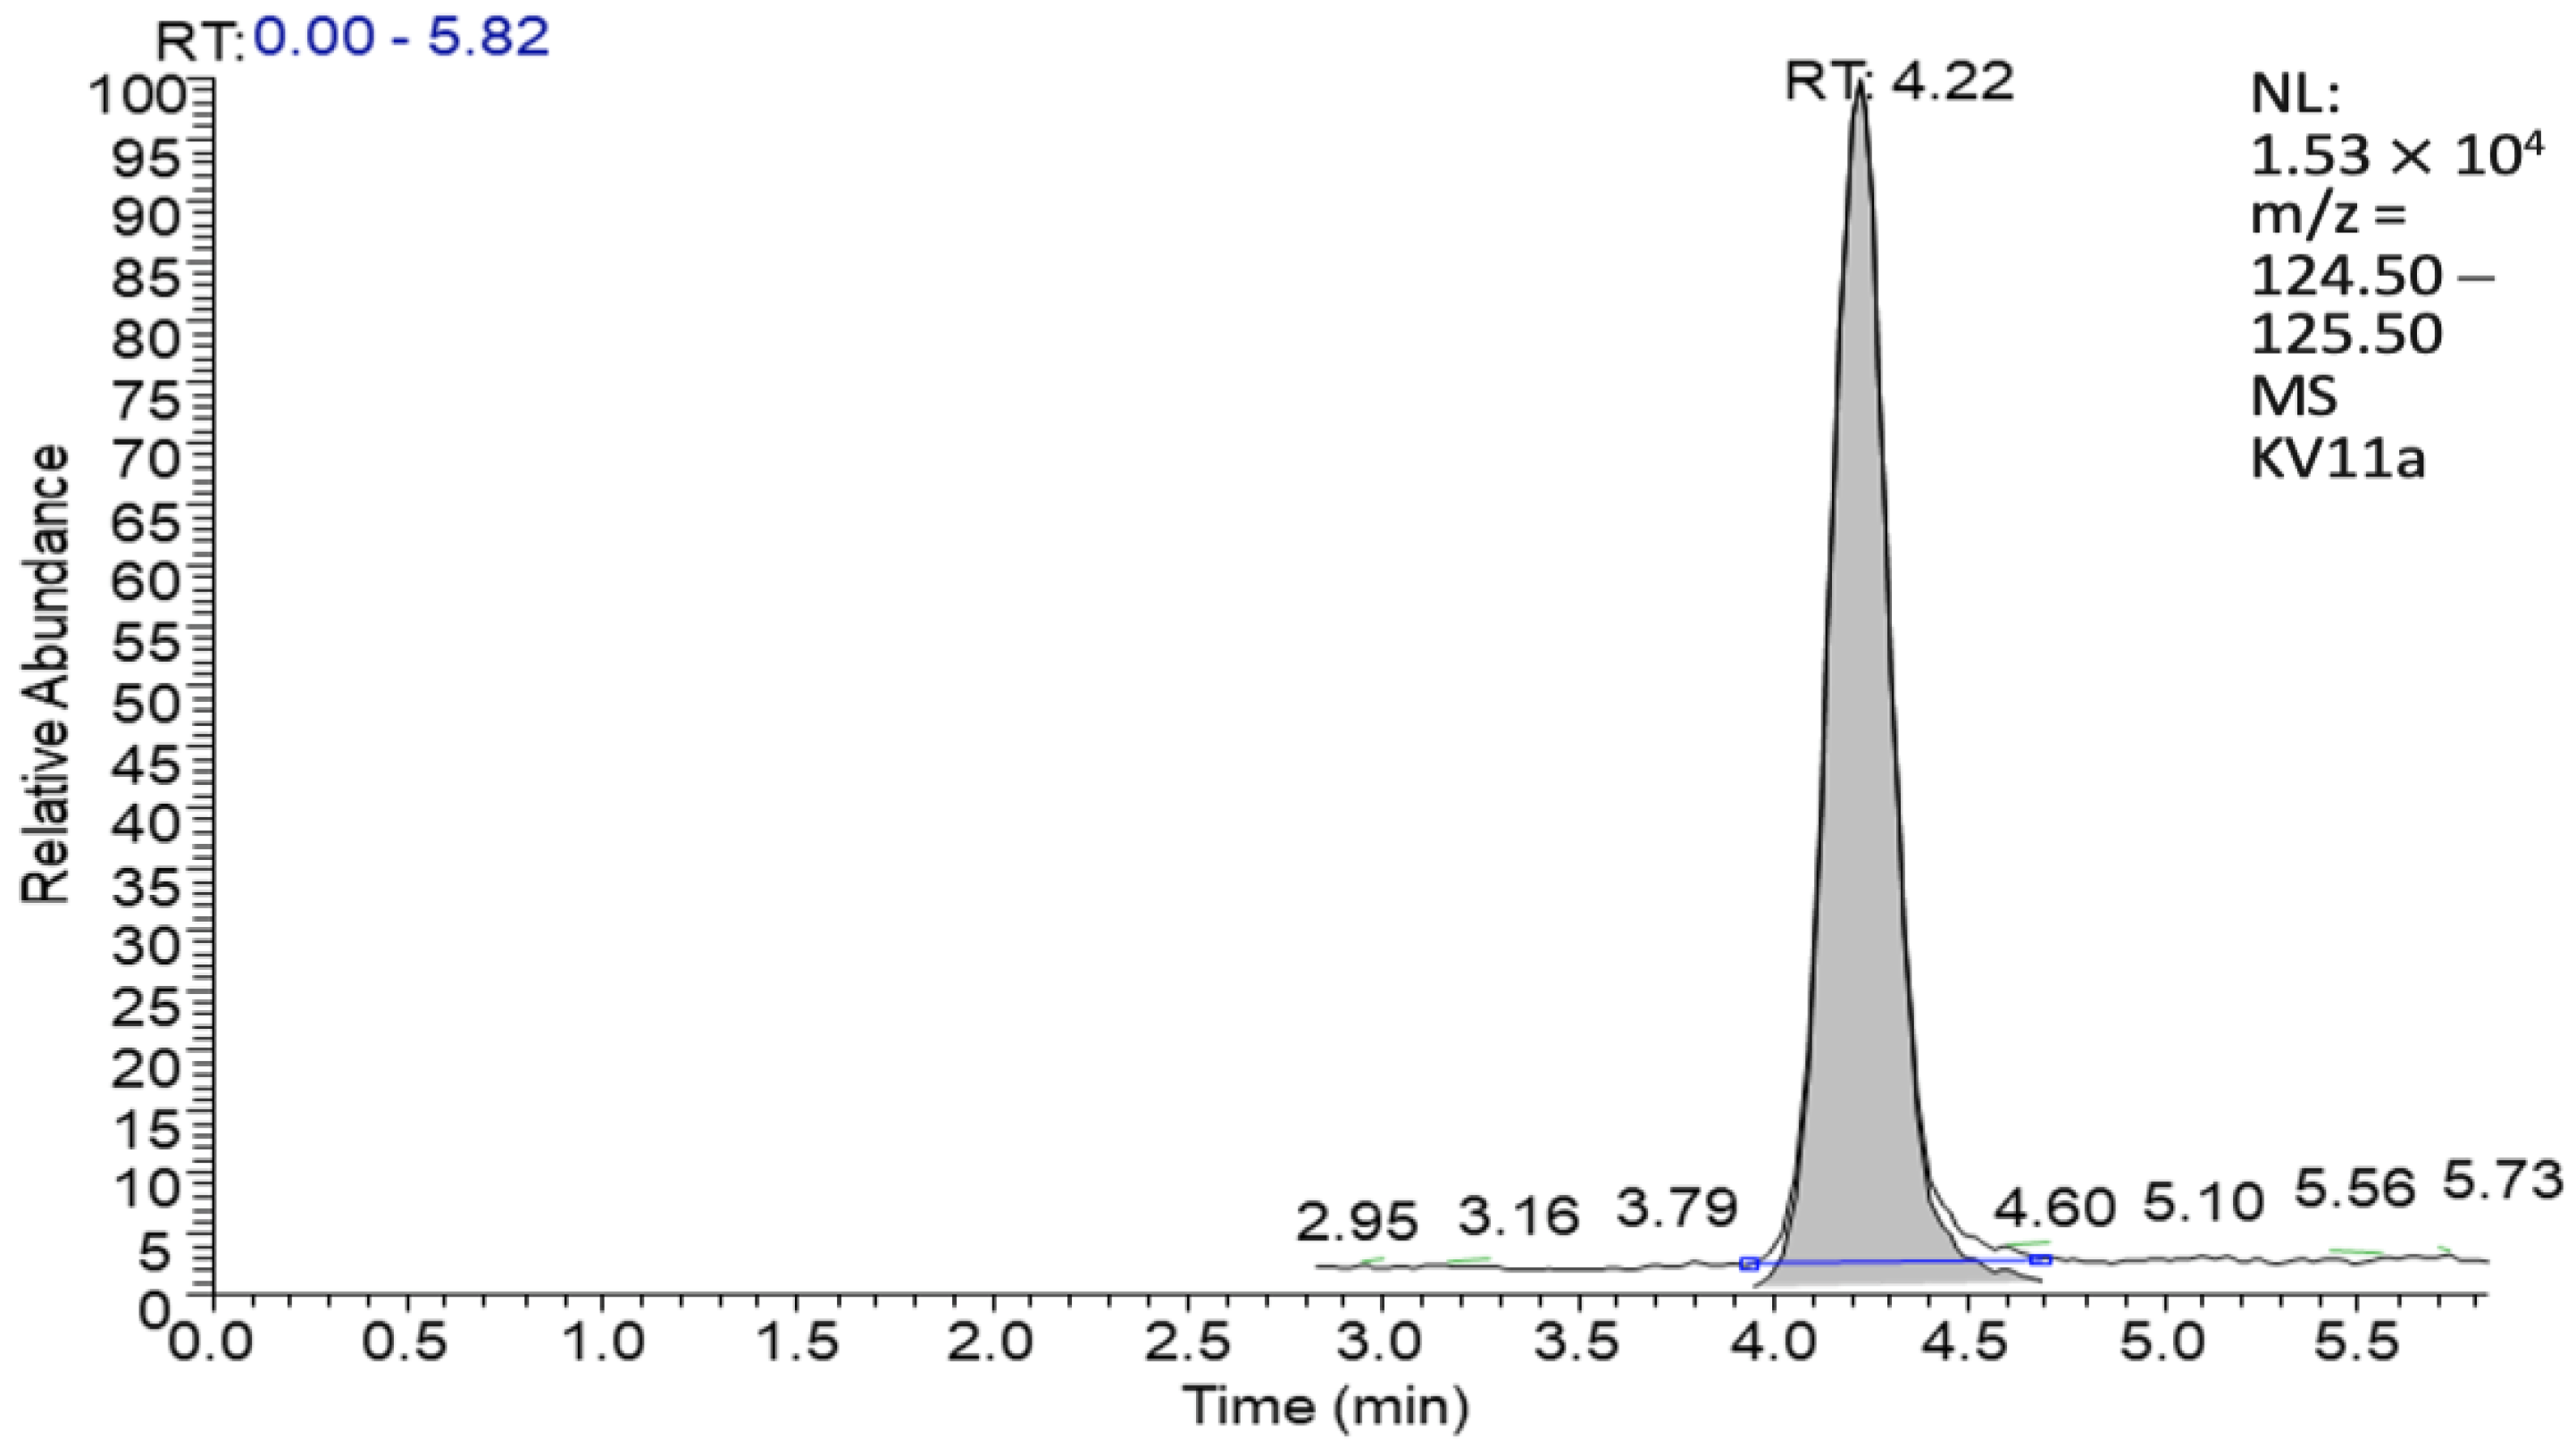
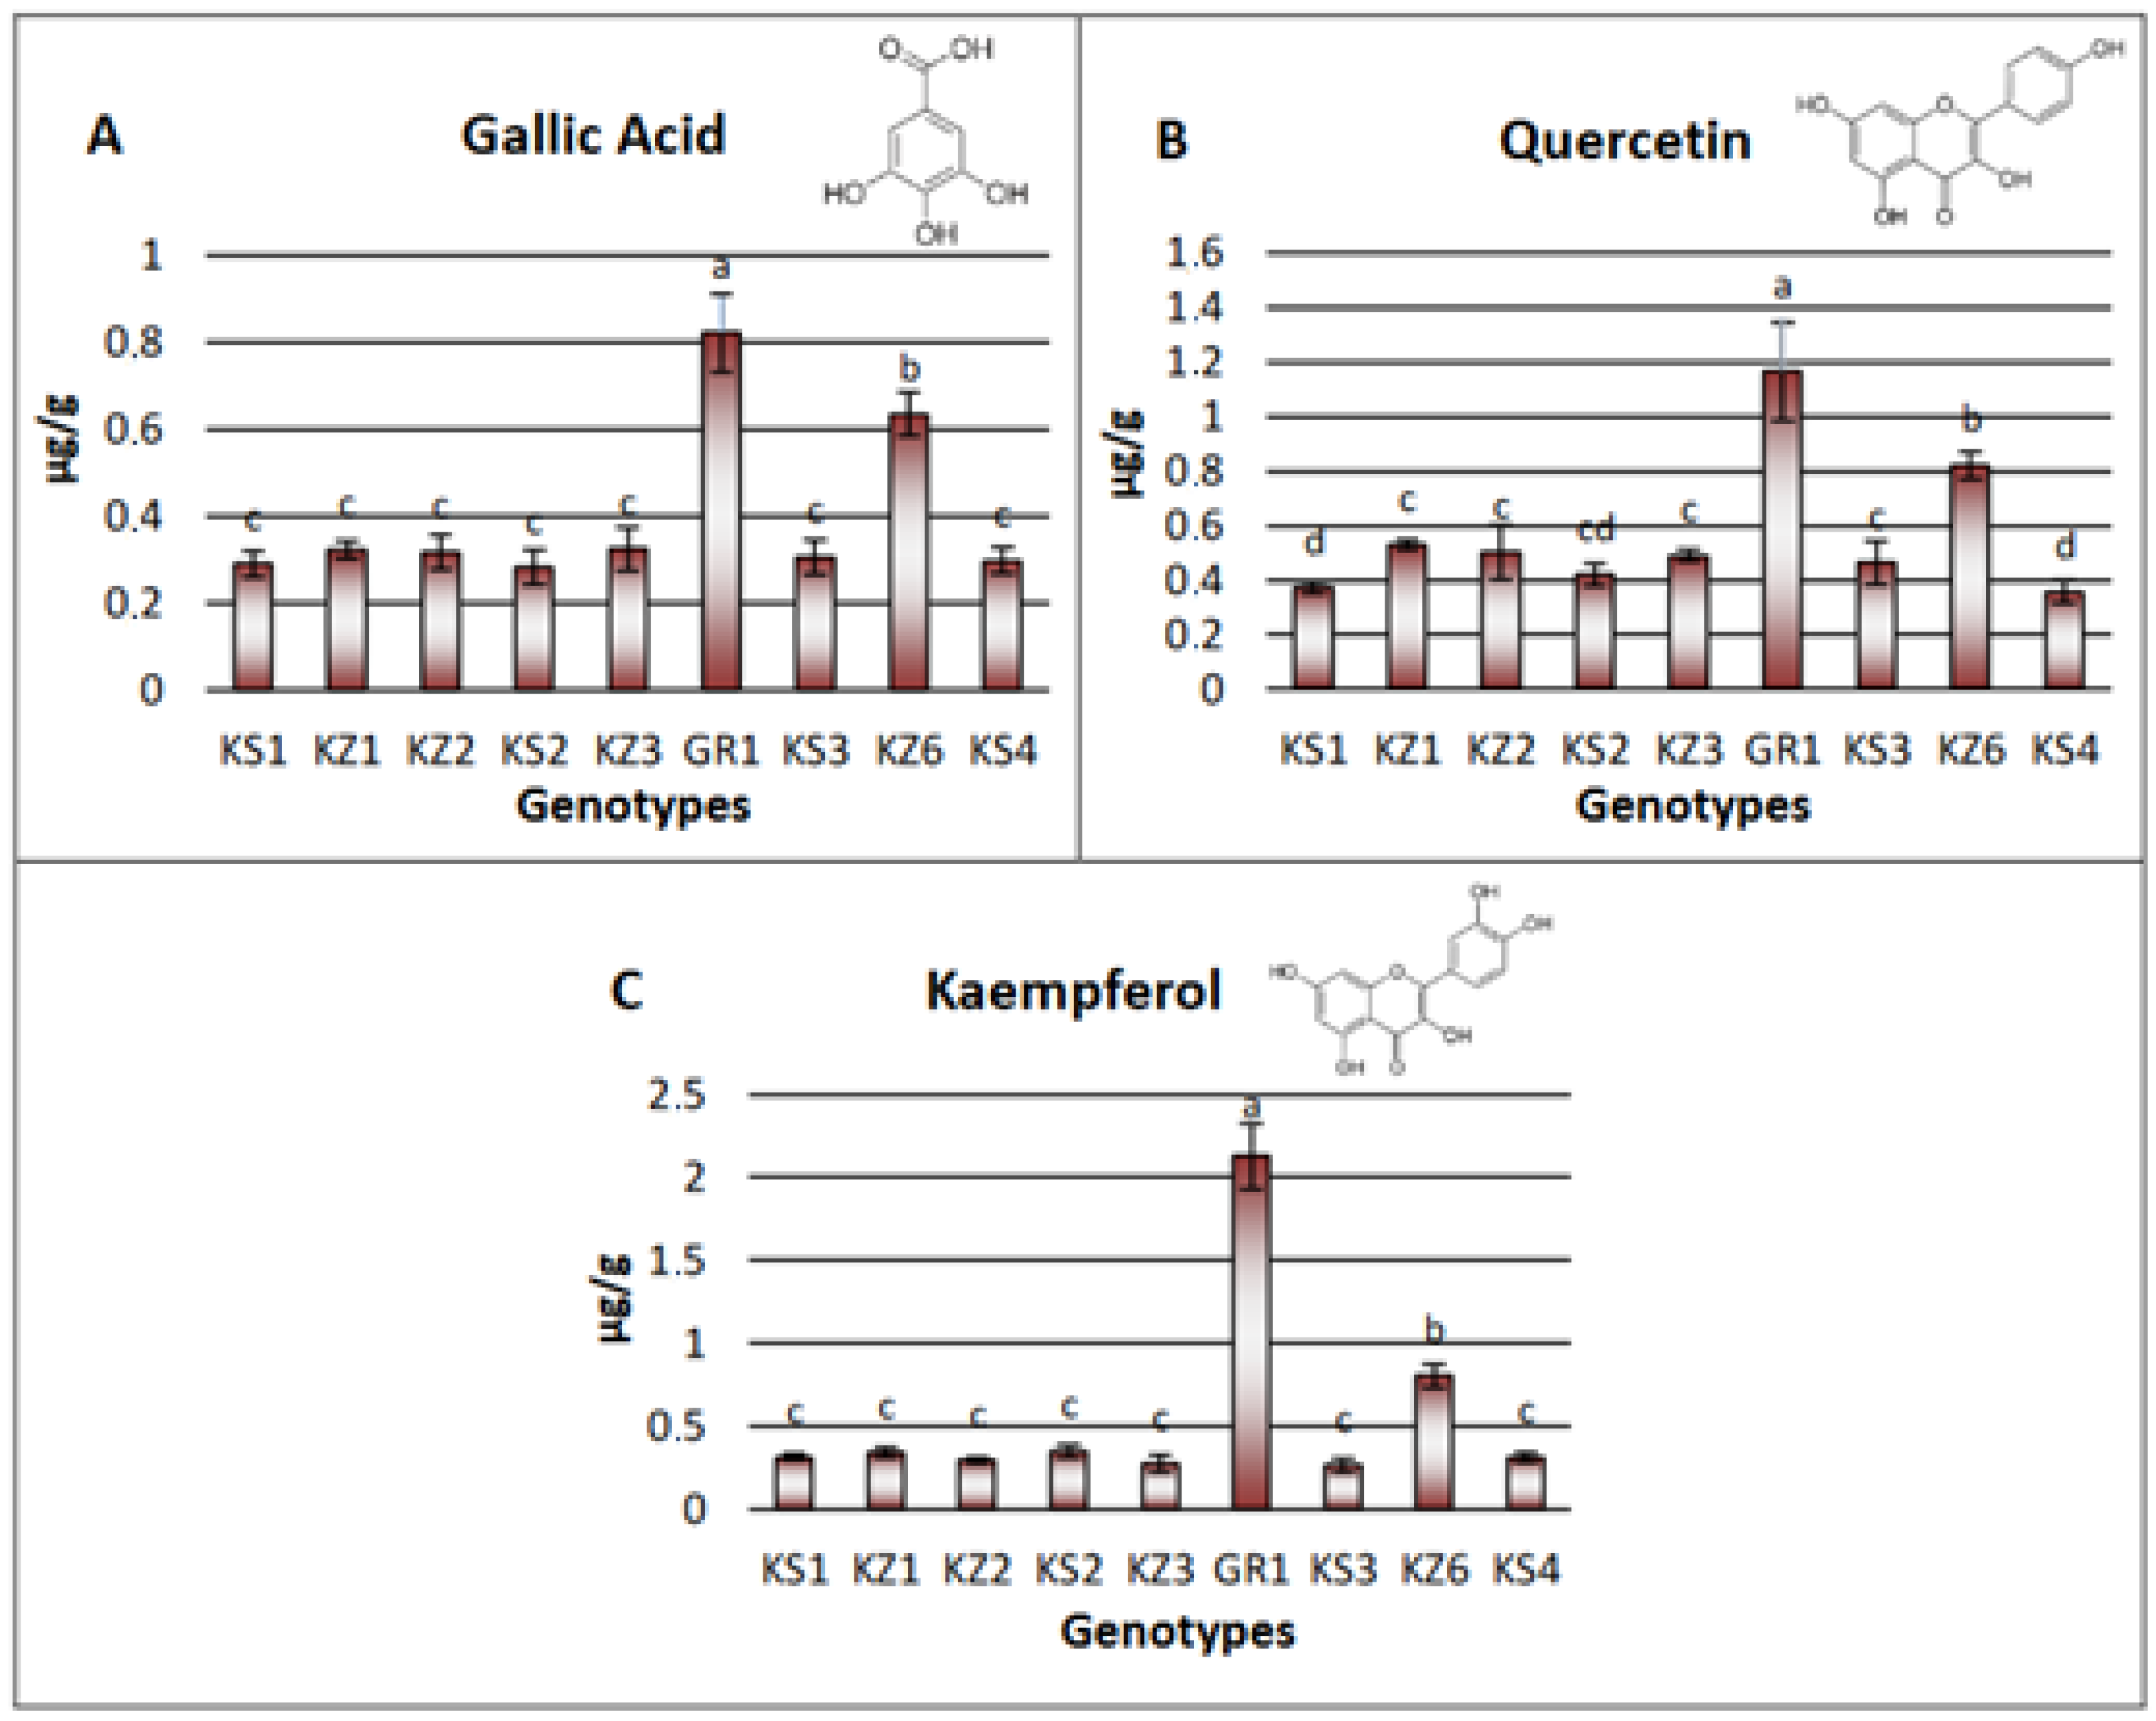
3.3.2. Non-Volatile Substances Analysis with LC-MS

Gallic acid and quercetin were the most abundant non-volatile substances in the rose petal extracts of all nine genotypes of R. damascena from Greece (Figure 8A,B and Table S2). In the genotype GR1, gallic acid had a value of 0.82 μg/g, which was significantly higher than the sample values of the rest of the genotypes, followed by the genotype KZ6 (0.63 μg/g). The samples of the other seven genotypes contained significantly lower concentrations of gallic acid (Figure 8A and Table S2). Quercetin was also high, with the highest value (1.17 μg/g) detected in the sample of the genotype GR1, which differed significantly from the values of the other genotypes, followed again by the genotype KZ2 (0.82 μg/g), which also differed significantly from the remaining seven genotypes (Figure 8B and Table S2). The genotype GR1 also contained the greatest amount of kaempferol (2.13 μg/g), significantly higher than the KZ2 genotype (0.80 μg/g), both of which were significantly different from the other seven genotypes (Figure 8C and Table S2).
Gallic acid is usually one of the most abundant phenolic acids in rose petals of aromatic varieties [6,73]. In a cold extract of fresh R. damascena flower petals with methanol, Baydar and Baydar [54] reported a concentration of 0.72 μg/g for gallic acid, which is close to our samples of genotypes GR1 (0.82 μg/g) and KZ6 (0.63 μg/g). Quercetin and kaempferol were the main flavonols detected in the fresh flower petal extracts of the nine R. damascena genotypes, with quercetin present at relatively higher amounts than kaempferol, which is consistent with the report of Mohsen et al. [6]. The range of concentrations for quercetin in this study was from 0.36 to 1.17 µg/g, relatively lower than the concentration of 4.416 μg/mL reported by Khare et al. [38], which was probably due to the dried flower petals used and the different basis of calculation.

4. Conclusions

The ISSR and SCoT markers showed a high percentage of genetic similarity among the nine genotypes of R. damascena, cultivated in Greece for rose oil production, the genotype from Turkey and one of the three from Bulgaria, while the other genotypes used exhibited a very low percentage of genetic similarity. The two markers used in this study proved to be efficient in distinguishing genetic diversity, which, together with their characteristics of being simple, fast and cost-effective, makes them capable and reliable molecular tools for assessing the genetic relationship between various genotypes of R. damascena. The rooting of shoot cuttings was relatively easy with the application of K-IBA with no statistically significant differences among the nine genotypes from Greece. The solvent extraction of the flower petals of the nine genotypes and analysis with GS-MS and/or LC-MS resulted in the detection and identification of all main compounds. The main volatile chemical substance in the rose petal extracts was 2-phenylethylalcohol, while thirteen substances in total were detected. The ratio of the total content of citronellol and nerol to geraniol, a criterion for the evaluation of the quality of rose oil, was above 1.2 in the petal samples of seven of the nine genotypes tested. Also, gallic acid and quercetin were the most abundant non-volatile substances in the rose petal extracts. All these substances, related to the rose oil components, make the whole process realistic for predicting the composition of the produced rose oil.

Supplementary Materials

The following supporting information can be downloaded at: https://www.mdpi.com/article/10.3390/horticulturae9080946/s1, Table S1: Quantities (numerical) of the substances 2-phenylethylalcohol, nerol, citronellol, geraniol, nonadecane and (citronellol + nerol)/geraniol detected with GC-MS in the flower petal extracts of the nine genotypes of R. damascena from Greece; Table S2: Quantities (numerical) of the substances gallic acid, quercetin and kaempferol detected with LC-MS in the flower petal extracts of the nine genotypes of R. damascena from Greece.

Author Contributions

Conceptualization, S.H., S.K. and A.E.; methodology, S.K., E.-N.P. and S.H.; software, F.-T.Z., A.-A.K. and P.-G.A.; validation, S.K., E.-N.P., F.-T.Z. and A.-A.K.; formal analysis, F.-T.Z., A.-A.K., S.K. and E.-N.P.; investigation, F.-T.Z., A.-A.K., S.H., E.-N.P., P.-G.A. and S.K.; resources, S.H., S.K., E.-N.P., P.-G.A. and A.E.; data curation, S.K., E.-N.P., F.-T.Z. and A.-A.K.; writing—original draft preparation, F.-T.Z., A.-A.K., E.-N.P. and A.E.; writing—review and editing, A.E., S.K. and E.-N.P.; visualization, F.-T.Z. and A.-A.K.; supervision, S.H., S.K., E.-N.P. and A.E.; project administration, S.H., S.K., E.-N.P. and A.E.; funding acquisition, S.H., S.K. and A.E. All authors have read and agreed to the published version of the manuscript.

Funding

This research was funded by “Research—Create—Innovate”, EPANEK, NSRF 2014–2020, with co-financing from Greece and the European Union, Project code: T1EDK-05318.

Institutional Review Board Statement

Not applicable.

Informed Consent Statement

Informed consent was obtained from all subjects involved in the study.

Data Availability Statement

Not applicable.

Acknowledgments

The technical assistance (plant cultivation and rose sample collection) of the “Association of Aromatic Pharmaceutical & Horticultural Plants of Kozani” is gratefully acknowledged.

Conflicts of Interest

The authors declare no conflict of interest.

References

  1. Tsanaktsidis, C.G.; Tamoutsidis, E.; Kasapidis, G.; Itziou, A.; Ntina, E. Preliminary results on attributes of distillation products of the rose Rosa damascene as a dynamic and friendly to the environment rural crop. APCBEE Procedia 2012, 1, 66–73. [Google Scholar] [CrossRef]
  2. Nasri, F.; Fadakar, A.; Saba, M.K.; Yousefi, B. Study of indole butyric acid (IBA) effects on cutting rooting improving some of wild genotypes of Damask roses (Rosa damascena Mill.). J. Agric. Sci. 2015, 60, 263–275. [Google Scholar] [CrossRef]
  3. Nazamuddin, M.; Wadud, A.; Najeed, J.; Tanwir, A.M.; Asim, M.K.; Aisha, P. Gul-e-surkh (Rosa damascena Mill.) and its therapeutic uses described in unani literature. Res. Pharm. Health Sci. 2018, 4, 411–414. [Google Scholar]
  4. Basim, E.; Basim, H. Antibacterial activity of Rosa damascena essential oil. Fitoterapia 2003, 74, 394–396. [Google Scholar] [CrossRef]
  5. Mahboubi, M. Rosa damascena as holy ancient herb with novel applications. J. Tradit. Compl. Med. 2016, 6, 10–16. [Google Scholar] [CrossRef] [PubMed]
  6. Mohsen, E.; Younis, I.Y.; Farag, M.A. Metabolites profiling of Egyptian Rosa damascena Mill. flowers as analyzed via ultra-high-performance liquid chromatography-mass spectrometry and solid-phase microextraction gas chromatography-mass spectrometry in relation to its anti-collagenase skin effect. Ind. Crops Prod. 2020, 155, 112818. [Google Scholar] [CrossRef]
  7. Ahmadi, S.J.; Mortazaeinezhad, F.; Zeinali, H.; Askari-Khorasgani, O.; Pessarakli, M. Evaluation of various Rosa damascena Mill. genotypes grown under rainfed semi-arid condition. Commun. Soil Sci. Plant Anal. 2019, 50, 2534–2543. [Google Scholar] [CrossRef]
  8. Niazi, M.; Hashempur, M.H.; Taghizadeh, M.; Heydari, M.; Shariat, A. Efficacy of topical rose (Rosa damascena Mill.) oil for migraine headache: A randomized double-blinded placebo-controlled cross-over trial. Compl. Ther. Med. 2017, 34, 35–41. [Google Scholar] [CrossRef]
  9. Baydar, N.G.; Baydar, H.; Debener, T. Analysis of genetic relationships among Rosa damascena plants grown in Turkey by using AFLP and microsatellite markers. J. Biotechnol. 2004, 111, 263–267. [Google Scholar] [CrossRef]
  10. Agaoglu, Y.S.; Ergül, A.; Baydar, N. Molecular analysis of genetic diversity oil rose (Rosa damascena Mill.) grown isparta (Turkey) region. Biotechnol. Biotechnol. Equip. 2000, 14, 16–18. [Google Scholar] [CrossRef]
  11. Farooq, A.; Kiani, M.; Khan, M.A.; Riaz, A.; Khan, A.A.; Anderson, N.; Byrne, D.H. Microsatellite analysis of Rosa damascena from Pakistan and Iran. Hort. Environ. Biotechnol. 2013, 54, 141–147. [Google Scholar] [CrossRef]
  12. Baydar, H.; Erbaş, S.; Kazaz, S. Variations in floral characteristics and scent composition and the breeding potential in seed-derived oil-bearing roses (Rosa damascena Mill.). Turk. J. Agric. For. 2016, 40, 560–569. [Google Scholar] [CrossRef]
  13. Nedeltcheva-Antonova, D.; Stoicheva, P.; Antonov, L. Chemical profiling of Bulgarian rose absolute (Rosa damascena Mill.) using gas chromatography–mass spectrometry and trimethylsilyl derivatives. Ind. Crops Prod. 2017, 108, 36–43. [Google Scholar] [CrossRef]
  14. Rusanov, K.; Kovacheva, N.; Rusanova, M.; Atanassov, I. Low variability of flower volatiles of Rosa damascena Mill. plants from rose plantations along the Rose Valley, Bulgaria. Ind. Crops Prod. 2012, 37, 6–10. [Google Scholar] [CrossRef]
  15. Rusanov, K.; Kovatcheva, N.; Stefanova, K.; Atanassov, A.; Atanassov, I. Rosa damascena—genetic resources and capacity bulding for molecular breeding. Biotechnol. Biotechnol. Equip. 2009, 23, 1436–1439. [Google Scholar] [CrossRef]
  16. Iwata, H.; Kato, T.; Ohno, S. Triparental origin of Damask roses. Gene 2000, 259, 53–59. [Google Scholar] [CrossRef] [PubMed]
  17. Yokoya, K.; Roberts, A.; Mottley, J.; Lewis, R.; Brandham, P. Nuclear DNA amounts in roses. Ann. Bot. 2000, 85, 557–561. [Google Scholar] [CrossRef]
  18. Saffari, V.R.; Sharifi-Sirchi, G.R.; Torabi-Sirchi, M.H. Enhancing rooting consistency in Rosa damascena scions. Afr. J. Biotechnol. 2011, 10, 16495–16500. [Google Scholar] [CrossRef]
  19. Ginova, A.; Tsvetkov, I.; Kondakova, V. Rosa damascena Mill.—An overview for evaluation of propagation methods. Bulg. J. Agric. Sci. 2012, 18, 545–556. [Google Scholar]
  20. Pati, P.K.; Prakash, O.; Sharma, M.; Sood, A.; Ahuja, P.S. Growth performance of cuttings raised from in vitro and in vivo propagated stock plants of Rosa damascena Mill. Biol. Plant. 2004, 48, 609–611. [Google Scholar] [CrossRef]
  21. Abbas, H.; Jaskani, M.J.; Hussain, Z.; Asif, M. Response of rose cuttings against root promoting hormones during spring and autumn. Int. J. Biol. Biotechnol. 2006, 3, 201–204. [Google Scholar]
  22. Aithida, A.; Tahiri, A.; Oubassine, Y.; Cherif, K.; Mokhtari, M.; Hassani, L.A.I. Agromorphological characterization of the perfume rose (Rosa damascena Mill.) of KelâaM’Gouna-Dades, Morocco. Atlas J. Plant Biol. 2019, 8, 86–95. [Google Scholar] [CrossRef]
  23. Panwar, S.; Singh, K.P.; Sonah, H.; Deshmukh, R.; Banyal, N.; Prasad, K.V.; Sharma, T.R. Molecular fingerprinting and assessment of genetic diversity in rose (Rosa × hybrida). Indian J. Biotechnol. 2015, 14, 518–524. [Google Scholar]
  24. Aldhebiani, A.Y.; Al Saud, N.S.; Yaslam, W.A.; Hassan, S.M. Molecular characterization of Rosa damascena Mill growing in Taif and Almadinah using ISSR and SSR markers. Res. J. Biotechnol. 2018, 13, 11–19. [Google Scholar]
  25. El-Assal, S.E.-D.; El-Awady, M.A.; El-Tarras, A.; Shehab, G. Assessing the genetic relationship of Taif rose with some rose genotypes (Rosa sp.) based on random amplified polymorphic DNA, inter simple sequence repeat and simple sequence repeat markers. Amer. J. Biochem. Biotechnol. 2014, 10, 88–98. [Google Scholar] [CrossRef]
  26. Jabbarzadeh, Z.; Knosh-khui, M.; Salehi, H.; Saberivand, A. Inter simple sequence repeat (ISSR) markers as reproducible and specific tools for genetic diversity analysis of rose species. Afr. J. Biotechnol. 2010, 9, 6091–6095. [Google Scholar] [CrossRef]
  27. Amer, S.; Basaid, S.A.; Ali, E. Molecular identification of Rosa × damascena growing in Taif region (Saudi Arabia). Int. J. Plant Biol. 2016, 7, 6307–6317. [Google Scholar] [CrossRef]
  28. Agarwal, A.; Gupta, V.; Ul Haq, S.; Jatav, P.K.; Kothari, S.L.; Kachhwaha, S. Assessment of genetic diversity in 29 rose germplasms using SCoT marker. J. King Saud Univ. Sci. 2019, 31, 780–788. [Google Scholar] [CrossRef]
  29. Korkmaz, M.; Yildirim Dogan, N. Analysis of genetic relationships between wild roses (Rosa L. Spp.) growing in Turkey. Erwerbs-Obstbau. 2018, 60, 305–310. [Google Scholar] [CrossRef]
  30. Mostafavi, A.S.; Omidi, M.; Azizinezhad, R.; Etminan, A.; Badi, H.N. Genetic diversity analysis in a mini core collection of Damask rose (Rosa damascena Mill.) germplasm from Iran using URP and SCoT markers. J. Genet. Eng. Biotechnol. 2021, 19, 144–157. [Google Scholar] [CrossRef]
  31. Lawrence, B.M. The isolation of aromatic materials from natural plant products. In A Manual on the Essential Oil Industry; De Silva, K.T., Ed.; United Nations lndustrial Development Organization: Vienna, Austria, 1995; pp. 57–154. [Google Scholar]
  32. Yousefi, B.; Tabaei-Aghdaei, S.R.; Darvish, F.; Assareh, M.H. Flower yield performance and stability of various Rosa damascena Mill. landraces under different ecological conditions. Sci. Hortic. 2009, 121, 333–339. [Google Scholar] [CrossRef]
  33. Baydar, H.; Baydar, N.G. The effect of harvest date, fermentation duration and Tween 20 treatment on essential oil content and composition of idustrial oil rose (Rosa damascena Mill.). Ind. Crops Prod. 2005, 21, 251–255. [Google Scholar] [CrossRef]
  34. Kazaz, S.; Erbaş, S.; Baydar, H. The effects of storage temperature and duration on essential oil content and composition oil rose (Rosa damascena Mill.). Turk. J. Field Crops 2009, 14, 89–96. [Google Scholar]
  35. Kazaz, S.; Erbaş, S.; Baydar, H.; Dilmacunal, T.; Koyuncu, M.A. Cold storage of oil rose (Rosa damascena Mill.) flowers. Sci. Hortic. 2010, 126, 284–290. [Google Scholar] [CrossRef]
  36. Dobreva, A.; Kovacheva, N. Daily dynamics of essential oils of Rosa damascena Mill. and Rosa alba L. Agric. Sci. Technol. 2010, 2, 71–74. [Google Scholar]
  37. Yang, L.; Jianwu, R.; Wang, Y. Chemical investigation of volatiles emitted from flowers of three varieties of Damask rose cultivated in Beijing. Hortc. Environ. Biotechnol. 2014, 55, 524–530. [Google Scholar] [CrossRef]
  38. Khare, S.; Gupta, M.; Cheema, H.S.; Maurya, A.K.; Rout, P.; Darokar, M.P.; Pal, A. Rosa damascena restrains Plasmodium falciparum progression in vitro and impedes malaria pathogenesis in murine model. Biomed. Pharmacother. 2018, 97, 1654–1662. [Google Scholar] [CrossRef] [PubMed]
  39. Ouerghemmi, S.; Sebei, H.; Siracusa, L.; Ruberto, G.; Saija, A.; Khebour Allouche, F.; Dhaouadi, K.; Cimino, F.; Cristani, M. LC-DAD-ESI-MS and HPLC-DAD phytochemical investigation and in vitro antioxidant assessment of Rosa sp. stem pruning products from different northern areas in Tunisia. Phytochem. Anal. 2020, 31, 98–111. [Google Scholar] [CrossRef]
  40. Ncube, N.S.; Afolayan, A.J.; Okoh, A.I. Assessment techniques of antimicrobial properties of natural compounds of plant origin: Current methods and future trends. Afr. J. Biotechnol. 2008, 7, 1797–1806. [Google Scholar] [CrossRef]
  41. Charles, D.J.; Simon, J.E. Comparison of extraction methods for the rapid determination of essential oil content and composition of basil. J. Am. Soc. Hortic. Sci. 1990, 115, 458–462. [Google Scholar] [CrossRef]
  42. Green, R.J. Antioxidant Activity of Peanut Plant Tissues. Master’s Thesis, North Carolina State University, Raleigh, NC, USA, 2004. [Google Scholar]
  43. Doyle, J.J.; Doyle, J.L. A rapid DNA isolation procedure for small quantities of fresh leaf tissue. Phytochem. Bull. 1987, 19, 11–15. [Google Scholar]
  44. Tsaktsira, M.; Chavale, E.; Kostas, S.; Pipinis, E.; Tsoulpha, P.; Hatzilazarou, S.; Ziogou, F.-T.; Nianiou-Obeidat, I.; Iliev, I.; Economou, A.; et al. Vegetative propagation and ISSR-based genetic identification of genotypes of Ilex aquifolium ‘Agrifoglio Commune’. Sustainability 2021, 13, 10345. [Google Scholar] [CrossRef]
  45. Prevost, A.; Wilkinson, M.J. A new system of comparing PCR primers applied to ISSR fingerprinting of potato cultivars. Theor. Appl. Genet. 1999, 98, 107–112. [Google Scholar] [CrossRef]
  46. De Riek, J.; Calsyn, E.; Everaert, I.; Van Bockstaele, E.; De Loose, M. AFLP based alternatives for the assessment of distinctness, uniformity and stability of sugar beet varieties. Theor. Appl. Genet. 2001, 103, 1254–1265. [Google Scholar] [CrossRef]
  47. Varshney, R.K.; Chabane, K.; Hendre, P.S.; Aggarwal, R.K.; Graner, A. Comparative assessment of EST-SSR, EST-SNP and AFLP markers for evaluation of genetic diversity and conservation of genetic resources using wild, cultivated and elite barleys. Plant Sci. 2007, 173, 638–649. [Google Scholar] [CrossRef]
  48. Peakall, R.; Smouse, P.E. GenAlEx 6.5: Genetic analysis in Excel. Population genetic software for teaching and research—An update. Bioinformatics 2012, 28, 2537–2539. [Google Scholar] [CrossRef]
  49. Pritchard, J.K.; Stephens, M.; Donnelly, P. Inference of population structure using multilocus genotype data. Genetics 2000, 155, 945–959. [Google Scholar] [CrossRef]
  50. Tamura, K.; Dudley, J.; Nei, M.; Kumar, S. MEGA 4: Molecular evolutionary genetics analysis (MEGA) software version 4.0. Mol. Biol. Evol. 2007, 24, 1596–1599. [Google Scholar] [CrossRef]
  51. Evanno, G.; Regnaut, S.; Goudet, J. Detecting the number of clusters of idividuals using the software STRUCTURE: A simulation stydy. Mol. Ecol. 2005, 14, 2611–2620. [Google Scholar] [CrossRef]
  52. Earl, D.A.; von Holdt, B.M. STRUCTURE HARVESTER: A website and program for visualizing STRUCTURE output and implimating the Evanno method. Conserv. Gen. Resour. 2012, 4, 359–361. [Google Scholar] [CrossRef]
  53. Rusanov, K.E.; Kovacheva, N.M.; Atanassov, I.I. Comparative GC/MS analysis of rose flower and distilled oil volatiles of the oil bearing rose Rosa damascena. Biotechnol. Biotechnol. Equip. 2011, 25, 2210–2216. [Google Scholar] [CrossRef]
  54. Baydar, N.G.; Baydar, H. Phenolic compounds, antiradical activity and antioxidant capacity of oil-bearing rose (Rosa damascena Mill.) extracts. Ind. Crops Prod. 2013, 41, 375–380. [Google Scholar] [CrossRef]
  55. Roldán-Ruiz, I.; Dendauw, J.; Van Bockstaele, E.; Depicker, A.; De Loose, M. AFLP markers reveal high polymorphic rates in ryegrasses (Lolium spp.). Mol. Breed. 2000, 6, 125–134. [Google Scholar] [CrossRef]
  56. Powell, W.W.; Koput, K.W.; Smith-Doerr, L. Interorganizational collaboration and the locus of innovation: Networks of learning in biotechnology. Adm. Sci. Quart. 1996, 41, 116–145. [Google Scholar] [CrossRef]
  57. Babaei, A.; Tabaei-Aghdaei, S.R.; Khosh-Khui, M.; Omidbaigi, R.; Naghavi, M.R.; Esselink, G.D.; Smulders, M.J.M. Microsatellite analysis of Damask rose (Rosa damascena Mill.) accessions from various regions in Iran reveals multiple genotypes. BMC Plant Biol. 2007, 7, 12. [Google Scholar] [CrossRef] [PubMed]
  58. Kiani, M.; Zamani, Z.; Khalighi, A.; Fatahi, R.; Byrne, D.H. Wide genetic diversity of Rosa damascena Mill. germplasm in Iran as revealed by RAPD analysis. Sci. Hortic. 2008, 115, 386–392. [Google Scholar] [CrossRef]
  59. Rusanov, K.; Kovacheva, N.; Vosman, B.; Zhang, L.; Rajapakse, S.; Atanassov, A.; Atanassov, I. Microsatellite analysis of Rosa damascena Mill. accessions reveals genetic similarity between genotypes used for rose oil production and old Damask rose varieties. Theor. Appl. Genet. 2005, 111, 804–809. [Google Scholar] [CrossRef]
  60. Kiani, M.; Zamani, Z.; Khalighi, A.; Fatahi, R.; Byrne, D.H. Microsatellite analysis of Iranian Damask rose (Rosa damascena Mill.) germplasm. Plant Breed. 2009, 129, 551–557. [Google Scholar] [CrossRef]
  61. Lau, J.W.; Green, P.J. Bayesian model-based clustering procedures. J. Comput. Graph. Stat. 2007, 16, 526–558. [Google Scholar] [CrossRef]
  62. Porras-Hurtado, L.; Ruiz, Y.; Santos, C.; Phillips, C.; Carracedo, A.; Lareu, M.V. An overview of STRUCTURE: Applications, parameter settings, and supporting software. Front. Genet. 2013, 4, 1–13. [Google Scholar] [CrossRef]
  63. Khatik, V.K.; Mishra, A. Influence of growing media and indole butyric acid on Damask rose cuttings (Rosa damascena Mill.) var. Ranisahiba. Vegetos—Int. J. Plant Res. 2017, 30, 262–266. [Google Scholar] [CrossRef]
  64. Akram, M.; Riaz, M.; Munir, N.; Akhter, N.; Zafar, S.; Jabeen, F.; Shariati, M.A.; Akhtar, N.; Riaz, Z.; Altaf, S.H.; et al. Chemical constituents, experimental and clinical pharmacology of Rosa damascena: A literature review. J. Pharm. Pharmacol. 2020, 72, 161–174. [Google Scholar] [CrossRef] [PubMed]
  65. Ueyama, Y.; Hashimoto, S.; Nii, H.; Furukawa, K. The volatile constituents of Shi Mei (Rosa davurica Pall.) flower concrete from China. Flavour Fragr. J. 1990, 5, 115–120. [Google Scholar] [CrossRef]
  66. Villa, C.; Robustelli Della Cuna, F.S.; Russo, E.; Ibrahim, M.F.; Grignani, E.; Preda, S. Microwave-assisted and conventional extractions of volatile compounds from Rosa x damascena Mill. fresh petals for cosmetic applications. Molecules 2022, 27, 3963. [Google Scholar] [CrossRef] [PubMed]
  67. Tambe, E.; Gotmare, S.R. Study of variation and identification of chemical composition in Rosa species oil collected from different countries. IOSR J. Appl. Chem. 2016, 9, 11–18. [Google Scholar] [CrossRef]
  68. Zhao, C.-Y.; Xue, J.; Cai, X.-D.; Guo, J.; Li, B.; Wu, S. Assessment of the key aroma compounds in rose-based products. J. Food Drug Anal. 2016, 24, 471–476. [Google Scholar] [CrossRef] [PubMed]
  69. Mohamadi, M.; Mostafavi, A.; Shamspur, T. Effect of storage on essential oil content and composition of Rosa damascena Mill. petals under different conditions. J. Essent. Oil Bear. Plants 2011, 14, 430–441. [Google Scholar] [CrossRef]
  70. Erbaş, S.; Baydar, H. Variation in scent compounds of oil-bearing rose (Rose damascena Mill.) produced by headspace solid phase microextraction, hydrodistillation and solvent extraction. Rec. Nat. Prod. 2016, 10, 555–565. [Google Scholar]
  71. Mirzaei, M.; Sefidkon, F.; Ahmadi, N.; Shojaeiyan, A.; Hosseini, H. Damask rose (Rosa damascena Mill.) essential oil is affected by short- and long-term handling. Ind. Crops Prod. 2016, 79, 219–224. [Google Scholar] [CrossRef]
  72. Kumar, R.; Sharma, S.; Sood, S.; Kaundal, M.; Agnihotri, V.K. Effect of manure and inorganic fertilizers on growth, yield, and essential oil of Damask rose (Rosa damascena Mill.) and chemical properties of soil in western Himalayas. J. Plant Nutr. 2017, 40, 1604–1615. [Google Scholar] [CrossRef]
  73. Ben Mrid, R.; Ramdan, R.; El Karbane, M.; Nhiri, M. Promising effects of Rosa damascena petal extracts as antioxidant and antibacterial agents. Pak. J. Pharm. Sci. 2021, 34, 1–8. [Google Scholar] [CrossRef]
Figure 1. Liquid chromatography analysis (LC-MS) for gallic acid of the sample KV11 (extract of petals with solvent methanol) of R. damascena.
Horticulturae 09 00946 g001
Figure 2. PCR amplification profiles of the 16 genotypes of R. damascena using SCoT and ISSR primers. (A): SCoT-313 primer with no DNA as Control (Co), (B): SCoT-330, (C): ISSR primer UBC-810 and (D): UBC-841. Samples with code names from KS1 to KZ1 correspond to genotypes from Greece (red line); TR from Turkey (light blue line); FR1, FR2 and FR3 from France (blue line); and B1, B2 and B3 from Bulgaria (green line).
Horticulturae 09 00946 g002
Figure 3. Principal coordinates analysis (PCoA) for the 16 genotypes of R. damascena based on the ISSR (A) and SCoT (B) markers and their combined data (C). The red circle includes the samples from Greece, the one sample from Turkey “TR” and “B1” from Bulgaria, the black circle includes the samples “B2” and “B3” from Bulgaria, and the blue circle includes the three samples from France.
Horticulturae 09 00946 g003
Figure 4. Genetic relationships among 16 genotypes of R. damascena, based on genetic distance using the UPGMA method, which were created with the ISSR (A) and SCoT markers (B) and their combined data (C). Clade I (red outline) includes the samples from Greece, the one sample from Turkey “TR” and “B1” from Bulgaria, clade II (black outline) includes the samples “B2” and “B3” from Bulgaria, and clade III (blue outline) includes the three samples from France.
Horticulturae 09 00946 g004
Figure 5. STRUCTURE analysis and the delta K values of R. damascena based on ISSR (A), SCoT (B) and their combined data (C). The delta K value indicated the number of different genetically homogenous clusters, and each color represents a cluster. Genotypes 1–9: from Greece, 10: from Turkey, 11–13: from France and 14–16: from Bulgaria.
Horticulturae 09 00946 g005
Figure 6. The result of gas chromatography (GC-MS) analysis of R. damascena flower petal extracts (using hexane solvent).
Horticulturae 09 00946 g006
Figure 7. Quantities of the substances 2-phenylethylalcohol (A), nerol (B), citronellol (C), geraniol (D), (citronellol + nerol)/geraniol (E) and nonadecane (F) detected in the flower petal extracts of the nine genotypes of R. damascena from Greece (mean ± standard deviation, n = 5). Different letters in columns of each substance indicate statistically significant differences according to Duncan’s multiple range test at p ≤ 0.05.
Horticulturae 09 00946 g007
Figure 8. Quantities of the substances gallic acid (A), quercetin (B) and kaempferol (C) detected in the flower petal extracts of the nine genotypes of R. damascena from Greece (mean ± standard deviation, n = 5). Different letters in columns of each substance indicate statistically significant differences according to Duncan’s multiple range test at p ≤ 0.05.
Horticulturae 09 00946 g008
Table 1. Genotype codes, origin and geographical coordinates of R. damascena Mill. plants used in the study.
No.Genotype
Code
OriginLatitude
N
Longitude
E
1KS1Kastoria, Greece40.508266°21.337528°
2KS2Pentavrisos, Greece40.459530°21.132097°
3KS3Dispilio, Greece40.477315°21.292740°
4KS4Argos Orestiko, Greece40.435072°21.263327°
5KZ1Platania, Greece40.380573°21.349774°
6KZ2Simantro, Greece40.385791°21.320717°
7KZ3Neapoli, Greece40.327133°21.375617°
8KZ6Sideras, Greece40.381999°21.700040°
9GR1Mega Sirinio, Greece40.114581°21.403893°
10TRInsparta, Turkey37.770464°30.496718°
11FR1Doue La Fontaine, France47.185548°−0.312815°
12FR2Doue La Fontaine, France47.185410°−0.313332°
13FR3Doue La Fontaine, France47.185530°−0.313543°
14B1Tarnicheni, Bulgaria42.632029°25.139176°
15B2Skobelevo, Bulgaria42.668283°25.196214°
16B3Skobelevo, Bulgaria42.670284°25.196456°
Table 2. ISSR and SCoT primers used in this study.
MarkerPrimerSequence (5′→3′)Ta 1 (°C)
UBC-810GAG AGA GAG AGA GAG AT54
UBC-815CTC TCT CTC TCT CTC TG54
ISSRUBC-834AGA GAG AGA GAG AGA GYT54
UBC-841GAG AGA GAG AGA GAG AYC54
UBC-845CTC TCT CTC TCT CTC TRG54
301CAA CAA TGG CTA CCA CCA50
303CAA CAA TGG CTA CCA CCG50
SCoT313ACG ACA TGG CGA CCA TCG50
315ACG ACA TGG CGA CCG CGA50
330CCA TGG CTA CCA CCG GCG50
1 Annealing temperature.
Table 3. Mobile phase gradient elution regime.
Time
(min)
% B 1
040
3100
3.5100
3.5140
1540
1 Mobile phase B consisted of 0.1% formic acid in methanol.
Table 4. Detection parameters of polyphenols of R. damascena.
SubstanceParent
Ion
Product Ion 1Collision Energy
(V)
Product Ion 2Collision
Energy
(V)
Retention Time
(min)
Gallic acid16979.234125184.33
Epicatechin28910930245182.57
Syringic acid197.1153.114182.1173.05
Quercetin301.1151.126179.1219.14
Kaempferol285185.129239.13010.98
Table 5. Parameters of the genetic analysis of the 16 genotypes of R. damascena generated with the ISSR and SCoT markers used in this study.
MarkerPrimer NameTAB 1NPB 2PPB 3 (%)PIC 4RP 5MI 6
UBC-810231878.260.289.382.95
UBC-81513861.540.203.501.05
ISSRUBC-834201785.000.277.382.71
UBC-841151386.670.337.002.72
UBC-845171482.350.276.252.25
30110880.000.335.251.75
303231982.610.266.632.78
SCoT313201785.000.38.382.88
315161062.500.225.381.49
330231773.910.279.253.04
1 Total amplified bands, 2 Number of polymorphic bands, 3 Percentage of polymorphic bands, 4 Polymorphism information content, 5 Resolving power, 6 Marker index.
Table 6. Rooting rate (%), number and length of roots (cm) of shoot cuttings of the nine R. damascena genotypes of Greece rooted with the application of 2 gL−1 of IBA.
GenotypeRooting
(%)
Number
of Roots
Length
of Roots (cm)
KS155.0 ± 12.9 1 a7.1 ± 1.2 1 a8.0 ± 2.4 1 a
KS262.5 ± 9.6 a6.2 ± 1.8 a9.6 ± 3.8 a
KS360.0 ± 8.2 a5.9 ± 1.4 a8.3 ± 2.5 a
KS457.5 ± 12.5 a7.2 ± 2.1 a6.9 ± 2.7 a
KZ167.5 ± 12.6 a5.6 ± 1.6 a9.5 ± 3.7 a
KZ255.0 ± 12.9 a6.4 ± 1.2 a6.7 ± 2.3 a
KZ370.0 ± 14.1 a6.9 ± 1.6 a8.2 ± 2.7 a
KZ665.0 ± 12.9 a6.2 ± 1.8 a7.6 ± 2.1 a
GR160.0 ± 14.1 a6.7 ± 2.0 a7.1 ± 3.0 a
1 Means ± standard deviation within a column followed by the same letter are not significantly different according to Duncan’s multiple range test at p ≤ 0.05.
Disclaimer/Publisher’s Note: The statements, opinions and data contained in all publications are solely those of the individual author(s) and contributor(s) and not of MDPI and/or the editor(s). MDPI and/or the editor(s) disclaim responsibility for any injury to people or property resulting from any ideas, methods, instructions or products referred to in the content.

