Article

Microsatellite-Based Molecular Diversity in Sour Cherry Genotypes (Prunus cerasus L.) Cultivated in Hungary

Molecular Genetics and Breeding Group, Department of Genetics and Genomics, Institute of Genetics and Biotechnology, Hungarian University of Agriculture and Life Sciences (MATE), H-2100 Gödöllő, Hungary
*
Author to whom correspondence should be addressed.
Horticulturae 2023, 9(8), 892; https://doi.org/10.3390/horticulturae9080892
Submission received: 10 July 2023 / Revised: 1 August 2023 / Accepted: 2 August 2023 / Published: 6 August 2023
(This article belongs to the Section Genetics, Genomics, Breeding, and Biotechnology (G2B2))

Abstract

:
The aim of this study was to evaluate the genetic diversity of sour cherries using SSR markers, correlate the data with phenotypic traits, and investigate the suitability of Prunus-specific microsatellite markers in this species. Nineteen sour cherry genotypes from the Fruit Research Institute in Érd, Hungary, were analyzed using twelve SSR primer pairs. The number of alleles ranged from two to ten, with a mean value of 4.67 per locus. The highest number of alleles was generated with BPPCT 007. All the primers displayed a polymorphic pattern. The most informative markers, based on the highest PIC values, were CPPCT022, BPPCT041, and BPPCT030. The genotypes were grouped based on flowering time, ripening time, and fruit weight. To determine the correlation, we have performed a regression analysis association with fruit traits and molecular markers. The marker PceGA025 appeared to have an allele size that statistically significantly correlates to flowering and ripening time. Also, BPPCT002, BPPCT007 and UCDCH17 have an allele that significantly correlates to ripening time. Additionally, one of the alleles of UDP 98 410 appeared to be correlated with fruit weight.

1. Introduction

Within the Rosaceae family, there are several agronomically and economically important stone fruit plants, such as almonds, plums, peaches, and nectarines [1]. The Prunus genus alone includes about 400 to 430 species, including peaches (Prunus persica L., 2n = 2x= 16), apricots (Prunus armeniaca L., 2n = 2x = 16), sweet cherries (Prunus avium L., 2n = 2x = 16), and sour cherries (Prunus cerasus L., 2n = 4x = 32) [1,2,3,4,5]. Cherries are indigenous to Europe and Asia, while sour cherries are native to the Near East center (Asia Minor, Iran, Iraq, Syria) [6]. Prunus cerasus L. is an allotetraploid species that evolved from the natural hybridization of Prunus avium L. (2x = 16) and Prunus fruticosa L. (4x = 32) both originating from the same area [7,8].
Several theories have been proposed regarding the arrival of sour cherries in Europe, but the most widely accepted suggestion is that various ecotypes have developed over the years to adapt to different weather conditions [9]. As a result of this broad adaptation, sour cherries can be grown in various areas, including Hungary. Additionally, Hrotkó et al. [10] explored the genetic background of Prunus fruticosa Pall. in various hybrid derivatives, revealing that the female parent of sour cherry must be Prunus fruticosa. For natural hybridization to occur, both species need to share the same habitat and flowering time, providing an opportunity for normal Prunus fruticosa gametes to encounter unreduced Prunus avium gametes. This finding was further supported by Wöhner et al. [11], who provided evidence through long-read chromosome-level draft genome assembly.
The vegetation period of sour cherries is between 200 and 240 days, with the blooming period starting in the middle of April and lasting until the beginning of May. Moreover, these fruits exhibit excellent adaptability to different climates and they can tolerate temperatures as low as −35 °C during the winter period [12]. Although other countries initiated their sour cherry breeding projects in the early 1900s, Hungary only established its foundation in the 1950s when Pál Maliga aimed to select clones that ripened earlier than Pándy clones, were self-fertile, and possessed multi-purpose utilization [13]. Until that time, Pándy dominated the market, despite being self-incompatible and having a low yield [12]. However, there are no perfect varieties that can be used for every purpose, and breeders need to consider their customers’ demands. Furthermore, due to climate change, there is a need to improve and develop new, modern varieties that can adapt to the new environmental conditions and meet the interests of consumers and breeders [14,15,16]. To accomplish this, traits are separated into various categories according to different priorities. For example, from the customers’ perspective, the primary group of traits includes ripening time, fruit size, skin color, taste, etc., while the secondary group encompasses kernel size, vitamin content, flesh color, etc. [12].
Several studies have demonstrated that molecular markers are useful tools that allow breeders to select from their collections, reduce time and costs, and increase potential profit [17,18]. Molecular markers are widely used to assess genetic variation in germplasm collections [19], evolutionary studies [20], ecological and phylogenetic studies, as well as in various fields such as taxonomy and genetic engineering [21,22,23].
One of the most popular molecular markers are microsatellites, or simple sequence repeats (SSRs), which can be detected using simple reproducible assays. They are co-dominant, abundant, multi-allelic, and uniformly distributed throughout the genome [24]. SSRs can be classified as mono-, di-, tri-, tetra-, penta-, and hexanucleotide repeats, with lengths ranging from 1 to 6 nucleotides [25]. Typically, they consist of tandem repeats of 5–20 times in the genome with a minimum repeat length of twelve base pairs [26,27,28] and are widely applied in research [29,30,31,32,33]. Microsatellites have been successfully used in Prunus species since the early 2000s [2,34,35,36,37], and were primarily developed in peaches, but have also been tested and used in other species [2]. Moreover, SSRs have been developed and applied in sour cherries, not only in Prunus cerasus L., but also in other members of the Rosaceae family [38,39]. For instance, Downey and Iezzoni [40] used two sour cherry microsatellites in black cherry along with sweet cherry and peach primers. Furthermore, microsatellites have evolved to be suitable not only for diversity evaluation [31,41]; they have also helped to preserve the germplasm [42], assess the pollinizer success rate [43], and supported further studies regarding, for instance, sex determination in the case of dioecious plants [44] within or outside of the Rosaceae family.
Therefore, the aim of this study was to assess the genetic diversity within sour cherry genotypes cultivated in Hungary. The subject of this present research is also to assess the correlation between genotypic data and phenotypic traits to provide background information and a tool that is suitable for selecting plants during breeding, thereby helping the work of breeders. This examination also assesses the transferability of microsatellite markers developed in other species to sour cherry.

2. Materials and Methods

2.1. Plant Material and DNA Isolation

The plant materials used for the SSR analysis consisted of a total of 19 sour cherry genotypes (Table 1 and Table 2) which were obtained from the Fruit Research Institute in Érd, Hungary. Leaves were collected and stored at −20 °C until further use. DNA extractions were carried out with Qiagen DNeasy® Plant Mini Kit with PVP (Polyvinylpyrrolidone) according to the manufacturer’s protocols.

2.2. PCR Condition

PCR was conducted using a Thermal Cycler GeneAmp PCR System 9700 with a final volume of 10 µL for 15–20 ng of template DNA. The reaction mixture contained DreamTaq™ DNA polymerase (Thermo Fisher Scientific™); the protocols were performed according to the manufacturer’s instructions (Table 3). Touchdown PCRs were carried out, which consisted of an initiation cycle at 95 °C for 3 min; 10 cycles of denaturation at 95 °C for 30 s, primer annealing at 65 °C for 30 s and extension at 72 °C for 30 s, at which point the annealing temperature was decreased by 1 °C at each cycle. This was followed by 25 cycles of denaturation at 95 °C for 30 s, annealing at 56 °C for 30 s and extension at 72 °C for 30 s. The reaction was completed with a post-polymerization extension cycle at 72 °C for 5 min.

2.3. SSR and Statistical Analysis

In this study, the amplified PCR products were first tested on a 1% TBE agarose gel and then separated on a 6% polyacrylamide gel (© Bio-Rad Laboratories, Inc., Budapest, Hungary) using a vertical system (ALF-Express II., Amersham Biosciences, AP Hungary LTD, Budapest, Hungary). Fragments were detected using a Cyanine5 (Cy5) label attached to the forward primer (Bio-Science Kereskedelmi és Szolgáltató Kft, Budapest, Hungary). Cy5 is a far-red-fluorescent dye which, at 633 nm or 647 nm laser lines, results in an excitation; therefore, the sensors can notice the signals. The allele sizes at the SSR loci were determined using DNA molecular weight standards and the ALFwin Fragment Analyser 1.0 software.
To analyze the genetic similarity among the genotypes, a dendrogram was constructed using the IBM SPSS Statistics 23 (Release 23.0.0.0) program. We classified the genotypes into hierarchical clusters using the “Within-groups linkage” cluster method by checking the binary data “variance”. Furthermore, the Jaccard index was calculated using the Past 4.03 (Paleontological Statistics) program. The Jaccard index is a measure of genetic similarity based on the presence or absence of alleles on a scale 0–1, where 1 means complete similarity and 0 indicates a complete difference between genotypes. Furthermore, the genotypes were classified into 4–4 groups for each trait based on flowering time (1— early, 2—early–mid, 3—mid, mid–late and 4—late), ripening time (1—before June 5; 2—June 5–15, 3—June 15–25, 4—after June 25) and fruit weight (1– ≤ 3–4 g; 2–4–5 g; 3–5–6 g; 4–6 g≤) and regression association analysis was applied again with this software. Then, a Chi-square test was performed based on the allele size dispersion according to flowering time, ripening time, and fruit weight groups. The SSR fragments were scored as either present or absent, and subsequent association analysis was conducted to identify markers that were correlated with the studied characteristics. This analysis aimed to establish relationships between the molecular data and the trait data under investigation.
Additionally, the results were evaluated using various parameters. The expected heterozygosity index (H), Polymorphic Information Content (PIC), Effective multiplex ratio, Marker index and Discriminating power were calculated using the iMEC: Online Marker Efficiency Calculator program developed by Amiryousefi et al. [51]. The program utilizes different calculations based on previous research. It is an R software-based analytical webpage which is available online. The expected heterozygosity was determined based on the work of Liu et al. [52], the PIC was based on Botstein et al.’s research [53], and the mean heterozygosity, marker index, and discriminating power were based on the work of Tessier et al. [54]. Binary data were used for the analysis, and for codominant markers, the maximum value of H and PIC was assumed to be 0.5, since both values were affected by the number and frequency of alleles, and it is assumed that there were two alleles per locus. Higher values of the indices indicated higher levels of polymorphism between genotypes.

3. Results

In this study, nineteen sour cherry varieties (Table 1) were fingerprinted using twelve microsatellite markers, six newly applied pairs of SSR (Simple Sequence Repeat) primers, alongside with six previously used microsatellites together (Table 4, [55]) to assess their genetic diversity and relatedness.
A total of 56 alleles were found, with the number of alleles per locus ranging from 2 to 10, and a mean of 4.67 alleles per locus. The highest number of alleles was observed in BPPCT007 (Table 4).
None of the twelve examined SSR loci exhibited a monomorphic pattern. We evaluated our SSR results based on a study by Amiryousefi et al. [51] (Table 5). The loci Ma39a, UCDCH17 and UDP 96 005 showed the highest heterozygosity index (H = 0.50), while CPPCT022 had the lowest (H = 0.35). These three primer pairs have the highest probability of predicting a heterozygous individual for the given locus. The average heterozygosity index across the twelve markers was 0.46. Among the twelve markers tested, CPPCT022 (PIC = 0.43), BPPCT041 (PIC = 0.42), and BPPCT030 (PIC = 0.41) exhibited the highest PIC values in Prunus cerasus L. The effective multiplex ratio (EMR), ranging from 0.55 to 6.23, reflects the effectiveness of the primer–marker system, with higher values indicating better effectiveness. The Marker Index (MI) is interpreted similarly to EMR, where higher values indicate better performance. According to the discriminating power, BPPCT041 (DP = 0.93) and UDP 98 410 (DP = 0.89) have the best ability to distinguish individuals in a population, thus reducing the probability of confusion between individuals, meanwhile CPPCT022 has the poorest ability at 0.41 (Table 5).
The Jaccard index, among the examined Prunus cerasus L. genotypes, indicates that Pándy clones are identical to each other. Also, Újfehértói fürtös, Debreceni bőtermő, and Kántorjánosi 3 exhibit high similarity (Table 6). The genotypes based on SSR data that bear the closest resemblance to Érdi bőtermő are Favorit, Hibrid 3/48, and Maliga emléke.
On the other hand, Pipacs genotypes show the least similarity to the analyzed samples according to the Jaccard index (Table 6).
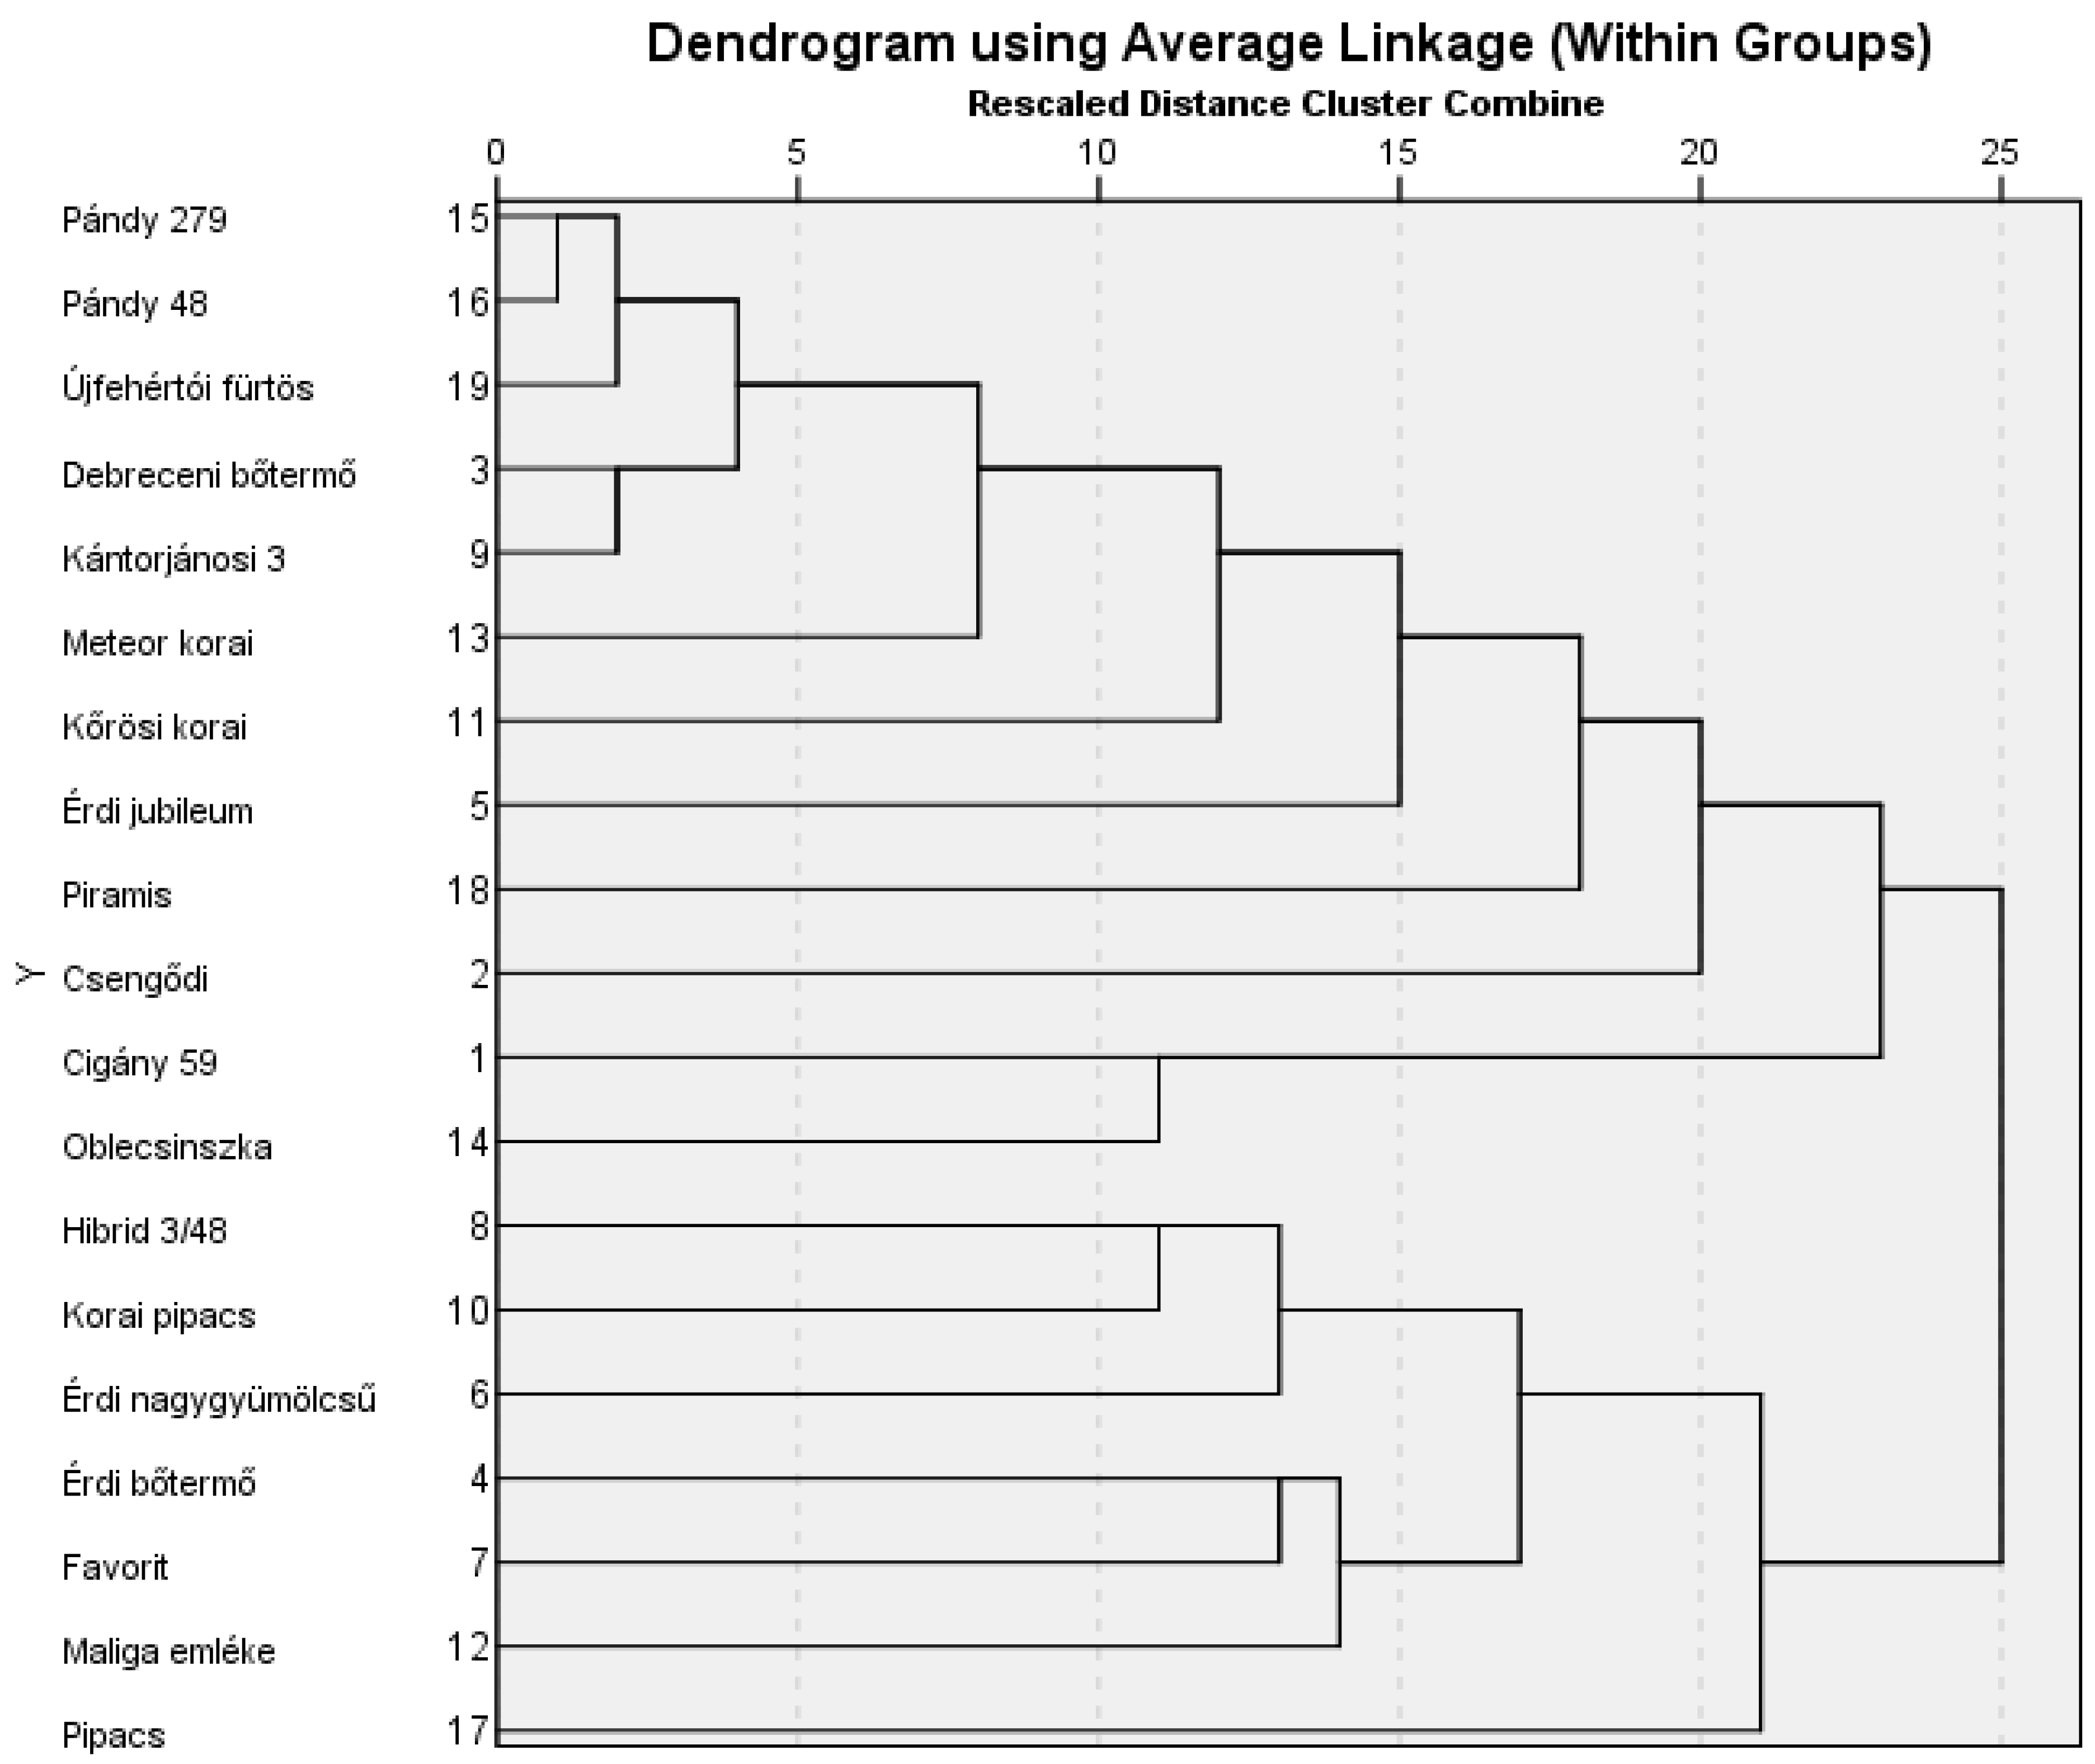
To determine genetic relatedness, a dendrogram was constructed based on the SSR data of the nineteen sour cherry cultivars using 12 microsatellite markers, as shown in Figure 1. The dendrogram reveals two main groups. The first and largest group contains Pándy clones, Érdi jubileum, a Cigány clone, and Debreceni bőtermő, among others. The second main group consists of Korai pipacs, Favorit, and the other two Érdi genotypes, among others. Pándy 48 and Pándy 279 cannot be distinguished from each other based on the dendrogram. Additionally, Pipacs, Cigány 59, and Oblecsinszka genotypes are genetically the furthest from the analyzed samples within their respective cluster, as indicated in Figure 1.
Additionally, based on their characteristics (flowering time, ripening time, and fruit weight) we classified the genotypes into 4–4 groups for each trait (Table 2), then regression association analysis was performed to determine the linkage for each phenotypic trait and the microsatellite markers used. The aim of these analyses is to be able to examine populations to help breeders in the early selection phase. Thus, we have demonstrated the dispersion of allele sizes on heatmaps (Figure 2). The statistically significant values were marked with green asterisks. Following this analysis, we carried out a Chi-square test. PceGA025172 was found to be associated with flowering time. The marker alleles BPPCT002179, BPPCT007122, PceGA025172, UCDCH17182 showed an association with the ripening time. Also, UDP98 410141 showed correlation with fruit weight. The highest correlation was shown by PceGA025172 and UCDCH17182 (R2 = 0.795 and R2 = 0.852, respectively). One of the markers, BPPCT007122, had −0.753 as a standardized beta coefficient and showed statistically significant (t = −5.965, p < 0.001) negative correlation with ripening time. BPPCT002179 also had a statistically significant correlation with ripening time, where the standardized beta coefficient was 0.763 (t = 6.525, p < 0.001) (Table 7).

4. Discussion

Simple Sequence Repeats (SSRs) were primarily developed and tested in peaches in the Rosaceae family. However, multiple studies have shown that although they were generated in Prunus persica L., some of them can also be used in other species within the Rosaceae family [2,32,56].
It is a difficult challenge to analyze sour cherries because they are tetraploid and most of the statistical analysis techniques and software used molecular genetics are designed for diploid species or dominant features. Moreover, diversity analyses in sour cherries are usually based on morphological characteristics [57]; only a few studies have applied genetic markers to examine them [7,58]. In the present study, twelve molecular markers were used to analyze and characterize the genetic diversity of sour cherries cultivated in Hungary and we attempted to overcome the associated limitations. Of these markers, ten originated from peach, one from sweet cherry, and one from sour cherry (Table 3). Among these twelve microsatellites, only Ma039a has never been previously applied in Prunus cerasus L.; however, we have proved that this marker is applicable in this genus. Moreover, this marker could be link to flowering time [59].
There are studies in which the same markers were used in sour cherry, but detailed data on the generated alleles are not available [60,61]. However, our data are within or close to the size ranges reported in other analyses. Dirlewanger et al. [2] developed several Prunus microsatellites in peach and tested them in species within the Rosaceae family and outside of the family. They reported the exact allele sizes for Prunus persica L. and Prunus avium L. However, for other tested genotypes, there were cases in which the markers worked, partially worked, or did not amplify at all. In the case of sour cherry, markers BPPCT002, BPPCT015, BPPCT030, and BPPCT041 generated amplicons in the tested genotypes, while only BPPCT007 did not yield fragments for all individuals. Additionally, the BPPCT007 microsatellite appears to be multilocal since more than four fragments were detected in approximately half of the samples. It has been reported that this locus is also multilocal in sweet cherry, which is a parent of sour cherry, explaining the shared characteristics.
Although Dirlewanger et al. [2] did not report allele sizes, subsequent studies have used these markers and reported them. Wünsch et al. [62] applied BPPCT002 and BPPCT007, but only size ranges were published. In the case of BPPCT002, the expected amplicon length was between 166 bp and 180 bp. Comparing our results (Table 4) to theirs, the generated allele sizes are within or slightly above their range. In the case of BPPCT007, the lowest range is quite similar to theirs, but in our case the highest size is approximately 50 bp longer. Antonius et al. [63] in agreement with Khadiv-Khub et al. [7,64,65] also applied these to markers in sour cherry. While their results showed similar fragment lengths for BPPCT002, the highest value for BPPCT007 was 187 bp and 189 bp, respectively, compared to our result of 234 bp. Khadivi-Khub [65] has indicated that the 234 bp fragment of BPPCT007 is associated with doubled fruit, but this trait was not the focus of our research. Nevertheless, we observed this length in almost half of our examined genotypes.
Cantini et al. [38], Pedersen et al. [39], Lacis et al. [66], and Najafzadeh et al. [67] reported the use of PceGA025. Our allele results are within the size range reported by these authors. Moreover, Pedersen et al. [39] have analyzed four genotypes that are consistent with our analyzed varieties. In the case of the Favorit genotype, our results match with theirs, but for Érdi jubileum, Oblacsinszka, and Újfehértói fürtös, we observed one fewer allele. Even though we used the same percentage for the polyacrylamide gel, we used different running conditions and a different visualization method. The other researchers used dried gel that was exposed to Kodak BioMax film and in our case, a computer program detected the fragments. It might not be able to sense the allele sizes that are too close to each other; thus, the different technique could be the reason for the lower number of alleles.
UDP 96 001 marker was studied in flowering cherries by Ohta et al. [60] and in Prunus rootstock by Turkoglu et al. [68]. They obtained almost identical results to ours. However, Najafzadeh et al. [67] have also applied this primer pair, and their reported size range was slightly broader, with triple the number of alleles compared to ours. They also analyzed their samples with a UDP 96 005 microsatellite, and in that case, their size range was much larger (75–180 bp) than ours (102–134 bp). Nonetheless, Wünsch et al., Turkoglu et al. and Khadivi-Khub et al. reported similar allele sizes and ranges to ours [7,62,68]. Khadivi-Khub [65] suggested that the 122 bp length of UDP 96 005 is correlated with fruit weight, fruit length, and fruit diameter. We did not obtain this specific allele size in our study; the closest size we obtained was 118 bp. However, it was present in all genotypes regardless of their fruit weight and length (Table 2). Thus far, we have only had the opportunity to examine individuals and Khadivi-Khub [65] has used only five wild cherry (Mazzard) and four sour cherry genotypes; it is important and necessary to investigate segregating generations to prove and establish a correlation.
The data of Kompetenzzentrum [69] include four markers (CPPCT022, UCDCH17, UDP 96 001, UDP 98 410) applied in sour cherry, and three of them (UCDCH17, UDP 96 001, UDP 98 410) produced exact sizes in their study, with four genotypes (Favorit, Kánotjánosi 3, Maliga emléke, Újfehértói fürtös) matching with ours. Regarding UCDCH17 and UDP 96 001, although our data are close to their size range, all common genotypes had one additional allele. In the case of UDP 98 410, the two datasets are the same. However, differences in the technique (Multiplex PCR), polymerase (GE Taq Polymerase), and running conditions (sequencer for analyzing fragments) used in the research may account for the slight discrepancies in exact allele sizes. For example, UDP 98 410 results show that in the case of Kompetenzzentrum [69], they obtained 127 bp,135 bp and 127 bp for Favorit and Maliga emléke, respectively, while in our dataset, the same genotypes had 131 bp,139 bp, and 131 bp, respectively.
The twelve primer pairs used to screen the nineteen sour cherry genotypes generated a total of 52 distinct alleles. The average allele number per locus was 4.67, ranging from 2 to 10 (Table 4).
In conclusion, in our research, the lowest heterozygosity index was observed for CPPCT022 (H = 0.35), while the highest values were observed for Ma39a(H = 0.50), UCDCH17(H = 0.50) and UDP 96 005 (H = 0.50). On the other hand, in the case of PIC the lowest applies to Ma39a (PIC = 0.37), UCDCH17 (PIC = 0.37), and UDP 96 005 (PIC = 0.37). The highest values were 0.43 for CPPCT022, followed by 0.42 for BPPCT041. Regarding Effective Multiplex Ratio (EMR), the values ranged from 0.55 to 6.23, with BPPCT 007 having the highest value and BPPCT 041 having the lowest. Similar results were observed for the Marker Index (MI). Additionally, according to our results, BPPCT041 (DP = 0.93) and UDP 98 410 (DP = 0.89) have a higher chance of distinguishing a genotype, while CPPCT022 (DP = 0.41) has the least discriminative power (Table 5).
Regarding the Jaccard index (Table 6), the lowest average similarity was observed for Pipacs, followed by Csengődi and Cigány 59, respectively. All the genotypes selected are from different regions. Correspondingly, the dendrogram partially supported the results, as genetically, the furthest genotypes were Pipacs, Piramis, and Csengődi (Figure 1).
The regression association analysis showed that PceGA025172, BPPCT002179, BPPCT007122, UCDCH17182, and UDP98410141 had statistically significant values regarding flowering time, ripening time, and fruit weight (Table 2). In the case of peach genotypes, BPPCT007 was associated with fruit weight [70,71]; in our case, statistically it was more in line with ripening time. Dirlewanger et al. [59] found in the case of apricot UDP 98 410, BPPCT007, Ma39a, and CPPCT022, and in the case of sweet cherry BPPCT002, UDP 98 410, and CPPCT022 that they could relate to flowering time.
In summary, based on our results, the most efficient primers used to analyze the nineteen sour cherry genotypes were BPPCT 007, and BPPCT 002, while the least efficient was BPPCT 041.
Additionally, this type of research can help breeders to overcome limitations and may assist with early selection. Moreover, monilia and blumeriella leaf spot are common diseases of cherries [72], so the breeding of varieties resistant or tolerant to these diseases is crucial, and the analysis of additional morphological characteristics could contribute a lot to the work of breeders.

5. Conclusions

In this study, twelve SSR primer pairs were used to analyze 19 sour cherry genotypes. All the microsatellites showed a polymorphic pattern, indicating genetic variation among the genotypes. The polymorphic information content (PIC) value was highest for CPPCT 022. However, further data analysis based on regression association analysis revealed that BPPCT 007, BPPCT 002, PceGA025, and UCDCH17 were the best markers for distinguishing Prunus cerasus L. genotypes. These markers provided the most informative data for genotype differentiation. It is important to note that there may be non-distinguishable clones among the genotypes analyzed in this study. To overcome this limitation and enhance our ability to differentiate between closely related genotypes, it is advisable to use additional molecular markers in future studies. Furthermore, among other studied microsatellite marker alleles, BPPCT007122 and BPPCT002179 indicated high correlation with ripening time based on regression association analysis. Studying genetic diversity among different cultivars and populations is crucial, particularly for stock nurseries in which fruit production is not allowed. In such cases, breeders face challenges in terms of distinguishing genotypes visually based on morphological traits. Our results can help to predict genotypes’ flowering time, ripening time, and fruit weight and help breeders with early selection to reduce time and cost. Furthermore, molecular-based genetic analysis plays a vital role in assisting breeders in making informed decisions about genotypes, since molecular markers are not influenced by environmental effects and can help to predict characteristics in early stages of development. By providing valuable information on genetic diversity, these analyses can facilitate the selection and breeding of improved sour cherry varieties.

Author Contributions

Conceptualization, E.K.; methodology, J.B. and A.K.T.-L.; software, J.B. and Z.K.; validation, A.S., A.V. and E.K.; formal analysis, B.P.; investigation, J.B. and Z.K.; data curation, B.P., Z.K. and A.K.T.-L.; writing—original draft preparation, J.B.; writing—review and editing, Z.K., A.V., A.S. and E.K.; visualization, J.B. and Z.K.; supervision, E.K., A.V. and A.S. All authors have read and agreed to the published version of the manuscript.

Funding

This research received no external funding; it was solely supported by the Hungarian University of Agriculture and Life Sciences.

Institutional Review Board Statement

Not applicable.

Informed Consent Statement

Not applicable.

Data Availability Statement

The data presented in this study are available on request from the corresponding author. Informed consent was obtained from all subjects involved in the study.

Acknowledgments

The authors would like to thank the Fruit Research Institute in Érd, Hungary, for their time and assistance when collecting the plant materials. We wish to express our deepest gratitude to Ákos Tarnawa (Hungarian University of Agriculture and Life Sciences) for his knowledge and the comments on the manuscript that we received to carry out the research.

Conflicts of Interest

The authors declare no conflict of interest.

References

  1. Marquis, D.A. Prunus serotina Ehrh. black cherry. Silv. N. Am. 1990, 2, 594–604. [Google Scholar]
  2. Dirlewanger, E.; Cosson, P.; Tavaud, M.; Aranzana, J.; Poizat, C.; Zanetto, A.; Arus, P.; Laigret, F. Development of microsatellite markers in peach [Prunus persica (L.) Batsch] and their use in genetic diversity analysis in peach and sweet cherry (Prunus avium L.). Theor. Appl. Genet. 2002, 105, 127–138. [Google Scholar] [CrossRef]
  3. Dirlewanger, E.; Graziano, E.; Joobeur, T.; Garriga-Caldere, F.; Cosson, P.; Howad, W.; Arus, P. Comparative mapping and marker-assisted selection in Rosaceae fruit crops. Proc. Natl. Acad. Sci. USA 2004, 101, 9891–9896. [Google Scholar] [CrossRef]
  4. Tavaud, M.; Zanetto, A.; David, J.L.; Laigret, F.; Dirlewanger, E. Genetic relationships between diploid and allotetraploid cherry species (Prunus avium, Prunus x gondouinii and Prunus cerasus). Heredity 2004, 93, 631–638. [Google Scholar] [CrossRef] [Green Version]
  5. Das, B.; Ahmed, N.; Singh, P. Prunus diversity-early and present development: A review. Int. J. Biodivers. Conserv. 2011, 3, 721–734. [Google Scholar]
  6. Vavilov, N.I.; Vavylov, M.I.; Dorofeev, V.F. Origin and Geography of Cultivated Plants; Cambridge University Press: Cambridge, MA, USA, 1992. [Google Scholar]
  7. Khadivi-Khub, A. Genetic relationships among cherry species with transferability of simple sequence repeat loci. Mol. Biol. Rep. 2014, 41, 6201–6210. [Google Scholar] [CrossRef]
  8. Dondini, L.; Lugli, S.; Sansavini, S. Cherry breeding: Sweet cherry (Prunus avium L.) and sour cherry (Prunus cerasus L.). In Advances in Plant Breeding Strategies: Fruits; Springer: Berlin/Heidelberg, Germany, 2018; pp. 31–88. [Google Scholar]
  9. Quero-García, J.; Iezzoni, A.; Pulawska, J.; Lang, G.A. Cherries: Botany, Production and Uses; CABI: Wallingford, UK, 2017. [Google Scholar]
  10. Hrotkó, K.; Feng, Y.; Halász, J. Spontaneous hybrids of Prunus fruticosa Pall. in Hungary. Genet. Resour. Crop Evol. 2020, 67, 489–502. [Google Scholar] [CrossRef] [Green Version]
  11. Wöhner, T.W.; Emeriewen, O.F.; Wittenberg, A.H.; Schneiders, H.; Vrijenhoek, I.; Halász, J.; Hrotkó, K.; Hoff, K.J.; Gabriel, L.; Lempe, J. The draft chromosome-level genome assembly of tetraploid ground cherry (Prunus fruticosa Pall.) from long reads. Genomics 2021, 113, 4173–4183. [Google Scholar] [CrossRef]
  12. Tóth, M. Gyümölcsfaj-és Fajtaismeret; Inkart Kft.: Budapest, Hungary, 2009; pp. 103–114. ISBN 978-963-503-406-2. [Google Scholar]
  13. Bedő, Z.B.L.; Karsai, I.; Kruppa, J.; Matuz, J.; Oláh, I.A.; Polgár, Z.; Veisz, O. (Eds.) A magyar növénynemesítés eredményei az ezredfordulón (1990–2018). Agroinform. Bp. 2019, 79–89. [Google Scholar]
  14. Khaeim, H.; Kende, Z.; Balla, I.; Gyuricza, C.; Eser, A.; Tarnawa, Á. The Effect of Temperature and Water Stresses on Seed Germination and Seedling Growth of Wheat (Triticum aestivum L.). Sustainability 2022, 14, 3887. [Google Scholar] [CrossRef]
  15. Kovács, Z.; Bedő, J.; Pápai, B.; Tóth-Lencsés, A.K.; Csilléry, G.; Szőke, A.; Bányai-Stefanovits, É.; Kiss, E.; Veres, A. Ripening-Induced Changes in the Nutraceutical Compounds of Differently Coloured Pepper (Capsicum annuum L.) Breeding Lines. Antioxidants 2022, 11, 637. [Google Scholar] [CrossRef]
  16. Pápai, B.; Kovács, Z.; Tóth-Lencsés, K.A.; Bedő, J.; Csilléry, G.; Veres, A.; Szőke, A. Evaluation of Abnormal Hypocotyl Growth of Mutant Capsicum annuum Plants. Agriculture 2023, 13, 481. [Google Scholar] [CrossRef]
  17. Hasan, N.; Choudhary, S.; Naaz, N.; Sharma, N.; Laskar, R.A. Recent advancements in molecular marker-assisted selection and applications in plant breeding programmes. J. Genet. Eng. Biotechnol. 2021, 19, 1–26. [Google Scholar] [CrossRef]
  18. Shi, Y.; Zhu, H.; Zhang, J.; Bao, M.; Zhang, J. Development and validation of molecular markers for double flower of Prunus mume. Sci. Hortic. 2023, 310, 111761. [Google Scholar] [CrossRef]
  19. Bayo-Canha, A.; López-Ortega, G.; Hernández-Munuera, M.; Frutos-Tomás, D. Genetic analysis of a germplasm collection of sweet cherry with a set of SSR markers. In Proceedings of the VIII International Cherry Symposium 1235, Yamagata, Japan, 5–9 June 2017; pp. 79–84. [Google Scholar]
  20. Patzak, J.; Henychova, A.; Paprstein, F.; Sedlak, J. Evaluation of Genetic Diversity within Sweet Cherry Accessions of Czech Genetic Resources by Molecular SSR Markers; Acta Horticulturae 1235; ISHS: Coimbatore, India, 2019; pp. 71–78. [Google Scholar]
  21. Agarwal, M.; Shrivastava, N.; Padh, H. Advances in molecular marker techniques and their applications in plant sciences. Plant Cell Rep. 2008, 27, 617–631. [Google Scholar] [CrossRef]
  22. Marchese, A.; Giovannini, D.; Leone, A.; Mafrica, R.; Palasciano, M.; Cantini, C.; Di Vaio, C.; De Salvador, F.; Giacalone, G.; Caruso, T. S-genotype identification, genetic diversity and structure analysis of Italian sweet cherry germplasm. Tree Genet. Genomes 2017, 13, 93. [Google Scholar] [CrossRef]
  23. Barreneche, T.; Cárcamo de la Concepción, M.; Blouin-Delmas, M.; Ordidge, M.; Nybom, H.; Lacis, G.; Feldmane, D.; Sedlak, J.; Meland, M.; Kaldmäe, H. Ssr-based analysis of genetic diversity and structure of sweet cherry (Prunus avium L.) from 19 countries in Europe. Plants 2021, 10, 1983. [Google Scholar] [CrossRef] [PubMed]
  24. Powell, W.; Morgante, M.; Andre, C.; Hanafey, M.; Vogel, J.; Tingey, S.; Rafalski, A. The comparison of RFLP, RAPD, AFLP and SSR (microsatellite) markers for germplasm analysis. Mol. Breed. 1996, 2, 225–238. [Google Scholar] [CrossRef]
  25. Oppen, M.J.v.; Rico, C.; Turner, G.F.; Hewitt, G.M. Extensive homoplasy, nonstepwise mutations, and shared ancestral polymorphism at a complex microsatellite locus in Lake Malawi cichlids. Mol. Biol. Evol. 2000, 17, 489–498. [Google Scholar] [CrossRef] [PubMed] [Green Version]
  26. Vaughan, S.; Russell, K. Characterization of novel microsatellites and development of multiplex PCR for large-scale population studies in wild cherry, Prunus avium. Mol. Ecol. Notes 2004, 4, 429–431. [Google Scholar] [CrossRef]
  27. Ellegren, H. Microsatellites: Simple sequences with complex evolution. Nat. Rev. Genet. 2004, 5, 435–445. [Google Scholar] [CrossRef]
  28. Prajapati, B.; Gupta, J.; Pandey, D.; Parmar, G.; Chaudhari, J. Molecular markers for resistance against infectious diseases of economic importance. Vet. World 2017, 10, 112. [Google Scholar] [CrossRef] [Green Version]
  29. Zhang, Q.; Yan, G.; Dai, H.; Zhang, X.; Li, C.; Zhang, Z. Characterization of Tomentosa cherry (Prunus tomentosa Thunb.) genotypes using SSR markers and morphological traits. Sci. Hortic. 2008, 118, 39–47. [Google Scholar] [CrossRef]
  30. Jin, H.; Tan, X.; Liu, X.; Ding, Y. The study of effect of tea polyphenols on microsatellite instability colorectal cancer and its molecular mechanism. Int. J. Color. Dis. 2010, 25, 1407–1415. [Google Scholar] [CrossRef] [PubMed]
  31. Cho, Y.-I.; Park, J.-H.; Lee, C.-W.; Ra, W.-H.; Chung, J.-W.; Lee, J.-R.; Ma, K.-H.; Lee, S.-Y.; Lee, K.-S.; Lee, M.-C. Evaluation of the genetic diversity and population structure of sesame (Sesamum indicum L.) using microsatellite markers. Genes. Genom. 2011, 33, 187–195. [Google Scholar] [CrossRef]
  32. Antanynienė, R.; Šikšnianienė, J.B.; Stanys, V.; Frercks, B. Fingerprinting of Plum (Prunus domestica) Genotypes in Lithuania Using SSR Markers. Plants 2023, 12, 1538. [Google Scholar] [CrossRef] [PubMed]
  33. Choudhury, D.R.; Kumar, R.; Maurya, A.; Semwal, D.P.; Rathi, R.S.; Gautam, R.K.; Trivedi, A.K.; Bishnoi, S.K.; Ahlawat, S.P.; Singh, K.; et al. SSR and SNP Marker-Based Investigation of Indian Rice Landraces in Relation to Their Genetic Diversity, Population Structure, and Geographical Isolation. Agriculture 2023, 13, 823. [Google Scholar] [CrossRef]
  34. Cipriani, G.; Lot, G.; Huang, W.-G.; Marrazzo, M.; Peterlunger, E.; Testolin, R. AC/GT and AG/CT microsatellite repeats in peach [Prunus persica (L) Batsch]: Isolation, characterisation and cross-species amplification in Prunus. Theor. Appl. Genet. 1999, 99, 65–72. [Google Scholar] [CrossRef]
  35. Aranzana, M.; Carbó, J.; Arús, P. Microsatellite variability in peach [Prunus persica (L.) Batsch]: Cultivar identification, marker mutation, pedigree inferences and population structure. Theor. Appl. Genet. 2003, 106, 1341–1352. [Google Scholar] [CrossRef]
  36. Messina, R.; Lain, O.; Marrazzo, M.T.; Cipriani, G.; Testolin, R. New set of microsatellite loci isolated in apricot. Mol. Ecol. Notes 2004, 4, 432–434. [Google Scholar] [CrossRef]
  37. Struss, D.; Ahmad, R.; Southwick, S.M.; Boritzki, M. Analysis of sweet cherry (Prunus avium L.) cultivars using SSR and AFLP markers. J. Am. Soc. Hortic. Sci. 2003, 128, 904–909. [Google Scholar] [CrossRef] [Green Version]
  38. Cantini, C.; Iezzoni, A.F.; Lamboy, W.F.; Boritzki, M.; Struss, D. DNA fingerprinting of tetraploid cherry germplasm using simple sequence repeats. J. Am. Soc. Hortic. Sci. 2001, 126, 205–209. [Google Scholar] [CrossRef]
  39. Pedersen, B. DNA fingerprints of 51 sweet and sour Prunus accessions using simple sequence repeats. J. Hortic. Sci. Biotechnol. 2006, 81, 118–124. [Google Scholar] [CrossRef]
  40. Downey, S.L.; Iezzoni, A.F. Polymorphic DNA markers in black cherry (Prunus serotina) are identified using sequences from sweet cherry, peach, and sour cherry. J. Am. Soc. Hortic. Sci. 2000, 125, 76–80. [Google Scholar] [CrossRef] [Green Version]
  41. Ahmad, N.; Tian, R.; Lu, J.; Li, G.; Sun, J.; Lin, R.; Zhao, C.; Zhou, C.; Chang, H.; Zhao, S. DNA fingerprinting and genetic diversity analysis in Asparagus officinalis L. cultivars using microsatellite molecular markers. Genet. Resour. Crop Evol. 2023, 70, 1163–1177. [Google Scholar] [CrossRef]
  42. Savoia, M.A.; Del Faro, L.; Turco, A.; Fanelli, V.; Venerito, P.; Montemurro, C.; Sabetta, W. Biodiversity Evaluation and Preservation of Italian Stone Fruit Germplasm (Peach and Apricot) in Southern Italy. Plants 2023, 12, 1279. [Google Scholar] [CrossRef] [PubMed]
  43. Gasi, F.; Pojskić, N.; Stroil, B.K.; Frøynes, O.; Fotirić Akšić, M.; Meland, M. Determining Pollinizer Success Rates among Several Apple (Malus domestica L.) Cultivars Using Microsatellite Markers. Agronomy 2023, 13, 1106. [Google Scholar] [CrossRef]
  44. Ahmad, N.; Tian, R.; Li, G.; Zhao, C.; Fan, S.; Sun, J.; Zhao, S.; Wang, X. Establishment of male-specific sequence-tagged site markers in Asparagus officinalis: An efficient tool for sex identification. Plant Breed. 2022, 141, 471–481. [Google Scholar] [CrossRef]
  45. Brózik, S.; Kállay, T. Gyümölcsfajták 2.—Csonthéjas és Héjas Gyümölcsfajták; Mezőgazda Kiadó: Budapest, Hungary, 2001; pp. 26–38. [Google Scholar]
  46. Papp, J. A Gyümölcsök Termesztése 2; Mezőgazda Kiadó: Budapest, Hungary, 2004; pp. 303–306. [Google Scholar]
  47. Meggy-Gyümölcstermesztési Kutatóintézet. Available online: https://fruitresearch.naik.hu/gyki-gyumolcsnemesites-meggy#fajtak (accessed on 10 June 2023).
  48. Tóth, M. Gyümölcsészet; Primom Sz-Sz-B. Megyei Vállalkozásélénkítő Alapítvány, Vállalkozói Központ: Nyíregyháza, Hungary, 1997; pp. 257–272. [Google Scholar]
  49. Yamamoto, T.; Mochida, K.; Imai, T.; Shi, Y.; Ogiwara, I.; Hayashi, T. Microsatellite markers in peach [Prunus persica (L.) Batsch] derived from an enriched genomic and cDNA libraries. Mol. Ecol. Notes 2002, 2, 298–301. [Google Scholar] [CrossRef]
  50. Testolin, R.; Marrazzo, T.; Cipriani, G.; Quarta, R.; Verde, I.; Dettori, M.T.; Pancaldi, M.; Sansavini, S. Microsatellite DNA in peach (Prunus persica L. Batsch) and its use in fingerprinting and testing the genetic origin of cultivars. Genome 2000, 43, 512–520. [Google Scholar] [CrossRef] [PubMed]
  51. Amiryousefi, A.; Hyvönen, J.; Poczai, P. iMEC: Online marker efficiency calculator. Appl. Plant Sci. 2018, 6, e01159. [Google Scholar] [CrossRef] [PubMed]
  52. Liu, B.H. Statistical Genomics: Linkage, Mapping, and QTL Analysis; CRC Press: Boca Raton, FL, USA, 2017. [Google Scholar]
  53. Botstein, D.; White, R.L.; Skolnick, M.; Davis, R.W. Construction of a genetic linkage map in man using restriction fragment length polymorphisms. Am. J. Hum. Genet. 1980, 32, 314. [Google Scholar] [PubMed]
  54. Tessier, C.; David, J.; This, P.; Boursiquot, J.-M.; Charrier, A. Optimization of the choice of molecular markers for varietal identification in Vitis vinifera L. Theor. Appl. Genet. 1999, 98, 171–177. [Google Scholar] [CrossRef]
  55. Baris, E.; Bedő, J.; Edosa, O.S.; Kiss, E.; Veres, A. Preliminary results of SSR based characterization of sour (Prunus cerasus L.) and sweet cherry (Prunus avium L.) genotypes cultivated in Hungary. COLUMELLA–J. Agric. Environ. Sci. 2017, 4, 31–45. [Google Scholar] [CrossRef]
  56. Akpınar, A.; Koçal, H.; Ergül, A.; Kazan, K.; Şelli, M.; Bakır, M.; Aslantaş, Ş.; Kaymak, S.; Sarıbaş, R. SSR-based molecular analysis of economically important Turkish apricot cultivars. Genet. Mol. Res. 2010, 9, 324–332. [Google Scholar] [CrossRef] [PubMed]
  57. Momeni, H.; Bouzari, N.; Zeinolabedini, M.; Jahromi, M.G. Genetic diversity in a core collection of Iranian sour cherry. Braz. J. Biol. 2023, 84, e273386. [Google Scholar] [CrossRef]
  58. Clausen, S.K.; Andersen, S.B.; Henriksen, K.; Toldam-Andersen, T.; Grout, B.W.W. Assessment of genetic diversity within sour cherry clones. Sci. Hortic. 2013, 164, 556–562. [Google Scholar] [CrossRef]
  59. Dirlewanger, E.; Quero-Garcia, J.; Le Dantec, L.; Lambert, P.; Ruiz, D.; Dondini, L.; Illa, E.; Quilot-Turion, B.; Audergon, J.M.; Tartarini, S.; et al. Comparison of the genetic determinism of two key phenological traits, flowering and maturity dates, in three Prunus species: Peach, apricot and sweet cherry. Heredity 2012, 109, 280–292. [Google Scholar] [CrossRef] [Green Version]
  60. Ohta, S.; Katsuki, T.; Tanaka, T.; Hayashi, T.; Sato, Y.-I.; Yamamoto, T. Genetic variation in flowering cherries (Prunus subgenus Cerasus) characterized by SSR markers. Breed. Sci. 2005, 55, 415–424. [Google Scholar] [CrossRef]
  61. Xuan, H.; Wang, R.; Büchele, M.; Möller, O.; Hartmann, W. Microsatellite markers (SSR) as a tool to assist in identification of sweet (Prunus avium) and sour cherry (Prunus cerasus). In Proceedings of the I International Symposium on Biotechnology of Fruit Species: BIOTECHFRUIT2008 839, Dresden, Germany, 1–5 September 2008; pp. 507–514. [Google Scholar]
  62. Wünsch, A. Cross-transferable polymorphic SSR loci in Prunus species. Sci. Hortic. 2009, 120, 348–352. [Google Scholar] [CrossRef]
  63. Antonius, K.; Aaltonen, M.; Uosukainen, M.; Hurme, T. Genotypic and phenotypic diversity in Finnish cultivated sour cherry (Prunus cerasus L.). Genet. Resour. Crop Evol. 2011, 59, 375–388. [Google Scholar] [CrossRef]
  64. Khadivi-Khub, A.; Zamani, Z.; Fattahi, R.; Wünsch, A. Genetic variation in wild Prunus, L. subgen. Cerasus germplasm from Iran characterized by nuclear and chloroplast SSR markers. Trees 2013, 28, 471–485. [Google Scholar] [CrossRef]
  65. Khadivi-Khub, A. Regression association analysis of fruit traits with molecular markers in cherries. Plant Syst. Evol. 2014, 300, 1163–1173. [Google Scholar] [CrossRef]
  66. Lācis, G.; Rashal, I.; Trajkovski, V. Implementation of a limited set of SSR markers for screening of genetic variability in Latvian and Swedish sour cherry (L.) genetic resources collections. Proc. Latv. Acad. Sci. 2011, 65, 21–28. [Google Scholar] [CrossRef]
  67. Najafzadeh, R.; Arzani, K.; Bouzari, N.; Saei, A. Genetic variation and identification of promising sour cherries inferred from microsatellite markers. Russ. J. Genet. 2016, 52, 64–73. [Google Scholar] [CrossRef]
  68. Turkoglu, Z.; Bilgener, S.; Ercisli, S.; Yildirim, N. Simple sequence repeat (SSR) analysis for assessment of genetic variability in wild cherry germplasm. J. Appl. Bot. Food Qual. 2013, 85, 229. [Google Scholar]
  69. Chase, A. Analysing the Sweet- and Sour-Cherry Cultivars by use of SSRs; Kompetenzzentrum Obstbau-Bodensee (KOB) KOB: Budapest, Hungary, 2014. [Google Scholar]
  70. Da Silva Linge, C.; Bassi, D.; Bianco, L.; Pacheco, I.; Pirona, R.; Rossini, L. Genetic dissection of fruit weight and size in an F2 peach (Prunus persica (L.) Batsch) progeny. Mol. Breed. 2015, 35, 71. [Google Scholar] [CrossRef]
  71. Cao, K.; Wang, L.; Zhu, G.; Fang, W.; Chen, C.; Luo, J. Genetic diversity, linkage disequilibrium, and association mapping analyses of peach (Prunus persica) landraces in China. Tree Genet. Genomes 2012, 8, 975–990. [Google Scholar] [CrossRef]
  72. Hrotkó, K. Cseresznye és Meggy; Mezőgazda: Budapest, Hungary, 2003. [Google Scholar]
Figure 1. Hierarchical cluster analysis of nineteen Prunus cerasus L. genotypes cultivated in Hungary using 12 SSR markers illustrated on dendrogram.
Horticulturae 09 00892 g001
Figure 2. Heatmaps of microsatellite markers that displayed significant alleles based on regression analysis according to flowering time, ripening time, and fruit weight. The statistically significant values were marked with green asterisks. The group numbers assigned to flowering time indicate different categories: 1 represents early flowering, 2 represents early to mid-flowering, 3 represents mid-flowering, and 4 represents late flowering. Similarly, for ripening time, the group numbers are as follows: 1 corresponds to fruits ripening before June 5th, 2 corresponds to fruits ripening between June 5th and 15th, 3 corresponds to fruits ripening between June 15th and 25th, and 4 corresponds to fruits ripening after June 25th. Regarding fruit weight, the group numbers represent the following: 1 indicates fruits weighing less than or equal to 3–4 g, 2 indicates fruits weighing between 4 and 5 g, 3 indicates fruits weighing between 5 and 6 g, and 4 indicates fruits weighing 6 g or more.
Horticulturae 09 00892 g002aHorticulturae 09 00892 g002b
Table 1. Sour cherry genotypes from which leaves were collected and analyzed. The second column of the table shows their origin, where they were discovered or how they were developed, and the third lists the breeder who cultivated them or found them (Sources: [12,45,46,47,48]).
GenotypeOriginBreeder (s)
Cigány 59Selected from a Carpathian basin populationSándor Brózik
CsengődiSelected from a range of Bosnian sour cherry varieties grown in the Csengőd-Akasztó areaJános Apostol
Debreceni bőtermőSelected landrace from a suburb in DebrecenAttila Ménesi and Tibor Szabó
Érdi bőtermőPándy x Nagy angolPál Maliga and János Apostol
Érdi jubileumPándy x EugeniaPál Maliga and János Apostol
Érdi nagygyümölcsűHankovszky’s early cherry type seedling with open pollinationPál Maliga
FavoritPándy x MontreuilliPál Maliga
Hibrid 3/48Érdi bőtermő x Meteor koraiJános Apostol
Kántorjánosi 3Landrace selection around MátészalkaTibor Szabó
Korai pipacsPándy x CsászárPál Maliga and János Apostol
Kőrösi koraiLandrace selection around Debrecen and NyírségSándor Kovács
Maliga emlékePándy x EugeniaPál Maliga and János Apostol
Meteor koraiPándy x Nagy angolPál Maliga and János Apostol
OblacsinszkaSelected from a range of Bosnian sour cherry varieties
Pándy 48Clone of a selected Carpathian basin populationSándor Brózik
Pándy 279Clone of a selected Carpathian basin populationSándor Brózik
PipacsA selected cultivar from a range of Pipacs sour cherry varieties from Kecel croplandSándor Kovács
PiramisM221(Pándy x Olivet) x Meteor koraiJános Apostol
Újfehértói fürtösLandrace selection around ÚjfehértóFerenc Pethő and Tibor Szabó
Table 2. Summarized characteristics of Prunus cerasus L. genotypes that are used in this research. For each column, the background color represents the groups that share similar characteristics (orange indicates group 1, purple indicates group 2, green indicates group 3, and blue indicates group 4 for each trait). Each trait has its own groups; each group of traits are analyzed separately (Sources: [12,45,46,47,48]).
GenotypeBlooming TimeBeginning of Ripening TimeFruit Size
Cigány 59Mid–late~June 20–22.3–4 g, 14–20 mm
CsengődiEarly–mid~June 8–10.~5 g, 21–22 mm
Debreceni bőtermőLateEnd of June–beginning of July5–6 g, 22–23 mm
Érdi bőtermőEarly~ June 16–18.5–6 g, 21–23 mm
Érdi jubileumMid–late~ June 12.4–5 g, 21–23 mm
Érdi nagy-gyümölcsűMid~June 12–15.~6 g, 23–25 mm
FavoritEarly–mid~June 10–12.~6 g, ~24 mm
Hibrid 3/48Mid~May 22–25.~3 g, 19–21 mm
Kántorjánosi 3LateEnd of June–beginning of July5–6 g, 22–23 mm
Korai pipacsMid~June 12–15.~5 g, 21–22 mm
Kőrösi korai ~Middle of June~4, 3 g
Maliga emlékeMid~June 22.6–8 g, 23–25 mm
Meteor koraiEarly–mid~June 3–5.4, 5–5, 5 g, 21–22 mm
Oblacsinszka ~June 10–15.2, 5–3 g, 16–18 mm
Pándy 48Early~June 22.6–8 g, 21–24 mm
Pándy 279Late~June 25–30.6–8 g, 21–24 mm
PipacsLate~June 22–25.4–5 g, ≥20 mm
PiramisEarlyBeginning of June8–9 g, 24–26 mm
Újfehértói fürtösLateBeginning of July5–6 g, 22–24 mm
Table 3. List of SSR locus names applied in this sour cherry research, the sequences and the origin of microsatellites, where they were first developed, and their references (Sources: [2,34,35,37,48,49,50]).
SSR LocusForward SequenceReverse SequenceOriginReferences
BPPCT 002TCGACAGCTTGATCTTGACCCAATGCCTACGGAGATAAAAGACP. persica[2]
BPPCT 007TCATTGCTCGTCATCAGCCAGATTTCTGAAGTTAGCGGTA
BPPCT 015ATGGAAGGGAAGAGAAATCGGTCATCTCATCAAACTTTTCCG
BPPCT 030AATTGTACTTGCCAATGCTATGACTGCCTTCTGCTCACACC
BPPCT 041TGAAAGTGAAACAATGGAAGCCAGCCGAACCAAGGAGAC
CPPCT 022CAATTAGCTAGAGAGAATTATTGGACAAGAAGCAAGTAGTTTGP. persica[35]
Ma39aAGAAAGGCACTTTATCTAGGTTGTTTTGGGGATGGTAGTP. persica[49]
PceGA25GCAATTCGAGCTGTATTTCAGATGCAGTTGGCGGCTATCATGTCTTACP. cerasus[38]
UCDCH 17TGGACTTCACTCATTTCAGAGAACTGCAGAGAATTTCCACAACCAP. avium[37]
UDP96 001AGTTTGATTTTCTGATGCATCCTGCCATAAGGACCGGTATGTP. persica[34]
UDP96 005GTAACGCTCGCTACCACAAACCTGCATATCACCACCCAG
UDP98 410AATTTACCTATCAGCCTCAAATTTATGCAGTTTACAGACCGP. persica[50]
Table 4. Repeat motifs of the applied twelve microsatellite marker loci, and a summary of the results of the screened in sour cherry cultivars regarding number of alleles and allele size range.
LocusRepeat MotifNumber of AllelesAllele Size Range (bp)
BPPCT002 a(AG)254167–183
BPPCT007(AG)22(CG)2(AG)410110–234
BPPCT015(AG)13578–190
BPPCT030 a(AG)253141–163
BPPCT041 a(AG)212200–228
CPPCT022(CT)28CAA(CT)205223–261
Ma39a(GA)234161–181
PceGA025n.d.4160–184
UCDCH17 a(CT)117176–200
UDP 96 001 a(CA)173101–125
UDP 96 005 a(AC)16TG(CT)2CA(CT)115102–134
UDP 98 410(AG)234125–141
a Previously published results, [55]. n.d.: no data.
Table 5. Report of characterization based on heterozygosity index, polymorphic information content, effective multiplex ratio, marker index, and discriminating power of the twelve microsatellite primer pairs used in this study to differentiate 19 Prunus cerasus L. genotypes.
No.LocusHeterozygosity Index aPolymorphic Information Content aEffective Multiplex RatioMarker IndexDiscriminating Power
1BPPCT0020.480.382.360.0130.65
2BPPCT0070.470.396.230.0130.61
3BPPCT0150.480.382.960.0130.65
4BPPCT0300.420.412.090.0130.52
5BPPCT0410.400.420.550.0050.93
6CPPCT0220.350.433.860.0120.41
7Ma39a0.500.371.960.0110.76
8PceGA0250.490.382.320.0130.67
9UCDCH170.500.373.410.0110.76
10UDP 96 0010.490.381.730.0130.67
11UDP 96 0050.500.372.410.0110.77
12UDP 98 4100.440.401.320.0070.89
a The highest value could be 0.5 according to Amiryousefi et al. [51].
Table 6. Genetic relatedness of sour cherry genotypes based on Jaccard index using twelve Prunus specific microsatellites. (The darker the color, the more closely the genotypes are associated with each other).
Cigány 59 CsengődiDebreceni Bőtermő Érdi Bőtermő Érdi Jubileum Érdi NagygyümölcsűFavoritHibrid 3/48 Kántorjánosi 3Korai PipacsKőrösi KoraiMaliga Emléke Meteor Korai OblecsinszkaPándy 279Pándy 48PipacsPiramis Újfehértói Fürtös
Cigány 59 1
Csengődi0.611
Debreceni bőtermő 0.510.501
Érdi bőtermő 0.420.440.571
Érdi jubileum 0.500.610.630.611
Érdi nagygyümölcsű0.470.590.560.540.651
Favorit0.370.430.560.760.550.571
Hibrid 3/48 0.510.540.680.750.680.760.741
Kántorjánosi 30.530.490.970.600.650.550.550.701
Korai pipacs0.450.510.650.680.740.730.620.800.681
Kőrösi korai0.610.590.650.510.610.500.580.580.630.551
Maliga emléke 0.430.450.590.740.580.600.740.770.610.650.531
Meteor korai 0.490.510.690.590.650.540.620.660.680.630.590.611
Oblecsinszka0.790.550.530.480.530.460.400.540.560.480.630.420.481
Pándy 2790.540.530.940.560.620.550.550.670.920.640.680.580.730.521
Pándy 480.540.530.940.560.620.550.550.670.920.640.680.580.730.5211
Pipacs0.440.460.520.500.480.530.490.560.510.540.430.510.430.460.550.551
Piramis 0.350.430.600.540.550.490.610.640.620.580.580.590.580.430.590.590.491
Újfehértói fürtös 0.550.500.910.540.590.530.530.640.890.620.700.550.700.540.970.970.560.561
Table 7. Regression analysis of SSR marker alleles of 19 sour cherry genotypes associated with fruit traits.
TraitSSR Marker (Alleles)rR2Standardized Beta Coefficientst Valuep Value
Flowering timePceGA0251720.5880.346−0.588−2.8160.013
Ripening timeBPPCT0021790.6210.3860.7636.525<0.001
BPPCT0071220.7580.575−0.753−5.965<0.001
PceGA0251720.8920.795−0.430−3.6340.003
UCDCH171820.9230.8520.2852.3190.036
Fruit weightUDP984101410.5670.321−0.567−2.8380.011
Disclaimer/Publisher’s Note: The statements, opinions and data contained in all publications are solely those of the individual author(s) and contributor(s) and not of MDPI and/or the editor(s). MDPI and/or the editor(s) disclaim responsibility for any injury to people or property resulting from any ideas, methods, instructions or products referred to in the content.

