


Assessment of Genetic Diversity in the White-Colored Variants of Spray-Type Chrysanthemum Cultivars Using SSR Markers

Abstract
1. Introduction
2. Materials and Methods
2.1. Plant Material
2.2. Genomic DNA Extraction
2.3. Analysis of SSR Markers via ABI Genetic Analyzer
2.4. Data Analysis
3. Results
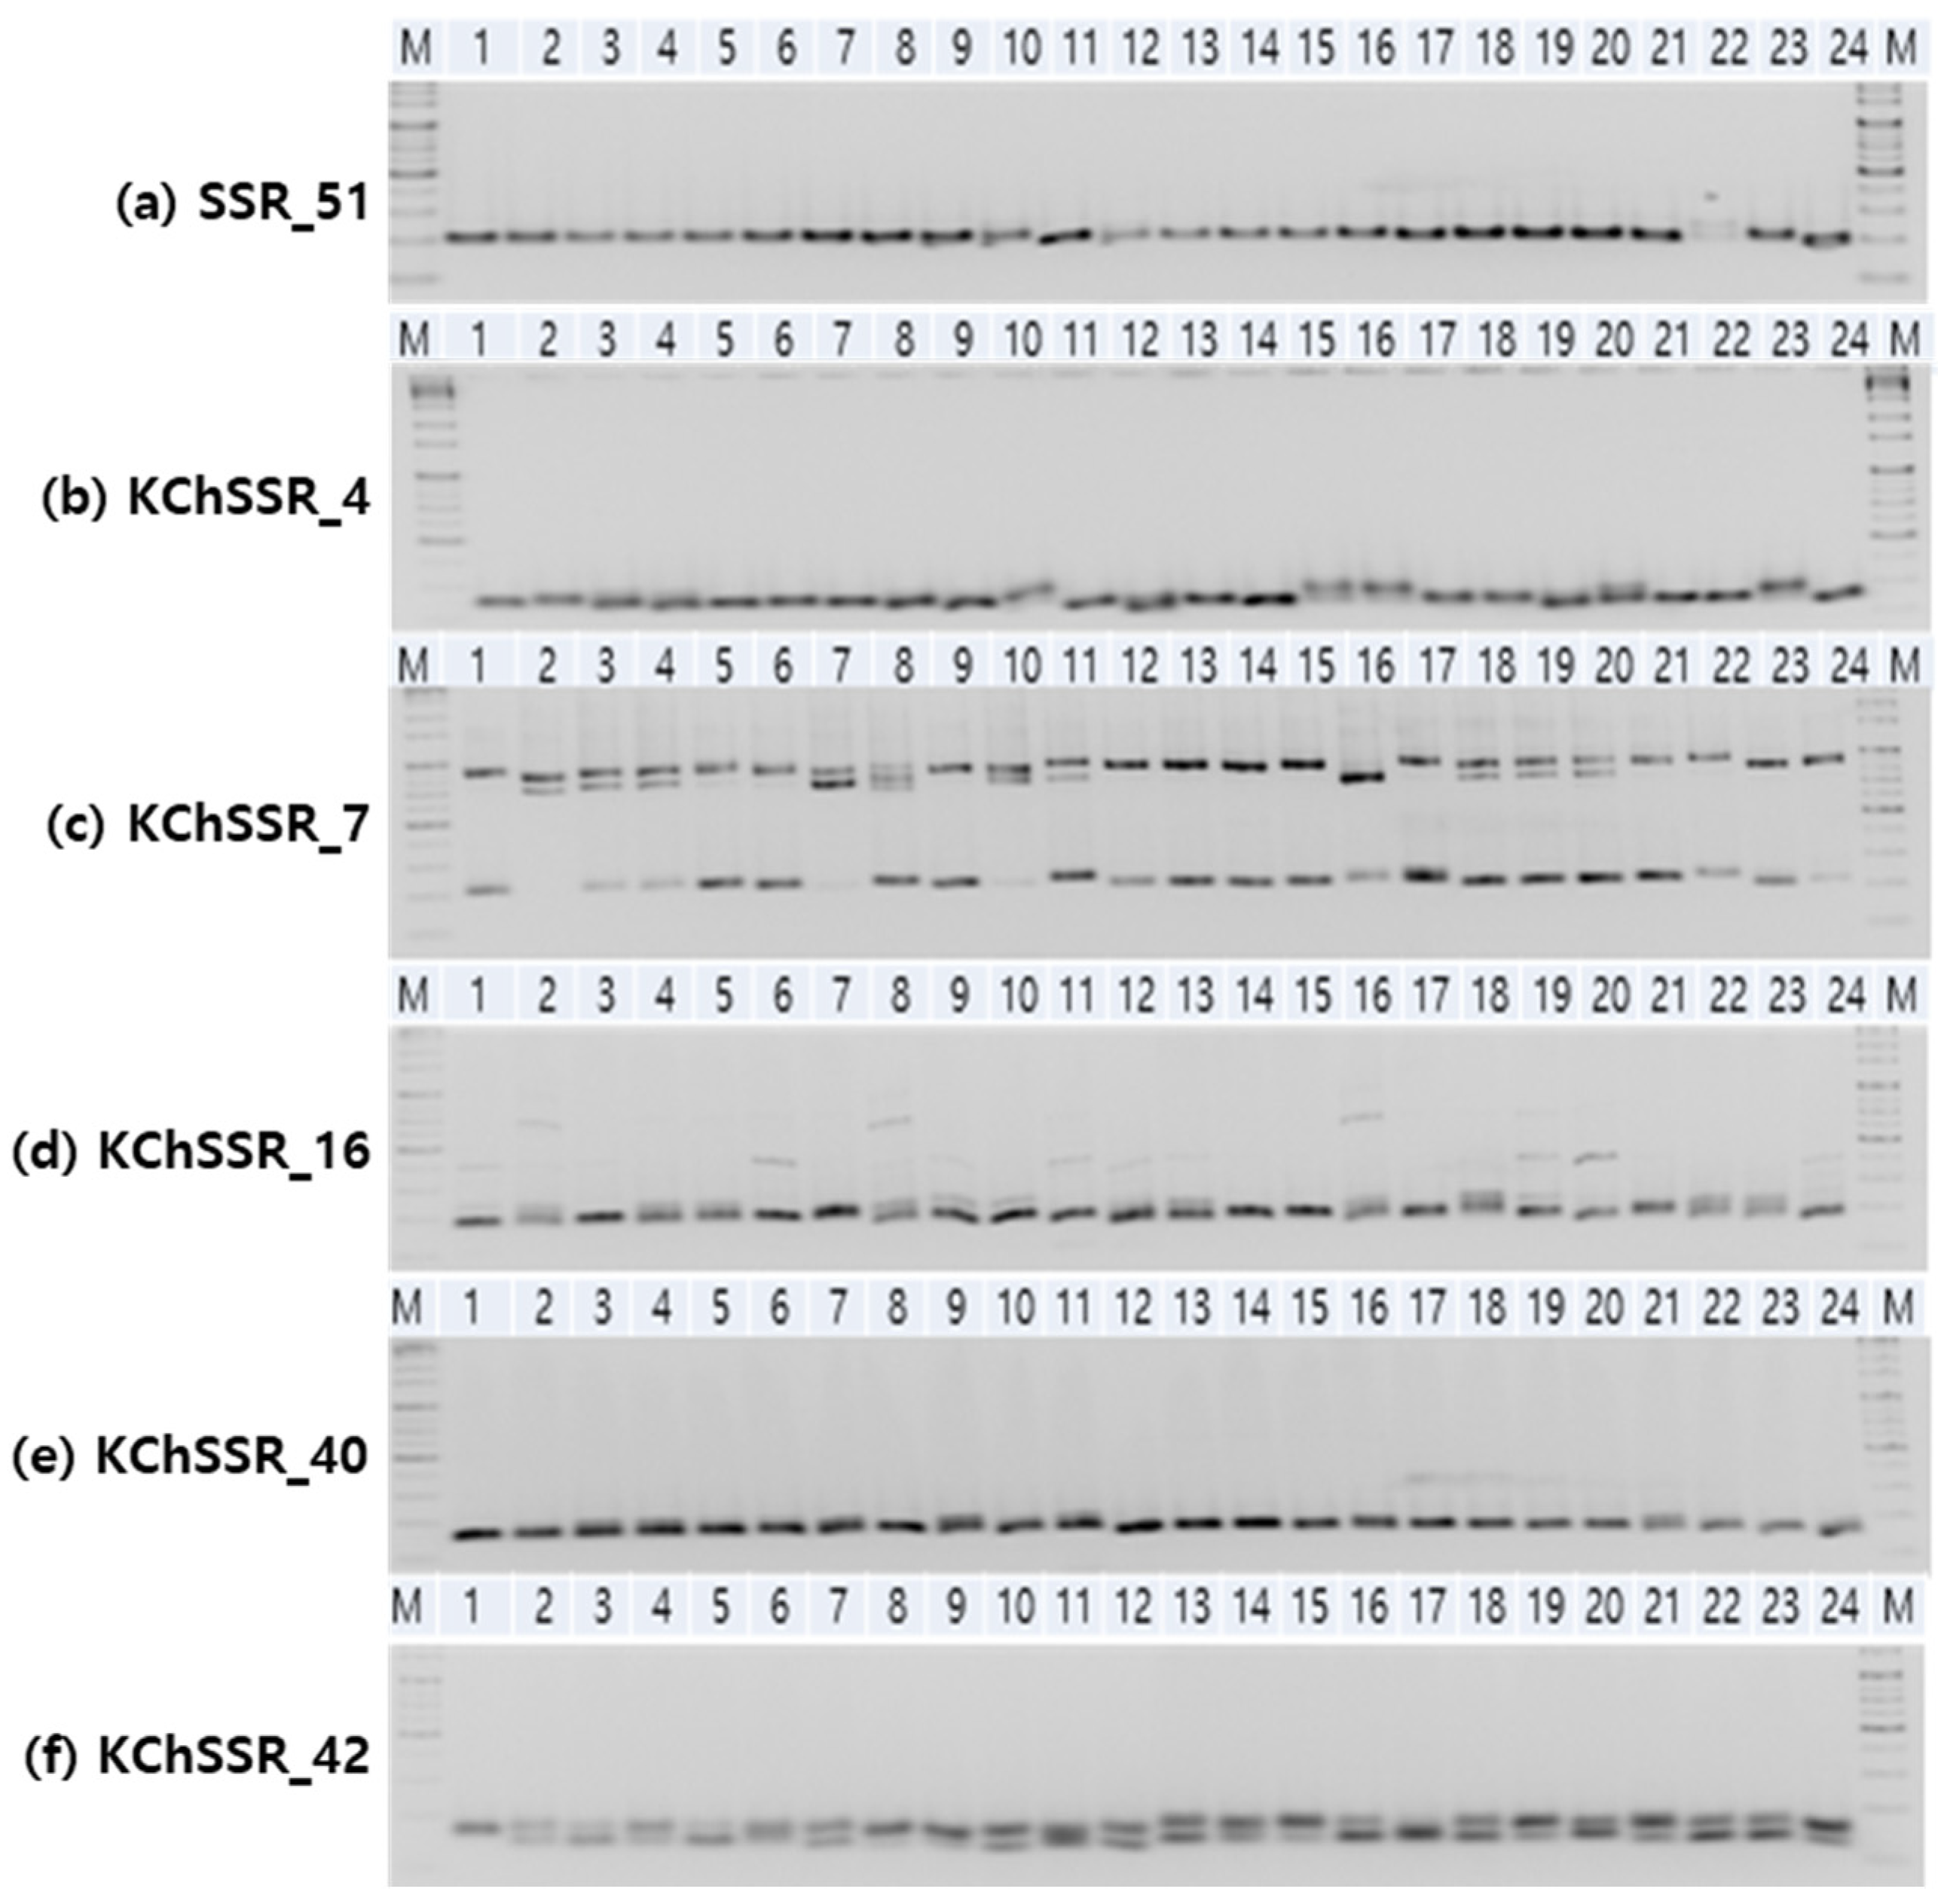
3.1. Genetic Variation of SSR Markers
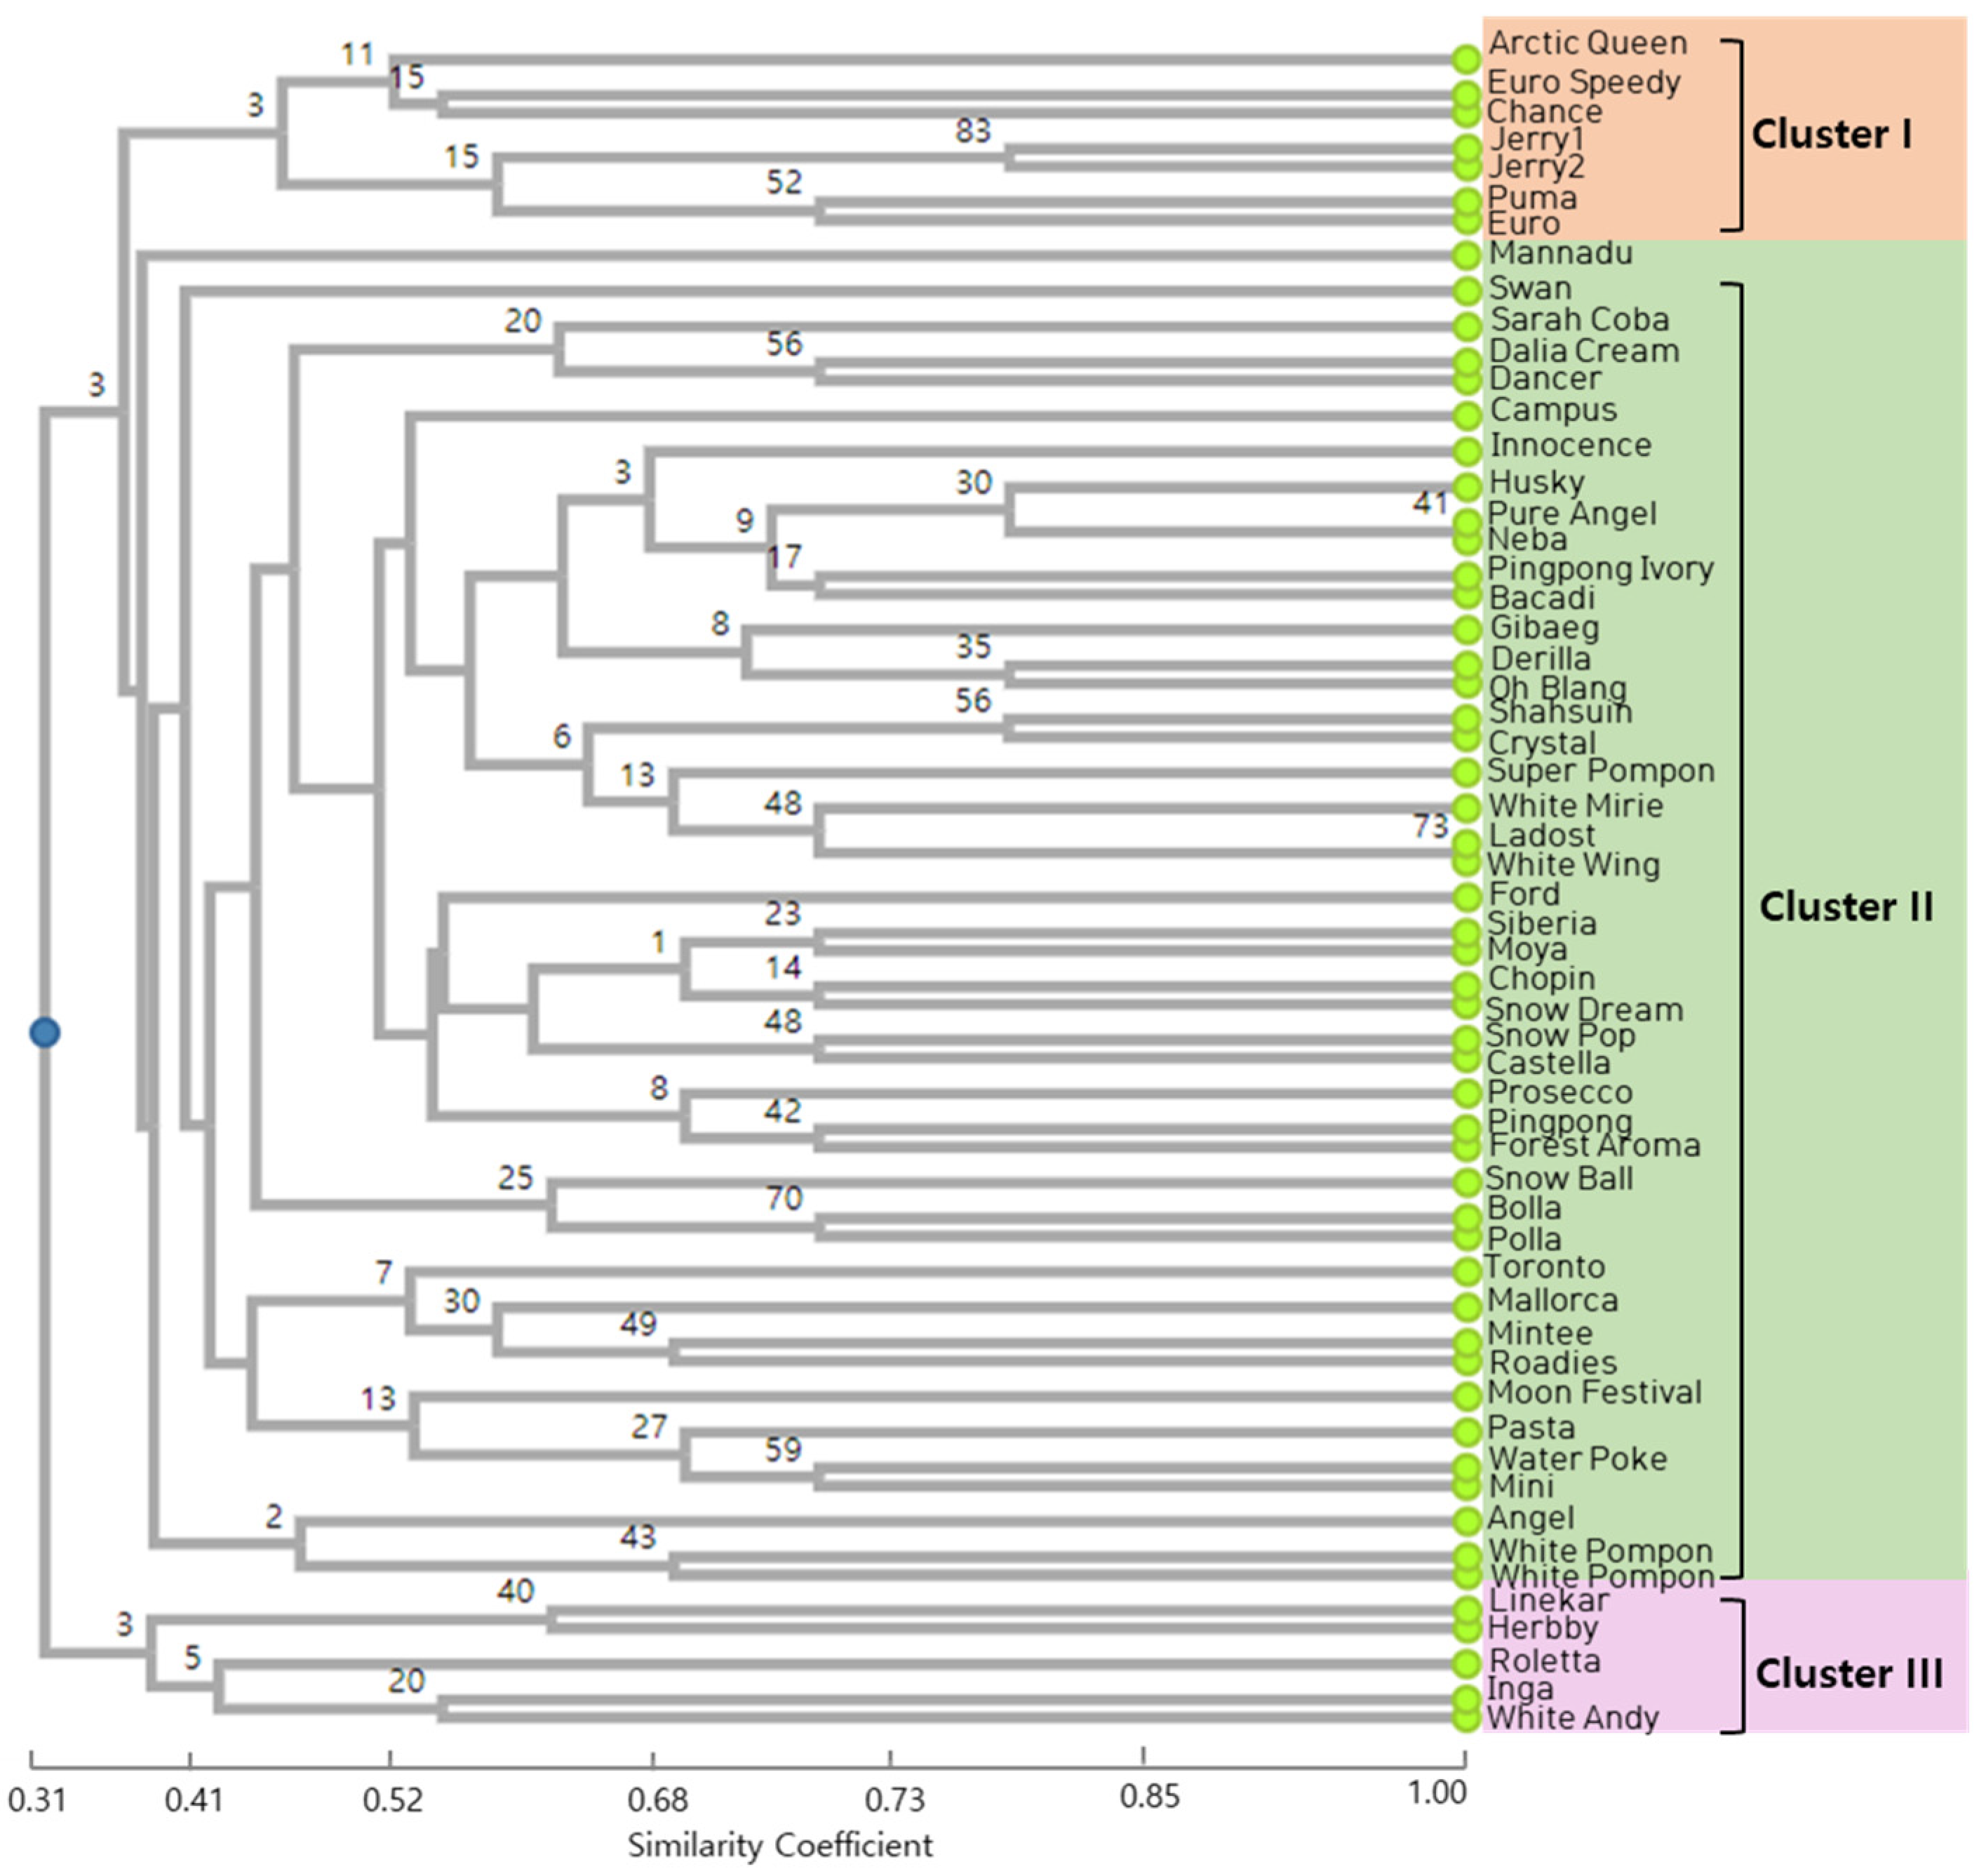
3.2. Analysis of Genetic Relationships between the Cultivars
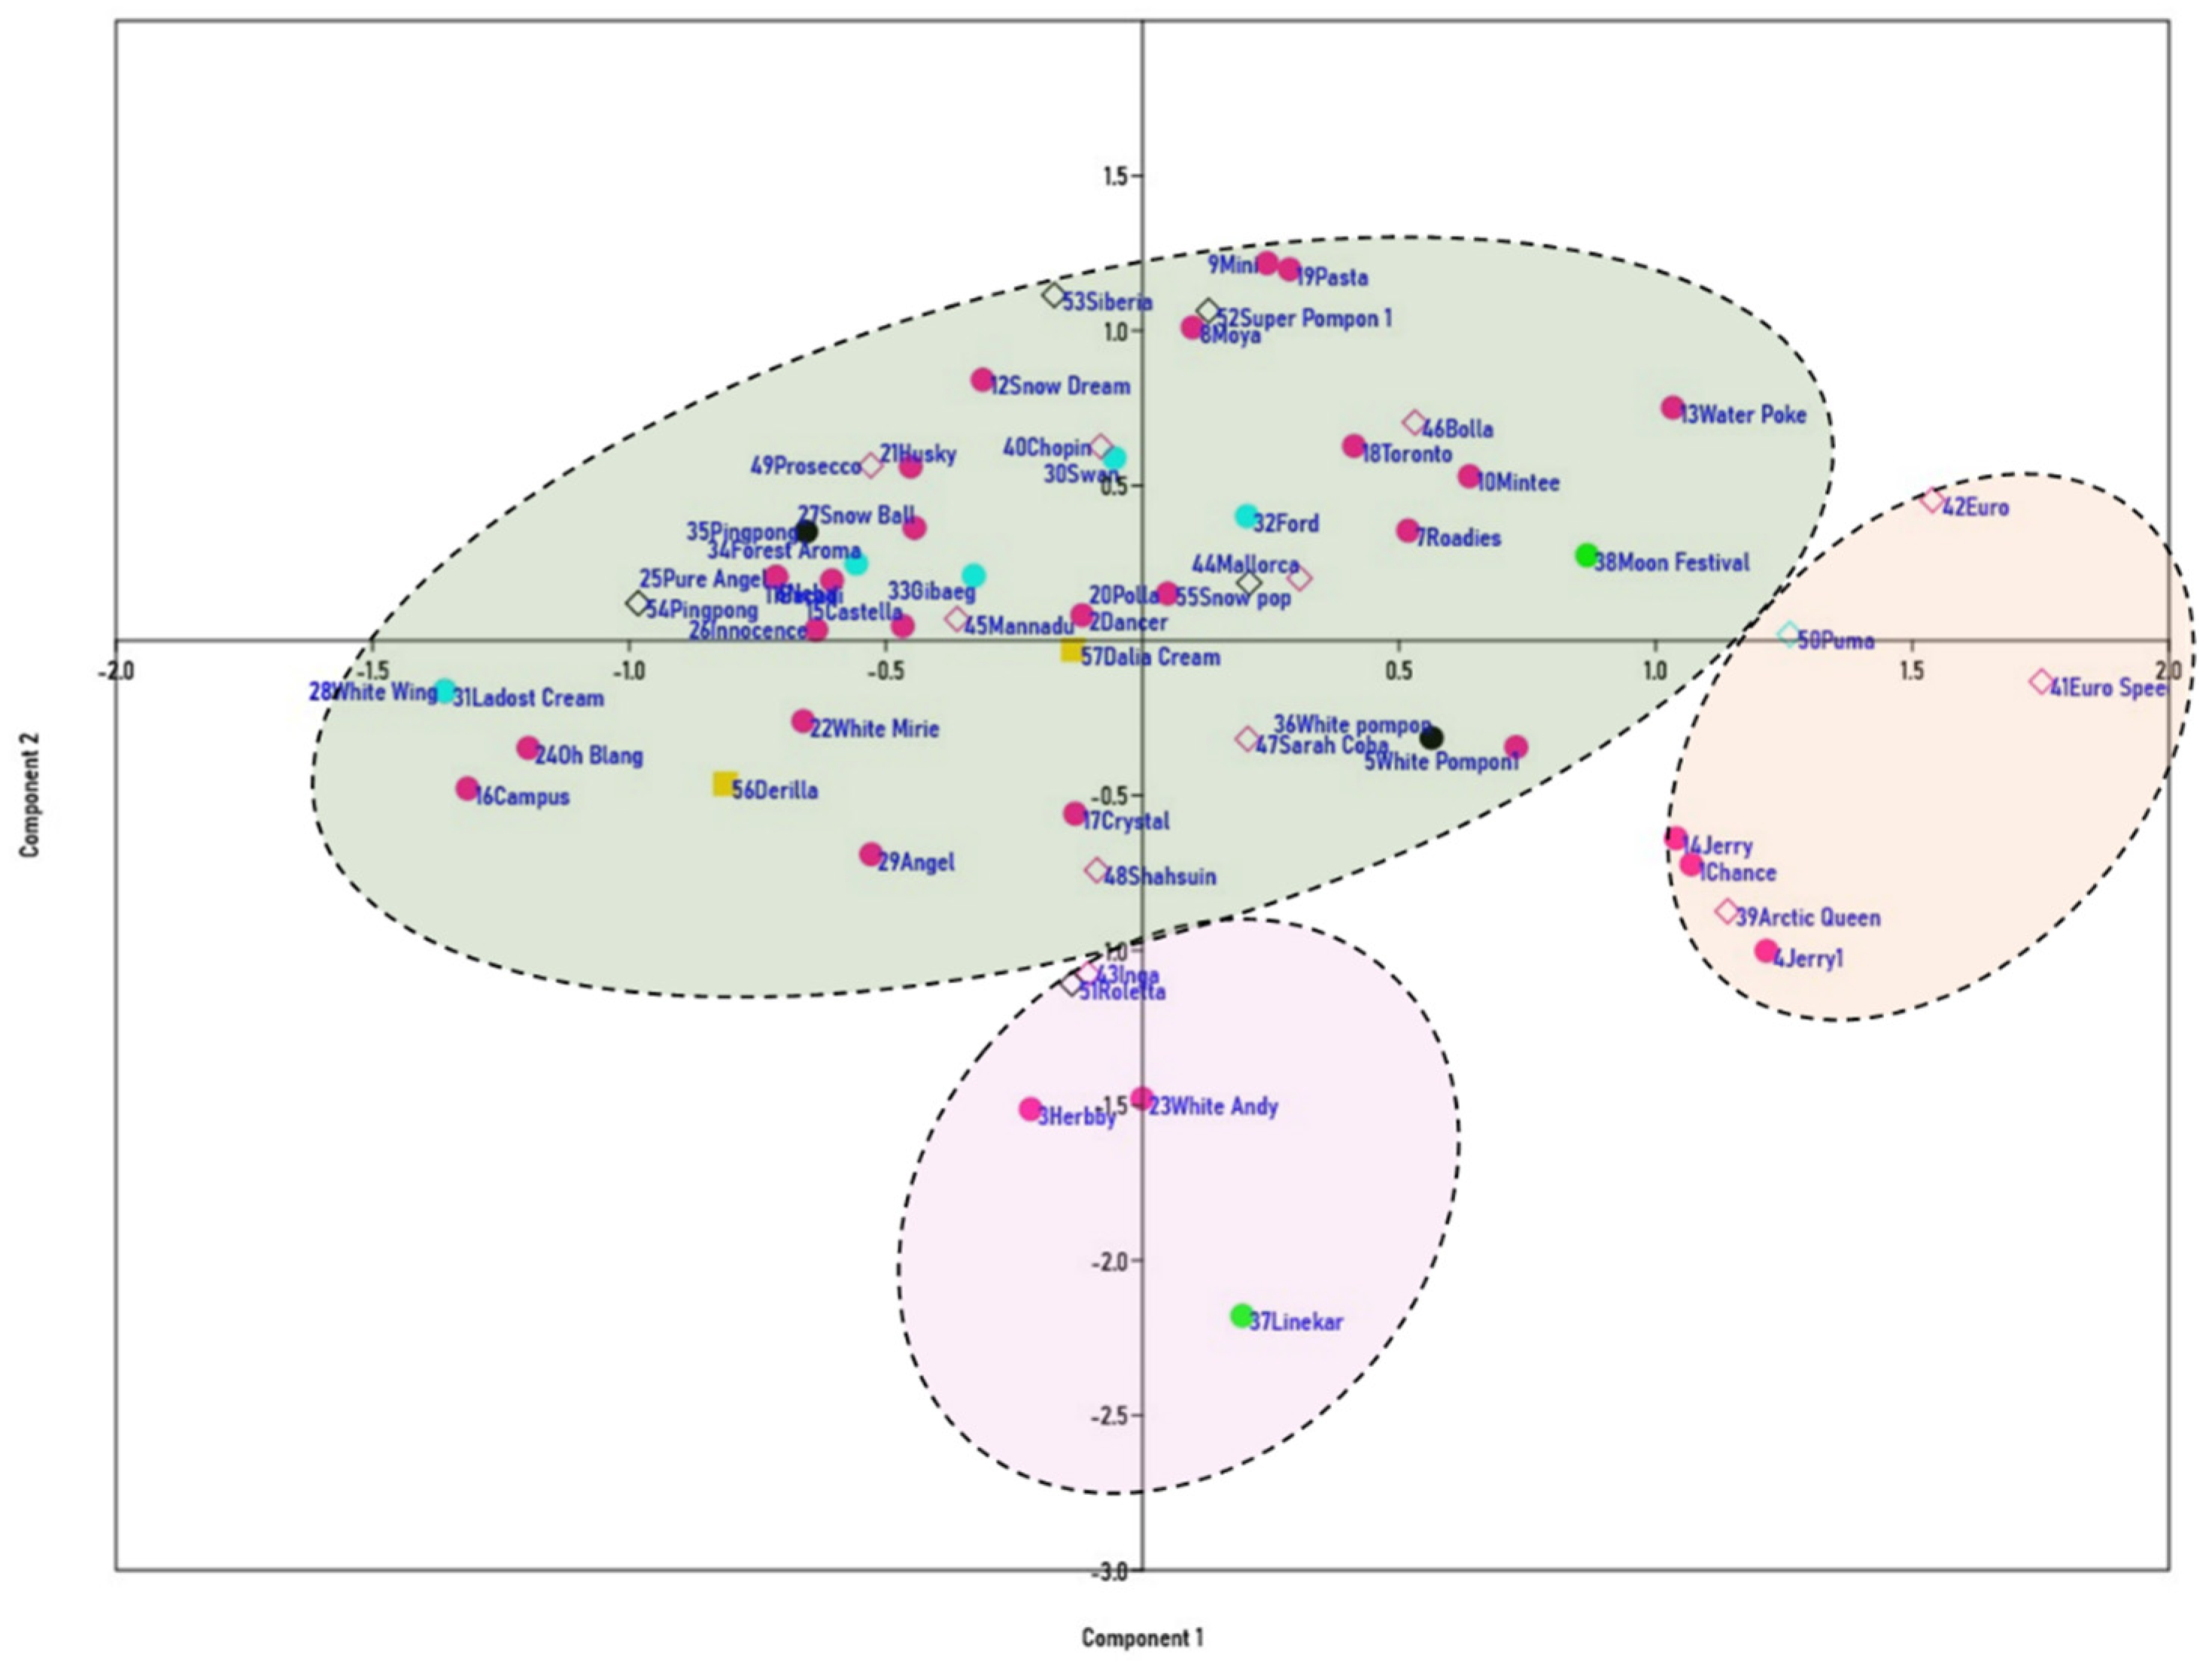
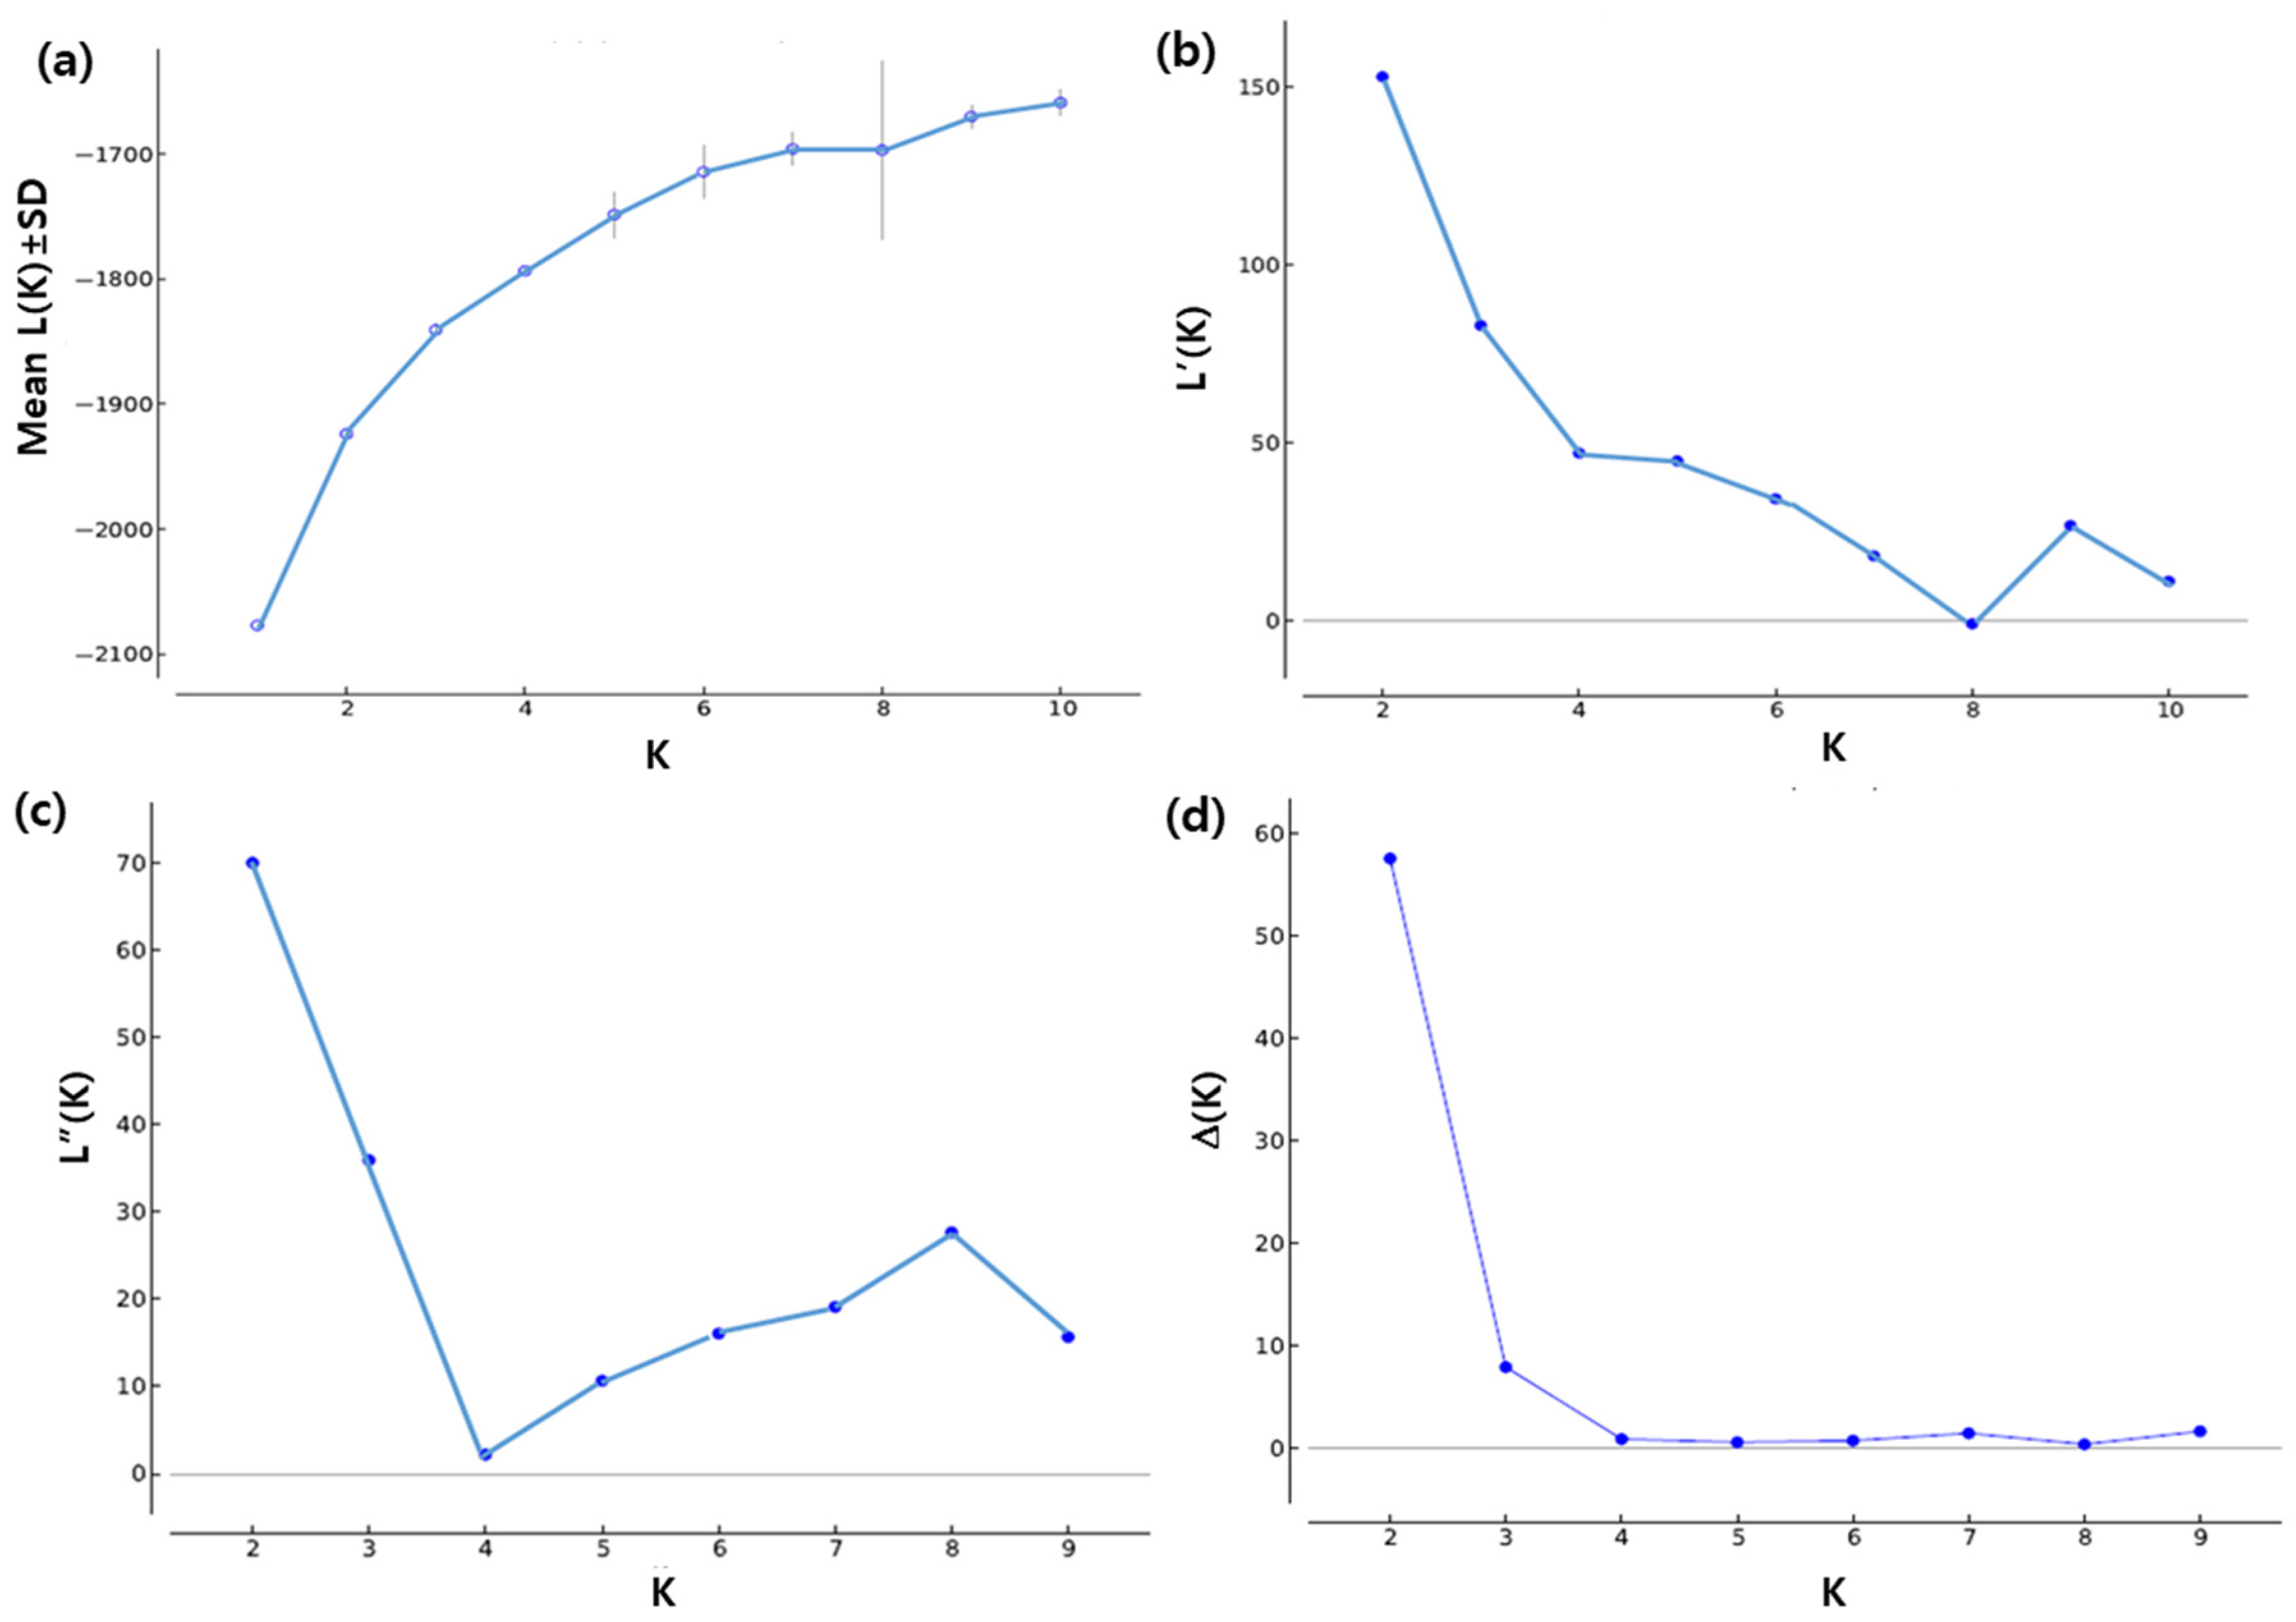
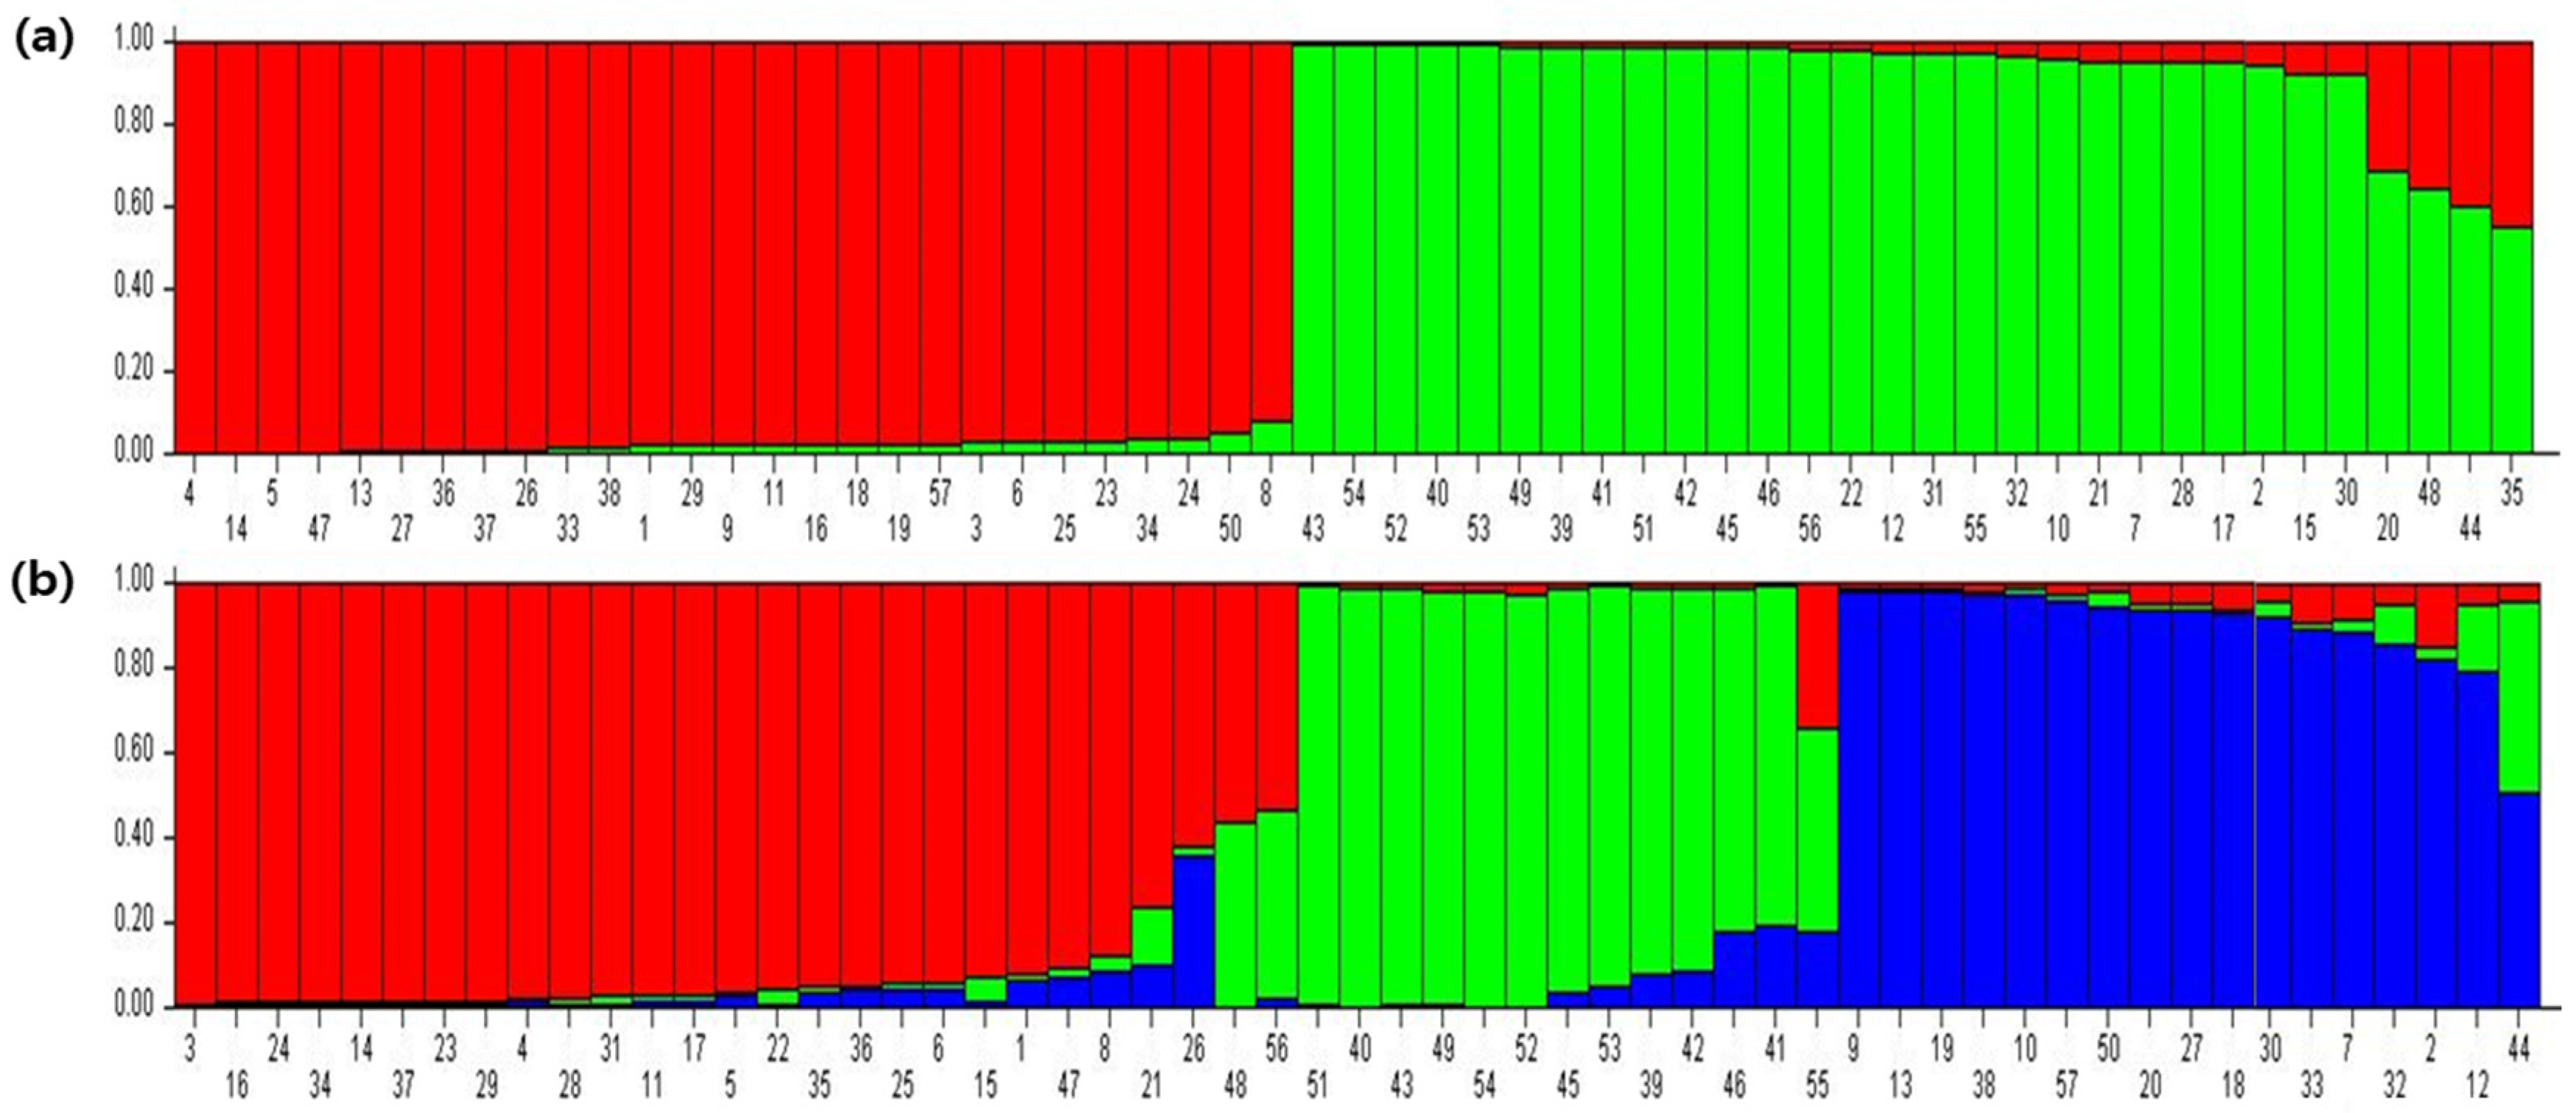
3.3. Population Structure Analysis
4. Discussion
5. Conclusions
Author Contributions
Funding
Data Availability Statement
Conflicts of Interest
References
- Teixeira da Silva, J.A.; Shinoyama, H.; Aida, R.; Matsushita, Y.; Raj, S.K.; Chen, F. Chrysanthemum biotechnology: Quo vadis. Crit. Rev. Plant Sci. 2013, 32, 21–52. [Google Scholar] [CrossRef]
- Royal Flora Holland in Facts and Figures. Annual Report. 2020. Available online: https://www.royalfloraholland.com/en (accessed on 4 July 2023).
- Anderson, N.O. Chrysanthemum. In Flower Breeding and Genetics; Springer: Dordrecht, The Netherlands, 2007; pp. 389–437. [Google Scholar]
- Liu, Y.H.; Mou, X.; Zhou, D.Y.; Zhou, D.Y.; Shou, C.M. Extraction of flavonoids from Chrysanthemum morifolium and antitumor activity in vitro. Exp. Ther. Med. 2018, 15, 1203–1210. [Google Scholar] [CrossRef] [PubMed]
- Bhattacharya, A.; da Silva, J.A.T. Molecular systematics in Chrysanthemum × grandiflorum (Ramat) Kitamura. Sci. Hortic. 2006, 109, 379–384. [Google Scholar] [CrossRef]
- Lin, L.; Harnly, J.M. Identification of the phenolic components of chrysanthemum flower (Chrysanthemum morifolium Ramat). Food Chem. 2010, 120, 319–326. [Google Scholar] [CrossRef]
- Li, Y.; Yang, P.; Luo, Y.; Gao, B.; Sun, J.; Lu, W.; Liu, J.; Chen, P.; Zhang, Y.; Yu, L.L. Chemical compositions of chrysanthemum teas and their anti-inflammatory and antioxidant properties. Food Chem. 2019, 286, 8–16. [Google Scholar] [CrossRef]
- Wu, J.Y.; Chen, Y.J.; Fu, X.Q.; Li, J.K.; Chou, J.Y.; Yin, C.L.; Bai, J.X.; Wu, Y.; Wang, X.Q.; Li, A.S.; et al. Chrysoeriol suppresses hyperproliferation of rheumatoid arthritis fibroblast-like synoviocytes and inhibits JAK2/STAT3 signaling. BMC Complement. Med. Ther. 2022, 22, 73. [Google Scholar] [CrossRef]
- Chen, S.; Liu, J.; Dong, G.; Zhang, X.; Liu, Y.; Sun, W. Flavonoids and caffeoylquinic acids in Chrysanthemum morifolium Ramat flowers: A potentially rich source of bioactive compounds. Food Chem. 2020, 344, 128733. [Google Scholar] [CrossRef]
- Liang, F.; Hu, C.; He, Z.; Pan, Y. An arabinogalactan from flowers of Chrysanthemum morifolium: Structural and bioactivity studies. Carbohydr. Res. 2014, 387, 37–41. [Google Scholar] [CrossRef]
- Kuang, C.; Lv, D.; Shen, G.; Li, S.; Luo, Q.; Zhang, Z. Chrysanthemum morifolium Chemical composition and antimicrobial activities of volatile oil extracted from Ramat. J. Food Sci. Technol. 2018, 55, 2786–2794. [Google Scholar] [CrossRef]
- Mottaghipisheh, J.; Taghrir, H.; Boveiri Dehsheikh, A.; Zomorodian, K.; Irajie, C.; Mahmoodi Sourestani, M.; Iraji, A. Linarin, a Glycosylated Flavonoid, with Potential Therapeutic Attributes: A Comprehensive Review. Pharmaceuticals 2021, 14, 1104. [Google Scholar] [CrossRef]
- Qi, W.; Chen, Y.; Sun, S.; Xu, X.; Zhan, J.; Yan, Z.; Shang, P.; Pan, X.; Liu, H. Inhibiting TLR4 signaling by linarin for preventing inflammatory response in osteoarthritis. Aging 2021, 13, 5369–5382. [Google Scholar] [CrossRef] [PubMed]
- El-Twab, M.H.A.; Kondo, K. Visualization of genomic relationships in allotetraploid hybrids between Chrysanthemum lavandulifolium × C. chanetii by fluorescence in situ hybridization. Chromosome Bot. 2008, 3, 19–25. [Google Scholar] [CrossRef]
- Dowrick, G.J. The chromosomes of Chrysanthemum, II: Garden varieties. Heredity 1953, 7, 59–72. [Google Scholar] [CrossRef]
- Roxas, N.J.; Tashiro, Y.; Miyazaki, S.; Isshiki, S.; Takeshita, A. Meiosis and pollen fertility in Higo chrysanthemum (Dendranthema × grnadiflorum (Ramat.) Kitam. J. Jpn. Soc. Hortic. Sci. 1995, 64, 161–168. [Google Scholar] [CrossRef]
- Shudo, A.; Goeku, S.; Tarora, K.; Gima, N.; Urasaki, N.; Tokunaga, T.; Ureshino, K.; Miyagi, E.; Sekizuka, S.; Adaniya, S. Identification of chrysanthemum (Chrysanthemum morifolium) cultivars using flower pigment related genes. Trop. Agr. Dev. 2011, 55, 166–169. [Google Scholar]
- Shiroto, C.S.; Peres, N.V.; Sabbag, O.J. Economic viability of potted chrysanthemums production in Atibaia, Sao Paulo state. Ornam. Hortic. 2016, 22, 130–137. [Google Scholar] [CrossRef]
- Olejnik, A.; Parkitna, K.; Bartosz, K.; Florczak, S.; Matkowski, J.; Nowosad, K. Assessment of the genetic diversity of Chrysanthemum cultivars using SSR markers. Agronomy 2021, 11, 2318. [Google Scholar] [CrossRef]
- Su, J.; Jiang, J.; Zhang, F.; Liu, Y.; Ding, L.; Chen, S.; Chen, F. Current achievements and future prospects in the genetic breeding of chrysanthemum: A review. Hortic. Res. 2019, 6, 109. [Google Scholar] [CrossRef]
- Korir, N.H.; Han, J.; Shangguan, L.; Wang, C.; Kayesh, E.; Zhang, Y.; Fang, J. Plant variety and cultivar identification: Advances and prospects. Crit. Rev. Biotechnol. 2013, 33, 111–125. [Google Scholar] [CrossRef]
- Zhang, F.; Chen, S.M.; Chen, F.D.; Fang, W.M.; Li, F.T. A preliminary genetic linkage map of chrysanthemum (Chrysanthemum morifolium) cultivars using RAPD, ISSR and AFLP markers. Sci. Hortic. 2010, 125, 422–428. [Google Scholar] [CrossRef]
- Zhang, F.; Chen, S.; Chen, F.; Fang, W.; Deng, Y.; Chang, Q.; Liu, P. Genetic analysis and associated SRAP markers for flowering traits of chrysanthemum (Chrysanthemum morifolium). Euphytica 2011, 177, 15–24. [Google Scholar] [CrossRef]
- Powell, W.; Machray, G.C.; Provan, J. Polymorphism revealed by simple sequence repeats. Trends Plant Sci. 1996, 1, 215–222. [Google Scholar] [CrossRef]
- Kalia, R.K.; Rai, M.K.; Kalia, S.; Singh, R.; Dhawan, A.K. Microsatellite markers: An overview of the recent progress in plants. Euphytica 2010, 177, 309–334. [Google Scholar] [CrossRef]
- Zhang, Y.; Dai, S.L.; Hong, Y.; Song, X.B. Application of genomic SSR locus polymorphisms on the identification and classification of Chrysanthemum cultivars in China. PLoS ONE 2014, 9, 104856. [Google Scholar] [CrossRef] [PubMed]
- Jo, K.M.; Jo, Y.H.; Chu, H.S.; Lian, S.; Cho, W.K. Development of EST-derived SSR markers using next-generation sequencing to reveal the genetic diversity of 50 chrysanthemum cultivars. Biochem. Syst. Ecol. 2015, 60, 37–45. [Google Scholar] [CrossRef]
- Shim, E.J.; Heo, E.J.; Yoon, M.K.; Soh, E.H.; Hong, J.H. Construction of SSR marker database of Chrysanthemum varieties collected in Korea. Korean J. Breed. Sci. 2015, 47, 366–375. [Google Scholar] [CrossRef]
- Mekapogu, M.; Kwon, O.K.; Hyun, D.Y.; Lee, K.J.; Ahn, M.S.; Park, J.T.; Jung, J.A. Identification of standard type cultivars in chrysanthemum (Dendranthema grandiflorum) using SSR markers. Hortic. Environ. Biotech. 2020, 61, 153–161. [Google Scholar] [CrossRef]
- Han, J.Y.; Kim, J.B.; Lee, J.H.; Hong, C.P.; Park, H.S.; Kim, T.S. Development of EST-SSR markers for cultivar determination and genetic diversity studies of commercial chrysanthemums in the Korean floral market. Korean J. Breed. Sci. 2019, 51, 201–208. [Google Scholar] [CrossRef]
- Schuelke, M. An economic method for the fluorescent labeling of PCR fragments. Nat. Biotechnol. 2000, 18, 233–234. [Google Scholar] [CrossRef]
- Liu, K.; Muse, S.V. Power Marker: An integrated analysis environment for genetic marker analysis. Bioinformatics 2005, 21, 2128–2129. [Google Scholar] [CrossRef] [PubMed]
- Pritchard, J.K.; Stephens, M.; Donnelly, P. Inference of population structure using multilocus genotype data. Genetics 2000, 155, 945–959. [Google Scholar] [CrossRef]
- Evanno, G.; Regnaut, S.; Goudet, J. Detecting the number of clusters of individuals using the software STRUCTURE: A simulation study. Mol. Ecol. 2005, 14, 2611–2620. [Google Scholar] [CrossRef]
- Rosenberg, N.A.; Burke, T.K.; Feldmann, M.W.; Freidlin, P.J.; Mam, G. Empirical evaluation of genetic clustering methods using multi-locus genotypes from 20 chicken breeds. Genetics 2001, 159, 699–713. [Google Scholar] [CrossRef]
- Earl, D.A.; vonHoldt, B.M. Structure Harvester: A website and program for visualizing STRUCTURE output and implementing the Evanno method. Conserv. Genet. Resour. 2012, 4, 359–361. [Google Scholar] [CrossRef]
- Nei, M. Analysis of gene diversity in subdivided populations. Proc. Natl. Acad. Sci. USA 1973, 70, 3321–3323. [Google Scholar] [CrossRef]
- Wang, F.; Zhang, F.J.; Chen, F.D.; Fang, W.M.; Teng, N.J. Identification of Chrysanthemum (Chrysanthemum morifolium) self-incompatibility. Sci. World J. 2014, 2014, 625658. [Google Scholar] [CrossRef]
- Feng, S.G.; He, R.F.; Jiang, M.Y.; Lu, J.J.; Shen, X.X.; Liu, J.J.; Wang, Z.A.; Wang, H.Z. Genetic diversity and relationships of medicinal Chrysanthemum morifolium revealed by start codon targeted (SCoT) markers. Sci. Hortic. 2016, 201, 118–123. [Google Scholar] [CrossRef]
- Luo, C.; Chen, D.; Cheng, X.; Liu, H.; Li, H.; Li, Y.; Huang, C. SSR analysis of genetic relationship and classification in Chrysanthemum germplasm collection. Hortic. Plant J. 2018, 4, 73–82. [Google Scholar] [CrossRef]
- Feng, S.; He, R.; Li, J.; Jiang, M.; Shen, X.; Jiang, Y.; Wang, Z.; Wang, H. Development of SSR markers and assessment of genetic diversity in medicinal Chrysanthemum morifolium cultivars. Front. Genet. 2016, 7, 113. [Google Scholar] [CrossRef] [PubMed]
- Roein, Z.; Asil, M.H.; Sabouri, A.; Dadras, A.R. Genetic structure of Chrysanthemum genotypes from Iran assessed by AFLP markers and phenotypic traits. Plant Syst. Evol. 2014, 300, 493–503. [Google Scholar] [CrossRef]
- Kumar, S.; Kumar, M.; Yadav, H.K.; Sharma, S.; Kumar, S. Genetic diversity and population structure analysis of Chrysanthemum (Dendranthema grandiflora Tzvelev) germplasm based on RAPD markers. J. Environ. Biol. 2017, 38, 457–464. [Google Scholar] [CrossRef]


| No | Marker | Primer sequence | Repeat Motif | |
|---|---|---|---|---|
| Forward | Reverse | |||
| 1 | ChSSR_51 | CCCCCTCTTCTTCTTCAACC | CAATAGAAAGCGCGTGACAA | (CCAA)4 |
| 2 | ChSSR_4 | ACAGTACACACACAGCCAACAC | GTAATGCTTCCGTCTGCATAGC | (CAA)4 |
| 3 | ChSSR_7 | AGGCCCAACTTTATTCACCC | CCAAATCCAATCTCCGGC | (GAG)4 |
| 4 | ChSSR_16 | ACAAGTAGTAGGAGGAGGAGGA | CAGTGTAGCCGGTACAGAAGA | (AGT)5 |
| 5 | ChSSR_40 | GACGGATTTTGAGCTTGGAG | GAACCAATAATCCCGACACC | (TA)13 |
| 6 | ChSSR_42 | CAAAGTACTACCAAACGCGG | GTAACATTGAGGGTGTAGCAGC | (CA)6 |
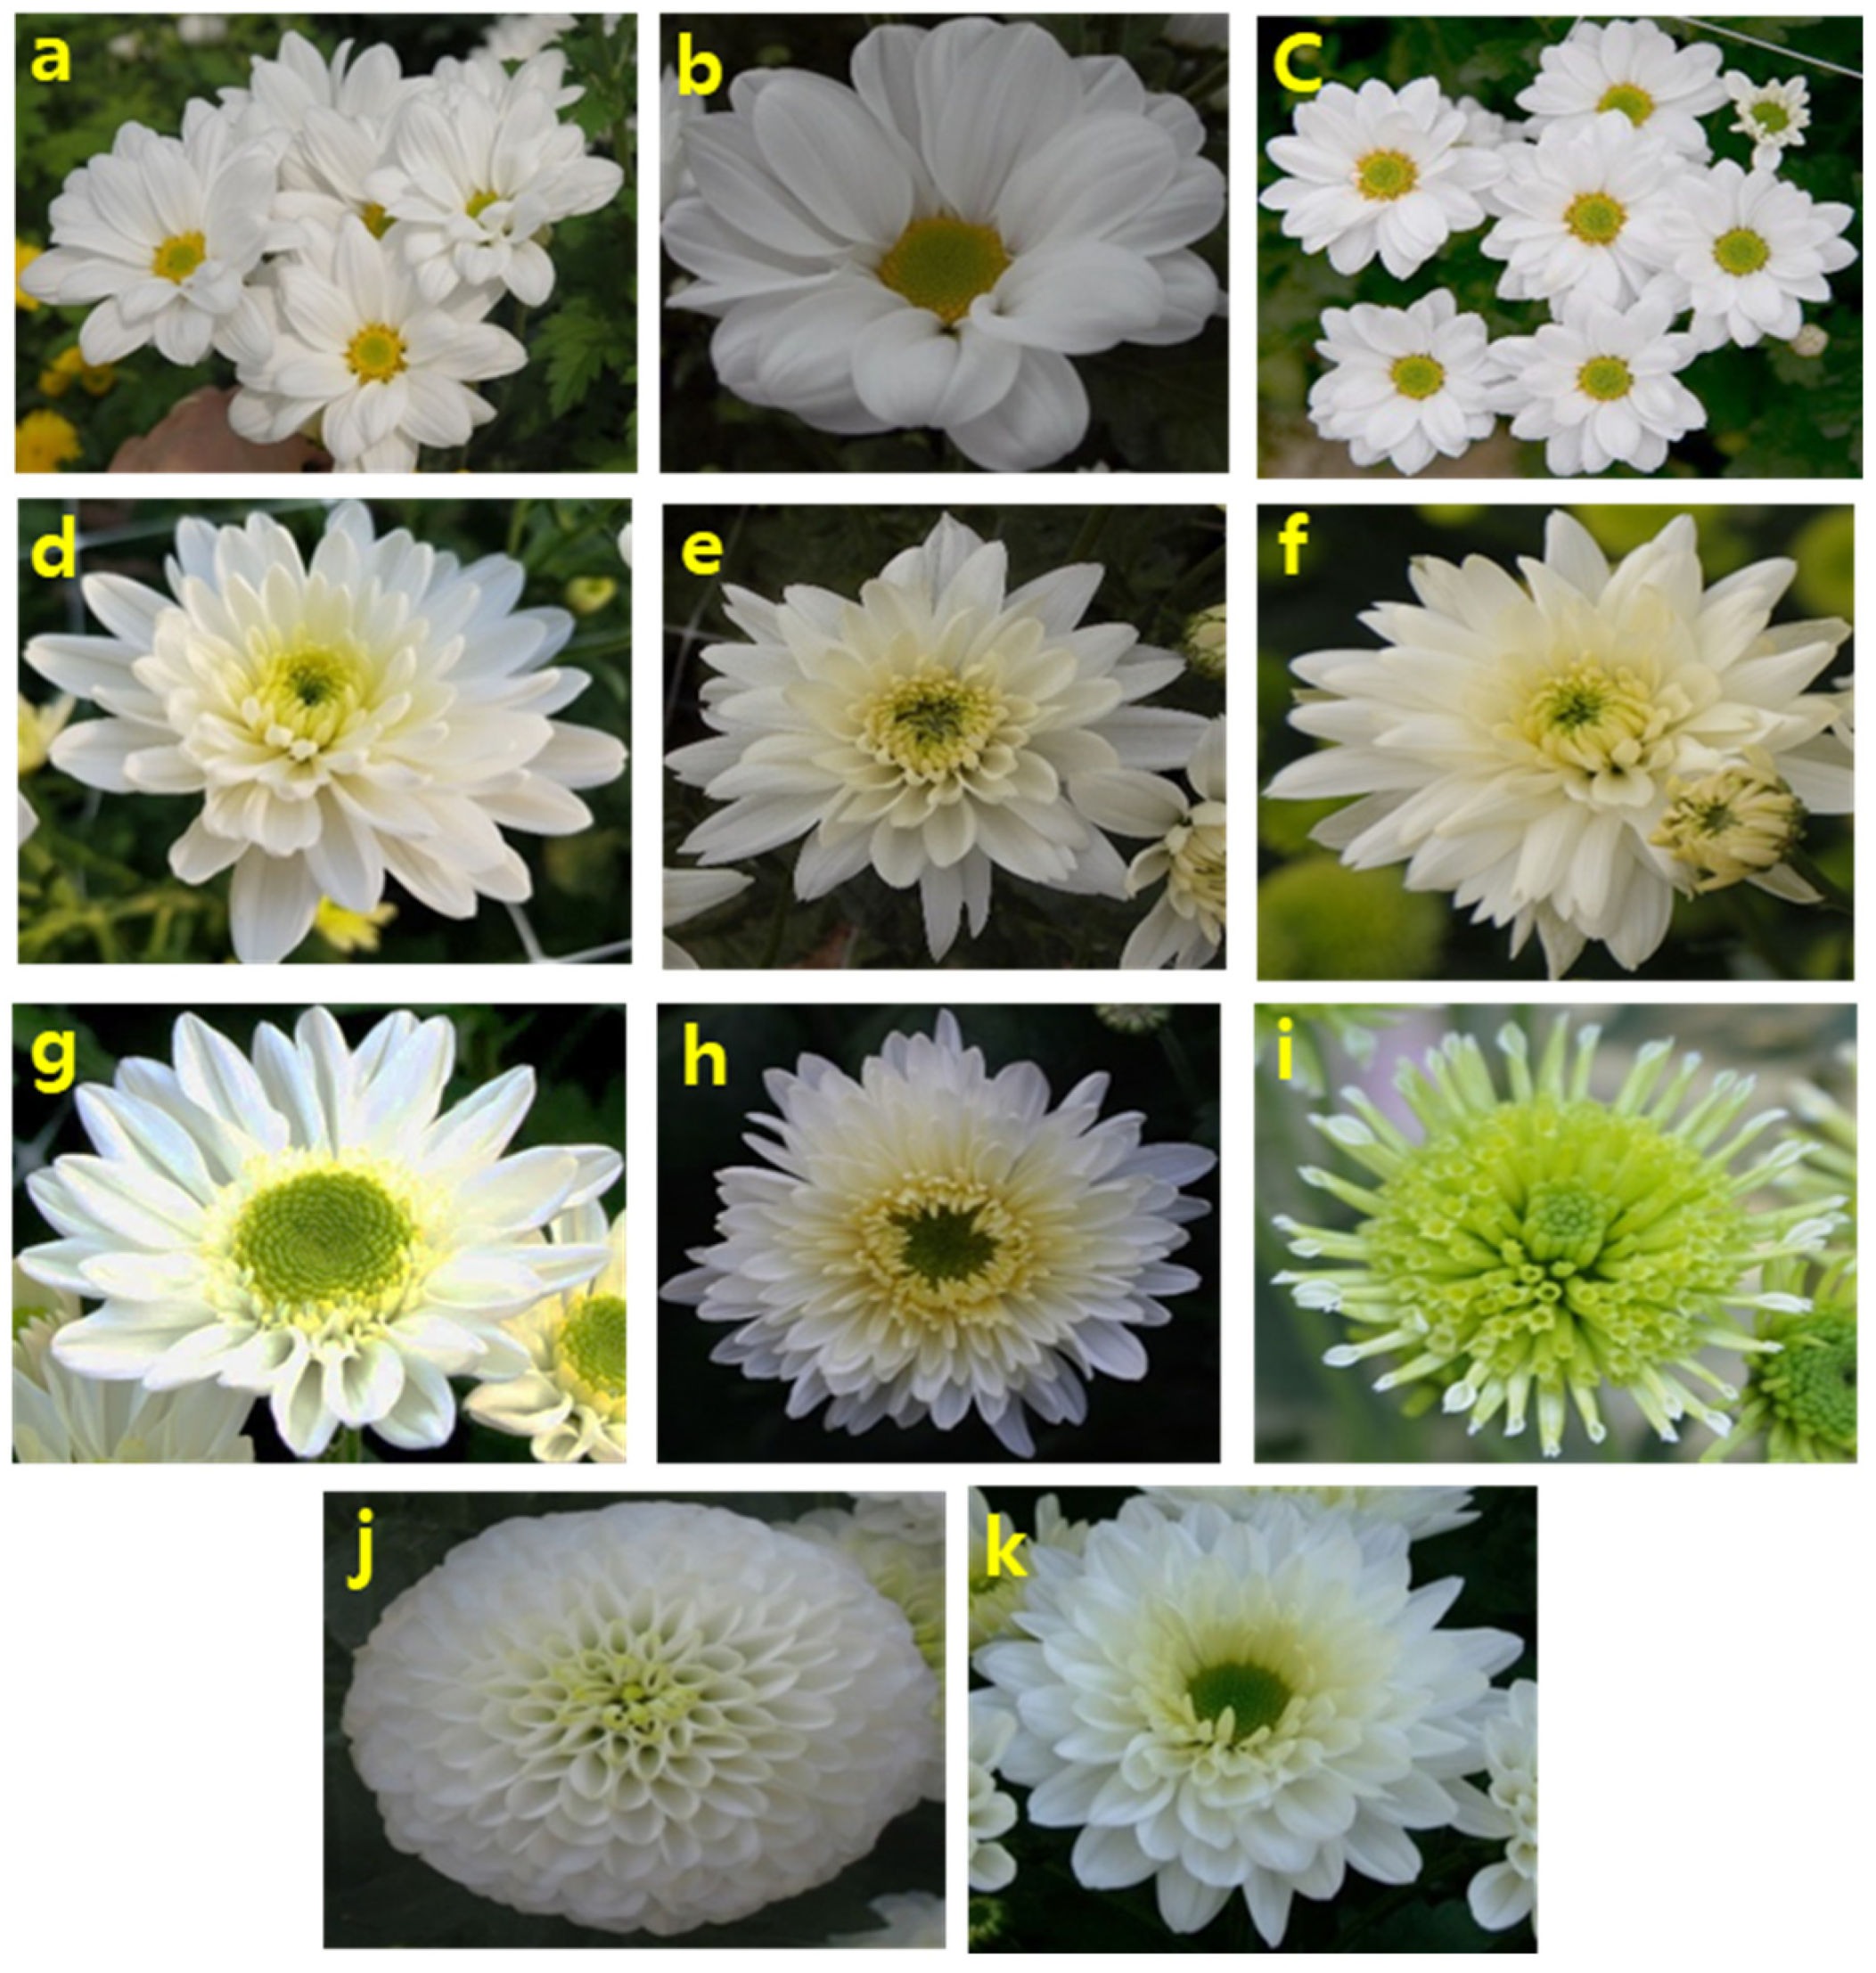
| Single | Pompon | Anemone | Semi-Double | Double |
|---|---|---|---|---|
| Chance, Dancer, Herby, Jerry, White Pangpang, Neba, Roadies, Moya, Mini, Mintee, Bacadi, Snow Dream, Water Poke, Jerry, Castella, Campus, Crystal, Toronto, Pasta, Polla, Husky, White Mirie, White Andy, Oh Blang, Pure Angel, Innocence, Snow Ball, White Wing, Angel, Arctic Queen, Chopin. Euro Speedy, Euro, Inga, Mallorca, Mannadu, Bolla, Sarah Coba, Shahsuin, Prosecco, Derilla, Dalia Cream | Ping Pong, White Pompon, Roletta, Super Pompon, Siberia, Pingpong, Snow Pop | Swan, Ladost Cream, Ford, Gibaeg, Forest Aroma, Puma | Moon Festival | Linekar |
| S.No. | Marker | Product Size (bp) | No. of Alleles | ¶ MAF | § HO | ¥ PIC | Gene Diversity |
|---|---|---|---|---|---|---|---|
| 1 | SSR_51 | 197-252 | 3 | 0.63 | 0.75 | 0.33 | 0.44 |
| 2 | KChSSR_4 | 248-274 | 4 | 0.36 | 0.80 | 0.67 | 0.69 |
| 3 | KChSSR_7 | 240-267 | 2 | 0.65 | 0.67 | 0.35 | 0.44 |
| 4 | KChSSR_16 | 185-194 | 6 | 0.34 | 0.80 | 0.73 | 0.76 |
| 5 | KChSSR_40 | 146-152 | 3 | 0.45 | 0.67 | 0.61 | 0.56 |
| 6 | KChSSR_42 | 142-170 | 3 | 0.59 | 0.80 | 0.51 | 0.52 |
| Mean | 3.5 | 0.50 | 0.75 | 0.53 | 0.57 |
Disclaimer/Publisher’s Note: The statements, opinions and data contained in all publications are solely those of the individual author(s) and contributor(s) and not of MDPI and/or the editor(s). MDPI and/or the editor(s) disclaim responsibility for any injury to people or property resulting from any ideas, methods, instructions or products referred to in the content. |
© 2023 by the authors. Licensee MDPI, Basel, Switzerland. This article is an open access article distributed under the terms and conditions of the Creative Commons Attribution (CC BY) license (https://creativecommons.org/licenses/by/4.0/).
Share and Cite
Mekapogu, M.; Song, H.-Y.; Lim, S.-H.; Jung, J.-A. Assessment of Genetic Diversity in the White-Colored Variants of Spray-Type Chrysanthemum Cultivars Using SSR Markers. Horticulturae 2023, 9, 798. https://doi.org/10.3390/horticulturae9070798
Mekapogu M, Song H-Y, Lim S-H, Jung J-A. Assessment of Genetic Diversity in the White-Colored Variants of Spray-Type Chrysanthemum Cultivars Using SSR Markers. Horticulturae. 2023; 9(7):798. https://doi.org/10.3390/horticulturae9070798
Chicago/Turabian StyleMekapogu, Manjulatha, Hyun-Young Song, So-Hyeon Lim, and Jae-A Jung. 2023. "Assessment of Genetic Diversity in the White-Colored Variants of Spray-Type Chrysanthemum Cultivars Using SSR Markers" Horticulturae 9, no. 7: 798. https://doi.org/10.3390/horticulturae9070798
APA StyleMekapogu, M., Song, H.-Y., Lim, S.-H., & Jung, J.-A. (2023). Assessment of Genetic Diversity in the White-Colored Variants of Spray-Type Chrysanthemum Cultivars Using SSR Markers. Horticulturae, 9(7), 798. https://doi.org/10.3390/horticulturae9070798