Article

Identification of ABA Signaling Pathway Genes and Their Differential Regulation in Response to Suboptimal Light Stress in Grape (Vitis vinifera L.)

1
College of Biological and Environmental Sciences, Zhejiang Wanli University, Ningbo 315100, China
2
College of Fisheries and Life Science, Shanghai Ocean University, Shanghai 201306, China
*
Author to whom correspondence should be addressed.
These authors contributed equally to this work.
Horticulturae 2023, 9(7), 789; https://doi.org/10.3390/horticulturae9070789
Submission received: 22 May 2023 / Revised: 8 July 2023 / Accepted: 10 July 2023 / Published: 11 July 2023
(This article belongs to the Special Issue New Advances in Genetic Improvement and Breeding of Fruit Trees)

Abstract

:
Suboptimal light stress in grapevines is increasing worldwide with the spread of grapevine cultivation, which can affect grapevine physiology and productivity, such as in Southern China. Abscisic acid (ABA) is an important hormone in plant adaptive responses to abiotic stress, including low light stress. However, ABA signaling pathway genes (APGs) are not well characterized in the grapevine, and little is known of their potentially mitigating role in grapevine growth under weak light stress. Our study aimed to explore the potential role of the ABA signaling pathway in the response of grapevines to suboptimal light conditions. In this study, APGs were identified in the grapevine genome, and the distribution of conserved motifs was shown to reflect their phylogenetic relationships. Gene duplication analysis indicated that segmental duplication was an important driver for gene expansion in the grapevine ABA signaling pathway. Suboptimal conditions of light were shown to seriously affect the growth of grapevine leaves and berries, with the differential regulation of APGs in the grapevine. Our study summarizes the basic characteristics of APGs in grapevine, which can now be examined further for their roles in grapevine’s response to suboptimal light conditions.

1. Introduction

As the main source of energy for plants, light is a key environmental factor that affects their growth, morphological changes, and physiological conditions [1,2]. However, with the intensification of climate change, haze, cloud overcast, rain, and other factors, more frequently affect the light intensity [3]. In particular, the more frequent rainfall in southern China from mid-June to mid-July has seriously affected the light environment in protected cultivation [4,5]. Poor light severely restricts the photosynthesis of plants, and affects the formation and maintenance of photosynthetic organs, stomatal opening, and flowering time, all of which limit crop productivity [6,7]. Under suboptimal light conditions, plants maintain photosynthesis by regulating stomatal morphological characteristics and hormone and enzyme synthesis levels [8,9,10]. It is well known that abscisic acid (ABA) plays a pivotal role in plant response to light stress, especially in the alleviation of damage caused by high light stress [11,12]. However, studies exploring the effects of weak light stress on ABA signaling pathway genes (APGs) remain limited.
The core ABA signal transduction pathway mainly consists of the pyrabactin resistance/PYR-like/regulatory components of ABA receptors (PYR/PYL/RCARs), protein phosphatase 2Cs (PP2Cs), and non-fermenting-1-related protein kinases 2 (SnRK2s), which form a negative regulatory system, and ABA reaction element binding protein/ABRE binding factors (AREB/ABFs) [13,14,15]. Under normal conditions, the ABA content can be maintained relatively low, leaving its receptor complex largely free. In this state, the PP2C of the complex binds and actively dephosphorylates the auto-phosphorylating SnRK2s, which consequently are unable to activate downstream ABF responses [16]. Under environmental stress, ABA levels increase and bind with its receptor, which forms the PYR/PYL/RCAR-PP2C trimer complex, leading to conformational changes in PP2C and the inactivation of its phosphatase activity, thus promoting the release of the autophosphorylated state SnRK2 [17,18]. In their phosphorylated state, activating SnRK2s can interact and activate AREB/ABF transcription factors, which regulate the transcription of downstream genes containing the ABRE cis-acting element [19].
The ABA signaling pathway has been found to play a crucial role in regulating growth, development, and the response to stress in many plants pp. [20,21,22,23,24]. In the grapevine, APGs play a key role in resisting low and high-temperature stresses [25]. In addition, the overexpression of APGs enhances the plant’s tolerance to various abiotic stresses [26,27]. However, the role of APGs under weak light stress remains unclear. Grapes (Vitis vinifera L.) are an economically important crop that is mainly cultivated in greenhouses in southern China [28]. The grapevine responds well to well-lit conditions, whereas weak light stress has adverse effects on its physiology and biochemistry, with decreases in the grape yield, quality, and economic return. Therefore, balancing tolerance to abiotic stresses and grape yields are important goals in crop improvement. Yinhong’, a grapevine variety obtained from ‘Kyhon’ budding, is regarded highly due to its production of excellent juicy berries and good flavor and is widely cultivated in southern China. In this study, five-year-old ‘Yinhong’ vines were subjected to different light intensities to monitor changes in photosynthesis, berry growth, and the expression of leaf APGs. This study provides insight into the role played by the ABA signaling pathway in grapevines under conditions of low light stress.

2. Materials and Methods

2.1. Identification and Analysis of APGs in Grapevine

To identify APGs from the grape genome database (GCA_000003745.2), known APGs in Arabidopsis proteins (TAIR: http://www.arabidopsis.org/; accessed on 5 April 2023) were used as query sequences. Blastp was used to select coding sequences with more than a 50% sequence similarity to their Arabidopsis counterparts [29]. Gene sequences that were too short or had a low expression in the leaves were removed. All sequences were further screened for conserved motifs present in APGs using the Pfam (http://pfam-legacy.xfam.org/ accessed on 11 April 2023), SMART (http://smart.embl.de/ accessed on 11 April 2023), and NCBI-CDD (https://www.ncbi.nlm.nih.gov/cdd/ accessed on 11 April 2023) databases. Additionally, the molecular weights and theoretical isoelectric points of the selected grapevine proteins were predicted using ExPasy (http://web.expasy.org/protparam/ accessed on 14 April 2023). Their subcellular localization was predicted using SoftBerry (http://www.softberry.com/ accessed on 15 April 2023).

2.2. Phylogenetic Analysis and Gene Conserved Motif Analysis

Multiple sequence alignments of ABA signaling pathway protein sequences and the construction of phylogenetic trees utilized MEGA 6.0 with the neighbor-joining method (1000 bootstrap repeats) [30]. Conserved motifs in proteins with the ABA signaling pathway were identified using TBtools [31].

2.3. Chromosomal Location, Gene Duplication, Synteny Analysis and Cis-Acting Regulatory Element Analysis

MapChart was used to determine the distribution of APGs across grapevine chromosomes 1–19 [32]. The rates of non-synonymous (Ka) and synonymous substitution (Ks) in APGs were calculated with KaKs_Calculator v. 2 [33]. To estimate the approximate date of duplicate events, the formula T = Ks/2R could be used where R represents the divergence rate, which was assumed to be 1.5 × 10⁻⁸ synonymous substitutions per gene per year for dicotyledonous plants [34]. The collinearity and syntenic relationship of APGs were analyzed using MCScanX [35]. The Plant CARE database (http://bioinformatics.psb.ugent.be/webtools/plantcare/html/ accessed on 20 April 2023) was used to identify cis-acting regulatory elements in the promoter regions (from 1500 bp upstream of the start codon) of APGs [36].

2.4. Plant Materials and Treatments

The experiments were performed with 5-year-old ‘Yinhong’ table grape vines between May and July 2021 in an irrigated vineyard at Cixi, Zhejiang, China (30°16′6.59″ N, 121°25′2.18″ E). The physical and chemical properties of the soil were as follows: soil type, clayey soil; pH, 6.4; soil depth, 102 cm; total organic matter content, 25 g·kg−1; basic nitrogen, 202 mg·kg−1; available phosphorus, 35 mg·kg−1; available potassium, 114 mg·kg−1; soil bulk density, 112.3 g·cm−1; and groundwater level, 55–60 cm [37]. The soil is a typical marine sedimentary plain soil, with a deep and sparse soil layer and good permeability. In total, 40 uniform randomly selected vines were planted and cultivated under rain-shelter cultivation greenhouse conditions. They were grouped into three treatments: control under the natural light of the greenhouse (CK) and T1 and T2, which had one and two layers of black nylon mesh, respectively, installed approximately 2.5 m above the vine tops. The light intensity levels at the vine crowns in T1 and T2 were ca. 30% and 60% lower than that of the control, respectively. At the experimental setup, the photosynthetic photon flux densities of 622, 435, and 289 μmol·m−2·s−1 were recorded for the three conditions, respectively. Sample collection and light measurements were carried out at 0, 7, 14, 21, 28, 35, and 42 days after treatment initiation. All other conditions were standard for the greenhouse and were uniformly applied to all treatments. Three biological replicates, each consisting of three berry clusters and three leaves, were collected at each sampling date. To explore gene expression patterns under ABA treatment, the plants were sprayed with 100 μM ABA (Aladdin Biochemical Technology, Shanghai, China) or distilled water as the control. Triplicate random leaf samples were collected after 5 min, 2, 4, 6, and 8 h for analysis. All samples were snap-frozen in liquid nitrogen and stored at −80 °C until analysis.

2.5. Measurement of Leaf Gas Exchange Parameters

Gas exchange was measured on the uppermost leaves between 10:00 a.m. and 12:00 a.m. on a sunny day using a portable photosynthesis measuring system (CIRAS-3, Boston, MA, USA), which provided estimates for the net photosynthetic rate (Pn), stomatal conductance (Gs), intercellular CO2 concentration (Ci), and transpiration rate (Tr). Leaf chlorophyll fluorescence was measured after dark adaptation for 30 min using a modulated chlorophyll fluorometer (Junioir-PAM, Walz, Germany), which provided estimates of the maximal photochemical efficiency (Fv/Fm), photochemical quenching (qP), actual photochemical efficiency (Y(II)) and non-photochemical quenching (qN).

2.6. Measurement of Berry Quality

Grape dimensions (n = 9 per replicate) were measured using an electronic Vernier caliper. A portable refractometer (ATAGO, Guangzhou, China) was used to determine the total soluble solids (TSS) in grapes. Titratable acids (TA) were measured with NaOH [38]. A color difference meter (NH300, Shenzhen, China) was used to calculate the color index of the red grape (CIRG) as described previously [39]. An electronic balance was used to measure the fresh weight (FW; g) of 30 grape berries from each vine.

2.7. RNA Extraction and qRT-PCR

The total RNA was isolated from grape leaves and berries using HipPure Plant RNA Mini Kit (Magen, Guangzhou, China) and reverse transcribed into cDNA using SuperMix (Novoprotein, Suzhou, China). Primers used in qPCR were designed using primer 5.0 software (Premier Biosoft International, Palo Alto, CA, USA) and are shown in Table S1. SYBR qPCR SuperMix Plus (Novoprotein) was used for the qPCR of APGs. The relative expression levels of these selected genes were calculated using the 2−ΔΔCt method [40].

2.8. Statistical Analysis

All tests were performed with three biological replicates and repeated three times. Statistical analysis was conducted using a one-way analysis of variance, followed by Duncan’s multiple range test using SPSS statistics 25 (IBM, Armonk, NY, USA); Pearson’s correlation coefficients were calculated using Origin2021 (OriginLab, Northampton, MA, USA).

3. Results

3.1. Identification and Analysis of APGs in Grapevine

Forty APGs were identified in the grapevine, including 9 SnRK2s, 6 PYR/PYL/RCARs, 8 ABF/AREBs, and 17 PP2Cs, which were named based on their function and chromosomal location (Tables S2–S4). Relative to previous reports, this study identifies eight new grapevine APGs members (VvPYR/PYL/RCAR3, VvPP2C7, VvSnRK2.4, VvSnRK2.7, VvSnRK2.8, VvABF/AREB2, VvABF/AREB4, VvABF/AREB8) [25]. The protein size of SnRK2 proteins in the grape varied from 275 (VvSnRK2.7) to 938 (VvSnRK2.8) amino acids, the PYR/PYL/RCAR proteins varied from 185 (VvPYR/PYL/RCAR2 and VvPYR/PYL/RCAR6) to 290 (VvPYR/PYL/RCAR3) amino acids, the ABF/AREB proteins varied from 99 (VvABF/AREB4) to 713 (VvABF/AREB2) amino acids and PP2C proteins varied from 111 (VvPP2C11) to 408 (VvPP2C17) amino acids. With the exception of PYR/PYL/RCAR members, the range of the protein sizes and molecular weights in each gene family was relatively broad (Figure 1 and Table S2). The pI values of key proteins for the ABA signaling pathway ranged from 4.85 (VvSnRK2.4) to 10.60 (VvABF/AREB4). In addition, the average pI for PP2Cs was the highest, while SnRKs were the lowest. Among the forty grapevine APGs, 23 were predicted to be plasma membrane-associated, 10 to be nuclear, and 4 to be located in extracellular space. Of these, most of the PP2Cs (8/9) and SnRK2s (16/17) are predicted to be in the plasma membrane, while all ABF/AREB proteins were predicted to be nuclear.

3.2. Phylogeny and Conserved Motifs of APGs in Grapevine

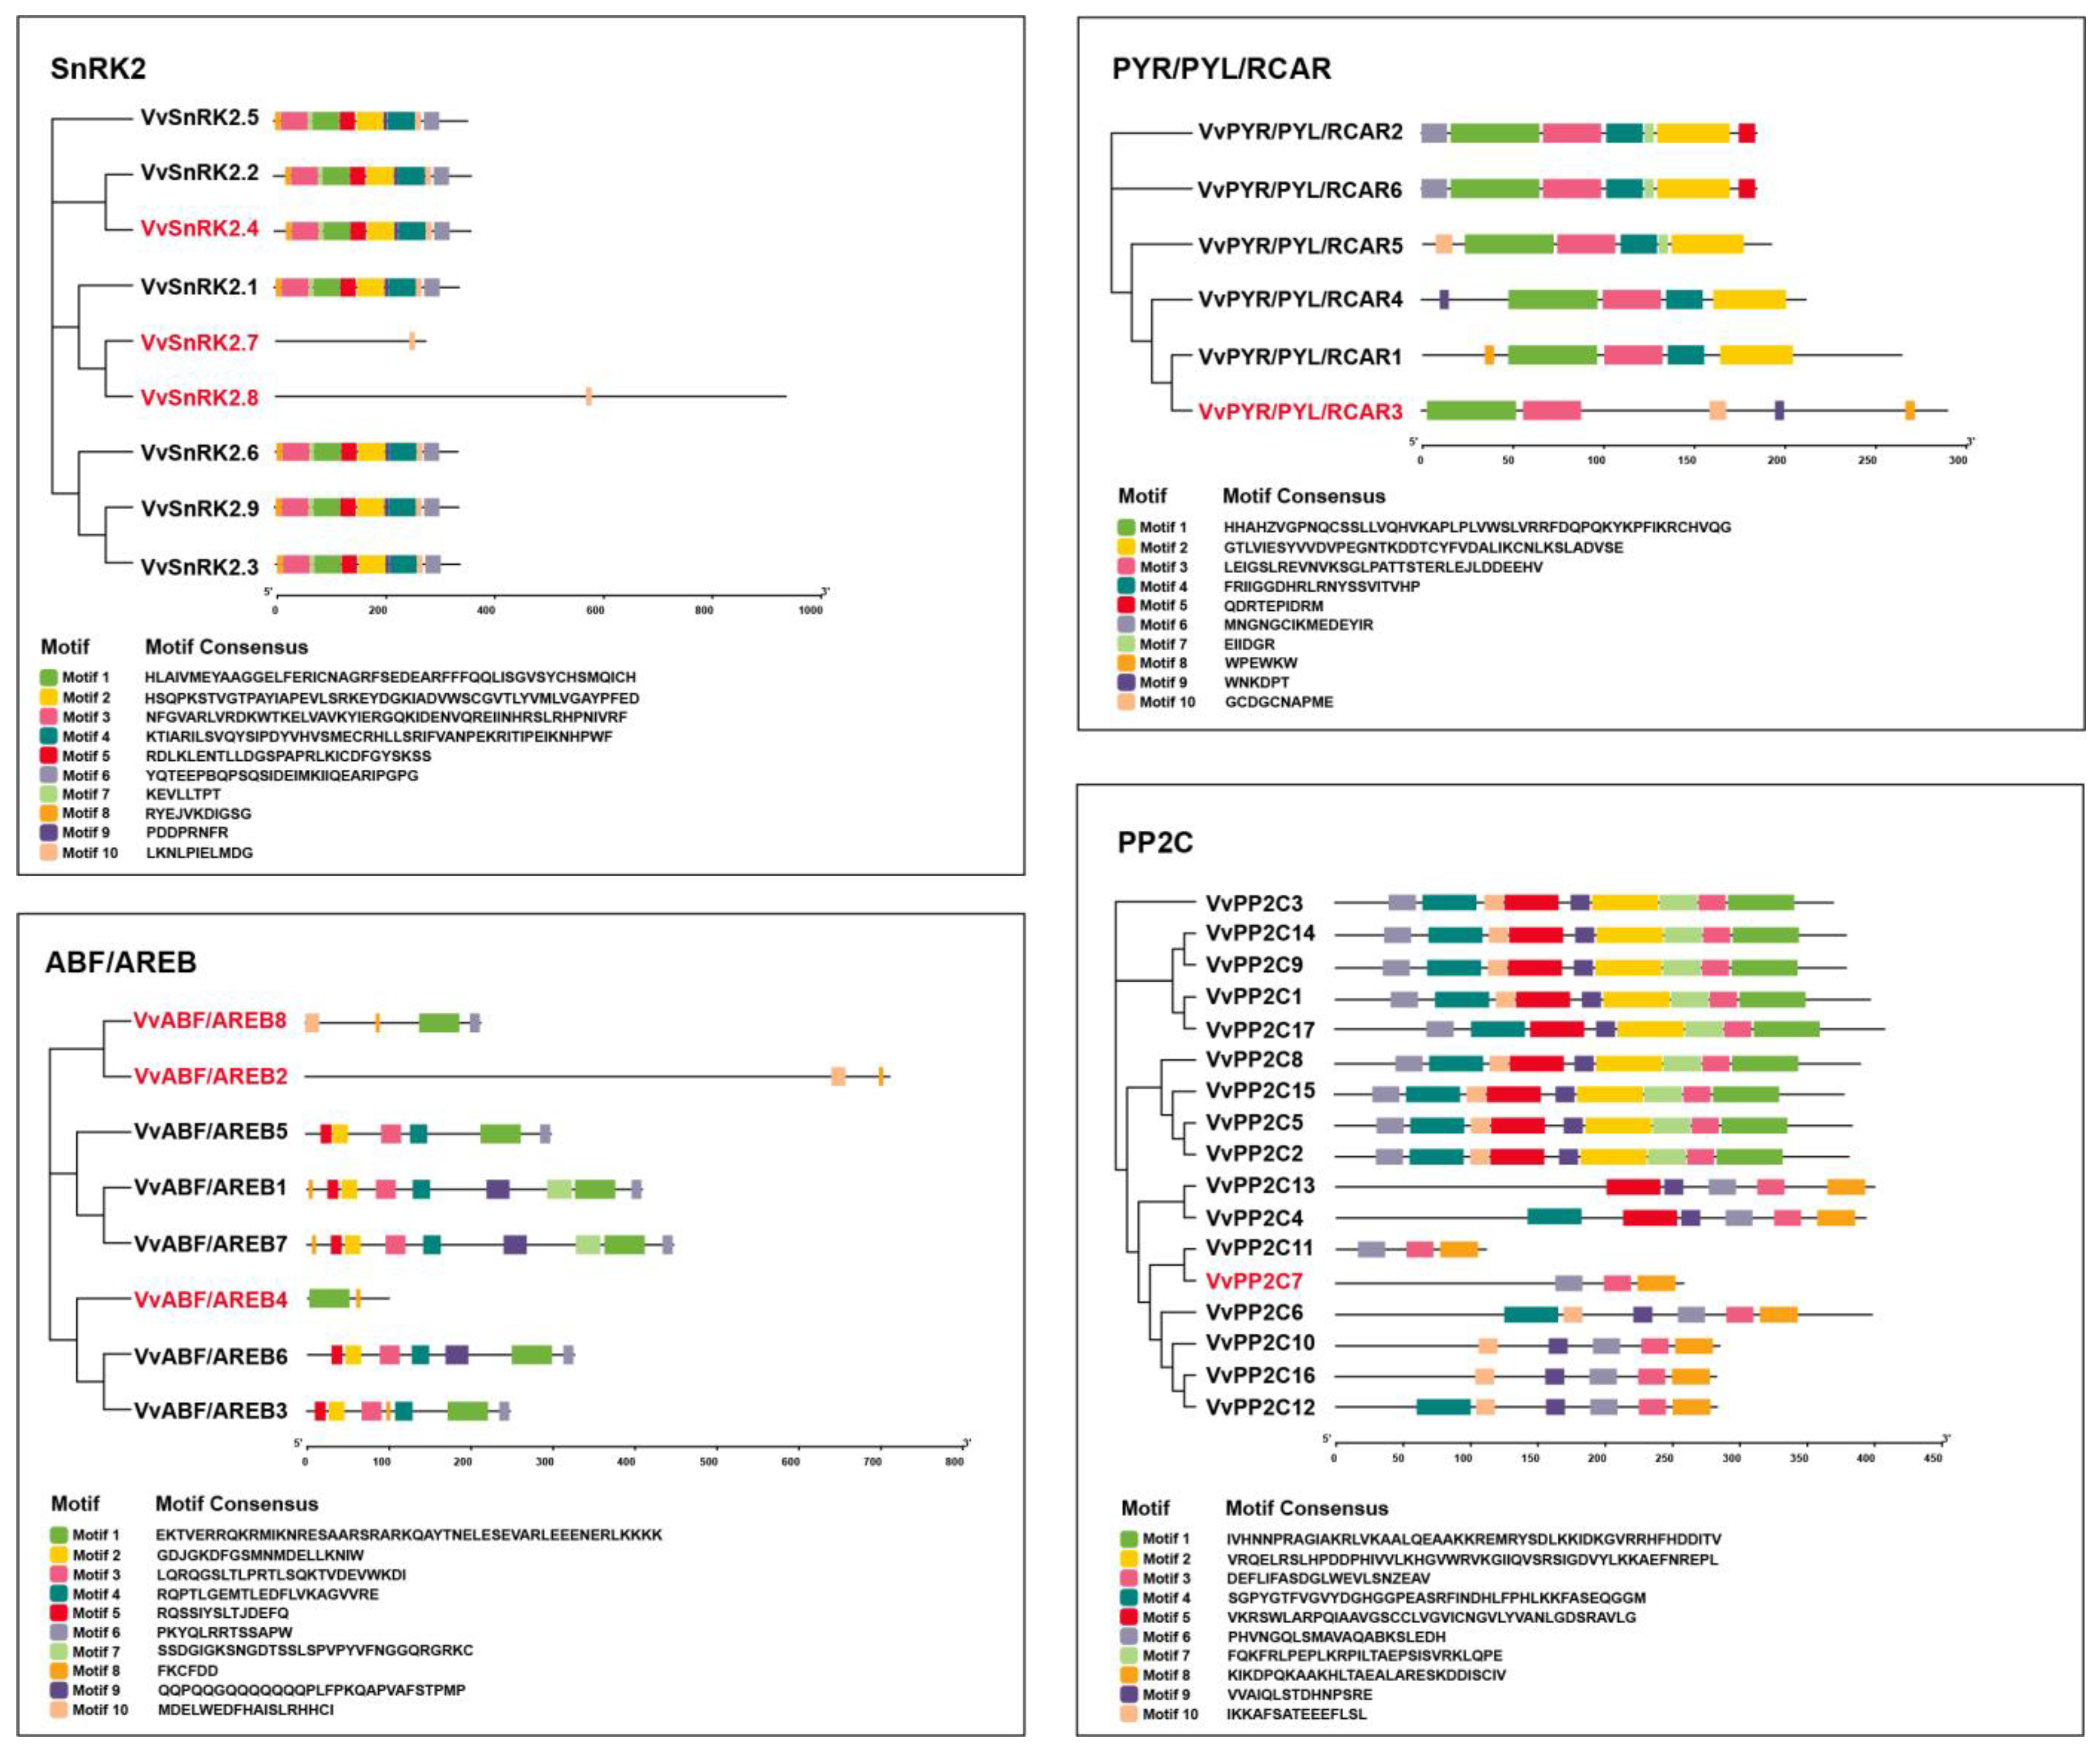
To examine the evolutionary relationship within each APG family, we conducted a combined phylogenetic and conserved sequence motif analysis for each gene family (Figure 2). We observed that the sequences of VvSnRK2.7, VvSnRK2.8, and VvABF/AREB2 significantly differed in the conserved motifs present in their respective family members. The majority of VvSnRK2s contained a similarly positioned motif 10, whereas, in VvSnRK2.8 and VvSnRK2.7, this motif was positioned differently. For the PYR/PYL/RCAR family, each family member contained motif 1 and motif 3. The structures of VvPYR/PYL/RCAR2 and VvPYR/PYL/RCAR6 were highly similar, with seven similarly placed sequence motifs. For the ABF/AREB family, most of the family members (7/8) contained motif 1. The structures of VvABF/AREB1 and VvABF/AREB7 were highly similar, with nine identical conserved sequence motifs, and showed their greatest similarity to VvABF/AREB6 and VvABF/AREB3. For VvPP2Cs, each family member contained motif 3 and motif 6. Moreover, the entire PP2C family could be clearly divided into two categories, one containing nine motifs and the other containing three identical motifs.

3.3. Chromosomal Location and Collinearity Analysis

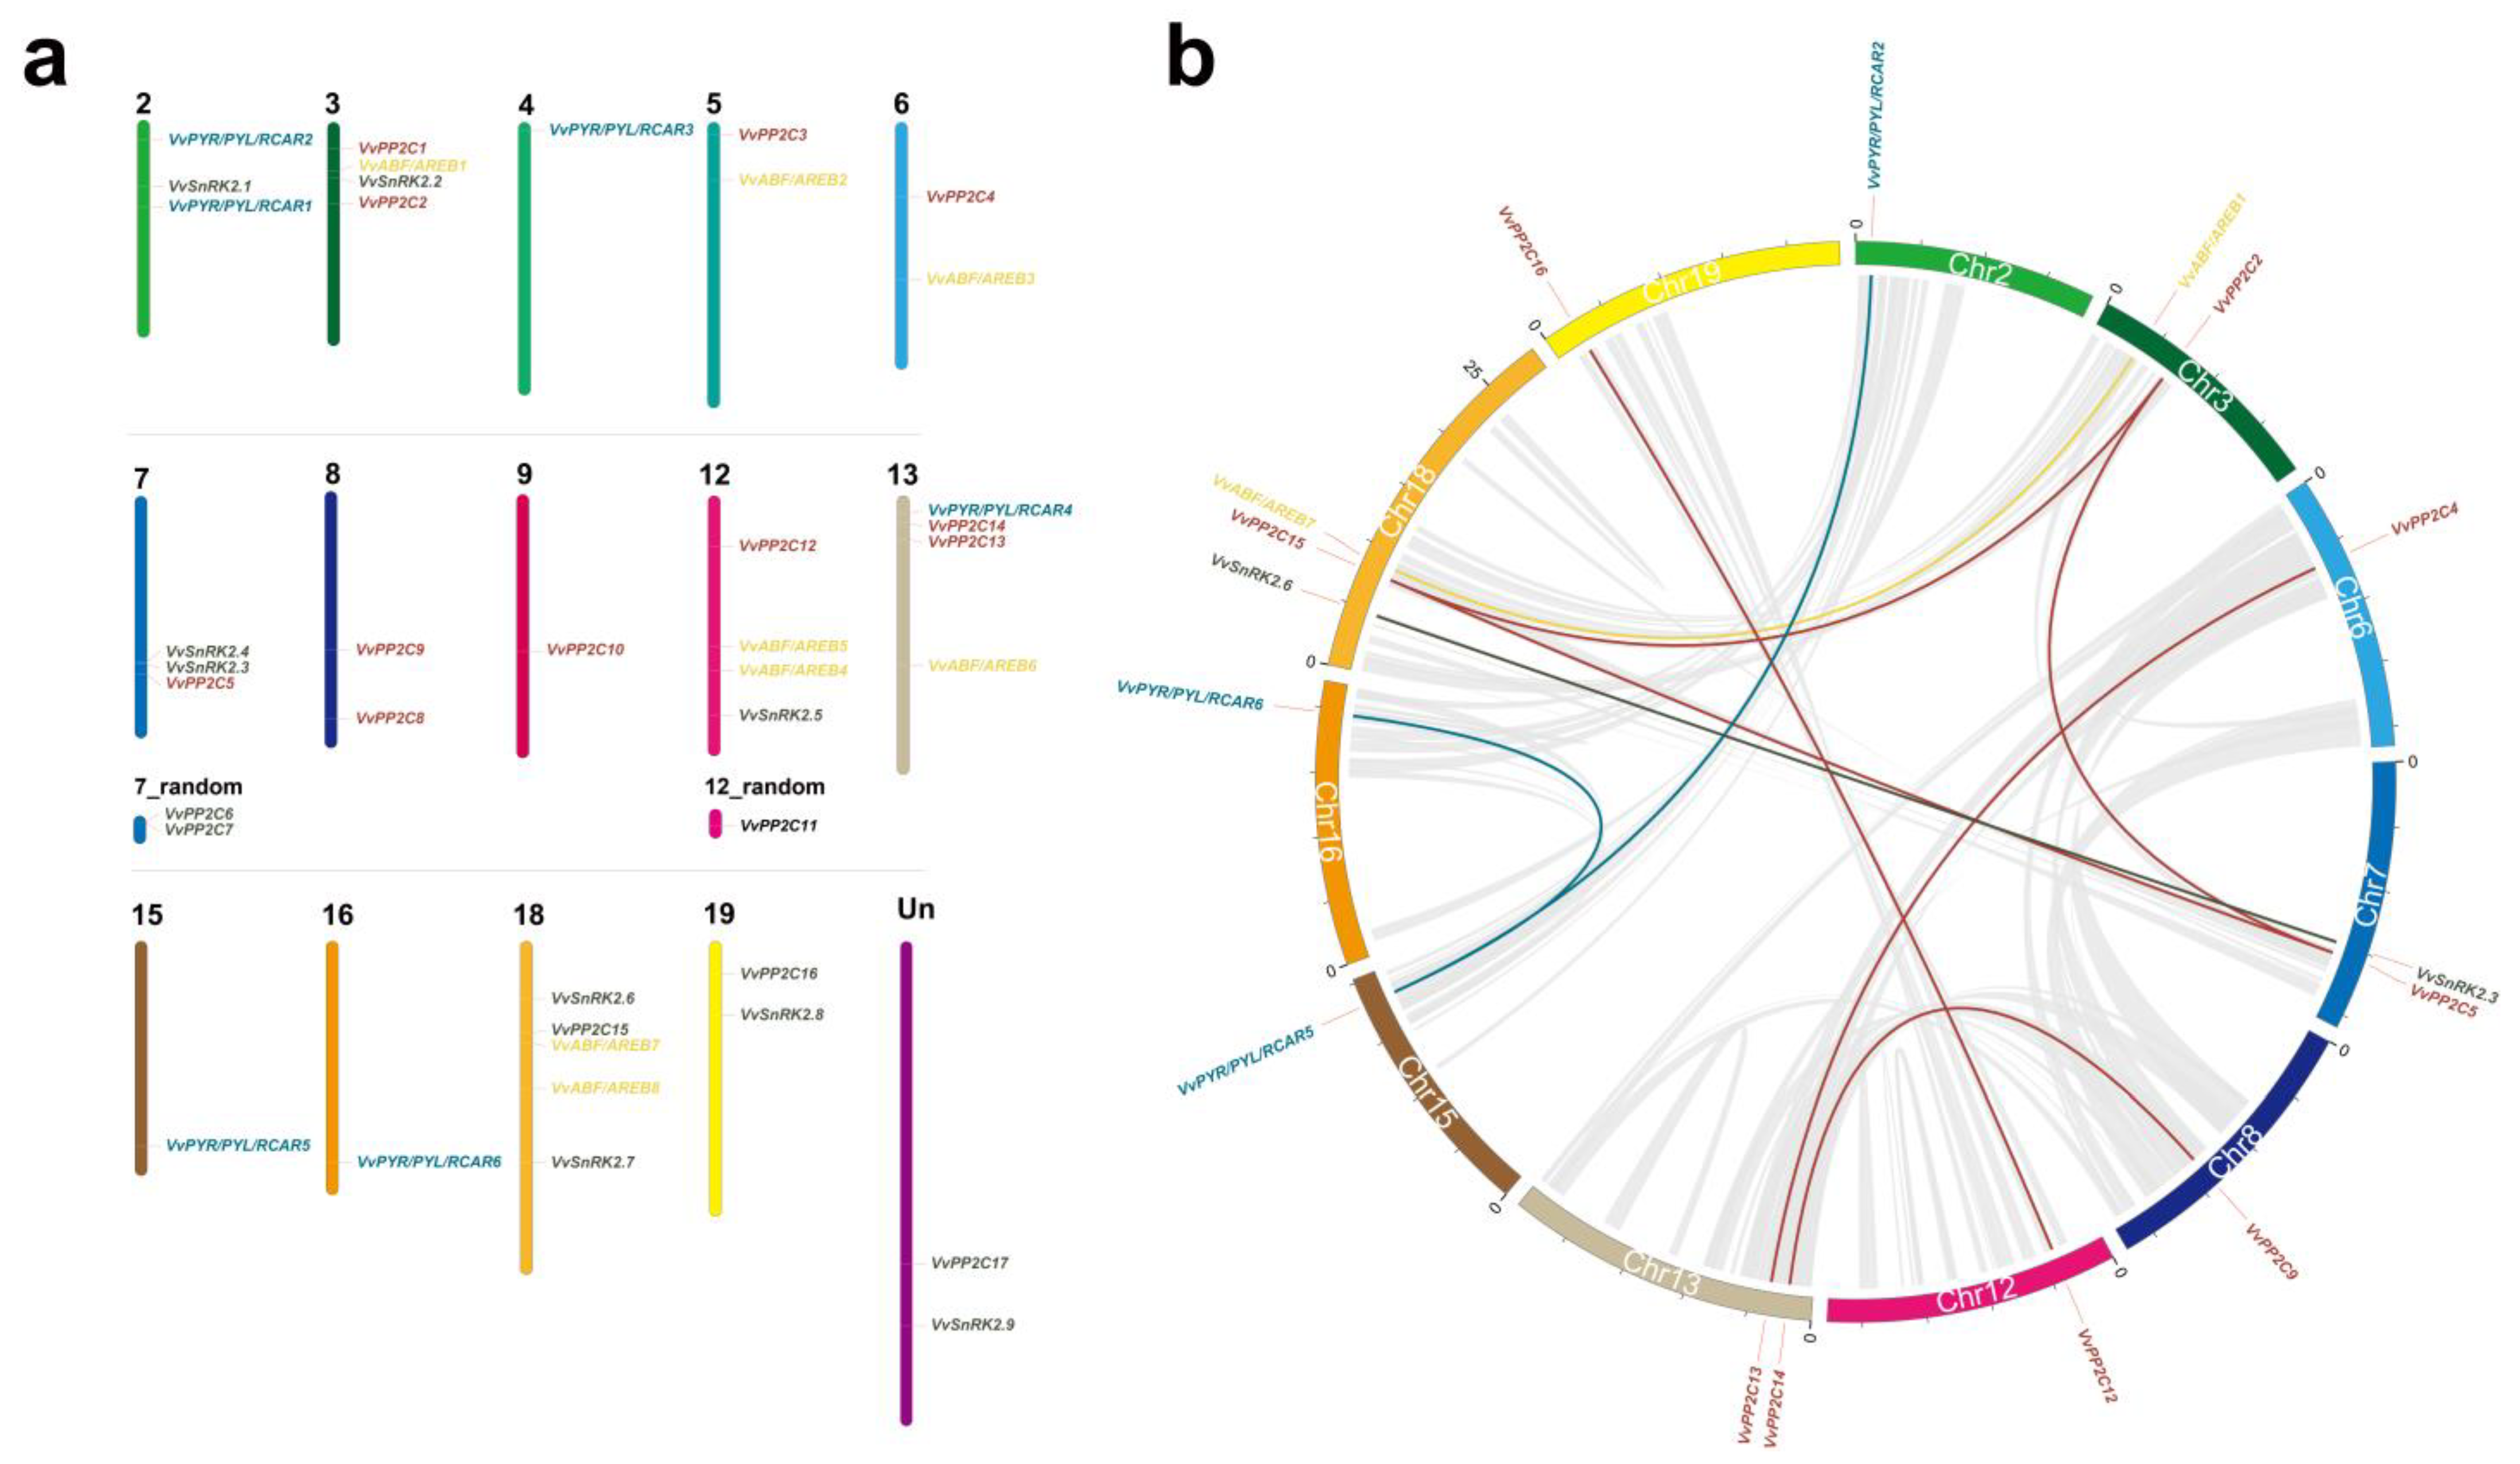
The distribution of 40 selected APGs could be seen as unevenly distributed across 15/19 chromosomes, one of which remains unclassified (Figure 3a). A total of four genes are clustered within a short distance at the top of chromosome 3, whereas chromosomes 4, 9, 15, and 16 each harbored a single gene. Conversely, none of these genes were located on chromosomes 1, 10, 11, 14, and 17. Furthermore, it was found that this distribution was independent of chromosome length. Based on a collinearity analysis of the four gene families of the ABA signaling pathway using MCScanX, a total of 10 segmental-duplicated gene pairs were observed between Chr18 and Chr3 (VvABF/AREB7 and VvABF/AREB1), Chr3 and Chr7 (VvPP2C2 and VvPP2C5), Chr6 and Chr13 (VvPP2C4 and VvPP2C13), Chr7 and Chr18 (VvPP2C5 and VvPP2C15), Chr8 and Chr13 (VvPP2C9 and VvPP2C14), Chr12 and Chr19 (VvPP2C12 and VvPP2C16), Chr15 and Chr16 (VvPYR/PYL/RCAR5 and VvPYR/PYL/RCAR6), Chr15 and Chr2 (VvPYR/PYL/RCAR5 and VvPYR/PYL/RCAR2), Chr18 and Chr7 (VvSnRK2.6 and VvSnRK2.3), Chr3 and Chr18 (VvPP2C2 and VvPP2C15) (Figure 3b).
Our analysis indicated that a portion of each gene family member was derived from segmental replication events, indicating that segmental replication played a major role in the expansion of these genes in the grapevine. However, gene segmentation does not appear to have occurred between these four gene families. The number of synonymous substitutions per site (Ks) could be used to estimate the evolution time of whole genome duplications or segment repeat events [41]. Our results indicate that all gene pairs had relatively small Ks values between 0.44 and 3.12, indicating that these duplication events occurred recently, from 34.89 to 104.12 Mya (Table 1).

3.4. Cis-Acting Elements Present in the Promoter Regions

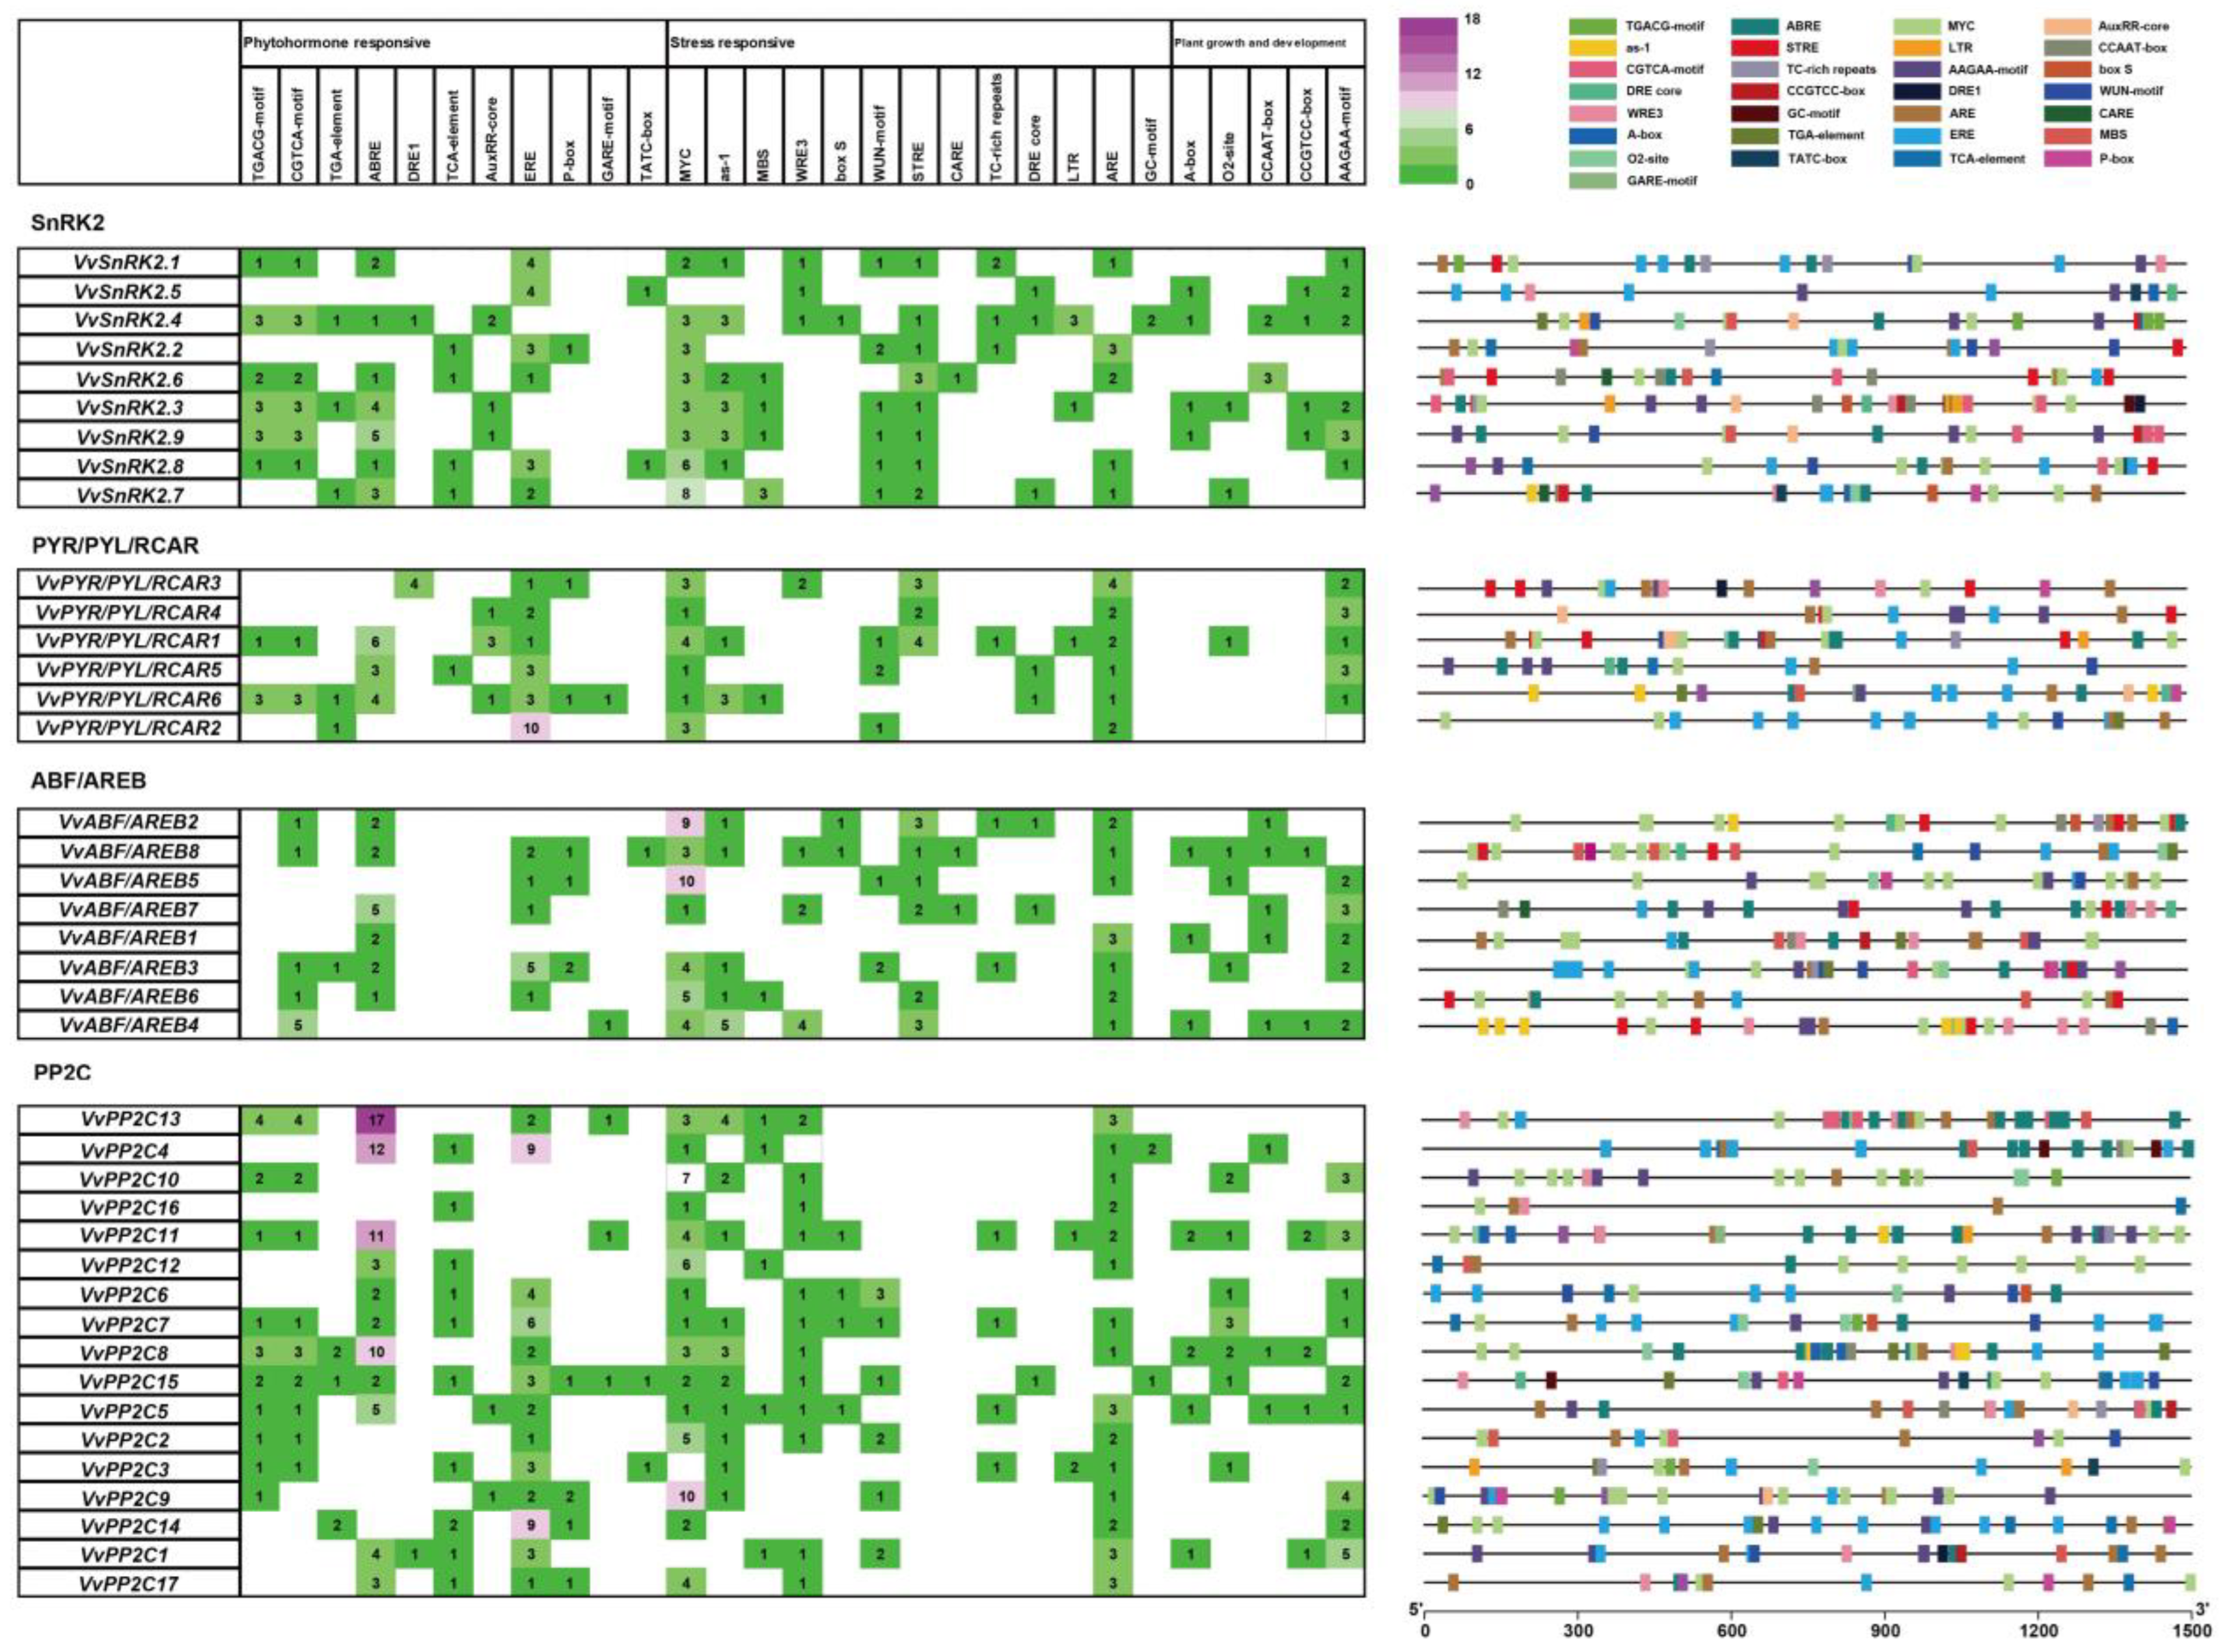
Promoters for the majority of grapevine APGs were seen to contain many cis-regulatory elements that were associated with stress-related gene regulation (Figure 4). The most common of these included response elements to ABA (ABRE), ethylene (ERE), wounding (WRE3), stress (STRE), anoxia (ARE), as well as binding elements of MYC and seed-specific expression (AAGAA-motif). These stress-related cis-acting elements were mainly related to anaerobic, defensive, drought, low temperature, trauma, and other stresses, indicating that APGs may play a role in stress tolerance.

3.5. Growth of Leaves and Berry under Weak Light Stress

The phenotypes of grape leaf growth and berry development under different light conditions are shown in Figure 5. Over time (0–42 days), the color of the shaded leaves darkened, although a small amount of yellow macula appeared on T2 leaves after 35 days. Due to the fact that this study was affected by local natural changes in the weather, some data were affected. However, the growth of the grape leaves and berries under low light stress still showed some trends. Leaf net photosynthesis (Pn) was found to be highest in the control (CK) and was reduced with decreasing light intensity (Table S5). The intercellular CO2 (Ci) under control conditions varied little throughout 0–42 days, while Ci under the lowest light intensity (T2) was significantly higher at 28–42 days than that in the control. Conversely, the Ci of T1 leaves was significantly lower than that of CK during this period. Interestingly, we observed that Gs and Tr were affected by weak light stress with the same trend as Pn. Fv/Fm and Y(II) under low-intensity weak light stress were greater than that under high-intensity weak light stress at an early stage; however, the opposite was observed in a later stage (Table S6). The photochemical quenching coefficient of this treatment group was significantly lower than that of the control group under weak light stress. However, the changing trend of qP and qN was the opposite under weak light stress. In conclusion, it could be seen that the normal growth of leaves was limited under weak light stress.
After grape berries reached the first expansion stage, the vines were treated with low light stress of different intensities until their maturation. The growth rate of berries was reduced under reduced light conditions, and berry ripening was delayed at the lowest light intensity (Table S7). The transverse diameters and weights of the grape berries in T2 conditions were significantly different from those grown under the control and T1 treatments. Stronger shading intensities tended to promote a longer transverse diameter and lower berry weight. However, berry length was not affected by shading. Shade significantly affected the total soluble solids (TSS) and total acidity (TA). Relative to other treatments, the T2 group displayed the lowest TSS with the highest TA. Shaded grapes generally displayed lower CIRG. After 42 days, T2 grapes remained green, whereas the grapes from the other groups were red. The grapes of the T1 group were similar to the control grapes.

3.6. Expression Pattern of APGs under Low Light Treatments

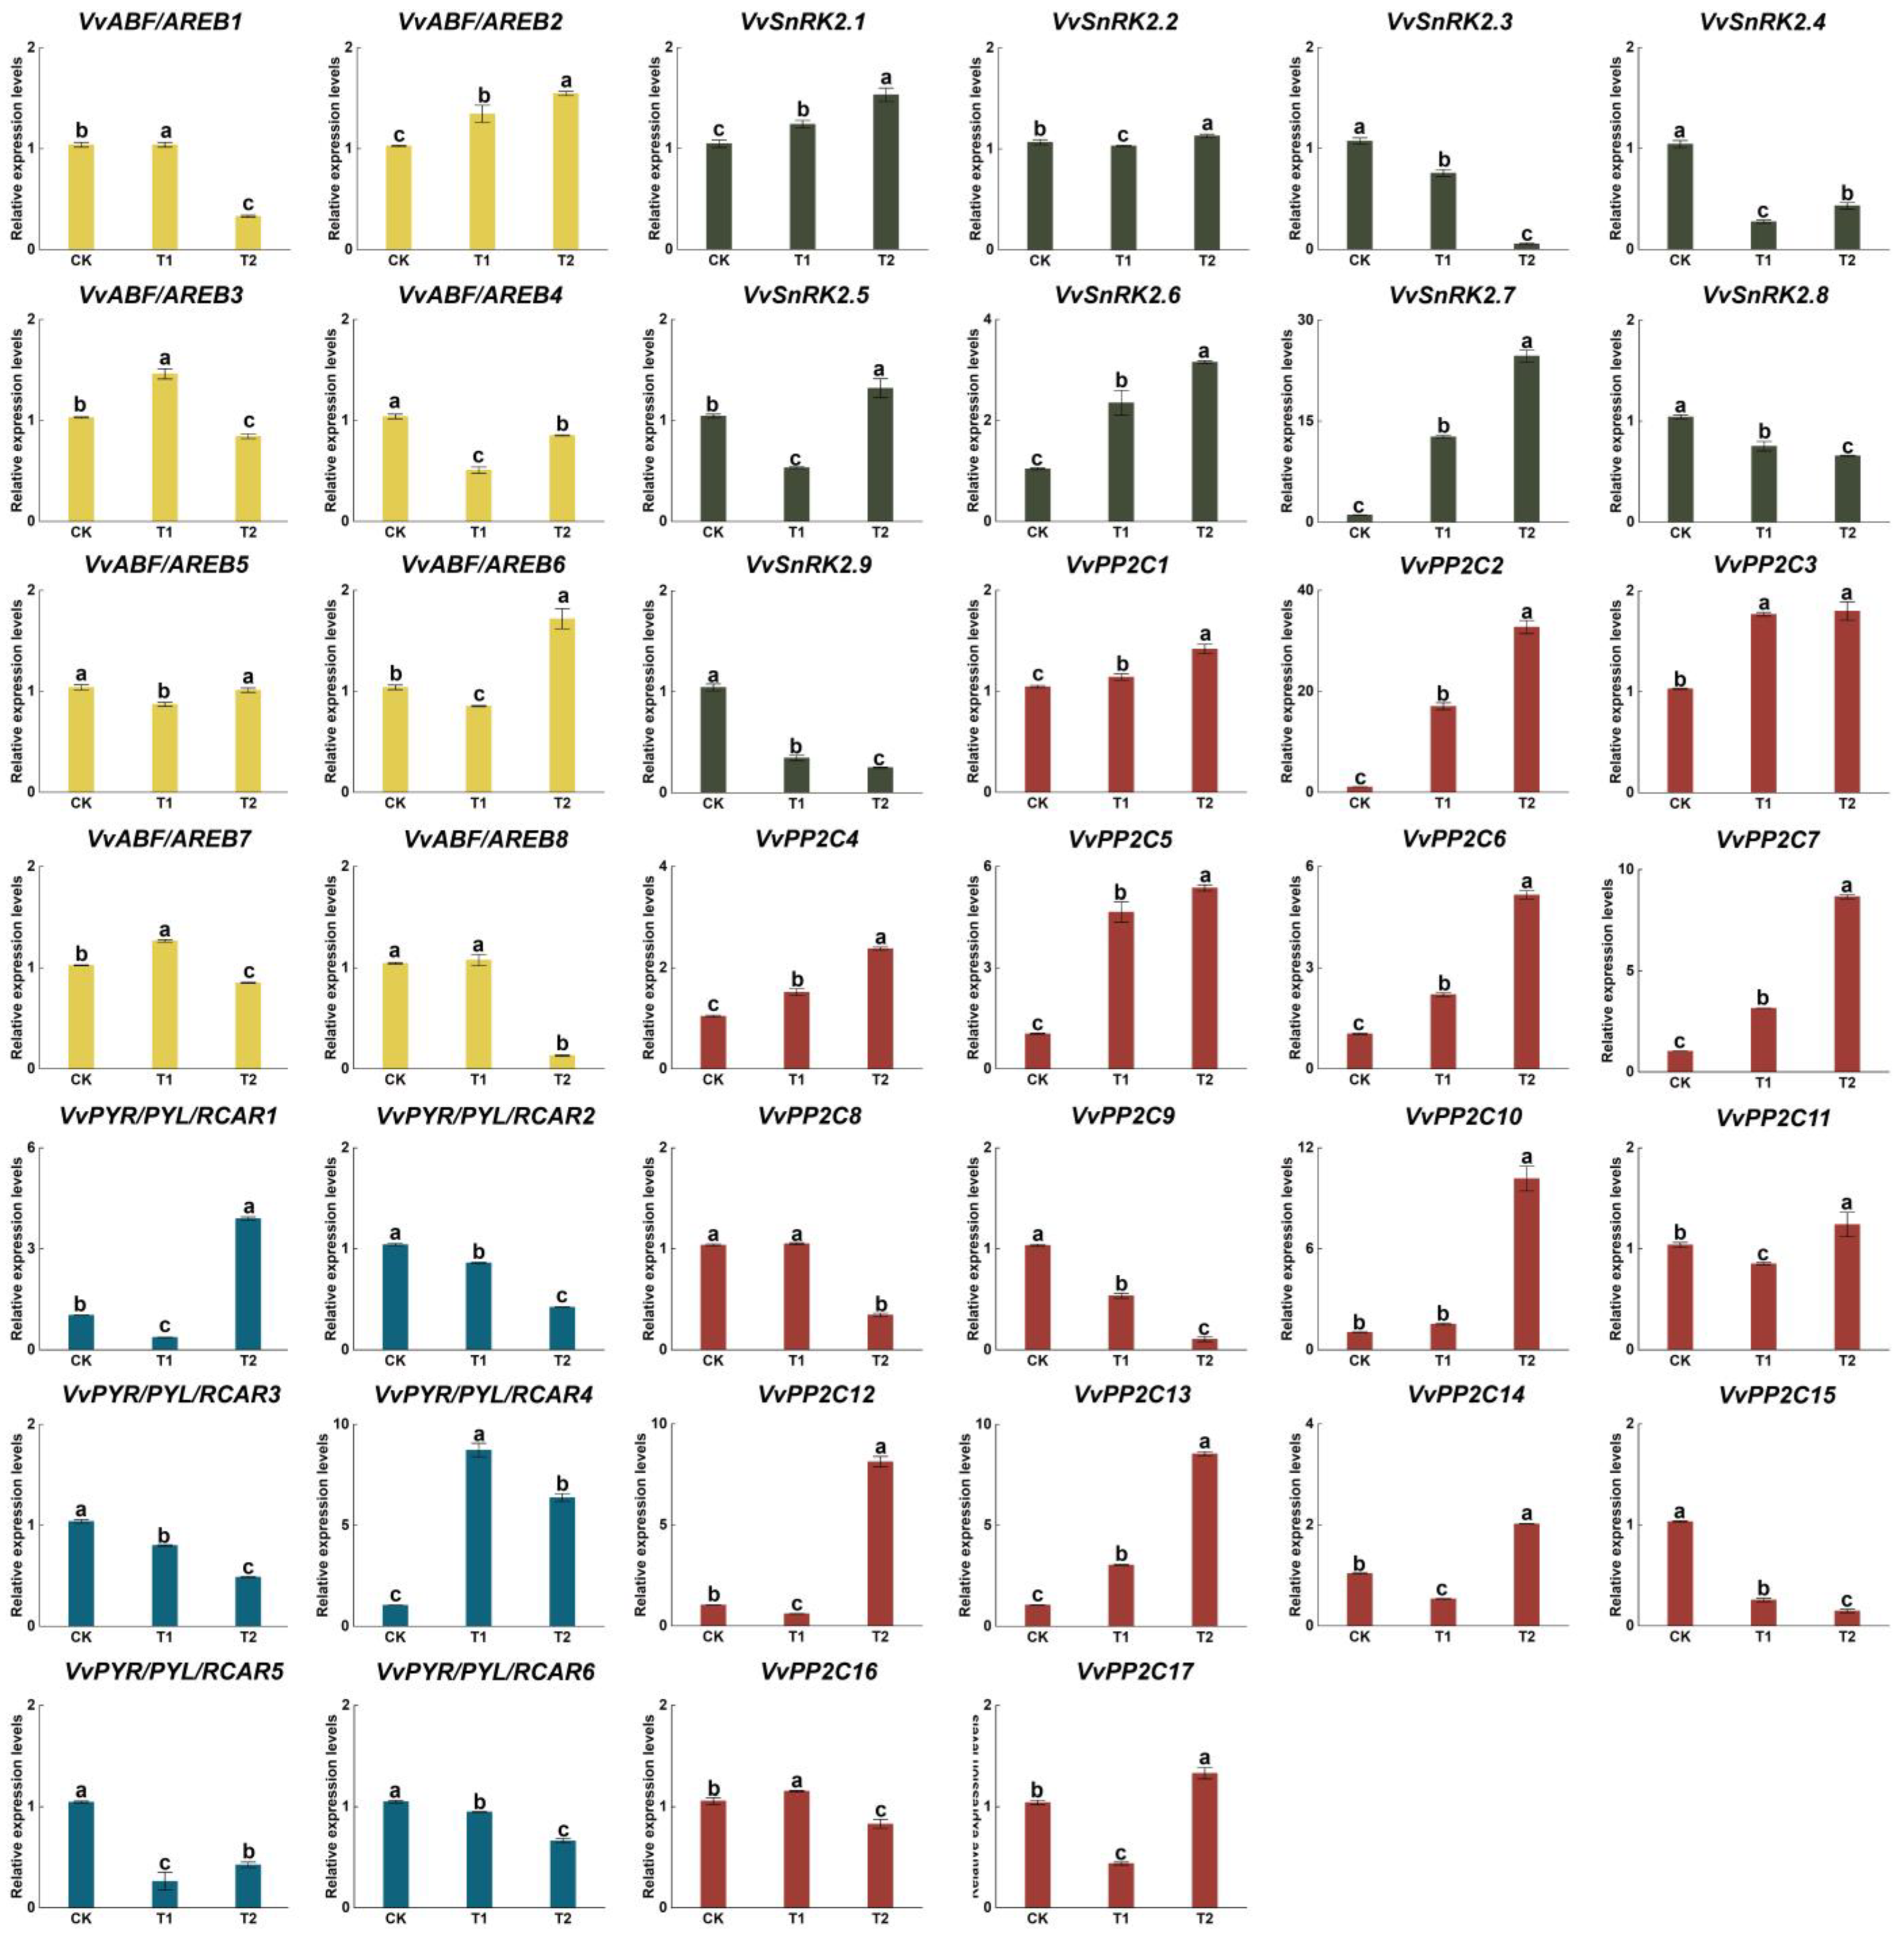
The impact of 42 days of weak light stress on APGs was studied by qPCR analysis (Figure 6). Of the 40 selected genes, 16 (4 SnRKs, 4 PYR/PYL/RCARs, 4 ABF/AREBs, and 4 PP2Cs) were markedly downregulated. In the SnRK2 family, the expressions of VvSnRK2.1, VvSnRK2.6, and VvSnRK2.7 increased with lower light availability. Similarly, VvABF/AREB2, VvABF/AREB6, and VvPYR/PYL/RCAR1 displayed an increased expression that was proportional to the degree of low light stress (T2 > T1 > CK). For the PP2C family, the expression level of most genes (13/17) displayed sensitivity to weak light stress, and the later changes in expression occurred under S2 rather than CK and T1 conditions.

3.7. Expression Pattern of APGs under ABA Treatments

To investigate the sensitivity of APGs to ABA, the changes in their expression levels were determined by PCR after exogenous ABA treatment (Figure 7). VvABF/AREB6, VvABF/AREB7, VvSnRK2.8, and VvPP2C4 all displayed an up-regulation, reaching peak expression levels 6 and 8 h after ABA application and confirming their classification as APGs. Compared to other APGs, VvSnRK2.7 and VvPP2C10 were less sensitive to ABA treatment. Notably, the expression levels of nineteen APGs were all markedly increased at 5 min after treatment, especially VvABF/AREB8, VvPYR/PYL/RCAR2, VvPYR/PYL/RCAR5, VvPYR/PYL/RCAR6, VvSnRK2.1, VvPP2C4, VvPP2C7, and VvPP2C8.

4. Discussion

ABA plays an important role in many stages of the plant life cycle and in the response of plants to various environmental stresses [42]. In recent years, the ABA signaling pathway and its functions under stress response have attracted increasing attention [43]. However, the role of the grapevine ABA pathway in weak light stress responses remains unclear. In this study, we selected 40 APGs in the grapevine by their homology to Arabidopsis members of four key gene families with functions in the ABA signaling pathway (SnRK2, PYR/PYL/RCAR, ABF/AREB, PP2C). The phylogenetic analysis of each grapevine gene family indicated that these gene structures differed substantially from that of their respective family members, lacking several conserved sequence motifs (Figure 2). Domain acquisition and loss drove neo-functionalizations and the expansion of gene families; therefore, the altered functions in these variant genes could now be examined for their potentially novel contribution to the ABA signaling pathway [44].
The cellular location of plant proteins provided essential clues to their function [45]. As expected from their known functions, grapevine members of the PP2C and ABF/AREB families were predicted to be targeted to the plasmalemma and nucleus, respectively. The six PYR/PYL/RCARs members were predicted to be targeted to either/or the cytoplasm, Golgi, mitochondria, or the extracellular domain, suggesting that grapevine PYR/PYL/RCAR members experienced functions in various cellular environments. In addition, our phylogenetic analysis of the four gene families indicated that VvSnRK2.7 showed some similarity with the ABF/AREB gene family. The predicted subcellular location for VvSnRK2.7 and members of the ABF/AREB gene family were inconsistent with the prediction results of their own SnRK2 gene family members; therefore, so speculated that the structure of this gene had an impact on the location of gene expression (Figure S1 and Table S4).
In this study, we described the chromosomal locations of 40 APGs, and the results showed that they were distributed on 15 chromosomes (Figure 3). In several cases, the genes of one family were clustered together with members of other gene families, such as VvSnRK2.1 and VvPYR/PYL/RCAR1, which could indicate their close evolutionary relationship [28]. In addition, this study also used collinearity analysis to understand the evolutionary relationship between genes. The expansion of gene families and the diversification of gene functions driven by tandem and segmental gene repeats were the foundation of many biological studies. The accurate analysis of tandem repeats and the segmental repeats of genes could help us infer the origin of new genes [46]. Interestingly, we found that all genes with collinear relationships were also clustered together in their evolutionary tree, such as VvPP2C2 and VvPP2C15, which further demonstrated the accuracy of clustering results (Figure 3b). The analysis of these grapevine genes indicated that there were 10 pairs of genes derived from segmental duplication events, which displayed Ka/Ks ratios of <1, indicating that they underwent purification selection [28,47].
Today, grapes are mainly grown in controlled environments, in which light intensity is an important parameter. Light intensity has a profound impact on plants through its ability to activate or inactivate physiological reactions [48]. In this study, the effects of weak light stress on grapevine growth were investigated by observing the leaf and berry status at different stages of grape development and under different levels of low light stress. We found that Pn, Fv/Fm, Y(II), and qP of the leaves decreased significantly under low light, from which it was difficult to recover in the later stages (Figure 5). This is often accompanied by a decrease in the activity of photosynthetic enzymes and enzymes associated with the elimination of reactive oxygen species [49]. The weak light treatment was shown to directly affect the photosynthetic and electron transfer activity, reduce the photosynthetic conversion efficiency, and significantly reduce the photochemical reactivity, ultimately resulting in a significant reduction in net photosynthetic efficiency. This showed that weak light stress not only limited the photosynthesis of leaves but also led to the occurrence of light inhibition, and long-term weak light stress caused damage to the photosynthetic system. In addition, natural lighting conditions were most suitable for grape cultivation in Southern China.
The light environment is an important factor in the synthesis of anthocyanins. The accumulation of anthocyanins in the grape pericarp affects the berry coloring, which is commercially important for evaluating berry quality and its development [50]. However, the surface color of grapes is hard to characterize visually [39]. In this study, the CIRG index was determined by colorimetry, and it was found that weak light stress delayed the color transition in the berry pericarp (Figure 5a). In addition, the soluble solid content, quality, and size of T2 mature berries were significantly lower than those of T1 and the control. Together, the data indicated that weak light conditions delayed grape ripening with decreases in the berry quality.
Plants responded to abiotic stress by sensing external stimuli and then activating signaling pathways which induced targeted gene responses. An analysis of cis-elements that were present in the promoters of the 40 selected genes indicated that ABRE elements were widely present, suggesting these genes were transcriptionally regulated in response to a variety of stress conditions [51]. Other abundant cis elements indicated the regulation of these genes by ABA, GA, and SA, as well as light intensity, high temperature, and other stresses [52]. This revealed that the ABA signaling pathway in grapes could be co-regulated by the interplay of hormone and stress signaling pathways. Interestingly, we found that the expression of several APGs was modulated by exogenous ABA treatment, of which VvPYR/PYL/RCAR2, VvPP2C4, and VvPP2C8 displayed the highest ABA sensitivities and contained a large number of cis-regulatory elements, indicating that these genes could be key genes in the ABA signal pathway (Figure 4 and Figure 7).
In addition, the expression levels of many of these genes were significantly altered under suboptimal light conditions (Figure 6). Some genes that were phylogenetically clustered together also displayed similar expression patterns. Examples of this are the two similar PP2Cs, VvPP2C6 and VvPP2C7, and the close ABF/AREBs homologs, VvABF/AREB4 and VvABF/AREB5, indicating that genes with closer evolutionary relationships could have similar functions in response to weak light conditions, which has significance for subsequent research on the functions of gene family members (Figure 2). The expression levels of VvPP2Cs and VvSnRK2s were most significantly increased by weak light conditions, which is similar to their trend under temperature stress, indicating that most VvPP2Cs and VvSnRK2s have an important role in their grapevine response to stress [25].

5. Conclusions

In this study, a total of 40 grapevine APGs were identified. Bioinformatic approaches were used to examine their phylogeny, chromosomal localization, collinearity, and gene structure, including the content of conserved sequence motifs and cis-acting elements to provide an insight into their evolutionary origin and function. In addition, 5-year-old ‘Yinhong’ grapevines were subjected to weak light stress at different intensities, and the growth status of the berry and leaves were observed. The results showed that weak light stress reduced the accumulation of organic matter, delayed berry ripening, and damaged photosynthetic functions. By analyzing the expression patterns of APGs under weak light and ABA treatment, key genes in the ABA pathway response to weak light stress were identified. In conclusion, this study indicated that specific APGs were involved in the grapevine response to low light stress and could have scientific and practical significance in future work aimed at improving grapevine shade tolerance.

Supplementary Materials

The following are available online at https://www.mdpi.com/article/10.3390/horticulturae9070789/s1, Table S1: The primer sequences for qRT-PCR; Table S2: Sequence characteristics of key ABA signaling pathway genes in grapevine; Table S3: List of APG coding sequences in the grape; Table S4: Similarity of APGs between Grape and Arabidopsis; Table S5: The gas exchange parameters in leaves under weak light stress; Table S6: Changes of chlorophyll fluorescence parameter in leaves under weak light stress; Table S7: The effects of weak light stress on berry quality; Figure S1: Phylogenetic analysis of APGs in grapevine.

Author Contributions

T.X. and M.Z. participated in writing the manuscript; Y.W. was involved in the experimental design. T.X., M.Z., T.C., L.G., L.H., J.Y. and H.S. were involved in the collection and analysis of data. All authors have read and agreed to the published version of the manuscript.

Funding

This research was funded by 2025 Major Science and Technology Innovation Special Project of Ningbo (2019B10015), Key Research and Development Program of Zhejiang Province (2021C02053) and Zhejiang Provincial Department of Education Science Research Project (Y202250321).

Institutional Review Board Statement

Not applicable.

Informed Consent Statement

Not applicable.

Data Availability Statement

Not applicable.

Conflicts of Interest

The authors declare that they have no conflict of interest.

References

  1. Zhang, B.; Zhang, H.; Jing, Q.; Wang, J. Light pollution on the growth, physiology and chlorophyll fluorescence response of landscape plant perennial ryegrass (Lolium perenne L.). Ecol. Indic. 2020, 115, 106448. [Google Scholar] [CrossRef]
  2. Velez-Ramirez, A.I.; van Ieperen, W.; Vreugdenhil, D.; Millenaar, F.F. Plants under continuous light. Trends Plant Sci. 2011, 16, 310–318. [Google Scholar] [CrossRef] [PubMed] [Green Version]
  3. Yang, H.; Li, Y.; Qiao, Y.; Sun, H.; Liu, W.; Qiao, W.; Li, W.; Liu, M.; Dong, B. Low light stress promotes new tiller regeneration by changing source-sink relationship and activating expression of expansin genes in wheat. Plant Cell Environ. 2023, 46, 1562–1581. [Google Scholar] [CrossRef] [PubMed]
  4. Shi, K.; Gu, X.; Lu, W.; Lu, D. Effects of weak-light stress during grain filling on the physicochemical properties of normal maize starch. Carbohydr. Polym. 2018, 202, 47–55. [Google Scholar] [CrossRef] [PubMed]
  5. Li, N.J.; Shahid, M.; Zong, X.F.; Lv, J.; Wang, D.B.; Saleem, A.; Anjum, S.A.; Wang, S.G. Exogenously applied 5-aminolevulinic acid mediated physiochemical regulations ameliorate weak light stress in tobacco seedlings. Bangladesh J. Bot. 2019, 48, 353–358. [Google Scholar] [CrossRef]
  6. Wang, M.; Jiang, W.; Yu, H. Effects of Exogenous Epibrassinolide on Photosynthetic Characteristics in Tomato (Lycopersicon esculentum Mill) Seedlings under Weak Light Stress. J. Agric. Food Chem. 2010, 58, 3642–3645. [Google Scholar] [CrossRef] [PubMed]
  7. Lau, O.S.; Deng, X.W. Plant hormone signaling lightens up: Integrators of light and hormones. Curr. Opin. Plant Biol. 2010, 13, 571–577. [Google Scholar] [CrossRef] [PubMed]
  8. De Wit, M.; Galvão, V.C.; Fankhauser, C. Light-Mediated Hormonal Regulation of Plant Growth and Development. Annu. Rev. Plant Biol. 2016, 67, 513–537. [Google Scholar] [CrossRef]
  9. Shi, Y.; Ke, X.; Yang, X.; Liu, Y.; Hou, X. Plants response to light stress. J. Genet. Genom. 2022, 49, 735–747. [Google Scholar] [CrossRef]
  10. Verma, V.; Ravindran, P.; Kumar, P.P. Plant hormone-mediated regulation of stress responses. BMC Plant Biol. 2016, 16, 86. [Google Scholar] [CrossRef] [Green Version]
  11. Jia, H.; Lu, C. Effects of abscisic acid on photoinhibition in maize plants. Plant Sci. 2003, 165, 1403–1410. [Google Scholar] [CrossRef]
  12. Zhao, H.; Wu, C.; Yan, Y.; Tie, W.; Ding, Z.; Liu, G.; Yan, W.; Li, Y.; Wang, W.; Peng, M.; et al. Genomic analysis of the core components of ABA signaling reveals their possible role in abiotic stress response in cassava. Environ. Exp. Bot. 2019, 167, 103855. [Google Scholar] [CrossRef]
  13. Boneh, U.; Biton, I.; Schwartz, A.; Ben-Ari, G. Characterization of the ABA signal transduction pathway in Vitis vinifera. Plant Sci. 2012, 187, 89–96. [Google Scholar] [CrossRef] [PubMed]
  14. Hauser, F.; Waadt, R.; Schroeder, J.I. Evolution of Abscisic Acid Synthesis and Signaling Mechanisms. Curr. Biol. 2011, 21, R346–R355. [Google Scholar] [CrossRef] [PubMed] [Green Version]
  15. Iyer, L.M.; Koonin, E.V.; Aravind, L. Adaptations of the helix-grip fold for ligand binding and catalysis in the START domain superfamily. Proteins Struct. Funct. Bioinform. 2001, 43, 134–144. [Google Scholar] [CrossRef]
  16. Schweighofer, A.; Meskiene, I. Phosphatases in plants. Methods Mol. Biol. 2015, 1306, 25–46. [Google Scholar] [CrossRef] [PubMed]
  17. Hirayama, T.; Shinozaki, K. Perception and transduction of abscisic acid signals: Keys to the function of the versatile plant hormone ABA. Trends Plant Sci. 2007, 12, 343–351. [Google Scholar] [CrossRef]
  18. Yoshida, R.; Umezawa, T.; Mizoguchi, T.; Takahashi, S.; Takahashi, F.; Shinozaki, K. The Regulatory Domain of SRK2E/OST1/SnRK2.6 Interacts with ABI1 and Integrates Abscisic Acid (ABA) and Osmotic Stress Signals Controlling Stomatal Closure in Arabidopsis*. J. Biol. Chem. 2006, 281, 5310–5318. [Google Scholar] [CrossRef] [Green Version]
  19. Yang, W.; Zhang, W.; Wang, X. Post-translational control of ABA signalling: The roles of protein phosphorylation and ubiquitination. Plant Biotechnol. J. 2017, 15, 4–14. [Google Scholar] [CrossRef]
  20. Lei, P.; Wei, X.; Gao, R.; Huo, F.; Nie, X.; Tong, W.; Song, W. Genome-wide identification of PYL gene family in wheat: Evolution, expression and 3D structure analysis. Genomics 2021, 113, 854–866. [Google Scholar] [CrossRef]
  21. Chen, Y.; Feng, L.; Wei, N.; Liu, Z.-H.; Hu, S.; Li, X.-B. Overexpression of cotton PYL genes in Arabidopsis enhances the transgenic plant tolerance to drought stress. Plant Physiol. Biochem. 2017, 115, 229–238. [Google Scholar] [CrossRef] [PubMed]
  22. Yang, J.; Wang, M.; Zhou, S.; Xu, B.; Chen, P.; Ma, F.; Mao, K. The ABA receptor gene MdPYL9 confers tolerance to drought stress in transgenic apple (Malus domestica). Environ. Exp. Bot. 2022, 194, 104695. [Google Scholar] [CrossRef]
  23. Liu, T.; Zhou, T.; Lian, M.; Liu, T.; Hou, J.; Ijaz, R.; Song, B. Genome-Wide Identification and Characterization of the AREB/ABF/ABI5 Subfamily Members from Solanum tuberosum. Int. J. Mol. Sci. 2019, 20, 311. [Google Scholar] [CrossRef] [PubMed] [Green Version]
  24. Yong, X.; Zheng, T.; Zhuo, X.; Ahmad, S.; Li, L.; Li, P.; Yu, J.; Wang, J.; Cheng, T.; Zhang, Q. Genome-wide identification, characterisation, and evolution of ABF/AREB subfamily in nine Rosaceae species and expression analysis in mei (Prunus mume). PeerJ 2021, 9, e10785. [Google Scholar] [CrossRef]
  25. Zhang, R.; Wang, Y.; Li, S.; Yang, L.; Liang, Z. ABA signaling pathway genes and function during abiotic stress and berry ripening in Vitis vinifera. Gene 2021, 769, 145226. [Google Scholar] [CrossRef]
  26. Ren, C.; Kuang, Y.; Lin, Y.; Guo, Y.; Li, H.; Fan, P.; Li, S.; Liang, Z. Overexpression of grape ABA receptor gene VaPYL4 enhances tolerance to multiple abiotic stresses in Arabidopsis. BMC Plant Biol. 2022, 22, 271. [Google Scholar] [CrossRef]
  27. Nai, G.; Liang, G.; Ma, W.; Lu, S.; Li, Y.; Gou, H.; Guo, L.; Chen, B.; Mao, J. Overexpression VaPYL9 improves cold tolerance in tomato by regulating key genes in hormone signaling and antioxidant enzyme. BMC Plant Biol. 2022, 22, 344. [Google Scholar] [CrossRef]
  28. Xu, T.; Chen, T.C.; Zhang, T.Y.; Shen, L.Y.; Chen, Z.; Xu, Y.; Wu, Y.Y.; Yang, J. Genome-Wide Identification and Characterization of USP Gene Family in Grapes (Vitis vinifera L.). Horticulturae 2022, 8, 1024. [Google Scholar] [CrossRef]
  29. Altschul, S.F.; Gish, W.; Miller, W.; Myers, E.W.; Lipman, D.J. Basic local alignment search tool. J. Mol. Biol. 1990, 215, 403–410. [Google Scholar] [CrossRef]
  30. Tamura, K.; Stecher, G.; Peterson, D.; Filipski, A.; Kumar, S. MEGA6: Molecular Evolutionary Genetics Analysis Version 6.0. Mol. Biol. Evol. 2013, 30, 2725–2729. [Google Scholar] [CrossRef] [Green Version]
  31. Chen, C.; Chen, H.; Zhang, Y.; Thomas, H.R.; Frank, M.H.; He, Y.; Xia, R. TBtools: An Integrative Toolkit Developed for Interactive Analyses of Big Biological Data. Mol. Plant 2020, 13, 1194–1202. [Google Scholar] [CrossRef] [PubMed]
  32. Voorrips, R.E. MapChart: Software for the graphical presentation of linkage maps and QTLs. J. Hered. 2002, 93, 77–78. [Google Scholar] [CrossRef] [Green Version]
  33. Wang, D.; Zhang, Y.; Zhang, Z.; Zhu, J.; Yu, J. KaKs_Calculator 2.0: A toolkit incorporating gamma-series methods and sliding window strategies. Genom. Proteom. Bioinform. 2010, 8, 77–80. [Google Scholar] [CrossRef] [PubMed] [Green Version]
  34. Koch, M.A.; Haubold, B.; Mitchell-Olds, T. Comparative Evolutionary Analysis of Chalcone Synthase and Alcohol Dehydrogenase Loci in Arabidopsis, Arabis, and Related Genera (Brassicaceae). Mol. Biol. Evol. 2000, 17, 1483–1498. [Google Scholar] [CrossRef] [PubMed] [Green Version]
  35. Wang, Y.; Tang, H.; Debarry, J.D.; Tan, X.; Li, J.; Wang, X.; Lee, T.H.; Jin, H.; Marler, B.; Guo, H.; et al. MCScanX: A toolkit for detection and evolutionary analysis of gene synteny and collinearity. Nucleic Acids Res. 2012, 40, e49. [Google Scholar] [CrossRef] [Green Version]
  36. Lescot, M.; Déhais, P.; Thijs, G.; Marchal, K.; Moreau, Y.; Van De Peer, Y.; Rouzé, P.; Rombauts, S. PlantCARE, a database of plant cis-acting regulatory elements and a portal to tools for in silico analysis of promoter sequences. Nucleic Acids Res. 2002, 30, 325–327. [Google Scholar] [CrossRef] [PubMed]
  37. Chen, T.; Xu, T.; Shen, L.; Zhang, T.; Wang, L.; Chen, Z.; Wu, Y.; Yang, J. Effects of Girdling and Foliar Fertilization with K on Physicochemical Parameters, Phenolic and Volatile Composition in ‘Hanxiangmi’ Table Grape. Horticulturae 2022, 8, 388. [Google Scholar] [CrossRef]
  38. Gao, J. Experimental Guidance for Plant Physiology; Higer Education Press: Beijing, China, 2006. [Google Scholar]
  39. Xu, C.; Yagiz, Y.; Zhao, L.; Simonne, A.; Lu, J.; Marshall, M.R. Fruit quality, nutraceutical and antimicrobial properties of 58 muscadine grape varieties (Vitis rotundifolia Michx.) grown in United States. Food Chem. 2017, 215, 149–156. [Google Scholar] [CrossRef]
  40. Livak, K.J.; Schmittgen, T.D. Analysis of relative gene expression data using real-time quantitative PCR and the 2−ΔΔCT Method. Methods 2001, 25, 402–408. [Google Scholar] [CrossRef]
  41. Guo, B.-B.; Li, J.-M.; Liu, X.; Qiao, X.; Musana, R.F.; Wang, P.; Zhang, S.-l.; Wu, J.-Y. Identification and expression analysis of the PbrMLO gene family in pear, and functional verification of PbrMLO23. J. Integr. Agric. 2021, 20, 2410–2423. [Google Scholar] [CrossRef]
  42. Xu, D.; Li, J.; Gangappa, S.N.; Hettiarachchi, C.; Lin, F.; Andersson, M.X.; Jiang, Y.; Deng, X.W.; Holm, M. Convergence of Light and ABA signaling on the ABI5 promoter. PLoS Genet. 2014, 10, e1004197. [Google Scholar] [CrossRef] [PubMed]
  43. Zhou, J.; An, F.; Sun, Y.; Guo, R.; Pan, L.; Wan, T.; Hao, Y.; Cai, Y. Genome-wide identification of the ABA receptor PYL gene family and expression analysis in Prunus avium L. Sci. Hortic. 2023, 313, 111919. [Google Scholar] [CrossRef]
  44. Tao, X.; Chengjie, C.; Chuhao, L.; Jiarou, L.; Chaoyang, L.; Yehua, H.J.B.G. Genome-wide investigation of WRKY gene family in pineapple: Evolution and expression profiles during development and stress. BMC Genom. 2018, 19, 490. [Google Scholar]
  45. Li, H.; Yue, M.; Jiang, L.; Liu, Y.; Zhang, N.; Liu, X.; Ye, Y.; Lin, X.; Zhang, Y.; Lin, Y.; et al. Genome-Wide Identification of Strawberry C2H2-ZFP C1-2i Subclass and the Potential Function of FaZAT10 in Abiotic Stress. Int. J. Mol. Sci. 2022, 23, 13079. [Google Scholar] [CrossRef]
  46. Xu, H.; Li, D.; Hao, Y.; Guo, X.; Lu, J.; Zhang, T. Genome-wide analysis of DGAT gene family in Perilla frutescens and functional characterization of PfDGAT2-2 and PfDGAT3-1 in Arabidopsis. Plant Sci. 2022, 324, 111426. [Google Scholar] [CrossRef]
  47. Safder, I.; Shao, G.; Sheng, Z.; Hu, P.; Tang, S. Identification and analysis of the structure, expression and nucleotide polymorphism of the GPAT gene family in rice. Plant Gene 2021, 26, 100290. [Google Scholar] [CrossRef]
  48. Zhang, Y.; Chen, C.; Jin, Z.; Yang, Z.; Li, Y. Leaf anatomy, photosynthesis, and chloroplast ultrastructure of Heptacodium miconioides seedlings reveal adaptation to light environment. Environ. Exp. Bot. 2022, 195, 104780. [Google Scholar] [CrossRef]
  49. Van Heerden, P.D.R.; KrÜGer, G.H.J.; Loveland, J.E.; Parry, M.A.J.; Foyer, C.H. Dark chilling imposes metabolic restrictions on photosynthesis in soybean: Dark chilling imposes restrictions on photosynthesis. Plant Cell Environ. 2003, 26, 323–337. [Google Scholar] [CrossRef] [Green Version]
  50. Li, H.; Bai, Y.; Yang, Y.; Zheng, H.; Xu, X.; Li, H.; Wang, W.; Tao, J. Transcriptomic analyses reveal light-regulated anthocyanin accumulation in ‘ZhongShan-HongYu’ grape berries. Sci. Hortic. 2023, 309, 111669. [Google Scholar] [CrossRef]
  51. Song, H.; Duan, Z.; Wang, Z.; Li, Y.; Wang, Y.; Li, C.; Mao, W.; Que, Q.; Chen, X.; Li, P. Genome-wide identification, expression pattern and subcellular localization analysis of the JAZ gene family in Toona ciliata. Ind. Crops Prod. 2022, 178, 114582. [Google Scholar] [CrossRef]
  52. Hu, L.; Wang, P.; Hao, Z.; Lu, Y.; Xue, G.; Cao, Z.; Qu, H.; Cheng, T.; Shi, J.; Chen, J. Gibberellin Oxidase Gene Family in L. chinense: Genome-Wide Identification and Gene Expression Analysis. Int. J. Mol. Sci. 2021, 22, 7167. [Google Scholar] [CrossRef] [PubMed]
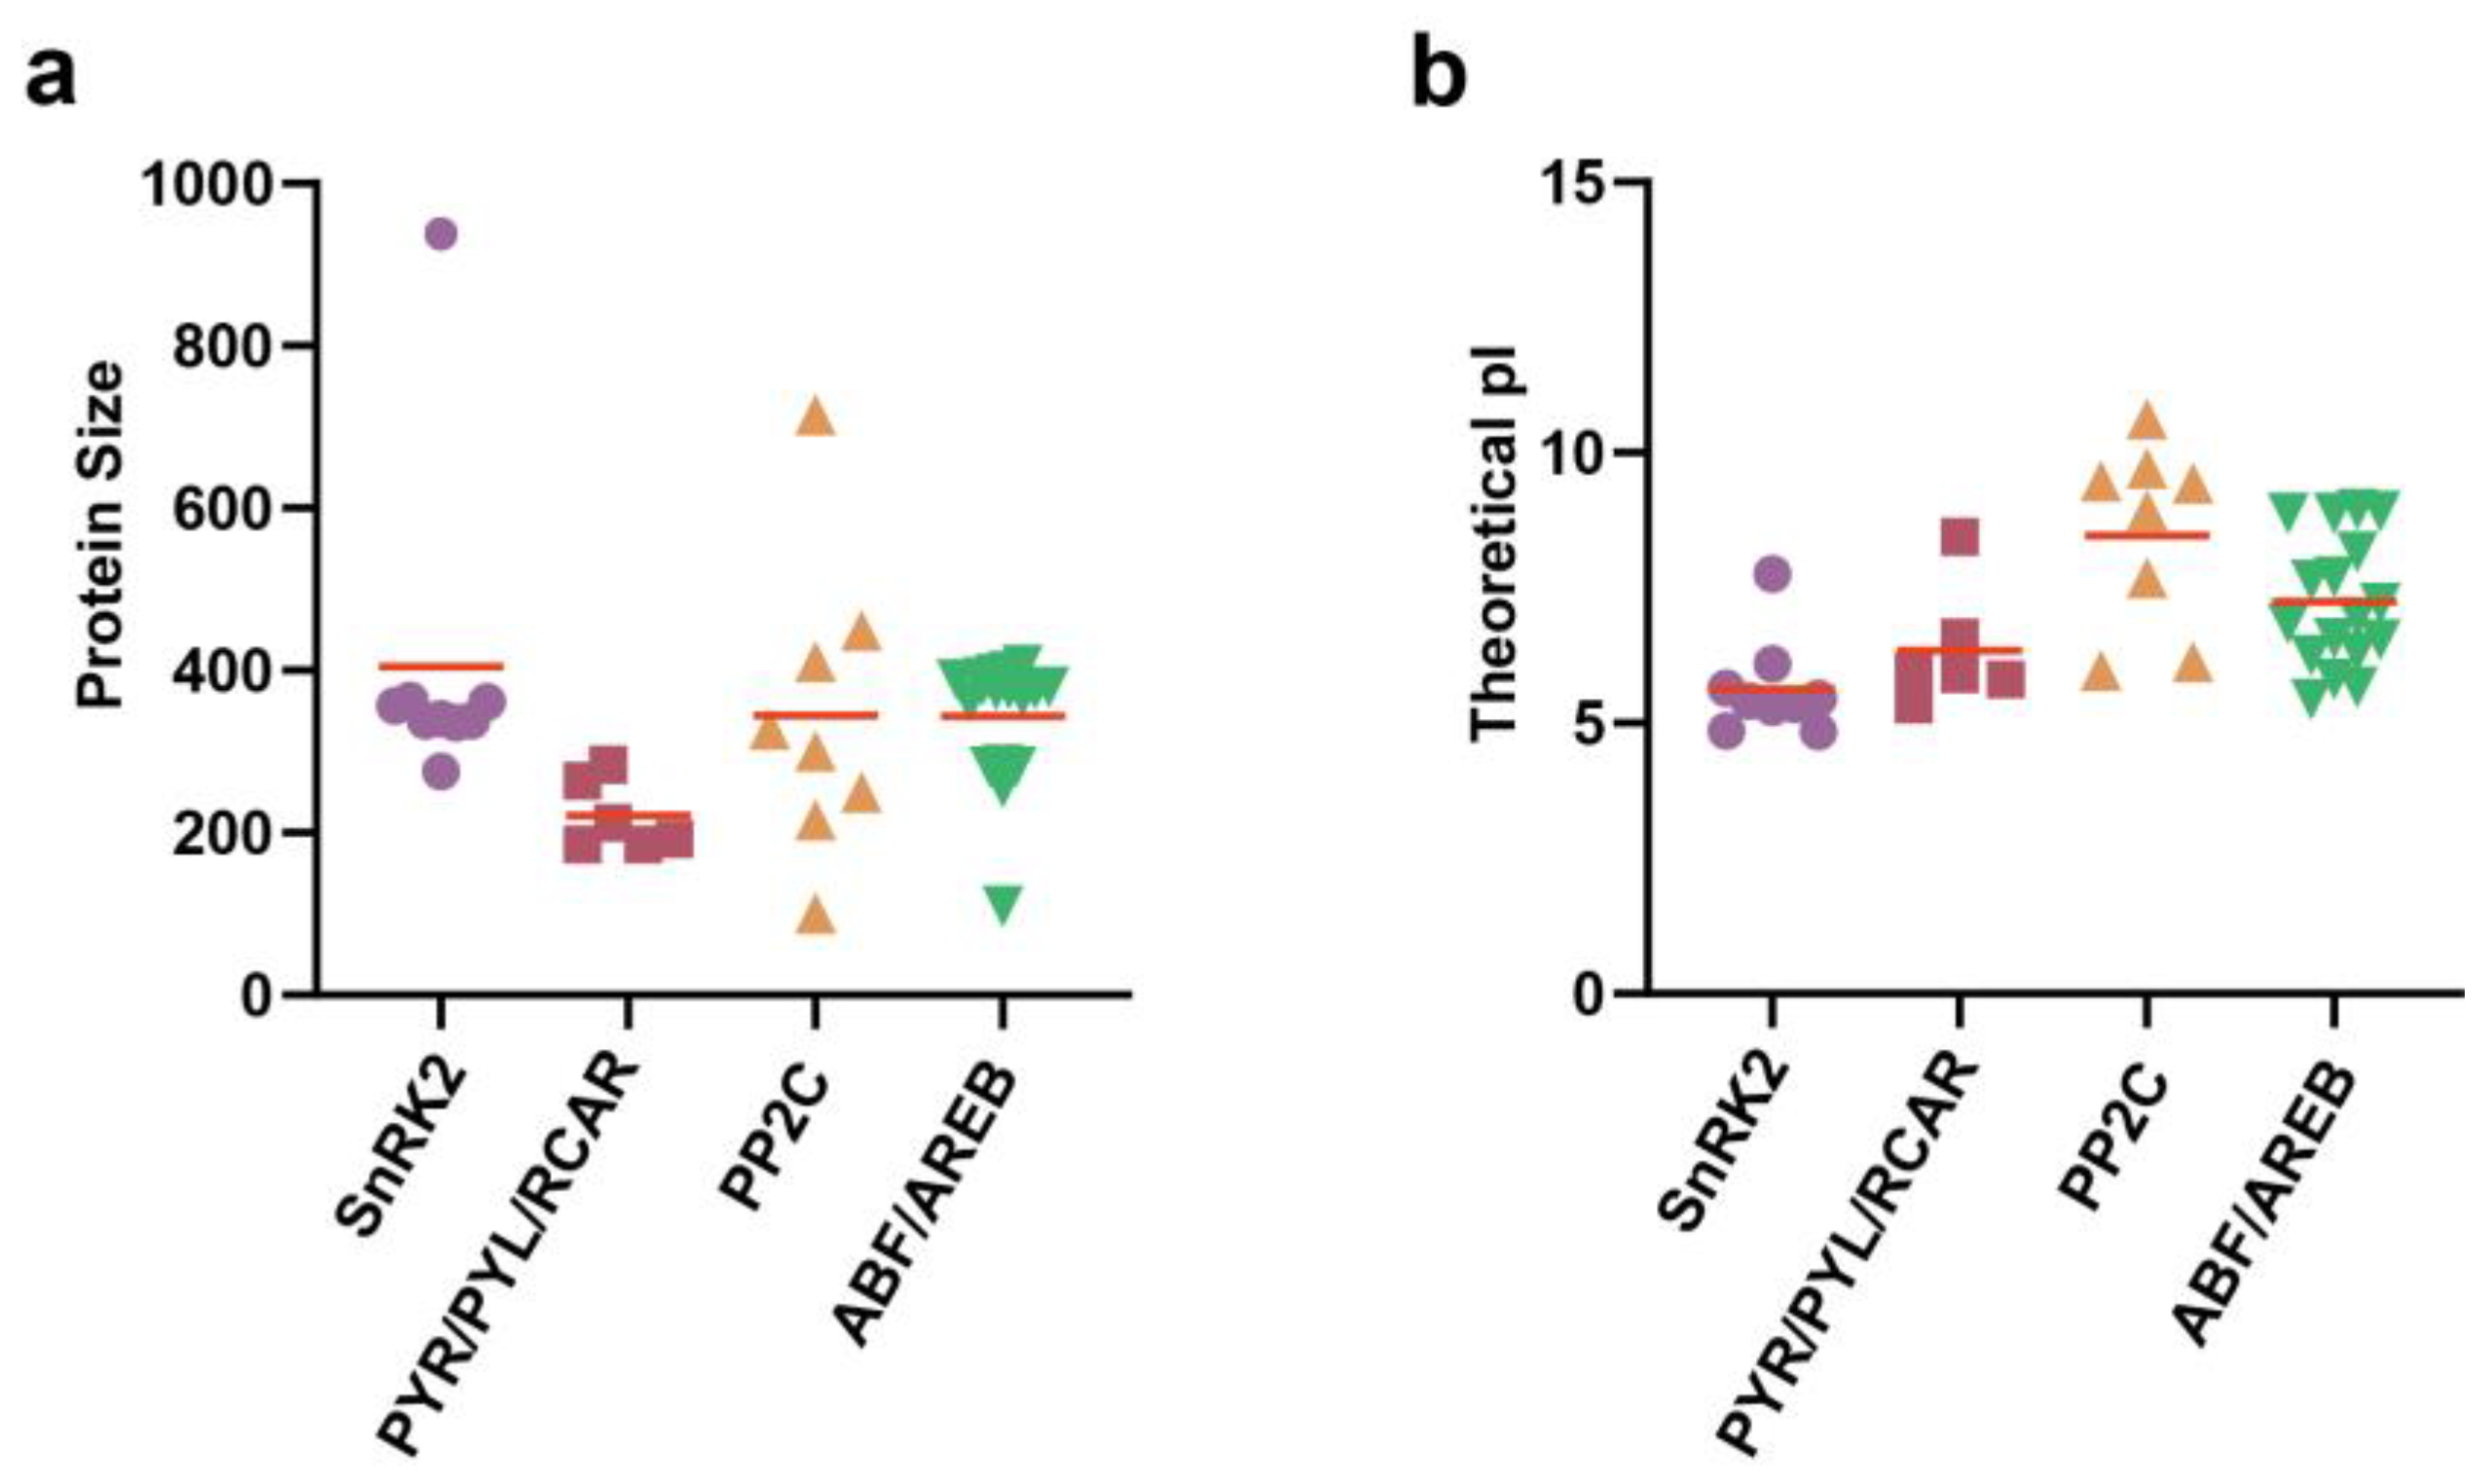
Figure 1. Molecular characterization of ABA signaling pathway proteins in grapevine. (a) Protein size (amino acid length); (b) Theoretical pI. The different families are represented by different colored symbols.
Horticulturae 09 00789 g001
Figure 2. Phylogenetic and conserved sequence motif analyses of APGs in the grapevine. The phylogenetic tree was constructed based on the full-length sequences of APG proteins by neighbor-joining methods using MEGA 6.0 software with 1000 bootstrap replicates. Amino acid motifs in the APG proteins (1–10) are represented by colored boxes. Black lines indicate relative protein lengths. The red font represents new grapevine APGs members.
Horticulturae 09 00789 g002
Figure 3. The chromosomal distribution (a), and collinearity analysis (b). Different chromosomes are shown in different colors. The number of chromosomes was displayed at the top of each vertical line. The inner gray lines denote all the collinearity relationships between chromosomal locations and the inner lines of different colored lines represent the collinearity relationships of different gene family members in the ABA pathway.
Horticulturae 09 00789 g003
Figure 4. Promoter analysis (0–1500 upstream from transcriptional start site) of APGs in grapevine. Different colored rectangles in the right image represent different cis-elements.
Horticulturae 09 00789 g004
Figure 5. Effects of different weak light stress levels on grape growth.
Horticulturae 09 00789 g005
Figure 6. Expression levels of APGs under weak light treatments of qRT-PCR. Different letters above the bars indicate a significant difference (p < 0.05). The expression levels of different gene family are displayed in different colors.
Horticulturae 09 00789 g006
Figure 7. Expression levels of APGs under ABA treatment by qRT-PCR. Different letters above the bars indicate a significant difference (p < 0.05). The expression levels of different gene family are displayed in different colors.
Horticulturae 09 00789 g007
Table 1. Calculation of Ka, Ks, and Ka/Ks and the divergent time of key gene families of the ABA signaling pathway.
Duplicated Gene PairsKaKsKa/KsDuplicated TypeDivergence-Time (Mya)
VvABF/AREB1/VvABF/AREB70.253.120.08Segmental104.12
VvPP2C2/VvPP2C50.132.110.06Segmental70.34
VvPP2C4/VvPP2C130.400.440.92Segmental14.55
VvPP2C5/VvPP2C150.731.810.40Segmental60.39
VvPP2C9/VvPP2C140.182.000.09Segmental66.75
VvPP2C12/VvPP2C160.151.500.10Segmental50.19
VvPP2C2/VvPP2C150.161.540.11Segmental51.41
VvPYR/PYL/RCAR5/VvPYR/PYL/RCAR60.181.910.09Segmental63.75
VvPYR/PYL/RCAR5/VvPYR/PYL/RCAR20.171.960.09Segmental65.27
VvSnRK2.6/VvSnRK2.30.121.050.12Segmental34.89
Disclaimer/Publisher’s Note: The statements, opinions and data contained in all publications are solely those of the individual author(s) and contributor(s) and not of MDPI and/or the editor(s). MDPI and/or the editor(s) disclaim responsibility for any injury to people or property resulting from any ideas, methods, instructions or products referred to in the content.