Article

Improved Genetic Map and Localization of Quantitative Trait Loci for Quality Traits in Auricularia heimuer

1
Engineering Research Center of Ministry of Education of China for Food and Medicine, Jilin Agricultural University, Changchun 130118, China
2
Guizhou Key Laboratory of Edible Fungi Breeding, Guizhou Academy of Agricultural Sciences, Guiyang 550006, China
3
College of Horticulture, Jilin Agricultural University, Changchun 130118, China
*
Author to whom correspondence should be addressed.
These authors contributed equally to this work.
Horticulturae 2023, 9(7), 763; https://doi.org/10.3390/horticulturae9070763
Submission received: 6 May 2023 / Revised: 23 June 2023 / Accepted: 28 June 2023 / Published: 2 July 2023

Abstract

:
Auricularia heimuer is among China’s most important edible mushrooms and is rich in gum. With the improvement of people’s quality of life, demand is increasing for high-quality and good-tasting food; thus, the texture of A. heimuer is the focus of increasing attention. In this study, we added extra markers to a previously constructed genetic linkage map to generate a high-density genetic linkage map of A. heimuer, resolved the attributes of substrate quality-related traits, and performed quantitative trait locus (QTL) localization. The original genetic linkage map was improved by adding two new linkage groups, merging seven linkage groups into three linkage groups, and increasing the average linkage distance and total linkage estimated length. We anchored the 142 scaffolds of the genome to the improved genetic linkage map. In total, 15 significant QTLs controlling four quality-related traits were detected. Gumminess and chewiness, and cohesiveness and resilience, were linked. Three genes controlled cohesiveness and resilience; one gene controlled gumminess and chewiness. In conclusion, this study lays the foundation for gene localization and chromosome assembly in A. heimuer, elucidation of the mechanism of substrate quality-related trait formation, and provides a basis for precision breeding of A. heimuer.

1. Introduction

Auricularia heimuer belongs to the Basidiomycota, Agaricomycetes, Auriculariales, and Auriculariaceae classes of fungi [1]. The fruiting body is rich in gelatin, soft, and tasty, and has a reputation as “the treasure of mushrooms” [2,3]. It is among the most important edible mushrooms in China. With the innovation of a cultivation method in which wood ear is grown under sunlight with intermittent misting, the commercial cultivation area of A. heimuer has spread from the north of China to further south. Under the guidance of the small mushroom industry, A. heimuer has been rapidly commercialized in China and its production has the potential to expand further [4,5]. In 2020, the total output reached 7,064,300 tons, the second-largest edible mushroom crop in China [6]. China accounts for more than 98% of global production, and A. heimuer is called the “national mushroom” [7]. With the improvement of people’s quality of life, consumers’ preferences are changing and, accordingly, the texture of A. heimuer is the focus of increasing attention.
However, the texture of the fruiting body of A. heimuer tends to be described with terms such as sticky, crunchy, and hard. Limited genetic information for fruiting body texture-related traits is currently available. Texture meters are also known as food materiality meters. The meter functions by mimicking the mechanical movements of the mouth as food is chewed and pressed. It records texture traits, such as hardness, springiness, cohesiveness, gumminess, chewiness, and resilience [8]. Me et al. determined that both the content of sawdust in the substrate and the cultivation mode significantly affect the texture of A. heimuer [9]. Peng et al. observed that the springiness and hardness of A. heimuer cultivated on logs were higher than those cultivated on a substitute material [10]. Zhang et al. reported significant differences in the hardness, springiness, cohesiveness, gumminess, chewiness, and resilience of A. auricula-judae [11]. Taken together, these findings reveal that culture substrate, human intervention, and external environment have important effects on the quality of A. heimuer, but the intrinsic mechanisms need to be further investigated.
Genetic linkage mapping is the basis for quantitative trait locus (QTL) localization, and can provide a reference for genome assembly and molecular marker-assisted breeding. Genetic linkage mapping and QTL localization for some traits have been performed for certain mushroom species, such as Lentinula edodes [12], Pleurotus cornucopiae [13], A. cornea [14], and Gloeostereum incarnatum [15]. A genetic linkage map for A. heimuer and QTL localization for major agronomic traits have been conducted [16], but the current linkage map density is low and cannot be used to precisely locate the genes that control agronomic traits.
Our research team initiated a project to improve A. heimuer cultivars in the National Edible Mushroom Industry Technology System and conduct long-term research on genetic breeding and efficient cultivation of A. heimuer [17]. We established an evaluation system for agronomic traits and molecular markers, and conducted research on the quantitative classification of agronomic traits of A. heimuer germplasm resources [18]. We also developed an innovative crossbreeding program and produced several new A. heimuer cultivars [19,20,21], completed the construction of a genetic linkage map, performed QTL localization for major agronomic traits of A. heimuer [16], and developed markers for fruiting body type for A. heimuer [22]. Therefore, in the present study, based on our previous results, the simple-sequence repeat (SSR) and insertion/deletion (InDel) markers developed from the genome assembly were used to increase the density of markers on the genetic linkage map. This allowed us to build a high-density map, anchor the genome to the genetic linkage map, optimize the genome assembly, and determine and localize QTLs for quality traits of A. heimuer. The results provide a foundation for improved quality-related breeding of A. heimuer.

2. Materials and Methods

2.1. Strain and Culture Conditions

All strains used in this research were obtained from the National Modern Agricultural Industry Technology System A. heimuer Variety Improvement Post. Strains A14 (Qihei No. 1, Jilin Agricultural University, Changchun, China) and A18 (Qihei No. 2, Jilin Agricultural University, Changchun, China), which show significant differences in quality traits, are widely cultivated strains in China. The mononuclear strains A14-5 and A18-119 were derived from A14 and A18, respectively. Strain 119-5 is a hybrid strain of 14-5 and 18-119, and the mapping population consisted of 138 mononuclear strains isolated from strain 119-5. The test cross line was formed by crossing the mapping population with A184-57 (a mononuclear strain of the wild strain A184 from Shandong Province, Jilin Agricultural University, Changchun, China), and the naming format was Cx. The culture medium was 78% sawdust, 20% bran, 1% gypsum, and 1% lime. Cultivation was conducted under the traditional mycelial culture and mushroom emergence conditions [8].

2.2. Nucleic Acid Extraction

Genomic DNA was extracted using a modified cetyltrimethylammonium bromide method [23], and total RNA was extracted using the TRIzol method [24]. Total RNA was reverse transcribed into cDNA using a reverse transcription kit (TRNA AT-311, TransGen Biotech, Beijing, China). The quality of DNA and RNA was determined using a NanoDrop 2000 UV-Vis spectrophotometer (Thermo Fisher Scientific, Waltham, MA, USA). Screening of genotyping primers was performed using DNA from the mononuclear strains A14-5 and A18-119. Genetic linkage maps were constructed using DNA from the mapping population. Fruiting bodies of A14 and A18 were used for transcriptome sequencing.

2.3. Synthesis of Primers

SciRoKo3.4 software was used to scan the entire genome of A14-5 to obtain microsatellite sequences [25]. SAMTOOLS (https://www.htslib.org (accessed on 18 August 2018)) was used to scan the whole genomes of A14-5 and 18-119 to obtain InDel sequences. The SSR and InDel primers were designed and synthesized based on the sequences flanking the InDel sequences. The primers were synthesized by Suzhou Genewiz Biotechnology Co., Ltd. (Suzhou, China).

2.4. PCR Amplification and Electrophoresis

The SSR-PCR and InDel-PCR reaction mixtures comprised 100 ng template DNA, 1 µL each of upstream and downstream primers, 10 µL of 2× PCR mix, and water added to make up the volume to 20 mL. Table S1 summarizes the SSR-PCR and InDel-PCR protocols. The SSR-PCR and InDel-PCR products amplified from the mapping parents and mapping populations were detected by 8% polyacrylamide gel electrophoresis.

2.5. Genotyping

PCR amplification and electrophoresis were used to screen the SSR and InDel primers to distinguish the genotypes of A14-5 and A18-119. The screened primers were then used to genotype the mapping populations (a band type matching with parent A14-5 was recorded as A, and a band type matching with parent A18-119 was recorded as B). The data were entered into an Excel spreadsheet and a chi-square test was performed to determine whether all markers followed the 1:1 segregation pattern.

2.6. High-Density Genetic Linkage Map Construction

Existing genetic maps can be improved by adding extra markers. In this study, based on the A. heimuer genetic map previously constructed [16], SSR markers were randomly added to increase the density of markers on the genetic linkage map. In addition, InDel markers located on different scaffolds to the SSR markers were screened to increase the proportion of the genome covered by the genetic linkage map.
The newly added markers were combined with the markers of the previously constructed linkage map of A. heimuer [16], and a linkage analysis was performed using the mapping software JoinMap 4.0 [26]. The mapping parameters were recombination rate = 0.4, logarithm of the odds (LOD) = 3.0, and Kosambi function. Using MapChart 2.2 software, we constructed a genetic linkage map.

2.7. Genetic Linkage Mapping Analysis

The estimated length (G) of the A. heimuer genetic linkage map was estimated using two methods. The first method estimated the length of each linkage cluster plus twice the average spacing of the map [27,28], and the second method estimated the length of each cluster multiplied by (m + 1)/(m − 1) and then summed to obtain the total length of the linkage map, where m is the number of markers in each cluster [29,30]. The final linkage map length is the average of the two methods. The formula c = (1 − e−2dn/G) × 100, where c (%) represents the percentage inclusion of a marker at a genetic distance of d cM, n is the number of markers, and G is the estimated length of the linkage map, was used to calculate the coverage of the map [31,32].

2.8. Genome Assembly Sequence Anchoring to Genetic Maps

Genome anchoring is the process of anchoring the scaffold to the genetic linkage map based on the marker loci on the genetic map and the location information on the assembly sequence. Suppose the scaffold contains markers from the genetic linkage map. In that case, we anchored the scaffold to the corresponding linkage group according to the position information of the marker on the linkage group. According to the anchoring information, the anchoring can be divided into forward, reverse, and uncertain direction anchoring. Positive anchoring is the same order of markers in the genetic linkage map and scaffold. Forward anchoring is the same order of markers in the genetic linkage map and scaffold. Reverse anchoring is the opposite order of markers in the genetic linkage map and scaffold. Uncertain direction anchoring is the same and the opposite, or the scaffold has only one marker for the uncertain direction anchoring [15].

2.9. Texture Profile Analysis (TPA)

Dried A. heimuer fruiting bodies were sieved, soaked in clean water for 12 h, cut into samples 2 cm long and 1 cm wide, and set aside. The TPA mode was used to perform a texture analysis of the rehydrated fruiting bodies. The measurement conditions were as follows: probe: P5; pretest speed: 1 mm/s; test speed: 2 mm/s; post-test speed: 1 mm/s; test distance: 2 mm; trigger force: Auto 5 g; reset model: Auto; data acquisition rate: 400 pps. Three replicates of each strain were tested.

2.10. TPA Data Analysis and QTL Localization

After TPA measurement of the rehydrated A. heimuer fruiting body, SPSS 17.0 software was used to count each trait index and calculate the mean and coefficient of variation (CV) for each index. The composite interval mapping (CIM) method implemented in WinQTL-Cart2.5 software was used to perform QTL mapping [33,34]. We sorted the trait data according to the reading and writing requirements of the software. The statistical rules of the data were as follows: the same marker genotype as A14-5 was represented by 2, and the same marker genotype as A18-119 was represented by 0. We set the background control of the software model to 6, the step frequency of mapping was 1 cM, the window size was 10 cM, and the number of control markers was 5. The LOD threshold of the trait was estimated by performing a permutation test (number of permutations = 1000), and the LOD threshold at the significance level of α = 0.05 in the genome was estimated. The confidence interval (CI) of a QTL is the interval of the position on the genetic linkage map corresponding to the values obtained by subtracting one LOD score on either side of the peak LOD of the QTL. We named the QTLs using the format “q + trait abbreviation + number of loci detected”, e.g., the first locus associated with hardness was named qh-1. The locations of the QTLs were plotted on the genetic linkage map using Map Chart v2.2 software [35].

2.11. Candidate Gene Prediction

Based on the whole-genome sequence of the A14-8 strain, we determined the candidate interval according to the physical location of the marker linked to the QTL locus. We determined the candidate gene-by-gene annotation and, further, according to differentially expressed genes in the parental transcriptome and the QTL localization’s additive effect.

3. Results

3.1. Construction of Genetic Linkage Map

We obtained 62 SSR primers and 105 InDel primers, which were subsequently used to construct genetic linkage maps. Combined with 130 SSR marker loci obtained by our research group in an early stage, the segregation of 297 marker loci was analyzed using the chi-square test. In total, 17 SSR markers and 6 InDel markers deviated from the Mendelian segregation ratio (p < 0.01; Table 1), of which 10 markers were biased toward the A14-5 allele and 13 markers were biased toward the A18-119 allele.
We constructed a molecular genetic linkage map of A. heimuer using the mapping software JoinMap 4.0 for the 297 loci. The total length of the map was 1091.4 cM, containing nine linkage groups with an average marker distance of 3.79 cM, the length of the linkage groups ranged from 82.504 to 166.0 cM with an average length of 121.3 cM, and the number of markers ranged from 12 to 63 with an average number of markers of 33. The number of intervals more significant than 10 cM ranged from 1 to 4, with a total of 23, and the most significant gap was in cluster 9 at 22.3 cM. The cluster with the longest distance across the map was cluster 1, with a length of 166.0 cM, the most significant number of loci (63), and the lowest average distance (2.635 cM). Zero to six segregation distortion markers were present in each cluster. We detected three segregation distortion regions (SDRs) distributed in the LG IV, LG V, and LG VI clusters (Figure 1, Table 1).

3.2. Comparative Analysis Genetic Linkage Map and Genomic Anchoring

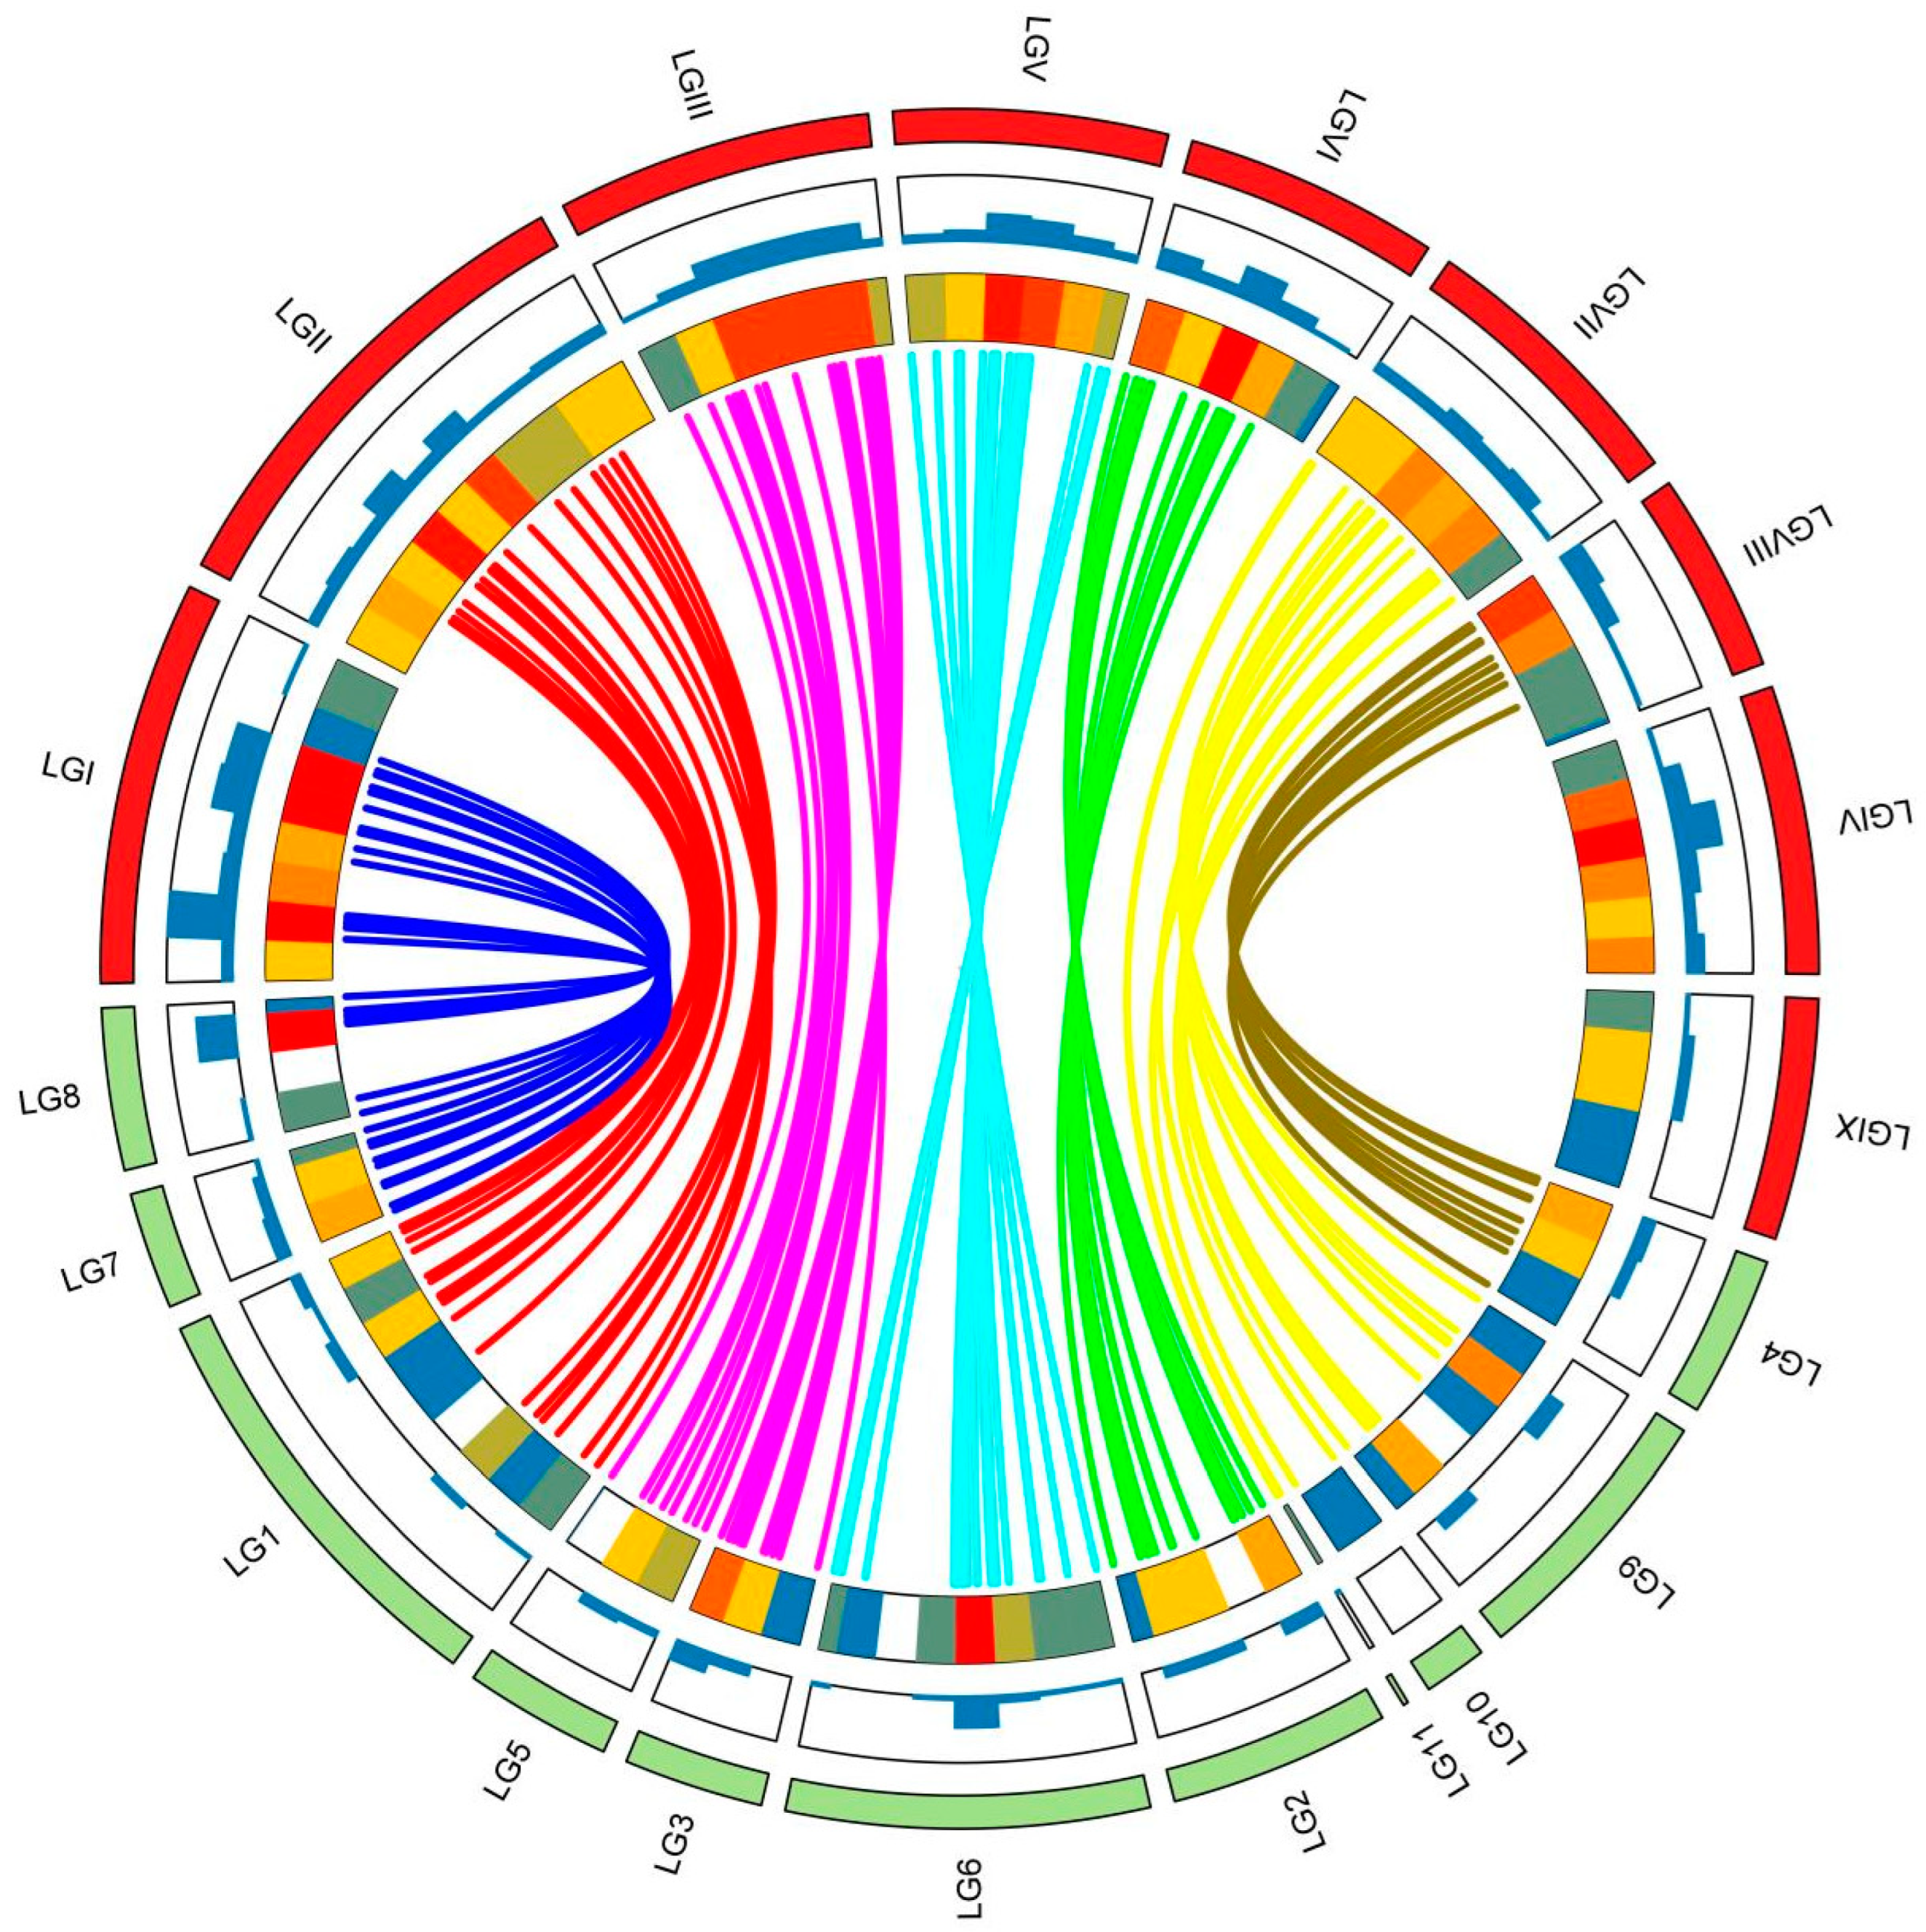
We compared the improved and original genetic linkage maps (Figure 2, Table 2). The new genetic linkage map contained nine linkage groups, two fewer than the original. However, LG IV and LG IX were new linkage groups. Each improved linkage group contained one or more original linkage groups. The average distance between linkage groups on the genetic linkage map decreased from 7.14 cM to 3.79 cM after improvement. The total estimated length of the genetic linkage map increased from 1018.4 cM to 1202.6 cM after improvement. Within 20 cM, 10 cM, and 5 cM, the coverage of markers was increased from 99%, 92%, and 72% to 100%, 99%, and 92%, respectively.
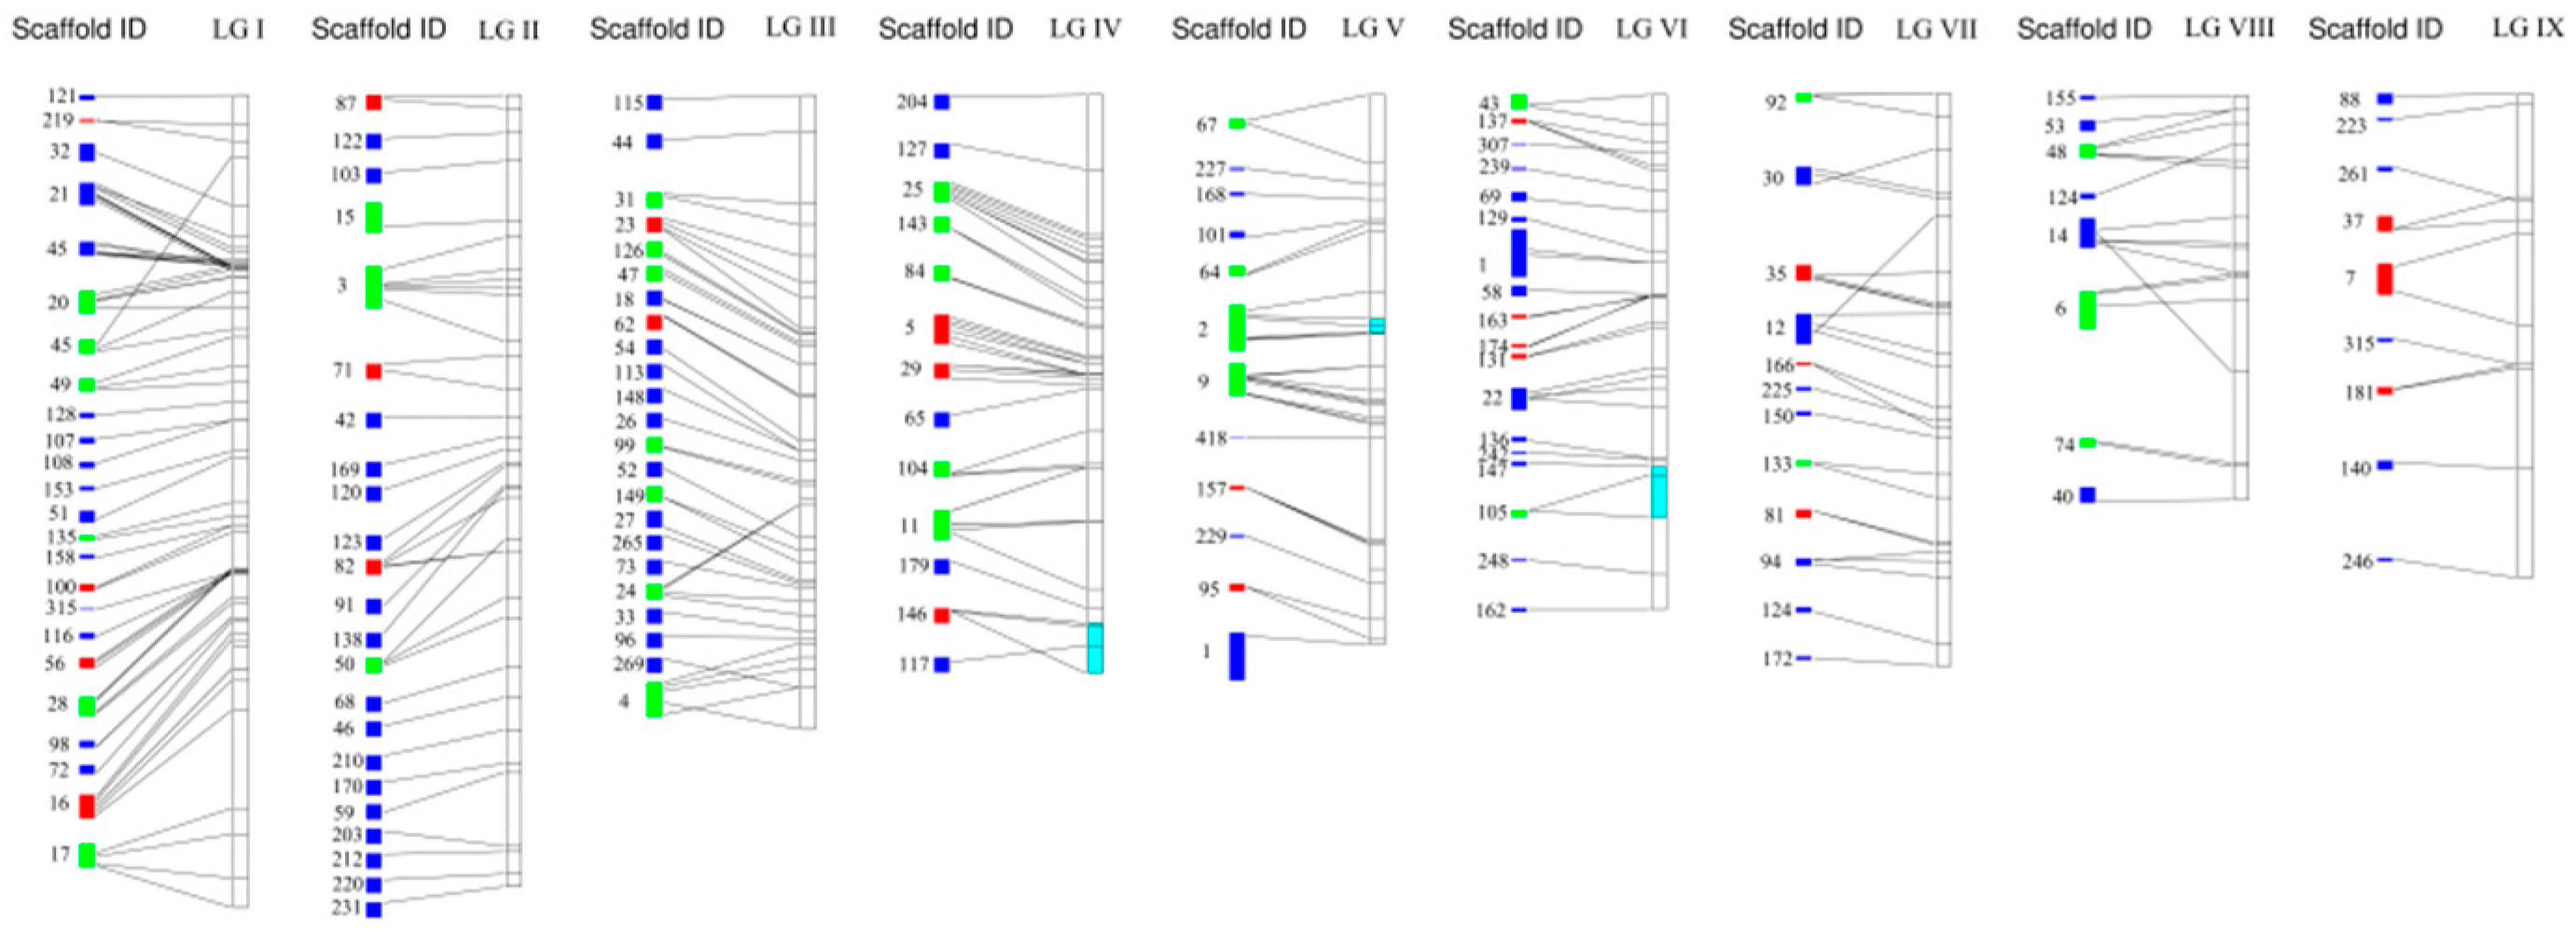
A total of 142 scaffolds were anchored in the genetic linkage map, with a size of 31.68 Mb, covering 73% of the genome. Among the nine linkage groups, the assembly sequence on LG I was the greatest (24 scaffolds), and the total base of the LG III assembly sequence was the largest (5.85 Mb). Among the 149 scaffolds, 24 were forward anchoring, 32 were reverse anchoring to the genetic linkage map, 87 were uncertain scaffold directions, and 4 scaffolds were present in two linkage groups, which were chimeric scaffolds: Scaffold1 (LG V and LG VI), Scaffold124 (LG VII and LG VIII), Scaffold248 (LG I and LG VI), and Scaffold315 (LG I and LG IX) (Figure 3).

3.3. Statistical Analysis of Quality-Related Traits of A. heimuer

We measured fruiting body quality-related traits of A. heimuer (hardness, springiness, cohesiveness, gumminess, chewiness, and resilience). The six traits showed continuous variation and were quantitative traits. The Kolmogorov–Smirnov test p-values were all greater than 0.05, indicating that the data for all traits conformed to a normal distribution (Figure 4). Descriptive statistics for the traits are summarized in Table 3. The mean hardness was 728.24 ± 20.83 g, with a distribution range of 190.44–1380.36 g and CV of 30%. The mean springiness was 0.87, with a distribution range of 0.74–0.95 and CV of 3%. The mean cohesiveness was 0.75 ± 0.01, with a distribution range of 0.49–0.94 and CV of 13%. The mean gumminess was 521 ± 17.36, with a distribution range of 137.40–1093.77 and CV of 35%. The mean chewability was 455.33 ± 15.41, with a distribution range of 105.96–995.82 and CV of 35%. The mean resilience was 1 ± 0.03 with a distribution range of 0.33–1.67 and CV of 33%.

3.4. QTL Mapping Analysis of Fruiting Body Quality-Related Traits of A. heimuer

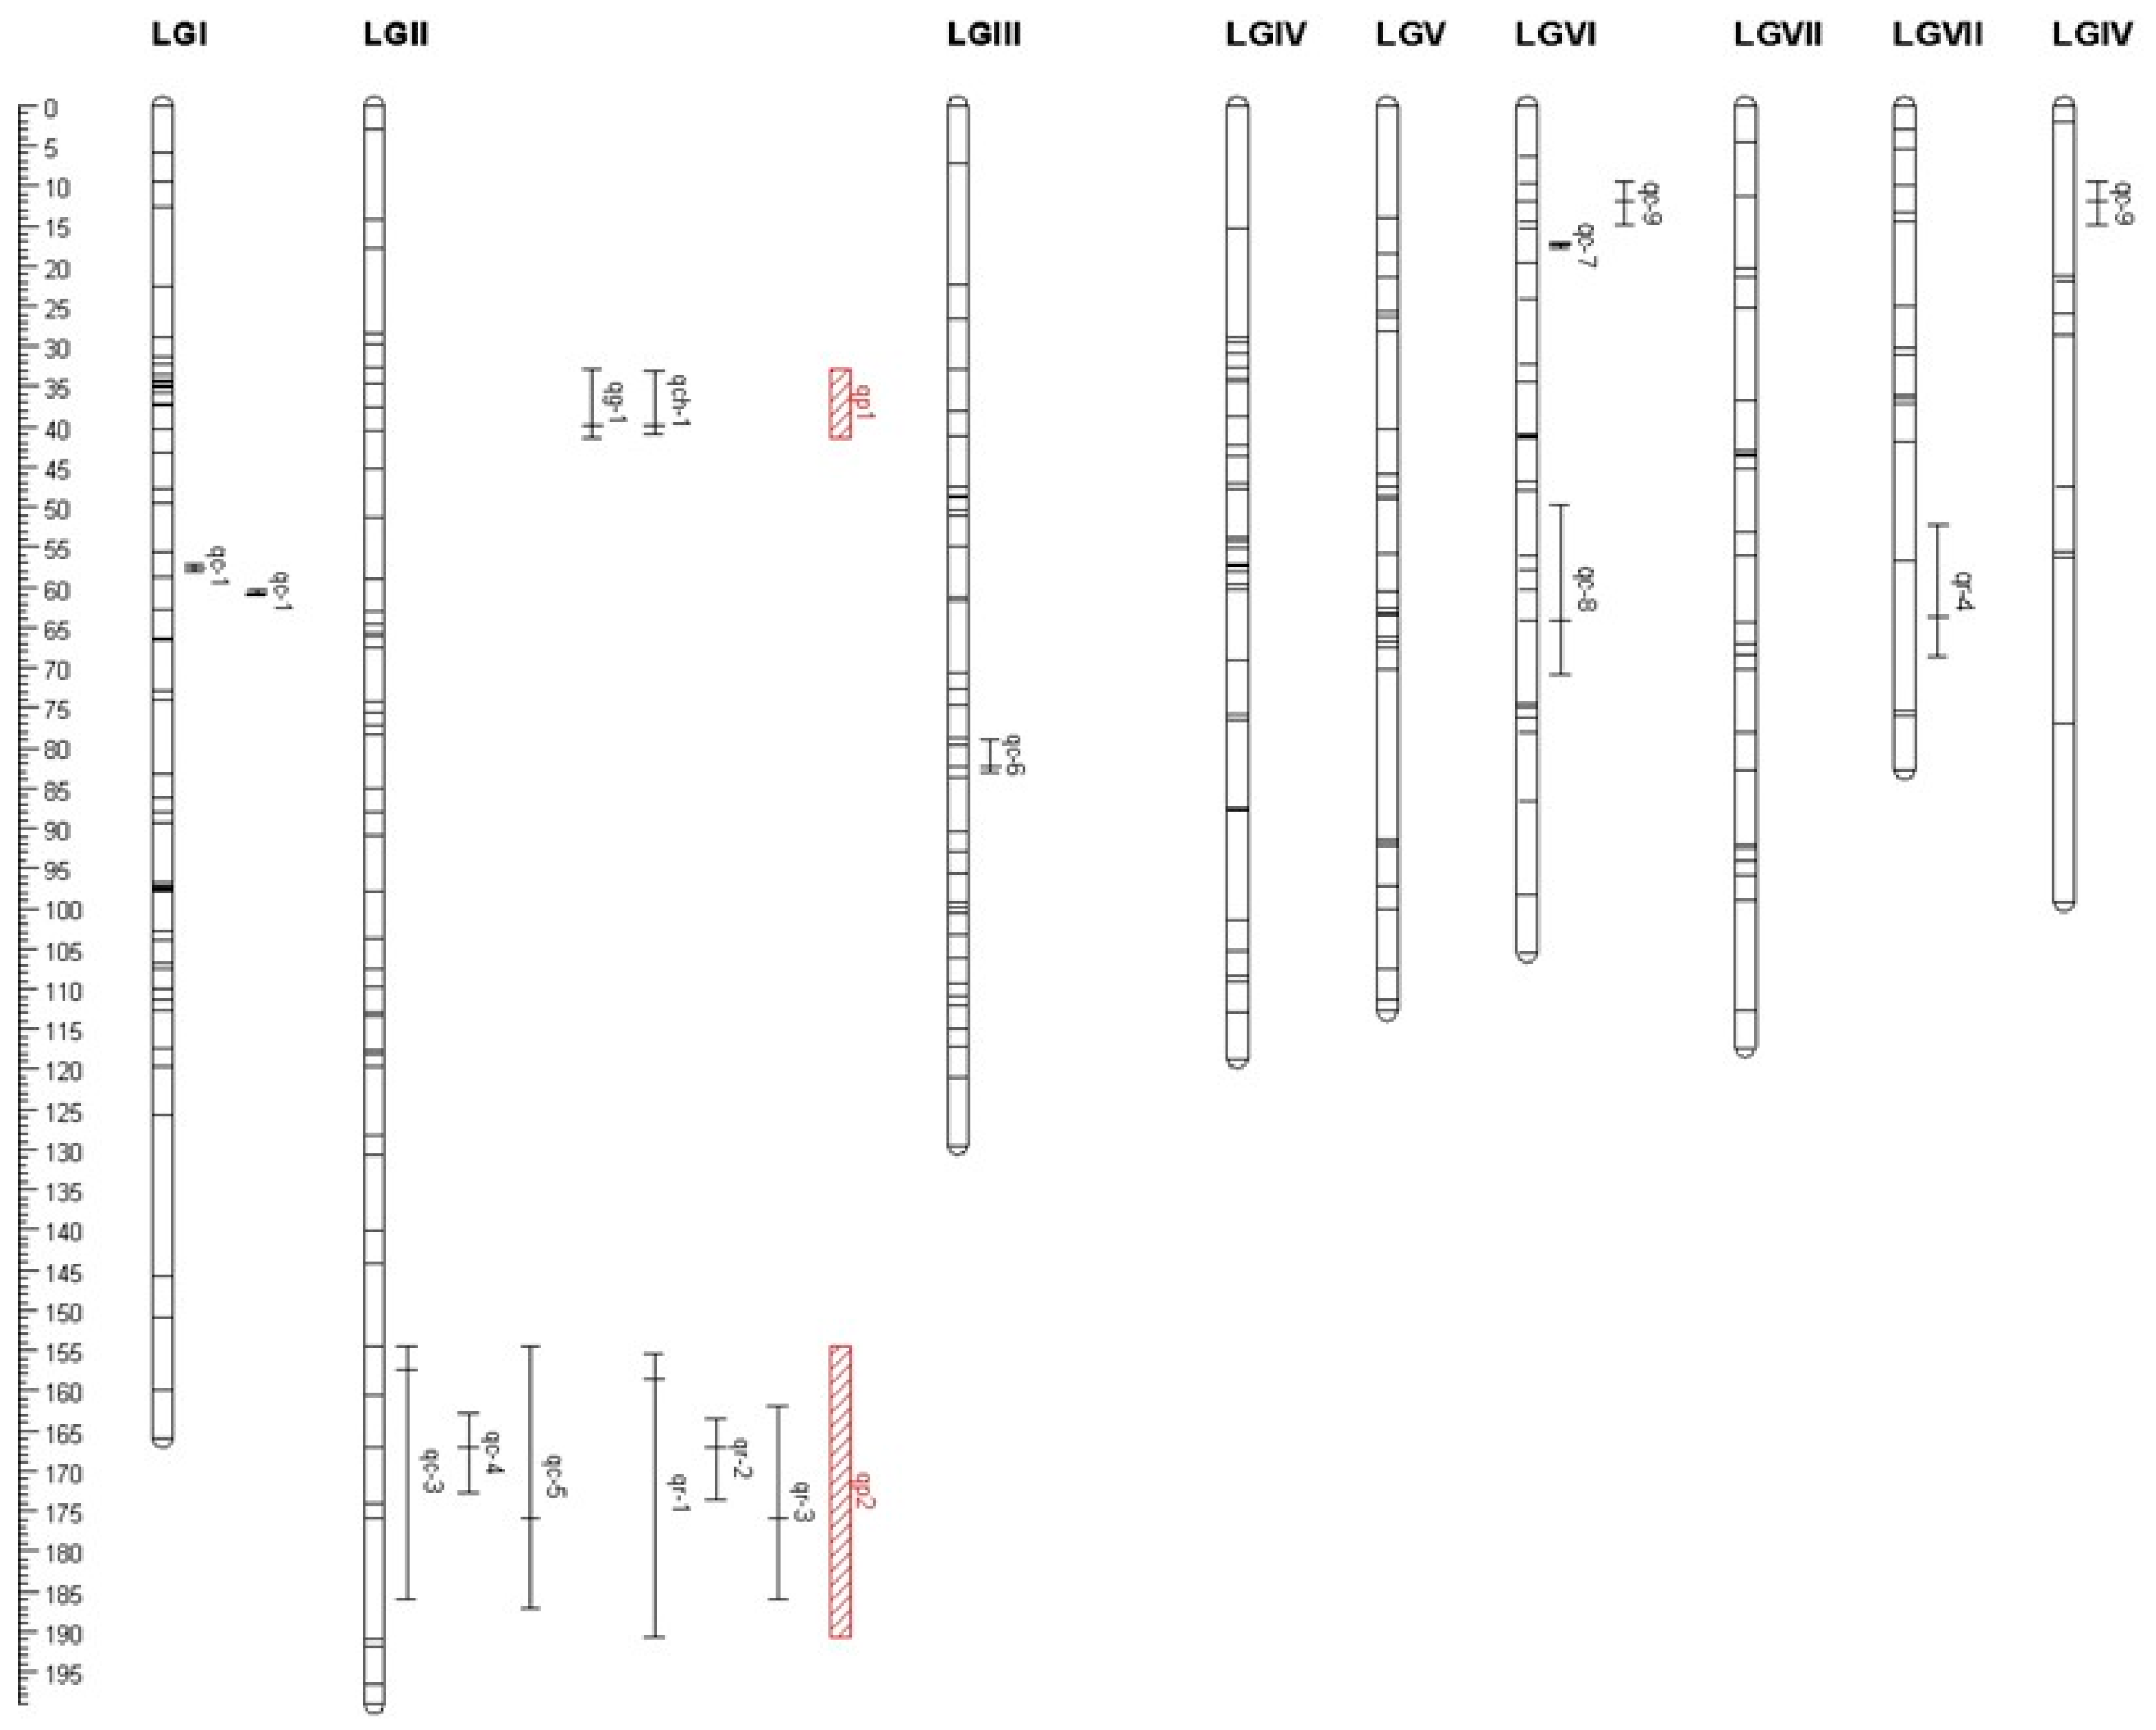
Based on the genetic linkage map, we used six fruiting body quality-related traits of A. heimuer for QTL mapping. Hardness and springiness were not associated with detected QTLs. Nine QTLs were associated with fruiting-body cohesiveness, one QTL each with gumminess and chewiness, and four QTLs were associated with fruiting-body resilience (Table 4). The linkage groups LG II, LG VI, LG I, LG VIII, and LG I harbored 8, 3, 2, 1, and 1 QTL sites, respectively (Figure 5).
Cohesiveness was localized with nine QTLs. qc-1 and qc-2 were distributed adjacent to LG I with 48–49% contribution and a negative additive effect, and the potentiating loci were derived from parent A18-119. qc-3, qc-4, and qc-5 were distributed adjacent to LG II with 9–13% contribution and a positive additive effect, and potentiating loci were derived from parent A14-5. qc-6 was distributed on LG III with 7% contribution, a positive additive effect, and the potentiating loci derived from parent A14-5. qc-6 was distributed on LG III with 7% contribution and a positive additive effect, and the locus was derived from parent A14-5. qc-7, qc-8, and qc-9 were distributed on LG VI with 7%, 41%, and 49% contribution, respectively, a negative additive effect, and the locus was derived from parent A18-119. One QTL was associated with gumminess and one with chewiness; both loci were distributed on LG II and in the same region, and the additive effects were in the same direction, and thus probably represented the same locus. Four QTLs for resilience were detected and distributed on LG II and LG VIII. Among these loci, qr-1, qr-2, and qr-3 were distributed adjacent to LG II, with between 11% and 13% contribution and positive additive effects, and the potentiation loci were derived from parent 14-5.
To further illustrate the results of QTL mapping, QTLs for overlapping traits with different confidence intervals were multi-effect QTLs, so QTL loci with the same or primarily identical confidence intervals were merged into the same locus. Accordingly, the gumminess locus qg-1 and the chewiness locus qch-1 were merged into the qp-1 locus, a multi-effect locus. In addition, qc-3, qc-4, and qc-5 of the cohesiveness loci and qr-1, qr-2, and qr-3 of the resilience loci were merged into the qp-2 locus, which affects both cohesiveness and resilience (Table 5).

3.5. Candidate Gene Analysis

We identified candidate genes for the loci by the location of molecular markers linked to the QTLs. The qc-1 locus located between 959,194 and 967,462 bp on Scaffold7 of the strain Dai13782 genome contained four predicted genes (Table 6). Transcriptome analysis revealed that the expression of the g11733 gene was significantly different between the parents, and thus might be the control gene of this locus. The qc-2 locus located between 967,462 and 1,068,450 bp on Scaffold7 contained 33 predicted genes. A total of 13 genes were significantly differentially expressed between the parents, and the differential expression of 10 genes was consistent with the additive effect. Both qc-4 and qr-2 were located between 298,835 and 434,760 bp on Scaffold16 and contained 47 predicted genes. A total of 16 genes were significantly differentially expressed between the parents. Differential expression of 10 genes was consistent with the additive effect. Since the qc-4 and qr-2 loci are closely linked with SSR387, the differential genes were further screened according to the marker position, and g3299 was identified as the locus control gene. The qc-5 and qr-3 loci located between 434,760 and 479,015 bp on Scaffold16 contained 13 predicted genes. Transcriptome analysis revealed that four genes were significantly differentially expressed between the parents, and the differential expression of the g3338 gene was consistent with the additive effect. The qc-8 locus between 848,218 and 916,729 bp on Scaffold8 contained 19 predicted genes. Transcriptome analysis revealed that five genes were significantly differentially expressed between the parents, consistent with the additive effect. The qg-1 and qch-1 loci were considered the same locus, located between 1,513,685 and 1,569,878 bp on Scaffold4, containing 19 predicted genes. The transcriptome data showed that the expression of the g11733 gene differed significantly between the parents, and thus could be the control gene for this locus.

4. Discussion

4.1. SSR and InDel Marker Development

The development of molecular markers is essential to improve the efficiency of genetic mapping, and the density and coverage of genetic linkage maps. SSR molecular markers show co-dominant inheritance, have high reproducibility and stable inheritance, and are widely used in the construction of linkage maps of plants and animals [36]. InDel markers have the advantages of being abundant, widely distributed, present at a high density in the genome, yield stable amplification products, show high polymorphism, and are easily detected. InDel markers are also widely used to construct genetic linkage maps in plants and animals [37,38]. Comparing genetic maps and establishing correspondence between maps and genomic sequences can be facilitated using SSR and InDel markers based on genomic sequences [39]. The present study used SSR markers developed from the genome sequence and resequencing data of different strains to develop InDel markers and detect parental polymorphism. The results showed that only 10.3% of 1012 InDel markers were polymorphic. The proportion of polymorphism of InDel markers in this study was lower than that for the L. edodus genetic map. This phenomenon may be because the selected markers were located on different scaffolds than the original map markers [40].
Of the molecular markers used in the current study, the markers within the SDR were all biased toward one parent. This phenomenon is similar to results observed in L. edodus, P. ostreatus, P. pulmonarius, and P. eryngii [41,42]. Previous studies have shown that the SDR is associated with non-random segregation of mating-type loci, and the markers associated with mating-type loci are partially segregated [40]. In the mating-type study of A. heimuer by Lu et al. [16], the mating-type locus was located on LG 8 of the original map, which is the new linkage group LG I. In the present study, no partial segregation hotspot region on LG I was detected, indicating that the occurrence of the SDR was unrelated to mating-type loci, and thus, other reasons may be responsible.

4.2. Characterization and Anchoring of the New Genetic Linkage Map of A. heimuer

In this study, the newly constructed genetic map contained 297 markers covering 1202.6 cM with an average marker interval of 3.79 cM. The number of linkage groups was nine, which was two linkage groups fewer than the original linkage map, and the seven linkage groups in the original map were merged into three linkage groups and two new linkage groups were added. Suppose the span of the two genomic regions is large, and the number of markers obtained is not significant. In that case, the linkage group will break between the two regions lacking markers, so the original linkage regions will be distributed into different linkage groups. As the number of markers increases, some markers will be linked to markers on different linkage groups and connected to one linkage group [43]. For example, in this study, the coded linkage group LG I contained the original linkage groups LG 7 and LG 8, LG III contained the original linkage groups LG 3 and LG 5, and LG VII contained the original linkage groups LG 9, LG 10, and LG 11. As the number of markers increases, the number of marker linkage groups approaches the number of chromosomes until it is equal, as also observed in a previous study of L. edodes [40]. The number of linkage groups in this study was consistent with the detection of at least nine chromosomes by contour-clamped homogeneous electric field electrophoresis (CHEF) [44]. However, the genome length detected by CHEF was 22 Mb. The genome size estimated by the genome sequencing assembly is very different (43.57 or 49.76 Mb) [45,46], so further experiments are needed to determine whether the genetic linkage map corresponds to the number of chromosomes.
The information from molecular markers allows the genetic map to be linked to the genome. Fang et al. observed that the mating-type locus is located on Scaffold45, which is located on the same scaffold as the genetically matched mating-type gene by genomic and genetic linkage mapping association. Anchoring sequencing assembly results by genetic linkage mapping is an effective method to solve the problem of sequencing assembly fragmentation and construct chromosome-level assembly results. Therefore, in this study, the genome was assembled based on linkage groups. It was found that 142 scaffolds were anchored in the genetic linkage map, and the genome sequence was 31.68 Mb, covering 73% of the genome. This study anchored the scaffolds to the genetic linkage map and four scaffolds were mapped to different linkage groups. Such problems in genome anchoring have been reported for Nelumbo nucifera and L. edodus for which genome assembly errors may be the cause [12,39]. Thus, the correctness of these scaffold assemblies needs to be further determined.

4.3. QTL Mapping for Fruiting Body Quality-Related Traits of A. heimuer

In a previous study that performed QTL mapping of A. auricula traits, Lu et al. used CIM to locate five major agronomic traits of A. auricula, including mycelial growth rate, growth period, and yield. In the present study, QTL mapping was performed on six chewing quality-related traits of A. heimuer (i.e., hardness, springiness, cohesiveness, gumminess, chewiness, and resilience). Fifteen loci were associated with four quality-related traits of A. heimuer (Table 4), distributed in five clusters, with 1–8 QTLs for each trait, and the contribution ranging from 7% to 49%. Most of the QTLs were distributed in clusters, mainly in LG I, LG II, and LG VI. In several other edible mushrooms, QTLs are also distributed in clusters [47,48].
The phenomenon of one-cause pleiotropy or tightly linked loci controlling multiple related agronomic traits has been studied extensively in crop plants. Often, a high correlation is observed between traits, leading to the detection of more common loci, and one-cause pleiotropy or tight linkage between genes is an important reason for the correlation of phenotypic traits [49,50]. In the present study, the cohesiveness loci qc-1 and qc-2 were closely interlocked on LG I. The positions of the chewiness locus qch-1 and the gumminess locus qg-1 were located in the same confidence interval, which may represent a single-cause–multiple-effect gene, and both chewiness and gumminess may reflect the state of food when it is swallowable. The positions of loci qc-3, qc-4, and qc-5, and loci qr-1, qr-2, and qr-3 were all distributed on LG VI (Table 5) with overlapping confidence intervals, which may be the same locus observed in L. edodus [12], suggesting that the genetic basis of the phenotypic correlation may be due to the co-location of QTLs. The positive and negative correlations between traits may be due to QTLs controlling the traits of interest located on the same or similar genome segments.
Because the fruiting body quality-related traits of A. heimuer can only be measured at the dikaryon stage, this study introduced monokaryons from other strains. The test-cross monokaryons used are different, so the interaction effects are also different. If the gene of the testcross strain is dominant relative to the mapping monokaryon, the phenotype controlled by that locus will not be significantly different [40,47]. The present study revealed that no QTL loci were detected for the two traits of hardness and springiness. It may be that the test-cross strains were dominant for these two traits compared with the mapping monokaryons. In future studies, we will select different test-cross strains to eliminate the influence of test-cross strains on localization.

4.4. Candidate Gene Analysis for Fruiting Body Quality-Related Traits of A. heimuer

There are currently two genome assemblies for A. heimuer. Based on the position of molecular markers anchored on the two assemblies, we observed that most of the QTL loci-linked markers belonged to the different scaffolds in the genome of strain A14-8. In contrast, most of these markers belonged to the same scaffold in the strain Dai13782; hence, in this study, we chose the strain Dai13782 genome as the anchor genome. We compared the markers associated with 15 QTLs with the genome data for A. heimuer and only two markers associated with nine QTLs were located in the same scaffold. We predicted genes by location, and then, by assessing their expression in the transcriptome of the parents and the direction of the additive effect of the QTL locus, it was determined that the control genes for loci qc-1, qc-4 (qr-2), qc-5 (qr-3), and qg-1 (qch-1) were g11733, g3299, g3338, and g8874, respectively. Annotation information revealed that all genes encoded hypothetical proteins. The next step is to further verify these genes between different strains.

5. Conclusions

In summary, the improved genetic linkage map consisted of nine linkage groups and merged seven original linkage groups into three linkage groups. We anchored 142 scaffolds of 31.68 Mb, covering 73% of the genome in the genetic linkage map. Fifteen QTL loci control four fruiting body quality-related traits on the genetic linkage map. A linkage between gumminess and chewiness, and a partial connection between cohesiveness and resilience were observed. Three genes control cohesiveness and resilience, and one gene controls gumminess and chewiness. This study lays the foundation for gene localization and chromosome assembly of A. heimuer, elucidation of the mechanism by which substrate influences fruiting-body quality, and provides a basis for precision breeding of A. heimuer.

Supplementary Materials

The following supporting information can be downloaded at: https://www.mdpi.com/article/10.3390/horticulturae9070763/s1. Table S1: SSR-PCR, InDel-PCR reaction procedures.

Author Contributions

F.Y. designed the experiments; J.L. and M.F. prepared the materials for the experiments and analyzed the data; X.M. and K.S. helped analyze the data; L.L. and J.M. helped revise the manuscript; J.L. wrote the manuscript. All authors have read and agreed to the published version of the manuscript.

Funding

This study was funded by the China Agriculture Research System (No. CARS-20), the Guizhou Key Laboratory of Edible Fungi Breeding (No. [2019]5105-2001 and No. [2019]5105-2005), and the Science and Technology Research Project of Jilin Provincial Department of Education (No. JJKH20220352KJ).

Institutional Review Board Statement

Not applicable.

Informed Consent Statement

Not applicable.

Data Availability Statement

The data presented in this study are available in the article.

Conflicts of Interest

The authors declare no conflict of interest.

References

  1. Wu, F. Taxonomy and Phylogeny of Auricularia (Auriculariales, Basidiomycota). Ph.D. Thesis, Beijing Forestry University, Beijing, China, 2019. [Google Scholar]
  2. Liu, F.Y.; Wang, Y.X.; Wang, A.X.; Deng, W.M.; Wu, R.G. Regional Testing and Application Evaluation of ‘Xuemei No.1’ in Fujian. North. Hortic. 2017, 14, 160–165. [Google Scholar]
  3. Zheng, S.Y.; Shi, L.Y.; Zhao, C.M.; Zhang, Y.L.; Guo, J.Y. Screening of High-quality Auricularia auricula Strains Suitable for Cultivation in Western Mountainous Areas of Hebei Province. Edible Fungi China 2019, 38, 19–22, 27. [Google Scholar]
  4. Yao, F.J.; Bian, Y.B. Illustrating the Key Technology of Auricularia Auricula; China Agricultural Press: Beijing, China, 2011. [Google Scholar]
  5. Yao, F.J. The Cultivation Spread of Auricularia auricula from North to South in China. Edible Fungi China 2012, 31, 61–62. [Google Scholar]
  6. China Edible Fungi Association. Analysis of the results of the national edible mushroom statistical survey in 2020. Edible Fungi China 2022, 41, 85–91. [Google Scholar]
  7. Yao, F.J.; Zhang, Y.M.; Lu, L.X.; Fang, M. Research Progress on Genetics and Breeding of Auricularia auricula-judae. J. Fung. Res. 2015, 13, 125–128. [Google Scholar]
  8. Idrees, M.; Yaqoob, S.; Leo, S.F.; Khan, A.A.; Sun, L.; Yang, Y.; Li, D.; Fu, Y.; Li, Y. A Comparison of the Physical, Chemical, and Structural Properties of Wild and Commercial Strains of Button Mushroom, Agaricus bisporus (Agaricomycetes). Int. J. Med. Mushrooms 2019, 21, 611–625. [Google Scholar] [CrossRef]
  9. Me, H.W.; Han, Y.; Li, Y.J.; Xue, Y.; Fu, T.T.; Liu, Y.; Hu, W.; Han, S.C.; Zhao, F.C.; Wu, H.J.; et al. Effect of Different Culture Substrates and Cultivation Mode on Sensory Quality of Auricularia auricular. J. Northeast For. Univ. 2017, 45, 51–56, 88. [Google Scholar]
  10. Peng, Y.H. Texture Analysis and Nutrition Evaluation for Products of Auricularia heimuer Produced by Log Cultivation and Substituted Material Cultivation. Edible Fungi China 2019, 38, 50–56, 60. [Google Scholar]
  11. Zhang, Y.L.; Mu, Y.; Li, Y.J.; Wan, P.; Feng, L.; Lei, H. Effects of Geographical Environment and Genotype on Nutritional Contents, Texture and Microstructure of Auricularia auricula-judae. Food Sci. 2018, 39, 233–239. [Google Scholar]
  12. Zhang, L.; Gong, W.; Li, C.; Shen, N.; Gui, Y.; Bian, Y.; Kwan, H.S.; Cheung, M.K.; Xiao, Y. RNA-Seq-based high-resolution linkage map reveals the genetic architecture of fruiting body development in shiitake mushroom, Lentinula edodes. Comput. Struct. Biotechnol. J. 2021, 19, 1641–1653. [Google Scholar] [CrossRef]
  13. Zhang, Y.; Gao, W.; Sonnenberg, A.; Chen, Q.; Zhang, J.; Huang, C. Genetic Linkage and Physical Mapping for an Oyster Mushroom (Pleurotus cornucopiae) and Quantitative Trait Locus Analysis for Cap Color. Appl. Environ. Microbiol. 2021, 87, e0095321. [Google Scholar] [CrossRef] [PubMed]
  14. Wang, P.; Yao, F.J.; Lu, L.X.; Fang, M.; Zhang, Y.M.; Khan, A.A.; Kong, X.H.; Yu, J.; Jiang, W.Z.; Kitamoto, Y. Map-based cloning of genes encoding key enzymes for pigment synthesis in Auricularia cornea. Fungal Biol. 2019, 123, 843–853. [Google Scholar] [CrossRef] [PubMed]
  15. Jiang, W.Z.; Yao, F.J.; Lu, L.X.; Fang, M.; Wang, P.; Zhang, Y.M.; Meng, J.J.; Lu, J.; Ma, X.X.; He, Q.; et al. Affiliations expand. Genetic linkage map construction and quantitative trait loci mapping of agronomic traits in Gloeostereum incarnatum. J. Microbiol. 2021, 59, 41–50. [Google Scholar] [CrossRef] [PubMed]
  16. Lu, L.X.; Yao, F.J.; Wang, P.; Fang, M.; Zhang, Y.M.; Zhang, W.T.; Kong, X.H.; Lu, J. Construction of a genetic linkage map and QTL mapping of agronomic traits in Auricularia auricula-judae. J. Microbiol. Biol. Educ. 2017, 55, 792–799. [Google Scholar] [CrossRef] [PubMed]
  17. Zhang, P.; Yao, F.J.; Wang, L.J.; Zhang, Y.M. Overview of Morphological Development about Auricularia auricula. North. Hortic. 2011, 19, 185–187. [Google Scholar]
  18. Chen, Y.; Yao, F.J.; Zhang, Y.M.; Fang, M. Numerical classification of cultivated germplasm of Auricularia auricula-judae. Mycosystema 2014, 33, 984–996. [Google Scholar]
  19. Yao, F.J.; Zhang, Y.M. A New Auricularia auricula Cultivar ‘Qihei 1’. Acta Hortic. Sin. 2012, 39, 603–604. [Google Scholar]
  20. Wang, X.; Zhang, Y.M.; Chen, Y.; Fang, M.; Wang, W.; Yao, F.J. A New Auricularia auricula Cultivar ‘Jihei 1’. Acta Hortic. Sin. 2013, 40, 601–602. [Google Scholar]
  21. Fang, M.; Yao, F.J.; Wang, X.; Chen, Y.; Zhang, Z.W.; Ren, Y.Y. A New Auricularia auricula Cultivar ‘Jihei 2’. Acta Hortic. Sin. 2013, 40, 1215–1216. [Google Scholar]
  22. Yao, F.J.; Lu, L.X.; Wang, P.; Fang, M.; Zhang, Y.M.; Chen, Y.; Zhang, W.T.; Kong, X.H.; Lu, J.; Honda, Y. Development of a Molecular Marker for Fruiting Body Pattern in Auricularia auricula-judae. Mycobiology 2018, 46, 72–78. [Google Scholar] [CrossRef] [Green Version]
  23. Murray, M.G.; Thompson, W.F. Rapid isolation of high molecular weight plant DNA. Nucleic Acids Res. 1980, 8, 4321–4325. [Google Scholar] [CrossRef] [PubMed] [Green Version]
  24. Zhang, Y.; Yao, F.J.; Sun, W.J.; Fang, M.; Wu, C.S. Screening of reference genes for qRT-PCR amplification in Auricularia heimuer. Mycosystema 2020, 39, 1510–1519. [Google Scholar]
  25. Kofler, R.; Schlotterer, C.; Lelley, T. SciRoKo: A new tool for whole genome microsatellite search and investigation. Bioinformatics 2007, 23, 1683–1685. [Google Scholar] [CrossRef] [PubMed] [Green Version]
  26. Van Ooijen, J.W. JoinMap 4, Software for the Calculation of Genetic Linkage Maps in Experimental Populations; Kyazma BV: Wageningen, The Netherlands, 2006. [Google Scholar]
  27. Labbé, J.; Zhang, X.; Yin, T.; Schmutz, J.; Grimwood, J.; Martin, F.; Tuskan, G.A.; Le Tacon, F. A genetic linkage map for the ectomycorrhizal fungus Laccaria bicolor and its alignment to the whole-genome sequence assemblies. New Phytol. 2008, 180, 316–328. [Google Scholar] [CrossRef] [PubMed]
  28. Fishman, L.; Kelly, A.J.; Morgan, E.; Willis, J.H. A genetic map in the Mimulus guttatus species complex reveals transmission ratio distortion due to heterospecific interactions. Genetics 2001, 159, 1701–1716. [Google Scholar] [CrossRef]
  29. Chakravarti, A.; Lasher, L.K.; Reefer, J.E. A maximum likelihood method for estimating genome length using genetic linkage data. Genetics 1991, 128, 175–182. [Google Scholar] [CrossRef]
  30. Martin, F.; Aerts, A.; Ahren, D.; Brun, A.; Danchin, E.G.; Duchaussoy, F.; Gibon, J.; Kohler, A.; Lindquist, E.; Pereda, V.; et al. The genome of Laccaria bicolor provides insights into mycorrhizal symbiosis. Nature 2008, 452, 88–92. [Google Scholar] [CrossRef] [Green Version]
  31. van der Nest, M.A.; Slippers, B.; Steenkamp, E.T.; De Vos, L.; Van Zyl, K.; Stenlid, J.; Wingfield, M.J.; Wingfield, B.D. Genetic linkage map for Amylostereum areolatum reveals an association between vegetative growth and sexual and self-recognition. Fungal Genet. Biol. 2009, 46, 632–641. [Google Scholar] [CrossRef] [Green Version]
  32. Remington, D.L.; Whetten, R.W.; Liu, B.H.; O’Malley, D.M. Construction of an AFLP genetic map with nearly complete genome coverage in Pinus taeda. Theor. Appl. Genet. 1999, 98, 1279–1292. [Google Scholar] [CrossRef] [Green Version]
  33. Zeng, Z.B. Precision mapping of quantitative trait loci. Genetics 1994, 136, 1457–1468. [Google Scholar] [CrossRef]
  34. Wang, S.; Basten, C.; Zeng, Z. Windows Qtl Cartographer 2.5; Department of Statistics, North Carolina State University: Raleigh, NC, USA, 2012. [Google Scholar]
  35. Voorrips, R.E. MapChart: Software for the graphical presentation of linkage maps and QTLs. J. Hered. 2002, 93, 77–78. [Google Scholar] [CrossRef] [PubMed] [Green Version]
  36. Xu, Y.; Zhu, L.; Xiao, J.; Huang, N.; Mccouch, S.R. Chromosomal regions associated with segregation distortion of molecular markers in F2, backcross, doubled haploid, and recombinant inbred populations in rice (Oryza sativa L.). Mol. Gen. Genet. 1997, 253, 535–545. [Google Scholar] [CrossRef] [PubMed]
  37. Wang, Y. A Sequence-Based Reference Genetic Linkage Map of Brassica Rapa. Master’s Thesis, Chinese Academy of Agricultural Sciences, Beijing, China, 2011. [Google Scholar]
  38. Usdin, K. The biological effects of simple tandem repeats: Lessons from the repeat expansion diseases. Genome Res. 2008, 18, 1011–1019. [Google Scholar] [CrossRef] [Green Version]
  39. Gui, S.T. Study on the linkage map construction and genome consolidation in Nelumbo nucifera Gaertn. Ph.D. Thesis, Wuhan University, Wuhan, China, 2017. [Google Scholar]
  40. Gong, W.B. Quantitative Trait Loci Mapping of Important Agronomic Traits in Lentinula Edodes. Ph.D. Thesis, Huazhong Agricultural University, Wuhan, China, 2014. [Google Scholar]
  41. Okuda, Y.; Ueda, J.; Obatake, Y.; Murakami, S.; Fukumasa, Y.; Matsumoto, T. Construction of a genetic linkage map based on amplified fragment length polymorphism markers and development of sequence-tagged site markers for marker-assisted selection of the sporeless trait in the oyster mushroom (Pleurotus eryngii). Appl. Environ. Microb. 2012, 78, 1496–1504. [Google Scholar] [CrossRef] [Green Version]
  42. Terashima, K.; Matsumoto, T.; Hayashi, E.; Fukumasa-Nakai, Y. A genetic linkage map of Lentinula edodes (shiitake) based on AFLP markers. Mycol. Res. 2002, 106, 911–917. [Google Scholar] [CrossRef]
  43. Zhang, F.M. Density-Increasing of Genetic Map and QTL for Hybrid Population of Populus Adenopoda × P.Alba. Master’s Thesis, Nanjing Forestry University, Nanjing, China, 2011. [Google Scholar]
  44. Bian, Y.B.; Luo, X.C.; Wang, B.; Jin, D.M.; Zhou, Q. Electrophoretic karyotype analysis ofauricularia auricula. Mycosystema 2000, 19, 78–80. [Google Scholar]
  45. Yuan, Y.; Wu, F.; Si, J.; Zhao, Y.F.; Dai, Y.C. Whole genome sequence of Auricularia heimuer (Basidiomycota, Fungi), the third most important cultivated mushroom worldwide. Genomics 2019, 111, 50–58. [Google Scholar] [CrossRef]
  46. Fang, M.; Wang, X.; Chen, Y.; Wang, P.; Lu, L.; Lu, J.; Yao, F.; Zhang, Y. Genome Sequence Analysis of Auricularia heimuer Combined with Genetic Linkage Map. J. Fungi 2020, 6, 37. [Google Scholar] [CrossRef] [Green Version]
  47. Larraya, L.; Peñas, M.M.; Pérez, G.; Santos, C.; Ritter, E.; Pisabarro, A.G.; Ramírez, L. Identification of incompatibility alleles and characterisation of molecular markers genetically linked to the A incompatibility locus in the white rot fungus Pleurotus ostreatus. Curr. Genet. 1999, 34, 486–493. [Google Scholar] [CrossRef]
  48. Foulongne-Oriol, M.; Spataro, C.; Cathalot, V.; Monllor, S.; Savoie, J. An expanded genetic linkage map of an intervarietal Agaricus bisporus var. bisporus × A. bisporus var. burnettii hybrid based on AFLP, SSR and CAPS markers sheds light on the recombination behaviour of the species. Fungal Genet. Biol. 2010, 47, 226–236. [Google Scholar] [CrossRef]
  49. Zygier, S.; Chaim, A.B.; Efrati, A.; Kaluzky, G.; Borovsky, Y.; Paran, I. QTLs mapping for fruit size and shape in chromosomes 2 and 4 in pepper and a comparison of the pepper QTL map with that of tomato. Theor. Appl. Genet. 2005, 111, 437–445. [Google Scholar] [CrossRef] [PubMed]
  50. Sibov, S.T.; de Souza, C.J.; Garcia, A.A.; Garcia, A.F.; Silva, A.R.; Mangolin, C.A.; Benchimol, L.L.; de Souza, A.P. Molecular mapping in tropical maize (Zea mays L.) using microsatellite markers. 1. Map construction and localization of loci showing distorted segregation. Hereditas 2003, 139, 96–106. [Google Scholar] [CrossRef] [PubMed] [Green Version]
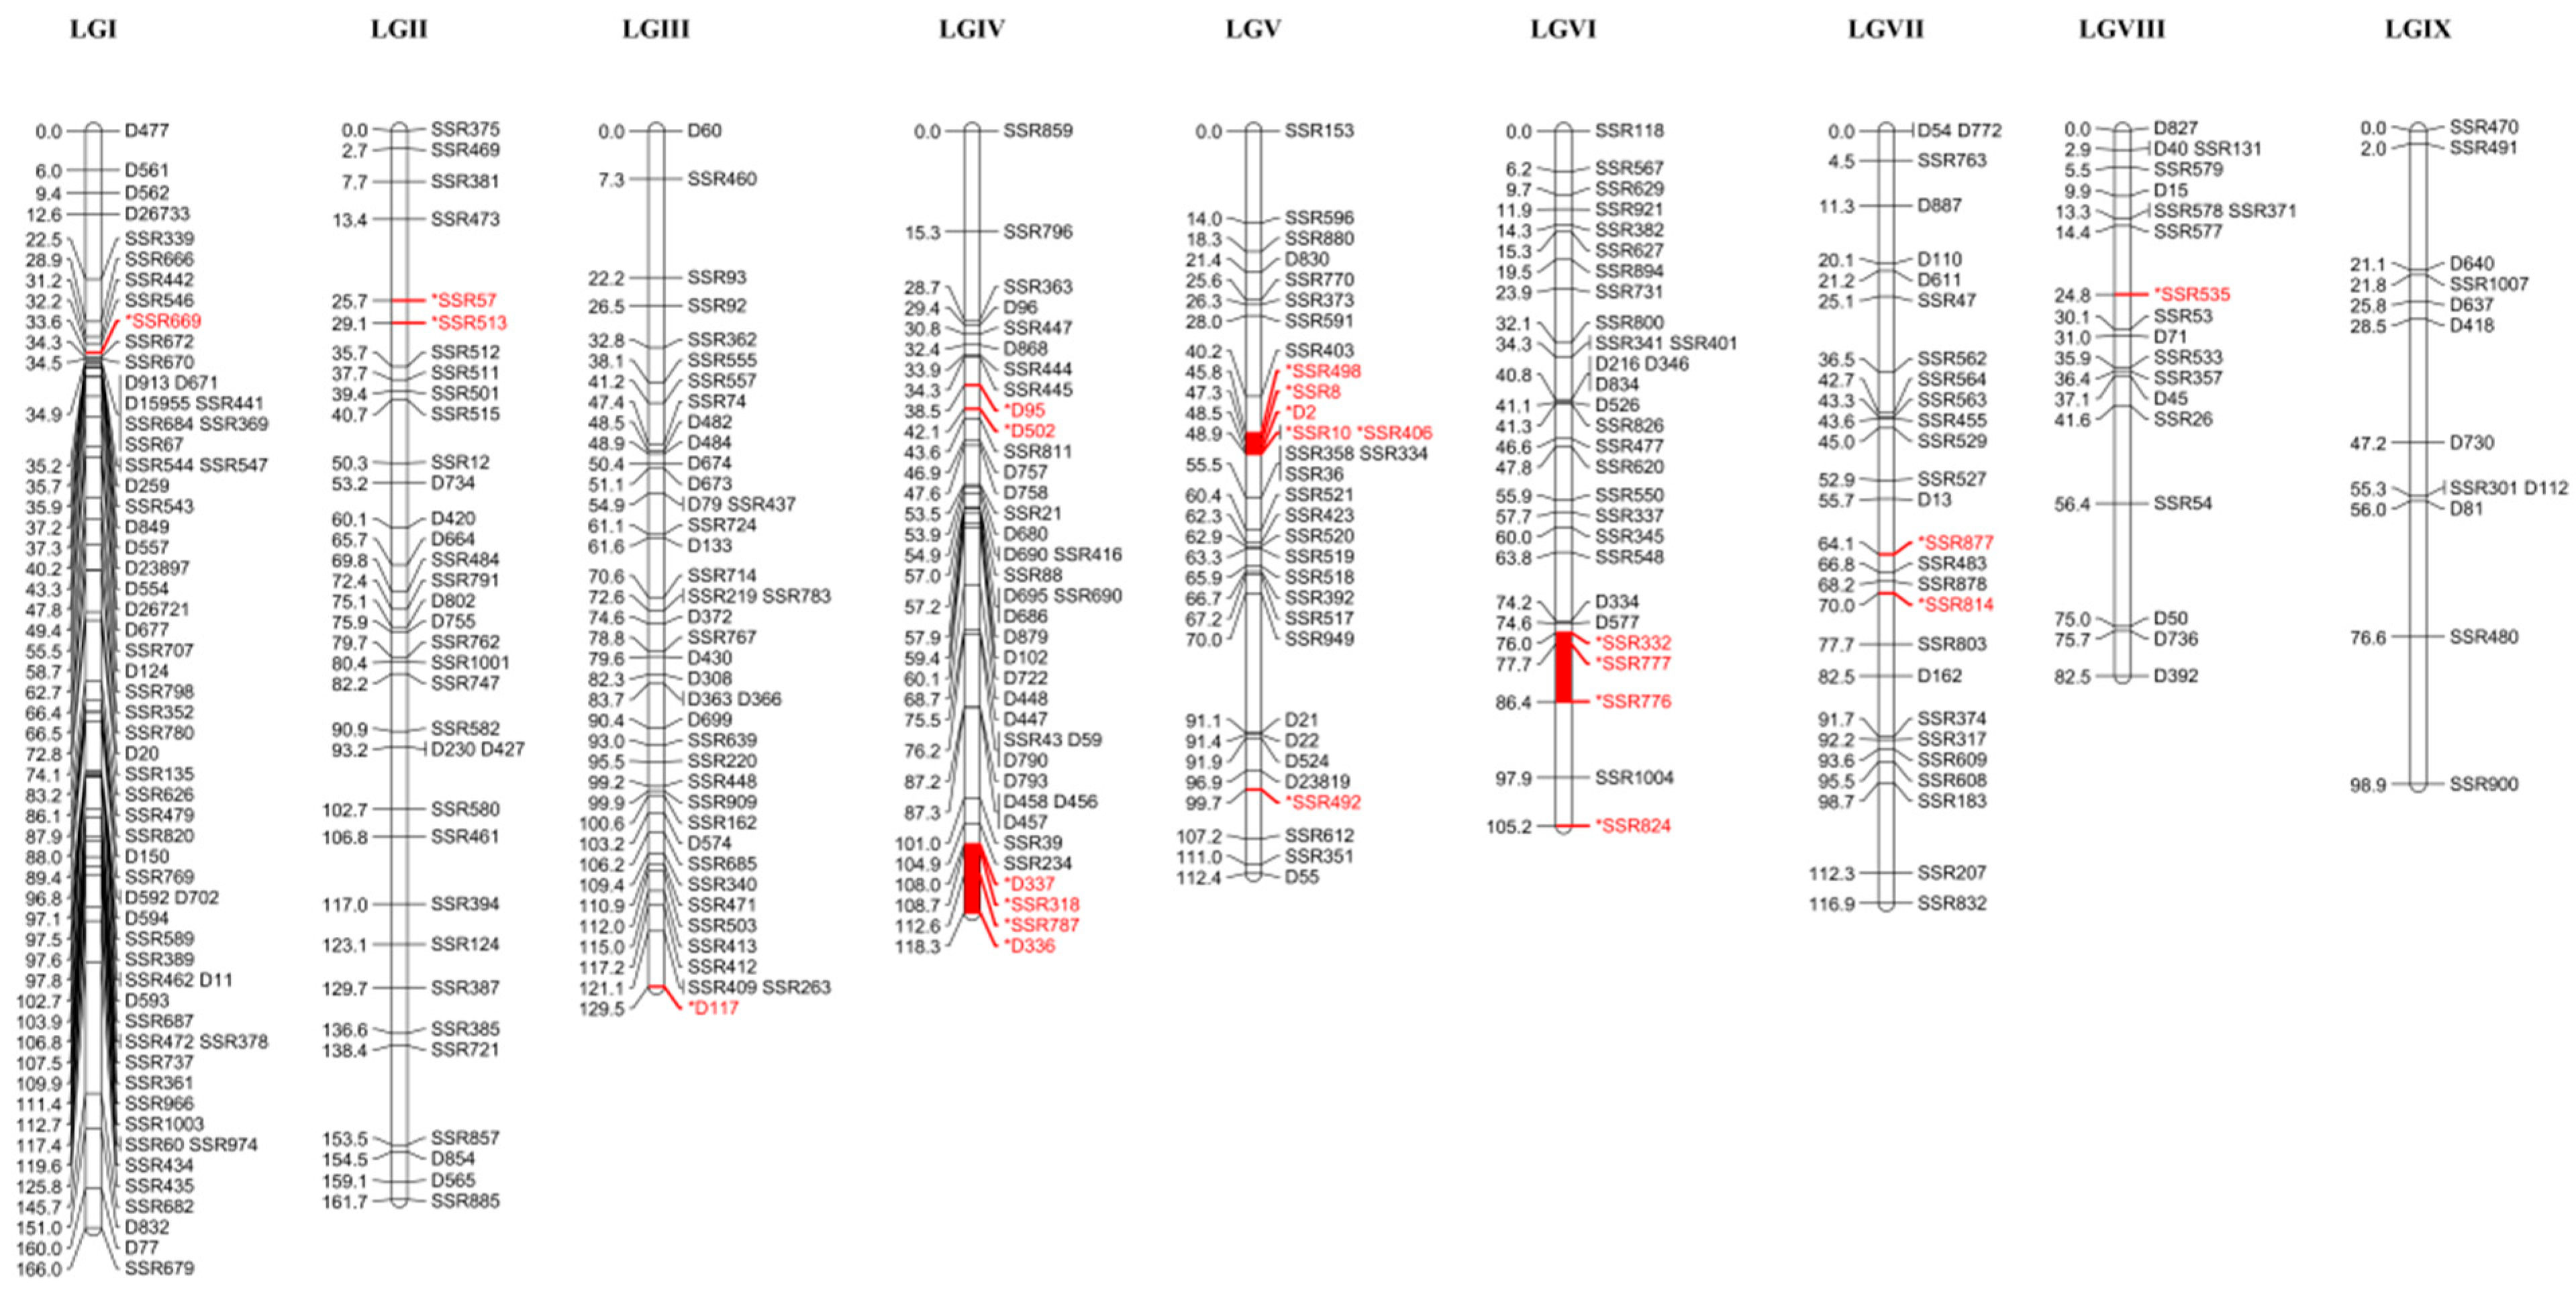
Figure 1. Genetic linkage map of Auricularia heimuer. Note: Each linkage group is named LG, and the left number of each linkage group is the map distance (cM). The SSR markers are named SSRXXX, and the InDel markers are named DXXX. Separated markers are denoted by * and indicated in red. The red markers are segregation distortion markers, and the red area of the linkage group is the segregation distortion region.
Horticulturae 09 00763 g001
Figure 2. Collinear analysis and marker density of linkage groups. Note: The first (outermost) layer is the linkage group. The new linkage groups use the format LG + Roman numerals, such as LG I, indicated by red filling, and the original linkage groups use the format LG + Arabic numerals, such as LG 1, indicated by light-green filling. The second layer is the number of markers per 20 cM; the third layer is the label density per 20 cM; and the fourth layer is the connection line of the same marker on the new linkage group and the original linkage group, with a unique color used for each new linkage group.
Horticulturae 09 00763 g002
Figure 3. Anchoring scaffolds to linkage groups for Auricularia heimuer. Note: The numeral on the left of each map is the scaffold ID number, which is arranged according to the order of the markers on the linkage group. The red-filled scaffolds are the same order of the markers on the scaffold and the linkage group, the green-filled scaffolds are the opposite order of the markers on the scaffold and the linkage group, and the blue-filled scaffolds are the unknown order of the markers on the scaffold and the linkage group. The bar on the right represents the individual linkage group; the central lines indicate the connection between the same markers on a scaffold and the linkage groups.
Horticulturae 09 00763 g003
Figure 4. Frequency distributions of data for quality-related traits of Auricularia heimuer fruiting bodies.
Horticulturae 09 00763 g004
Figure 5. Quantitative trait loci (QTLs) localization for fruiting body quality-related traits of Auricularia heimuer. Note: The QTLs for cohesiveness (qc), gumminess (qg), chewiness (qch), and resilience (qr) are indicated on the right of the linkage group. The QTL for each agronomic trait was marked with a black bar. The LOD-1 confidence interval is represented by the black bars above and below each black bar. The QTLs for multi-effect sites (qp) are represented by red boxes.
Horticulturae 09 00763 g005
Table 1. Characteristics of the linkage group map of Auricularia heimuer.
Linkage GroupObserved Length (cM)Number of MarkersAverage Marker
Spacing (cM)
Largest Interval (cM)>10 cM IntervalNumber of Segregation
Distortion Markers
SDR
LGI166.0632.63519.911
LGII161.7354.37015.132
LGII129.5413.16014.911
LGIV118.3393.03215.3261
LGV112.4323.51321.1461
LGVI105.2293.62811.5341
LGVII116.9274.32913.922
LGVII82.5194.34218.631
LGIX98.9128.24122.340
Total1091.4297 23233
Average121.3333.79 2.62.60.3
Table 2. Comparison of characteristics between linkage groups in the original and improved linkage maps for Auricularia heimuer.
ProjectNew MappingOriginal Mapping
Number of chains911
Number of markers297130
Average spacing (cM)3.797.14
Estimated length (cM)1202.61018.4
20 cM of a marker100%99%
10 cM of a marker99%92%
5 cM of a marker92%72%
Table 3. Descriptive statistics for quality-related traits of Auricularia heimuer fruiting bodies.
No.TraitsMeanScopeRangeStandard DeviationVarianceCoefficient of VariationKolmogorov–Smirnov Test
1Hardness728.24 ± 20.83190.44–1380.361189.9246,845.3246,845.3230%0.431
2Springiness0.87 ± 00.74–0.950.2100.003%0.289
3Cohesiveness0.75 ± 0.010.49–0.940.450.010.0113%0.792
4Gumminess521 ± 17.36137.40–1093.77956.3732,543.932,543.9035%0.411
5Chewiness455.33 ± 15.41105.96–995.82889.8625,640.7925,640.7935%0.259
6Resilience1 ± 0.030.33–1.671.340.110.1133%0.444
Table 4. Mapping of quantitative trait loci for fruiting body quality-related traits of Auricularia heimuer.
TraitsLociLinkage MapPosition
(cM)
Adjacent MarkerLODConfidence Intervals (cM)Additive EffectParental GenotypeR2 (%)
Cohesivenessqc-1157.5SSR707-D1242.0457.1–58.0−0.07A18-11948
qc-2160.7D124-SSR7983.0060.4–61.0−0.07A18-11949
qc-32157.5SSR394-SSR1242.70154.4–185.90.04A14-513
qc-42167.1SSR3873.62162.9–172.80.04A14-512
qc-52175.8SSR7212.55154.6–187.00.03A14-59
qc-6382.3D3082.0879.0–82.90.03A14-57
qc-7617.3SSR627-SSR8942.8017.0–17.7−0.07A18-11949
qc-8663.8SSR5482.0949.5–70.5−0.03A18-1197
qc-9912.0SSR491-D6402.299.3–14.9−0.07A18-11941
Gumminessqg-1239.8SSR375-SSR4692.3032.9–41.5−92.46A18-1199
Chewinessqch-1239.8SSR375-SSR4692.3533.0–41.0−83.37A18-1199
Resilienceqr-12158.5SSR394-SSR1242.55154.4–190.80.11A14-511
qr-22167.1SSR3873.96163.5–173.60.12A14-513
qr-32175.8SSR7213.33161.9–185.90.11A14-511
qr-4863.4SSR54-D502.1552.1–68.40.13A14-516
Table 5. Combined multi-effect quantitative trait loci.
Multiple Effect SitesConfidence Intervals (cM)LociConfidence Intervals
(cM)
Linkage MapTraitParental Genotype
qp-132.9–41.5qg-132.9–41.5LGIIGumminessA18-119
qch-133.0–41.0LGIIMasticatoryA18-119
qp-2154.4–190.8qc-3154.4–185.9LGIICohesivenessA14-5
qc-4162.9–172.8LGIICohesivenessA14-5
qc-5154.6–187.0LGIICohesivenessA14-5
qr-1154.4–190.8LGIIReceptiveA14-5
qr-2163.5–173.6LGIIReceptiveA14-5
qr-3161.9–185.9LGIIReceptiveA14-5
Table 6. Candidate gene information for quantitative trait loci mapping regions.
LociLinkage MapAdjacent MarkerScaffold NumberMark PositionPredicted Gene NumberGene DifferenceGene NameFunction
qc-11SSR707-D1247959,194–967,46241g11733Hypothetical protein
qc-21D124-SSR7987967,462–1,068,4503313 (10)
qc-42SSR124-SSR387-SSR38516298,835–361,206–434,7604716 (10)g3299Hypothetical protein
qc-52SSR385-SSR72116434,760–479,015134 (1)g3338Hypothetical protein
qc-86SSR548-SSR3458848,218–916,729195
qp-12SSR375-SSR46941,513,685–1,569,878191g8874Hypothetical protein
qr-22SSR124-SSR387-SSR38516398,835–361,206–434,7604716 (10)g3299Hypothetical protein
qr-32SSR385-SSR72116434,760–479,015134 (1)g3338Hypothetical protein
Disclaimer/Publisher’s Note: The statements, opinions and data contained in all publications are solely those of the individual author(s) and contributor(s) and not of MDPI and/or the editor(s). MDPI and/or the editor(s) disclaim responsibility for any injury to people or property resulting from any ideas, methods, instructions or products referred to in the content.