Abstract
Plant cuticular wax plays an important role in resistance to environmental stresses. Eceriferum (CER) genes are involved in wax synthesis. However, little information is available for tomato species. In this study, 26 SlCER genes were identified in tomato (S. lycopersicum), and they were classified into four clades. The physicochemical properties and conserved motifs of their proteins were predicted. These SlCERs were mainly expressed in leaves, flowers or fruits, and most SlCERs played roles in response to abiotic stresses, especially drought stress. Furthermore, the changes in haplotypes indicated that SlCERs might have been involved in adapting to the environments for wild species S. pimpinellifolium before domestication. These findings would lay a foundation for future functional studies of SlCERs and also provide insights for anti-stress improvement in tomato in the near future.
1. Introduction
The wax layer is a structural component of the plant surface cuticle, which is evolutionarily conserved among land plants [1] and carries out many important defense functions [2,3]. The composition of the wax layer is very complex, mainly comprised of very long-chain fatty acids (VLCFAs, greater than 20 carbons in length), their derivatives and specialized metabolites, such as polyketides and terpenoids [4,5].
Eceriferum (CER) series genes are involved in various stages of wax synthesis. They were discovered and named originally in ethylmethane sulfonate (EMS)-induced mutants of Arabidopsis thaliana, which caused changes in cuticular wax morphology, size and quantity [6,7]. Among them, CER2, CER6, CER9, CER26 and CER60 contribute to fatty acid elongation [8,9,10,11,12], while CER1, CER1-LIKE1, CER3, CER4, CER16 and CER17 affect VLCFAs derivatization by either the acyl reduction pathway or decarbonylation pathway [13,14,15,16,17,18]. In addition, CER10 is involved in wax formation and endocytic membrane trafficking [19], and CER11 can catalyze a dephosphorylation step involved in secretory trafficking in plant cells [20]. Collectively, CERs affect cuticular wax synthesis and response to phytohormone signaling, and ultimately play important functional roles in plant growth, such as pollen fertility, water use efficiency and abiotic/biotic stress resistance [21,22,23,24,25,26].
In other species of plants, CERs show largely identical functions with a few differences, which mainly include leaf wettability, water loss rates, fruit glossiness and storability and sensitivity in response to abiotic or biotic stresses [27,28,29,30,31,32]. To date, genome-wide identification of CER genes has been reported in several species, including apple, jujube, sunflower, passion fruit and Chinese chestnut [33,34,35,36,37], and their sequence structures and responses to the environment have been extensively explored. However, only a few CER genes have been reported in tomato [38,39,40], and their relationship and specific functions remain largely unknown.
Up to now, extensive sequencing data on tomato have been documented [41,42,43,44,45]. They would serve to identify CER genes in tomato species over the whole genome and to uncover their functions. Meanwhile, during domestication and improvement, cultivated tomato undergoes a complex history, characterized by a “two-step” model from S. pimpinellifolium to S. lycopersicum var. cerasiforme and then to S. lycopersicum var. lycopersicum, accompanied by changes in fruit size, flavor and growing environments due to natural or human selection [41,46]. SlCERs may also play a crucial role in the domestication and improvement processes. In this study, we identified SlCER genes and analyzed their expression profiles during the development stages and under abiotic/biotic stresses. Additionally, the changes in haplotype frequencies of SlCERs during the domestication and improvement stages reveal their potential role in responding to stress during domestication.
2. Materials and Methods
2.1. Identification of CER Genes in Solanum lycopersicum
To identify and verify Eceriferum (CER) genes in tomato (Solanum lycopersicum) and compare them with homologous proteins in Arabidopsis thaliana, we downloaded annotated protein sequences (version ITAG4.1) from the SGN website (https://solgenomics.net/, accessed on 19 February 2023). We used the 17 AtCER protein sequences available on the TAIR website (https://www.arabidopsis.org/, accessed on 19 February 2023) as queries for local BLASTP (version 2.12.0) searches against the tomato protein sequences. To annotate the protein domains contained in each AtCER protein, we used the Pfam database [47] and downloaded their Hidden Markov Model (HMM) files for hmmsearch (HMMER version 3.3.2) against the tomato protein sequences. We then used the SlCER protein sequences as queries to execute local BLASTP searches against the Arabidopsis protein sequences to verify the specificity of the match and finalize the SlCER gene set (Table 1 and Table S1).

Table 1.
The physicochemical properties of SlCERs.
2.2. Analysis of Physicochemical Properties of SlCERs
The physicochemical properties of SlCER proteins, including the number of amino acids, molecular weight, theoretical isoelectric point (pI), instability index (an estimate of the stability of the protein in a test tube), aliphatic index (the relative volume occupied by aliphatic side chains) and grand average of hydropathicity (GRAVY, calculated as the sum of hydropathy values of all the amino acids, divided by the number of residues in the sequence) [48], were evaluated using the ProtParam tool (https://web.expasy.org/protparam/, accessed on 20 February 2023). The distribution of SlCERs on chromosomes was visualized using the MG2C website (http://mg2c.iask.in/mg2c_v2.1/, accessed on 28 February 2023) (Table S2).
2.3. Phylogenetic Analysis
A total of 11 species’ CER protein sequences were used for phylogenetic analysis. Aside from Solanum lycopersicum and Arabidopsis thaliana, several CER protein sequences were obtained from supplementary files previously reported, including those from Malus domestica [33], Ziziphus jujube [34], Helianthus annuus [35] and Passiflora edulis [36], while others from Capsicum annuum, Cucumis sativus, Oryza sativa, Solanum tuberosum and Zea mays were downloaded from the NCBI website (https://www.ncbi.nlm.nih.gov/, accessed on 3 March 2023). In this study, a total of 177 CER protein sequences were aligned using the Clustal method. A Neighbor-Joining tree was constructed using ClustalX (version 2.1) [49], and the phylogenetic tree annotations and management were performed using the iTOL website (https://itol.embl.de/, accessed on 12 June 2023).
2.4. Motif Analysis of SlCERs
To identify motifs in the SlCER protein sequences, we used the MEME website (https://meme-suite.org/meme/tools/meme, accessed on 9 March 2023) with parameters set to 200 motifs and default settings, retaining only motifs with an E-value smaller than 0.05. The resulting motifs were visualized using the TBtools software (version v1.1.20) [50].
2.5. Analysis of Cis-Acting Elements of SlCERs
We extracted 2000 bp sequences upstream of the SlCER genes using samtools (version 1.10) [51] and searched for cis-acting elements using the PlantCARE website (https://bioinformatics.psb.ugent.be/webtools/plantcare/html/, accessed on 31 March 2023) [52]. Statistical analyses and visualizations were performed using the R (version 4.2.2) package ggplot2 (version 3.4.1) (Tables S3 and S4).
2.6. RNA-Seq Analysis
Raw sequencing reads for this study were obtained from the NCBI database (BioProject numbers PRJNA635375, PRJNA624032, PRJNA419151, PRJNA639037 and PRJNA756681). We filtered low-quality reads using fastp (version 0.20.0) [53] and aligned the remaining reads to the tomato reference genome (version SL4.0) using Hisat2 (version 2.1.0) [54]. The resulting RNA-seq alignments were assembled into potential transcripts using StringTie (version 2.0.6) [55].
To better visualize the expression profiles and eliminate any potential outliers, we normalized the expression levels of transcripts to fragments per kilobase of exon per million reads (FPKM), followed by Z-score normalization. The significance of expression differences among treatments was calculated using the Kruskal–Wallis test in R. To visualize the expression profiles, we used the R package ComplexHeatmap (version 2.14.0).
2.7. Variants Calling and Haplotype Analysis
We obtained raw ILLUMINA sequencing reads from previously sequenced tomato accessions from NCBI (BioProject numbers PRJNA454805, PRJNA557253, PRJNA259308, PRJNA353161 and PRJEB5283), as well as from the SGN website. The low-quality reads were filtered using fastp. The remaining reads were aligned to the tomato reference genome (version SL4.0) using bwa (version 0.7.17-r1188) [56]. We performed variant calling using bcftools (version 1.9) [51] and extracted single-nucleotide polymorphisms (SNPs) using the SelectVariants module in GATK (version 4.1.2.0) [57], with filtering based on quality parameters including QD < 2.0, FS > 60.0, MQ < 40.0, MQRankSum < −12.5 and ReadPosRankSum< −8.0. We then filtered the raw SNPs based on the proportion of missing data and minor allele frequency (–max-missing 0.7; --maf 0.02) using vcftools (version 0.1.16) [58].
SNPs located in the coding sequence (CDS) region were extracted and used to calculate FST values between groups using vcftools, with a threshold of 0.4 set based on previous experience. Haplotype analysis was performed using the geneHapR package (version 1.1.9), excluding accessions with missing or heterozygous sites. Visualization of the results was accomplished using the ggplot2 package.
3. Results
3.1. Identification of CER Genes in Tomato
Twenty-six SlCER genes were identified to be distributed on ten chromosomes, with the exception of Chr4 and Chr10 (Figure 1; Table S1). We named these genes based on their homology to Arabidopsis. The physicochemical properties play a key role in functional annotation; thus, we predicted the physicochemical properties of SlCERs (Table 1). The length of SlCERs protein ranged from 125 (SlCER9-2) to 1861 (SlCER13) amino acids, with a corresponding molecular weight range of 13.45 to 207.4 kDa. The isoelectric points ranged from 4.39 (SlCER9-2) to 9.7 (SlCER10-1). The instability index ranged from 24.48 (SlCER4-1) to 70.88 (SlCER9-2). Seventeen SlCERs were deemed stable (instability index smaller than 40) and nine SlCERs were unstable (greater than 40). The aliphatic index ranged from 56.32 (SlCER9-2) to 109.7 (SlCER13), while the GRAVY ranged from −0.744 (SlCER16) to 0.289 (SlCER9-1).
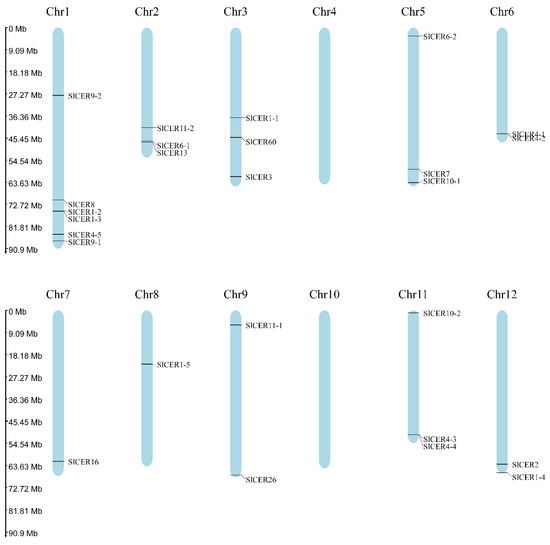
Figure 1.
The distribution of SlCERs in tomato genome. The blue bars represent the chromosomes, and the rulers show the physical location.
To evaluate the homology among the CERs, we constructed a phylogenetic tree with a total of 177 CERs protein sequences from 10 species covering the Compositae, Cruciferae, Cucurbitaceae, Gramineae, Passifloraceae, Rhamnaceae, Rosaceae and Solanaceae families (Figure 2). Dominated by AtCERs, these proteins were divided into four clades. Clade 1 contained CER1s and CER3s, Clade 2 contained CER6s and CER60s, Clade 3 contained CER9s and CER17s and Clade 4 contained CER2s, CER4s, CER7s, CER9s, CER10s, CER11s, CER13s, CER16s and CER26s. The clusters of SlCERs were mainly in accord with AtCERs, which supported our SlCERs identification results. However, SlCER10-2 was not clustered together with SlCER10-1 but instead was in Clade 3, which may be due to its lower identity (31.8%) with AtCER10 (Table S1). For most SlCERs, they shared more homology with HanCERs than other species’ CERs. However, in Clade 4, SlCER2, SlCER16 and SlCER26 shared more homology with StCERs and CaCERs, which suggested that these protein sequences are conserved among Solanaceae plants.
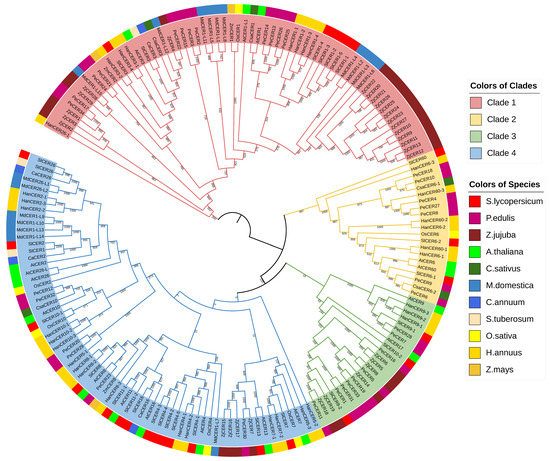
Figure 2.
The phylogenetic tree of CER proteins. Clades are distinguished by colors of branches. Species are distinguished by colors of labels.
3.2. Motifs Analysis of SlCERs
For a deeper understanding of the structural features of SlCERs, we predicted the motifs in their protein sequences using the MEME website. We identified 42 reliable motifs (E-value < 0.05), with a distribution frequency ranging from 2 to 9, reflecting the diversity of SlCER protein structures (Figure 3 and Figure S1). We detected eleven motifs shared in SlCER1s and SlCER3, ten motifs shared in SlCER4s, eight motifs shared in SlCER6s and SlCER60, four motifs shared in SlCER11s, two motifs shared in SlCER9s and one motif shared in SlCER2 and SlCER26. No motif was detected in SlCER7, SlCER10 and SlCER16. Motif14 had the widest distribution, being present in SlCER1s, SlCER3, SlCER6s and SlCER60. These results reflect the diversity and conservation among SlCER proteins.
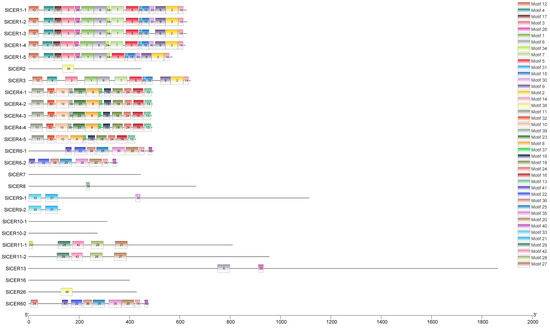
Figure 3.
Location of SlCERs motifs. 42 motifs are represented by colors.
3.3. Cis-Acting Element Analysis of SlCER Genes
In order to investigate the possible functions of SlCERs, we extracted the upstream 2000 bp sequences of each SlCER gene for cis-acting element searching. According to the function annotation of the searching result, cis-acting elements mainly comprised four categories (Figure 4; Table S4). A light responsiveness term was contained in all the SlCERs, followed by stress responsiveness terms (25 SlCERs), phytohormone responsiveness terms (24 SlCERs) and plant growth and development terms (16 SlCERs). Due to the defense functions of wax, we focused on stress responsive and phytohormone responsive function terms to explore the potential transcription factor binding sites of SlCERs. Five kinds of cis-acting elements associated with phytohormone responsiveness were detected (Figure 5a,b), in order of count, including methyl jasmonate (CGTCA-motif and TGACG-motif types), abscisic acid (ABRE type), gibberellin (GARE-motif, P-box and TATC-box types), auxin (AuxRR-core, TGA-box and TGA-element types) and salicylic acid (SARE and TCA-element types). Five kinds of cis-acting elements associated with stress responsiveness were detected (Figure 5c,d), in order, including anaerobic induction (ARE type), drought (MBS type), defense& stress (TC-rich repeats type), low-temperature (LTR type) and wound (WUN-motif type). These sites provided support for possible interactions among genes.
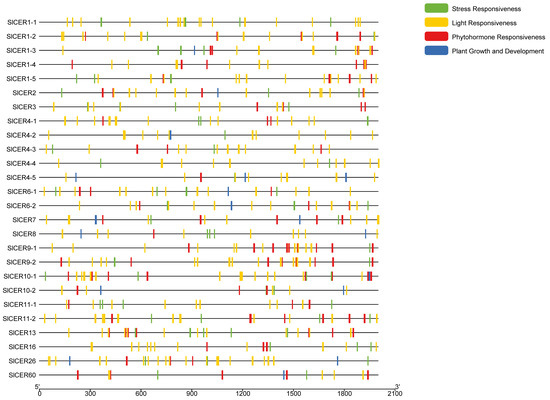
Figure 4.
Cis-acting elements of SlCERs. Bins with different functions are represented by colors. Lines represent the 2000 bp upstream regions of genes.
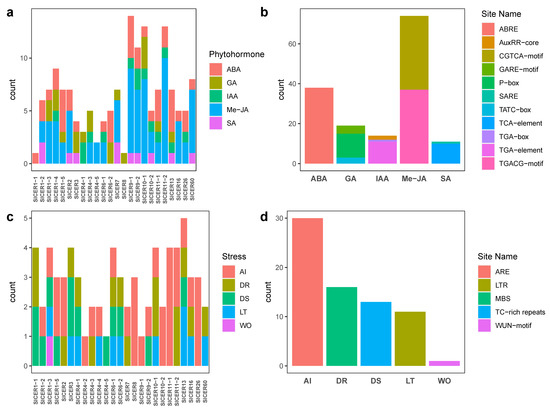
Figure 5.
Statistics of cis-acting elements for SlCERs. (a) Statistics of cis-acting elements involved in phytohormone responsiveness. (b) Statistics on the count of types of cis-acting elements for phytohormone. (c) Statistics of cis-acting elements involved in stress responsiveness. (d) Statistics on the count of types of cis-acting elements for stress. ABA, abscisic acid; IAA, auxin; GA, gibberellin; Me-JA, methyl jasmonate; SA, salicylic acid; AI, anaerobic induction; DS, defense and stress; DR, drought; LT, low temperature; Wo, wound.
3.4. Expression Profiles of SlCERs during Different Development Stages
In order to explore the spatial and temporal transcriptional characteristics of SlCERs and analyze their function, we searched for their expression profiles on eFP Browser 2.0 website (https://bar.utoronto.ca/efp2/, accessed on 4 April 2023) and TEA website (https://tea.solgenomics.net/, accessed on 4 April 2023) (Tables S5 and S6). As shown in Figure 6a, SlCER1-4 was mainly expressed in roots, SlCER1-3 was mainly expressed in flowers and seven SlCERs (SlCER1-1, SlCER1-5, SlCER3, SlCER6-1, SlCER8, SlCER10-2 and SlCER26) showed higher expression levels in both leaves and flowers. As shown in Figure 6b, SlCER1-2 was mainly expressed in fruits, and the expression level increased sharply after the breaker stage; SlCER1-1 showed an inside-out pattern of expression during fruit development, and a total of ten SlCERs (SlCER1-1, SlCER1-5, SlCER2, SlCER3, SlCER4-1, SlCER6-1, SlCER6-2, SlCER8, SlCER10-1 and SlCER26) showed higher expression levels in the outer epidermis of fruit. These specific expression patterns imply their functions in the biotic/abiotic resistance of leaves, pollen fertility of flowers or glossiness and shelf life of the fruits by potentially influencing the synthesis of wax. Several genes, including SlCER7, SlCER9-1, SlCER11-1 and SlCER11-2, did not show an obvious preference for any organ or stage of fruit development, indicating that their expression is constitutive. Furthermore, SlCER4-2, SlCER4-3, SlCER4-4, SlCER4-5 and SlCER60 exhibited low expression levels across all developmental stages of the fruit, as well as in the roots and leaves, implying that their expression is likely non-constitutive.
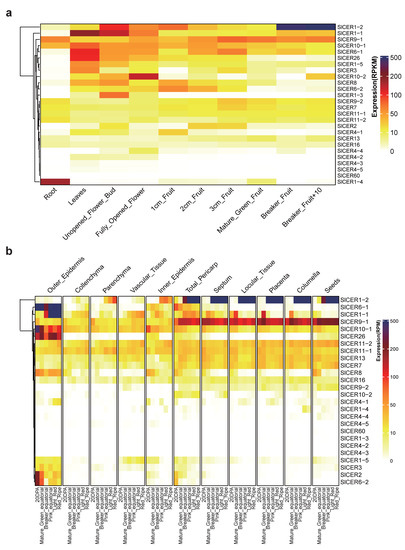
Figure 6.
Expression levels of SlCERs during the development stage. (a) Global perspective of expression levels during the different development stages in cv. Heinz 1706. The data are normalized by reads per kilobase of exon model per million mapped reads (RPKM). (b) The perspective of expression levels during fruit development in cv. M82. The data are normalized by reads of exon model per million mapped reads (RPM). Colors from white to blue reflect the expression levels.
3.5. Expression Profiles of SlCERs under Abiotic/Biotic Stress
In order to explore SlCERs’ expression patterns under abiotic/biotic stresses, we downloaded the transcriptome sequencing data of tomato under stresses of drought, heat, salt, pathogenic bacteria [59,60] and parasitic plant [61] on the NCBI website (https://www.ncbi.nlm.nih.gov/). Genes without significant expression change among treatments were excluded from the analysis (Kruskal–Wallis test, p < 0.05) (Tables S7–S12).
Further, 22, 15 and 10 SlCERs showed changes in their expression levels under drought, heat and salt stress treatments, respectively (Figure 7a–c). In response to drought stress, eight SlCERs were downregulated and then upregulated during the recovery treatment, whereas the other fourteen showed the opposite expression pattern (Figure 7a). Similarly, under heat stress, six SlCERs were upregulated, followed by downregulation upon recovery (Figure 7b), and the other nine were initially downregulated by heat stress, and various regulation trends appeared after the recovery treatment, suggesting that some SlCERs’ expression was influenced by heat stress and could not be reversed. For salt stress, five SlCERs showed an increase in expression, while the other five showed a decrease in expression (Figure 7c).
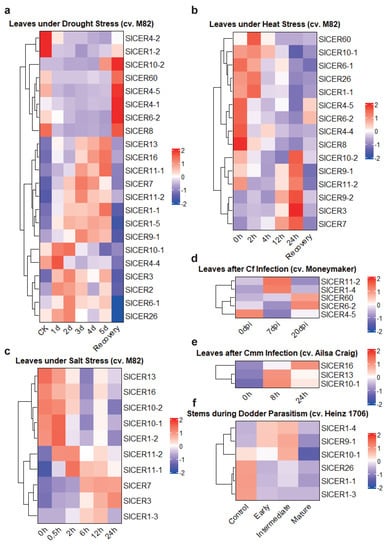
Figure 7.
The expression profiles of SlCERs under abiotic/biotic stress. (a) The expression profiles of SlCERs under drought stress. The sequenced samples are seedling-stage leaves of tomato (cv. M82). Seven treatments are control, drought-treated for 1 day, 2 days, 3 days, 4 days, 5 days and recovery, respectively. (b) The expression profiles of SlCERs under heat stress. The sequenced samples are seedling-stage leaves of tomato (cv. M82). Six treatments are heat-treated for 0 h, 2 h, 4 h, 12 h, 24 h and recovery, respectively. (c) The expression profiles of SlCERs under salt stress (treated with NaCl). The sequenced samples are seedling-stage leaves of tomato (cv. M82). Six treatments are treated for 0 h, 0.5 h, 2 h, 6 h, 12 h and 24 h, respectively. (d) The expression profiles of SlCERs after Cf infection. The sequenced samples are leaves of tomato (cv. Moneymaker), which are collected at 0, 7 and 20 days following inoculation (dpi). (e) The expression profiles of SlCERs after Cmm infection. The sequenced samples are leaves next to the inoculation site of tomato (cv. Ailsa Craig), which are collected at 0, 8 and 24 h following inoculation (hpi). (f) The expression profiles of SlCERs during dodder parasitism. The sequenced samples are stem tissues of tomato (cv. Heinz 1706) next to C. campestris haustoria, which are collected at early, intermediate and mature stage of the haustoria. The data are normalized into fragments per kilobase of exon per million reads (FPKM) following Z-score normalization. Expression levels are mapping from blue (the lower) to red (the higher).
Furthermore, five, three and six SlCERs showed changes in their expression levels during Cladosporium fulvum (Cf) infection, Clavibacter michiganensis subsp. michiganensis (Cmm) infection and dodder parasitism, respectively (Figure 7d–f). Four SlCERs were upregulated upon Cf infection, with different expression levels at 7dpi and 20dpi (Figure 7d). Similarly, three SlCERs showed an ascending expression pattern during Cmm infection (Figure 7e). Additionally, upon dodder parasitism, three SlCERs were upregulated, while three others were downregulated; however, all six SlCERs showed low expression levels at the mature stage of the haustoria, indicating a potential role of these genes against the haustoria only at earlier stages of invasion (Figure 7f).
Based on our findings, more SlCERs exhibited changes in expression in response to abiotic stresses than biotic stresses, suggesting their primary function may involve responding to abiotic stress, particularly drought stress. We speculated that SlCER3, SlCER7, SlCER10-1, SlCER10-2 and SlCER11-2 may be involved in a key pathway of stress response and play crucial roles in responding to abiotic stress as their expression levels were regulated by all three abiotic stresses. Meanwhile, thirteen SlCERs (SlCER1-1, SlCER1-2, SlCER4-4, SlCER4-5, SlCER6-1, SlCER6-2, SlCER8, SlCER9-1, SlCER11-1, SlCER13, SlCER16, SlCER26 and SlCER60) responded to two abiotic stresses, and six SlCERs (SlCER1-3, SlCER1-5, SlCER2, SlCER4-1, SlCER4-2 and SlCER9-2) responded to only one type of abiotic stress, indicating their function specificity.
3.6. Selection on SlCERs during Domestication and Improvement
We collected sequencing data from previous reports [41,42,43,44] to investigate whether the SlCERs were under selection during domestication and improvement. A total of 653 accessions consisting of 34 S. pimpinellifolium (SP), 229 S. lycopersicum var. cerasiforme (SLC) and 390 S. lycopersicum var. lycopersicum (SLL) were analyzed to understand the two stages, the domestication stage from SP to SLC and the improvement stage from SLC to SLL [41].
After SNP calling and filtering, we identified CDS-region SNP variants in 24 out of 26 SlCERs. To better understand the role of SlCERs during domestication and improvement, the fixation indices (FST) were calculated in two stages. The results illustrated that differentiation was present in most SlCERs (22 in 24) during the domestication stage, indicating the critical functions of SlCERs during domestication (Figure 8a). Only SlCER4-5 showed differentiation in the improvement stage, potentially related to the response to drought, heat and Cf-infection stresses (Figure 7a,b,d and Figure 8b). To further illustrate the differentiation, we calculated the haplotype frequency of each SlCER in SP, SLC and SLL groups. Two to eighteen haplotypes were identified in each SlCER, and the haplotype diversity declined dramatically during domestication, supporting the higher levels of FST in the domestication stage (Figure 8c; Table S13). These findings suggested that SlCERs underwent diversity decline during the domestication of tomato from harsh wild environments to relatively friendly semi-wild environments, resulting in low haplotype diversity in both SLC and SLL groups.
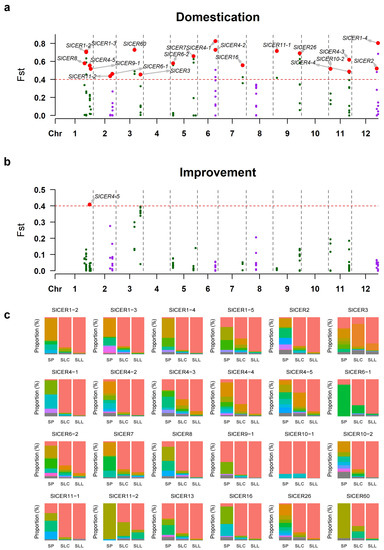
Figure 8.
Selection against SlCERs during domestication and improvement. (a) FST values for all CDS-region SNP sites between SP and SLC. (b) FST values for all CDS-region SNP sites between SLC and SLL. Red dots above the horizontal dashed line represent highly differentiated SNPs; locating genes are marked. (c) Haplotypes change among SP to SLC to SLL. Proportion of haplotypes is represented by colorful blocks. The numbers of accessions in SP, SLC and SLL are 34, 229 and 390, respectively.
4. Discussion
CER genes perform vital functions in wax biosynthesis. Based on the sequence homology with 17 AtCERs, 26 SlCERs were identified in this study, and the number is less than that in jujube (29), Chinese chestnut (34), passion fruit (34) and sunflower (37) but more than that in apple (10) [33,34,35,36,37]. However, the homologous gene of AtCER17 was not identified here. The subcellular localization prediction (Table S14) showed that 24 SlCERs were located on either the endoplasmic reticulum or the cytoplasm, where the wax was formed or transported [7], except for SlCER13 and SlCER16, which were located on the nucleus. In total, one-hundred-seventy-seven CERs identified from the different species were divided into five clades. In Brassicaceae, some CERs have been demonstrated to be paralogs, such as CER1 and CER3 and CER6 and CER60 [62,63]. Our phylogenetic tree showed consistent results with it. Furthermore, we found that SlCER2, SlCER16 and SlCER26 shared more homology with CERs of C. annuum and S. tuberosum on Clade 4, reflecting a closer relationship among Solanaceae plants. SlCER3 was closer to HanCER3s than StCER3 and CaCER3, suggesting the existence of a non-conserved relationship in Solanaceae plants. However, the relationships of the remaining CERs still need to be addressed further due to the limited Solanaceae CERs’ sequences information.
Plants have evolved a complex regulatory system to challenge environments. The phytohormones play an important role during this procedure [64]. To find clues of how SlCERs respond to stresses, we focused on cis-acting elements involved in responsiveness of phytohormone and stress, combined with transcriptome analysis. Surprisingly, although almost all the SlCERs showed responses to drought stress in transcriptome analysis, only 13 of 26 SlCERs had cis-acting elements involved in drought stress (Figure 5c and Figure 7a). The remaining SlCERs without drought-responsive cis-acting elements have cis-acting elements involved in kinds of phytohormone, such as abscisic acid, auxin, gibberellin, methyl jasmonate and salicylic acid. This evidence hinted that these SlCERs without drought-responsive cis-acting elements might respond to drought stress mediated by the phytohormones.
Up to now, ample evidence has demonstrated the high correlation between expression levels obtained from sequencing-based methods and those from qRT-PCR-based methods [65,66,67]. Recently, the expression patterns of PeCERs in passion fruit were characterized by RNA-seq and confirmed by qRT-PCR. Both results showed the expected consistency [36]. All these findings hinted at availability for analysis of gene expression by RNA-seq independently. In this study, the expression profiles of SlCERs in the different development stages and under abiotic/biotic stress were analyzed by RNA-seq data. To further validate our results, the previous expression profiles of SlCER1s and SlCER3 quantified by qRT-PCR in different tomato organs were compared with our RNA-seq results and the evidence showed that there was much parallelism. Further, these results were verified again in cucumber crop under drought and salt stresses [28,29]. Hence, we suggested that RNA-seq data could appropriately characterize gene expression profiles independently.
The findings from this study show that 22 out of 26 SlCERs were involved in the domestication of the tomato crop. However, only four of twenty-two SlCERs (SlCER1-2, SlCER1-3, SlCER4-5 and SlCER9-1) could be located in the putative domestication sweeps [41]. The bias might result from the different calculations. In the previous identification, the putative domestication sweeps were calculated by slide window [41]. It absolutely can provide a global view of the selection over the genome but may ignore the differentiation among single-locus ones [68]. Instead, calculating FST with CDS-region SNP sites as used in our analysis can improve the insight on specific genes and avoided false positives caused by neutral selection, as demonstrated in human [69], rice [70] and tomato [71]. Meanwhile, the diversity of 22 SlCERs decreased rapidly during the domestication and improvement, indicating that they might have been subject to strong selection pressure. As is widely known, all the wild tomato relatives, including S. pimpinellifolium, are distributed in the dry desert or pre-desert environments of the western Andes [72], which endows them with diverse stress-resistant genes, particularly those that confer drought resistance. Meanwhile, S. lycopersicum var. cerasiforme grows either in humid environments as a true wild species or human-modified areas as a cultivated crop [73]. This evidence suggests that the domestication of tomato involved at least two selective pressures, one imposed naturally through changes in the growth environment and another artificially imposed through selection for fruit appearance. The expression profiles of SlCERs showed their expression in leaves and fruits (Figure 6a), implying their contribution to drought resistance and fruit quality. Hence, we supposed that the decreased diversity in SlCERs might be caused by (1) the consecutive self-pollination, and the selection happened in a predominantly inbreeding species [74]; (2) the decreased diversity for challenging environments during the domestication [75] and (3) artificial selection on human favor traits influenced by SlCERs somehow, which should be focused on in the further functional studies. This evidence might provide the approach for genetic improvement regarding tomato crop against environmental stresses in the near future.
5. Conclusions
Overall, twenty-six SlCER genes were identified in S. lycopersicum, and they were classified into four clades. These SlCERs were mainly expressed in leaves, flowers or fruits and played roles in response to abiotic stresses, especially drought stress. The decline in diversity in 22 SlCER genes during the domestication process suggests a tradeoff between environmental adaptation and domestication traits. Deciding how to properly combine and apply these genes in stress-resistant breeding is a consideration regarding our next steps, and the specific effects of these genes on phenotypes still need to be experimentally validated. Nevertheless, our identification of the SlCER genes would lay a foundation for future functional research and provide insights for anti-stress improvement regarding tomato crop.
Supplementary Materials
The following supporting information can be downloaded at: https://www.mdpi.com/article/10.3390/horticulturae9070748/s1, Figure S1: Sequence features of 42 motifs; Table S1: The result of SlCERs identification by BLASTP and Pfam searching; Table S2: The distribution of SlCERs in tomato genome; Table S3: Cis-acting element region of SlCERs; Table S4: Function annotations of cis-acting elements; Table S5: Expression levels of SlCERs during the development stage; Table S6: Expression levels of SlCERs during the development stage; Table S7: The expression profiles of SlCERs under drought stress; Table S8: The expression profiles of SlCERs under heat stress; Table S9: The expression profiles of SlCERs under salt stress; Table S10: The expression profiles of SlCERs after Cf infection; Table S11: The expression profiles of SlCERs after Cmm infection; Table S12: The expression profiles of SlCERs during dodder parasitism; Table S13: The haploytpes of SlCERs in accessions; Table S14: Subcellular localization prediction of SlCERs.
Author Contributions
Conceptualization, F.P. and X.L. (Xin Li); methodology, D.Z., X.L. (Xiaoxiao Lu) and C.P.; data curation, J.H., W.S., H.Z., C.Z. and X.L. (Xin Li); writing—original draft preparation, F.P.; writing—review and editing, X.L. (Xin Li); visualization, L.S.; supervision, Y.G., Z.H., X.W., Y.D., L.L. and J.L.; project administration, L.L. and J.L.; funding acquisition, J.L. All authors have read and agreed to the published version of the manuscript.
Funding
This research was funded by National Natural Science Foundation of China (grant number 31991185), the Fundamental Research Funds for Central Nonprofit Scientific Institution (grant number IVF-BRF2018006), the Key Laboratory of Biology and Genetic Improvement of Horticultural Crops, Ministry of Agriculture, China and the Science and Technology Innovation Program of the Chinese Academy of Agricultural Sciences (grant number CAASASTIP-IVFCAAS).
Data Availability Statement
All datasets presented in this study are included in the article.
Conflicts of Interest
The authors declare no conflict of interest.
References
- Lewandowska, M.; Keyl, A.; Feussner, I. Wax Biosynthesis in Response to Danger: Its Regulation upon Abiotic and Biotic Stress. New Phytol. 2020, 227, 698–713. [Google Scholar] [CrossRef] [PubMed]
- Baker, E.A. The Influence of Environment on Leaf Wax Development in Brassica Oleracea Var. Gemmifera. New Phytol. 1974, 73, 955–966. [Google Scholar] [CrossRef]
- Koch, K.; Hartmann, K.D.; Schreiber, L.; Barthlott, W.; Neinhuis, C. Influences of Air Humidity during the Cultivation of Plants on Wax Chemical Composition, Morphology and Leaf Surface Wettability. Environ. Exp. Bot. 2006, 56, 1–9. [Google Scholar] [CrossRef]
- Kunst, L.; Samuels, A.L. Biosynthesis and Secretion of Plant Cuticular Wax. Prog. Lipid Res. 2003, 42, 51–80. [Google Scholar] [CrossRef]
- Jetter, R.; Kunst, L.; Samuels, A.L. Composition of Plant Cuticular Waxes. In Biology of the Plant Cuticle; Riederer, M., Mller, C., Eds.; Blackwell Publishing Ltd.: Oxford, UK, 2006; pp. 145–181. ISBN 978-0-470-98871-8. [Google Scholar]
- Koornneef, M.; Hanhart, C.J.; Thiel, F. A Genetic and Phenotypic Description of Eceriferum (Cer) Mutants in Arabidopsis Thaliana. J. Hered. 1989, 80, 118–122. [Google Scholar] [CrossRef]
- Samuels, L.; Kunst, L.; Jetter, R. Sealing Plant Surfaces: Cuticular Wax Formation by Epidermal Cells. Annu. Rev. Plant Biol. 2008, 59, 683–707. [Google Scholar] [CrossRef]
- Jenks, M.A.; Tuttle, H.A.; Eigenbrode, S.D.; Feldmann, K.A. Leaf Epicuticular Waxes of the Eceriferum Mutants in Arabidopsis. Plant Physiol. 1995, 108, 369–377. [Google Scholar] [CrossRef]
- Goodwin, S.M.; Rashotte, A.M.; Rahman, M.; Feldmann, K.A.; Jenks, M.A. Wax Constituents on the Inflorescence Stems of Double Eceriferum Mutants in Arabidopsis Reveal Complex Gene Interactions. Phytochemistry 2005, 66, 771–780. [Google Scholar] [CrossRef]
- Tresch, S.; Heilmann, M.; Christiansen, N.; Looser, R.; Grossmann, K. Inhibition of Saturated Very-Long-Chain Fatty Acid Biosynthesis by Mefluidide and Perfluidone, Selective Inhibitors of 3-Ketoacyl-CoA Synthases. Phytochemistry 2012, 76, 162–171. [Google Scholar] [CrossRef]
- Pascal, S.; Bernard, A.; Sorel, M.; Pervent, M.; Vile, D.; Haslam, R.P.; Napier, J.A.; Lessire, R.; Domergue, F.; Joubès, J. The Arabidopsis Cer26 Mutant, like the Cer2 Mutant, Is Specifically Affected in the Very Long Chain Fatty Acid Elongation Process. Plant J. 2013, 73, 733–746. [Google Scholar] [CrossRef]
- Batsale, M.; Alonso, M.; Pascal, S.; Thoraval, D.; Haslam, R.P.; Beaudoin, F.; Domergue, F.; Joubès, J. Tackling Functional Redundancy of Arabidopsis Fatty Acid Elongase Complexes. Front. Plant Sci. 2023, 14, 1107333. [Google Scholar] [CrossRef] [PubMed]
- Rowland, O.; Zheng, H.; Hepworth, S.R.; Lam, P.; Jetter, R.; Kunst, L. CER4 Encodes an Alcohol-Forming Fatty Acyl-Coenzyme A Reductase Involved in Cuticular Wax Production in Arabidopsis. Plant Physiol. 2006, 142, 866–877. [Google Scholar] [CrossRef] [PubMed]
- Bernard, A.; Domergue, F.; Pascal, S.; Jetter, R.; Renne, C.; Faure, J.-D.; Haslam, R.P.; Napier, J.A.; Lessire, R.; Joubès, J. Reconstitution of Plant Alkane Biosynthesis in Yeast Demonstrates That Arabidopsis ECERIFERUM1 and ECERIFERUM3 Are Core Components of a Very-Long-Chain Alkane Synthesis Complex. Plant Cell 2012, 24, 3106–3118. [Google Scholar] [CrossRef] [PubMed]
- Doblas, V.G.; Amorim-Silva, V.; Posé, D.; Rosado, A.; Esteban, A.; Arró, M.; Azevedo, H.; Bombarely, A.; Borsani, O.; Valpuesta, V.; et al. The SUD1 Gene Encodes a Putative E3 Ubiquitin Ligase and Is a Positive Regulator of 3-Hydroxy-3-Methylglutaryl Coenzyme A Reductase Activity in Arabidopsis. Plant Cell 2013, 25, 728–743. [Google Scholar] [CrossRef]
- Yang, X.; Zhao, H.; Kosma, D.K.; Tomasi, P.; Dyer, J.M.; Li, R.; Liu, X.; Wang, Z.; Parsons, E.P.; Jenks, M.A.; et al. The Acyl Desaturase CER17 Is Involved in Producing Wax Unsaturated Primary Alcohols and Cutin Monomers. Plant Physiol. 2017, 173, 1109–1124. [Google Scholar] [CrossRef]
- Pascal, S.; Bernard, A.; Deslous, P.; Gronnier, J.; Fournier-Goss, A.; Domergue, F.; Rowland, O.; Joubès, J. Arabidopsis CER1-LIKE1 Functions in a Cuticular Very-Long-Chain Alkane-Forming Complex. Plant Physiol. 2019, 179, 415–432. [Google Scholar] [CrossRef]
- Yang, X.; Feng, T.; Li, S.; Zhao, H.; Zhao, S.; Ma, C.; Jenks, M.A.; Lü, S. CER16 Inhibits Post-Transcriptional Gene Silencing of CER3 to Regulate Alkane Biosynthesis. Plant Physiol. 2020, 182, 1211–1221. [Google Scholar] [CrossRef]
- Fukuda, N.; Oshima, Y.; Ariga, H.; Kajino, T.; Koyama, T.; Yaguchi, Y.; Tanaka, K.; Yotsui, I.; Sakata, Y.; Taji, T. ECERIFERUM 10 Encoding an Enoyl-CoA Reductase Plays a Crucial Role in Osmotolerance and Cuticular Wax Loading in Arabidopsis. Front. Plant Sci. 2022, 13, 898317. [Google Scholar] [CrossRef]
- Shi, L.; Dean, G.H.; Zheng, H.; Meents, M.J.; Haslam, T.M.; Haughn, G.W.; Kunst, L. ECERIFERUM11/C-TERMINAL DOMAIN PHOSPHATASE-LIKE2 Affects Secretory Trafficking. Plant Physiol. 2019, 181, 901–915. [Google Scholar] [CrossRef]
- Aarts, M.G.; Keijzer, C.J.; Stiekema, W.J.; Pereira, A. Molecular Characterization of the CER1 Gene of Arabidopsis Involved in Epicuticular Wax Biosynthesis and Pollen Fertility. Plant Cell 1995, 7, 2115–2127. [Google Scholar] [CrossRef]
- Hulskamp, M.; Kopczak, S.D.; Horejsi, T.F.; Kihl, B.K.; Pruitt, R.E. Identification of Genes Required for Pollen-Stigma Recognition in Arabidopsis Thaliana. Plant J. 1995, 8, 703–714. [Google Scholar] [CrossRef]
- Fiebig, A.; Mayfield, J.A.; Miley, N.L.; Chau, S.; Fischer, R.L.; Preuss, D. Alterations in CER6, a Gene Identical to CUT1, Differentially Affect Long-Chain Lipid Content on the Surface of Pollen and Stems. Plant Cell 2000, 12, 2001–2008. [Google Scholar] [CrossRef]
- Ueda, A.; Li, P.; Feng, Y.; Vikram, M.; Kim, S.; Kang, C.H.; Kang, J.S.; Bahk, J.D.; Lee, S.Y.; Fukuhara, T.; et al. The Arabidopsis Thaliana Carboxyl-Terminal Domain Phosphatase-like 2 Regulates Plant Growth, Stress and Auxin Responses. Plant Mol. Biol. 2008, 67, 683–697. [Google Scholar] [CrossRef] [PubMed]
- Bourdenx, B.; Bernard, A.; Domergue, F.; Pascal, S.; Léger, A.; Roby, D.; Pervent, M.; Vile, D.; Haslam, R.P.; Napier, J.A.; et al. Overexpression of Arabidopsis ECERIFERUM1 Promotes Wax Very-Long-Chain Alkane Biosynthesis and Influences Plant Response to Biotic and Abiotic Stresses. Plant Physiol. 2011, 156, 29–45. [Google Scholar] [CrossRef]
- Lü, S.; Zhao, H.; Des Marais, D.L.; Parsons, E.P.; Wen, X.; Xu, X.; Bangarusamy, D.K.; Wang, G.; Rowland, O.; Juenger, T.; et al. Arabidopsis ECERIFERUM9 Involvement in Cuticle Formation and Maintenance of Plant Water Status. Plant Physiol. 2012, 159, 930–944. [Google Scholar] [CrossRef] [PubMed]
- Zhou, L.; Ni, E.; Yang, J.; Zhou, H.; Liang, H.; Li, J.; Jiang, D.; Wang, Z.; Liu, Z.; Zhuang, C. Rice OsGL1-6 Is Involved in Leaf Cuticular Wax Accumulation and Drought Resistance. PLoS ONE 2013, 8, e65139. [Google Scholar] [CrossRef] [PubMed]
- Wang, W.; Zhang, Y.; Xu, C.; Ren, J.; Liu, X.; Black, K.; Gai, X.; Wang, Q.; Ren, H. Cucumber ECERIFERUM1 (CsCER1), Which Influences the Cuticle Properties and Drought Tolerance of Cucumber, Plays a Key Role in VLC Alkanes Biosynthesis. Plant Mol. Biol. 2015, 87, 219–233. [Google Scholar] [CrossRef] [PubMed]
- Wang, W.; Liu, X.; Gai, X.; Ren, J.; Liu, X.; Cai, Y.; Wang, Q.; Ren, H. Cucumis Sativus L. WAX2 Plays a Pivotal Role in Wax Biosynthesis, Influencing Pollen Fertility and Plant Biotic and Abiotic Stress Responses. Plant Cell Physiol. 2015, 56, 1339–1354. [Google Scholar] [CrossRef]
- Liu, D.; Tang, J.; Liu, Z.; Dong, X.; Zhuang, M.; Zhang, Y.; Lv, H.; Sun, P.; Liu, Y.; Li, Z.; et al. Cgl2 Plays an Essential Role in Cuticular Wax Biosynthesis in Cabbage (Brassica Oleracea L. Var. Capitata). BMC Plant Biol. 2017, 17, 223. [Google Scholar] [CrossRef]
- Mustafa, R.; Hamza, M.; Kamal, H.; Mansoor, S.; Scheffler, J.; Amin, I. Tobacco Rattle Virus-Based Silencing of Enoyl-CoA Reductase Gene and Its Role in Resistance Against Cotton Wilt Disease. Mol. Biotechnol. 2017, 59, 241–250. [Google Scholar] [CrossRef]
- Aryal, B.; Shinohara, W.; Honjo, M.N.; Kudoh, H. Genetic Differentiation in Cauline-Leaf-Specific Wettability of a Rosette-Forming Perennial Arabidopsis from Two Contrasting Montane Habitats. Ann. Bot. 2018, 121, 1351–1360. [Google Scholar] [CrossRef] [PubMed]
- Qi, C.; Jiang, H.; Zhao, X.; Mao, K.; Liu, H.; Li, Y.; Hao, Y. The Characterization, Authentication, and Gene Expression Pattern of the MdCER Family in Malus Domestica. Hortic. Plant J. 2019, 5, 1–9. [Google Scholar] [CrossRef]
- Li, N.; Li, X.Z.; Song, Y.Q.; Yang, S.T.; Li, L.L. Genome-Wide Identification, Characterization, and Expression Profiling of the ECERIFERUM (CER) Gene Family in Ziziphus Jujube. Russ. J. Plant Physiol. 2021, 68, 828–837. [Google Scholar] [CrossRef]
- Muhammad Ahmad, H.; Wang, X.; Fiaz, S.; Mahmood-Ur-Rahman; Azhar Nadeem, M.; Aslam Khan, S.; Ahmar, S.; Azeem, F.; Shaheen, T.; Mora-Poblete, F. Comprehensive Genomics and Expression Analysis of Eceriferum (CER) Genes in Sunflower (Helianthus Annuus). Saudi J. Biol. Sci. 2021, 28, 6884–6896. [Google Scholar] [CrossRef]
- Rizwan, H.M.; Waheed, A.; Ma, S.; Li, J.; Arshad, M.B.; Irshad, M.; Li, B.; Yang, X.; Ali, A.; Ahmed, M.A.A.; et al. Comprehensive Genome-Wide Identification and Expression Profiling of Eceriferum (CER) Gene Family in Passion Fruit (Passiflora Edulis) Under Fusarium Kyushuense and Drought Stress Conditions. Front. Plant Sci. 2022, 13, 898307. [Google Scholar] [CrossRef]
- Zhao, S.; Nie, X.; Liu, X.; Wang, B.; Liu, S.; Qin, L.; Xing, Y. Genome-Wide Identification of the CER Gene Family and Significant Features in Climate Adaptation of Castanea Mollissima. Int. J. Mol. Sci. 2022, 23, 16202. [Google Scholar] [CrossRef]
- Leide, J.; Hildebrandt, U.; Reussing, K.; Riederer, M.; Vogg, G. The Developmental Pattern of Tomato Fruit Wax Accumulation and Its Impact on Cuticular Transpiration Barrier Properties: Effects of a Deficiency in a β -Ketoacyl-Coenzyme A Synthase (LeCER6). Plant Physiol. 2007, 144, 1667–1679. [Google Scholar] [CrossRef]
- Smirnova, A.; Leide, J.; Riederer, M. Deficiency in a Very-Long-Chain Fatty Acid β-Ketoacyl-Coenzyme A Synthase of Tomato Impairs Microgametogenesis and Causes Floral Organ Fusion. Plant Physiol. 2012, 161, 196–209. [Google Scholar] [CrossRef]
- Wu, H.; Liu, L.; Chen, Y.; Liu, T.; Jiang, Q.; Wei, Z.; Li, C.; Wang, Z. Tomato SlCER1–1 Catalyzes the Synthesis of Wax Alkanes, Increasing Drought Tolerance and Fruit Storability. Hortic. Res. 2022, 9, uhac004. [Google Scholar] [CrossRef]
- Lin, T.; Zhu, G.; Zhang, J.; Xu, X.; Yu, Q.; Zheng, Z.; Zhang, Z.; Lun, Y.; Li, S.; Wang, X.; et al. Genomic Analyses Provide Insights into the History of Tomato Breeding. Nat. Genet. 2014, 46, 1220–1226. [Google Scholar] [CrossRef]
- Zhu, G.; Wang, S.; Huang, Z.; Zhang, S.; Liao, Q.; Zhang, C.; Lin, T.; Qin, M.; Peng, M.; Yang, C.; et al. Rewiring of the Fruit Metabolome in Tomato Breeding. Cell 2018, 172, 249–261.e12. [Google Scholar] [CrossRef] [PubMed]
- Gao, L.; Gonda, I.; Sun, H.; Ma, Q.; Bao, K.; Tieman, D.M.; Burzynski-Chang, E.A.; Fish, T.L.; Stromberg, K.A.; Sacks, G.L.; et al. The Tomato Pan-Genome Uncovers New Genes and a Rare Allele Regulating Fruit Flavor. Nat. Genet. 2019, 51, 1044–1051. [Google Scholar] [CrossRef] [PubMed]
- Razifard, H.; Ramos, A.; Della Valle, A.L.; Bodary, C.; Goetz, E.; Manser, E.J.; Li, X.; Zhang, L.; Visa, S.; Tieman, D.; et al. Genomic Evidence for Complex Domestication History of the Cultivated Tomato in Latin America. Mol. Biol. Evol. 2020, 37, 1118–1132. [Google Scholar] [CrossRef]
- Zhou, Y.; Zhang, Z.; Bao, Z.; Li, H.; Lyu, Y.; Zan, Y.; Wu, Y.; Cheng, L.; Fang, Y.; Wu, K.; et al. Graph Pangenome Captures Missing Heritability and Empowers Tomato Breeding. Nature 2022, 606, 527–534. [Google Scholar] [CrossRef]
- Ranc, N.; Muños, S.; Santoni, S.; Causse, M. A Clarified Position for Solanum Lycopersicum Var. Cerasiformein the Evolutionary History of Tomatoes (Solanaceae). BMC Plant Biol. 2008, 8, 130. [Google Scholar] [CrossRef]
- Mistry, J.; Chuguransky, S.; Williams, L.; Qureshi, M.; Salazar, G.A.; Sonnhammer, E.L.L.; Tosatto, S.C.E.; Paladin, L.; Raj, S.; Richardson, L.J.; et al. Pfam: The Protein Families Database in 2021. Nucleic Acids Res. 2021, 49, D412–D419. [Google Scholar] [CrossRef]
- Walker, J.M. (Ed.) The Proteomics Protocols Handbook; Humana Press: Totowa, NJ, USA, 2005; ISBN 978-1-58829-343-5. [Google Scholar]
- Larkin, M.A.; Blackshields, G.; Brown, N.P.; Chenna, R.; McGettigan, P.A.; McWilliam, H.; Valentin, F.; Wallace, I.M.; Wilm, A.; Lopez, R.; et al. Clustal W and Clustal X Version 2.0. Bioinformatics 2007, 23, 2947–2948. [Google Scholar] [CrossRef]
- Chen, C.; Chen, H.; Zhang, Y.; Thomas, H.R.; Frank, M.H.; He, Y.; Xia, R. TBtools: An Integrative Toolkit Developed for Interactive Analyses of Big Biological Data. Mol. Plant 2020, 13, 1194–1202. [Google Scholar] [CrossRef]
- Danecek, P.; Bonfield, J.K.; Liddle, J.; Marshall, J.; Ohan, V.; Pollard, M.O.; Whitwham, A.; Keane, T.; McCarthy, S.A.; Davies, R.M.; et al. Twelve Years of SAMtools and BCFtools. GigaScience 2021, 10, giab008. [Google Scholar] [CrossRef]
- Lescot, M.; Déhais, P.; Thijs, G.; Marchal, K.; Moreau, Y.; Van de Peer, Y.; Rouzé, P.; Rombauts, S. PlantCARE, a Database of Plant Cis-Acting Regulatory Elements and a Portal to Tools for in Silico Analysis of Promoter Sequences. Nucleic Acids Res. 2002, 30, 325–327. [Google Scholar] [CrossRef]
- Chen, S.; Zhou, Y.; Chen, Y.; Gu, J. Fastp: An Ultra-Fast All-in-One FASTQ Preprocessor. Bioinformatics 2018, 34, i884–i890. [Google Scholar] [CrossRef] [PubMed]
- Kim, D.; Paggi, J.M.; Park, C.; Bennett, C.; Salzberg, S.L. Graph-Based Genome Alignment and Genotyping with HISAT2 and HISAT-Genotype. Nat. Biotechnol. 2019, 37, 907–915. [Google Scholar] [CrossRef] [PubMed]
- Pertea, M.; Kim, D.; Pertea, G.M.; Leek, J.T.; Salzberg, S.L. Transcript-Level Expression Analysis of RNA-Seq Experiments with HISAT, StringTie and Ballgown. Nat. Protoc. 2016, 11, 1650–1667. [Google Scholar] [CrossRef]
- Li, H.; Durbin, R. Fast and Accurate Short Read Alignment with Burrows-Wheeler Transform. Bioinformatics 2009, 25, 1754–1760. [Google Scholar] [CrossRef] [PubMed]
- McKenna, A.; Hanna, M.; Banks, E.; Sivachenko, A.; Cibulskis, K.; Kernytsky, A.; Garimella, K.; Altshuler, D.; Gabriel, S.; Daly, M.; et al. The Genome Analysis Toolkit: A MapReduce Framework for Analyzing next-Generation DNA Sequencing Data. Genome Res. 2010, 20, 1297–1303. [Google Scholar] [CrossRef]
- Danecek, P.; Auton, A.; Abecasis, G.; Albers, C.A.; Banks, E.; DePristo, M.A.; Handsaker, R.E.; Lunter, G.; Marth, G.T.; Sherry, S.T.; et al. The Variant Call Format and VCFtools. Bioinformatics 2011, 27, 2156–2158. [Google Scholar] [CrossRef]
- Zhao, T.; Liu, W.; Zhao, Z.; Yang, H.; Bao, Y.; Zhang, D.; Wang, Z.; Jiang, J.; Xu, Y.; Zhang, H.; et al. Transcriptome Profiling Reveals the Response Process of Tomato Carrying Cf-19 and Cladosporium Fulvum Interaction. BMC Plant Biol. 2019, 19, 572. [Google Scholar] [CrossRef]
- Tsitsekian, D.; Daras, G.; Karamanou, K.; Templalexis, D.; Koudounas, K.; Malliarakis, D.; Koufakis, T.; Chatzopoulos, D.; Goumas, D.; Ntoukakis, V.; et al. Clavibacter Michiganensis Downregulates Photosynthesis and Modifies Monolignols Metabolism Revealing a Crosstalk with Tomato Immune Responses. Int. J. Mol. Sci. 2021, 22, 8442. [Google Scholar] [CrossRef]
- Jhu, M.-Y.; Farhi, M.; Wang, L.; Zumstein, K.; Sinha, N.R. Investigating Host and Parasitic Plant Interaction by Tissue-Specific Gene Analyses on Tomato and Cuscuta Campestris Interface at Three Haustorial Developmental Stages. Front. Plant Sci. 2022, 12, 764843. [Google Scholar] [CrossRef]
- Singh, S.; Das, S.; Geeta, R. A Segmental Duplication in the Common Ancestor of Brassicaceae Is Responsible for the Origin of the Paralogs KCS6-KCS5, Which Are Not Shared with Other Angiosperms. Mol. Phylogenet. Evol. 2018, 126, 331–345. [Google Scholar] [CrossRef]
- Wang, H.; Ni, X.; Harris-Shultz, K. Molecular Evolution of the Plant ECERIFERUM1 and ECERIFERUM3 Genes Involved in Aliphatic Hydrocarbon Production. Comput. Biol. Chem. 2019, 80, 1–9. [Google Scholar] [CrossRef] [PubMed]
- Salvi, P.; Manna, M.; Kaur, H.; Thakur, T.; Gandass, N.; Bhatt, D.; Muthamilarasan, M. Phytohormone Signaling and Crosstalk in Regulating Drought Stress Response in Plants. Plant Cell Rep. 2021, 40, 1305–1329. [Google Scholar] [CrossRef] [PubMed]
- Griffith, M.; Griffith, O.L.; Mwenifumbo, J.; Goya, R.; Morrissy, A.S.; Morin, R.D.; Corbett, R.; Tang, M.J.; Hou, Y.-C.; Pugh, T.J.; et al. Alternative Expression Analysis by RNA Sequencing. Nat. Methods 2010, 7, 843–847. [Google Scholar] [CrossRef] [PubMed]
- Shi, Y.; He, M. Differential Gene Expression Identified by RNA-Seq and QPCR in Two Sizes of Pearl Oyster (Pinctada Fucata). Gene 2014, 538, 313–322. [Google Scholar] [CrossRef] [PubMed]
- Qian, Z.; Rao, X.; Zhang, R.; Gu, S.; Shen, Q.; Wu, H.; Lv, S.; Xie, L.; Li, X.; Wang, X.; et al. Genome-Wide Identification, Evolution, and Expression Analyses of AP2/ERF Family Transcription Factors in Erianthus Fulvus. Int. J. Mol. Sci. 2023, 24, 7102. [Google Scholar] [CrossRef]
- Holsinger, K.E.; Weir, B.S. Genetics in Geographically Structured Populations: Defining, Estimating and Interpreting FST. Nat. Rev. Genet. 2009, 10, 639–650. [Google Scholar] [CrossRef]
- Guo, F.; Dey, D.K.; Holsinger, K.E. A Bayesian Hierarchical Model for Analysis of Single-Nucleotide Polymorphisms Diversity in Multilocus, Multipopulation Samples. J. Am. Stat. Assoc. 2009, 104, 142–154. [Google Scholar] [CrossRef]
- Zhang, F.; Wang, C.; Li, M.; Cui, Y.; Shi, Y.; Wu, Z.; Hu, Z.; Wang, W.; Xu, J.; Li, Z. The Landscape of Gene–CDS–Haplotype Diversity in Rice: Properties, Population Organization, Footprints of Domestication and Breeding, and Implications for Genetic Improvement. Mol. Plant 2021, 14, 787–804. [Google Scholar] [CrossRef]
- Corrado, G.; Piffanelli, P.; Caramante, M.; Coppola, M.; Rao, R. SNP Genotyping Reveals Genetic Diversity between Cultivated Landraces and Contemporary Varieties of Tomato. BMC Genom. 2013, 14, 835. [Google Scholar] [CrossRef]
- Causse, M.; Giovannoni, J.; Bouzayen, M.; Zouine, M. (Eds.) The Tomato Genome; Compendium of Plant Genomes; Springer: Berlin/Heidelberg, Germany, 2016; ISBN 978-3-662-53387-1. [Google Scholar]
- Blanca, J.; Cañizares, J.; Cordero, L.; Pascual, L.; Diez, M.J.; Nuez, F. Variation Revealed by SNP Genotyping and Morphology Provides Insight into the Origin of the Tomato. PLoS ONE 2012, 7, e48198. [Google Scholar] [CrossRef]
- Bai, Y.; Lindhout, P. Domestication and Breeding of Tomatoes: What Have We Gained and What Can We Gain in the Future? Ann. Bot. 2007, 100, 1085–1094. [Google Scholar] [CrossRef] [PubMed]
- Meyer, R.S.; Purugganan, M.D. Evolution of Crop Species: Genetics of Domestication and Diversification. Nat. Rev. Genet. 2013, 14, 840–852. [Google Scholar] [CrossRef] [PubMed]
Disclaimer/Publisher’s Note: The statements, opinions and data contained in all publications are solely those of the individual author(s) and contributor(s) and not of MDPI and/or the editor(s). MDPI and/or the editor(s) disclaim responsibility for any injury to people or property resulting from any ideas, methods, instructions or products referred to in the content. |
© 2023 by the authors. Licensee MDPI, Basel, Switzerland. This article is an open access article distributed under the terms and conditions of the Creative Commons Attribution (CC BY) license (https://creativecommons.org/licenses/by/4.0/).