Article

Genome-Wide Identification, Characterization, and Expression Pattern of MYB Gene Family in Melastoma candidum

1
College of Forestry and Landscape Architecture, South China Agricultural University, Guangzhou 510642, China
2
Guangzhou Institute of Forestry and Landscape Architecture, Guangzhou 510405, China
3
Faculty of Electronic Information Engineering, Guangdong Baiyun University, Guangzhou 510450, China
4
State Key Laboratory of Tree Genetics and Breeding, Chinese Academy of Forestry, Beijing 100091, China
5
College of Forestry, Sichuan Agricultural University, Chengdu 611130, China
*
Authors to whom correspondence should be addressed.
Horticulturae 2023, 9(6), 708; https://doi.org/10.3390/horticulturae9060708
Submission received: 3 May 2023 / Revised: 7 June 2023 / Accepted: 13 June 2023 / Published: 16 June 2023
(This article belongs to the Section Floriculture, Nursery and Landscape, and Turf)

Abstract

:
The MYB gene family is significant in plants, playing a role in numerous plant development processes, including metabolism, hormone signal transduction, cell identity, and biotic and abiotic stresses. Due to the recent availability of the Melastoma candidum genome, this is the first time that the MYB gene family has been identified in this species. This study identified 421 MYB gene members in the M. candidum genome using the HMMER search and BLASTp method. These MYBs were further divided into 10 sub-types, including R2R3, R-R, CPC-like, CCA1-like, TBP-like, R1R2R3, I-box, atypical MYB, MYB-CC, and MYB-like. Domain and conservation analyses revealed that each type of MYB was characterized by a different number and combination of SANTs/myb DNA-binding domains. Collinearity analysis revealed several gene duplication events within the MYB gene family. The Ka to Ks ratio suggested that most of the MYB genes underwent purifying selection during the evolution process. Phylogenetic analysis among three species confirmed our findings and displayed the evolutionary relationship of MYB genes in different species. RNA-seq of three developmental stages of flowers and WGCNA analysis identified McMYB113h, McMYB21b, and McGLK1c as playing a pivotal role during flower development in M. candidum. Finally, we conducted qRT-PCR experiments for 20 flower-development-related MYBs across 9 tissues to illustrate their expression patterns in M. candidum. This study establishes a foundation for exploring MYB gene resources and their potential applications in related industries of M. candidum.

1. Introduction

Myeloblastosis (MYB) is one of the largest families of transcription factors in plants [1] and is characterized by a conserved MYB DNA-binding domain located at the N-terminus [2]. The first MYB gene was found in the myeloblastosis virus and was named v-MYB oncogene [3], and then researchers named such genes as myeloblastosis. Subsequently, MYB gene family members were also identified in various plants and animals [4,5]. In animals, researchers found only a few MYB genes, including A-MYB, B-MYB, and C-MYB, with three MYB repeats [6], whereas a large number of MYB genes with diverse structures and functions were found in flowering plants. To date, a large number of MYB genes have been identified and characterized in different plants, such as Arabidopsis [7], rice [8], maize [9], soybean [10], poplar [11], grape [12], and cucumber [13].
Generally, an MYB domain is usually composed of one to five imperfect repeats with a helix-turn-helix conformation that intercalates in the major groove of the DNA [14]. In the Protein Data Bank (PDB), the three-dimensional structure of the MYB domain reveals that the DNA recognition α-helix interacts with the DNA major groove [15]. Moreover, previous research has shown that five amino acid residues in the helix-turn-helix motif are directly bound to the major groove [16]. The initial classification of MYB proteins is relatively disorganized. A rough classification is based on the number of MYB DNA-binding domains they contain, including R1-MYB protein (a single repeat), R2R3-MYB protein (two repeats), R1R2R3-MYB protein (three repeats), 4R-MYB (four repeats), and MYB-related protein (a single repeat or partial MYB repeat) [5,7]. However, further research with an increased number of MYB family members from model species has revealed that these proteins are more complex than initially believed. In 2006, Chen et al. [14] proposed a more systematic categorization that provides a detailed classification of MYBs, where they subdivided nearly ten classifications of MYBs in Arabidopsis. Up to now, the DNA-binding specificities of plant MYBs have remained obscure. Early research suggested that MYB proteins bind precisely to a specific DNA sequence (C/TAACG/TG) in most organisms, which is closely related to the E-box hexanucleotide [14]. Other researchers proposed that there are three primary types of DNA sites (MYB binding site I [MBSI], MBSII, and MBSIIG) for R2R3-MYB [17]. However, Romero et al. [17] observed that an overlap of DNA-binding specificity happened in R2R3-MYBs. Xie et al. [18] found that the DNA-binding specificity of FLP is uniquely distinct from other R2R3-MYBs. The R2 and R3 repeats in both R2R3-MYB and R1R2R3-MYB are essential components of the DNA-binding process [19]. While the R1 domain does not play a significant role in sequence recognition, it contributes to increasing the stability of the MYB-DNA complex [20]. There is a strong similarity between the DNA-binding domain (DBD) of MYB proteins and the SANT domain, which was identified as an approximately 50-amino-acid motif and was found in the subunits of many chromatin-remodeling complexes [21]. However, SANT domains contain several basic residues on the carboxy-terminal side of the third α-helix, and several key residues that contact DNA in the MYB DBD are not conserved with SANT domains. In addition, SANT domains contain consecutive hydrophobic residues that are incompatible with the DBD of MYBs [21].
There are two explanations for why R2R3-MYB is the largest type among all MYBs. Firstly, its rapid expansion is a contributing factor. Secondly, it is possible that the R2R3-MYB class evolved from an R1R2R3-MYB gene ancestor through the loss of sequences encoding the R1 repeat, followed by the expansion of the gene family. These factors contribute to why MYB transcription factors constitute one of the largest gene families [5,7]. As of today, R2R3-MYBs are the most well-studied MYBs in plants [4]. Several functional studies have shown that R2R3-MYBs play a role in primary and secondary plant metabolism [22], hormone signal transduction [23], cell fate and identity [24], and biotic and abiotic stresses [25]. For instance, AtMYB11 (also named PFG2), AtMYB12 (also named PFG1), and AtMYB111 (also named PFG3) control flavonol biosynthesis [26]. AtMYB75 (also named PAP1), AtMYB90 (also named PAP2), AtMYB113, and AtMYB114 regulate anthocyanin biosynthesis in the vegetative tissues [27]. AtMYB0 (also named GL1) and AtMYB23 control trichome initiation in shoots, whereas AtMYB66 (also named WER) has a relationship with root hair patterning. AtMYB66 positively regulated AtMYB23 to participate in a positive feedback loop to reinforce the cell fate establishment process in the root of Arabidopsis [28]. AtMYB30 (also named HSR1) plays an integral role in regulating hypocotyl cell elongation through the brassinosteroid pathway [29]. AtMYB60 and AtMYB96 act on the ABA signaling cascade to regulate stomatal movement, drought stress, and disease resistance [30,31]. In contrast to the R2R3-MYB genes, only a few other MYBs have been functionally studied. For example, CIRCADIAN CLOCK ASSOCIATED1 genes (CCA1-like genes) are involved in circadian rhythm maintenance [32]; CPC-like genes are involved in the control of cellular morphogenesis [33,34]; R1R2R3-MYB genes have conserved functions in differentiation and cell cycle control [34,35]; and MYB3R genes such as MYBBCDC5 are related to the yeast cell cycle protein CDC5+ and the human regulator of mitotic entry HsCDC5. These are potentially multifunctional MYB proteins involved in transcript splicing [36] and transcriptional regulation [37].
Collectively, MYBs are one of the most influential TFs during plant development and the life cycle process. To date, there has not been a comprehensive MYB gene family identification in M. candidum because of the absence of genome resources. M. candidum is widely spread in south China and has promising prospects in the garden and pharmaceutical industries. By understanding gene families, we can promote molecular breeding and expand the applications of M. candidum. So, here, we performed genome-wide MYB gene identification based on the HMMER search and BLASTp method for M. candidum. Motif, domain, and gene structure analyses were conducted for further identification. The conserved motifs in each type of MYB were verified. Gene duplication events of MYB gene members were checked based on collinearity analysis within the M. candidum genome. The synonymous substitution rate (Ks), nonsynonymous substitution rate, and their ratios (Ka/Ks) were calculated to check the divergence time and key factors that promoted the evolution of MYB genes in M. candidum. Evolutionary analyses among Arabidopsis, Populus, and M. candidum were performed to illustrate the gene evolutionary relationship. This subgroup classification as well as the identification of a putative functional conserved motif may prove useful for molecular breeding and property improvement of M. candidum.

2. Materials and Methods

2.1. Identification of MYB Transcription Factors

The M. candidum genome resource was downloaded at http://evolution.sysu.edu.cn/Sequences.html (accessed on 15 March 2022). To identify MYB family members in M. candidum, the MYB domain HMM profile (PF00249) of the myb DNA-binding domain from the Pfam database (http://pfam.sanger.ac.uk/; accessed on 20 August 2022) was used as a query to perform an HMMER search within the M. candidum genome with an E-value cut-off of 1e-3 following the HMMER User Guide. To further identify the MYB members, motif analysis (https://meme-suite.org/meme/tools/meme; accessed on 25 August 2022) and domain analysis (http://smart.embl-heidelberg.de/; accessed on 27 August 2022) were performed on all the obtained protein sequences.

2.2. Phylogenetic Tree Construction and Distribution of MYB Gene Family Members in Chromosome

The full length of the protein sequences and conservation regions of all the identified MYBs were aligned by MUSCLE of MEGA 6.01. A phylogeny tree was constructed via the ML (maximum likelihood) method and LG model with 1000 boot replications. Visualization of the phylogenetic tree was performed on the iTOL web browser (https://itol.embl.de/; accessed on 5 September 2022). The distribution of MYB genes in the chromosome was conducted using the gff annotation file and gene density file of the genome in the Gene Location Visualize in the GTF/GFF function module of the TBtools software [38].

2.3. Visualizing the Motifs, Domains, Gene Structure, and Promoter Regions of MYBs

We performed analyses of the motif, domain, gene structure, and promoter on all the MYB genes finally identified. To conduct promoter analysis, 2 Kb of 5′ upstream regions were extracted and uploaded to the website (https://bioinformatics.psb.ugent.be/webtools/plantcare/html/; accessed on 10 September 2022) to obtain the annotation of promoters of MYB genes. The gene structure, including the exon, intron, and untranslated region (UTR) of genes, was displayed by TBtools according to the gff file of the genome. Based on the identification of the MYB transcription factor part, the motifs and domains of MYB genes were visualized by TBtools software [38].

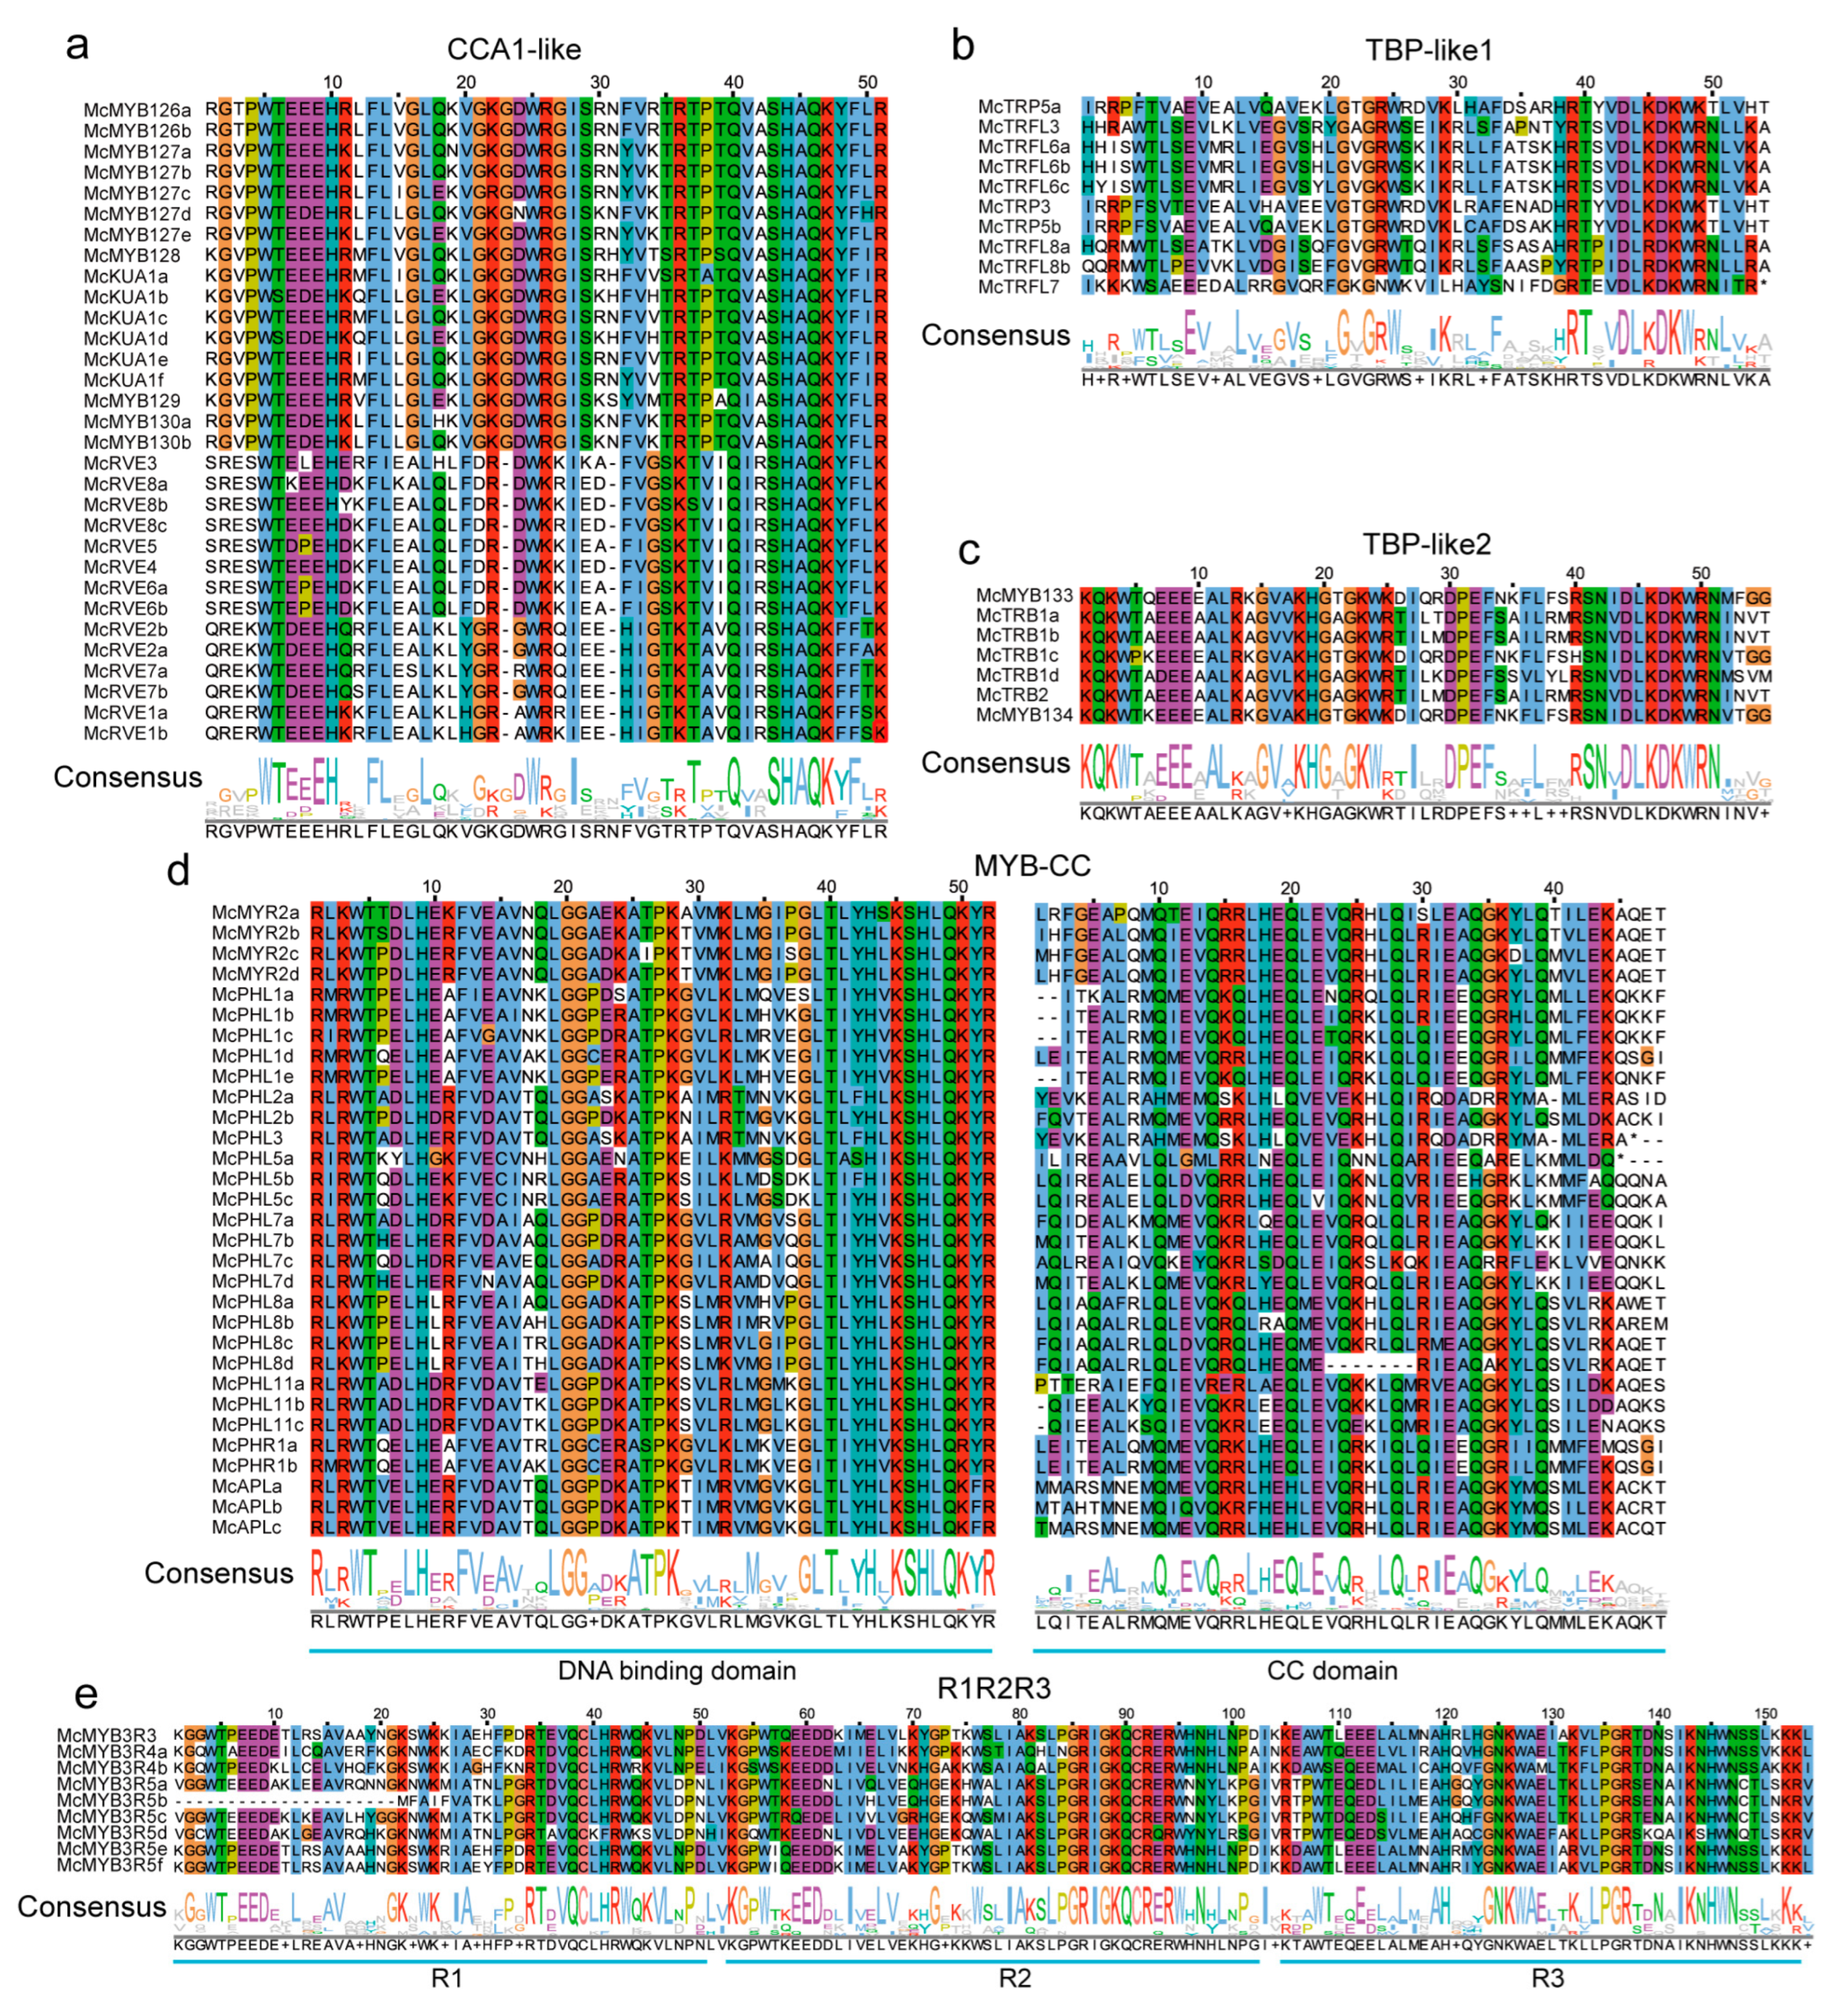
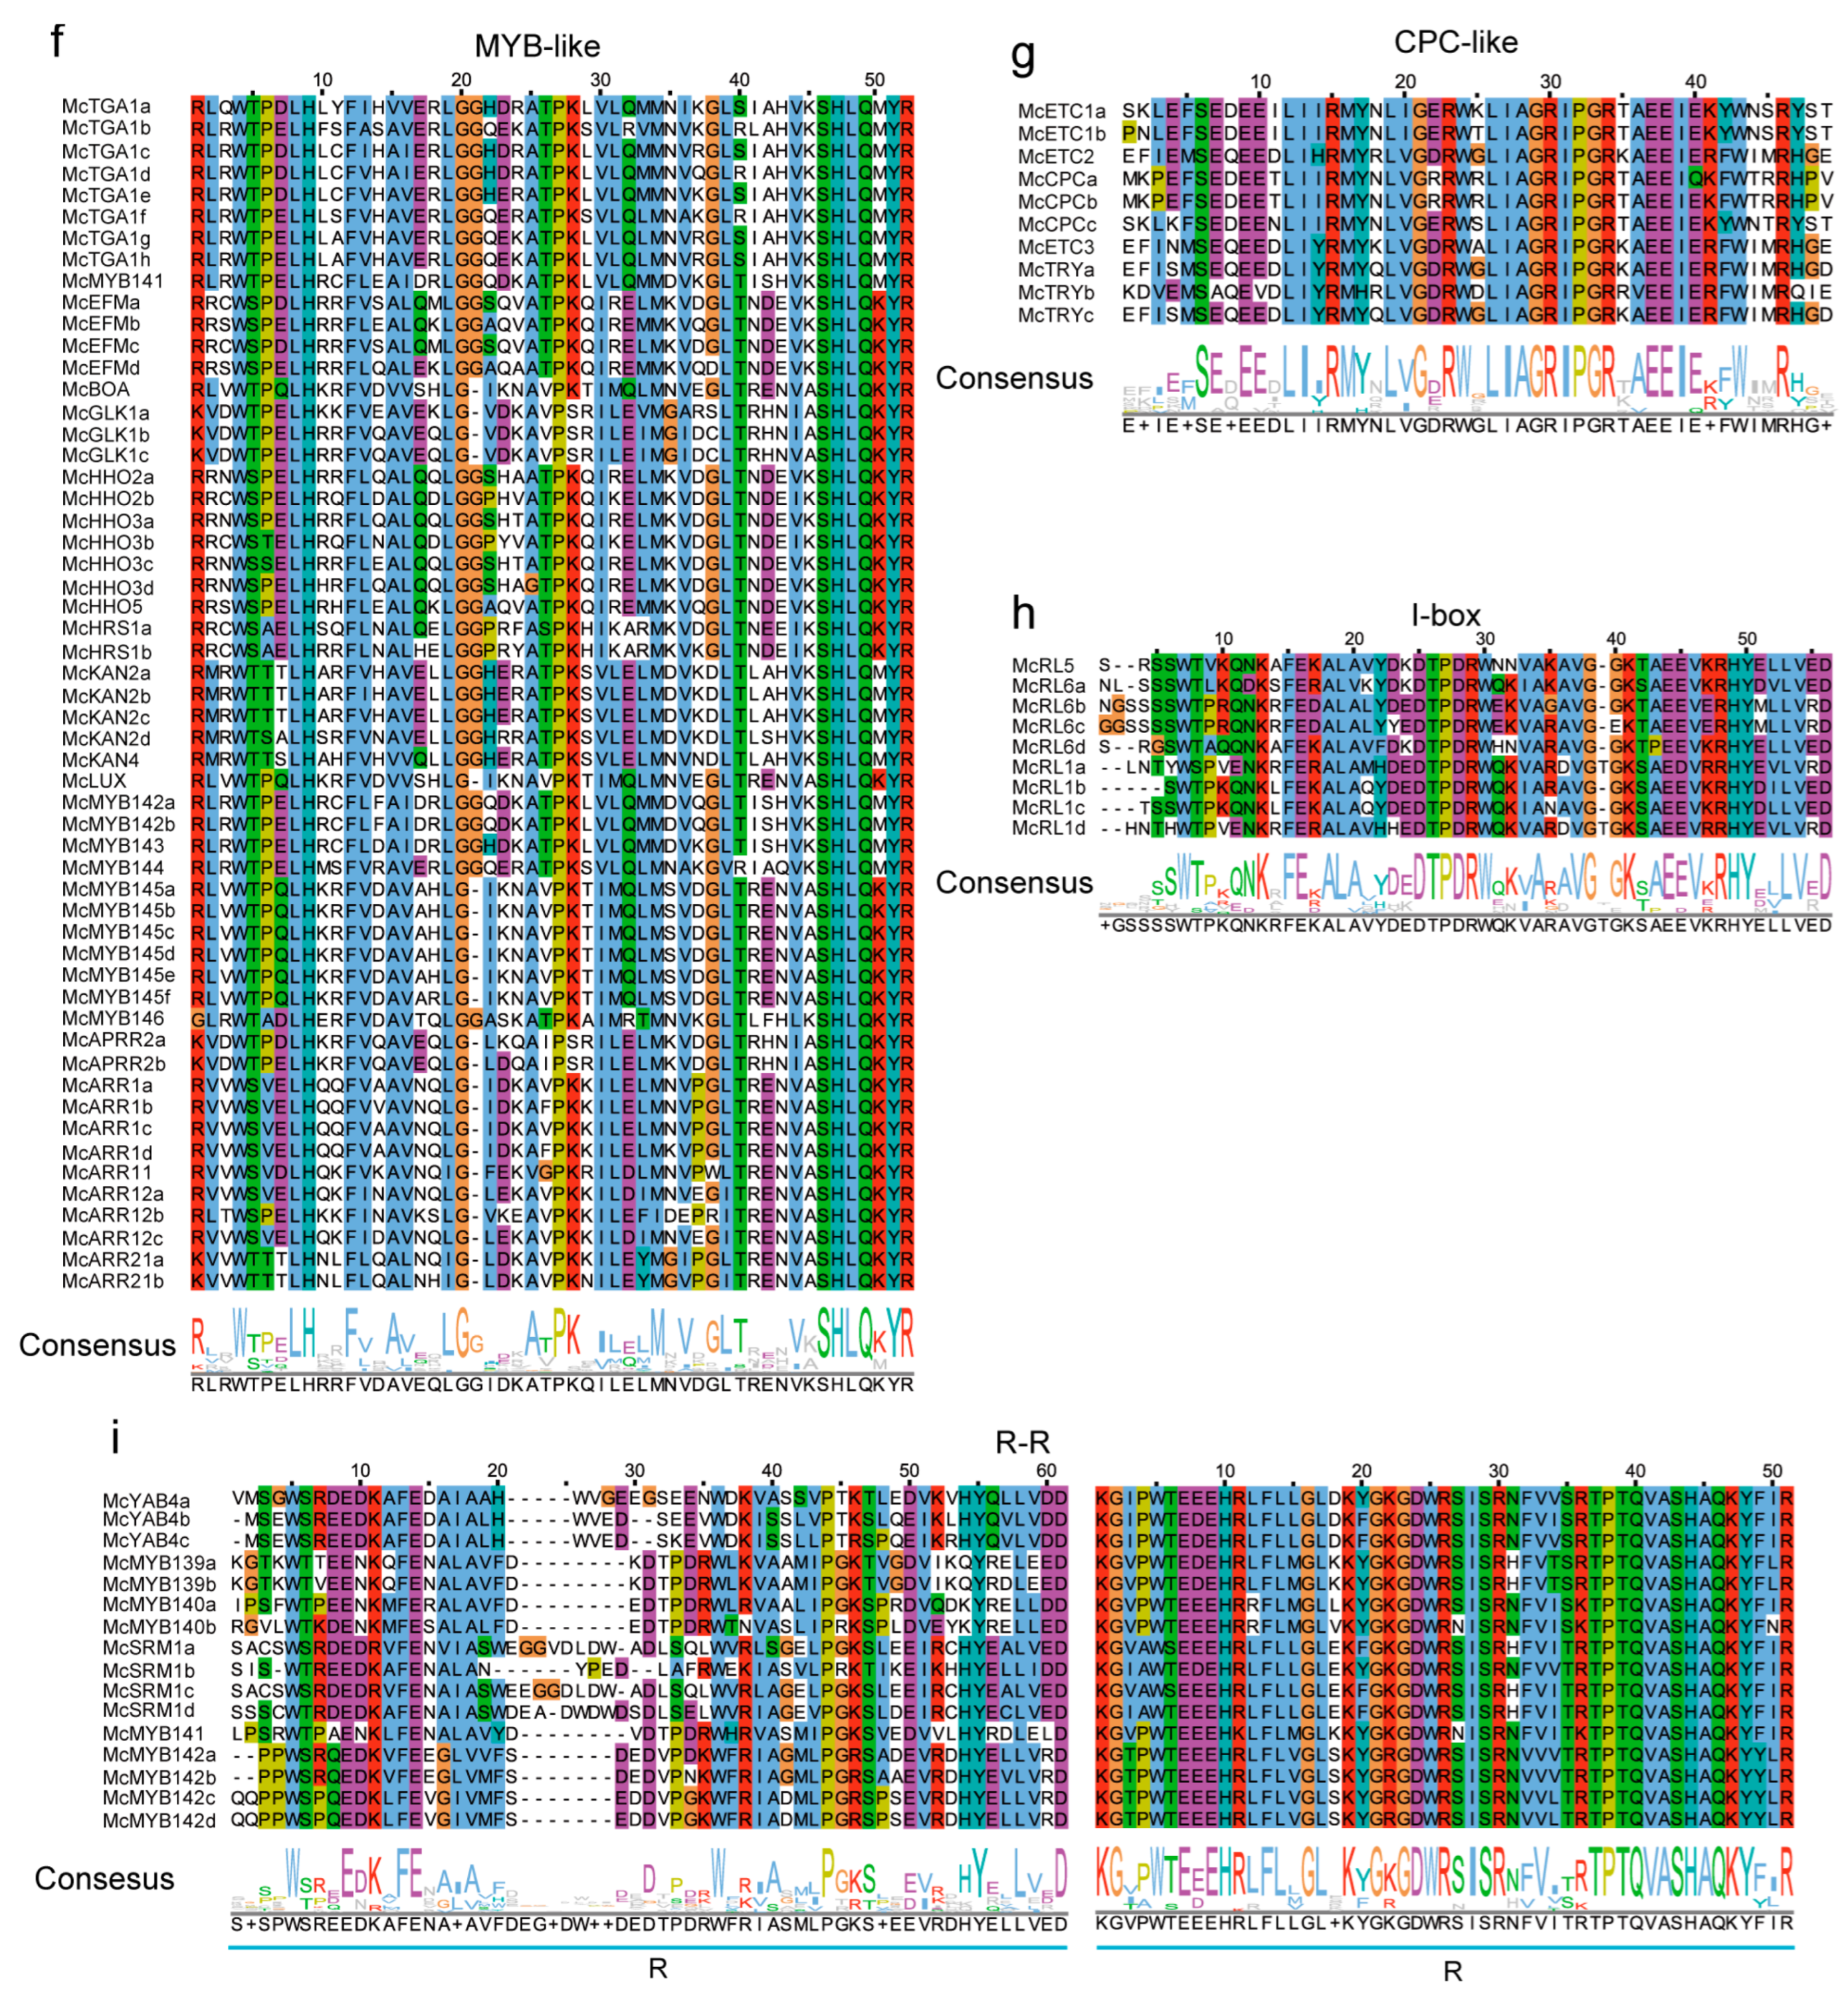
2.4. Conservation Region of the MYBs

Via BLASTp for Arabidopsis thaliana with a threshold of 1e-5, we divided the MYB transcription factors into ten groups, including R2R3, R-R, CPC-like, CCA1-like, TBP-like, R1R2R3, I-box, atypical MYB, MYB-CC, and MYB-like. The protein sequences identified in each MYB group were firstly aligned by CLUSTAL in MEGA software, and then the aligned fasta file was input into Genedoc to display the conserved region of each type of MYB gene. The conserved regions were then input into Jalview to show the conserved sequences and seqlogo graphs of each type of MYB.

2.5. Collinearity Analysis of Identified MYBs and Divergence Times Estimation

Gene collinearity analysis within the M. candidum genome was conducted using TBtools. In summary, the process involved the following steps: (1) generation of collinearity, CTL, and GFF files using the One Step MCScanX-Super Fast module; (2) production of a chromosome-length file using the Fasta Stats module; (3) creation of a gene pair file by merging data from the collinearity file using File Merge for the MCScanX module; (4) generation of a link region file using the File Transformat for the Microsyteny viewer module; and (5) extraction of gene pairs of selected MYB gene family members using the Text Block Extract and Filter module. Following these analyses, we aligned the protein sequences using ClustalW in MEGA software, and calculated the synonymous substitution (Ks) and non-synonymous substitution (Ka) rates using the Simple Ka/Ks Calculator (NG) module [39]. The divergence times (DT) of the gene pairs were estimated using the formula: T = Ks/2λ, where the divergence rate λ was set to 6.5 × 10⁻⁹ [40,41]. Visualization of MYB gene pairs was performed in the advanced Circos module of TBtools [38].

2.6. Collinearity and Phylogenetic Analyses for MYB Genes across Three Species

The One Step MCScanX-Super Fast module of TBtools was utilized with an E-value of 1e-3 to produce Multiple Chr layouts, gene links, and GFF files between A. thaliana and M. candidum, Populus trichocarpa, and M. candidum. Homologous genes among these different species were obtained from the merged gene link file using File Merge for the MCScan-X module. A phylogenetic tree was constructed among the three species using the protein sequences of these homologous genes, with the Maximum Likelihood (ML) method and 1000 boot replications in MEGA. The Multiple Synteny Plot module of TBtools [38] was then used to visualize the MYB gene collinearity plot among the different species.

2.7. RNA-seq, Differentially Expressed Gene Analysis (DEGS), WGCNA (Weighted Correlation Network Analysis) Analysis, and Functional Annotation

Three developmental stages of the flowers of M. candidum, including early-stage flowers (EF, closed buds with white petals), middle-stage flowers (MF, closed buds with pink petals), and blooming flowers (BF, opened buds with pink petals), were collected and frozen in liquid nitrogen immediately. Total RNA was extracted by using the OminiPlant RNA Kit (DNase I) (CW2598, CWBIO, Taizhou, China) following the manufacturer’s instructions and was assessed by an Agilent 2100 Bioanalyzer (Agilent Technologies, Palo Alto, CA, USA). Subsequently, cDNA library construction, adaptor ligation, and PCR amplification were performed, and the final PCR products were sequenced on Illumina HiSeq TM 4000 platforms by Gene Denovo Biotechnology Co. (Guangzhou, China). Following filtering, alignment [42,43], and qualification [44,45], we conducted differentially expressed gene analysis between MF and EF and BF and EF with an absolute log2 (fold change) ≥1 and p-value ≤ 0.05. We then conducted WGCNA analysis using R3.6.1. Functional annotation, including GO and KEGG analysis, was performed according to Li et al. [46]. The networks were visualized by Cytoscape 3.9.1.

2.8. Quantitative Real-Time PCR of the Selected MYB Genes in Different Tissues of M. candidum

Twenty flower color-formation-related MYB genes were selected for qRT-PCR across nine tissues or developmental stages, including young leaves (YL), adult leaves (AL), young stems (YS), adult stems (AS), seeds (S), roots (R), early-stage flowers (EF), middle-stage flowers (MF), and blooming flowers (BF). The total RNAs were extracted by using OminiPlant RNA Kit (DNase I) (CW2598, CWBIO, Taizhou, China) following the manufacturer’s instructions. After monitoring the quality of the total RNAs, 0.5 μg total RNA of each sample was reverse-transcribed into first-strand cDNA using the PrimeScript RT reagent Kit gDNA Eraser (Takara, Dalian, China). Then, the SYBR @Premix Ex Taq TMII (Takara, Dalian, China) was used for qRT-PCR of genes on the Illumina Eco real-time PCR system (Illumina, San Diego, CA, USA) platform. The α-tubulin gene of M. candidum was used as the internal reference gene. Ct values were standardized by the 2−ΔCt algorithm. Primers of qRT-PCR are listed in Table S1. GraphPad Prism 9 software was used for one-way ANOVA analysis and visualization.

3. Results

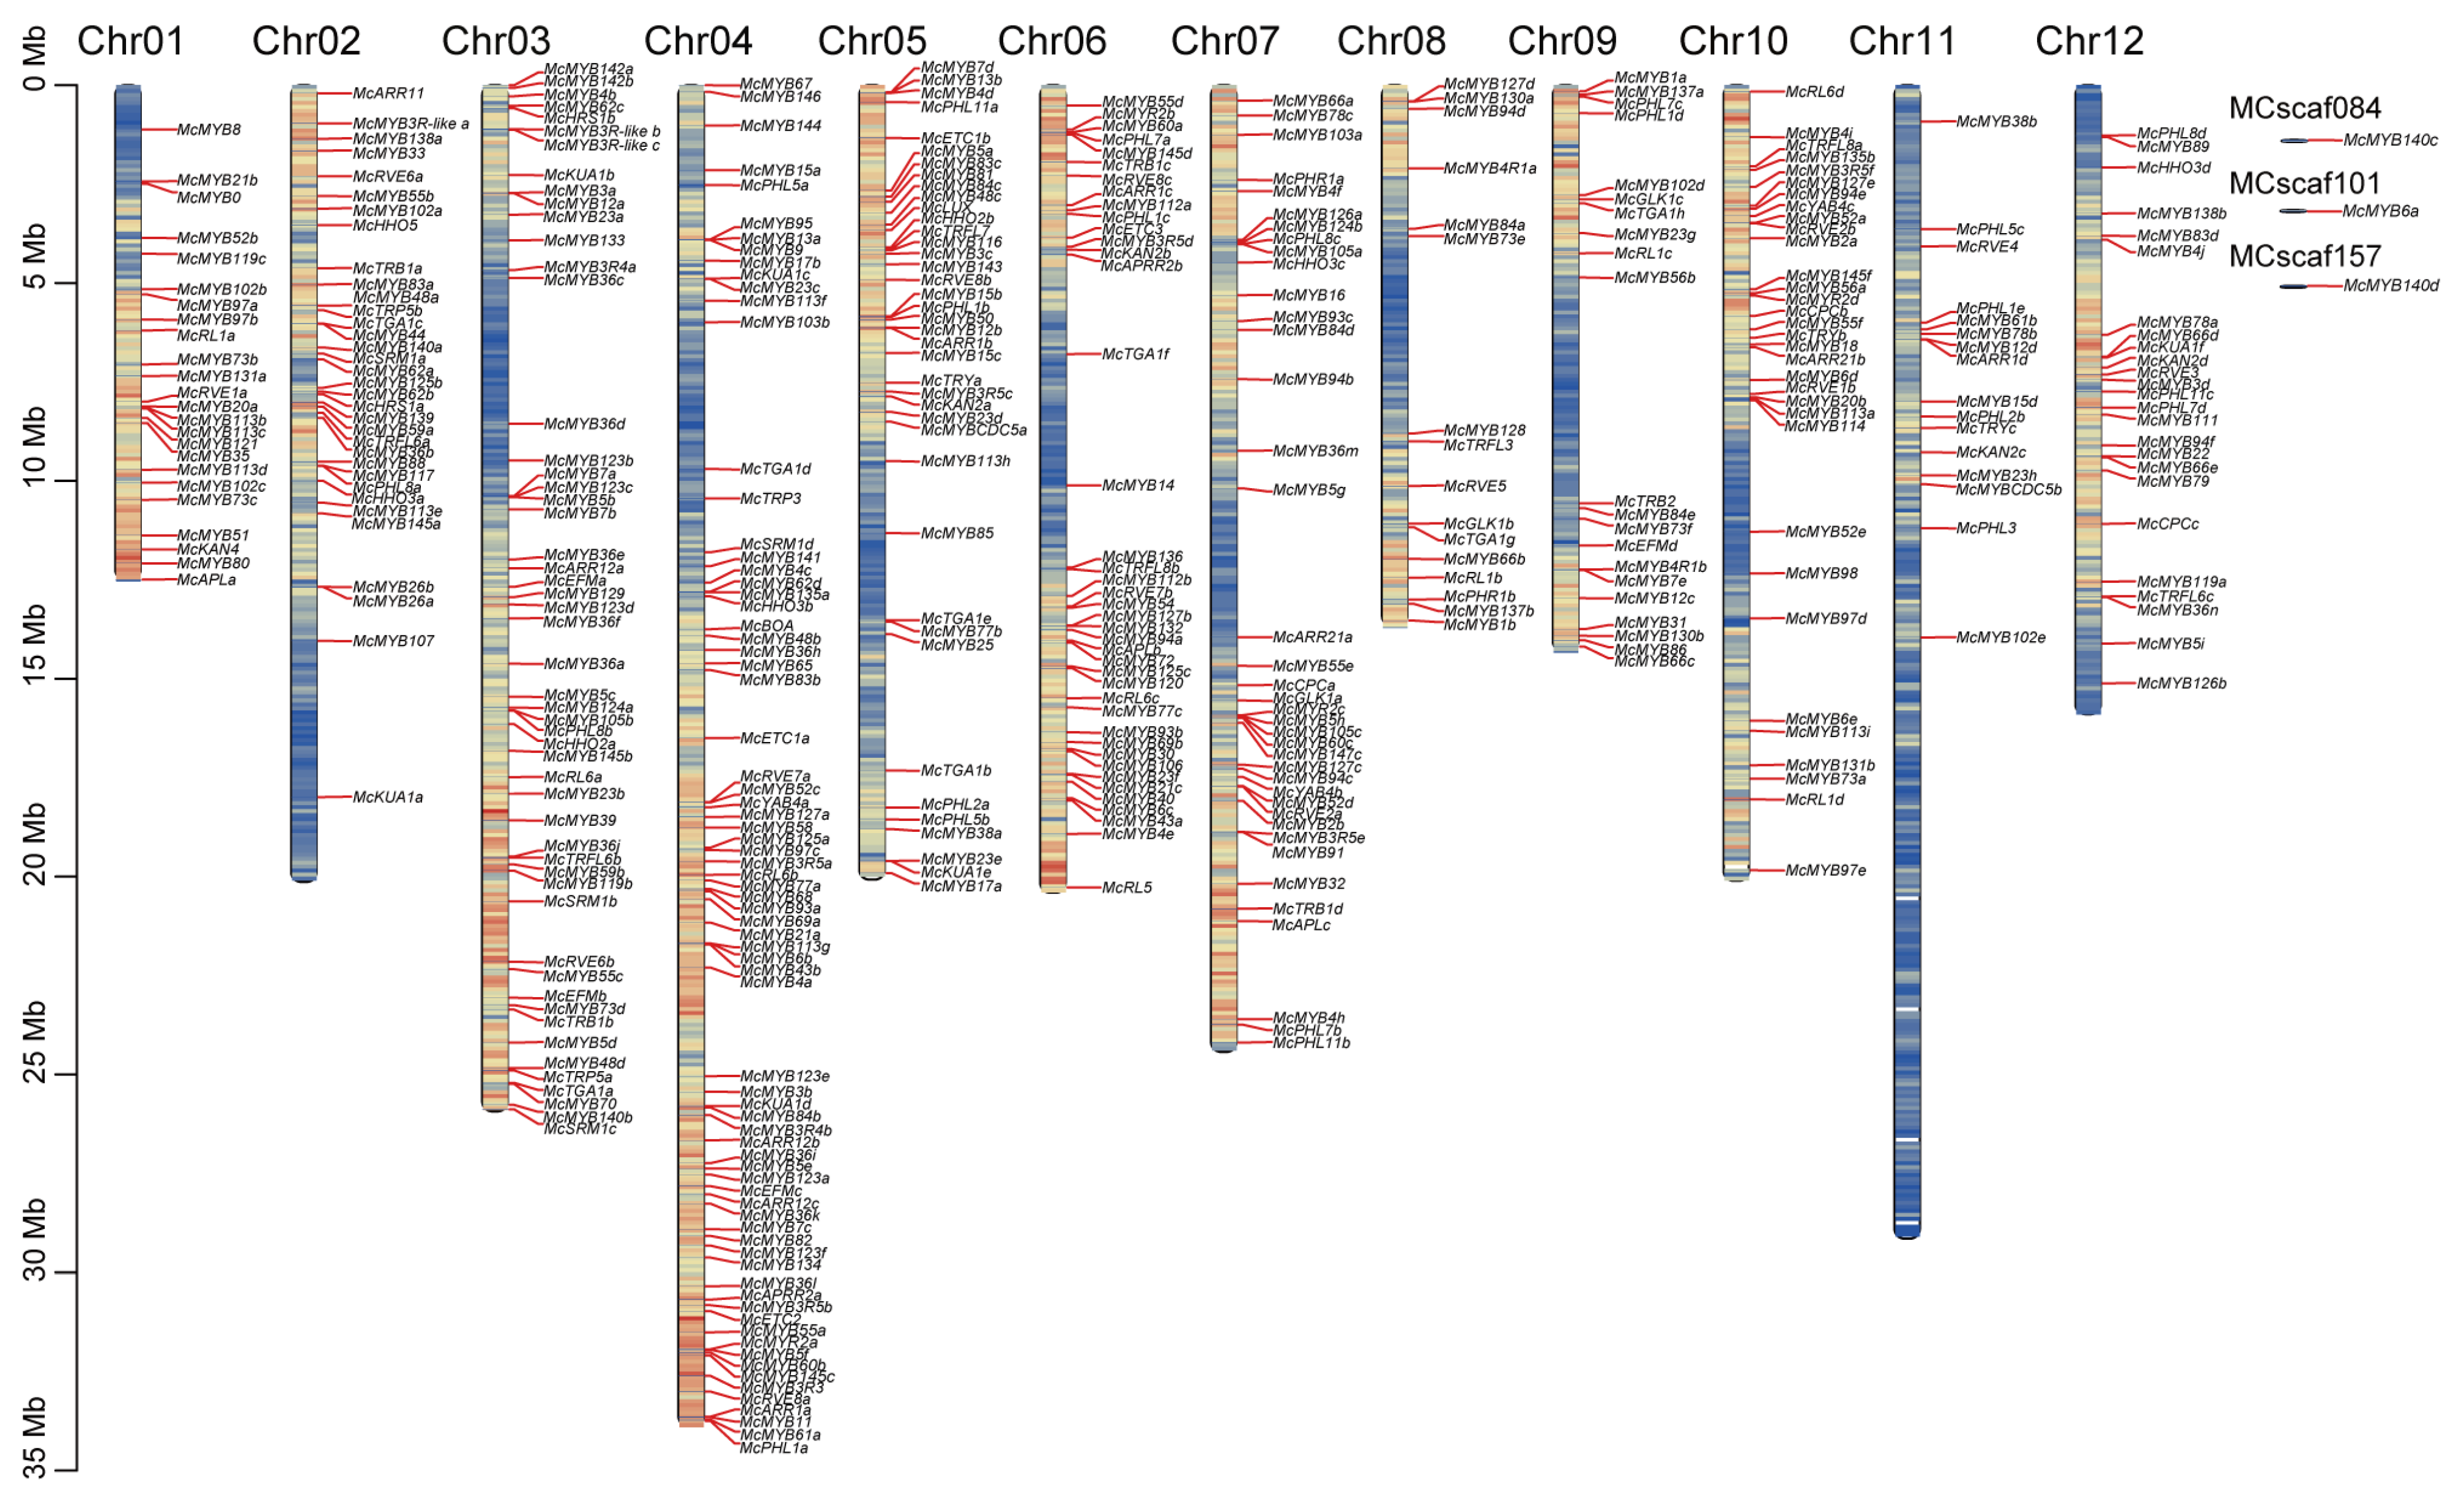
3.1. Evolution Relationship and Chromosome Distribution of MYB Genes

By using the HMMER search and domain analysis, a total of 421 MYBs were finally identified. After alignment by ClustalW, the conserved protein sequences of MYBs and the coding protein sequences were used to construct the phylogenetic analysis. Via phylogenetic analysis, we obtained 66 clades for all the MYBs (Figure 1). Combining with the BLASTp result with the genome of Arabidopsis, we categorized these 421 MYBs into 10 types, including R2R3, R-R, CPC-like, CCA1-like, TBP-like, R1R2R3, I-box, atypical MYB, MYB-CC, and MYB-like (outer layer color bands) (Figure S1). A total of 66 clades were identified among them, of which the R2R3 type alone occupied 56.1% (37 out of 66) (Figure 1). A close evolutionary relationship was found between the R-R and I-box MYBs, as well as the atypical MYBs and TBP-like MYBs. Both MYB-like and CCA1-like MYBs were divided into two groups. All R1R2R3 MYBs and CPC-like MYBs have developed a relatively close evolutionary relationship with their R2R3-type counterparts. It was observed that most members of MYB-CC and MYB-like members were evolving in close relation, indicating high similarity of the protein sequence between these two types of MYBs. MYBs with similar functions are likely to be located in the same sub-groups based on the topology of their phylogenetic trees [15], and vice versa. For example, McMYB3R-like a, b, and c were clustered in clade 1 and McMYB124a, McMYB124b, and McMYB88 were clustered in clade 2 (Figure 1), indicating that these genes have similar protein sequences within their corresponding clade, which potentially leads to functional similarities among them. McMYB124a, McMYB124b, and McMYB88 were distinguished from other members of R2R3 and clustered into one clade, suggesting these dissimilarities may be reflected in biological functions compared with other R2R3 members (Figure S1). However, whether this rule can reflect the similar or different functions of genes requires further validation through in vivo experiments, such as gene knockout or silencing. We also detected the distribution of the identified MYBs in chromosomes. Other than McMYB6a, McMYB140c, and McMYB140d, which were distributed across three separated scaffolds, the remaining 418 MYBs were distributed unevenly across 12 chromosomes (Figure 2). Among all the chromosomes, Chr04 had the longest length and carried 18.1% (76 out of 421) of all MYBs. In contrast, two chromosomes, Chr08 and Chr11, carried only 3.8% (16 out of 421) of MYBs and were the least distributed chromosomes in M. candidum (Figure 2). So, there was no correlation between the length of the chromosome and the distribution of MYB genes on the chromosome.

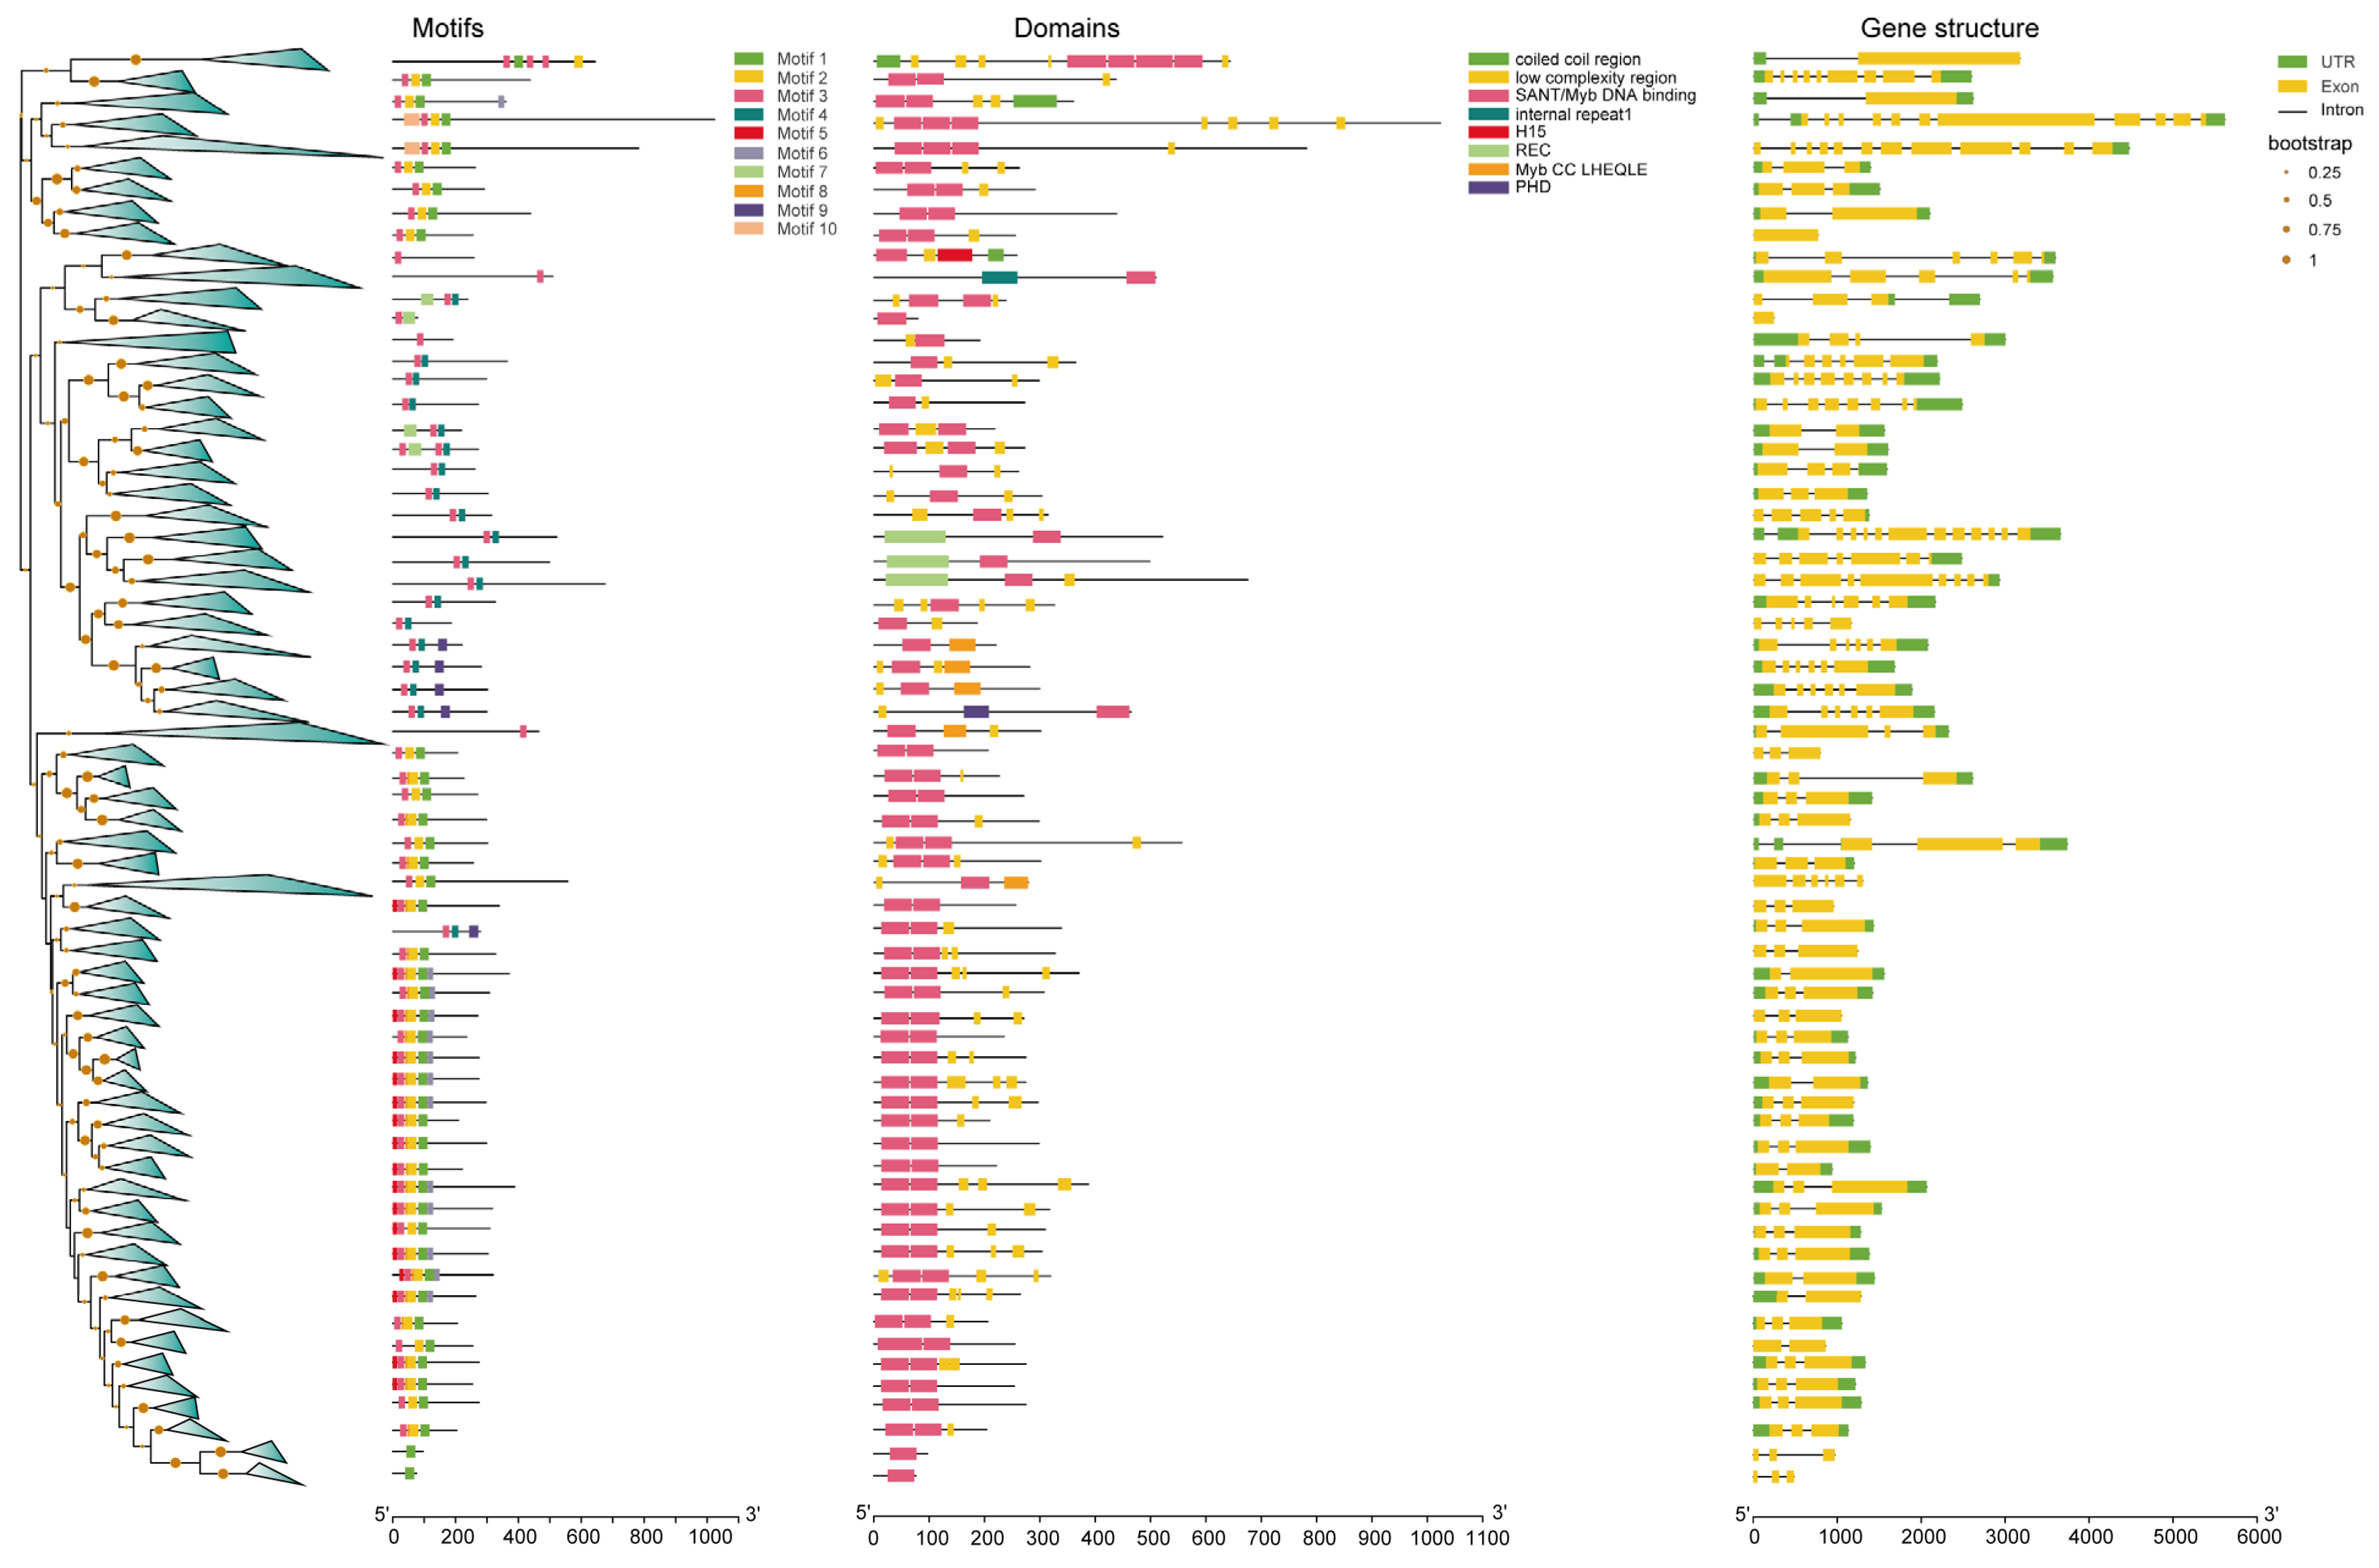
3.2. Motif, Domain, and Gene Structure Analyses of the Identified MYBs

The motif analysis showed that most of the R2R3 TFs contained motifs 1–4, indicating that the structures of R2R3-MYBs are conserved (Figure 3 and Figure S2). For the rest of the MYBs, the R-R and the CCA1-like MYBs have motifs 1 and 4 in common; whereas the R1R2R3 and the atypical MYBs share motifs 2, 3, and 5, which indicate that these two types of MYBs have a similar function. According to domain analyses, we found that a number of the R2R3-type MYBs contained two adjacent SANTs/myb DNA-binding domain complexes, which indicate important characteristics of the MYB TFs involved. However, we also observed that some initially identified R2R3 types of MYBs, mc35997 (homologous to AtMYB13), mc04810 (homologous to AtMYB66), mc05687 (homologous to AtMYB87), mc32670 (homologous to AtMYB91), mc00194 (homologous to AtMYB94), mc09531 (homologous to AtMYB101), mc18667 (homologous to AtMYB103), mc09647 (homologous to AtMYB111), and mc00413 (homologous to AtMYB119) (Figure S3), contain only one SANT/myb DNA-binding domain, indicating that these nine MYBs did not exhibit obvious characteristics associated with R2R3 MYBs, so we removed them from the identified list. CCA1-like MYBs, TBP-like MYBs, and CPC-like MYBs only contain one SANT/myb DNA-binding domain. Most R-R types contain two distant SANTs/myb DNA-binding domains, which were greatly different R2R3-type MYBs. However, we observed that one MYB, mc07136 (homologous to AT3G10580), contained only one SANT/myb DNA-binding domain, indicating that it was distinguished from the rest of the R-R MYBs, so we also removed it from the identified list (Figure S3). For R1R2R3-type MYBs, three SANTs/myb DNA-binding domain complexes were included. For atypical MYBs, a complex number of SANTs/myb DNA-binding domains were involved. For example, McMYBCDC5a and McMYBCDC5b had three SANTs/myb DNA-binding domains; McMYB3R-like a, b, and c had four SANTs/myb DNA-binding domains; and McMYB4R1a and b harbored five SANTs/myb DNA-binding domains (Figure S2). Gene structure analysis showed some incomplete UTRs or too-long regions of some genes, which may be caused by genome assembly.

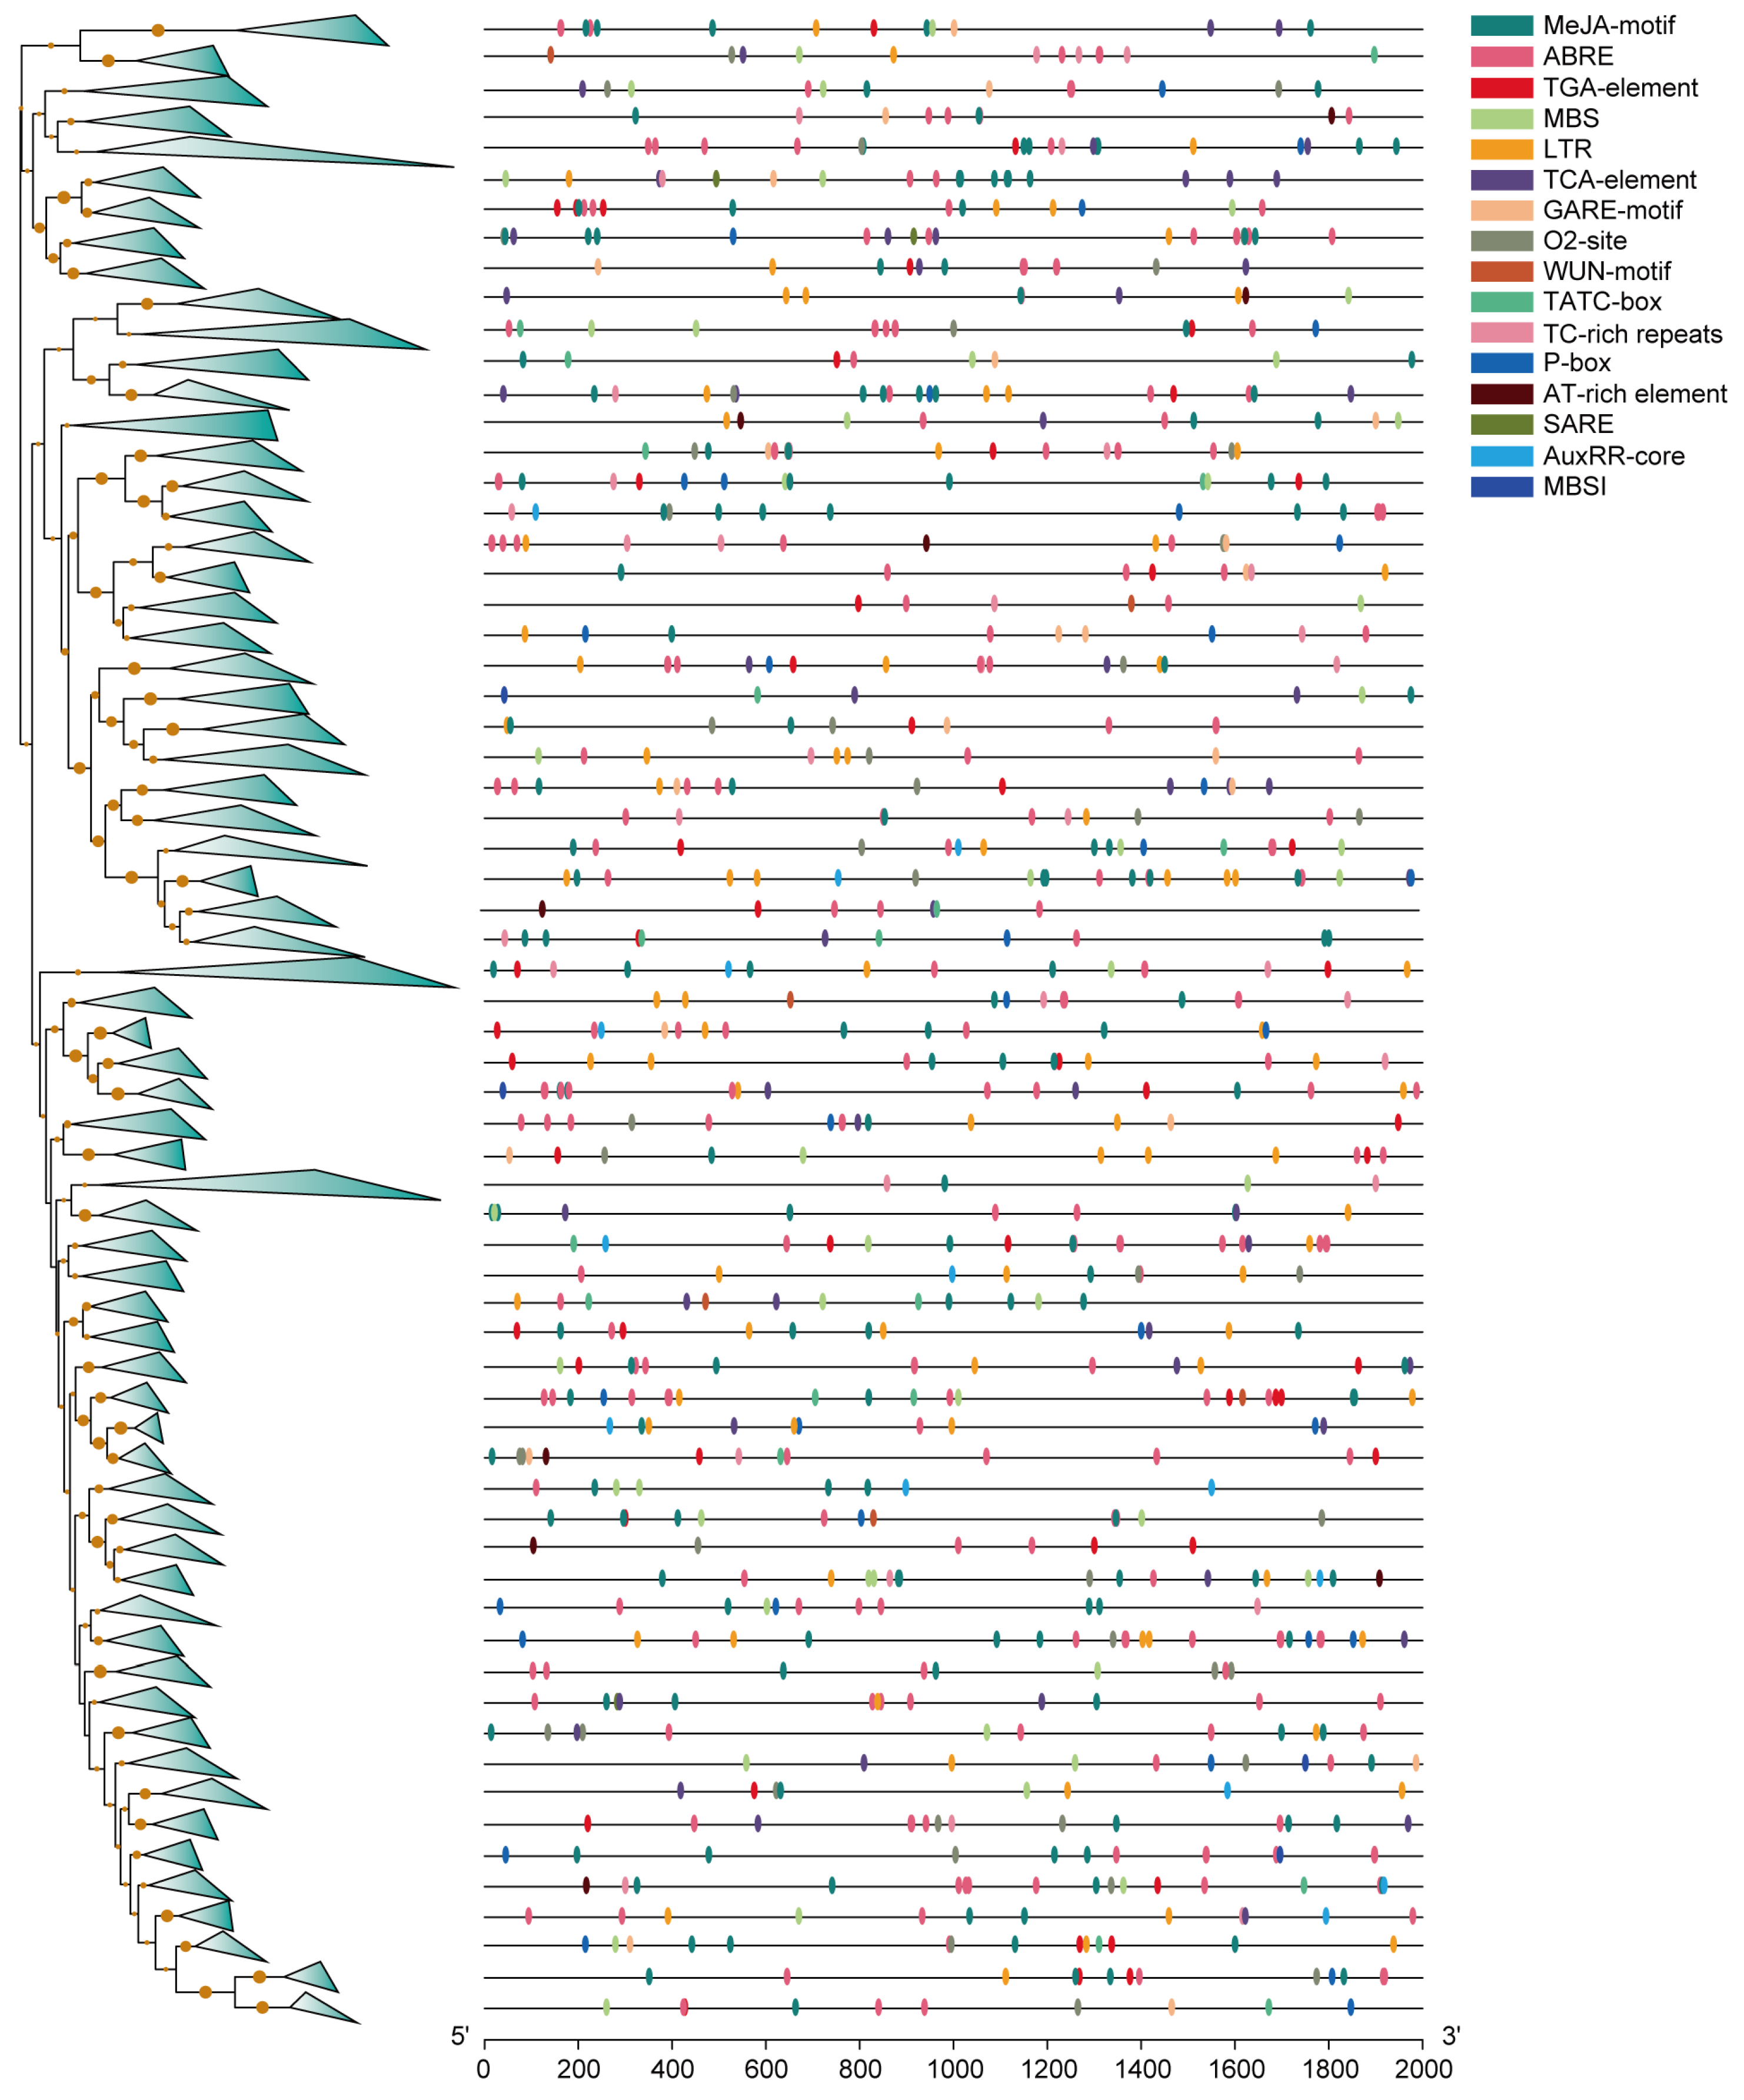
3.3. Promoter Analysis of All the Identified MYBs

In the promoter region of various genes, transcription factors interact with cis-acting elements, thereby activating cascades of genes [47]. A cis-acting regulatory element is a short DNA sequence motif of approximately 5–25 bases [48]. In order to determine the binding attribution of the promoter region of the identified MYBs, we conducted promoter analysis to identify their chief cis-acting elements. The promoter region of MYB genes showed various cis-acting elements, but here, we showed only those involved in hormone metabolism, stress response, flavonoid biosynthesis, and related processes (Figure 4 and Figure S4, and Table S2). Some hormone-metabolism-related motifs, such as TGA elements with the AACGAC binding site, TCA elements with the TCAGAAGAGG binding site, MeJA (methyl jasmonate) with the TGACG/CGTCA binding sites, O2 with the GATGACATGG binding site, and ABRE with the ACGTG binding site, were predicted in the promoter region of MYBs. Among them, ~71% (299 out of 421) MYB genes harbored TGA elements; ~58.7% (247 out of 421) contain TCA elements; ~94.8% (399 out of 421) contain MeJA (methyl jasmonate) elements; ~65.3% (275 out of 421) contain O2-sites; and ~95.5% (402 out of 421) contain ABRE elements (Figure S5, Tables S2 and S3). The presence of these cis-acting elements indicates that hormones or hormone-metabolism-related genes may regulate MYB genes in order to participate in various biological processes. In addition, most of the MYBs contributed to abscisic acid (ABA) and methyl jasmonate metabolism.
Several key cis elements are related to stress signaling, such as LTR with the CCGAAA binding site, MBS with the CAACTG binding site, TC-rich repeats with the GTTTTCTTAC binding site, and a WUN motif with the AAATTTCCT binding site, which were found in ~73.2% (308 out of 421), ~74.3% (313 out of 421), ~47.7% (201 out of 421), and ~42% (177 out of 421) of promoter regions of MYB genes, respectively (Figure S5 and Table S4). Among them, the low-temperature responsive element (LTR) is important for inducing cold-regulated genes. Brown et al. used transient-expression analysis and nuclease sensitivity analysis to confirm that the LTR motif is involved in regulating the expression of blt101.1 at low temperature [49]. MBSI with an aaaAaaC(G/C)GTTA binding site could be involved in the flavonoid biosynthesis process. In this study, we found that 13 R2R3 MYBs, two atypical MYB genes, two MYB-like MYBs, and 1 R-R MYB gene harbored MBSI elements in their promoter regions, indicating that these genes could participate in regulating pigment or color formation in M. candidum (Tables S2 and S3).

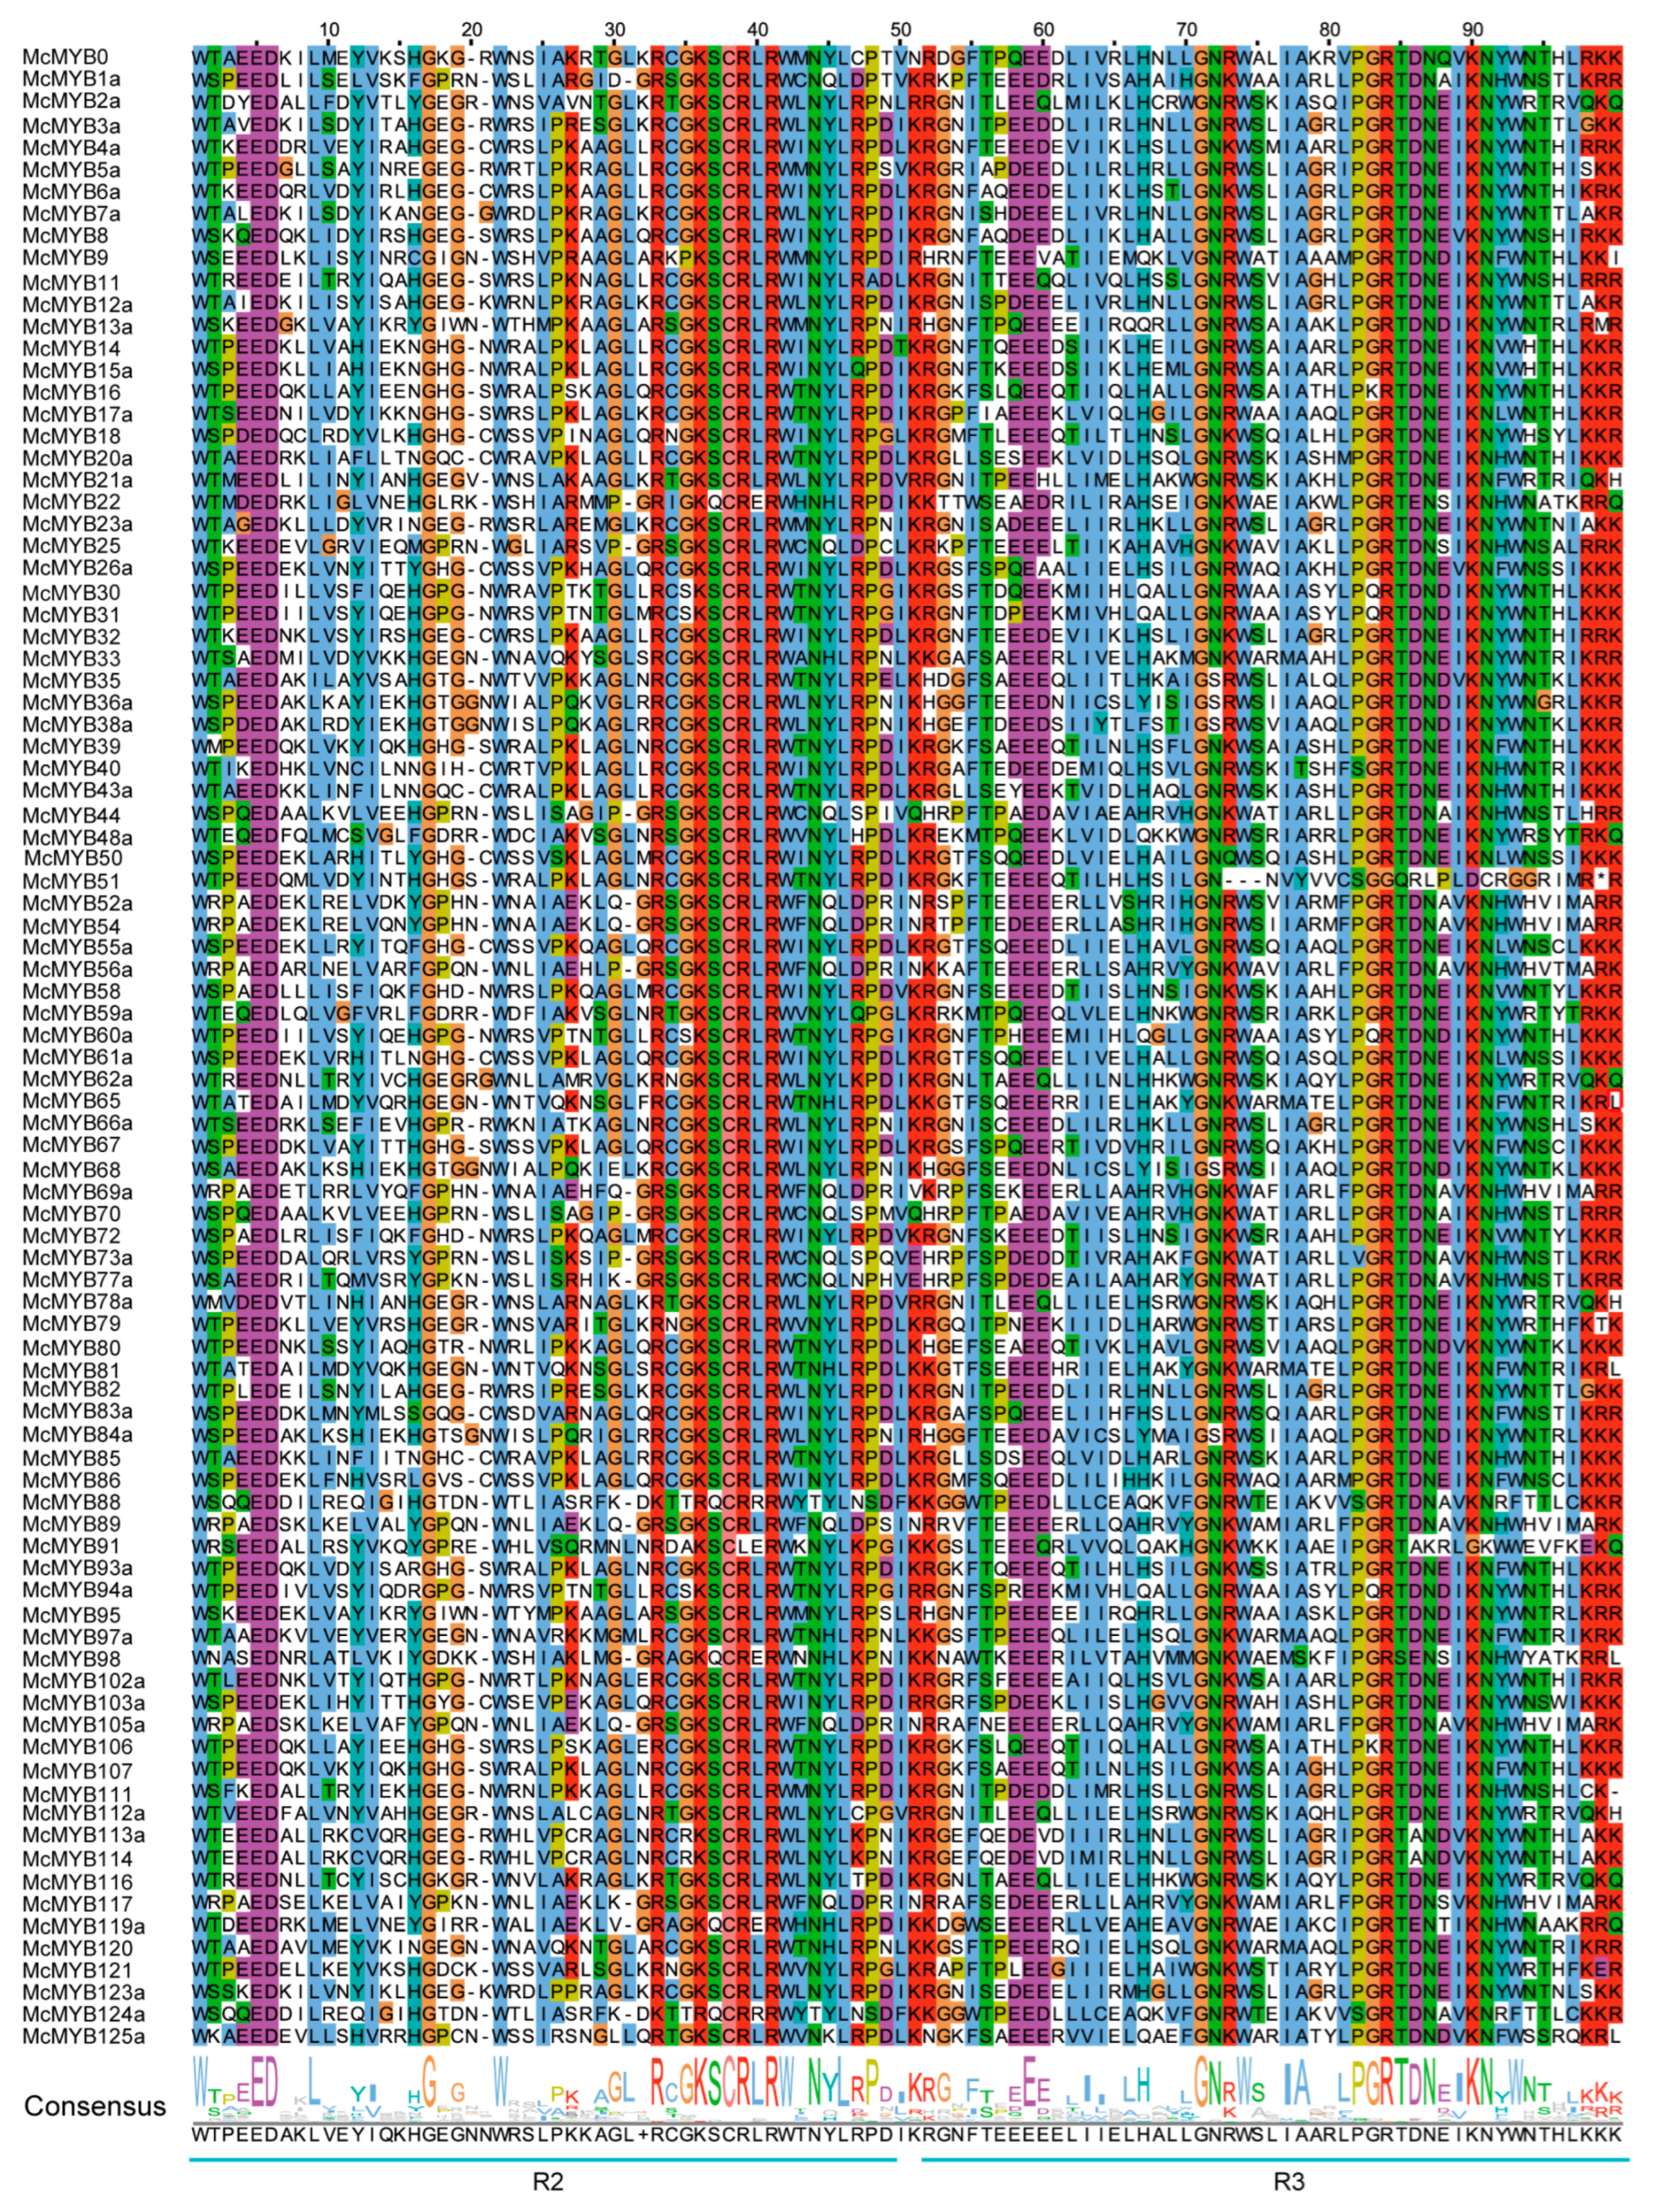
3.4. Conservation Analysis of Different Types of MYB TFs

Based on domain analysis, we confirmed the final MYB members and then conducted conservation analyses for each type of MYB TF. A total of 90 R2R3 TFs from phylogenetic trees were chosen to perform the alignment of protein sequences by the ClustalW method. The conserved region was confirmed to contain two adjacent regions, named R2 and R3, ranging from 1 amino acid (aa) to 50 aa and 54 aa to 105 aa positions, respectively (Figure 5). In both regions, a higher conservation level was found in the back parts than in the front parts (Figure 5), suggesting that there exist functional differences among R2R3 family members. For CCA1-like, CPC-like, and I-box TFs, there is only one SANT/DNA-binding domain with an approximate length of 50 aa (Figure 6a,g,h). At the 40–51 aa position, all 31 identified CCA1-like MYBs were highly conservative, and we also observed that the 31 TFs could be categorized into two groups based on their domains, one consisting of 17 members and another consisting of 14 members (Figure 6a), indicating the functional differentiation within the members of the CCA1 sub-family. Compared with CCA1-like MYBs, there was a much higher conservation level for CPC-like and I-box TFs within families, indicating that these TFs are functionally similar (Figure 6g,h). All TBP-like TFs also contained one SANT/DNA-binding domain with an approximate length of 55 aa. However, 10 TBP-like TFs contained the conserved domain at the beginning parts of their sequences, and the other 7 TBP-like TFs contained the conserved domain at the end part of their sequences. Additionally, there was a lack of conservatism between the two domains as well (Figure 6b,c). R1R2R3-type MYBs had three conservative SANTs/DNA-binding domains, namely R1, R2, and R3, with a length of 50 aa, 51 aa, and 51 aa, respectively. The nine identified MYBs had a higher conservative degree in the latter part of their protein sequences than in the front in each of the three domains (Figure 6e). Although R-R-type MYBs also contain two distant domains, they appear to be very different from the two domains of the R2R3 MYBs. A total of 17 identified MYBs were not conserved at the 20–29 aa position of the first domain, but highly conserved in the second domain. The conservative degree in the second R region was significantly higher than that in the first R region (Figure 6i). The atypical MYBs were composed of 3 types of MYBs, including McMYB3R-like, McMYB4R1, and McMYBCDC5 with more complex domains, and 3–5 SANTs/DNA-binding domains, so it was hard to find the conservative regions for them. Previous studies on MYB gene identification have often overlooked the MYB-CC and MYB-like sub-families in their analyses [2,50,51]. In this study, we identified 31 MYB-CC MYBs and 56 MYB-like MYBs. The MYB-CC TFs contain two conserved domains, one SANT/DNA-binding domain and another MYB-CC domain (Figure 6d). MYB-like MYBs contain an approximately 52-amino-acid domain. It is clear from the above that most MYB types have unique characteristics, which make them distinct from other types of MYBs.

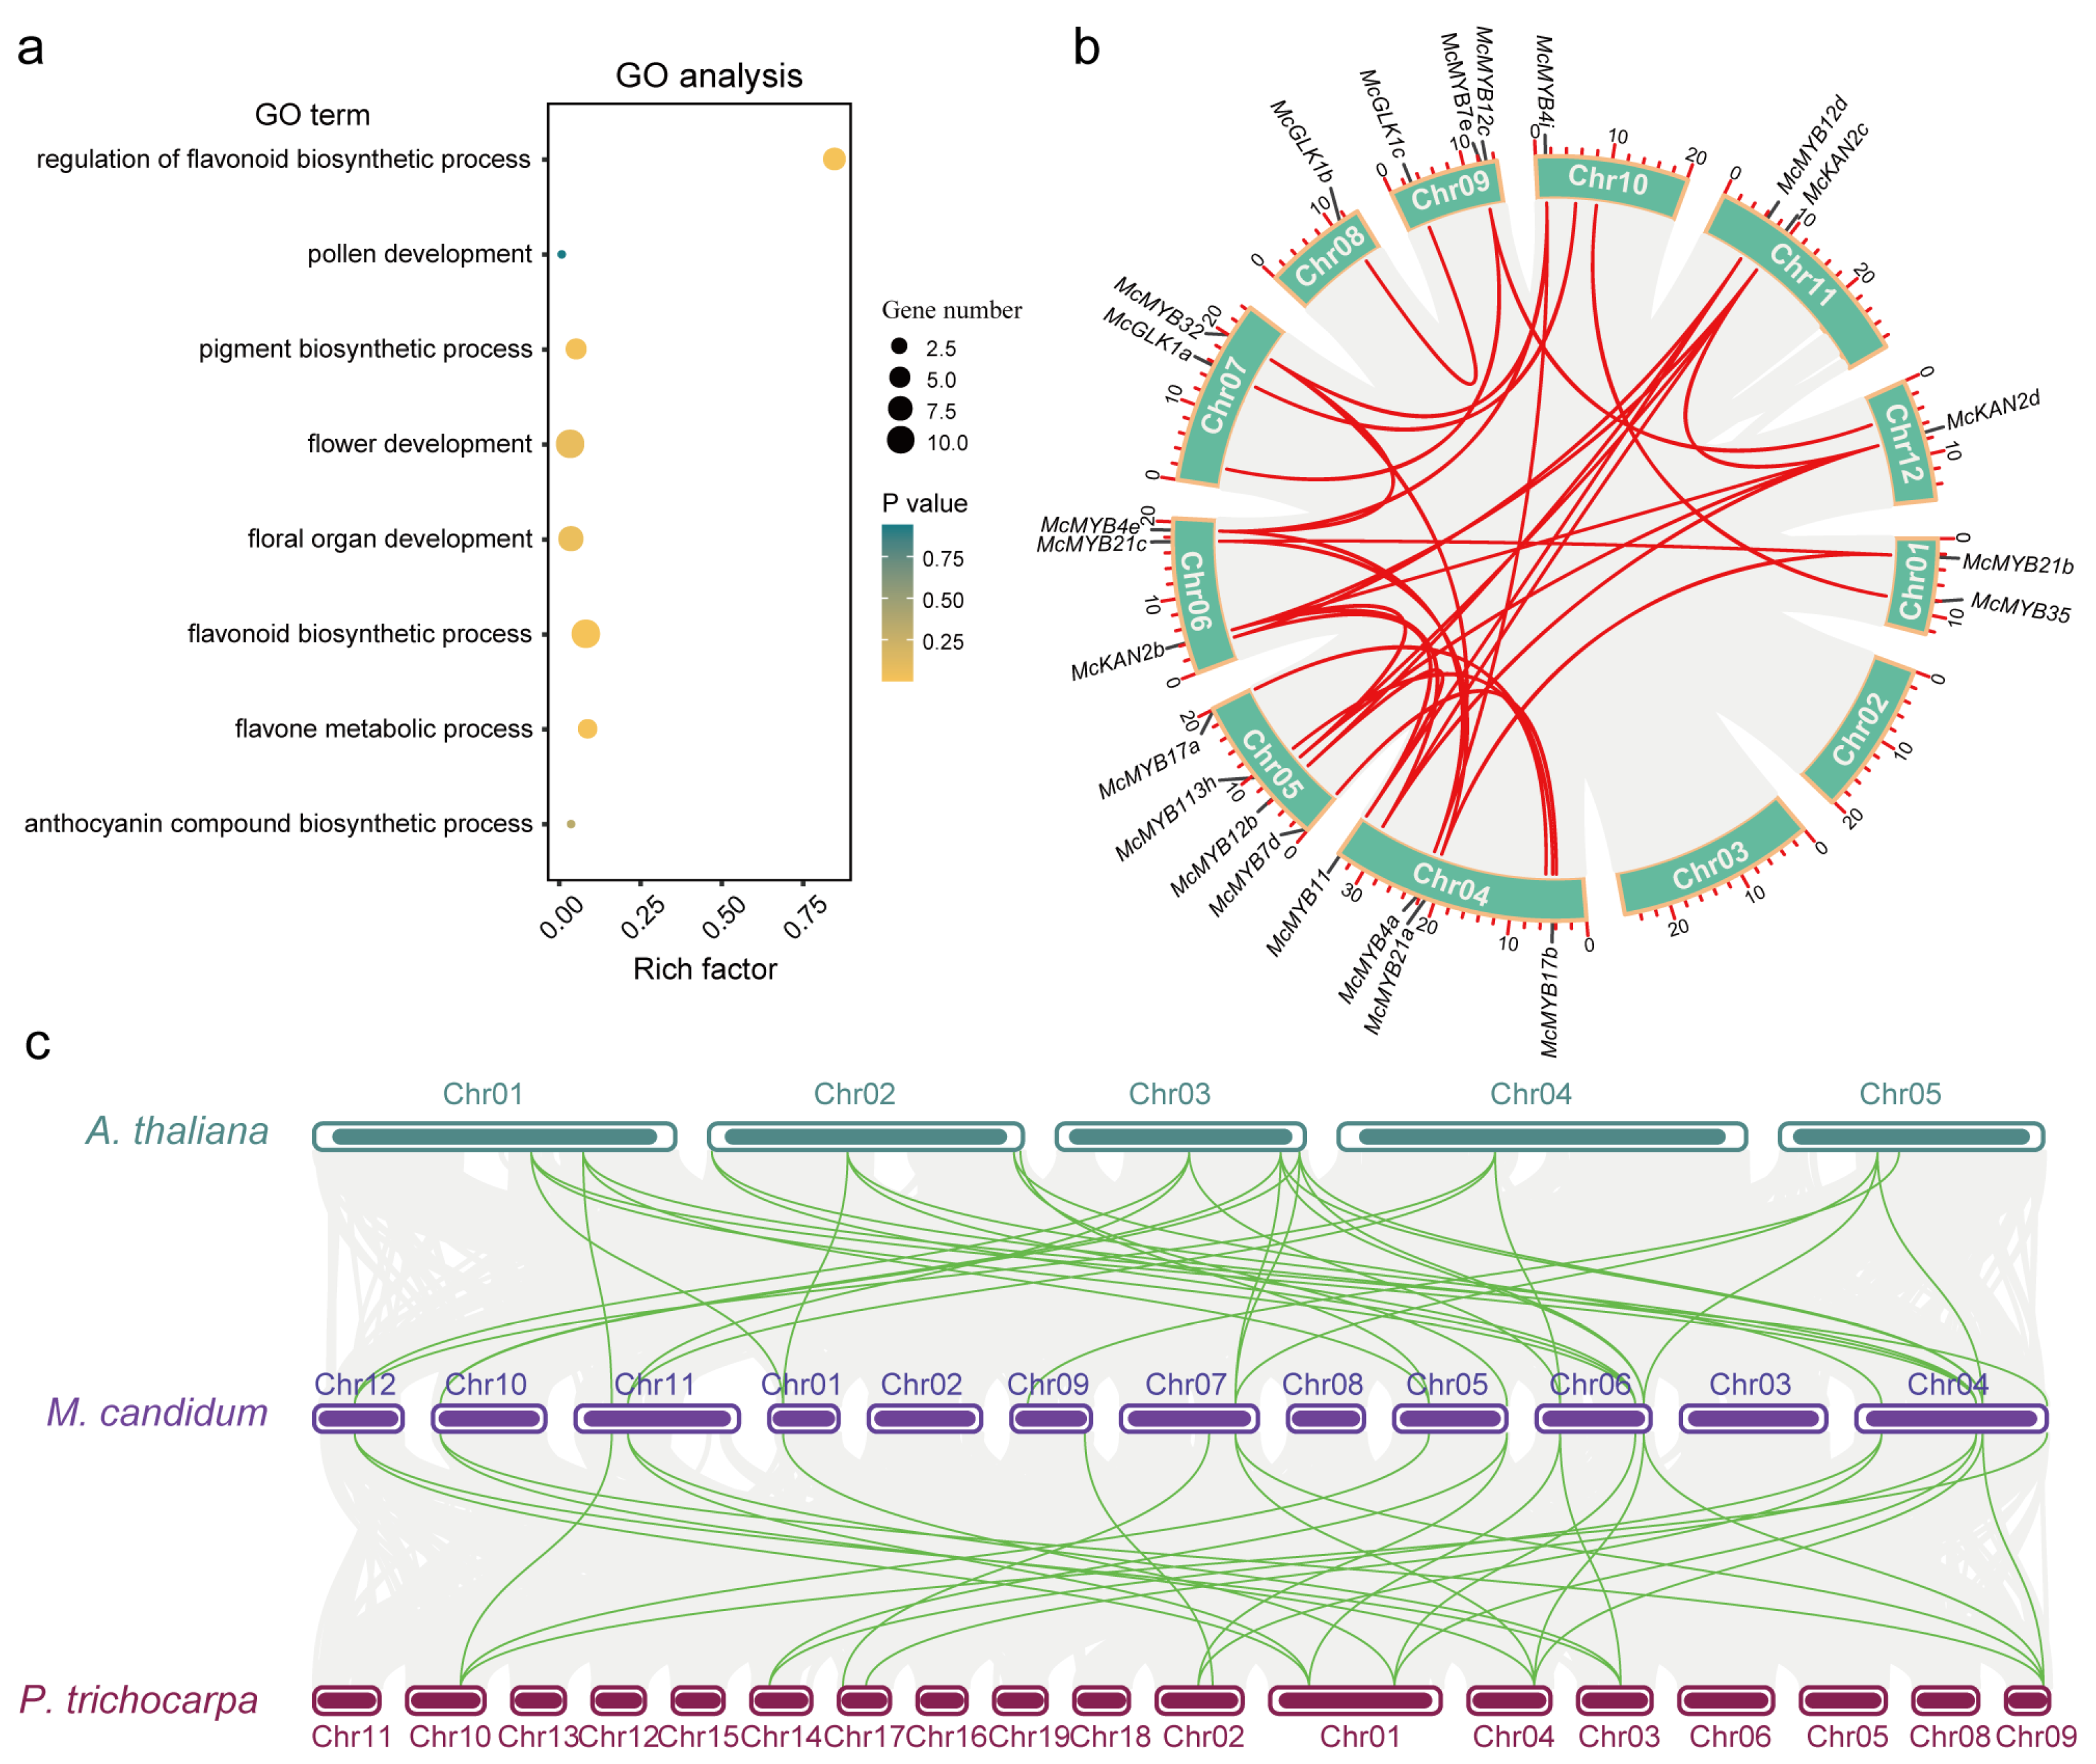
3.5. Duplication Events, Divergence, and Collinearity of Flower Development and Color-Formation-Related MYB Genes

Gene duplication events contribute to gene proliferation in the plant kingdom and often evolve to partition existing functions to form sub-functionalizations or neo-functionalizations [52,53]. To investigate the gene duplication events of all identified MYBs, we performed an intragenomic collinearity analysis. In the Circos graph, the red lines indicate that two genes, called gene pairs, were linked together (Figure S6). We obtained 363 gene pairs in all identified MYBs (Table S4). The fact that many gene pairs are located on different chromosomes suggested that segmental duplication events have occurred within the MYB family of M. candidum. To investigate the potential involvement of MYBs in flower development and color formation, we performed GO analysis of the 421 MYBs. Eight related GO terms were selected, including regulation of the flavonoid biosynthetic process (GO: 0009962, p-value: 3.83E-11), flavonoid biosynthetic process (GO: 0009813, p-value: 8.74E-06), flavone metabolic process (GO:0051552, p-value: 4.50E-3), pigment biosynthetic process (GO:0046148, p-value: 1.88E-2), floral organ development (GO:0048437, p-value: 5.50E-2), anthocyanin-containing compound biosynthetic process (GO:0009718, p-value: 0.33), flower development (GO:0009908, p-value: 6.97E-2), and pollen development (GO:0009555, p-value: 0.94) (Figure 7a, Table S5). Finally, we identified 23 MYBs that were associated with flower development and color formation. Furthermore, these 23 MYBs were used to conduct a collinearity analysis within the M. candidum genome and a total of 24 gene pair relationships were found (gene pairs with yellow shading) (Figure 7b, Table S4).
By using a divergence rate of 6.5 × 10⁻⁹ per synonymous site per year [41], we estimated the divergence time between the MYB gene pairs. The divergence time ranged from 7.32 MYA to 289.34 MYA, suggesting that the identified MYBs experienced long-time evolutionary selection in M. candidum (Table S4). A total of 48.5% (177 out of 365) of gene pairs in M. candidum far surpassed the divergence time of grass species (56–73 MYA) [54,55], indicating that earlier gene duplication events happened in M. candidum. Divergence of members of the same sub-gene family can also occur over a different period; for example, in the MYB21 sub-family, the divergence between McMYB21b and McMYB21c occurred at about 66.54 MYA, but the divergence of MYB21a and MYB21c happened at about 16.94 MYA. Divergence of McMYB4a and McMYB4i happened at about 82.26 MYA; divergence of McMYB4a and McMYB4e occurred at about 28.79 MYA; and divergence of McMYB4b and McMYB4c happened at about 107.45 MYA (Table S4). Different sub-family members could also be gene pairs, such as McMYB4a and McMYB32, McMYB4f and McMYB7e, and McMYB54 and McMYB52a, etc., indicating the same genetic origin of these genes (Table S4).
To estimate the selection pressure among duplicated genes, the non-synonymous substitution (Ka/dN) and synonymous substitution (Ks/dS) rates were obtained by using TBtools. Subsequently, we calculated the ratio of substitution mutations (Ka/Ks) (Table S4). Genes that undergo positive selection (Ka/Ks greater than 1) usually have changes in the coding protein that can affect their function. If Ka/Ks is less than 1, it means that the genes have been subjected to negative selection, also referred to as purifying selection, which may maintain the stability of the coding protein during the selection process. We found in our study that the ratio between all MYB gene pairs ranged from 0.06 to 0.80, indicating that all the MYBs have undergone purifying pressure and have been relatively stable throughout the entire evolutionary history of M. candidum. In general, the larger the ratio of Ka/Ks, the more rapid the rate of divergence between gene pairs. According to our results, McMYB3R5b and McMYB3R5d were found to have experienced the most rapid functional divergence in M. candidum (Table S4). Whole-genome duplication (WGD) events are one major reason for gene duplication. Based on synonymous substitution rate (Ks) analysis, previous studies had defined different types of WGD events, such as α, β, and, γWGD events [56,57]. Here, we defined three kinds of WGDs, including WGDα (Ks < 0.45), WGDβ (0.45 ≤ Ks ≤ 0.85), and WGDγ events (Ks > 0.85). By this standard, ~32.5% of MYB gene pairs (118 out of 363) experienced WGDα, ~9.6% (35 out of 363) of MYB gene pairs experienced WGDβ, and 57.9% of MYB gene pairs (210 out of 363) experienced WGDγ. Our analysis illustrated that more than half of the MYB genes may originate from more ancient duplication events.
To investigate the relationship of the MYBs among different species, we used one herbaceous species, A. thaliana, and one woody species, P. trichocarpa, to perform the collinearity analysis with M. candidum. A total of 336 MYBs in M. candidum were correlated with 153 MYBs in A. thaliana and 236 MYBs in P. trichocarpa, respectively (Figure S7 and Table S6). Among the 23 MYBs related to flower development and color formation, 18 found in M. candidum were syntenic with 12 MYBs in both A. thaliana and P. trichocarpa (Figure 8 and Table S6). We also observed that some genes had multiple homologous genes in the other two species. For example, the gene in Chr01 of M. candidum had two collinearity genes in Chr01 and Chr02 of A. thaliana. The gene in Chr10 of M. candidum had two collinearity genes in Chr01 and Chr04 of P. trichocarpa (Figure 7c). To understand the evolution of collinearity genes in different species, we performed phylogenetic analyses for these 42 genes from three species. The results showed that the evolutionary tree mainly consisted of six clades (Figure S8). The first clade was mainly comprised of GLK1 members. McGLK1a was found to be closely clustered with Potri.017G015800 (GLK1) and Potri.007G136901. McGLK1c was closely clustered with At2g20570 (GLK1). The second clade was comprised of KAN members. McKAN2b–d were close to At4g17695 (KAN3), At1g32240 (KAN2), Potri.003G096300 (KAN2), and Potri.001G137600 (KAN2). In the third clade, McaMYB12c was closely clustered with At5g49330 (MYB111), Potri.002G198100 (MYB12), and Potri.010G141000 (MYB111). At3g62610 (MYB11) were clustered into one branch. McMYB11, McMYB12b, and d were clustered in one independent branch, indicating that there are differences among different species. McaMYB21a–c, At3g01530 (MYB57), At5g40350 (MYB24), At3g27810 (MYB21), Potri.017G071500 (MYB21), and Potri.001G346600 (MYB21) were clustered into one clade, indicating that MYB57, MYB24, and MYB21 were highly homologous in Arabidopsis. In this clade, we also observed that the genes In the three species also cluster into three separate clades. MYB17a and b were orthologous to At3g61250 (MYB17), Potri.014G081200 (MYB17), and Potri.002G157600 (MYB17). The last clade was composed of McMYB4a, McMYB4e, McMYB4i, McMYB32, At4g38620 (MYB4), At2g16720 (MYB7), Potri.009G134000 (MYB4), and Potri.004G174400 (MYB4). Amongst these, four genes of M. candidum showed a high degree of similarity compared to their orthologous counterparts in the other two species (Figure S8). Although collinearity genes in different species had close evolutionary relationships, obvious differences exist among species.

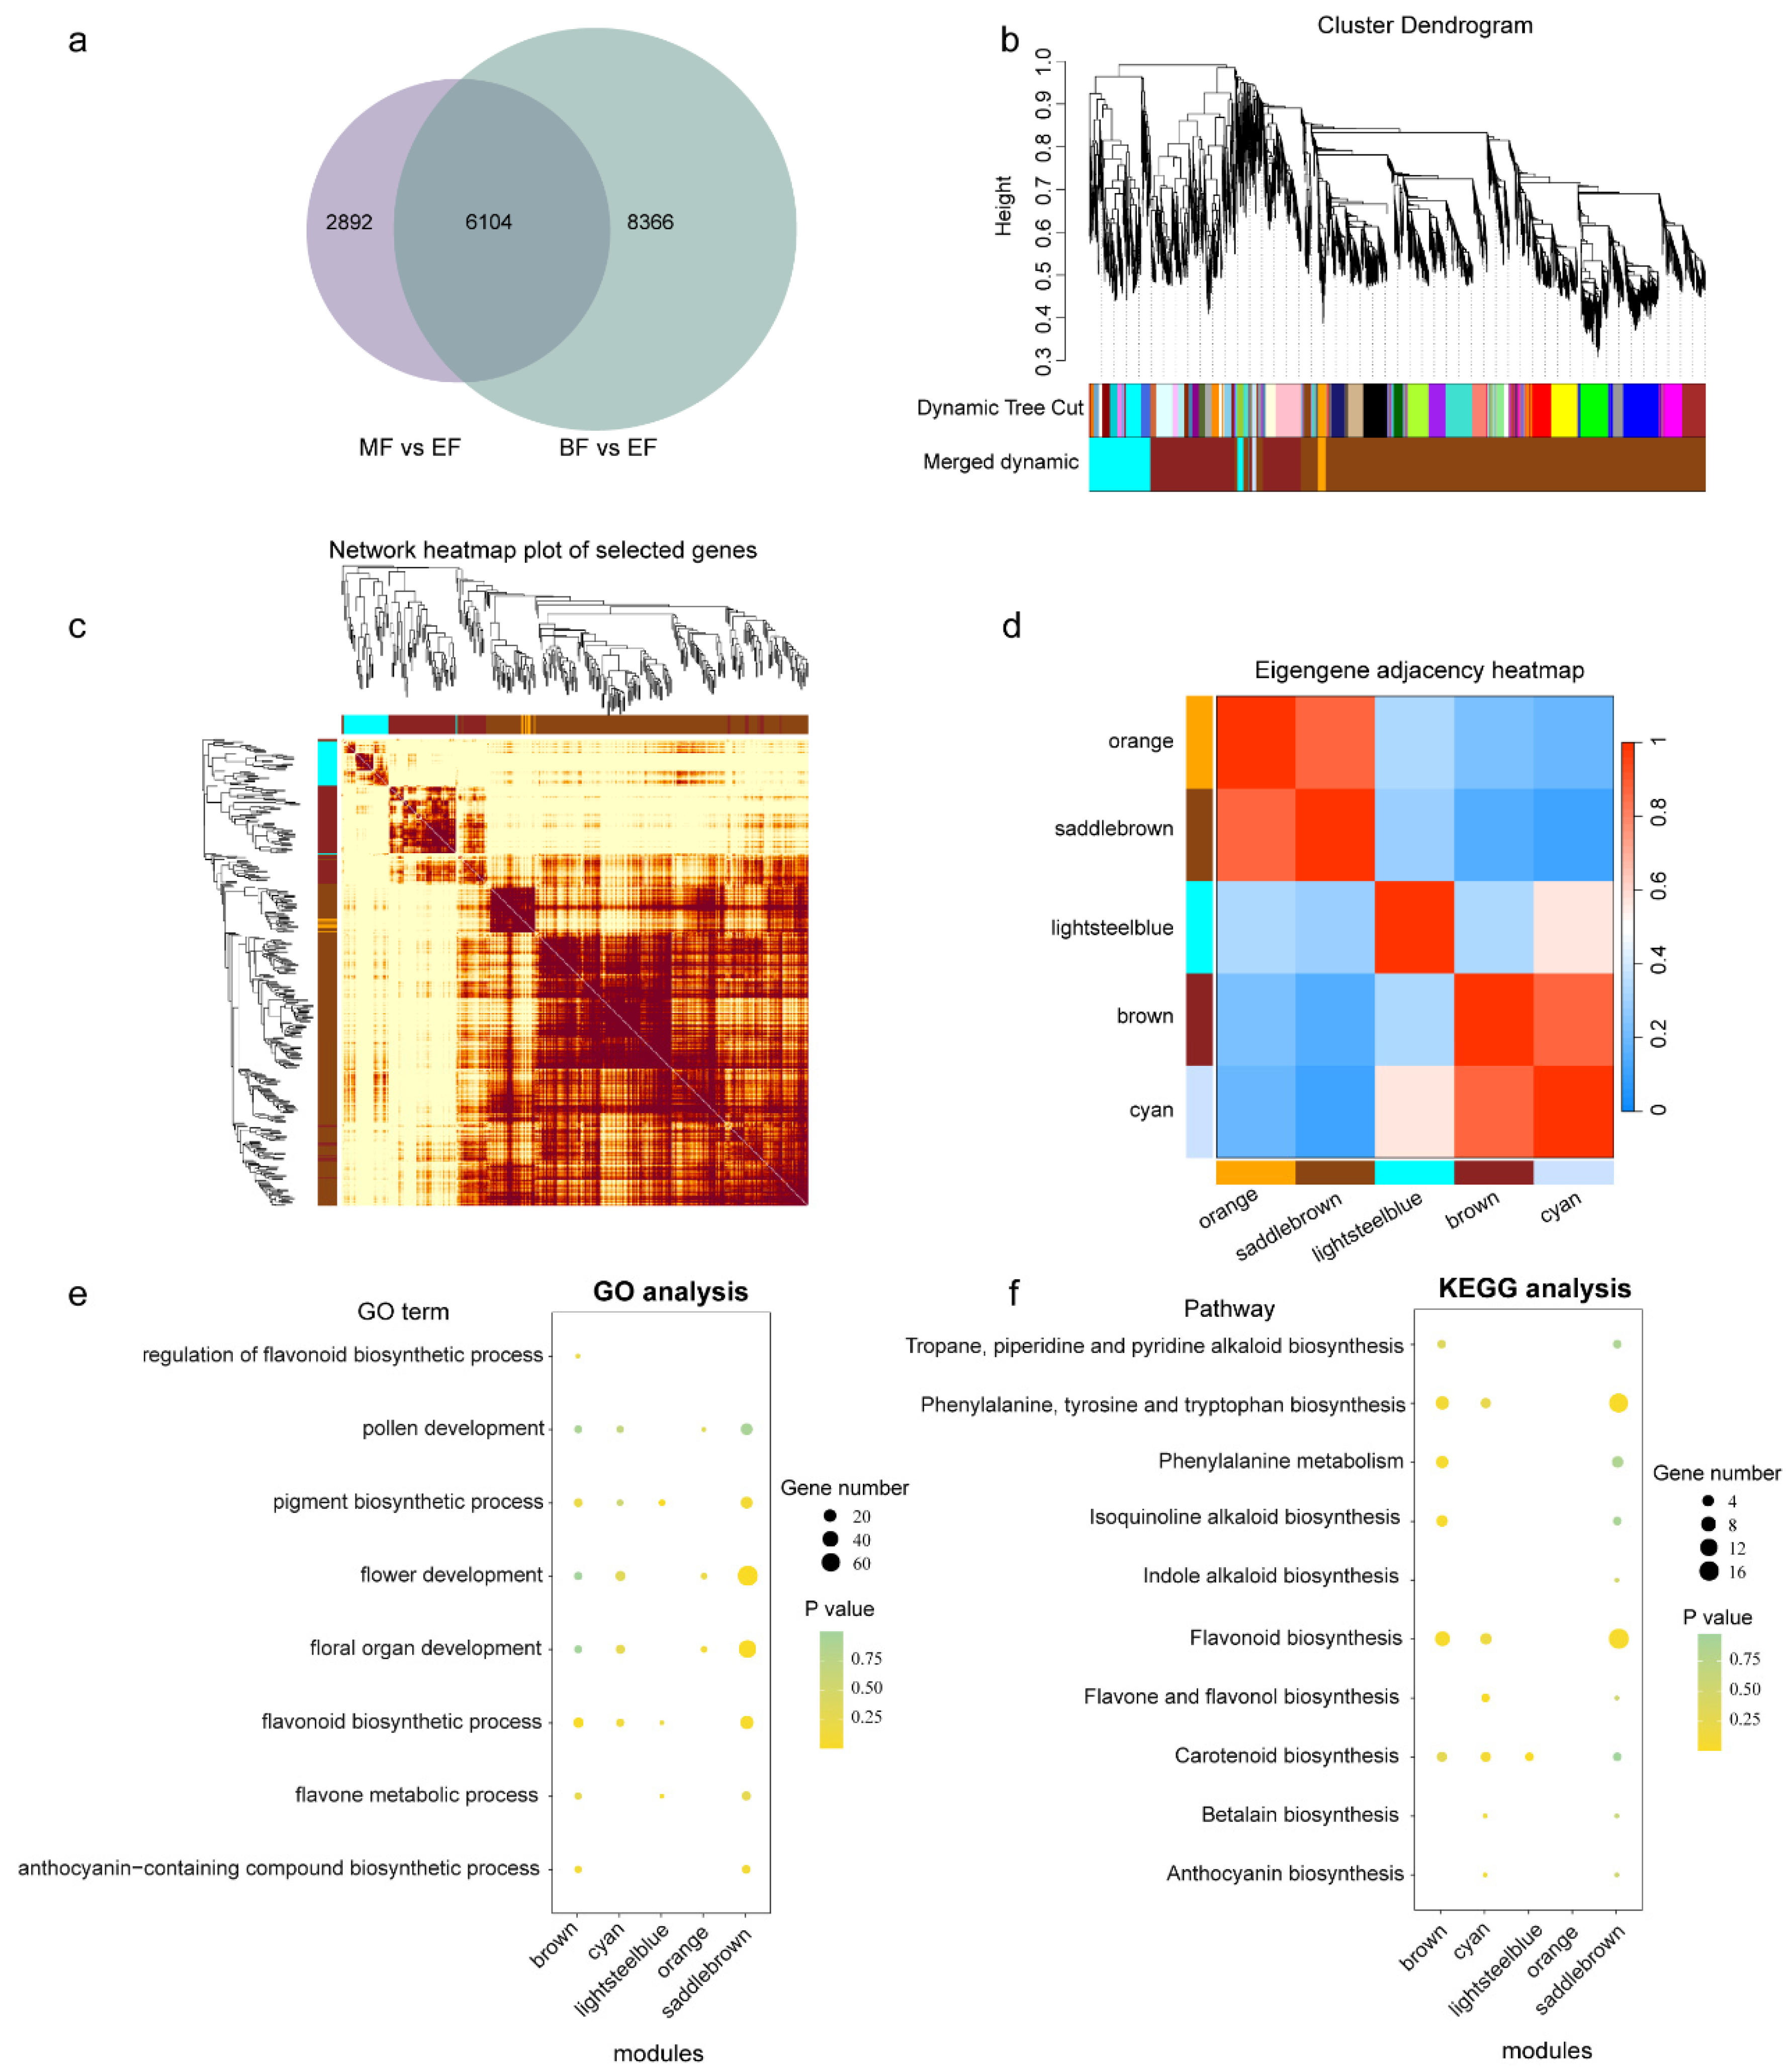
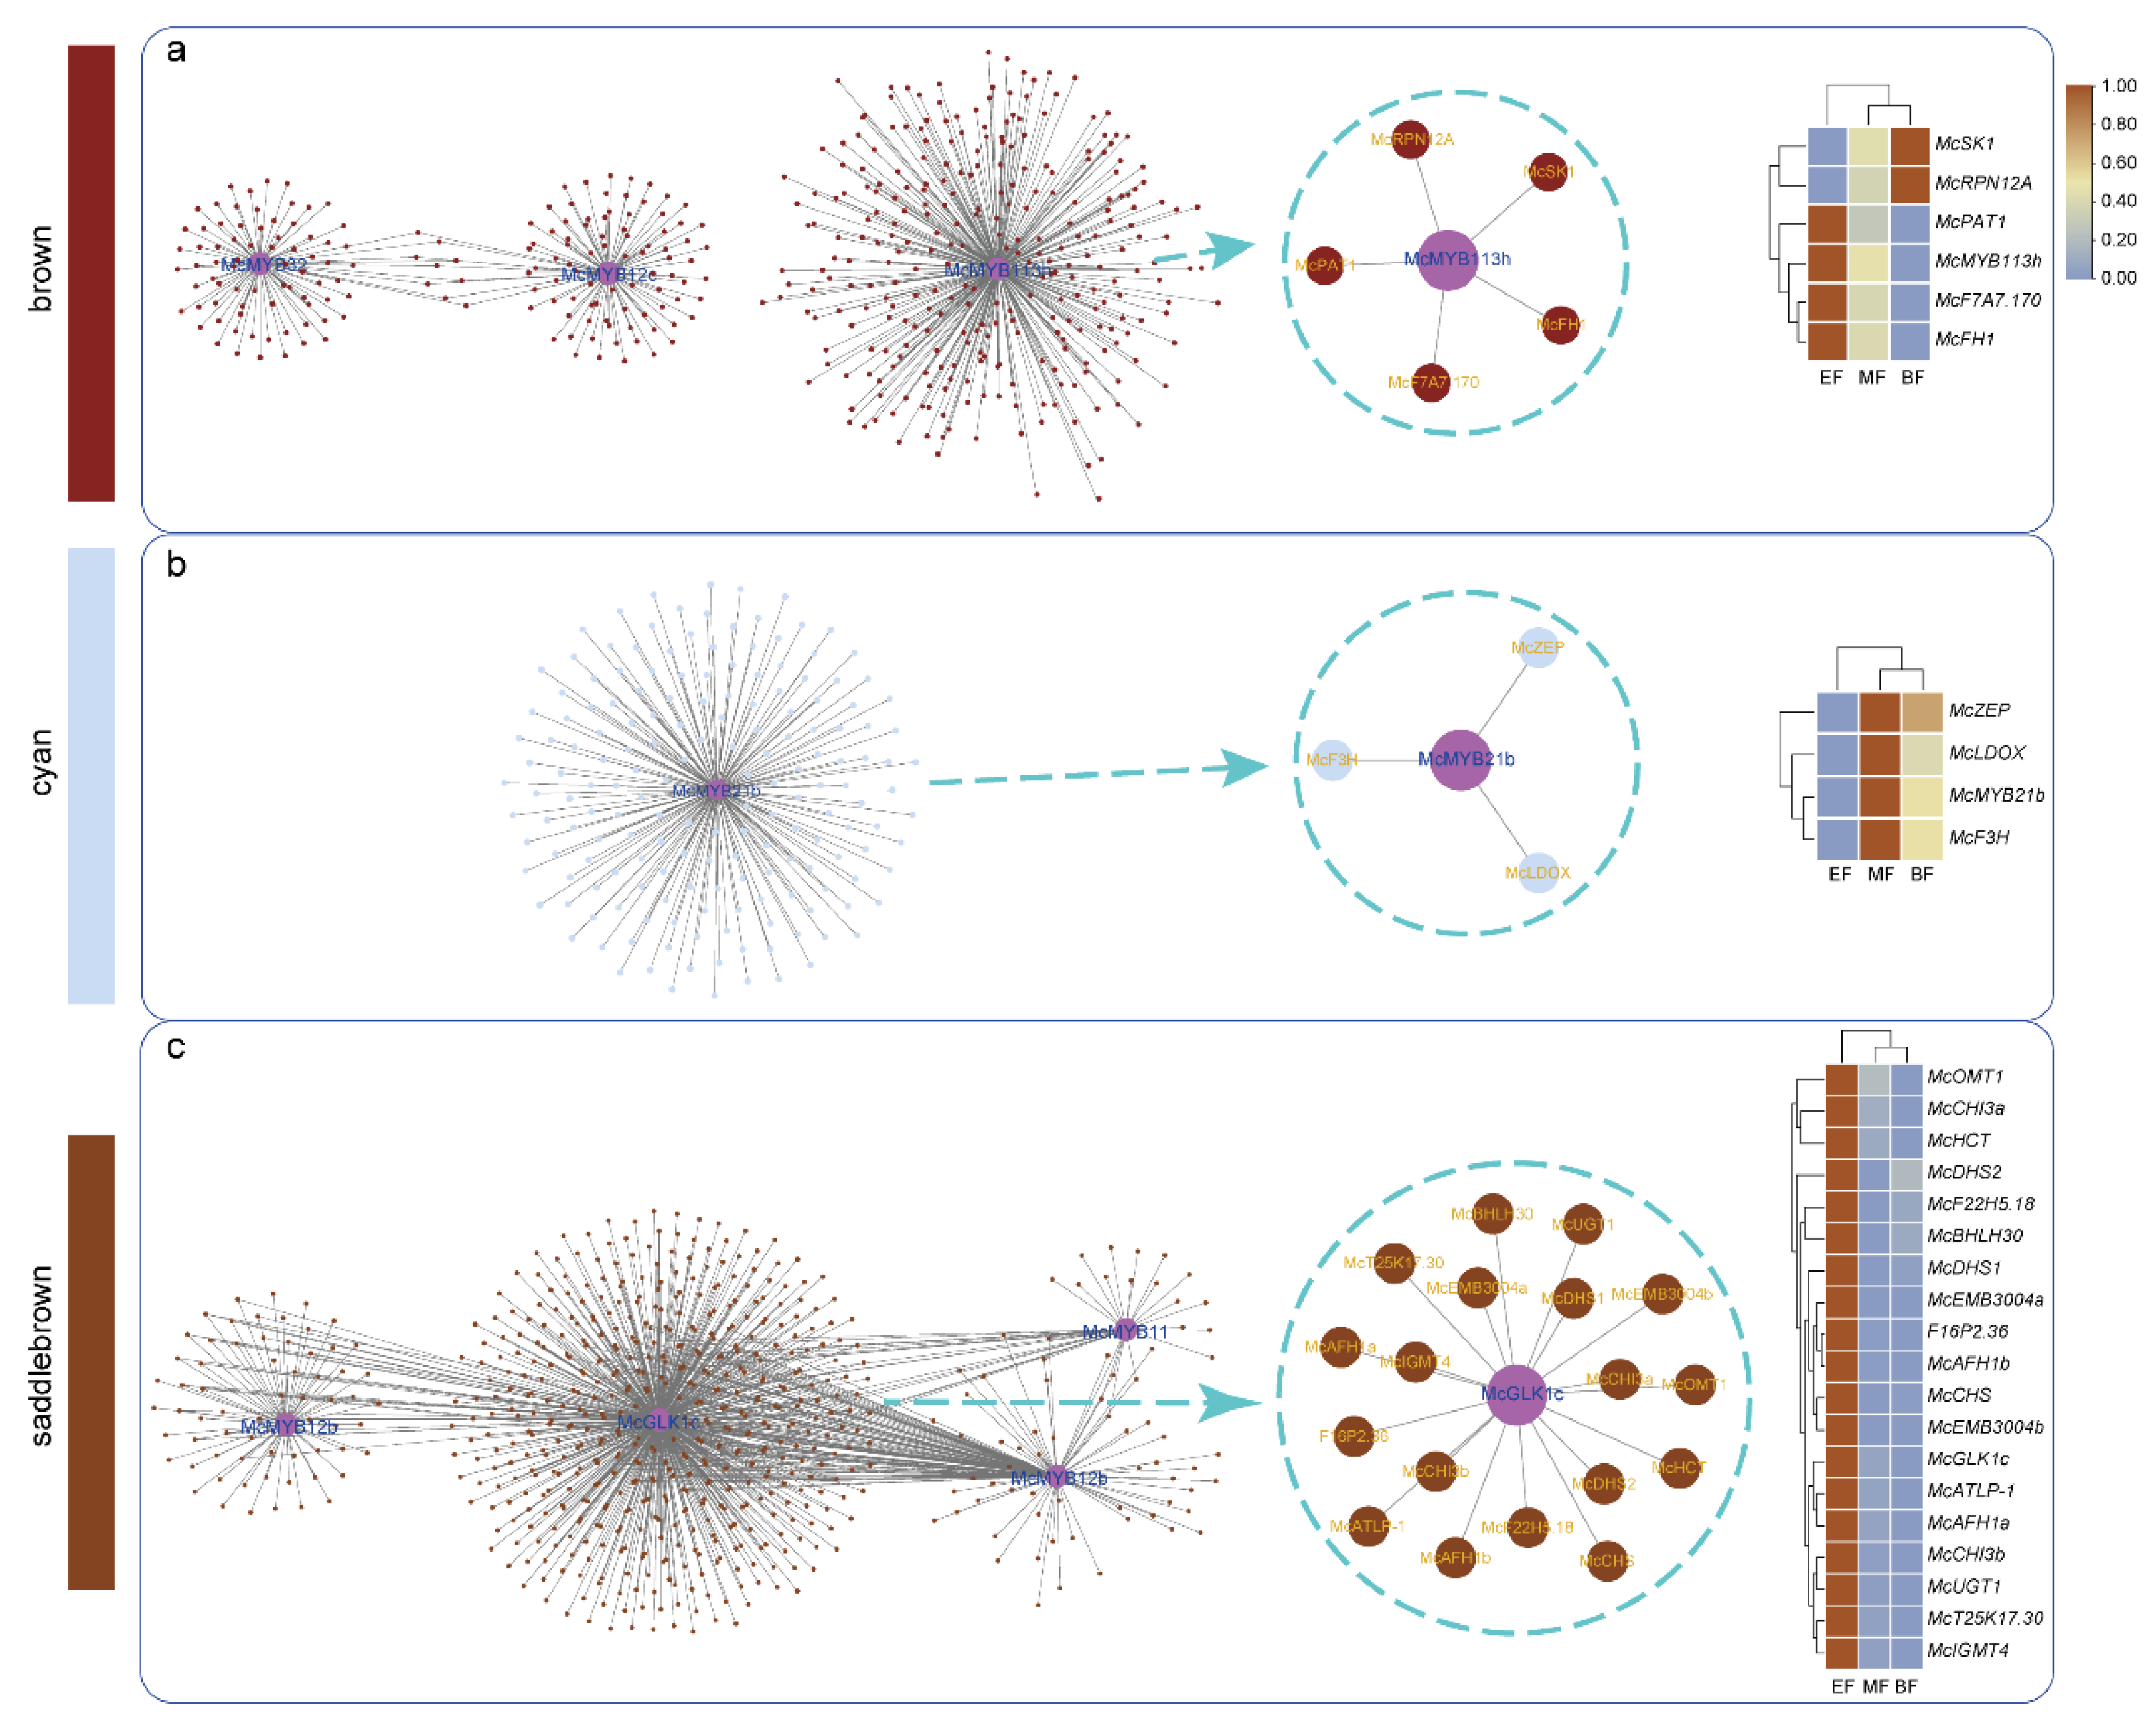
3.6. WGCNA Analysis, Functional Analysis of DEGs, and MYB-Centered Network Building

To understand the roles of MYB family members in flower development, we collected flower samples from three different stages and conducted RNA-seq. After performing differentially expressed gene (DEG) analysis, we obtained 8996 DEGs in the MF vs. EF groups and 14,470 DEGs in the BF vs. EF groups. The intersection between these two groups resulted in 6104 DEGs (Figure 8a, Table S7) containing 95 MYB gene family members (Figure S9). A total of 68 out of 95 MYBs were up-modulated in the EF stage; 15 out of 95 MYBs were up-modulated in BF compared to the EF stage; and 12 out of 95 MYBs were up-modulated in the MF stage (Figure S9 and Table S7). With these DEGs, we performed WGCNA analysis and obtained 47 modules, which were later merged to five isolated modules: brown, saddlebrown, lightsteelblue, orange, and cyan (Figure 8b,c). Correlation analysis of these different modules showed that the orange and saddlebrown modules, as well as the brown and cyan modules, exhibited positive correlation relationships (Figure 8d). To understand the gene function of these different modules, we conducted GO and KEGG analyses for each (Figure 8e,f). Our findings indicated that the saddlebrown module is crucial in flower development as it contains more genes related to flower development than other modules. Additionally, genes in brown, cyan, and lightsteelblue modules were enriched in carotenoid biosynthesis, indicating their potential contributions to carotenoid metabolism. In contrast, we observed that only a few genes in the orange module were enriched in the selected pathways in the KEGG and GO analyses.
To explore the relationship between our selected MYBs and other functional genes, we constructed a co-expression network of the top 100,000 genes in the saddlebrown, brown, and cyan modules based on weight value (Figure 9a–c). We observed that in these modules, several DEGs had co-expression relationships with McMYB32, McMYB12e, and McMYB113h. Upon further investigation with flower-development-related functional genes, we found that McMYB113h displayed high co-expression relationships with McSK1, McRPN12A, McPAT1, McF7A7.170, and McFH1 in the brown module (Figure 9a). McSK1 and McRPN12A were up-regulated in the BF stage, while the rest of the genes in the co-expression network were up-regulated in the EF stage (Figure 9a). In the cyan module, we observed that McMYB21b had relatively high co-expression relationships with McF3H, McZEP, and McLDOX (Figure 9b). All genes in the subnetwork were up-regulated in the MF stage (Figure 9b). In the saddlebrown module, we found that McGLK1c had relatively high co-expression relationships with 18 functional genes and all genes in the subnetwork were up-regulated in EF stages (Figure 9c).

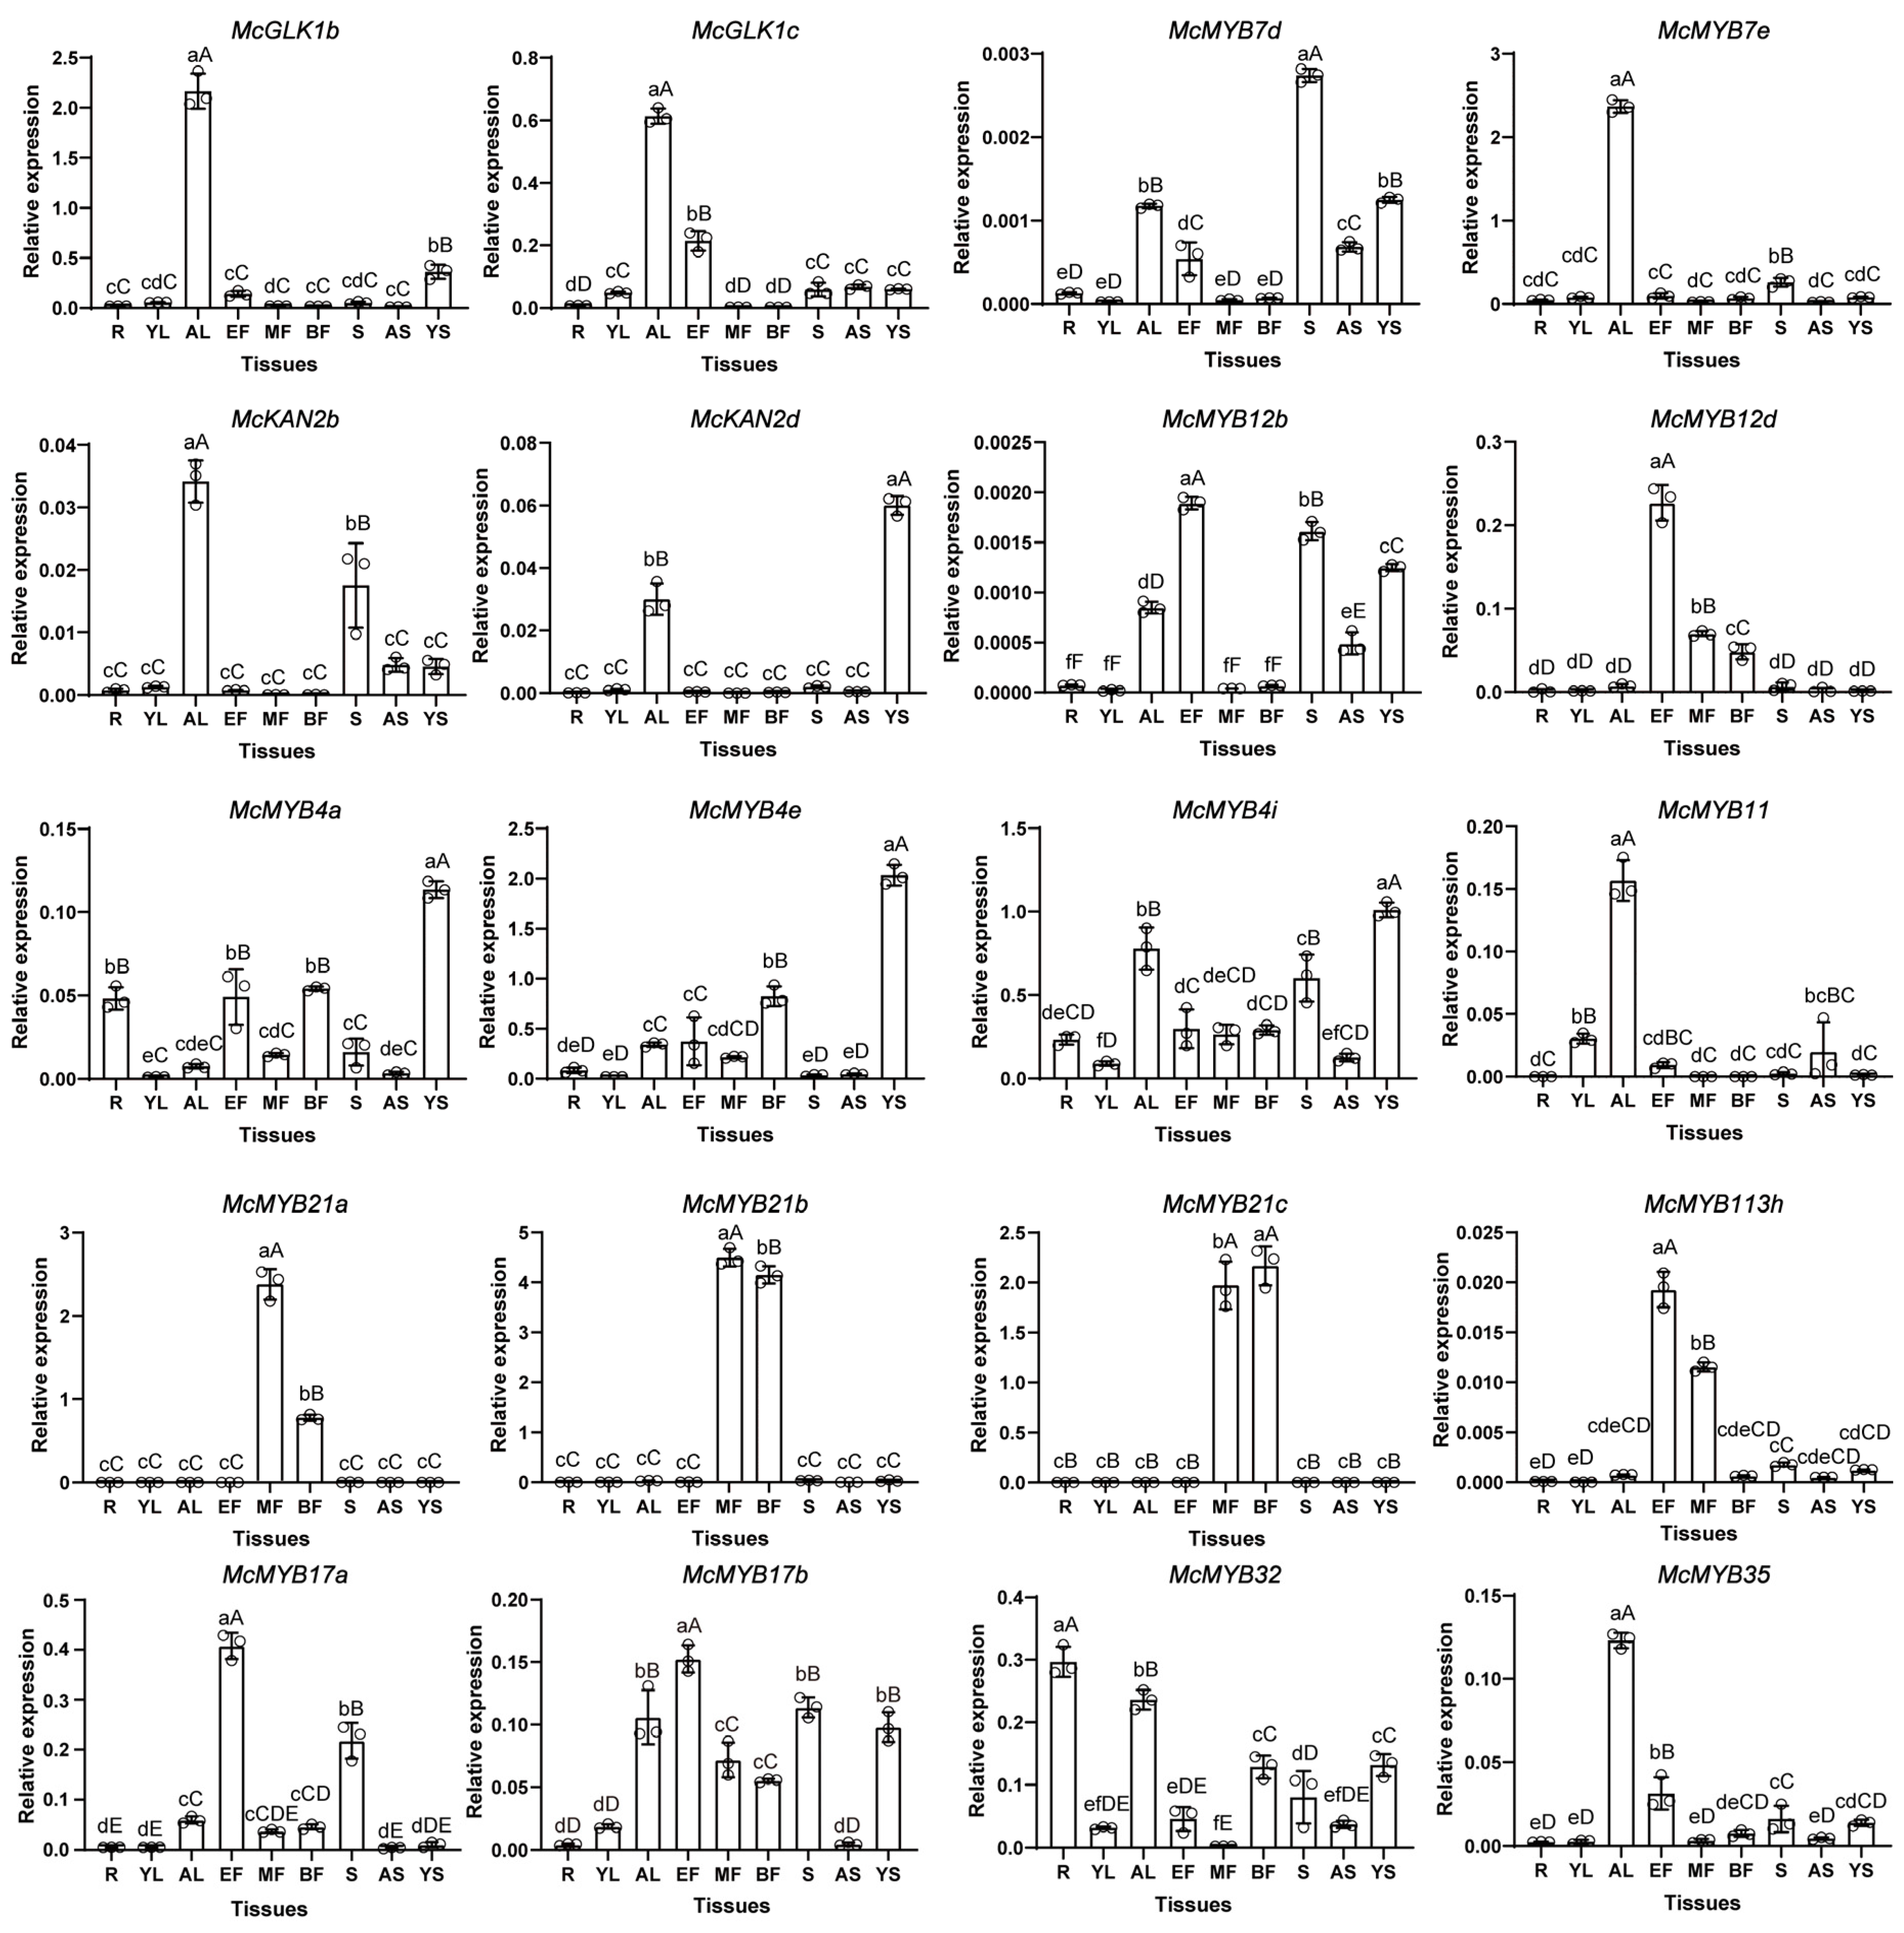
3.7. Expression Pattern of Selected MYBs in Different Tissues of M. candidum

To investigate the expression patterns of the MYB genes shown in Figure 7b, we chose 20 MYBs and conducted qRT-PCR analysis on 9 tissues or developmental stages of M. candidum. Firstly, we compared the qRT-PCR results with RNA-seq data and found that among the 20 MYBs, 9 common genes, including McGLK1c, MYB12b, MYB11, MYB21a–c, MYB113h, MYB17b, and MYB32, were also identified as differentially expressed genes in the RNA-seq. Apart from the expression level of MYB32 in EF and MF not being consistent with the RNA-seq results, the expression trends of the remaining eight MYBs were consistent with the RNA-seq (Figure 10 and Figure S9). Some MYBsMcKAN2b, McKAN2d, McMYB7d, McMYB12b, and McMYB113h—were poorly expressed in all nine tissues of M. candidum. However, as compared with the expression levels in different tissues, 20 of these selected MYB genes showed a preference for expression levels in certain tissues. For example, McGLK1c, McMYB4a, e, i, McMYB12b, d, McMYB21a, b, c, McMYB17a, b, and McMYB113h showed higher expression levels in flowers compared with other tissues. McMYB21ac were highly expressed in middle-stage and blooming-stage flowers, which indicated their important role in flower development. McMYB32 was highly expressed in the roots. McKAN2d, McMYB4a, e, and i were highly expressed in the young stems. McMYB7d, McMYB17a, and b had relatively high expression levels in seeds. Simultaneously, we found that the counterparts of gene pairs were expressed differently in different tissues, which indicated that they had diverged in terms of function during the evolutionary process as well. McMYB17a, for example, was highly expressed in early-stage flowers and seeds, whereas McMYB17b was only weakly expressed in roots, young leaves, and adult stems. Similarly, McKAN2d was highly expressed in young stems, which was inconsistent with the expression pattern of McKAN2b (Figure 10).

4. Discussion

The MYB gene family plays important roles in various biological processes in plants. A comprehensive understanding of its functional, genomic, and structural characteristics can promote crop improvements for more effective use in the future [58]. However, due to the lack of genomic information, there has been no comprehensive report on the identification of the MYB gene family in M. candidum. This study integrated the HMMER search method and the BLASTp method to identify 421 MYB genes and classified them into 10 main types based on their conserved domains: R2R3, R-R type, CPC-like, CCA1-like, R1R2R3, TBP-like, I-box, atypical MYB, MYB-like, and MYB-CC.
Compared to other species, our results found a higher number of MYB members. Some previous research has focused only on R2R3 MYBs [2,9,12,13] or early classification systems [5,7], excluding rare MYB types. Our study integrated earlier research that classified MYBs into various types in Arabidopsis [14] and recent research reporting rare MYB members. In a previous study, Cai et al. [59] identified a novel type of MYB gene called MYB-CC in maize, which contains both a coiled-coil (CC) domain and a SANT/DNA-binding domain. In our current study, we identified 31 MYBs belonging to the MYB-CC type. Other previous studies reported an MYB-like sub-family [60,61,62,63], and in our research, we identified 44 genes with conserved domains belonging to this type. Although MYB-like had a single SANT/DNA-binding domain, it differed from the domains found in CPC-like, CCA1-like, TBP-like, and I-box (Figure 6). Furthermore, some studies on MYB classification were based on transcriptome data [64,65,66]. The transcriptome has limitations in detecting low-expressed genes, potentially leading to the omission of some MYBs. Genome annotation and assembly quality are key factors influencing the number of gene families identified [50]. Take Selaginella Moellendorffii, for example; earlier studies identified only 20 R2R3 MYBs, but later studies found 41 R2R3 MYBs [67]. Imperfect genome quality could result in an erroneous judgment of the sequence, further leading to inaccurately identified results. Additionally, the annotated coding sequences (CDs) of some genes may lead to the creation of an unreal gene sequence, with incomplete MYB repeats that may ultimately be deleted. In our research, although 10 members, including mc3599, mc0481, mc05687, mc32670, mc00194, mc09531, mc1866, mc09647, mc00413, and mc07136 (Figure S3), were initially identified by HMMER and BLASTp since they included part of the key domain, further domain analysis revealed that these genes lacked key characteristics of corresponding MYB types. In order to further verify the correctness of the identification, some abnormal sequences of the gene family should be cloned from cDNA in order to confirm their true sequence. Only in this way can misidentification due to the imperfectly assembled quality of the genome be avoided. Moreover, the selection of a threshold can also impact the identification results. For instance, some studies built the HMM file for certain species using a strict threshold of the model species with E value = 1e-20 [68], resulting in a reduction in the number of identified genes. Lastly, we discovered numerous gene duplication events within these MYB genes, leading to a higher number of MYB members in M. candidum. The high frequency of gene duplication events in MYBs suggests that functional redundancy may be more common among MYB genes in M. candidum.
Plant genome evolution is characterized by gene duplication, which contributes to the establishment of multi-gene families. Genes can be duplicated through various mechanisms, including whole genome duplication (WGD), segmental duplications, tandem duplications, and retrotranspositions [51]. A previous study showed that WGD and segmental duplications account for the large expansion of the MYB gene family [8,69]. Accordingly, our results confirmed the findings of these studies, which indicated that segmental duplication played an important role in the expansion of MYB genes in M. candidum because of the cross-distribution of gene pairs on the different chromosomes (Figure S2). By calculation of synonymous substitutions (Ks or dS), we estimated that the MYB genes in M. candidum have undergone approximately three WGD events, eventually leading to a superfamily with 421 gene members. Among them, more than 50% of MYB gene pairs happened in gene duplication events in ancient times (Table S4). There was previous evidence that most MYB genes were driven by purifying selection during the evolution of woodland strawberries [2], wolfberry, tomato, pepper, potato, and eggplants [70]. We also found, in line with previous studies, that all the MYB gene pairs in M. candidum experienced purifying selection (0.06 ≤ Ka/Ks ≤ 0.80) (Table S4). This phenomenon may illustrate that the MYB gene family experienced a similar evolutionary process in the plant kingdom. Gene duplication will lead to functional redundancy, which is a substantial challenge for functional exploring-related studies [7]. Based on non-synonymous substitution, synonymous substitution, and substitution mutation ratio analysis, we have been able to identify recent and ancestral duplications of MYB genes. This may provide a backbone for the research of neo- and subfunctionalization of MYB genes in M. candidum. Synteny and collinearity information is important for elucidating the evolutionary histories of both genomes and gene families by identifying putative homologous chromosomal regions [71]. Patterns of synteny and collinearity can provide insight into the evolutionary history of a genome [71], suggesting high correlation between collinearity and evolutionary relations. In our results, the collinearity analysis was consistent with evolutionary analysis. For instance, McGLK1c exhibited collinearity with At2g20570 (Table S6), and both genes clustered together in Figure S8; McGLK1a showed collinearity with Potri.017G015800 and Potri.007G136901 (Table S6), and these genes clustered in the same sub-clade (Figure S8). Similarly, At3g61250 displayed a high degree of collinearity with McMYB17a and McMYB17b. Furthermore, McMYB17a and McMYB17b exhibited a significant level of collinearity with Potri.002G157600 and Potri.014G081200 (Table S6), leading to their clustering in the same sub-clade of the evolutionary tree (Figure S8). Our results demonstrated that collinearity information can accurately reflect evolutionary relations between genes.
R2R3-MYBs have been implicated in various biological processes, including primary metabolism and secondary metabolism, development [7], and response to stress or hormones [14]. Our motif analysis of MYBs showed that many MYB members were involved in hormone metabolism, such as abscisic acid (ABA) and methyl jasmonate metabolism (Figure S4, Table S2). The ABRE (ABA-responsive element) is a well-studied cis element in ABA-induced gene expression. ABRE-binding proteins or factors have positive effects on osmotic stress in plants [72]. Methyl jasmonate, another important stress-signaling motif, could activate plant defense mechanisms in response to environmental stress, such as drought, low temperature, and salinity [73]. We speculated that MYBs with these motifs may contribute to osmotic, drought, low temperature, and salinity stress through their influence on ABA and methyl jasmonate metabolism, providing a potential avenue for further research into the molecular mechanisms underlying plant growth and adaptation to environmental stresses. For the 23 selected MYBs related to flower development and color formation, we observed that most of them were also associated with other GO terms. For example, McMYB4a was enriched in response to acidic chemicals (GO:0001101), regulation of nucleic-acid-templated transcription (GO:1903506), regulation of the nitrogen compound metabolic process (GO:0051171), and so on. Similarly, MYB11 was enriched in the aromatic compound biosynthetic process (GO:0019438), response to oxygen-containing compounds (GO:1901700), response to light stimulus (GO:0009416), and several other biological processes (Table S8). These findings suggest the multifunctional role of MYBs.
Previous studies indicated that there is a transition in the roles played by MYBs at different stages of development. In 14-day-old Arabidopsis, the expression of some MYBs was restricted to the roots [74], whereas by the 32nd day, the expression of MYB proteins expanded to inflorescences and leaves of the rosette [14]. In line with these findings, our research revealed that that McGLK1 b, c, McMYB7e, McMYB11, McMYB32, and McMYB35 had higher expression levels in adult leaves than in young leaves; McMYB17a, b, McGLK1c, and McMYB35 expressed in early-stage flowers; McMYB113h expressed in middle-stage flowers; McMYB4a and e were highly expressed in blooming flowers; and McMYB4a, e, i, and McMYB12b were highly expressed in young stems rather than in adult stems (Figure 10). These results suggested that a similar developmental transition also takes place in M. candidum. It has been found that MYB33 is predominantly expressed in stamens and pistils so that it can influence tomato flowers and pollen maturity further [70]. Our results showed that MYB33 was highly expressed in both McII and McIII, with particularly elevated levels observed in McII (Figure S9 and Table S7). These findings suggest that MYB33 may also play a crucial role in the reproductive development of M. candidum because McII is a key developmental stage during this process. In the co-expression network, FH1 has been shown to be related to cell membrane expansion and extension of pollen tubes in the poplar [75], suggesting that McMYB113h may also contribute to the development of pollen tubes. F3H catalyzes the 3-beta-hydroxylation of 2S-flavanones, which are intermediates in the biosynthesis of flavonols, anthocyanidins, catechins, and proanthocyanidins in plants [76]. LDOX is involved in anthocyanin and protoanthocyanidin biosynthesis by catalyzing the oxidation of leucoanthocyanidins into anthocyanidins [77], suggesting that McMYB21b is also involved in these biological processes. Notably, OMT1, CHI3, HCT, and CHS are known to play key roles in controlling flavonoids, flavonol, and anthocyanin biosynthesis processes [78,79,80,81]. The high co-expression of these functional genes with McGLK1c suggests diverse roles of McGLK1c in flower development and pigment biosynthesis. These provide insights into the molecular mechanisms underlying flower development in plants and may have implications for the improvement of flower color in the future.

5. Conclusions

In sum, we obtained 421 MYB gene family members and classified them as 10 types of MYBs in this study. It is true that not all the MYBs maintain a high consistency owing to their complex classification, but each type of MYB demonstrates high conservation. WGD and segmental duplication events may be the main reasons leading to MYB gene expansion in M. candidum. More than half of them diverged from ancient times. The substitution ratio of MYB genes in M. candidum showed that these genes experienced purifying selection during evolution. It has been observed that there are variations in certain members of the MYB gene family among the three species, M. candidum, A. thaliana, and P. trichocarpa. Our results pave the way for exploring the potential MYB gene and improving the application of M. candidum in the garden and pharmaceutical industries.

Supplementary Materials

The following supporting information can be downloaded at https://www.mdpi.com/article/10.3390/horticulturae9060708/s1: Figure S1: phylogenetic analysis of all identified MYBs in M. candidum. The color strip outside represents different types of MYBs. The pionts at the branches mean bootstrap values; Figure S2: motifs, domains, and gene structure analyses of all identified MYBs. Different colorful rectangles represent different motifs, domains, UTRs, or exons; Figure S3: domain analysis of abnormal R2R3 MYBs. Different colorful rectangles represent different domains on the MYBs; Figure S4: promoter analyses of all the identified MYBs. Different colorful pionts on the promoter regions represent cis elements; Figure S5: statistics of different cis elements. The integral numbers above the columns are the total number of genes containing corresponding cis elements. The percentages above the columns are the ratios of total genes containing cis elements to total MYB genes; Figure S6: collinearity analysis of MYBs within M. candidum. The red lines within the Circos display gene pair relationships; Figure S7: collinearity analysis among different species. The green lines link orthologous genes between M. candidum and A. thaliana, and between M. candidum and P. trichocarpa; Figure S8: phylogenetic analysis of selected MYB genes among three species. Different color modules represent different clades. The size of the pionts at branches is proportional to the bootstrap value; Figure S9: heatmap of differentially expressed MYB genes. Brown means a high expression level and green means a low expression level; Table S1: primers used in qRT-PCR; Table S2: distribution and annotation of cis elements in the promoter region of MYB genes; Table S3: numbers and proportions of different cis elements in promoters of each type of MYB; Table S4: synonymous substitution rate (Ks), non-synonymous substitution rate (Ka), and divergent time estimation between gene pairs; Table S5: GO analysis of flower development and color-formation-related MYBs; Table S6: collinearity results among three species; Table S7: common differentially expressed genes of MF vs. EF and BF vs. EF; Table S8: GO analysis of 23 selected MYBs.

Author Contributions

Methodology, Y.Y., S.D. and L.R.; software, H.L., M.W. and X.H.; formal analysis, visualization, validation, and writing—original draft preparation, H.L. and X.W.; writing—review and editing Y.Y., S.D. and L.R. All authors have read and agreed to the published version of the manuscript.

Funding

This work was supported by the project of funding of scientific research projects for postdocs (2022BSHKYZZ) and Guangzhou Ecological Garden Science & Technology Collaborative Innovation Center (202206010058).

Institutional Review Board Statement

Not applicable.

Informed Consent Statement

Not applicable.

Data Availability Statement

Not applicable.

Acknowledgments

We thank Renchao Zhou of Sun Yat-sen University for providing the genome resource of M. candidum.

Conflicts of Interest

The authors have no conflict of interest to declare relevant to this article’s content.

References

  1. Feller, A.; Machemer, K.; Braun, E.L.; Grotewold, E. Evolutionary and comparative analysis of MYB and bHLH plant transcription factors. Plant J. 2011, 66, 94–116. [Google Scholar] [CrossRef] [PubMed]
  2. Hui, L.; Xiong, J.-S.; Jiang, Y.-T.; Li, W.; Cheng, Z.-M. Evolution of the R2R3-MYB gene family in six Rosaceae species and expression in woodland strawberry. J. Integr. Agric. 2019, 18, 2753–2770. [Google Scholar]
  3. Klempnauer, K.-H.; Gonda, T.J.; Bishop, J.M. Nucleotide sequence of the retroviral leukemia gene v-myb and its cellular progenitor c-myb: The architecture of a transduced oncogene. Cell 1982, 31, 453–463. [Google Scholar] [CrossRef] [PubMed]
  4. Martin, C.; Paz-Ares, J. MYB transcription factors in plants. Trends Genet. 1997, 13, 67–73. [Google Scholar] [CrossRef]
  5. Rosinski, J.A.; Atchley, W.R. Molecular evolution of the Myb family of transcription factors: Evidence for polyphyletic origin. J. Mol. Evol. 1998, 46, 74–83. [Google Scholar] [CrossRef] [PubMed]
  6. Ito, M. Conservation and diversification of three-repeat Myb transcription factors in plants. J. Plant Res. 2005, 118, 61–69. [Google Scholar] [CrossRef] [PubMed]
  7. Dubos, C.; Stracke, R.; Grotewold, E.; Weisshaar, B.; Martin, C.; Lepiniec, L. MYB transcription factors in Arabidopsis. Trends Plant Sci. 2010, 15, 573–581. [Google Scholar] [CrossRef]
  8. Du, H.; Yang, S.-S.; Liang, Z.; Feng, B.-R.; Liu, L.; Huang, Y.-B.; Tang, Y.-X. Genome-wide analysis of the MYB transcription factor superfamily in soybean. BMC Plant Biol. 2012, 12, 106. [Google Scholar] [CrossRef] [Green Version]
  9. Du, H.; Feng, B.-R.; Yang, S.-S.; Huang, Y.-B.; Tang, Y.-X. The R2R3-MYB transcription factor gene family in maize. PLoS ONE 2012, 7, e37463. [Google Scholar] [CrossRef] [Green Version]
  10. Katiyar, A.; Smita, S.; Lenka, S.K.; Rajwanshi, R.; Chinnusamy, V.; Bansal, K.C. Genome-wide classification and expression analysis of MYB transcription factor families in rice and Arabidopsis. BMC Genom. 2012, 13, 544. [Google Scholar] [CrossRef] [Green Version]
  11. Wilkins, O.; Nahal, H.; Foong, J.; Provart, N.J.; Campbell, M.M. Expansion and diversification of the Populus R2R3-MYB family of transcription factors. Plant Physiol. 2009, 149, 981–993. [Google Scholar] [CrossRef] [PubMed] [Green Version]
  12. Matus, J.T.; Aquea, F.; Arce-Johnson, P. Analysis of the grape MYB R2R3 subfamily reveals expanded wine quality-related clades and conserved gene structure organization across Vitis and Arabidopsis genomes. BMC Plant Biol. 2008, 8, 83. [Google Scholar] [CrossRef] [PubMed] [Green Version]
  13. Li, Q.; Zhang, C.; Li, J.; Wang, L.; Ren, Z. Genome-wide identification and characterization of R2R3MYB family in Cucumis sativus. PLoS ONE 2012, 7, e47576. [Google Scholar] [CrossRef] [Green Version]
  14. Yanhui, C.; Xiaoyuan, Y.; Kun, H.; Meihua, L.; Jigang, L.; Zhaofeng, G.; Zhiqiang, L.; Yunfei, Z.; Xiaoxiao, W.; Xiaoming, Q. The MYB transcription factor superfamily of Arabidopsis: Expression analysis and phylogenetic comparison with the rice MYB family. Plant Mol. Biol. 2006, 60, 107–124. [Google Scholar] [CrossRef] [PubMed]
  15. Jiang, C.; Gu, X.; Peterson, T. Identification of conserved gene structures and carboxy-terminal motifs in the Myb gene family of Arabidopsis and Oryza sativa L. ssp. indica. Genome Biol. 2004, 5, R46. [Google Scholar] [CrossRef] [PubMed] [Green Version]
  16. Ogata, K.; Morikawa, S.; Nakamura, H.; Sekikawa, A.; Inoue, T.; Kanai, H.; Sarai, A.; Ishii, S.; Nishimura, Y. Solution structure of a specific DNA complex of the Myb DNA-binding domain with cooperative recognition helices. Cell 1994, 79, 639–648. [Google Scholar] [CrossRef] [PubMed]
  17. Romero, I.; Fuertes, A.; Benito, M.J.; Malpica, J.M.; Leyva, A.; Paz-Ares, J. More than 80R2R3-MYB regulatory genes in the genome of Arabidopsis thaliana. Plant J. 1998, 14, 273–284. [Google Scholar] [CrossRef]
  18. Xie, Z.; Lee, E.K.; Lucas, J.R.; Morohashi, K.; Li, D.; Murray, J.; Grotewold, S.E. Regulation of Cell Proliferation in the Stomatal Lineage by the Arabidopsis MYB FOUR LIPS via Direct Targeting of Core Cell Cycle Genes. Plant Cell 2010, 22, 2306–2321. [Google Scholar] [CrossRef] [Green Version]
  19. Howe, K.; Reakes, C.; Watson, R. Characterization of the sequence-specific interaction of mouse c-myb protein with DNA. EMBO J. 1990, 9, 161–169. [Google Scholar] [CrossRef]
  20. Tanikawa, J.; Yasukawa, T.; Enari, M.; Ogata, K.; Nishimura, Y.; Ishii, S.; Sarai, A. Recognition of specific DNA sequences by the c-myb protooncogene product: Role of three repeat units in the DNA-binding domain. Proc. Natl. Acad. Sci. USA 1993, 90, 9320–9324. [Google Scholar] [CrossRef] [Green Version]
  21. Boyer, L.A.; Latek, R.R.; Peterson, C.L. The SANT domain: A unique histone-tail-binding module? Nat. Rev. Mol. Cell Biol. 2004, 5, 158–163. [Google Scholar] [CrossRef] [PubMed]
  22. Lin-Wang, K.; Bolitho, K.; Grafton, K.; Kortstee, A.; Karunairetnam, S.; McGhie, T.K.; Espley, R.V.; Hellens, R.P.; Allan, A.C. An R2R3 MYB transcription factor associated with regulation of the anthocyanin biosynthetic pathway in Rosaceae. BMC Plant Biol. 2010, 10, 50. [Google Scholar] [CrossRef] [Green Version]
  23. Gális, I.; Šimek, P.; Narisawa, T.; Sasaki, M.; Horiguchi, T.; Fukuda, H.; Matsuoka, K. A novel R2R3 MYB transcription factor NtMYBJS1 is a methyl jasmonate-dependent regulator of phenylpropanoid-conjugate biosynthesis in tobacco. Plant J. 2006, 46, 573–592. [Google Scholar] [CrossRef] [PubMed]
  24. Song, S.-K.; Ryu, K.H.; Kang, Y.H.; Song, J.H.; Cho, Y.-H.; Yoo, S.-D.; Schiefelbein, J.; Lee, M.M. Cell fate in the Arabidopsis root epidermis is determined by competition between WEREWOLF and CAPRICE. Plant Physiol. 2011, 157, 1196–1208. [Google Scholar] [CrossRef] [PubMed] [Green Version]
  25. Ambawat, S.; Sharma, P.; Yadav, N.R.; Yadav, R.C. MYB transcription factor genes as regulators for plant responses: An overview. Physiol. Mol. Biol. Plants 2013, 19, 307–321. [Google Scholar] [CrossRef] [PubMed] [Green Version]
  26. Stracke, R.; Ishihara, H.; Huep, G.; Barsch, A.; Mehrtens, F.; Niehaus, K.; Weisshaar, B. Differential regulation of closely related R2R3-MYB transcription factors controls flavonol accumulation in different parts of the Arabidopsis thaliana seedling. Plant J. 2007, 50, 660–677. [Google Scholar] [CrossRef] [Green Version]
  27. Gonzalez, A.; Zhao, M.; Leavitt, J.M.; Lloyd, A.M. Regulation of the anthocyanin biosynthetic pathway by the TTG1/bHLH/Myb transcriptional complex in Arabidopsis seedlings. Plant J. 2008, 53, 814–827. [Google Scholar] [CrossRef]
  28. Kang, Y.H.; Kirik, V.; Hulskamp, M.; Nam, K.H.; Hagely, K.; Lee, M.M.; Schiefelbein, J. The MYB23 gene provides a positive feedback loop for cell fate specification in the Arabidopsis root epidermis. Plant Cell 2009, 21, 1080–1094. [Google Scholar] [CrossRef] [Green Version]
  29. Li, L.; Yu, X.; Thompson, A.; Guo, M.; Yoshida, S.; Asami, T.; Chory, J.; Yin, Y. Arabidopsis MYB30 is a direct target of BES1 and cooperates with BES1 to regulate brassinosteroid-induced gene expression. Plant J. 2009, 58, 275–286. [Google Scholar] [CrossRef] [Green Version]
  30. Cominelli, E.; Galbiati, M.; Vavasseur, A.; Conti, L.; Sala, T.; Vuylsteke, M.; Leonhardt, N.; Dellaporta, S.L.; Tonelli, C. A guard-cell-specific MYB transcription factor regulates stomatal movements and plant drought tolerance. Curr. Biol. 2005, 15, 1196–1200. [Google Scholar] [CrossRef]
  31. Seo, P.J.; Park, C.M. MYB96-mediated abscisic acid signals induce pathogen resistance response by promoting salicylic acid biosynthesis in Arabidopsis. New Phytol. 2010, 186, 471–483. [Google Scholar] [CrossRef] [PubMed]
  32. Mizoguchi, T.; Wheatley, K.; Hanzawa, Y.; Wright, L.; Mizoguchi, M.; Song, H.-R.; Carré, I.A.; Coupland, G. LHY and CCA1 are partially redundant genes required to maintain circadian rhythms in Arabidopsis. Dev. Cell 2002, 2, 629–641. [Google Scholar] [CrossRef] [PubMed] [Green Version]
  33. Schellmann, S.; Schnittger, A.; Kirik, V.; Wada, T.; Okada, K.; Beermann, A.; Thumfahrt, J.; Jürgens, G.; Hülskamp, M. TRIPTYCHON and CAPRICE mediate lateral inhibition during trichome and root hair patterning in Arabidopsis. EMBO J. 2002, 21, 5036–5046. [Google Scholar] [CrossRef] [PubMed] [Green Version]
  34. Kirik, V.; Simon, M.; Huelskamp, M.; Schiefelbein, J. The Enhancer of try and CPC1 gene acts redundantly with Triptycho and Caprice in trichome and root hair cell patterning in Arabidopsis. Dev. Biol. 2004, 268, 506–513. [Google Scholar] [CrossRef] [PubMed] [Green Version]
  35. Ito, M.; Araki, S.; Matsunaga, S.; Itoh, T.; Nishihama, R.; Machida, Y.; Doonan, J.H.; Watanabe, A. G2/M-phase–specific transcription during the plant cell cycle is mediated by c-Myb–like transcription factors. Plant Cell 2001, 13, 1891–1905. [Google Scholar]
  36. Burns, C.G.; Ohi, R.; Krainer, A.R.; Gould, K.L. Evidence that Myb-related CDC5 proteins are required for pre-mRNA splicing. Proc. Natl. Acad. Sci. USA 1999, 96, 13789–13794. [Google Scholar] [CrossRef] [Green Version]
  37. Lei, X.-H.; Shen, X.; Xu, X.-Q.; Bernstein, H.S. Human Cdc5, a regulator of mitotic entry, can act as a site-specific DNA binding protein. J. Cell Sci. 2000, 113, 4523–4531. [Google Scholar] [CrossRef]
  38. Chen, C.; Chen, H.; Zhang, Y.; Thomas, H.R.; Frank, M.H.; He, Y.; Xia, R. TBtools: An integrative toolkit developed for interactive analyses of big biological data. Mol. Plant 2020, 13, 1194–1202. [Google Scholar] [CrossRef]
  39. Wei, B.; Zhang, R.-Z.; Guo, J.-J.; Liu, D.-M.; Li, A.-L.; Fan, R.-C.; Mao, L.; Zhang, X.-Q. Genome-wide analysis of the MADS-box gene family in Brachypodium distachyon. PLoS ONE 2014, 9, e84781. [Google Scholar] [CrossRef] [Green Version]
  40. Lynch, M.; Conery, J.S. The evolutionary fate and consequences of duplicate genes. Science 2000, 290, 1151–1155. [Google Scholar] [CrossRef] [Green Version]
  41. Gaut, B.S.; Morton, B.R.; McCaig, B.C.; Clegg, M.T. Substitution rate comparisons between grasses and palms: Synonymous rate differences at the nuclear gene Adh parallel rate differences at the plastid gene rbcL. Proc. Natl. Acad. Sci. USA 1996, 93, 10274–10279. [Google Scholar] [CrossRef] [Green Version]
  42. Langmead, B.; Salzberg, S.L. Fast gapped-read alignment with Bowtie 2. Nat. Methods 2012, 9, 357–359. [Google Scholar] [CrossRef] [Green Version]
  43. Kim, D.; Langmead, B.; Salzberg, S.L. HISAT: A fast spliced aligner with low memory requirements. Nat. Methods 2015, 12, 357–360. [Google Scholar] [CrossRef] [PubMed] [Green Version]
  44. Pertea, M.; Pertea, G.M.; Antonescu, C.M.; Chang, T.-C.; Mendell, J.T.; Salzberg, S.L. StringTie enables improved reconstruction of a transcriptome from RNA-seq reads. Nat. Biotechnol. 2015, 33, 290–295. [Google Scholar] [CrossRef] [PubMed] [Green Version]
  45. Pertea, M.; Kim, D.; Pertea, G.M.; Leek, J.T.; Salzberg, S.L. Transcript-level expression analysis of RNA-seq experiments with HISAT, StringTie and Ballgown. Nat. Protoc. 2016, 11, 1650–1667. [Google Scholar] [CrossRef]
  46. Li, H.; Huang, X.; Li, W.; Lu, Y.; Dai, X.; Zhou, Z.; Li, Q. MicroRNA comparison between poplar and larch provides insight into the different mechanism of wood formation. Plant Cell Rep. 2020, 39, 1199–1217. [Google Scholar] [CrossRef] [PubMed]
  47. Sazegari, S.; Niazi, A.; Ahmadi, F.S. A study on the regulatory network with promoter analysis for Arabidopsis DREB-genes. Bioinformation 2015, 11, 101. [Google Scholar] [CrossRef] [Green Version]
  48. Wu, Y.; Ke, Y.; Wen, J.; Guo, P.; Ran, F.; Wang, M.; Liu, M.; Li, P.; Li, J.; Du, H. Evolution and expression analyses of the MADS-box gene family in Brassica napus. PLoS ONE 2018, 13, e0200762. [Google Scholar] [CrossRef] [Green Version]
  49. Brown, A.; Dunn, M.; Goddard, N.; Hughes, M. Identification of a novel low-temperature-response element in the promoter of the barley (Hordeum vulgare L.) gene blt101.1. Planta 2001, 213, 770–780. [Google Scholar] [CrossRef]
  50. Jiang, C.-K.; Rao, G.-Y. Insights into the diversification and evolution of R2R3-MYB transcription factors in plants. Plant Physiol. 2020, 183, 637–655. [Google Scholar] [CrossRef]
  51. Wu, Y.; Wen, J.; Xia, Y.; Zhang, L.; Du, H. Evolution and functional diversification of R2R3-MYB transcription factors in plants. Hortic. Res. 2022, 9, uhac058. [Google Scholar] [CrossRef] [PubMed]
  52. Airoldi, C.A.; Davies, B. Gene duplication and the evolution of plant MADS-box transcription factors. J. Genet. Genom. 2012, 39, 157–165. [Google Scholar] [CrossRef] [PubMed]
  53. Lee, H.-L.; Irish, V.F. Gene duplication and loss in a MADS box gene transcription factor circuit. Mol. Biol. Evol. 2011, 28, 3367–3380. [Google Scholar] [CrossRef] [PubMed] [Green Version]
  54. Gaut, B.S. Evolutionary dynamics of grass genomes. New Phytol. 2002, 154, 15–28. [Google Scholar] [CrossRef] [Green Version]
  55. Initiative, T. Genome sequencing and analysis of the model grass Brachypodium distachyon. Nature 2010, 463, 763–768. [Google Scholar]
  56. D’hont, A.; Denoeud, F.; Aury, J.-M.; Baurens, F.-C.; Carreel, F.; Garsmeur, O.; Noel, B.; Bocs, S.; Droc, G.; Rouard, M. The banana (Musa acuminata) genome and the evolution of monocotyledonous plants. Nature 2012, 488, 213–217. [Google Scholar] [CrossRef] [Green Version]
  57. Wang, J.; Wang, Z.; Jia, C.; Miao, H.; Zhang, J.; Liu, J.; Xu, B.; Jin, Z. Genome-wide identification and transcript analysis of TCP gene family in Banana (Musa acuminata L.). Biochem. Genet. 2022, 60, 204–222. [Google Scholar] [CrossRef]
  58. Ma, K.; Xiao, J.; Li, X.; Zhang, Q.; Lian, X. Sequence and expression analysis of the C3HC4-type RING finger gene family in rice. Gene 2009, 444, 33–45. [Google Scholar] [CrossRef]
  59. Bai, J.; Sun, F.; Wang, M.; Su, L.; Li, R.; Caetano-Anollés, G. Genome-wide analysis of the MYB-CC gene family of maize. Genetica 2019, 147, 1–9. [Google Scholar] [CrossRef]
  60. Ehsan, H.; Reichheld, J.-P.; Durfee, T.; Roe, J.L. TOUSLED kinase activity oscillates during the cell cycle and interacts with chromatin regulators. Plant Physiol. 2004, 134, 1488–1499. [Google Scholar] [CrossRef] [Green Version]
  61. Rawat, R.; Schwartz, J.; Jones, M.A.; Sairanen, I.; Cheng, Y.; Andersson, C.R.; Zhao, Y.; Ljung, K.; Harmer, S.L. REVEILLE1, a Myb-like transcription factor, integrates the circadian clock and auxin pathways. Proc. Natl. Acad. Sci. USA 2009, 106, 16883–16888. [Google Scholar] [CrossRef] [PubMed] [Green Version]
  62. Gatz, C. From pioneers to team players: TGA transcription factors provide a molecular link between different stress pathways. Mol. Plant-Microbe Interact. 2013, 26, 151–159. [Google Scholar] [CrossRef] [Green Version]
  63. Yan, Y.; Shen, L.; Chen, Y.; Bao, S.; Thong, Z.; Yu, H. A MYB-domain protein EFM mediates flowering responses to environmental cues in Arabidopsis. Dev. Cell 2014, 30, 437–448. [Google Scholar] [CrossRef] [PubMed] [Green Version]
  64. Liu, M.; Li, K.; Sheng, S.; Wang, M.; Hua, P.; Wang, Y.; Chen, P.; Wang, K.; Zhao, M.; Wang, Y. Transcriptome analysis of MYB transcription factors family and PgMYB genes involved in salt stress resistance in Panax ginseng. BMC Plant Biol. 2022, 22, 479. [Google Scholar] [CrossRef] [PubMed]
  65. Tombuloglu, H.; Kekec, G.; Sakcali, M.S.; Unver, T. Transcriptome-wide identification of R2R3-MYB transcription factors in barley with their boron responsive expression analysis. Mol. Genet. Genom. 2013, 288, 141–155. [Google Scholar] [CrossRef] [PubMed]
  66. Shen, J.; Cai, Z.; Chen, S.; Wang, D.; Wu, Z. Transcriptome-wide identification and characterization of the MYB gene family in sickle seagrass (Thalassia hemprichii). Ecol. Genet. Genom. 2021, 20, 100093. [Google Scholar] [CrossRef]
  67. Bowman, J.L.; Kohchi, T.; Yamato, K.T.; Jenkins, J.; Shu, S.; Ishizaki, K.; Yamaoka, S.; Nishihama, R.; Nakamura, Y.; Berger, F. Insights into land plant evolution garnered from the Marchantia polymorpha genome. Cell 2017, 171, 287–304.e15. [Google Scholar] [CrossRef] [Green Version]
  68. Edgar, R.C. MUSCLE: Multiple sequence alignment with high accuracy and high throughput. Nucleic Acids Res. 2004, 32, 1792–1797. [Google Scholar] [CrossRef] [Green Version]
  69. Li, P.; Wen, J.; Chen, P.; Guo, P.; Ke, Y.; Wang, M.; Liu, M.; Tran, L.-S.P.; Li, J.; Du, H. MYB superfamily in Brassica napus: Evidence for hormone-mediated expression profiles, large expansion, and functions in root hair development. Biomolecules 2020, 10, 875. [Google Scholar] [CrossRef]
  70. Yin, Y.; Guo, C.; Shi, H.; Zhao, J.; Ma, F.; An, W.; He, X.; Luo, Q.; Cao, Y.; Zhan, X. Genome-wide comparative analysis of the R2R3-MYB gene family in five Solanaceae species and identification of members regulating carotenoid biosynthesis in Wolfberry. Int. J. Mol. Sci. 2022, 23, 2259. [Google Scholar] [CrossRef]
  71. Wang, Y.; Tang, H.; Debarry, J.D.; Tan, X.; Li, J.; Wang, X.; Lee, T.-h.; Jin, H.; Marler, B.; Guo, H. MCScanX: A toolkit for detection and evolutionary analysis of gene synteny and collinearity. Nucleic Acids Res. 2012, 40, e49. [Google Scholar] [CrossRef] [PubMed] [Green Version]
  72. Fujita, Y.; Fujita, M.; Shinozaki, K.; Yamaguchi-Shinozaki, K. ABA-mediated transcriptional regulation in response to osmotic stress in plants. J. Plant Res. 2011, 124, 509–525. [Google Scholar] [CrossRef] [PubMed]
  73. Cheong, J.-J.; Do Choi, Y. Methyl jasmonate as a vital substance in plants. Trends Genet. 2003, 19, 409–413. [Google Scholar] [CrossRef] [PubMed]
  74. Czechowski, T.; Bari, R.P.; Stitt, M.; Scheible, W.R.; Udvardi, M.K. Real-time RT-PCR profiling of over 1400 Arabidopsis transcription factors: Unprecedented sensitivity reveals novel root-and shoot-specific genes. Plant J. 2004, 38, 366–379. [Google Scholar] [CrossRef]
  75. Cheung, A.Y.; Wu, H.-m. Overexpression of an Arabidopsis formin stimulates supernumerary actin cable formation from pollen tube cell membrane. Plant Cell 2004, 16, 257–269. [Google Scholar] [CrossRef] [Green Version]
  76. Sparvoli, F.; Martin, C.; Scienza, A.; Gavazzi, G.; Tonelli, C. Cloning and molecular analysis of structural genes involved in flavonoid and stilbene biosynthesis in grape (Vitis vinifera L.). Plant Mol. Biol. 1994, 24, 743–755. [Google Scholar] [CrossRef]
  77. Abrahams, S.; Lee, E.; Walker, A.R.; Tanner, G.J.; Larkin, P.J.; Ashton, A.R. The Arabidopsis TDS4 gene encodes leucoanthocyanidin dioxygenase (LDOX) and is essential for proanthocyanidin synthesis and vacuole development. Plant J. 2003, 35, 624–636. [Google Scholar] [CrossRef]
  78. Gauthier, A.; Gulick, P.J.; Ibrahim, R.K. Characterization of two cDNA clones which encode O-methyltransferases for the methylation of both flavonoid and phenylpropanoid compounds. Arch. Biochem. Biophys. 1998, 351, 243–249. [Google Scholar] [CrossRef]
  79. Shimada, N.; Aoki, T.; Sato, S.; Nakamura, Y.; Tabata, S.; Ayabe, S.-i. A cluster of genes encodes the two types of chalcone isomerase involved in the biosynthesis of general flavonoids and legume-specific 5-deoxy (iso) flavonoids in Lotus japonicus. Plant Physiol. 2003, 131, 941–951. [Google Scholar] [CrossRef] [Green Version]
  80. Jiang, L.; Yue, M.; Liu, Y.; Ye, Y.; Zhang, Y.; Lin, Y.; Wang, X.; Chen, Q.; Tang, H. Alterations of phenylpropanoid biosynthesis lead to the natural formation of pinkish-skinned and white-fleshed strawberry (Fragaria× ananassa). Int. J. Mol. Sci. 2022, 23, 7375. [Google Scholar] [CrossRef]
  81. Xie, L.; Li, F.; Zhang, S.; Zhang, H.; Qian, W.; Li, P.; Zhang, S.; Sun, R. Mining for candidate genes in an introgression line by using RNA sequencing: The anthocyanin overaccumulation phenotype in Brassica. Front. Plant Sci. 2016, 7, 1245. [Google Scholar] [CrossRef] [PubMed] [Green Version]
Figure 1. Phylogenetic analysis of MYB family members. The points on the tree branches represent bootstraps, whose sizes are in proportion to their bootstrap value.
Horticulturae 09 00708 g001
Figure 2. MYB gene distribution in chromosomes. The bar lengths represent the size of the chromosome. The red color within bars represents high gene density, and the blue color within bars represents low gene density.
Horticulturae 09 00708 g002
Figure 3. Motif, domain, and gene structure analysis of MYBs. Triangles on phylogeny trees mean highly similar MYBs within the clades.
Horticulturae 09 00708 g003
Figure 4. Promoter analysis of MYBs. Different triangles on the branches of phylogeny trees represent similar genes of one clade. Different colors on black lines represent different elements of the promoters.
Horticulturae 09 00708 g004
Figure 5. Conservation analysis of R2R3 MYBs. The same color in the column and the size of letters in the sequence logo suggest conservation of the corresponding position.
Horticulturae 09 00708 g005
Figure 6. Conservation analysis of other MYBs. (a) Conserved domain of CCA1-like MYBs. (b) and (c) Conserved domains of TBP-like MYBs. (d) Conserved domains of MYB-CC. (e) Conserved domains of R1R2R3 MYBs. (f) Conserved domain of MYB-like MYBs. (g) Conserved domain of CPC-like MYBs. (h) Conserved domain of I-box MYBs. (i) Conserved domains of R-R MYBs. The same color in the column and the size of letters in the sequence logo suggest conservation of the corresponding position.
Horticulturae 09 00708 g006aHorticulturae 09 00708 g006b
Figure 7. GO analysis and collinearity analysis of flower development and color-formation-related MYBs within genome and across genomes of different species. (a) GO analysis result of all identified MYBs. The yellow represents significantly enriched; the size of the pot represents enriched gene numbers. (b) Gene pairs of the selected 23 MYB genes. The red lines within the Circos graph display gene pair relationships. (c) Collinearity analysis of three different species. The green lines between different species display corresponding collinearity genes among three species.
Horticulturae 09 00708 g007
Figure 8. WGCNA analysis of differentially expressed genes at three developmental stages of flowers and GO and KEGG analyses of different modules. (a) Venn graph between two versus groups. EF: early-stage flowers; MF: middle-stage flowers; BF: blooming flowers. (bd) Module division of the common differentially expressed genes. The modules were named according to their color; within (c), the dark color indicates high correlations, light color indicates low correlations among genes. (e) GO analysis of different modules. (f) KEGG analysis of different modules. In both (e,f), yellow represents significantly enriched. The size of the points represents the gene number.
Horticulturae 09 00708 g008
Figure 9. Co-expression network of three selected modules. (a) Co-expression network in brown module. (b) Co-expression network in cyan module. (c) Co-expression network in saddlebrown module. Color bars on the left represent different modules. In the heatmap, light blue represents a low expression level and brown represents a high expression level.
Horticulturae 09 00708 g009
Figure 10. Analysis of expression of the selected MYB genes. YL: young leaves; AL: adult leaves; YS: young stems; AS: adult stems; S: seeds; R: roots; EF: early-stage flowers; MF: middle-stage flowers; BF: blooming flowers. Hollow circles in these graphs represent the relative expression of three biological repeats. The relative expression levels are shown as the mean ± SD. Duncan’s test was used to evaluate significant difference levels. Lowercase letters denote statistical significance at p ≤ 0.05; capital letters denote statistical significance at p ≤ 0.01.
Horticulturae 09 00708 g010
Disclaimer/Publisher’s Note: The statements, opinions and data contained in all publications are solely those of the individual author(s) and contributor(s) and not of MDPI and/or the editor(s). MDPI and/or the editor(s) disclaim responsibility for any injury to people or property resulting from any ideas, methods, instructions or products referred to in the content.

